Article

Reactive Grinding Synthesis of LaBO3 (B: Mn, Fe) Perovskite; Properties for Toluene Total Oxidation

by
Bertrand Heidinger
1,2,
Sébastien Royer
1,2,
Houshang Alamdari
2,
Jean-Marc Giraudon
1 and
Jean-François Lamonier
1,2,*
1
Univ. Lille, CNRS, Centrale Lille, ENSCL, Univ. Artois, UMR 8181–UCCS–Unité de Catalyse et Chimie du Solide, 59000 Lille, France
2
Department of Mining, Metallurgical and Materials Engineering, Laval University, Québec City, QC G1V 0A6, Canada
*
Author to whom correspondence should be addressed.
Catalysts 2019, 9(8), 633; https://doi.org/10.3390/catal9080633
Submission received: 2 July 2019 / Revised: 22 July 2019 / Accepted: 23 July 2019 / Published: 25 July 2019
(This article belongs to the Special Issue Catalysis by Metals on Perovskite-Type Oxides)

Abstract

:
LaBO3 (B: Mn, Fe) perovskites were synthesized using a three-step reactive grinding process followed by a calcination at 400 °C for 3 h. The three successive steps are: (i) solid state synthesis (SSR); (ii) high-energy ball milling (HEBM); (iii) low-energy ball milling (LEBM) in wet conditions. The impact of each step of the synthesis on the material characteristics was deeply investigated using physico-chemical techniques (X-ray diffraction (XRD), N2-physisorption, scanning electron microscopy (SEM), transmission electron microscopy (TEM), temperature-programmed reduction (H2-TPR), X-ray photoelectron spectroscopy (XPS)) and the catalytic performances of the synthesized materials were evaluated for the toluene total oxidation reaction. Starting from single oxides, microcrystalline perovskite phase, exhibiting negligible surface areas, is obtained after the SSR step. The HEBM step leads to a drastic reduction of the mean crystal size down to ~20 nm, along with formation of dense aggregates. Due to this strong aggregation, surface area remains low, typically below 4 m2·g−1. In contrast, the second grinding step, namely LEBM, allows particle deagglomeration resulting in increasing the surface area up to 18.8 m2·g−1 for LaFeO3. Regardless of the perovskite composition, the performance toward toluene oxidation reaction increases at each step of the process: SSR < HEBM < LEBM.

1. Introduction

Volatile organic compounds (VOCs) are responsible of important environmental and health issues such as greenhouse gas effect, tropospheric ozone accumulation or CMR (carcinogenic, mutagenic or reprotoxic) behavior on animals and human beings. Those chemicals are generated from both natural and anthropogenic sources, the latter being the most significant. Industry is a major contributor to the VOC emissions, with a huge consumption of chemicals, especially benzene, toluene and xylene (BTX) mainly used as precursors or organic solvents [1,2]. Toluene is, for example, a potential CMR and has consequent greenhouse power [3,4]. Professional exposure limits have been set up to protect workers with respectively 50 and 100 ppmv values for the long- and short-term exposition for the European Union [5]. Over the last two last decades, VOC emissions have been highly reduced to fit the stringent environmental regulations [2,6]. While chemical substitution has to be privileged, this alternative is difficult to adapt to industrial processes which are already well-optimized. Then, catalytic oxidation processes as a post-treatment solution, play a major role in VOC emissions control with attractive characteristics: limited energy consumption as well as complete and selective elimination of pollutants. Supported noble metal catalysts are active catalysts even at low temperature [7] but they generally suffer from a deactivation over time by poisoning [8,9]. Increasing the cost and rarefication of these resources limit their wide use [10]. Alternatives to noble metal catalysts are transition metal oxides, being of lower cost and some of them showing interesting catalytic performances in oxidation reactions [11,12]. Among them are perovskites-like mixed oxides, commonly described by the general formula ABO3 where A is an alkaline, an alkaline earth or a rare-earth cation and B is a transition metal. With numerous possible A and B associations, properties of perovskite-like materials can be fine-tuned regarding the targeted application [13,14,15]. Properties of perovskites are closely related to their synthesis method [16,17,18]. Parameters being identified as crucial are specific surface area (SSA), crystal domain size and transition metal surface accessibility, all parameters having an effect on cation reducibility and then on catalytic activity. Among the different compositions, LaMnO3.15 and LaFeO3 are of particular interest. LaMnO3.15 shows excellent catalytic performances related to MnIV/MnIII mixed valence stabilized in the structure (charge neutrality being reached with cationic vacancies). Considering a lower reducibility of the iron cations in the crystal (leading to a lower activity than those of the Co- and Mn-counterparts), LaFeO3 is far less studied, except for high temperature application due to its good stability [14].
As the important parameter that directly impacts the catalytic activity is the specific surface area. While solid state reaction route produces material with low specific surface area, not ideal in view of a catalytic application, solution-mediated synthesis routes give access to materials with better textural properties, but they can hardly be considered as a sustainable solution because of the consumption of solvent. On the other hand, reactive grinding (RG) is a common approach used in metallurgy that shows attractive features such as flexibility, low temperature, atmospheric pressure, no use of solvents (or in a small amount) [19,20]. Reactive grinding has then already been proved to be efficient to produce catalysts such as MnO2, several hexaaluminates and perovskites [21,22,23,24]. In this work, nanocrystalline LaMnO3 and LaFeO3 perovskites-type mixed oxides, exhibiting high specific surface areas, are obtained by a three-step reactive grinding synthesis. The selected synthesis sequence consists in: (1) a solid-state reaction step, starting with selected single oxides to obtain the perovskite phase, (2) the structural modification (crystal size decrease) with high-energy ball milling (HEBM) step, and finally, (3) a low-energy ball milling (LEBM) for surface area development. Solids are characterized at each step of the synthesis, and catalytic performances as well as stability behavior of LaMnO3.15 and LaFeO3, are reported for the toluene total oxidation reaction.

2. Results

2.1. Physico-Chemical Characterization

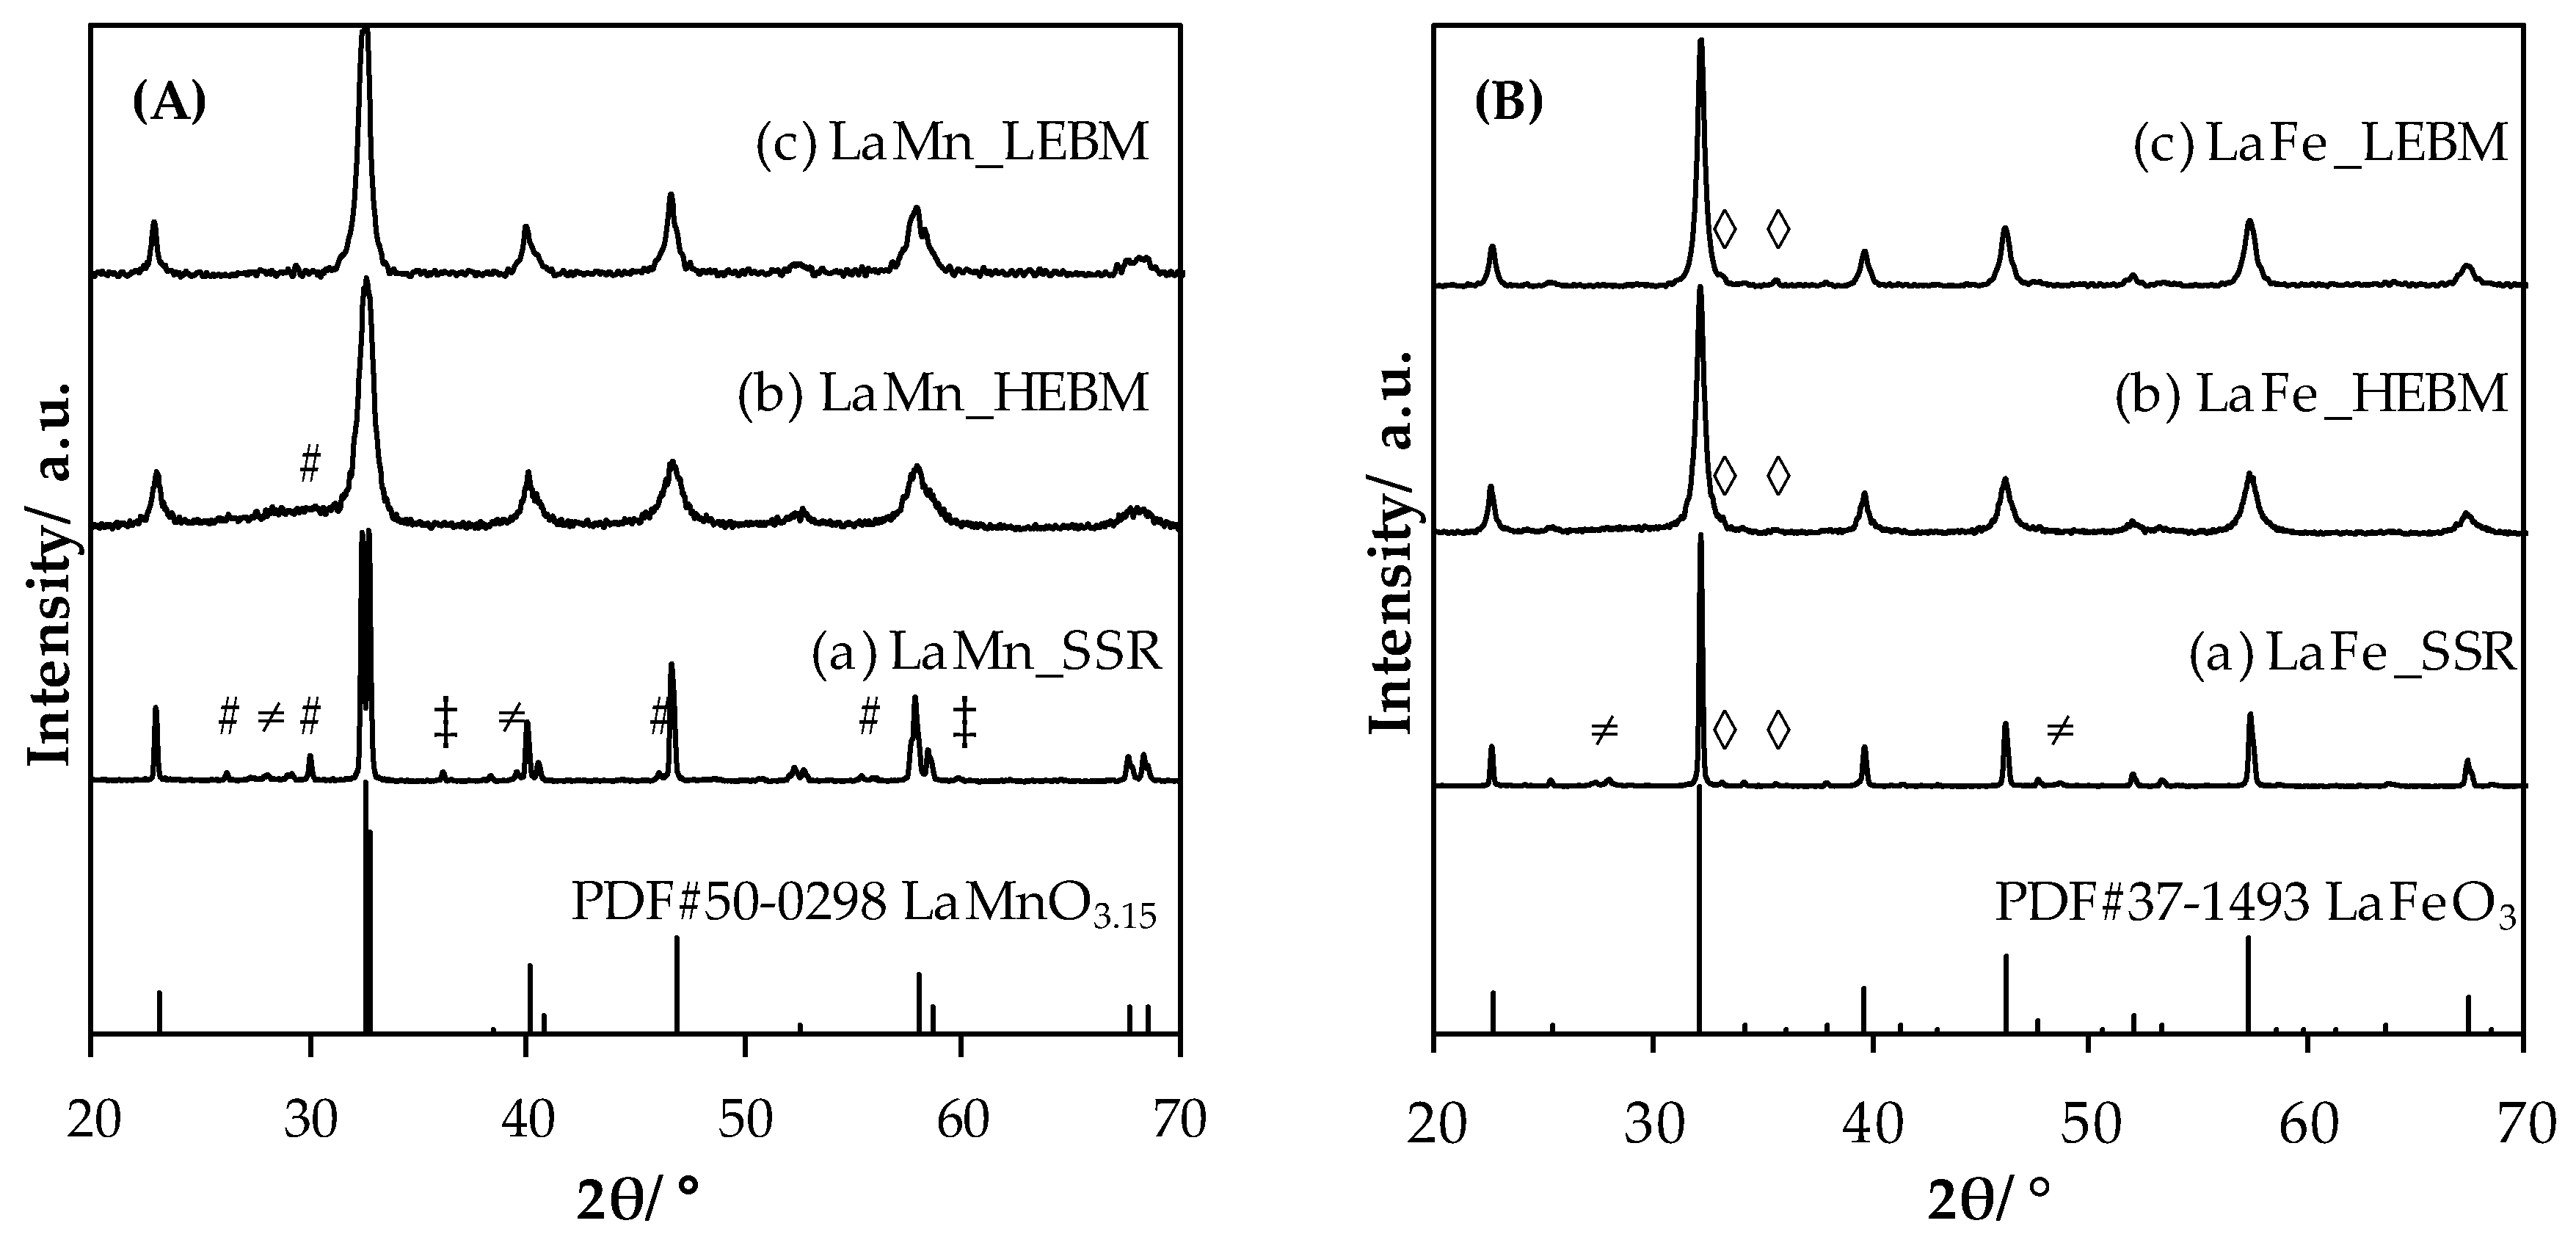
2.1.1. Structural Properties Evolution upon Grinding

X-ray diffractograms obtained for LaMnO3.15 and LaFeO3 materials, after each step of the synthesis, are shown in Figure 1. In the case of LaMnO3.15, after solid state synthesis step (LaMn_SSR), intense and narrow diffraction peaks that match with the LaMnO3.15 reference pattern (PDF#50-0298) of rhombohedral structure are observed. In addition to the main perovskite phase, weak remaining peaks (2θ = 26.2°, 27.9°, 29.2°, 29.9°, 36.1°, 39.6°, 46.1°, 55.5 or 59.9°) are also observed. These reflections are associated to unreacted oxide precursors and derived phases: La2O3 (PDF#74-2430), La(OH)3 (PDF#36-1481) and Mn3O4 (PDF#18-0803). However, these reflections, weak in intensity, suggest that most of the material consists in crystalline perovskite. After the high energy ball milling step, diffractogram recorded for LaMn_HEBM shows the comparable reflections, nonetheless the peaks are less intense and broadened. In addition, the peaks associated to the unreacted phases disappeared. This kind of evolution was already reported in previous works [22,25], and corresponds to a significant decrease of the coherent crystal domain. After the second step of grinding, namely low energy ball milling (LEBM performed in wet conditions), the obtained diffractograms are very similar to that obtained for the LaMn_HEBM sample. No significant evolution, neither for the phase detected nor the intensity/width of the reflection, can be observed. Comparable evolution of the Fe-containing perovskite diffractograms with the synthesis step is observed. Initially, LaFe_SSR displays LaFeO3 perovskite-type phase (PDF#37-1493, Orthorhombic crystal structure) in addition to La(OH)3 (peaks at 2θ = 27.4°, 28°, PDF#36-1481) and Fe2O3 (peaks at 2θ = 33.2°, 35.6°, PDF#33-1481) impurity phases. After the HEBM step, perovskite reflection broadening is observed, in addition to the disappearance of reflections ascribed to unreacted phases, and finally, after LEBM step, a comparable diffractogram to that obtained previously is obtained.
Crystal domain sizes were estimated using the Scherrer equation after correction for instrumental broadening. The obtained values are summarized in Table 1. Starting with micrometric crystals for the SSR-derived materials the crystal size drops down to a value in the size range of 14 to 22 nm depending on the perovskite composition and milling step. In that respect, the HEBM step induced a significant decrease of the crystal size attesting in that way that the energy transferred by the grinding induces a particle breakage. On the contrary, no significant modification of the crystal domain size could be observed after LEBM showing that this low-energetic wet milling process precludes additional decrease of the crystals. Interestingly, the B-metal nature did not have a significantly impact on the final crystal domain size which ranged in the 15–20 nm interval in line with a previous work reported in the case of Mn-containing perovskites [22] and slightly above the values reported by Gashdi et al. [25] for La1−xCexCoO3 (11–13 nm). However, in this last reference, the authors did not calcine their materials for characterization and application purpose that can explain the slightly lower reported values.

2.1.2. Textural Properties Evolution upon Grinding

N2-adsorption/desorption isotherms over LaFe based samples are presented in Figure 2. The curves exhibit the same pattern of a type II isotherm, regardless of the material composition and this isotherm shape is characteristic of materials displaying no significant porosity and the sharp N2 adsorption occurring at P/P0 above 0.8 is characteristic of external aggregate/particle porosity [26]. The amount of adsorbed N2 for the SSR material (shown for LaFeO3, Figure 2) is very low, demonstrating a limited pore volume. After the high-energy ball milling step, an increase of adsorbed N2 was observed but total volume adsorbed remained relatively low. The impact of the LEBM step on the total N2 volume adsorbed was more noticeable, as observed in Figure 2, showing that this step will impact the global porosity of the material, even if it was previously observed to have a very limited effect on the crystal domain size (Figure 1 and Table 1). As expected, the SSR materials, obtained at high crystallization temperature, displayed very limited surface areas (Table 1, ranging from 1.0 to 1.6 m2·g−1). This low surface area was directly related to the large crystal domain size displayed by the material (Table 1). After the HEBM step, leading to a significant decrease of the crystal domain size, the surface area slightly increased to 3.5 m2·g−1 ± 0.1 m2·g−1 for LaTM_HEBM, samples. Interestingly, the significant decrease of the crystal size did not promote the SSA of the samples as expected for an increase of the external surface due to non-interacting low size crystallites. Indeed, taking into account a LaFeO3 having a mean crystallite size of spherical-shape amounting to 17 nm and a density of 6.65 a theoretical SSA of 53.1 m2·g−1 was expected. The large discrepancy between the experimental surface area (3.4 m2·g−1 of accessible surface to N2) and the theoretical one indicated the formation of nanoparticle agglomerates displaying very limited porosity. After LEBM, a significant increase of the SSA was observed despite the absence of crystal domain size evolution during the milling. Then, LaFe_LEBM displayed a surface area of 18.8 m2·g−1 five time larger than the parent one. Such evolution demonstrated that the LEBM is acting mostly on the morphology of the aggregates present in the material. Two phenomena can be the origin of the SSA increase: (i) the decrease of the agglomerate size (deagglomeration process), (ii) formation/stabilization of a new porosity in the formed agglomerates [21,27]. However, it is very difficult to conclude on the impact of each phenomenon on the total surface increase, based only on N2 physisorption results.

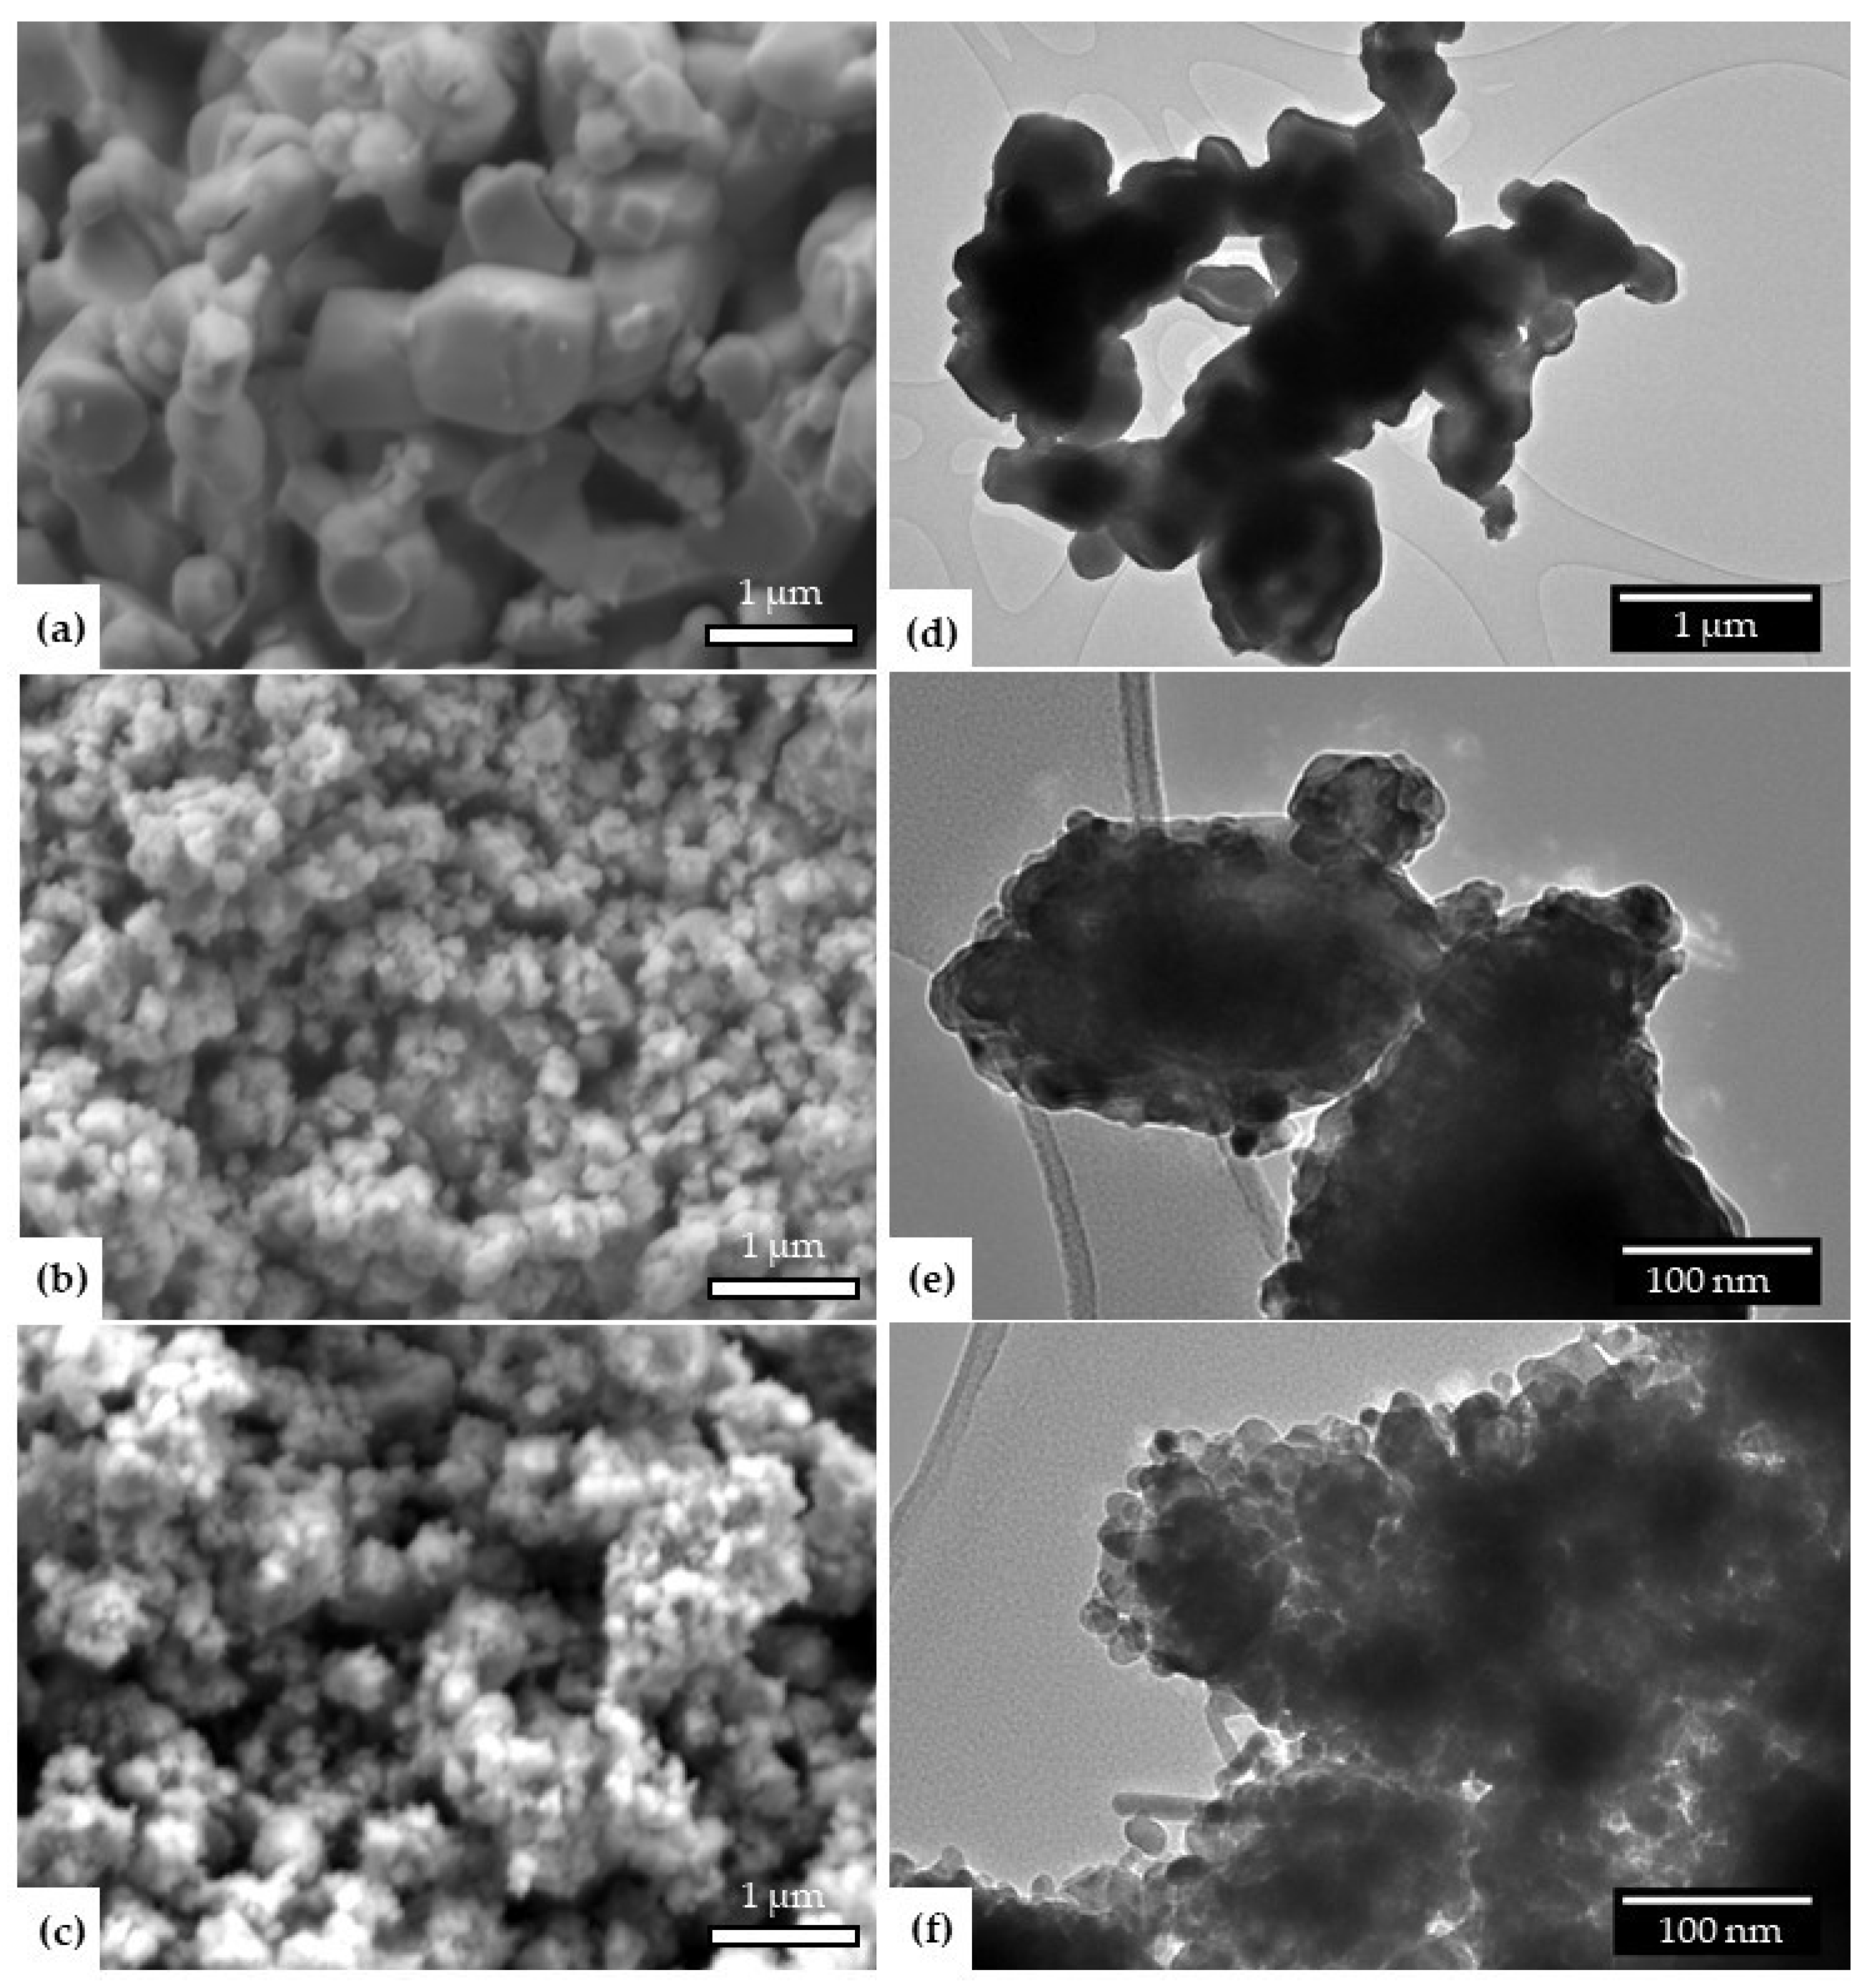
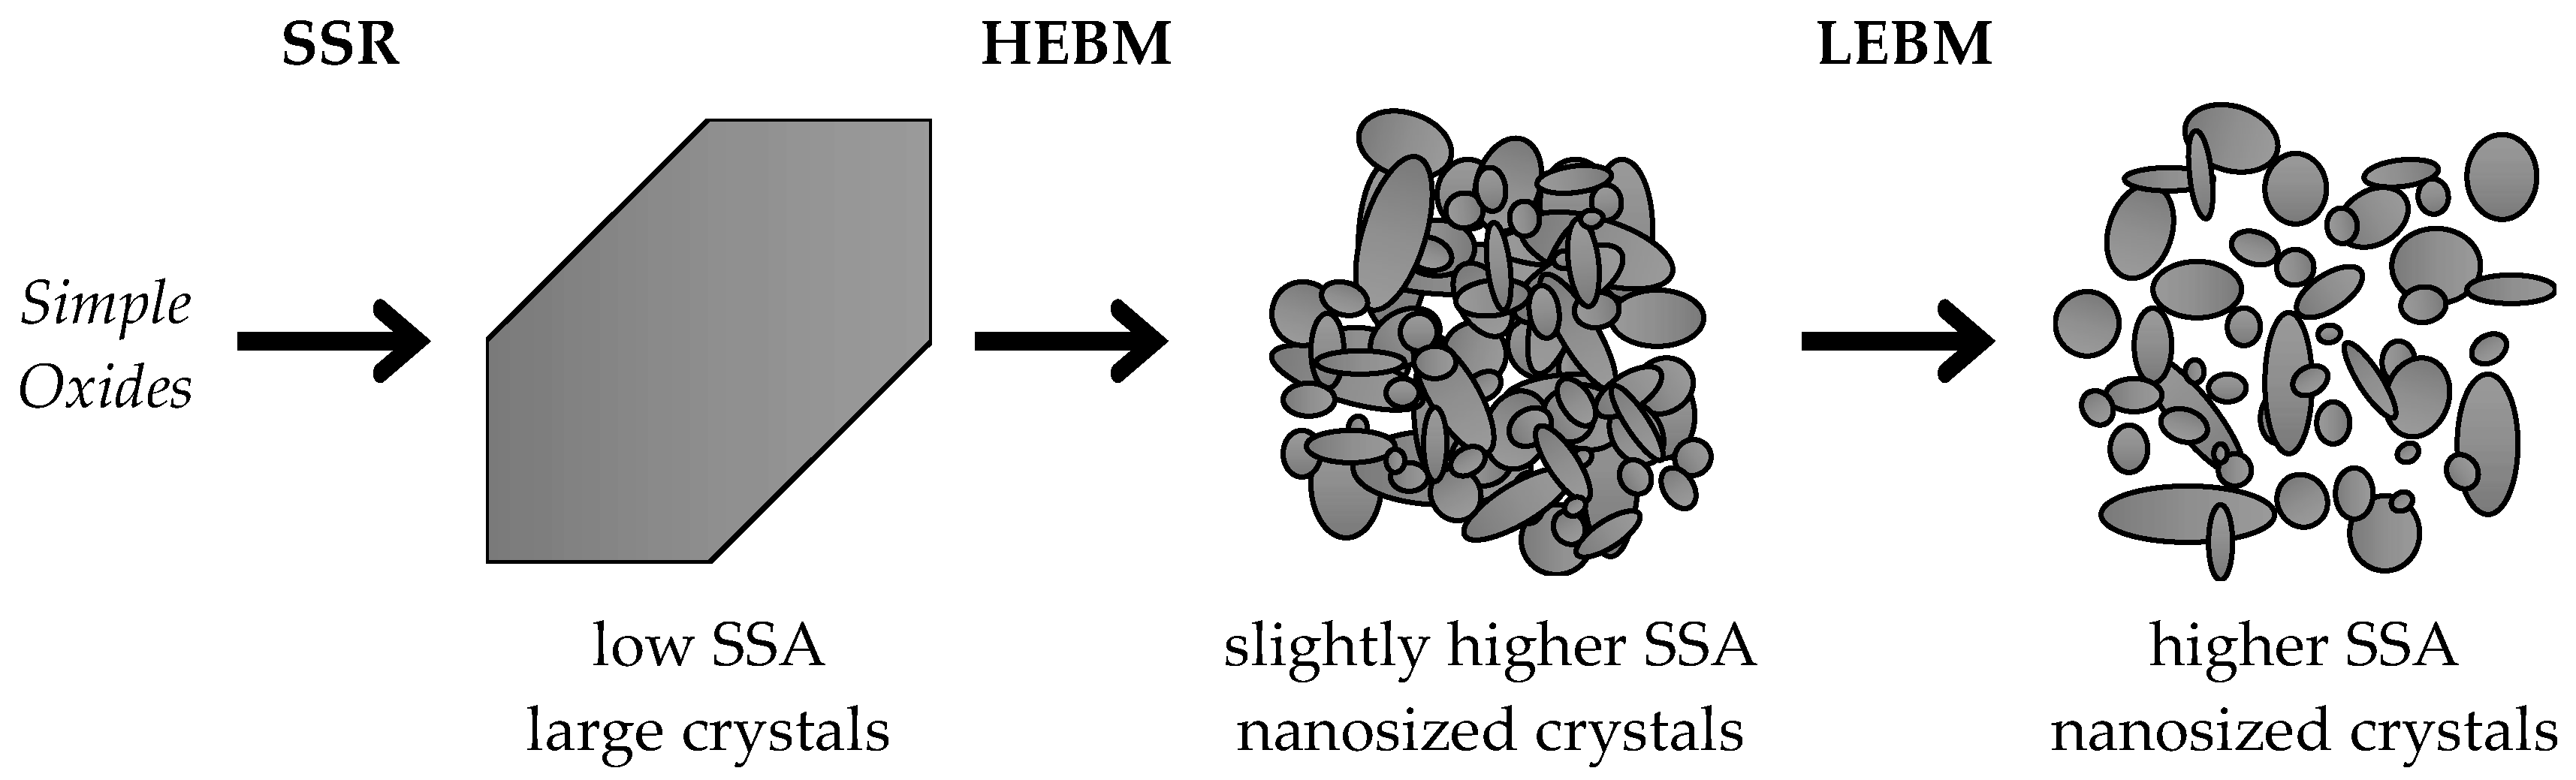
2.1.3. Morphology Evolution upon Grinding

Evolution of the morphology of the LaTM perovskite after each synthesis step was observed by scanning electron microscopy (SEM) and transmission electron microscopy (TEM). It should be noted that similar observations hold whatever TM is concerned. As an example, the corresponding SEM images for LaMn based samples are given in Figure 3a–c. The SSR sample, synthesized at high temperature (1100 °C), exhibited large hexagonal particles of different sizes, most of them being above 500 nm large and agglomerated. After HEBM, the morphology of the material consisted in small particles aggregated into large objects of about one micron in size. Then, the HEBM step allowed us to reduce the elementary crystallite size, which was consistent with the observed evolution from X-ray diffraction (XRD) analysis.
TEM analysis, presented in Figure 3d–f for LaFe-based samples, allowed us to observe the elementary particles (Figure 3e) which ranged from 10 to 40 nm. These sizes were in accordance with the XRD results, while the low surface area determined after the HEBM can be explained by the formation of dense, poorly porous, aggregates. When the material is subjected to LEBM, no significant modification of the large-scale morphology could be observed by SEM. Indeed, only aggregates of small nanocrystals were detected (Figure 3c). However, observation of the sample by TEM evidenced the formation of lower size aggregate/elementary particles despite the elementary particles remaining of comparable size than for the HEBM-derived material. As already concluded from XRD analysis, the LEBM step did not allow crystal size (as confirmed by TEM analysis, Figure 3f) to decrease, but seemed to allow the deagglomeration of the particles, leading in fine to the production of a material with higher SSA than after the HEBM step (Table 1). The Scheme 1 summarizes the role of the individual process steps, with the main characteristics of the perovskite obtained.

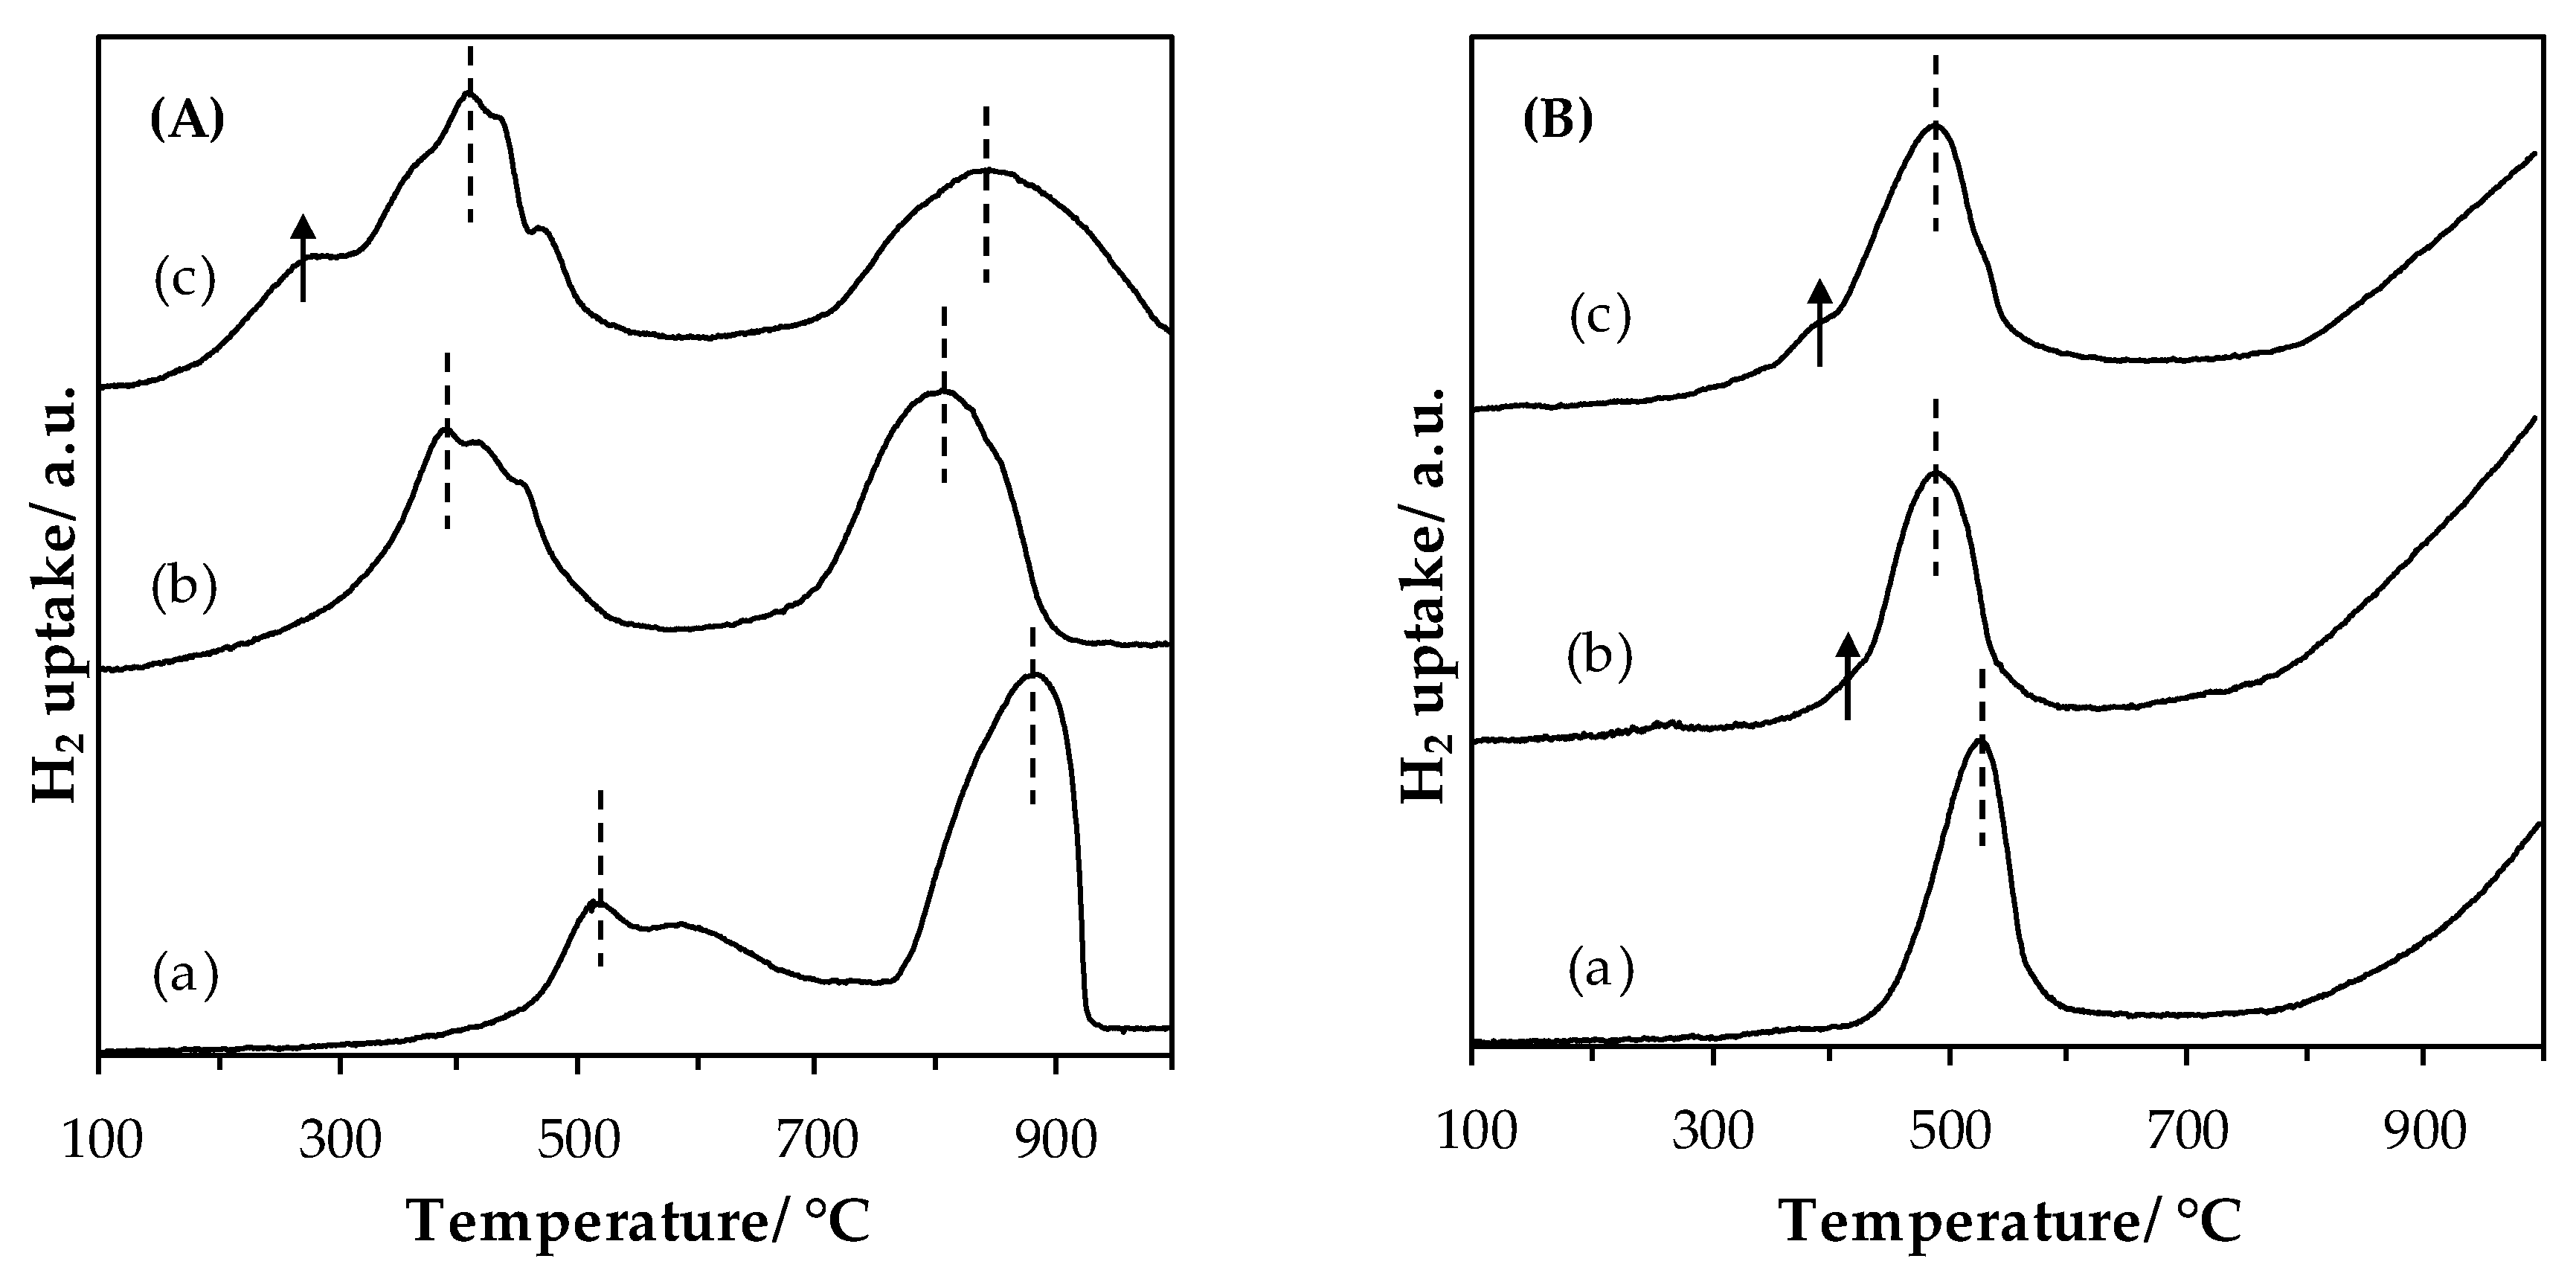
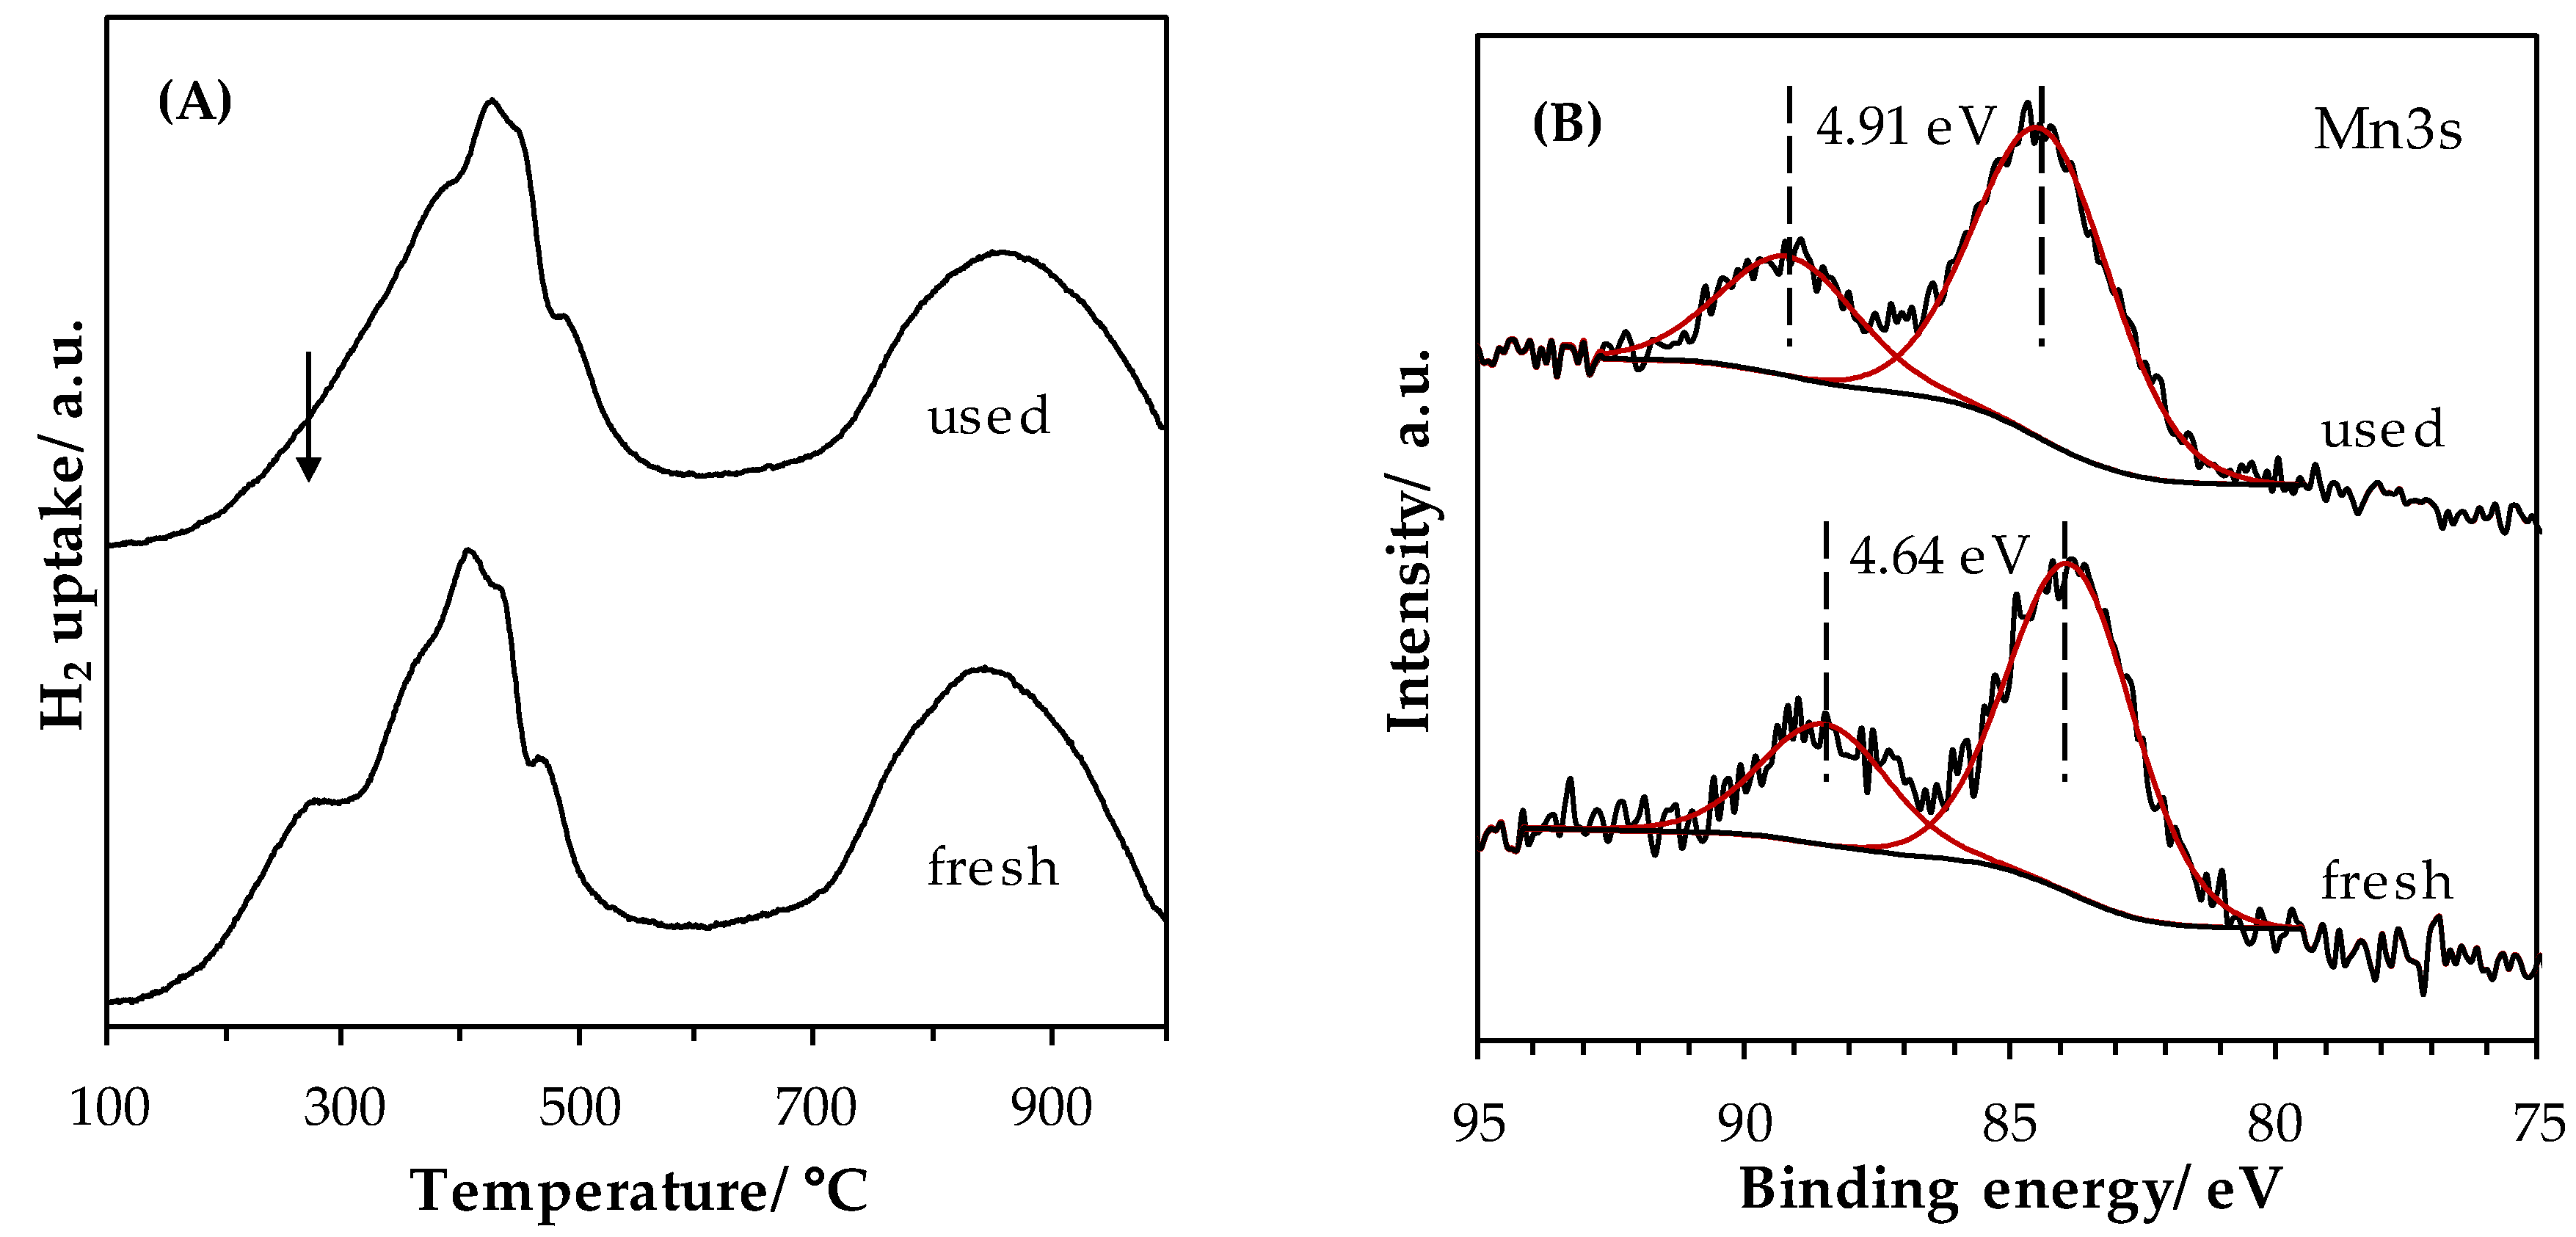
2.1.4. Evolution of Transition Metal Reducibility upon Grinding

Iron contamination is classically observed as a direct consequence of the grinding process [17,21,28] and has been estimated for LaMn samples (Table 1). Values staying below 3.0 at.% are reasonable even if an impact on the catalytic properties cannot be excluded, as already observed for MnOx [21].
Temperature-programmed reduction (H2-TPR) profiles of LaMnO3.15 (A) and LaFeO3 (B) materials are shown in Figure 4. Quantification of consumed hydrogen and temperatures at maximum hydrogen consumption are listed in Table 2.
Reduction of LaMnO3.15: the H2 consumption profile displays 2 main peaks for all the LaMn based catalysts. Overall, the Mn(+IV) and Mn(+III) entities initially present in the perovskite structure were reduced to Mn(+II). According to the literature, the two H2 consumption peaks can be ascribed to the consecutive Mn(+IV) → Mn(+III) and the Mn(+III) → Mn(+II) reductions [29,30]. Regarding the LaMn_SSR sample, these peaks were located at ~510 °C (shoulder: ~590 °C) and ~880 °C. Comparatively, for the LaMn_HEBM sample there was a lowering in terms of initial H2 consumption temperature as well as of the position of the peak maximum indicating an enhancement in the reducibility of the sample. Such improvements in reducibility have been already observed for the reduction of LaCoO3 [17] and have been interpreted in terms of a decrease of the crystal domain size. Finally, the reduction profile of LaMn_LEBM is globally comparable to that for LaMn_HEBM. However, it was now found at low temperature a new H2-consumption shoulder. This observation indicates that the LEBM plays a beneficial role in promoting the reducibility of the sample through particle deagglomeration. The Mn AOS estimated from the global H2 uptake gave a value of 3.4 (±0.1) in line with a LaMnO3.15 phase detected by XRD.
Reduction of LaFeO3: as for the Mn-based materials, two reduction steps were observed on the reduction profile of Fe-based samples. The hydrogen consumption profile registered over the LaFe_SSR sample shows one first reduction peak, with a maximum consumption at 520 °C. A second hydrogen consumption was observed to start at T > 750 °C, and is not achieved at the end of the experiment, i.e., at 1000 °C. According to the literature [31], and knowing that iron is essentially at the +III oxidation state in LaFeO3, the two successive steps should be described as:
-
Complete reduction of Fe(+III) to Fe(+II), with a possible additional hydrogen consumption of surface Fe(+II) reduction,
-
Reduction of remaining Fe(+II) to Fe(0), and obtaining of La2O3 + Fe(0) individual phases.
Quantification of hydrogen consumed in the first reduction peak, for LaFe_SSR allowed us to calculate an AOS of 2.4 (considering that the first step is only related to the Fe(+III) to Fe(+II) reaction), that is consistent with results available in the literature [31]. As observed for the LaMnO3.15 series, the HEBM step led to a shift of the hydrogen consumption step toward the low temperatures by 30 °C with a small additional consumption visible at 410 °C. Quantification led to a comparable value of AOS (Table 2). Finally, the LEBM step does not induce a significant change in hydrogen consumed and hydrogen consumption position. The only minor modification concerns the low temperature contribution, and the increase in intensity of the consumption located at 410 °C. However, global consumption always leads to an AOS of 2.5 (±0.1), comparable to the value obtained for the SSR and HEBM materials. The consumption peak at 410 °C can originate from the reduction of surface FeOx clusters, since Faye et al. reported a comparable temperature of reduction of Fe2O3 highly dispersed on the surface of LaFeO3 (405 °C for the first consumption [31]).

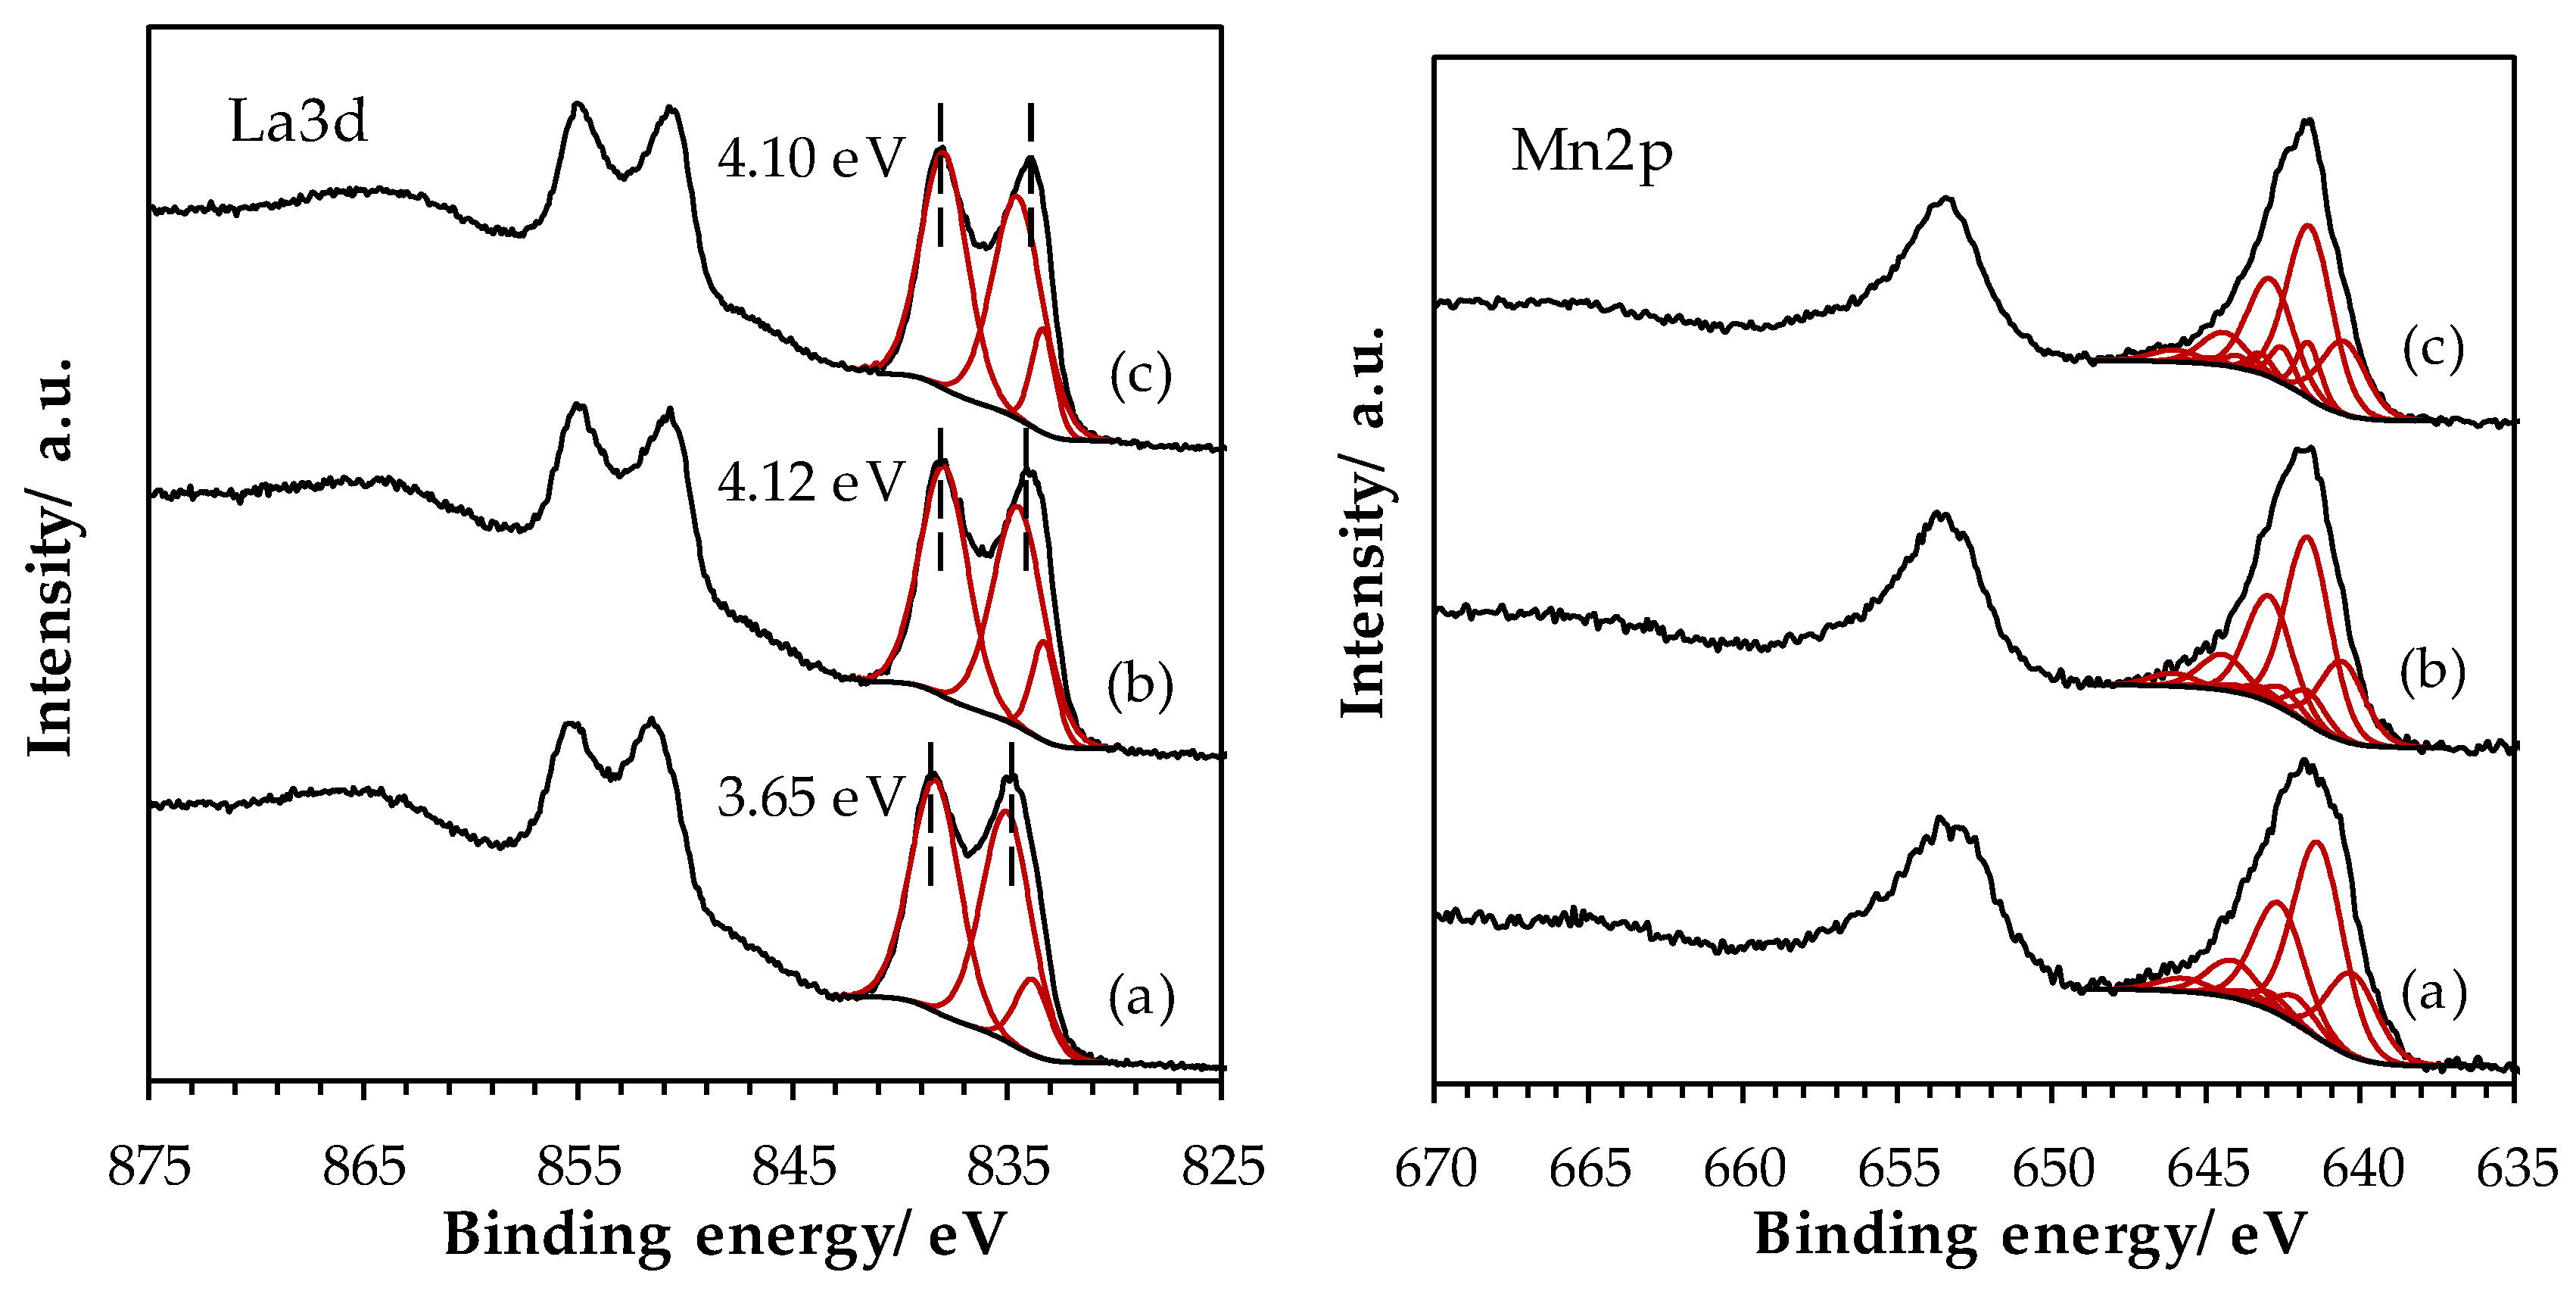
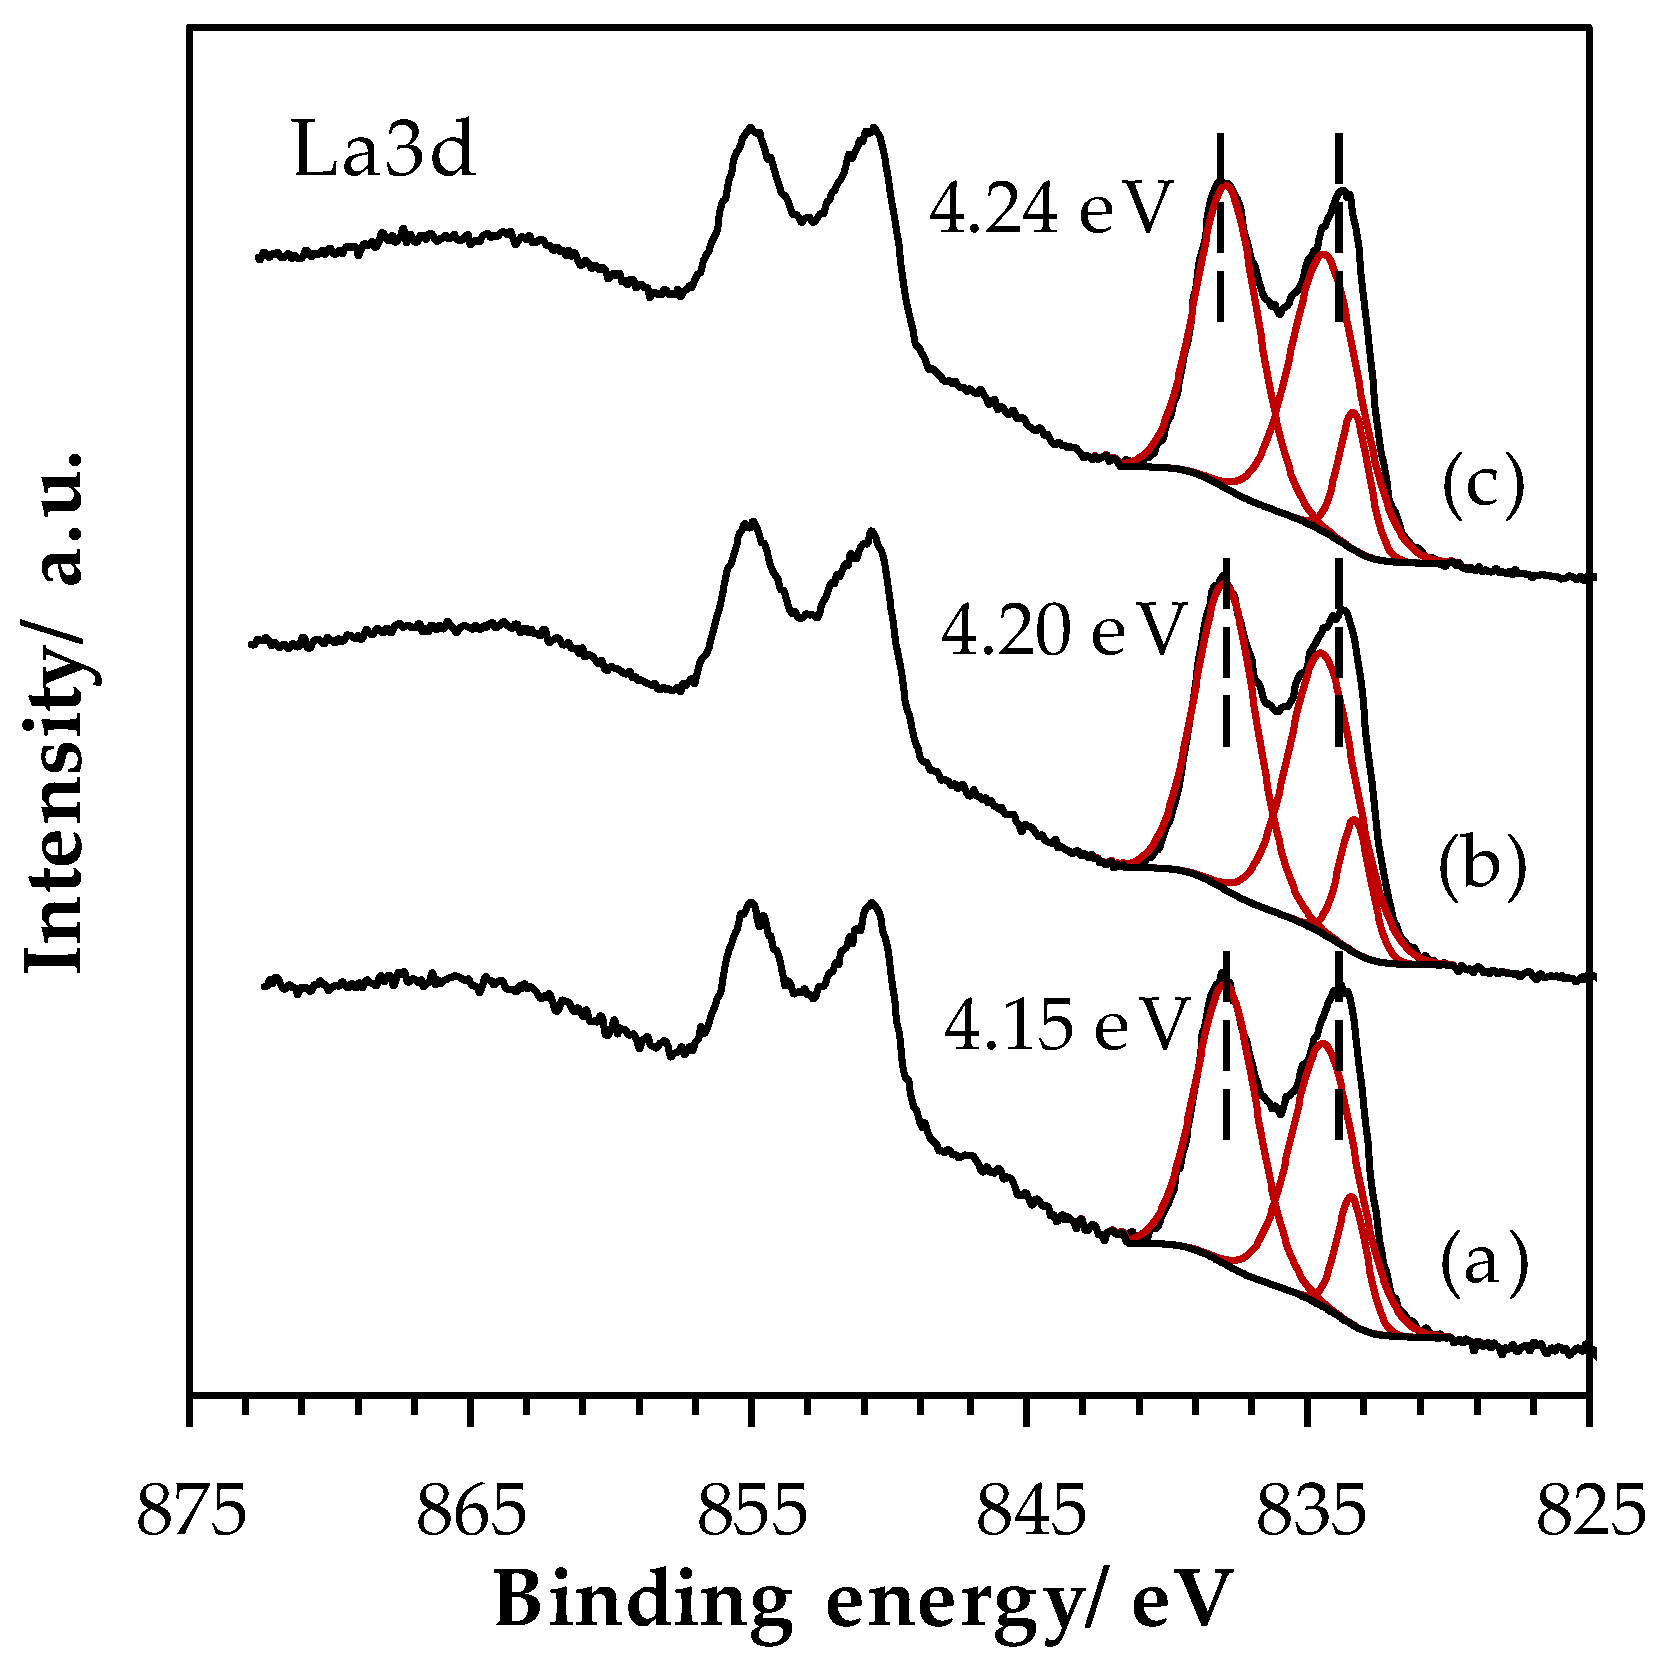
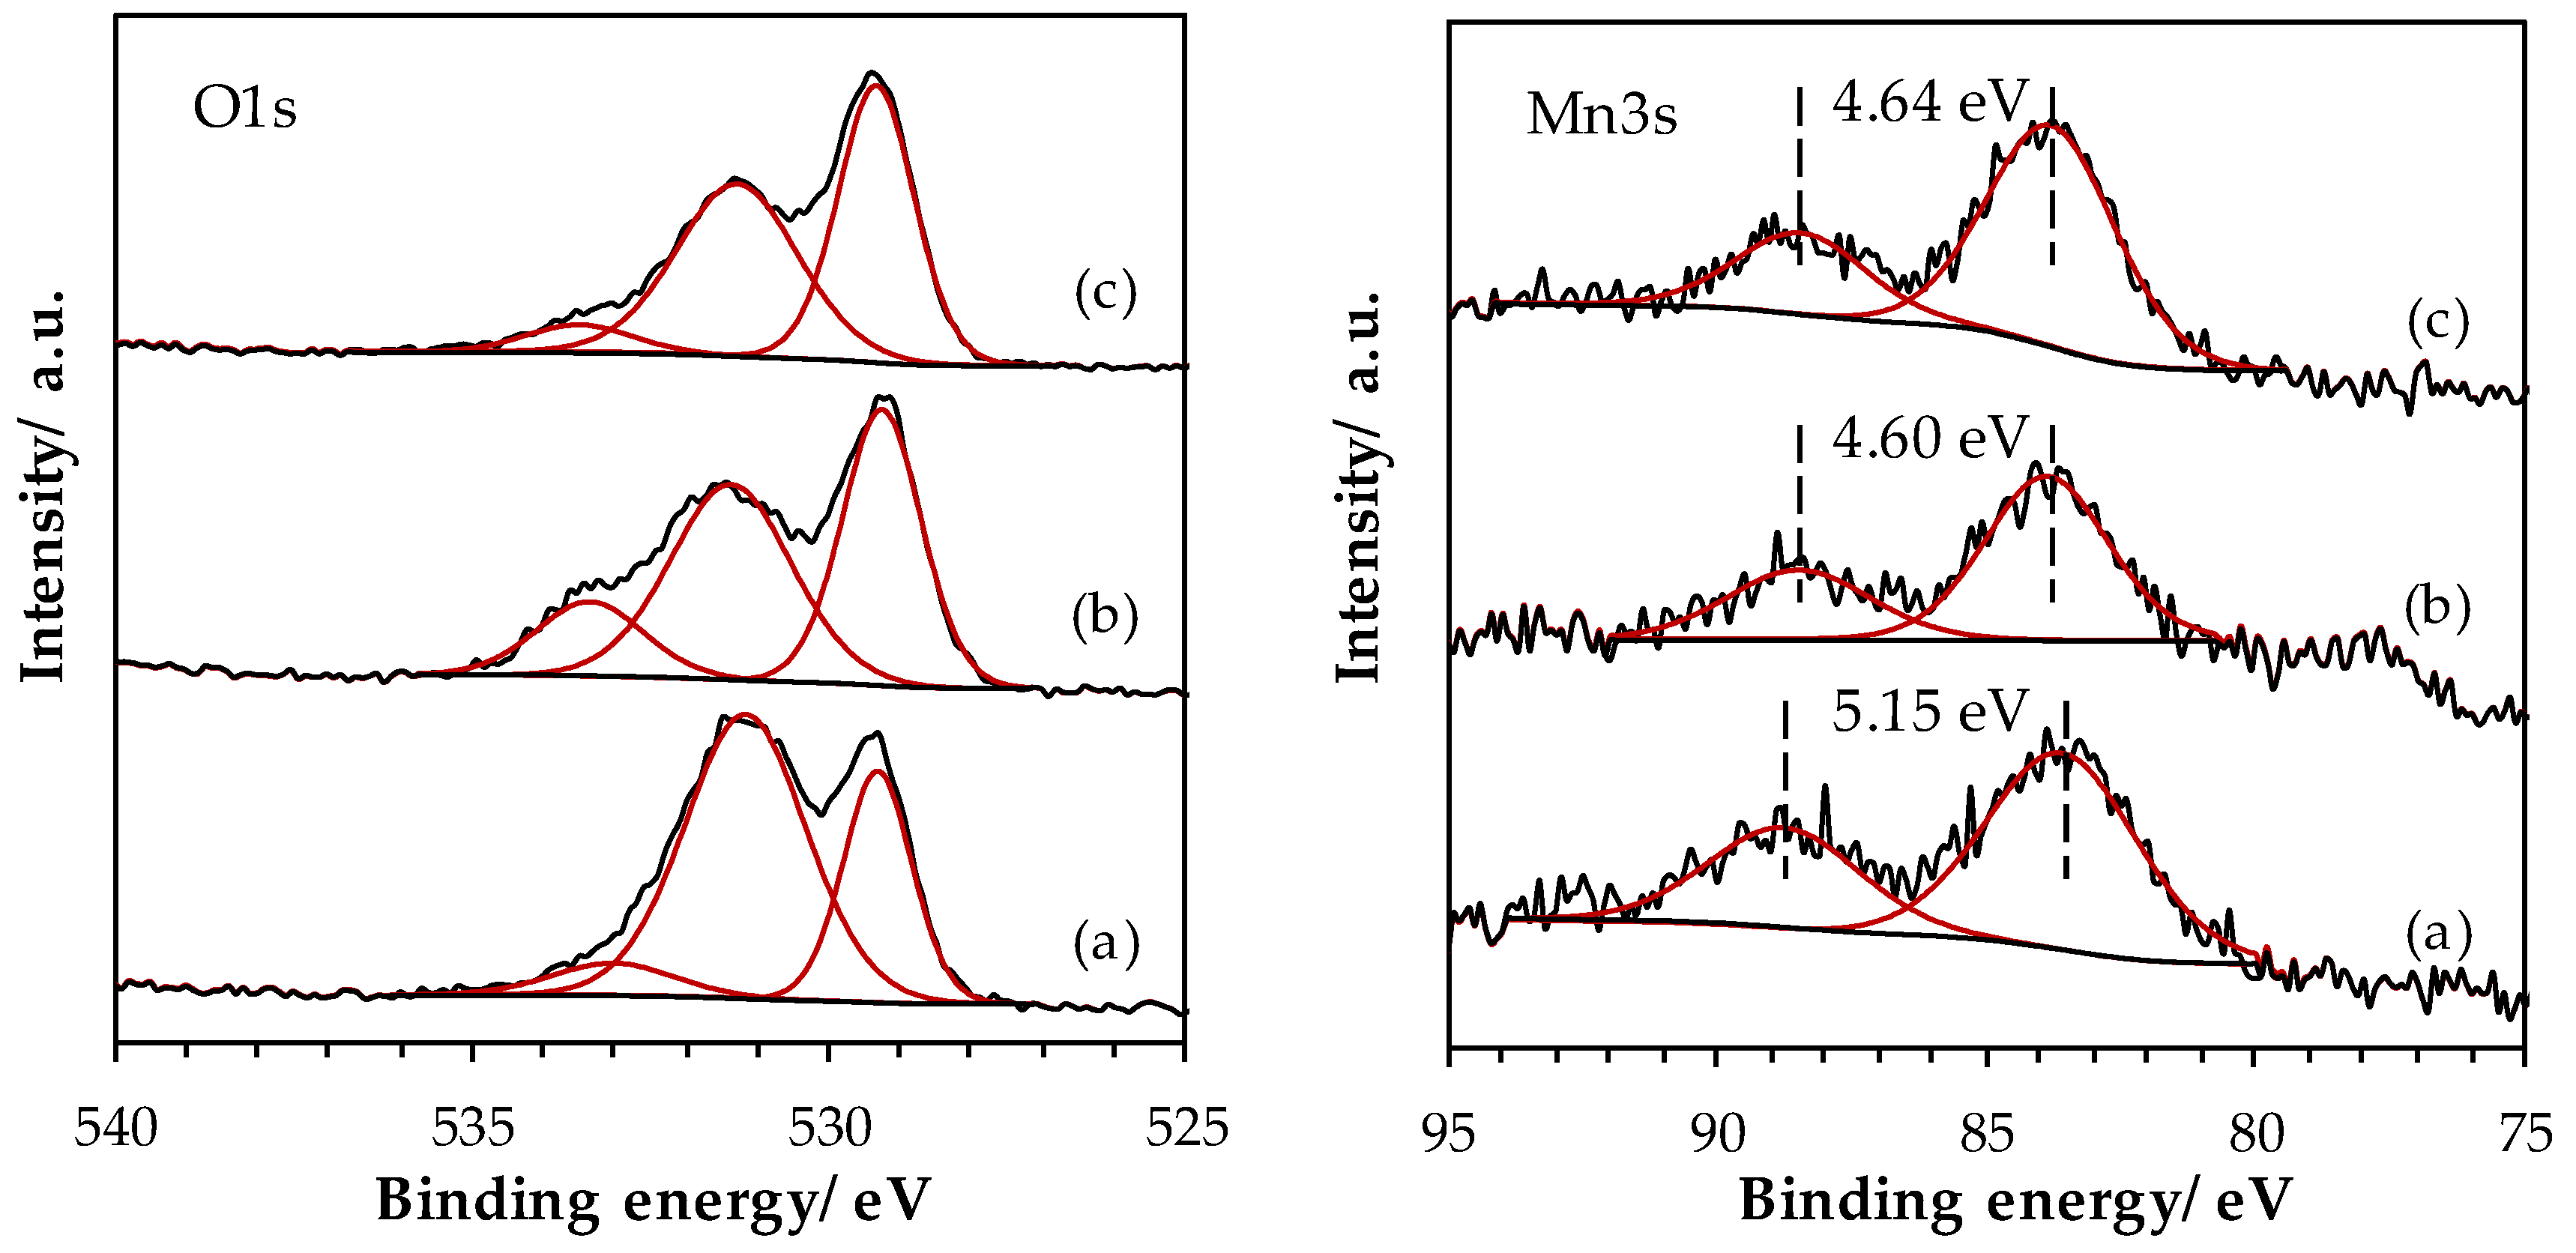
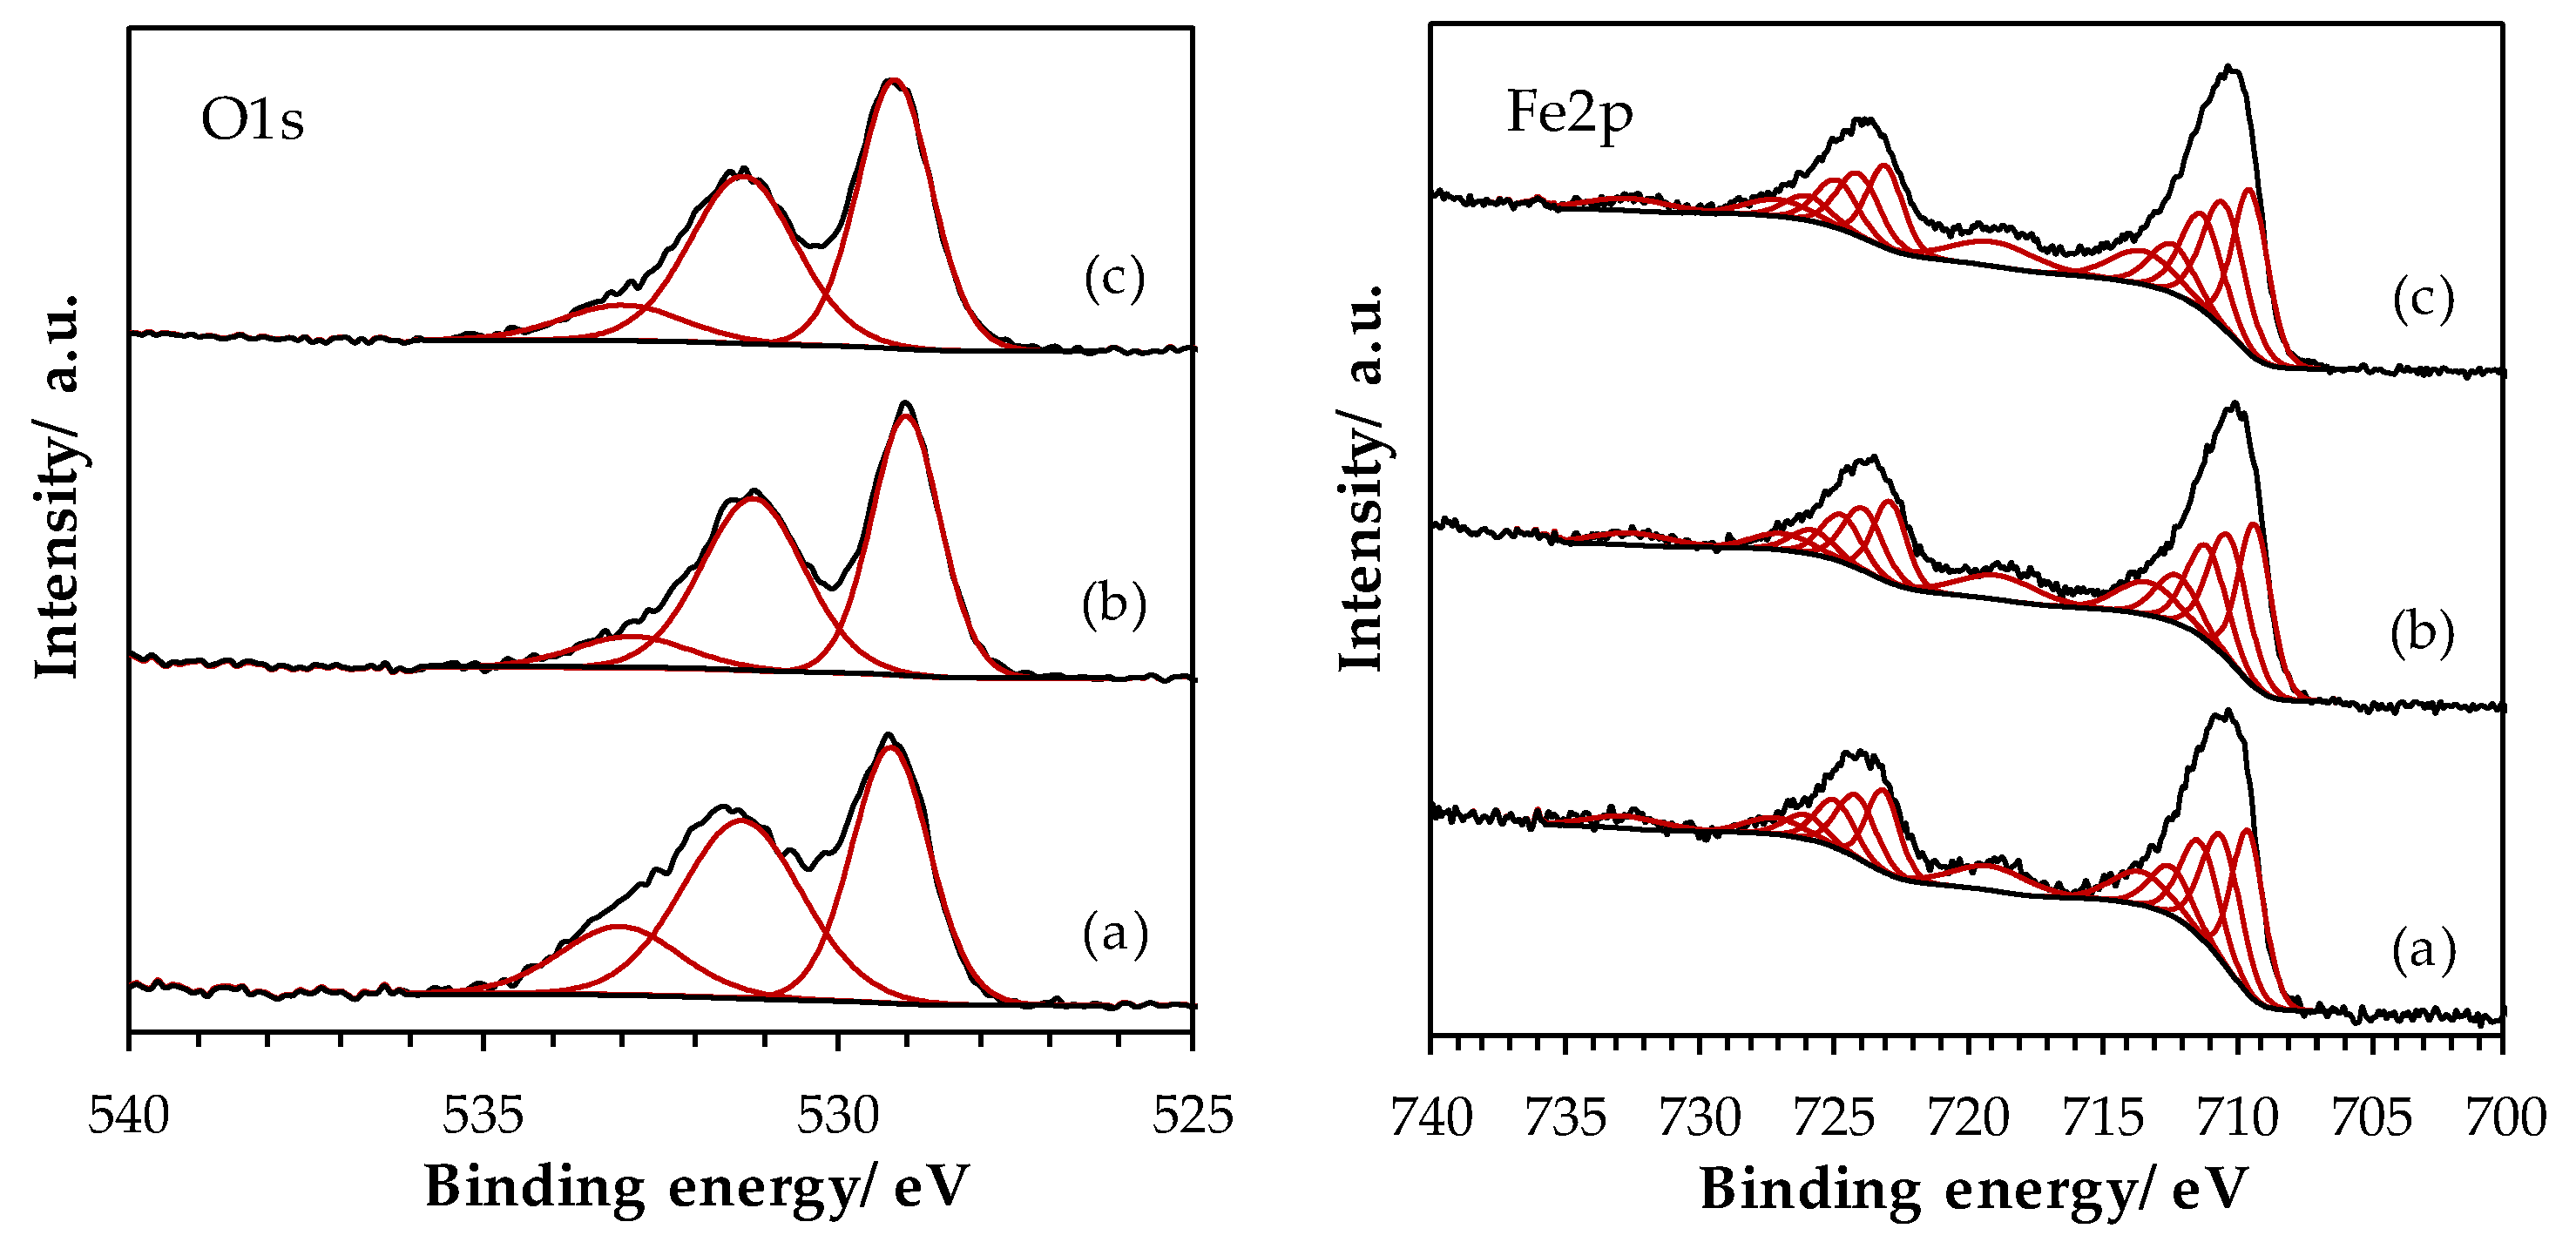
2.1.5. Surface Properties of Materials

X-ray photoelectron spectroscopy (XPS) quantification results are shown in Table 3. The quantification is based on La 3d, O 1s and Mn 2p or Fe 2p peak areas. The La atomic percentages are higher than stoichiometry. The lanthanum surface enrichment is often reported for La-based perovskites [32]. For LaMn_SSR sample, this enrichment can be explained by the presence of La(OH)3 at the outermost surface. With the disappearance of La(OH)3 in the course of ball milling and the surface contamination by Fe, the La enrichment became less pronounced for LaMn_HEBM and LaMn_LEBM samples. An opposite trend was observed over the LaFeO3 samples as a slight La enrichment of the surface was observed after the HEBM and LEBM steps, a phenomenon that cannot be explained at this stage considering that TPR experiment, and especially the low contribution reduction at 410 °C, suggesting the formation of surface FeOx cluster species that should have contributed to a decrease in La/Fe surface ratio.
The superposition of the O 1s spectra for the three LaMnO3.15 samples is shown in Figure 5. Satisfactory peak fitting can be achieved with three components in the three samples. The component OI at low BE (529.2 eV) is assigned to bulk O2− species [33]. At intermediate BE, the large OII component, centered at 531.3 eV, is ascribed to several species such as OH, CO32−, O22− and/or O species [34]. The presence of carbonate species is confirmed on the C 1s core level spectra, with a signal located at 289.0 eV. The OIII component, at higher BE (533.3 eV), originates from adsorbed water [35]. The SSR sample exhibits an intense OII component, which can be related to the presence of La(OH)3 (XRD) and carbonate surface species. The contribution of this component to the O 1s signal significantly decreases after the HEBM process and remains rather constant after the LEBM process, in agreement with the disappearance of the La(OH)3 phase after the ball milling processes. Figure A1 (Appendix A) shows the La 3d region for LaMnO3.15 samples, the La 3d spectrum being split into a 3d5/2 and a 3d3/2 lines due to the spin-orbit interaction. The magnitude of the multiplet splitting can be useful for the chemical assessment. While the energy difference between the main peak and its satellite (ΔE(La3d)) is around 3.9 for La(OH)3, the one for La2O3 is higher (4.6 eV) [36]. Therefore the increase in ΔE(La3d) value observed after the HEBM process suggests a lower La(OH)3 contribution to the La3d signal, in agreement with the XRD results and O 1s spectra analysis. Mn 2p spectra (Figure A1) show two main peaks corresponding to the spin–orbit split of 2p3/2 and 2p1/2 levels, while the weak signal at lower BE from the main peak is assigned to the satellite of the 2p1/2 peak. The 2p3/2 peak satellite is not noticeable because it overlaps with the 2p1/2 peak. Mn 2p3/2 peak has its maximum at BE of 641.6 eV for the three LaMnO3.15 samples. This BE value is intermediate between those recorded for Mn2O3 and for MnO2 [37], confirming the presence of a mixture of Mn3+ and Mn4+ species in the LaMnO3.15 samples. In order to estimate the proportion of Mn3+ and Mn4+ species, the Mn 3s core level has been studied. The superposition of Mn 3s spectra is shown in Figure 5. Two peaks, originating from the coupling of non-ionized 3s electron with 3d valence-band electrons [38], are distinguished. From the energy difference between the two peaks, ΔE(Mn 3s), it is possible to estimate the Mn AOS [39]. A significant decrease in ΔE(Mn 3s) value was observed from LaMn_SSR to LaMn_HEBM sample, and then remains stable for LaMn_LEBM sample (Figure 5). Therefore, the HEBM process resulted in a pronounced increase in Mn AOS on the material surface from 3.2 to 3.8, while the LEBM process does not induce significant additional change (Table 3). The surface AOS (obtained by XPS, Table 3) is identical to the bulk AOS (obtained by TPR, Table 2) for the LaMn_SSR material. However, while the bulk AOS was not affected during the HEBM and LEBM steps, it is evident from the XPS results that these steps result in an oxidation of the surface Mn ions.
XPS results obtained for the LaFeO3 samples are presented in Figure 6. The superposition of the O 1s spectra is shown in Figure 6. As previously observed for Mn-based samples, the same three components can be extracted from the O 1s signal. However, the component contributions to the O 1s signal are not significantly impacted by the ball milling process, since the OI to OII component ratio is similar regardless the synthesis step. Figure A2 shows the La 3d region obtained for the LaFe samples. ΔE(La 3d) values remains constant for the three samples: the multiplet splitting amplitude of ~4.2 eV confirms the oxide form. Figure 6 shows the curve fitted Fe 2p spectra. Indeed, the similarly to Mn 2p spectra, Fe 2p signal presents multiplet structures which can be fitted in order to resolve the surface iron state. The Fe 2p spectral fitting parameters of Fe2O3 compound proposed by Biesinger et al. [37], i.e., binding energy, percentage of total area, full width at half maximum and spectral component separation, have been used to simulate the Fe 2p signal. The good concordance between the fitted integration and the Fe 2p experimental envelope suggests that iron species are mainly in +III oxidation state, as it is often described in the literature.

2.2. Catalytic Performances

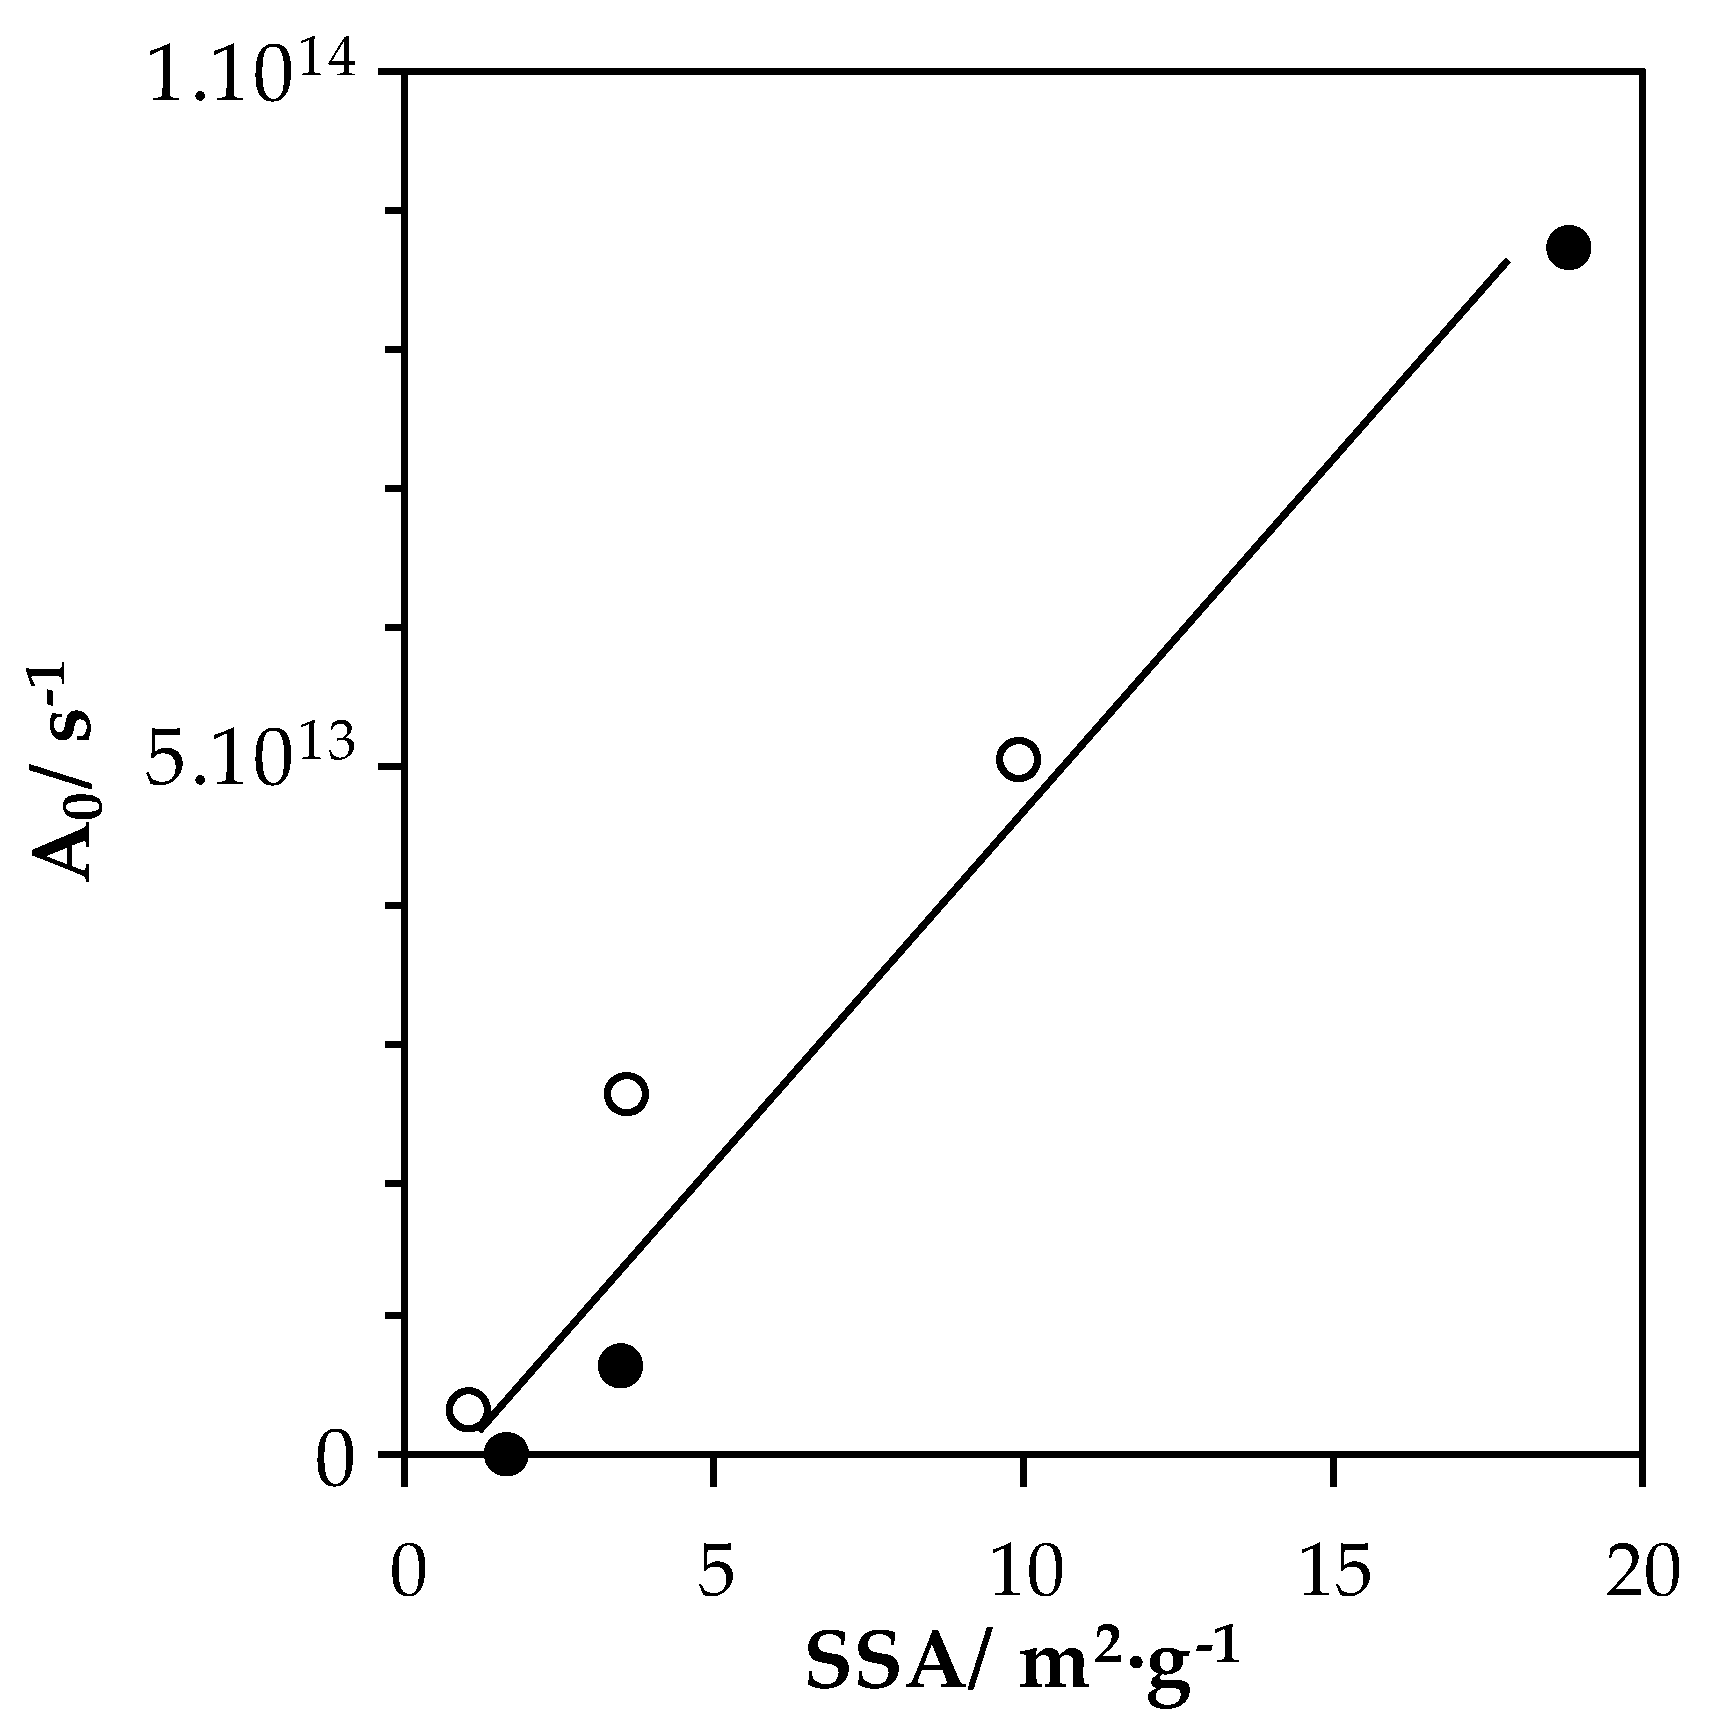
2.2.1. Catalysts Activity

Catalytic performances of materials were evaluated in the toluene total oxidation reaction. Conversion versus reaction temperature curves are shown in Figure 7. As first remark, reactions performed with different LaFe samples lead to the production of only CO2 and water as products, while benzene traces (not quantifiable) appear as a byproduct during reactions over LaMn samples, for high conversion value (X > 50%). Consequently, conversions plotted in Figure 7 refer to selective conversion into CO2.
LaMn_SSR and LaFe_SSR (straight lines) show low performances for the toluene oxidation reaction with 39% and 13% toluene converted in CO2 at T = 330 °C, respectively. After the high-energy ball milling process, far better performances were obtained with a shift of the light-off curves toward the lower temperature by −39 °C (LaMn_HEBM) and −52 °C (LaFe_HEBM). Samples from the second step of grinding at low energy showed even better performances with additional shifts toward the lower temperature by −12 °C for LaMn_LEBM, and by −40 °C for LaFe_LEBM. T10, T50 and T90 values, reflecting the catalytic performances of each materials are given in Table 4. The following ranking of activity was obtained:
LaFe_LEBM > LaMn_LEBM > LaMn_HEBM > LaFe_HEBM > LaMn_SSR > LaFe_SSR
Then, and as easily observed in Figure 7, the most active materials are LEBM-derived solids. It is interesting to note that LaFe_HEBM is little more active than LaMn_HEBM, while in the literature, a reverse order is generally reported even at low temperature (CO [11,15]) and at high temperature (CH4 [15,40]). However, when analyzing the normalized activities (per surface unit), the activity ranking becomes:
LaMn_HEBM > LaMn_LEBM > LaFe_LEBM > LaFe_HEBM >> LaMn_SSR > LaFe_SSR
This result clearly demonstrates that the Mn-containing formulation are little more active than the Fe-containing ones, in line with the more important reducibility of manganese as determined by TPR (Figure 4) and demonstrating a lower temperature of activation for the Mn(+IV)/Mn(+III) redox couple than for the Fe(+III)/Fe(+II) redox couple.
Figure 8 shows the Arrhenius plots drawn from conversion curves at X < 20%, assuming a first order toward toluene concentration and a zero order toward oxygen. Activation energies, estimated from Arrhenius plots slopes, are reported in Table 4. Calculated activation energies for the toluene oxidation over LaMn samples show values comprised between 126 and 146 kJ·mol−1. Calculated activation energies for the reaction over LaFe samples oscillated from 137 to 164 kJ·mol−1 respectively. Considering the precision of the measure, i.e., light off curve measurement, whole materials display comparable Ea, at an average value of 145 kJ·mol−1 suggesting a comparable oxidation mechanism for LaFe- and LaMn-containing formulation and whatever the synthesis step (SSR, HEBM, LEBM). Similar activation energy values had been reported for La1−xCaxBO3 (B = Fe, Ni) systems by Pecchi et al. [41].
Assuming an average Ea of 145 kJ·mol−1, corrected pre-exponential factor (A0 cor) is re-calculated, and obtained values are listed in Table 4. A0 cor factors, obtained at constant Ea for all materials, reflect the evolution in active sites on the catalysts, and when plotted as a function of the surface area of the solid (Figure 9), this allows us to determine the active site surface density. From Figure 9, it seems evident that a roughly linear correlation was obtained between A0 cor and materials surface area. Consequently, the active sites in materials evolves linearly with the surface area. Nonetheless, LaMn samples showed a slightly higher active site surface density than their LaFe equivalent.

2.2.2. Stability Tests

The toluene conversion into CO2 evolution as a function of time are presented in Figure 10 for the HEBM and LEBM catalysts (T = 285 °C; 70 h). Both LaMn based catalysts show a rapid deactivation in the five first hours before to slightly linearly deactivate with time. The activity coefficient a285 (see experimental part) are rather similar for both catalysts amounting to 0.66 and 0.64 for LaTM_HEBM and LaTM_LEBM catalysts, respectively. This likely indicates that the LEBM treatment has no effect on the stability of the catalyst on stream. By opposition, a good stability for the LaFe-based catalysts was found over time in terms of toluene conversion into CO2. It should be noted that, for all catalysts, it is found neither phase transformations nor crystallite size increase by XRD. Furthermore, the SSA keeps unchanged after the stability test considering the margin of uncertainties.
Behar et al. have shown that the total oxidation of toluene can be easily described by a Mars–van Krevelen model when Cu-Mn mixed oxide is used as catalyst [42]. In this model the toluene is oxidized by the catalyst and not directly by the gaseous oxygen, and the role of gaseous oxygen was in restoring and maintaining the oxidized state of the catalyst. The oxidized state of the LaMn_LEBM after the stability experiment was studied by means of H2-TPR and XPS analyses. Figure 11A shows the comparison between the two H2-TPR profiles obtained on the fresh and used LaMn_LEBM catalysts. It can be clearly seen that, for the used LaMn_LEBM sample, the shoulder at low temperature (280 °C) disappeared, suggesting that some Mn species in a high oxidation state (Mn(+IV)) are reduced during the stability test. Similarly, the analysis of the Mn 3s photopic (Figure 11B) shows an increase in the peak splitting ΔE(Mn 3s) value, from 4.64 eV for fresh LaMn_LEBM to 4.91 eV for the used one, which demonstrates a decrease in the Mn AOS value (from 3.7 to 3.4) after the stability experiment. Therefore, the deactivation observed for LaMn_LEBM catalyst could be related to the decrease in Mn AOS, the step of reoxidizing the reduced catalyst with gaseous oxygen being most likely the rate-determining step.

3. Materials and Methods

3.1. Synthesis

Perovskite-type mixed metal oxides LaMO3 (M = Mn or Fe) were synthesized by a three-step reactive grinding process:
-
STEP 1, Solid state reaction—SSR: oxide precursors (La2O3 and Mn2O3 or Fe3O4) were homogeneously mixed in such a way as the molar La:B be equal to 1.0 and calcined for 4 h at 1100 °C under static air atmosphere to obtain the perovskite phase (confirmed by XRD analysis). Materials produced at this step were LaMn_SSR and LaFe_SSR.
-
STEP 2, High-energy ball milling—HEBM: a first high energy milling step was performed for 90 min (SPEX 8000D grinder with stainless steel equipment and balls (ø 1 × 11 mm, 2 × 12.5 mm), under static air atmosphere) at a revolution frequency of 17.5 Hz (1060 cycle·min−1).
-
STEP 3, Low-energy ball milling—LEBM: a second low energy ball milling was performed for 120 min (Union Process’ Svegvari attritor with stainless steel equipment and balls (ø 5 mm), with addition of a small amount of water (0.4 mL per g of material)) at a rotation speed of 450 rpm. The muddy sample was recovered using 500 mL of water and dried at 150 °C overnight.
Materials taken from step 2 and 3 are calcined for 3 h at 400 °C prior to characterization and catalytic performance evaluation, and are respectively named LaM_HEBM and LaM_LEBM.

3.2. Physico-Chemical Characterizations

The physicochemical properties of the materials were evaluated after each steps of the synthesis. Diffractograms are recorded on a Bruker D8 apparatus, using the CuKα radiation (λ = 1.54059 Å). Data were collected for 2θ between 10° and 80°, with an increment of 0.05° and an integration time of 1.0 s at each step. Diffractograms were indexed using references PDF database. Crystallite mean sizes are calculated using the Scherrer equation: Dcryst = (k·λ)/(β·cosθ), where k and β are respectively the shape factor (~0.9) and the corrected full width at half maximum. N2-physisorption experiments were collected on a Micromeritics Tristar II porosity instrument. A known mass of catalyst was degassed at 150 °C under vacuum for 6 h. Isotherms were registered at a temperature of −196 °C and SSA were determined from the adsorption branch in the 0.05–0.30 P/P0 range with the Brunauer–Emmett–Teller (BET) equation. SEM images were acquired on a JOEL JSM 5300 microscope equipped with EDXS module, allowing elemental quantification. Samples were previously put on a carbon tape and coated with graphitic carbon to reduce charging effect. TEM images were registered on a MET FEI Tecnai G2-20 twin microscope equipped with LaB6 source and providing an electron beam with an acceleration voltage of 200 kV. Samples were dry-deposed on a copper grid without any other treatment. Temperature-programmed reductions were operated on a Micromeritics AutoChem II 2920 chemisorption analyzer. A catalyst mass, fixed to ~40 mg, was inserted in a quartz reactor and degassed under inert gas. A flow of 5 vol.% H2/N2 was stabilized at a total flow rate of 50 mL·min−1, and the catalyst was heated from 40 °C to 900 °C at a temperature increase rate of 10 °C·min−1 (K and P parameters respectively of 88 s and 15 °C). X-ray photoelectron spectroscopy analysis was carried out using a Kratos AXIS Ultra DLD apparatus with a monochromated Al Kα (1487 eV) source. Processing was performed using CasaXPS software, spectra being energy-corrected according to the main C 1s peak positioned at 284.8 eV.

3.3. Catalytic Activity Measurements

Catalytic performances were evaluated in the gas phase toluene oxidation reaction. A mass of catalyst equal to 0.200 g was positioned in a fixed bed reactor and was heated from 25 °C to 330 °C for30 min (2 °C·min−1) under synthetic air flow. Then, the reaction flow, composed of 1000 ppmv of toluene diluted in synthetic air, was stabilized at a flow rate of 100 mL·min−1 (given a Weight Hourly Space Velocity of 30,000 mL·h−1·g−1) and the reactor temperature was allowed to decrease from 300 °C to 150 °C at a constant temperature decrease rate of −0.5 °C·min−1. Stability experiments were performed during 70 h at a constant temperature of 285 °C. Exhaust gases were analyzed by gas chromatography and the results were expressed in terms of toluene conversion into carbon dioxide: X(%) = 100·[CO2]out/(7·[C7H8]in). To quantify the resistance against deactivation an activity coefficient a285 was defined as the ratio between the toluene conversion after 70 h reaction to that at initial time.

4. Conclusions

Mn- and Fe-containing perovskite were synthesized by a three-step reactive grinding process followed by calcination at 400 °C for 3 h. The reactive grinding process involved a first step resulting in the obtention of a crystalline perovskite at high temperature (solid state reaction) followed by a second step of HEBM affording a mean crystal size decrease to end up with a LBEM step performed in wet conditions for surface area improvement. Nanocrystalline LaMnO3.15 and LaFeO3 were obtained (crystal size range of 14–22 nm obtained after milling steps). The most efficient LEBM was found for the LaFeO3 formulation allowing it to reach a SSA of 18.8 m2·g−1. It was noted that the TM reducibility was significantly affected by the HEBM step through the lowering of the crystal size leading to a decrease of the temperature of reduction of the Mn(+IV) and Fe(+III) species. XPS analysis evidenced the important effect of the grinding steps on the surface composition. Catalytic tests provided evidence of the importance of the catalyst SSA for the conversion of toluene. Then, while comparable activation energies were estimated for both perovskite compositions (Mn and Fe), from the overall results it was found that: (i) a higher intrinsic activity for the Mn-compositions than for the Fe-compositions due to a better redox behavior; (ii) a higher weight activity for Fe-compositions due to higher surface areas. Finally, while Mn-formulations deactivated significantly (−30% after 70 h on stream), far better stability was reported for Fe-formulations.

Author Contributions

B.H. prepared the materials, conducted the experiments and wrote the first draft of the paper. J.-F.L., S.R. and H.A. supervised the work. All authors contributed to the data interpretation, the discussion and the revision of the paper.

Funding

B.H. thanks Laval University (Canada) and Lille University (France) for funding his joint PhD. The “DepollutAir” project (grant number 1.1.18) of the European Program INTERREG V France-Wallonie-Flanders (FEDER), Chevreul institute (FR 2638), Ministère de l’Enseignement Supérieur et de la Recherche and Région Hauts-de-France are acknowledged for the funding and their support for this work.

Conflicts of Interest

The authors declare no conflict of interest.

Appendix A

Table A1. Binding energies of LaMnO3.15 and LaFeO3 samples’ XPS components.
SampleBE (eV)
La3d5/2Mn2p3/2Fe2p3/2O1s 1
LaMn_SSR834.7641.6 529.3/531.2/533.0
LaMn_HEBM834.1641.6 529.2/531.3/533.3
LaMn_LEBM833.9641.7 529.4/531.3/533.5
LaFe_SSR833.9 710.8529.3/531.4/533.1
LaFe_HEBM833.7 710.6529.0/531.2/532.9
LaFe_LEBM833.6 709.6529.2/531.3/533.0
1 values corresponding to OI/OII/OIII type species.
Figure A1. High-resolution spectra of La 3d and Mn 2p core level spectra for LaMnO3.15 samples: (a) SSR, solid state reaction; (b) HEBM, high-energy ball milling; (c) LEBM, low-energy ball milling.
Catalysts 09 00633 g0a1
Figure A2. High-resolution spectra of La 3d core level spectra for LaFeO3 samples: (a) SSR, solid state reaction; (b) HEBM, high-energy ball milling; (c) LEBM, low-energy ball milling.
Catalysts 09 00633 g0a2

References

  1. He, C.; Cheng, J.; Zhang, X.; Douthwaite, M.; Pattisson, S.; Hao, Z. Recent Advances in the Catalytic Oxidation of Volatile Organic Compounds: A Review Based on Pollutant Sorts and Sources. Chem. Rev. 2019, 119, 4471–4568. [Google Scholar] [CrossRef] [PubMed]
  2. Publications office of the European Union website. European Union Emission Inventory Report 1990–2015 under the UNECE Convention on Long-Range Transboundary Air Pollution (LRTAP). Available online: https://publications.europa.eu/s/kInt (accessed on 6 March 2019).
  3. Donald, J.M.; Hooper, K.; Hopenhayn-Rich, C. Reproductive and developmental toxicity of toluene: A review. Environ. Health Perspect. 1991, 94, 237–244. [Google Scholar] [CrossRef] [PubMed]
  4. Hamilton, J.F.; Webb, P.J.; Lewis, A.C.; Reviejo, M.M. Quantifying small molecules in secondary organic aerosol formed during the photo-oxidation of toluene with hydroxyl radicals. Atmos. Environ. 2005, 39, 7263–7275. [Google Scholar] [CrossRef]
  5. Eur-LEX European Union Law website. Official Journal of the European Union, Commission Directive 2006/15/EC. Available online: https://eur-lex.europa.eu/eli/dir/2006/15/oj (accessed on 6 March 2019).
  6. Amann, M.; Lutz, M. The revision of the air quality legislation in the European Union related to ground-level ozone. J. Hazard. Mater. 2000, 78, 41–62. [Google Scholar] [CrossRef]
  7. Liotta, L.F. Catalytic oxidation of volatile organic compounds on supported noble metals. Appl. Catal. B Environ. 2010, 100, 403–412. [Google Scholar] [CrossRef]
  8. Spivey, J.J.; Butt, J.B. Literature review: Deactivation of catalysts in the oxidation of volatile organic compounds. Catal. Today 1992, 11, 465–500. [Google Scholar] [CrossRef]
  9. Ihm, S.-K.; Jun, Y.-D.; Kim, D.-C.; Jeong, K.-E. Low-temperature deactivation and oxidation state of Pd/γ-Al2O3 catalysts for total oxidation of n-hexane. Catal. Today 2004, 93–95, 149–154. [Google Scholar] [CrossRef]
  10. Johnson Matthey website. PGM Market Report. Available online: http://www.platinum.matthey.com/ (accessed on 6 March 2019).
  11. Royer, S.; Duprez, D. Catalytic Oxidation of Carbon Monoxide over Transition Metal Oxides. ChemCatChem 2011, 3, 24–65. [Google Scholar] [CrossRef]
  12. Quiroz Torres, J.; Royer, S.; Bellat, J.-P.; Giraudon, J.-M.; Lamonier, J.-F. Formaldehyde: Catalytic Oxidation as a Promising Soft Way of Elimination. ChemSusChem 2013, 6, 578–592. [Google Scholar] [CrossRef]
  13. Twu, J.; Gallagher, P.K. Chapter 1: Preparation of Bulk and Supported Perovskites. In Properties and Applications of Perovskite-Type Oxides, 1st ed.; Tejuca, L.G., Fierro, J.L.G., Eds.; CRC Press: Boca Raton, FL, USA, 1992; pp. 1–23. [Google Scholar]
  14. Peña, M.A.; Fierro, J.L.G. Chemical Structures and Performance of Perovskite Oxides. Chem. Rev. 2001, 101, 1981–2018. [Google Scholar] [CrossRef]
  15. Royer, S.; Duprez, D.; Can, F.; Courtois, X.; Batiot-Dupeyrat, C.; Laassiri, S.; Alamdari, H. Perovskites as substitutes of noble metals for heterogeneous catalysis: Dream or reality. Chem. Rev. 2014, 114, 10292–10368. [Google Scholar] [CrossRef] [PubMed]
  16. Wachowski, L. Influence of the method of preparation on the porous structure of perovskite oxides. Surf. Coat. Technol. 1986, 29, 303–311. [Google Scholar] [CrossRef]
  17. Royer, S.; Bérubé, F.; Kaliaguine, S. Effect of the synthesis conditions on the redox and catalytic properties in oxidation reactions of LaCo1−xFexO3. Appl. Catal. A Gen. 2005, 282, 273–284. [Google Scholar] [CrossRef]
  18. Zhang, C.; Guo, Y.; Guo, Y.; Lu, G.; Boreave, A.; Retailleau, L.; Baylet, A.; Giroir-Fendler, A. LaMnO3 perovskite oxides prepared by different methods for catalytic oxidation of toluene. Appl. Catal. B Environ. 2014, 148–149, 490–498. [Google Scholar] [CrossRef]
  19. Baláž, P.; Achimovičová, M.; Baláž, M.; Billik, P.; Cherkezova-Zheleva, Z.; Manuel Criado, J.; Delogu, F.; Dutková, E.; Gaffet, E.; José Gotor, F.; et al. Hallmarks of mechanochemistry: From nanoparticles to technology. Chem. Soc. Rev. 2013, 42, 7571–7637. [Google Scholar] [CrossRef] [PubMed]
  20. Alamdari, H.; Royer, S. Chapter 2: Mechanochemistry. In Perovskites and Related Mixed Oxides; Granger, P., Parvulescu, V.I., Prellier, W., Eds.; Wiley-VCH Verlag GmbH & Co. KGaA: Weinheim, Germany, 2015; pp. 25–46. [Google Scholar]
  21. Ciotonea, C.; Averlant, R.; Rochard, G.; Mamede, A.S.; Giraudon, J.M.; Alamdari, H.; Lamonier, J.-F.; Royer, S. A Simple and Green Procedure to Prepare Efficient Manganese Oxide Nanopowder for the Low Temperature Removal of Formaldehyde. ChemCatChem 2017, 9, 2366–2376. [Google Scholar] [CrossRef]
  22. Laassiri, S.; Bion, N.; Duprez, D.; Royer, S.; Alamdari, H. Clear microstructure–performance relationships in Mn-containing perovskite and hexaaluminate compounds prepared by activated reactive synthesis. Phys. Chem. Chem. Phys. 2014, 16, 4050–4060. [Google Scholar] [CrossRef] [PubMed]
  23. Levasseur, B.; Kaliaguine, S. Methanol oxidation on LaBO3 (B = Co, Mn, Fe) perovskite-type catalysts prepared by reactive grinding. Appl. Catal. A Gen. 2008, 343, 29–38. [Google Scholar] [CrossRef]
  24. Kaliaguine, S.; Van Neste, A. Process for Synthesizing Metal Oxides and Metal Oxides Having A Perovskite or Perovskite-Like Crystal Structure. U.S. Patent 6,770,256, 3 August 2004. [Google Scholar]
  25. Ghasdi, M.; Alamdari, H.; Royer, S.; Adnot, A. Electrical and CO gas sensing properties of nanostructured La1−xCexCoO3 perovskite prepared by activated reactive synthesis. Sens. Actuators B Chem. 2011, 156, 147–155. [Google Scholar] [CrossRef]
  26. Thommes, M.; Kaneko, K.; Neimark, A.V.; Olivier, J.P.; Rodriguez-Reinoso, F.; Rouquerol, J.; Sing, K.S. Physisorption of gases, with special reference to the evaluation of surface area and pore size distribution. Pure Appl. Chem. 2015, 87, 1051–1069. [Google Scholar] [CrossRef]
  27. Laassiri, S.; Duprez, D.; Royer, S.; Alamdari, H. Solvent free synthesis of nanocrystalline hexaaluminate-type mixed oxides with high specific surface areas for CO oxidation reaction. Catal. Sci. Technol. 2011, 1, 1124–1127. [Google Scholar] [CrossRef]
  28. Kaliaguine, S.; Van Neste, A.; Szabo, V.; Gallot, J.E.; Bassir, M.; Muzychuk, R. Perovskite-type oxides synthesized by reactive grinding: Part I. Preparation and characterization. Appl. Catal. A. 2001, 209, 345–358. [Google Scholar] [CrossRef]
  29. Vogel, E.M.; Johnson, D.W., Jr.; Gallagher, P.K. Oxygen Stoichiometry in LaMn1-xCuxO3+y by Thermogravimetry. J. Am. Ceram. Soc. 1977, 60, 31–33. [Google Scholar] [CrossRef]
  30. Irusta, S.; Pina, M.P.; Menéndez, M.; Santamaría, J. Catalytic Combustion of Volatile Organic Compounds over La-Based Perovskites. J. Catal. 1998, 179, 400–412. [Google Scholar] [CrossRef]
  31. Faye, J.; Baylet, A.; Trentesaux, M.; Royer, S.; Dumeignil, F.; Duprez, D.; Valange, S.; Tatibouët, J.M. Influence of lanthanum stoichiometry in La1-xFeO3-δ perovskites on their structure and catalytic performance in CH4 total oxidation. Appl. Catal. B Environ. 2012, 126, 134–143. [Google Scholar] [CrossRef]
  32. Zhang, C.; Wang, C.; Zhan, W.; Guo, Y.; Guo, Y.; Lu, G.; Baylet, A.; Giroir-Fendler, A. Catalytic oxidation of vinyl chloride emission over LaMnO3 and LaB0.2Mn0.8O3 (B = Co, Ni, Fe) catalysts. Appl. Catal. B Environ. 2013, 129, 509–516. [Google Scholar] [CrossRef]
  33. Fierro, J.L.G.; Gonzalez Tejuca, L. Non-stoichiometric surface behaviour of LaMO3 oxides as evidenced by XPS. Appl. Surf. Sci. 1987, 27, 453–457. [Google Scholar] [CrossRef]
  34. Deng, J.; Zhang, L.; Dai, H.; He, H.; Au, C.T. Strontium-Doped Lanthanum Cobaltite and Manganite: Highly Active Catalysts for Toluene Complete Oxidation. Ind. Eng. Chem. Res. 2008, 47, 8175–8183. [Google Scholar] [CrossRef]
  35. Fierro, J.L.G. Structure and composition of perovskite surface in relation to adsorption and catalytic properties. Catal. Today 1990, 8, 153–174. [Google Scholar] [CrossRef]
  36. Sunding, M.F.; Hadidi, K.; Diplas, S.; Løvvik, O.M.; Norby, T.E.; Gunnæs, A.E. XPS characterisation of in situ treated lanthanum oxide and hydroxide using tailored charge referencing and peak fitting procedures. J. Electron. Spectros. Relat. Phenom. 2011, 184, 399–409. [Google Scholar] [CrossRef]
  37. Biesinger, M.C.; Payne, B.P.; Grosvenor, A.P.; Lau, L.W.M.; Gerson, A.R.; Smart, R.S.C. Resolving surface chemical states in XPS analysis of first row transition metals, oxides and hydroxides: Cr, Mn, Fe, Co and Ni. Appl. Surf. Sci. 2011, 257, 2717–2730. [Google Scholar] [CrossRef]
  38. Bagus, P.S.; Broer, R.; Ilton, E.S. A new near degeneracy effect for photoemission in transition metals. Chem. Phys. Lett. 2004, 94, 150–154. [Google Scholar] [CrossRef]
  39. Galakhov, V.R.; Demeter, M.; Bartkowski, S.; Neumann, M.; Ovechkina, N.A.; Kurmaev, E.Z.; Lobachevskaya, N.I.; Mukovskii, Y.M.; Mitchell, J.; Ederer, D.L. Mn exchange splitting in mixed-valence manganites. Phys. Rev. B 2002, 65, 113102. [Google Scholar] [CrossRef]
  40. McCarty, J.G.; Wise, H. Perovskite catalysts for methane combustion. Catal. Today 1990, 8, 231–248. [Google Scholar] [CrossRef]
  41. Pecchi, G.; Jiliberto, M.G.; Delgado, E.J.; Cadús, L.E.; Fierro, J.L.G. Effect of B-site cation on the catalytic activity of La1−xCaxBO3 (B = Fe, Ni) perovskite-type oxides for toluene combustion. J. Chem. Technol. Biotechnol. 2011, 86, 1067–1073. [Google Scholar] [CrossRef]
  42. Behar, S.; Gómez-Mendoza, N.A.; Gómez-García, M.Á.; Świerczyński, D.; Quignard, F.; Tanchoux, N. Study and modelling of kinetics of the oxidation of VOC catalyzed by nanosized Cu–Mn spinels prepared via an alginate route. Appl. Catal. A Gen. 2015, 504, 203–210. [Google Scholar] [CrossRef]
Figure 1. Diffractograms obtained for LaMnO3.15 (A) and LaFeO3 (B) after each synthesis step. SSR: solid state reaction, HEBM: high-energy ball milling, LEBM: low-energy ball milling. Bottom of the figure: vertical bars are for cited JCPDS reference. #, La2O3; ‡, Mn3O4; ≠, La(OH)3; ◊, Fe2O3.
Catalysts 09 00633 g001
Figure 2. N2-Physisorption isotherms recorded for LaFeO3 samples after each step of synthesis.
Catalysts 09 00633 g002
Figure 3. Scanning electron microscope (SEM) images obtained for LaMnO3.15 (left) and transmission electron microscope (TEM) images obtained for LaFeO3 (right), after each synthesis steps. (a,d) SSR: solid state reaction, (b,e) HEBM: high-energy ball milling, (c,f) LEBM: low-energy ball milling.
Catalysts 09 00633 g003
Scheme 1. Simplified view of the material evolution with the synthesis steps of the reactive grinding process. SSR: solid state reaction; HEBM: high energy ball milling; LEBM: low energy ball milling.
Catalysts 09 00633 sch001
Figure 4. Temperature-programmed reduction (H2-TPR) profiles of LaMnO3.15 (A) and LaFeO3 (B) samples after the (a) SSR, solid state reaction; (b) HEBM, high-energy ball milling; (c) LEBM, low-energy ball milling, steps.
Catalysts 09 00633 g004
Figure 5. High-resolution spectra of O 1s and Mn 3s core level spectra for LaMnO3.15 samples: (a) SSR, solid state reaction; (b) HEBM, high-energy ball milling; (c) LEBM, low-energy ball milling.
Catalysts 09 00633 g005
Figure 6. High-resolution spectra of O 1s and Fe 2p core level spectra for LaFeO3 samples: (a) SSR, solid state reaction; (b) HEBM, high energy ball milling; (c) LEBM, low energy ball milling.
Catalysts 09 00633 g006
Figure 7. Toluene conversion curves obtained for LaMnO3.15 (A) and LaFeO3 (B) samples: (a) SSR, solid state reaction; (b) HEBM, high-energy ball milling; (c) LEBM, low-energy ball milling. Conditions: 200 mg of catalyst, 100 mL·min−1 of 1000 ppmv C7H8 in synthetic air (20% O2 in N2).
Catalysts 09 00633 g007
Figure 8. Arrhenius plots obtained at X < 20% for the toluene oxidation reaction over LaMnO3.15 (A) and LaFeO3 (B) samples: (a) SSR, solid state reaction; (b) HEBM, high-energy ball milling; (c) LEBM, low-energy ball milling.
Catalysts 09 00633 g008
Figure 9. Evolution of corrected pre-exponential factors with catalyst surface areas. Open symbols: LaMn-compositions; Full symbols: LaFe-compositions.
Catalysts 09 00633 g009
Figure 10. Stability experiments of LaMnO3.15 (A) and LaFeO3 (B) samples. Conditions are: 200 mg of catalyst exposed to 1000 ppmv C7H8 in 100 mL·min−1 of synthetic air (20% O2 in N2) for 70 h at a constant temperature of 285 °C. HEBM, high-energy ball milling; LEBM, low-energy ball milling.
Catalysts 09 00633 g010
Figure 11. Comparison of (A) H2-TPR profiles and (B) XPS high resolution spectra of Mn3s obtained for the fresh and used LaMn_LEBM catalysts.
Catalysts 09 00633 g011
Table 1. Structural, textural properties and elemental composition obtained for LaMnO3.15 and LaFeO3 after each synthesis step.
SampleXRD PhaseDcryst (nm)SSA 2 (m2·g−1)Fe cont. 3 (at.%)
LaMn_SSRP, La2O3, La(OH)3, Mn3O4>500 11.00.0
LaMn_HEBMP, La2O3143.50.7
LaMn_LEBMP169.92.9
LaFe_SSRP, La(OH)3, Fe2O3>500 11.6-
LaFe_HEBMP, Fe2O3173.4-
LaFe_LEBMP, Fe2O32218.8-
P: perovskite, TM: transition metal; 1 estimated by SEM; 2 SSA: specific surface area; 3 measured by X-ray fluorescence spectroscopy.
Table 2. H2-TPR results for LaMnO3.15 and LaFeO3 samples.
SampleT1,max (°C)T2,max (°C)H2 Uptake 1 (mmol(H2)·g−1)TM AOS 2
LaMn_SSR5128821.04 (2.63)3.3
LaMn_HEBM3908061.54 (3.02)3.4
LaMn_LEBM4048452.09 (3.14)3.4
LaFe_SSR523-0.892.4
LaFe_HEBM490-0.922.5
LaFe_LEBM489-1.182.6
TM: transition metal; 1 H2 uptake from the low temperature (LT) consumption peak domain, total uptake being into brackets; 2, calculated for LaMnO3.15 from the total H2 uptake assuming a complete reduction up to Mn(+II), and calculated for LaFeO3 from the LT H2 uptake and assuming a reduction to Fe(+II) during this LT process, assuming bulk La/MT ratio of 1.
Table 3. Quantification from X-ray photoelectron spectroscopy (XPS) analysis for LaMnO3.15 and LaFeO3 samples.
SampleLa (at.%)Mn (at.%)Fe (at.%)La/(Fe+Mn) (-)Ototal (at.%)OI (at.%)OII (at.%)OIII (at.%)AOS 1
LaMn_SSR19.29.9-2.0170.920.944.95.23.2
LaMn_HEBM16.411.3n.q.1.4572.329.432.310.63.8
LaMn_LEBM16.311.51.41.2670.733.032.84.93.7
LaFe_SSR14.4-9.11.5876.530.733.212.7-
LaFe_HEBM19.9-10.01.9970.132.031.76.4-
LaFe_LEBM19.0-11.11.7169.933.229.57.2-
1 issued from ΔE(Mn 3s) values.
Table 4. T50 values and kinetics data obtain from light-off curves of LaMn and LaFe samples.
SampleT10 (°C)T50 (°C)T90 (°C)Activity 1 (mmol·s−1·m−2)Ea 2 (kJ·mol−1)A0 3 (s−1)
LaMn_SSR290///1263.2 × 1012
LaMn_HEBM2512833178.68 × 10−61462.6 × 1013
LaMn_LEBM2422712956.41 × 10−61405.0 × 1013
LaFe_SSR325///1643.6 × 1011
LaFe_HEBM2733013232.44 × 10−61556.5 × 1012
LaFe_LEBM2342612835.39 × 10−61378.7 × 1013
1 determined at T = 250 °C; 2 determined in the range X(%) < 20%; 3 extrapolated using the Ea average value.

