1. Introduction
Two main drivers for lowering the cost of the hydrogen-powered automotive proton exchange membrane fuel cell (PEMFC) system have been recognized: PEMFC stack platinum group metal (PGM) loading and its power density, both of which are connected with oxygen reduction reaction (ORR) catalysis. Thus, the R&D is focused on synthesis and production of durable Pt-containing electrocatalysts for ORR with a mass activity higher than 1 A mg
−1Pt, which would enable a PGM loading of 0.065 gPGM kW
−1gross [
1]. The most promising strategy towards enabling such high mass activities for ORR seems to be alloying of Pt-containing electrocatalysts with less expensive and less noble 3d transition metals (Cu, Co, and Ni, etc.) [
2,
3,
4,
5,
6,
7,
8]. When doing so, the mass activity for ORR is enhanced due to better utilization of Pt atoms [
4,
9,
10,
11] as well as due to higher intrinsic activity for ORR from a combination of the well-known ligand and strain effects [
2,
5,
12,
13,
14]. On the other hand, the materials science community developing PEMFC electrocatalysts regularly faces serious issues when trying to transfer the high activities measured in
ex situ tests, usually via the thin film rotating disc electrode (TF-RDE) method, to
in situ membrane electrode assembly (MEA) PEMFC single cell tests [
15,
16,
17], in which high current densities at relatively low overpotentials are expected. The main issues related to this transfer are (i) the inability to scale-up the catalyst synthesis, (ii) the insufficient catalyst activation (leaching), (iii) the mass transport issues in the catalyst layer, (iv) the inability to prepare MEAs with optimized three-phase boundary, and (v) the presence of inhomogeneities in the catalyst layer [
15,
16]. Hence due to these reasons, promising MEA performances are momentarily scarce [
18,
19]. Furthermore, it must be noted that for different electrocatalysts, the bottlenecks towards optimal MEA performance differ as well. For instance, non-noble electrocatalysts suffer from reactants mass transport issues as the catalyst layer is inevitably too thick due to the low active site density [
20,
21,
22]. On the other hand, some catalysts with excellent RDE performance, for example, the 3M’s nanostructured thin films (NSTF), suffer from flooding [
17], i.e., the inability to remove products (water) from the catalyst layer. Additionally, it was shown that some non-intrinsic parameters such as improved Nafion coverage and thinning of the membrane via a direct membrane deposition printing technique has an enormous effect on MEA performance at high current densities [
23,
24].
In this study, we present an evaluation of our proprietary PtCu
3 catalyst [
25] characteristics obtained with TF-RDE and MEA tests. We show that the high ORR activity of the PtCu
3 electrocatalyst could potentially be transferred from an RDE to an MEA single cell test. The measurements reveal one of the highest Pt-alloy electrocatalysts activities for ORR at 0.9 V. However, in spite of this excellent performance, it is demonstrated that at lower potentials, the electrochemical performance is still insufficient. Guidelines for improvement are given.
2. Results
The as-prepared PtCu
3/C was subjected either to an (i) acid washing in 1 M acetic acid (HAc, PtCu
3/CA) or, (ii) alternatively, to both acid washing and milling (PtCu
3/CAM). In previous work, Strasser et al. [
26] demonstrated the possibility of in-situ voltammetric dealloying of the Pt-Cu-Co/C electrocatalyst in MEA. However, in another study by Yu et al. [
27], dealloyed Cu was shown to negatively affect both electrodes as well as the Nafion membrane. In a more recent study, Ahluwalia et al. [
28] and Mauger et al. [
17] additionally highlighted the benefits of removal of unstable Ni prior to the implementation in MEA on the beginning of the life, as well as the long-term performance. Thus, in this work, acid washing was used prior to the implementation of the PtCu
3/C electrocatalyst in MEA in order remove the unstable Cu leftovers from the synthesis and achieve ex situ partial activation. Milling, on the other hand, was used in order to break down the larger carbon agglomerates (micrometer range) into smaller agglomerates (see
Figure S3). As shown in continuation, the milling affected the mass transport properties in the MEA. The chemical compositions, including the Pt:Cu ratio of the present samples, can be found in
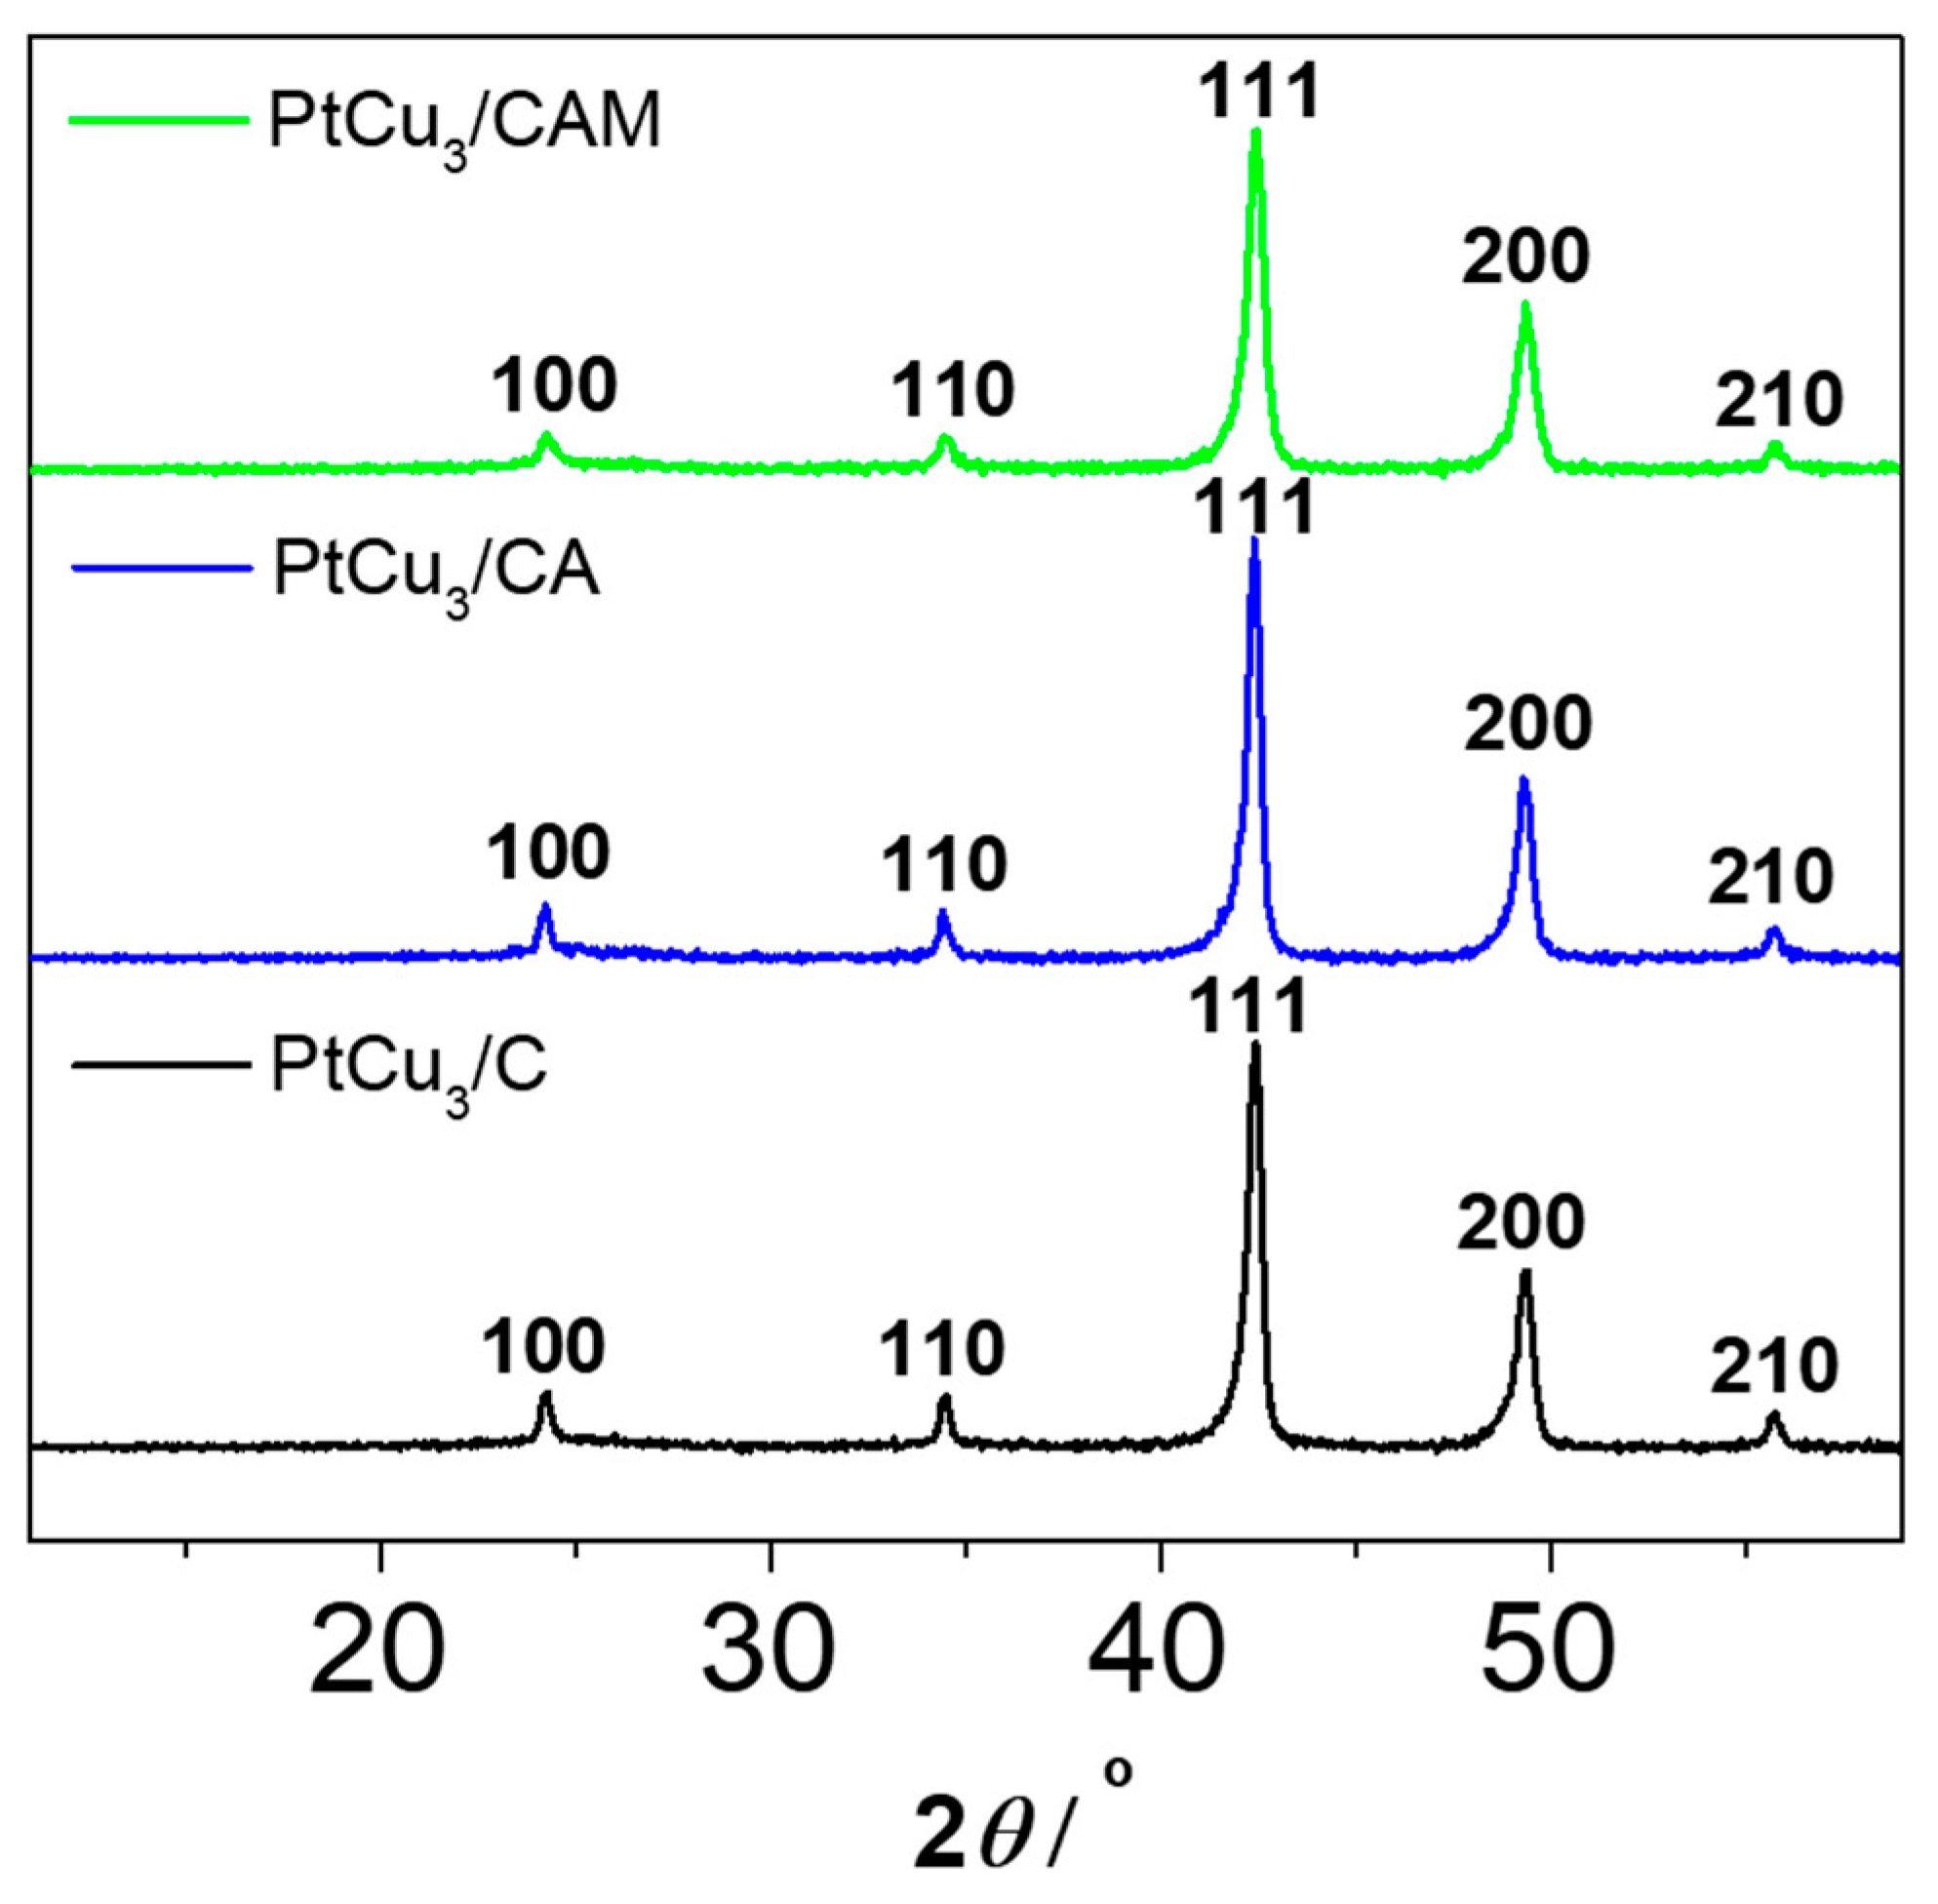
Table S1. The XRD analysis (
Figure 1) reveals no substantial changes in the bulk structure of the catalyst neither after acid washing or milling. This strongly indicates that any effects of the ex situ acid washing should be attributed to local changes, most likely on the catalyst surface.
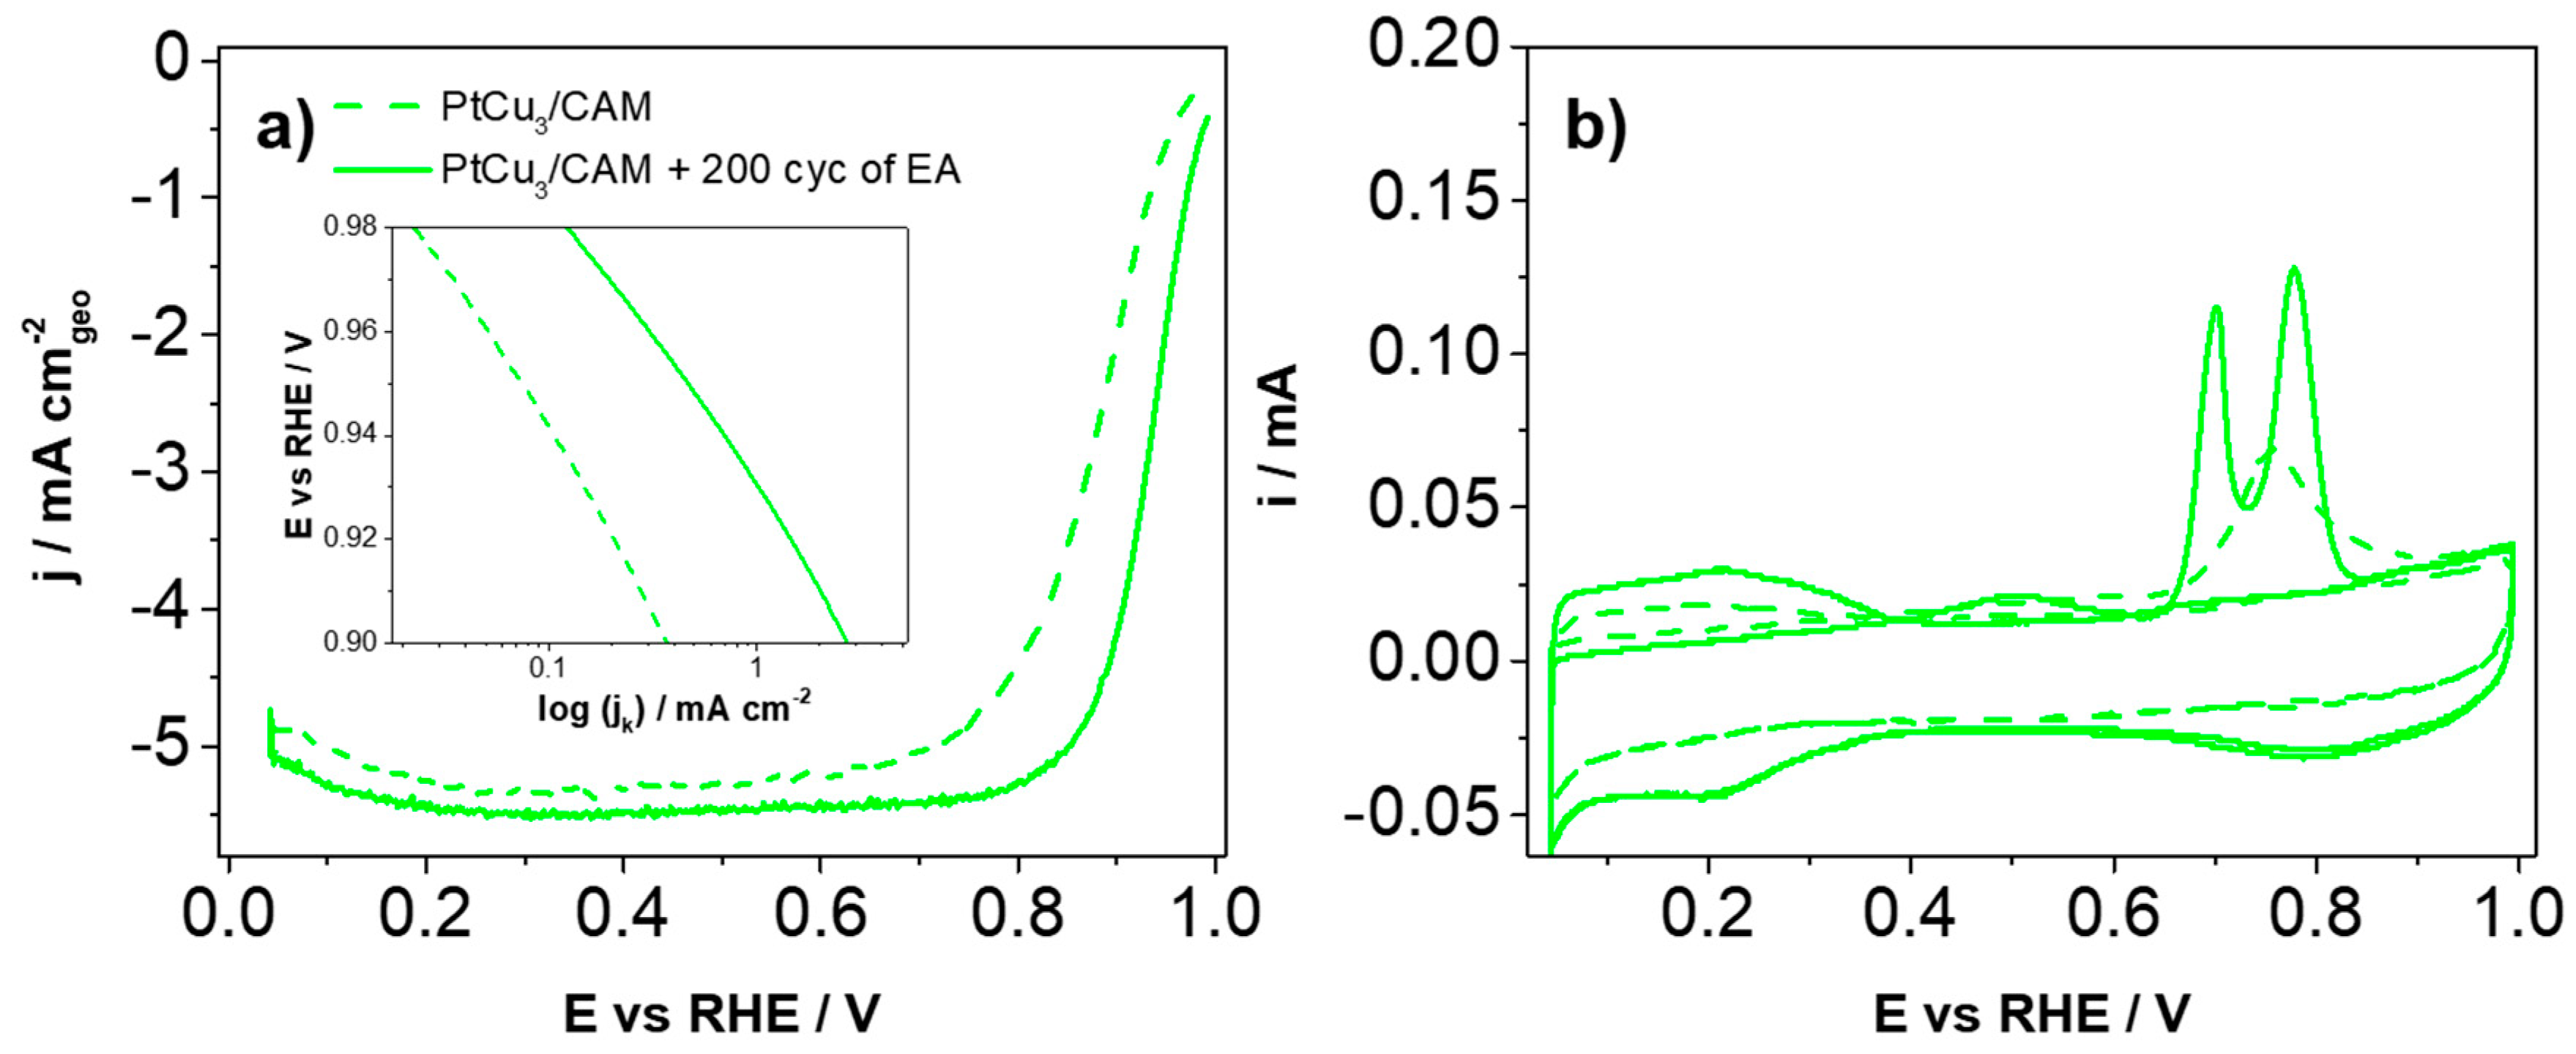
Despite acid washing, the initial TF-RDE activity of the catalyst is in the range of the Pt/C composites (
Figure 2a), while an additional electrochemical activation (EA, 0.1 M HClO
4, 200 cycles between 0.05–1.2 V
RHE, 300 mV s
−1) results in a significant improvement. One reason might be due to the absence of porous structure formation upon acid washing (
Figure S2c,d). In any case, one can notice that initially, the catalyst exhibits only a single CO electrooxidation peak (
Figure 2b) as well as a lower ECSA
CO (
Table S2). Upon EA, however, the porous structure develops which is indicated both by the appearance of an additional CO electrooxidation peak (
Figure 2b) [
28] as well as by an increase in ECSA
CO (
Table S2) from 22.8 to 31.5 m
2 g
−1Pt. This is in line with the observed phenomena from the IL-TEM images obtained before and after EA (see
Supplementary Materials, Figure S1e–f,g–h). These images clearly reveal the formation of pores after EA treatment. Interestingly, the limiting current densities for the two analogues in
Figure 2a differ. This is rather surprising considering that geometric areas of the two electrodes are the same for both analogues. The lower limiting current density in the case of the EA analogue should; therefore, be ascribed to higher Cu coverage of Pt surface in comparison to non-EA analogue. This influences the ORR reaction pathway, where a two-electron mechanism can proceed along with the four-electron path. This lowers the overall limiting current density [
29]. Overall, the dramatic difference in characteristic ORR parameters directly highlights the importance of further investigation on catalyst pre-treatment.
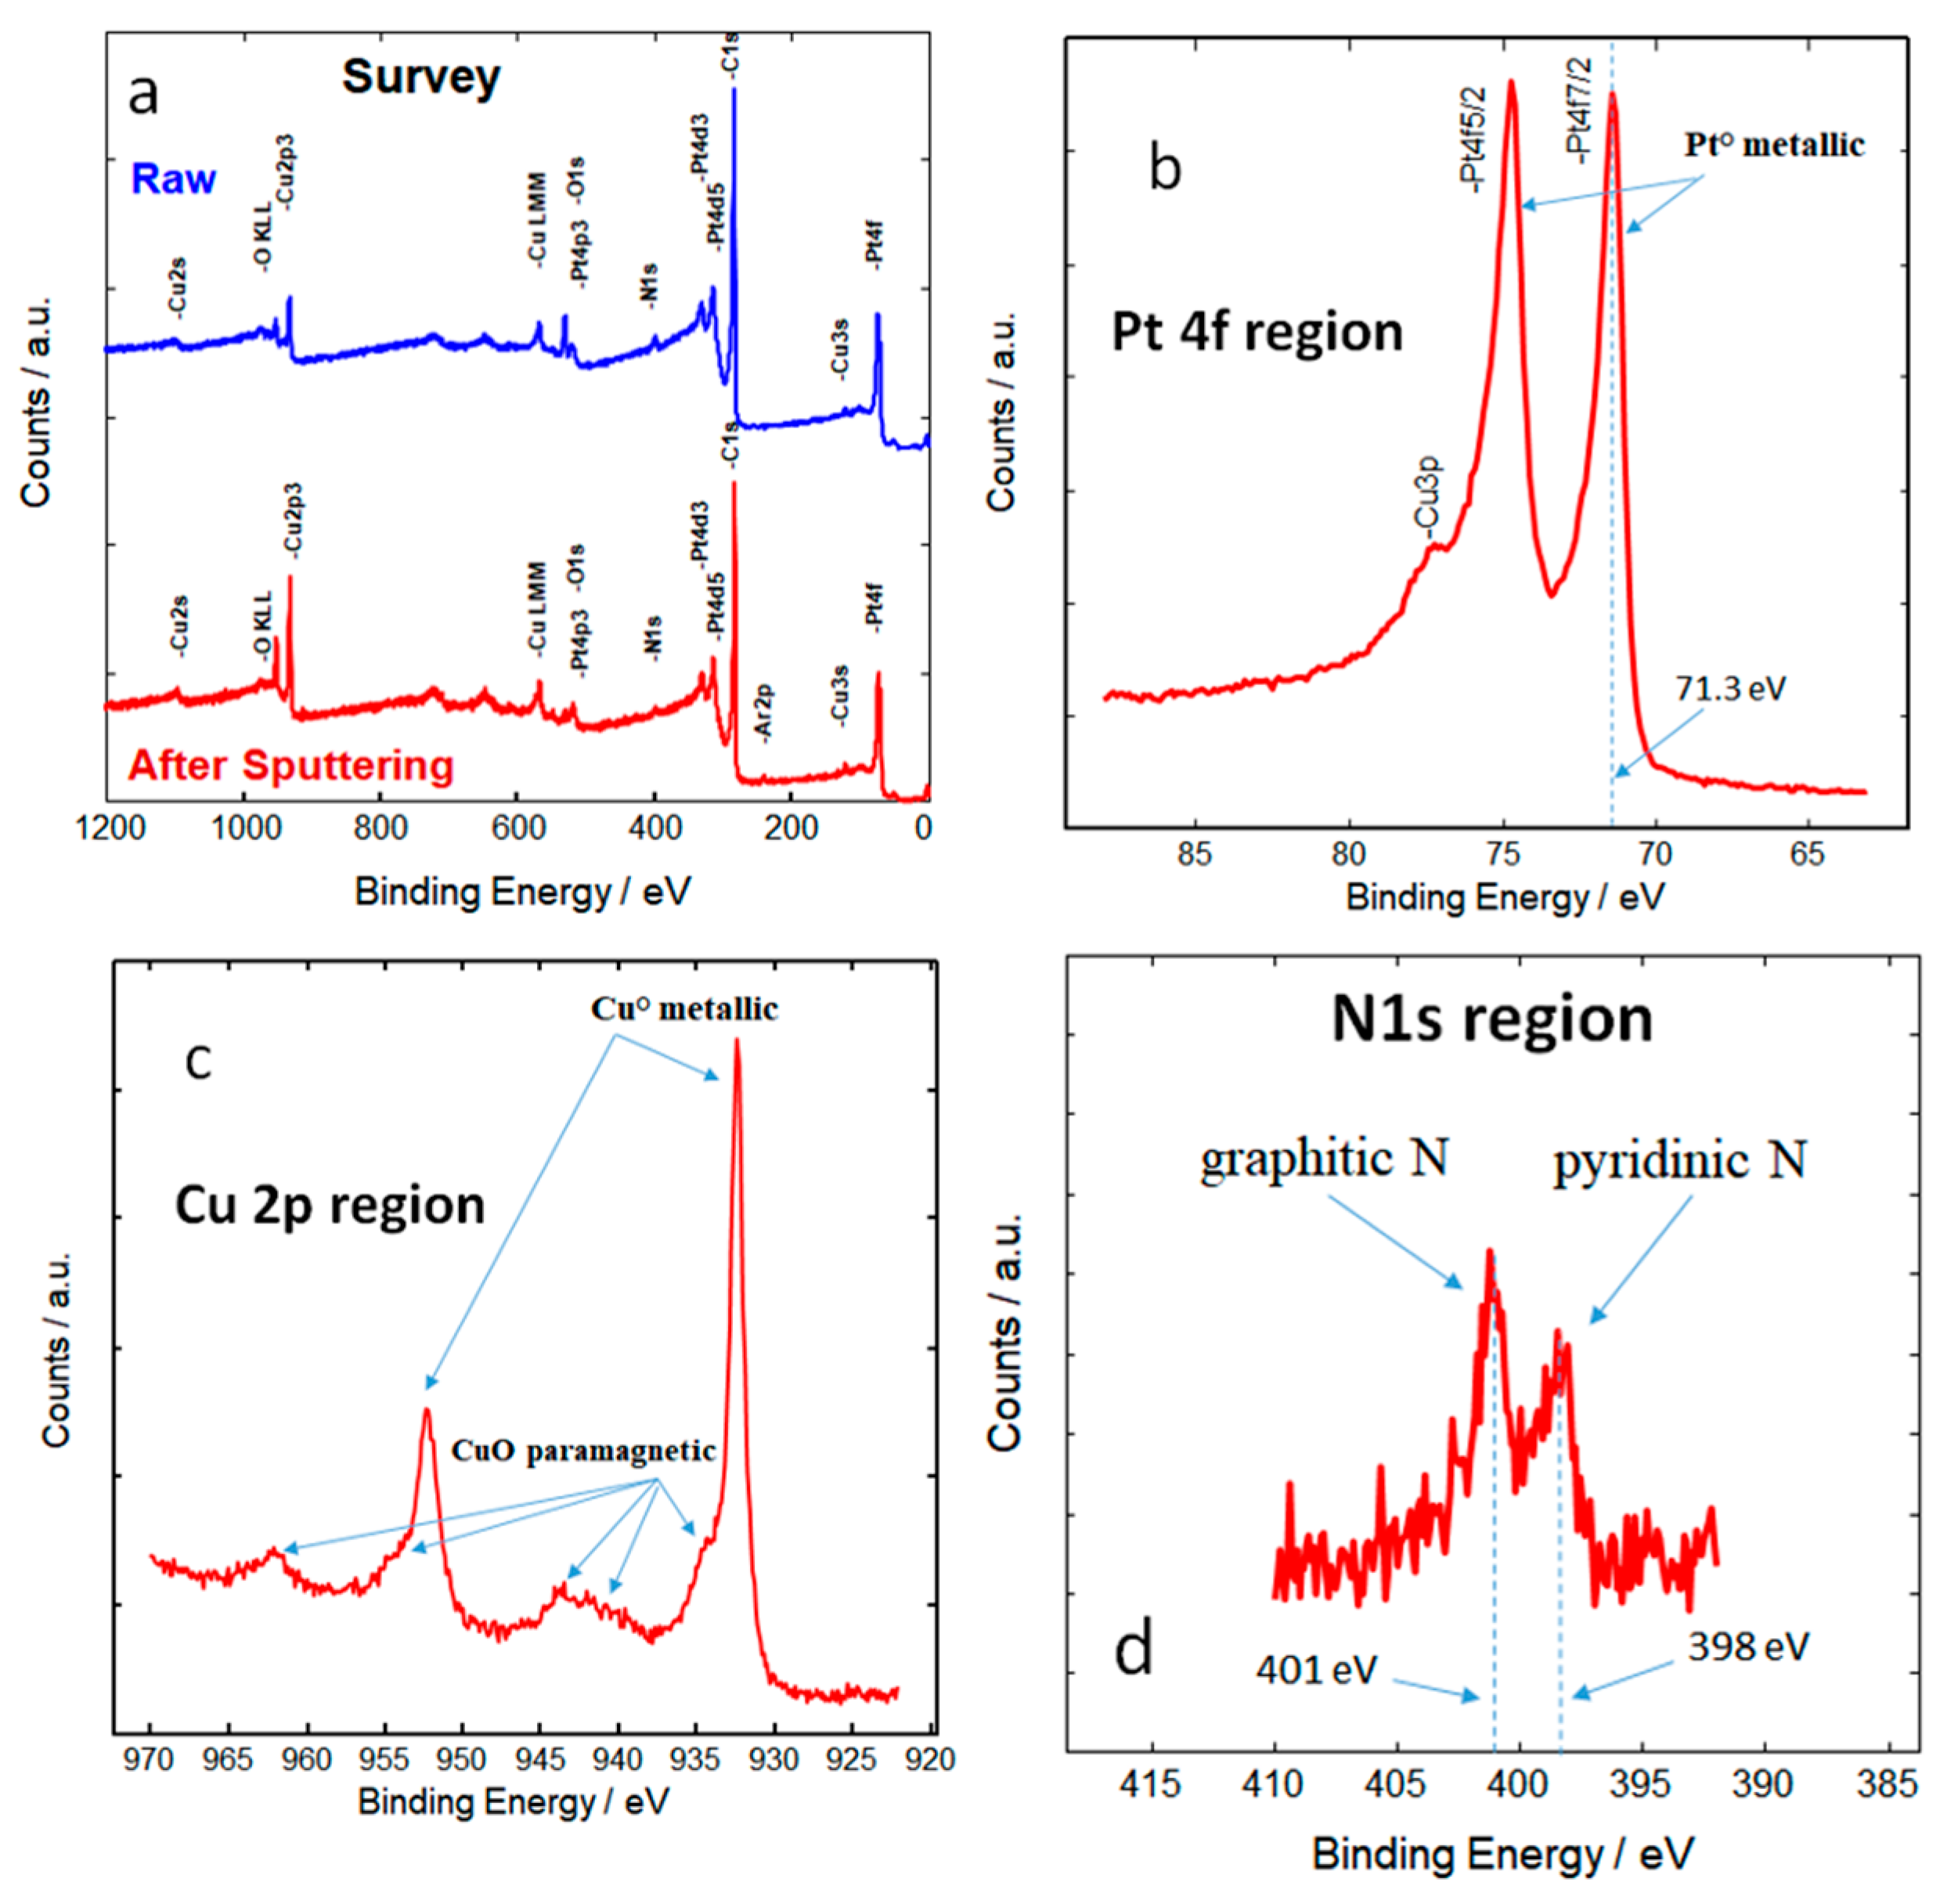
X-ray photoelectron spectroscopy (XPS) analysis reveals the nature, oxidation state, and composition of surface elements in the catalyst (
Figure 3a). In particular, the present results reveal enrichment of the surface with Pt atoms (
Figure 3b). This is in accordance with the fact that acid leaching selectively removes copper from the surface and near-surface regions, which is also confirmed by high-resolution transmission electron microscopy and energy-dispersive X-ray analysis (
Supplementary Materials in Figures S1 and S2). We note that in the near-surface region, Pt largely predominates and some remaining copper is mostly due to the relatively mild ex-situ acid washing. Both PtCu
3/CA and PtCu
3/CAM exhibit the same surface chemical composition: Pt:Cu 1:1, Pt:N 1:1, and Pt:O 1:2. The superficial Pt is essentially in the zero-valent state (
Figure 3b). Metallic copper is prevailing with a small amount of paramagnetic CuO (
Figure 3c). Interestingly, the analysis of XPS spectra also revealed the presence of nitrogen in two types of carbon functionalities (graphitic and pyridinic nitrogen) through s-p hybridization (
Figure 3d). According to extensive research, Pt enrichment on the surface is one of the decisive parameters in enhancing ORR activity [
4,
30,
31,
32]. Furthermore, the modified carbon support may play a role as well in enhancing ORR kinetics.
The two analogues (PtCu
3/CA and PtCu
3/CAM) were tested in an MEA configuration. Polarization curves for both analogues are shown in
Figure 4a. The results obtained with a commercial 40 wt% Pt/C Hi-Spec 4000 catalyst (Johnson Matthey) are included for reference. It can be seen that both Pt-Cu analogues are superior to the commercial Pt/C at low overpotentials (
Figure 4b; up to ca. 0.1 A cm
−2 which corresponds to ca. 0.86 V). At higher current densities (lower potentials), mass transport issues can be detected, especially in the case of the PtCu
3/CA analogue (see
Figure 4a). Based on the visible performance improvement after milling one may reasonably assume that in the PtCu
3/CA analogue more carbon aggregates are present which are probably surrounded with the PFSA ionomer which in turn eventually causes the observed mass transport issues.
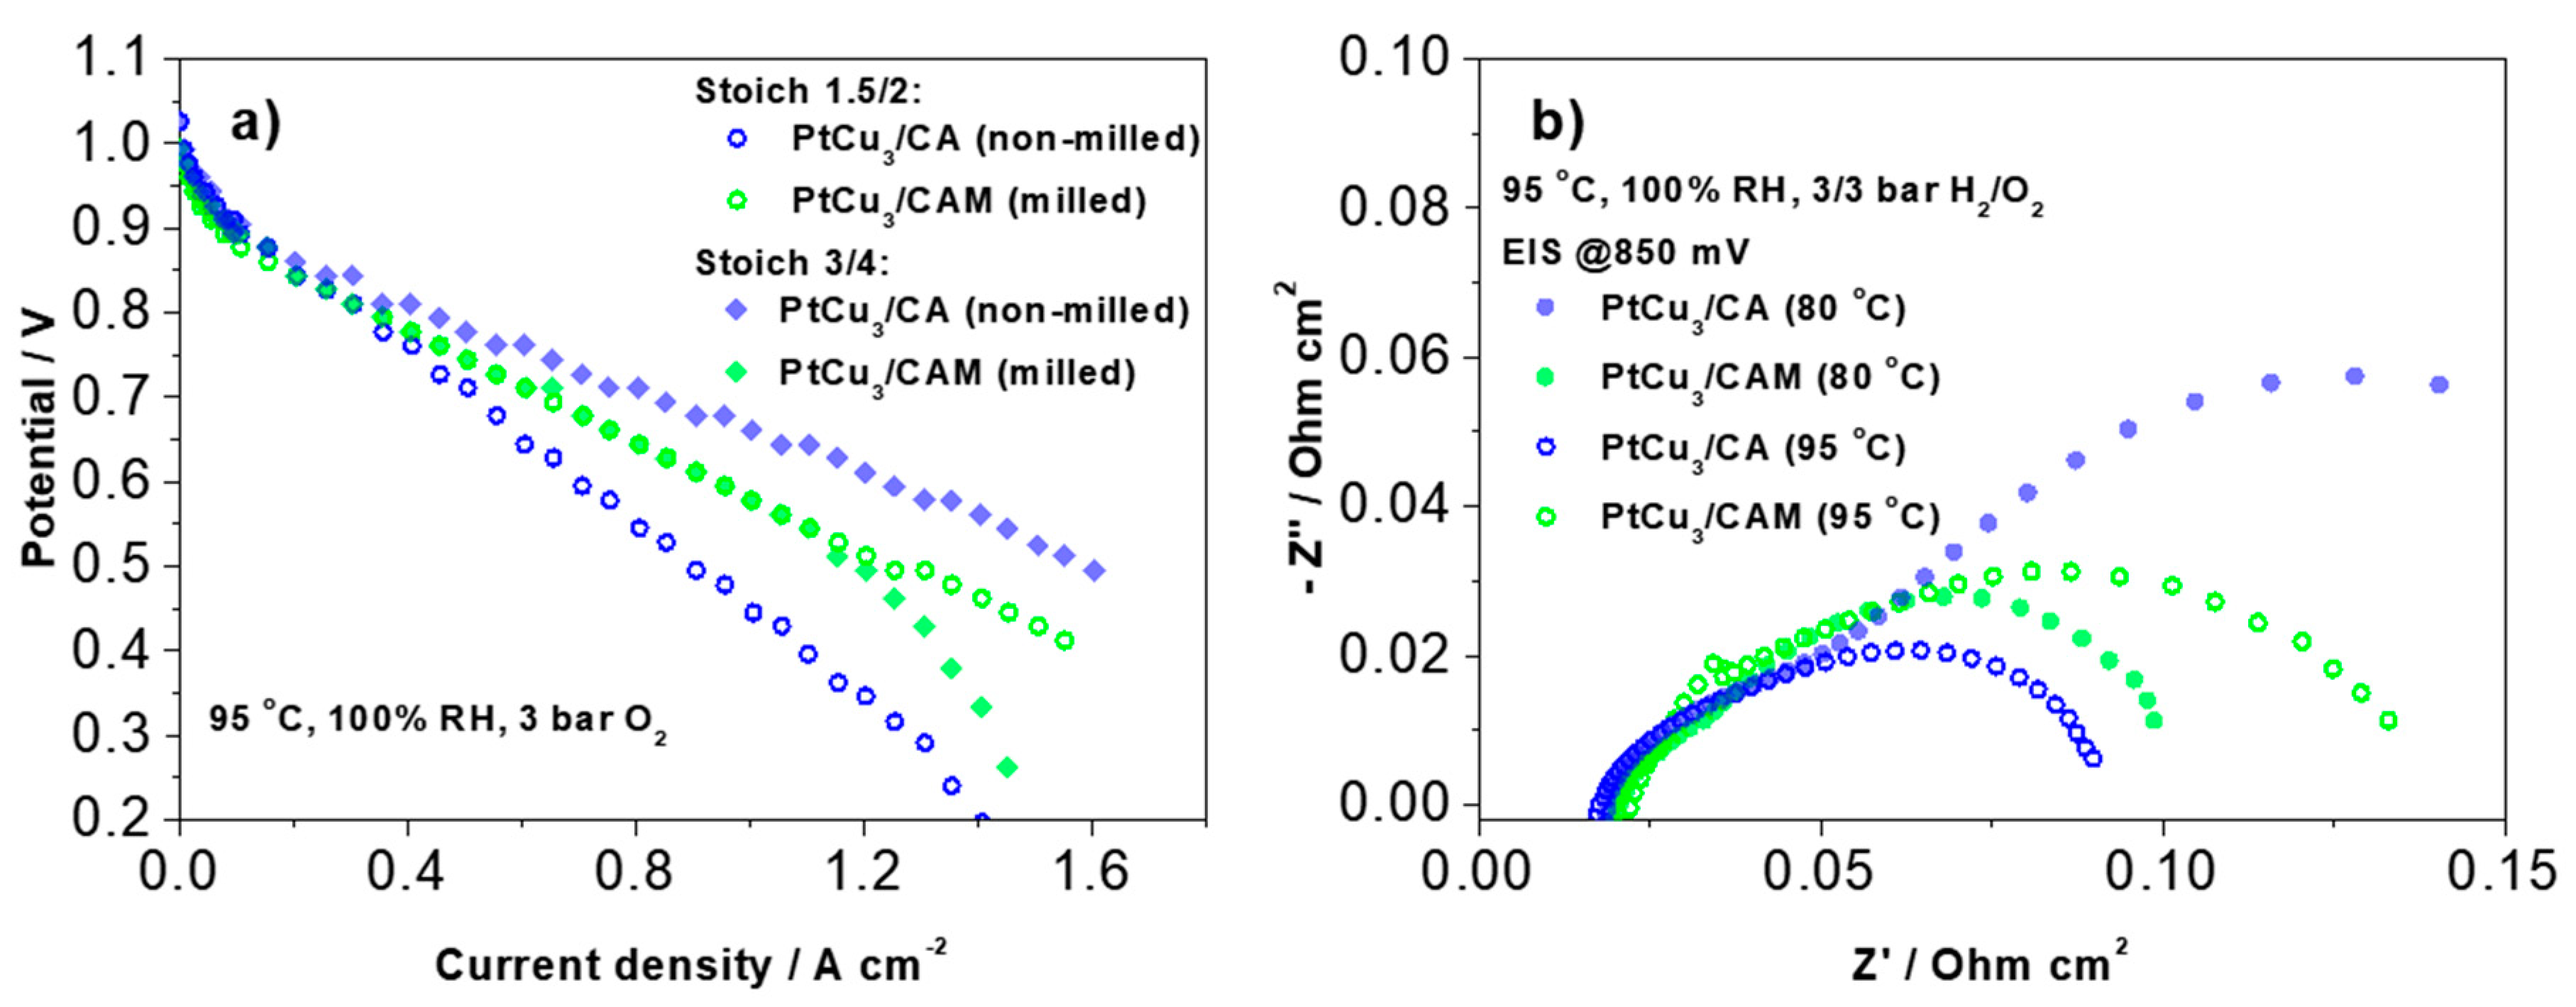
However, when increasing the temperature to 95 °C (the regime of practical MEA operation) and also increasing the gas stoichiometry ratio, one may observe a clear inversion of the trend in polarization behavior (
Figure 5a). In this case, the PtCu
3/CA analogue shows significantly better performance than the PtCu
3/CAM analogue. Such an inversion indicates that under these conditions, mass transport is sufficiently increased, hence intrinsic (kinetic) properties of the two analogues predominantly govern the MEA performance. This is in line with RDE kinetic data where PtCu
3/CA (EA) analogues show higher specific activity in comparison to PtCu
3/CAM (EA). Additional answers to this important question were sought in the next practical and modeling experiments.
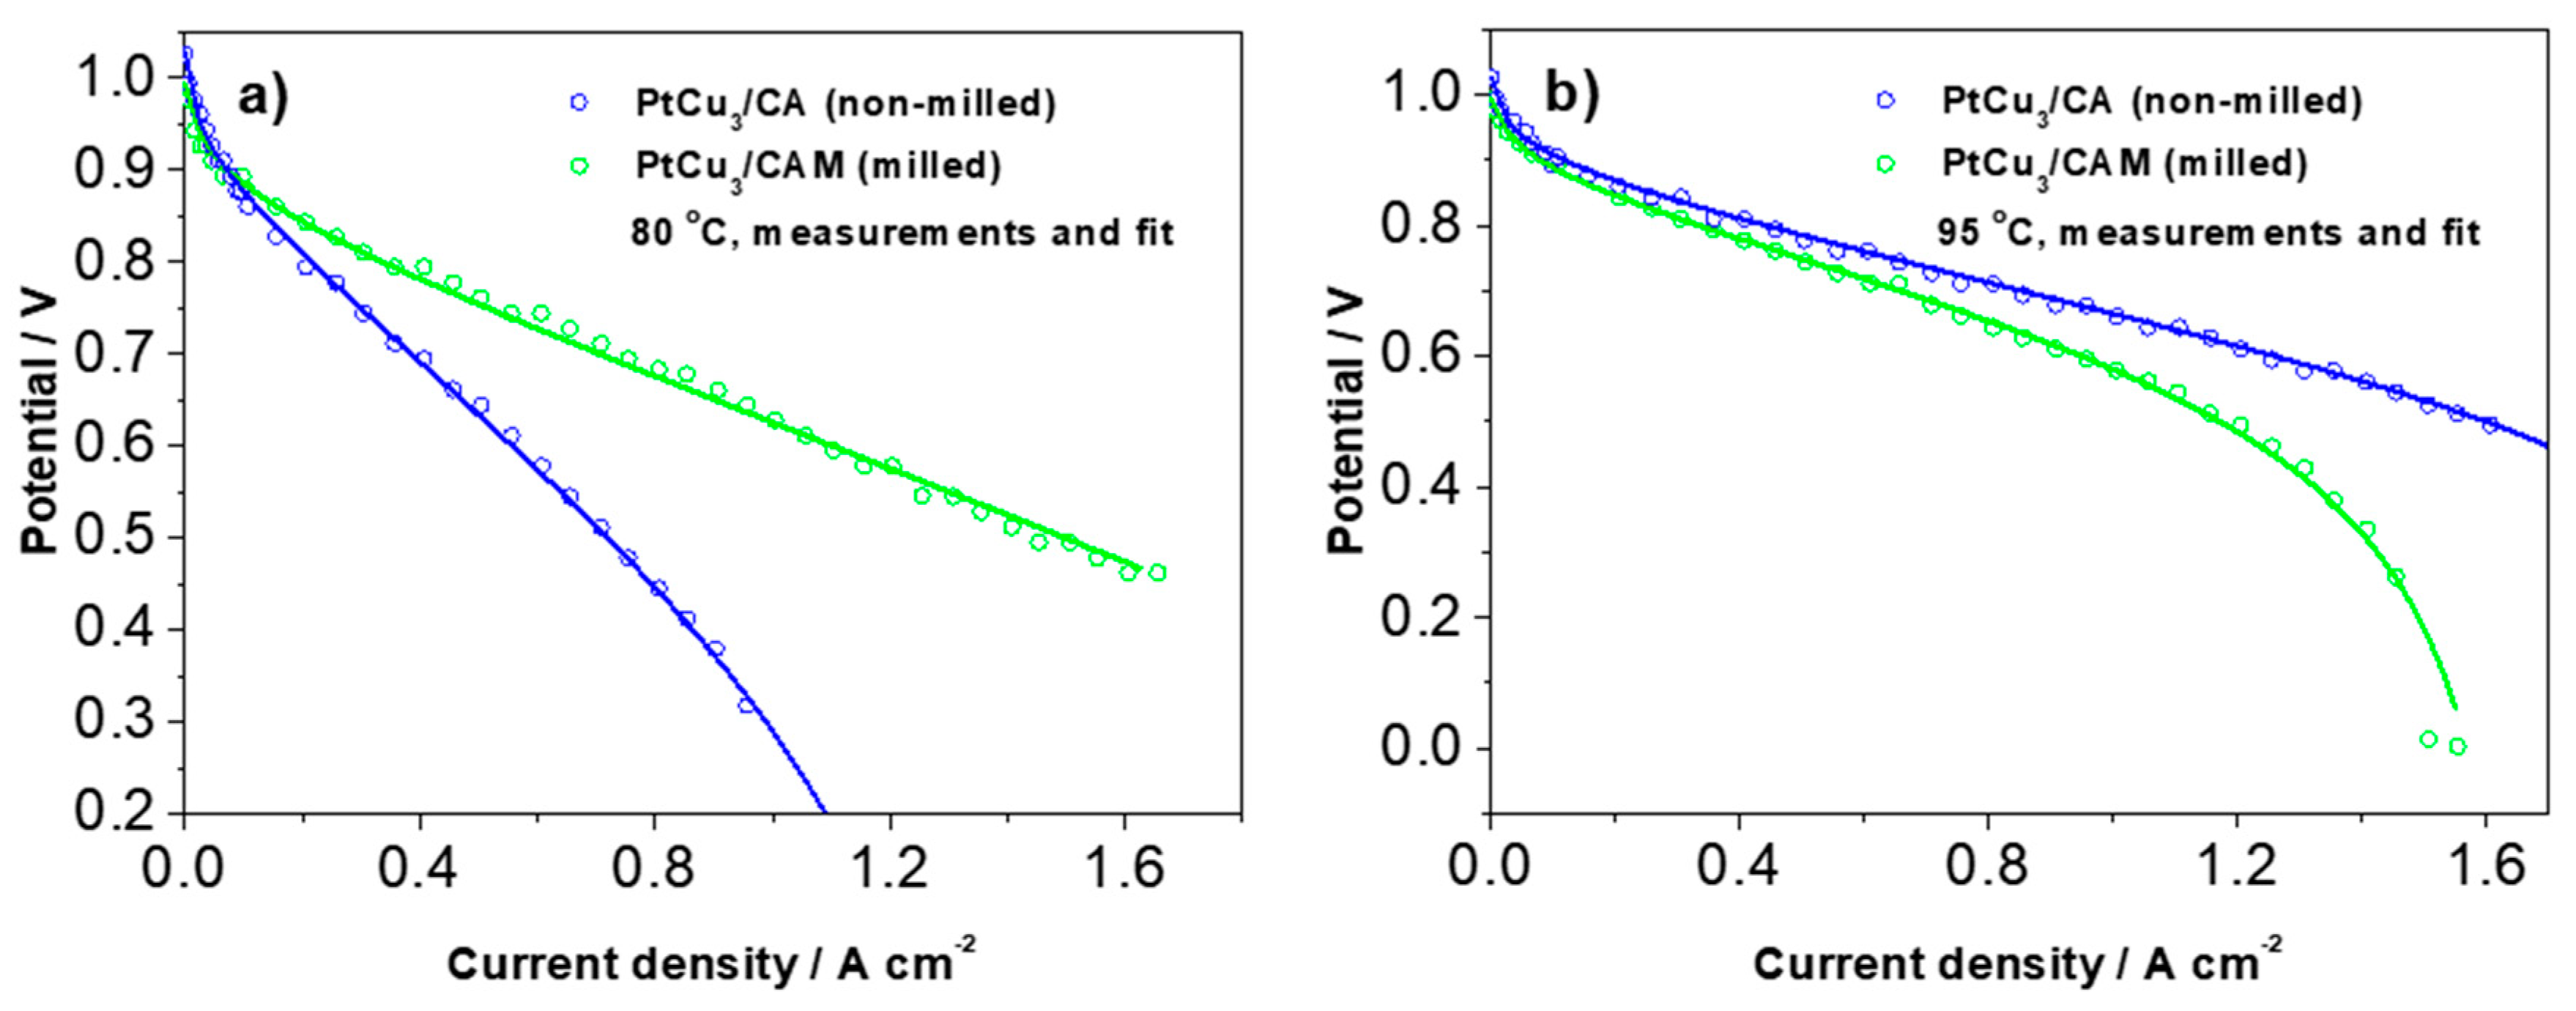
In order to get more specific and quantitative insight into the experimental trends shown in
Figure 4 and
Figure 5, we analyzed the typical polarization curves with the analytical model for cathode polarization curve proposed by Kulikovsky, neglecting the contribution of the anode side [
33]. The model contains all of the most important contributions to polarization curves such as activation polarization (in terms of exchange current density and Tafel slope), ohmic polarization, and polarization due to mass transport (in terms of the oxygen concentration in the different components and the respective oxygen diffusion coefficients). Examples of fitted polarization curves measured at 80 °C and 95 °C are shown in
Figure 6. The corresponding values of the parameters are displayed in
Table S3. Only four parameters were relaxed (not fixed) because this was found sufficient for a full description of the measured curves. In
Table S3, the relaxed parameters are denoted in bold. The most critical parameter that determines the final slope at the highest current densities before the cell stops working is
ch (oxygen molar concentration in the channel (mol cm
−3)). It can be seen that at a lower temperature (80 °C), this concentration is much lower in PtCu
3/CA (non-milled) analogue, whereas at 95 °C the situation is reversed. There is also some variation in the other three relaxed parameters; however, they mainly determine the curves at lower or intermediate current densities.
3. Discussion
These results thus indicate oxygen mass transport limitations by microporosity of catalyst carbon support at high current density. Besides polarization measurements, impedance spectra at various conditions were also measured for both samples (
Figure 5b). The impedance spectra were measured under polarization conditions (not at OCV), as indicated in the graph. Regardless of the polarization, the low-frequency impedance prevails in the non-milled sample at 80 °C. This is consistent with a larger polarization of this sample at this temperature. However, upon increasing the temperature to 95 °C a similar inversion is obtained in the low-frequency impedance as previously observed in the polarization behavior—at higher temperature, the non-milled sample exhibits much lower impedance values. Similarly, as the polarization curves, the impedance spectra were also analyzed using a quantitative model proposed by Kulikovsky [
34] (
Figure S4-see discussion in Supplementary Materials).
At 95 °C, a targeted operating temperature for automotive applications, the polarization curve in
Figure 6 has an OCV of 1.026 V, a current density of 0.442 A cm
−2 at 0.8 V, and a peak power density of 791 mW cm
−2 at 1.5 A cm
−2 and 0.532 V. The ORR catalyst mass activity derived from the IR-free polarization curve is 0.533 A mg
−1Pt at 0.9 V vs. RHE and 95 °C. These single cell data show promising prospect for reaching US DOE targets for 2020 (0.44 A mg
−1Pt) at a low current density (0.9 V vs. RHE; IR-free). The drawback and the future challenge is high cell resistance at a high current density, which in addition to the catalyst layer fabrication, optimization requires additional improvements on the catalyst design. We speculate that despite porosity formation, the obtained ECSA
CO after EA (
Table S2) is too low to further sustain the reaction. An ECSA of a minimum of 40 m
2 g
−1Pt was proposed by Kongkanand et al. [
16] as a benchmark for achieving high current densities. Thus, the main strategy for the improvement of the catalyst design in the future seems to be obtaining higher ECSA without lowering the loading of the metal on the carbon support.
4. Materials and Methods
4.1. Synthesis
4.1.1. PtCu3/C Electrocatalyst Preparation
Intermetallic ordered PtCu
3 nanoparticles that are tightly embedded (anchored) into modified carbon support were prepared via the patented modified sol-gel synthesis using a gelatin precursor [
25,
35,
36,
37]. Briefly, the synthesis consists of two vital steps, the first being the annealing of a Cu salt precursor together with gelatine and carbon black to obtain Cu particles in a porous carbon matrix. In the second part, the Cu from the composite is partly galvanically displaced by a Pt precursor (K
2PtCl
4) and annealed for the second time. The “as-prepared” PtCu
3/C electrocatalyst was prepared according to a batch procedure that produced 20 g of catalyst.
4.1.2. Xero-Gel Preparation
To mix the reactant at the molecular level, first the 10 g of gelatine (GELATIN-B; Fluka, cat. No. 48722) and 0.9 g of cetyl-trimethyl-ammonium bromide (CTAB; Fluka, cat. No.52365) were dissolved in 250 mL of water at 60 °C while stirring, adding 12 g of copper acetate (Sigma-Aldrich, St. Louis, MI, USA; cat. No.25038) and 5 g of carbon black (VULCAN XC72R, CABOT, Italy,). A mixture was obtained, which was homogenized while stirring for 20 min, followed by an additional 10 min of stirring with a turbo-stirrer Ultra Turax (15,000 rpm). Afterwards, the mixture was cooled to room temperature and left for 12 h. The obtained gel was freeze-dried with the use of liquid nitrogen and dried in vacuum. As seen from the SEM images, thermal annealing of the gel precursor resulted in polydisperse Cu particle sizes ranging from a few hundred nm and all the way up to tens of microns. Even though this seemed a very inconvenient way to prepare a precursor for the nanoparticle synthesis, the idea behind the preparation was to modify and stabilize commercial Vulcan carbon support, while also provide enough copper for the next step of the synthesis—galvanic displacement reaction of the platinum precursor salt.
4.1.3. Pyrolysis
In the second step, dried xerogel was heated in a reduced atmosphere of H2 (5%)/Ar (gas flow rate 50 mL/min) at a rate 10 °C/min to 800 °C for 1 h and cooled to room temperature. After having been heat-treated, the composite of copper nanoparticles embedded in the porous matrix was grounded.
4.1.4. Platination
Then followed platination of the composite using potassium tetrachloroplatinate (Sigma-Aldrich; St. Louis, MI, USA, cat. No. 323411), which had been dissolved in water solution while stirring. The addition of platinum precursor was performed in a two-step procedure. In the first step, 32% of the total amount was added dropwise to the composite of copper nanoparticles embedded in the carbon matrix. The obtained mixture was homogenized in an ultrasonic bath stirred for 15 min after which the rest of the platinum precursor was added. The mixture was stirred continuously for 12 h. Afterwards, the solid part of the mixture was separated from the liquid and washed three times with water and left to dry. The final composite material was obtained with annealing treatment.
4.1.5. Partial Oxidation
In the first heat treatment step, the partial oxidation of the platinized gel was adapted to control the amount of carbon on the catalyst nanoparticles. The composite material was first heat-treated in an air atmosphere at a heating rate of 5 °C/min to 310 °C and then left at this temperature for 1 h. With the partial oxidation process, nanoparticles buried within the support were uncovered, as well as the so-called carbon film on the nanoparticle surface was removed through controlled carbon oxidation. Subsequently, also removing the less stable carbon as sintering of very small particles was done to improve the corrosion resistance of the final PtCu3/C catalyst due to very small particle sizes. The higher temperature in an oxidative atmosphere would result in a huge loss of carbon support due to severe carbon oxidation as well as intense particle sintering.
4.1.6. Annealing
After partial oxidation, the composite material was heated at a rate of 10 °C/min to 750 °C for 30 min for solid solution formation. The sample was then cooled to 500 °C at a rate of 3 °C/min, and after 30 min, was dropped to 500 °C, where it remained for the next 12 h. This step was necessary for the formation of the partially ordered crystal structure.
4.1.7. PtCu3/C Electrocatalyst Acid Washing
As-prepared PtCu3/C electrocatalyst (20 g) was subjected to a simple acid treatment in acetic acid (stirring in 1 M HAc for 6 h, followed by filtration). Filtered electrocatalyst was redispersed in Milli-Q water (Merck, Darmstadt, Germany, 18.2 MΩ cm) and stirred for 1 h before filtering. Washing in Milli-Q water was repeated four times in order to ensure the removal of any residual HAc and achieve a neutral pH. This catalyst was hereinafter denoted as PtCu3/CA (A stands for Acid washed).
4.1.8. PtCu3/CA Electrocatalyst Milling
PtCu3/CA electrocatalyst (6 g) was subjected to a milling process. The milling was performed in a WAB Dyno®-mill Research Lab for 5 min at 3600 rpm in Ar purged hexane with 0.8 mm zirconium oxide balls. This catalyst was hereinafter denoted as PtCu3/CAM (Acid washed + Milled).
4.2. X-ray Diffraction (XRD)
The powder X-ray diffraction (XRD) measurements of all samples were carried out on a Siemens D5000 diffractometer with Cu Kα1 radiation (λ = 1.5406 Å) in the 2θ range from 10° to 60° with the 0.04° step per 1 s. Samples were prepared on zero-background Si holder.
4.3. Transmission Electron Microscopy Analysis
A Cold-FEG JEOL-ARM microscope was used for the experiments. The microscope was operated at 200 kV with a camera length of 8 cm. The used probe current was approximately 14.5 pA. The electrocatalyst suspension (1 mg Ml−1) was ultrasonicated for 15 min and diluted 10 times (100 uL of the suspension, 900 µL of Milli-Q water). After an additional 5 min of ultrasonication (diluted suspension), 5 µL of the suspension was drop-casted on a finder gold grid. Once dried, the grid was inspected under a transmission electron microscope (TEM).
For Identical Location experiments, several spots were identified and imaged with scanning transmission electron microscopy (STEM) at different magnifications. Then the grid was removed from the microscope to perform the electrochemical experiments as follows: the grid was mounted on a glassy carbon disc, embedded in Teflon (Pine Instruments, Grove, PA, USA) with a geometric surface area of 0.196 cm2. Prior to the electrochemical activation experiment, the electrode was polished to mirror the finish with Al2O3 paste (particle size 0.05 µm, Buehler) on a polishing cloth (Buehler, Lake Bluff, IL, USA). After polishing, the electrodes were rinsed and sonicated in Milli-Q water for 5 min. Electrochemical activation was conducted in a two-compartment electrochemical cell in a 0.1 M HClO4 (Merck, Darmstadt, Germany, Suprapur, 70%, diluted by Milli-Q) electrolyte with a conventional three-electrode system controled by a potentiostat (Compact Stat, Ivium technologies, Houten, The Netherland). Ag|AgCl was used as a reference and a Pt wire as a counter electrode. The Ag|AgCl reference was separated from both the working and the counter electrode via a salt bridge in order to avoid Cl− ion contamination. The electrode was mounted on the rotator (Pine Instruments). The electrode was placed in an Ar saturated electrolyte under potential control at 0.05 V (vs. RHE). The electrocatalyst on the Au-grid was potentio-dynamically treated for 200 cycles between 0.05–1.2 VRHE with a scan rate of 300 mV s−1 and a 600 rpm rotation. All potentials were given against the reversible hydrogen electrode (RHE). After electrochemical treatment, the Au-grid was dipped into fresh Milli-Q water and left to dry at room temperature. Once dried, the grid was again inspected under TEM, tracking the areas previously identified by the letters and imaged for analysis. The images were taken under the same conditions as the previous ones.
4.4. Experimental ICP-MS Analysis
All reagents used were of analytical grade or better. For sample dilution and preparation of standards, ultrapure water (Milli-Q) and ultrapure acids (HNO3 and HCl; Merck, Suprapur) were used. Standards were prepared in-house by the dilution of certified, traceable, inductively coupled plasma (ICP)-grade single-element standards (Merck CertiPUR). An Agilent Technologies 7900 ICP-mass spectrometry (MS) instrument, equipped with a MicroMist glass concentric nebulizer and Peltier-cooled, Scott type spray chamber was used. Prior to ICP-MS analysis, each sample was weighed (approximately 10 mg) and digested using a microwave-assisted digestion system (CEM MDS-2000, Apeldoorn, The Netherland) in a solution of 6 mL HCl and 2 mL HNO3. The digested samples were cooled to room temperature and then diluted with 2% v/v HNO3 until their concentration was within the desired concentration range. After the digestion procedure, samples were centrifuged to yield clear solutions that were used in subsequent analyses.
4.5. Electrochemical Evaluation via Thin Film Rotating Disc Electrode (TF-RDE)
4.5.1. Preparation of Thin Films and the Setup
Electrochemical measurements were conducted in a two-compartment electrochemical cell in a 0.1 M HClO4 (Merck, Suprapur, 70%, diluted by Milli-Q) electrolyte with a conventional three-electrode system controlled by a potentiostat (CompactStat, Ivium technologies). Ag|AgCl was used as a reference and a Pt wire as a counter electrode. The working electrode was a glassy carbon disc embedded in Teflon (Pine Instruments) with a geometric surface area of 0.196 cm2. The Ag|AgCl reference was separated from both the working and the counter electrode via a salt bridge in order to avoid Cl− ion contamination. Prior to each experiment, the two-compartment electrochemical cell was boiled in Milli-Q water for 1 h, and the electrode was polished to mirror finish with Al2O3 paste (particle size 0.05 µm, Buehler, Lake Bluff, IL, USA) on a polishing cloth (Buehler). After polishing, the electrodes were rinsed and ultrasonicated (Ultrasound bath Iskra Sonis 4) in Milli-Q water for 5 min. 20 µL of 1 mg Ml−1 water-based well-dispersed electrocatalyst ink was pipetted on the glassy carbon electrode completely covering it and dried under ambient conditions. After the drop had dried, 5 µL of Nafion solution (5% aqueous solution, Merck, Darmstadt, Germany) diluted in isopropanol (1:50) was added. Such preparation resulted in the electrocatalyst loading of 20 µg for all electrocatalysts and loading of approximately 22 µgPt cm−2geo. All potentials were given against the reversible hydrogen electrode (RHE), which was measured before the start of the experiment and at the end.
4.5.2. Electrochemical Evaluation in TF-RDE
After drying, the electrode was mounted on the rotator (Pine Instruments). The electrode was placed in an O
2 saturated electrolyte under open potential control (OCP) conditions. Ohmic resistance of the electrolyte was determined and compensated for as reported in reference [
38]. ORR polarization curves were measured with a rotation rate of 1600 RPM in the potential window 0.05–1.0 V
RHE with a scan rate of 20 mV s
−1. At the end of the ORR polarization curve measurement, the electrolyte was purged with CO under the potential of 0.05 V
RHE in order to ensure sufficient CO adsorption. Afterwards, the electrolyte was saturated with Ar. CO electrooxidation was performed using the same potential window and scan rate as in ORR, but without rotation and in an Ar-saturated electrolyte. The electrochemical surface area (ECSA) was determined by integrating the charge in CO electrooxidation experiments as described in reference [
39]. After subtraction of background current due to capacitive currents, ORR kinetic parameters were calculated at 0.9 V
RHE. After this initial ORR characterization, electrocatalysts were subjected to an additional 200 cycles of electrochemical activation between 0.05 and 1.2 V
RHE with a scan rate of 300 mV s
−1 under a rotation rate of 600 rpm. After this step, the electrolyte was exchanged for a fresh one. ORR polarization curves (including ohmic resistance and compensation) and CO electrooxidation measurements were performed again using the same process as in the initial ORR characterization.
4.6. X-ray Photoelectron Spectroscopy (XPS)
XPS measurements were performed by using a Physical Electronics (PHI) 5800-01 spectrometer. A monochromatic Al Ka X-ray source was used at a power of 350 W. Spectra were obtained with pass energies of 58.7 eV for elemental analysis (composition) and 11.75 eV for the determination of the oxidation states. The pressure in the analysis chamber of the spectrometer was 1 × 10⁻⁹ Torr during the measurements. The Ag 3d5/2 peak of an Ag foil was taken, after argon sputtering, for checking the calibration of the binding energy (BE) scale. The quantitative evaluation of each peak was obtained by dividing the integrated peak area by atomic sensitivity factors, which were calculated from the ionization cross-sections, the mean free electron escape depth, and the measured transmission functions of the spectrometer. XPS data were interpreted by using the online library of oxidation states implemented in the PHI MULTIPAK 6.1 software and the PHI Handbook of X-ray photoelectron spectroscopy.
4.7. Membrane Electrode Assembly (MEA) Preparation and Single Cell Studies
To evaluate the performance of the Pt-Cu cathode electro-catalysts in the single cell, at the anode side, a 40 wt% Pt/C (Hi-Spec 4000, Johnson Matthey, London, UK) catalyst was used in all experiments. The cathode catalytic ink was prepared by mixing, in an ultrasonic bath, the synthesized PtCu electrocatalyst with a 26 wt% of dry Aquivion® (Solvay, Brussels, Belgium, 20 wt% hydroalcoholic solution D79-20BS Solvay) as an ionomer. The catalytic ink was deposited onto a gas diffusion layer SGL25BC by a spray coating. A Pt loading of 0.2 mg cm−2 was used for both anode and cathode. The MEAs were prepared by hot pressing, assembling the electrodes with a 20 µm Short Side Chain (SSC) PFSA Aquivion membrane at 125 °C.
Electrochemical studies were performed in a 25 cm2 single cell, at a temperature range between 80 °C and 95 °C, at 3 barabs, and 100% of relative humidity values (RH) as indicated. The cell was fed with H2 as fuel and O2 as an oxidant in order to evaluate simultaneously the single cell performance and the catalytic activity for the ORR. The flow rates were varied to have a constant stoichiometry of 2 or 4 and 1.5 or 3 for oxidant and fuel, respectively. The single cell performance was investigated by steady-state galvanostatic measurements. The cell was connected to a fuel cell test station including an HP6051A electronic load. For the impedance analysis, the single cell was connected to a Potentiostat/Galvanostat PGSTAT30 AUTOLAB Metrohm (Utrecht, The Netherlands), equipped with a frequency response analyzer (FRA) module and a 20 A current booster. The impedance measurements were performed in the potentiostatic mode of fuel cell operation at 850 mV. The impedance spectra were obtained by varying the frequency of the voltage perturbation signal from 0.1 Hz to 100 kHz, by using an amplitude of 10 mV for the perturbing signal.

 ,
, 


