Porous Ni Photocathodes Obtained by Selective Corrosion of Ni-Cu Films: Synthesis and Photoelectrochemical Characterization


 ,
,  ,
, 
Abstract
1. Introduction
2. Results and Discussion
3. Materials and Methods
4. Conclusions
Author Contributions
Funding
Conflicts of Interest
References
- Zhao, G.; Rui, K.; Dou, S.X.; Sun, W. Heterostructures for Electrochemical Hydrogen Evolution Reaction: A Review. Adv. Funct. Mater. 2018, 28, 1803291. [Google Scholar] [CrossRef]
- Murthy, A.P.; Madhavan, J.; Murugan, K. Recent advances in hydrogen evolution reaction catalysts on carbon/carbon-based supports in acid media. J. Power Sources 2018, 398, 9–26. [Google Scholar] [CrossRef]
- Eftekhari, A. Electrocatalysts for hydrogen evolution reaction. Int. J. Hydrog. Energy 2017, 42, 11053–11077. [Google Scholar] [CrossRef]
- Kibsgaard, J.; Jaramillo, T.F.; Besenbacher, F. Building an appropriate active-site motif into a hydrogen-evolution catalyst with thiomolybdate [Mo3S13]2− clusters. Nat. Chem. 2014, 6, 248–253. [Google Scholar] [CrossRef] [PubMed]
- Chang, Y.H.; Lin, C.T.; Chen, T.Y.; Hsu, C.L.; Lee, Y.H.; Zhang, W.; Wei, K.H.; Li, L.J. Highly efficient electrocatalytic hydrogen production by MoSx grown on graphene-protected 3D Ni foams. Adv. Mater. 2013, 25, 756–760. [Google Scholar] [CrossRef]
- Youn, D.H.; Han, S.; Kim, J.Y.; Kim, J.Y.; Park, H.; Choi, S.H.; Lee, J.S. Highly active and stable hydrogen evolution electrocatalysts based on molybdenum compounds on carbon nanotube-graphene hybrid support. ACS Nano 2014, 8, 5164–5173. [Google Scholar] [CrossRef] [PubMed]
- Chen, W.F.; Muckerman, J.T.; Fujita, E. Recent developments in transition metal carbides and nitrides as hydrogen evolution electrocatalysts. Chem. Commun. 2013, 49, 8896–8909. [Google Scholar] [CrossRef]
- Faber, M.S.; Jin, S. Earth-abundant inorganic electrocatalysts and their nanostructures for energy conversion applications. Energy Environ. Sci. 2014, 7, 3519–3542. [Google Scholar] [CrossRef]
- Yu, X.Y.; Feng, Y.; Guan, B.; Lou, X.W.; Paik, U. Carbon coated porous nickel phosphides nanoplates for highly efficient oxygen evolution reaction. Energy Environ. Sci. 2016, 9, 1246–1250. [Google Scholar] [CrossRef]
- Zhao, Z.; Wu, H.; He, H.; Xu, X.; Jin, Y. A high-performance binary Ni-Co hydroxide-based water oxidation electrode with three-dimensional coaxial nanotube array structure. Adv. Funct. Mater. 2014, 24, 4698–4705. [Google Scholar] [CrossRef]
- Zhang, G.; Yuan, J.; Liu, Y.; Lu, W.; Fu, N.; Lia, W.; Huang, H. Boosting the oxygen evolution reaction in non-precious catalysts by structural and electronic engineering. J. Mater. Chem. A 2018, 6, 10253–10263. [Google Scholar] [CrossRef]
- Wei, J.; Zhou, M.; Long, A.; Xue, Y.; Liao, H.; Wei, C.; Xu, Z.J. Heterostructured Electrocatalysts for Hydrogen Evolution Reaction Under Alkaline Conditions. Nano-Micro Lett. 2018, 10, 75. [Google Scholar] [CrossRef] [PubMed]
- Liu, X.; Wang, X.; Yuang, X.; Dong, W.; Huang, F. Rational composition and structural design of in situ grown nickel-based electrocatalysts for efficient water electrolysis. J. Mater. Chem. A 2016, 4, 167–172. [Google Scholar] [CrossRef]
- Macdonald, T.J.; Xu, J.; Elmas, S.; Mange, Y.J.; Skinner, W.M.; Xu, H.; Nann, T. NiO Nanofibers as a Candidate for a Nanophotocathode. Nanomaterials 2014, 4, 256–266. [Google Scholar] [CrossRef] [PubMed]
- Hu, C.; Chu, K.; Zhao, Y.; Teoh, E.Y. Efficient Photoelectrochemical Water Splitting over Anodized p Type NiO Porous Films. ACS Appl. Mater. Interfaces 2014, 6, 18558–18568. [Google Scholar] [CrossRef]
- Li, L.; Gibson, E.A.; Qin, P.; Boschloo, G.; Gorlov, M.; Hagfeldt, A.; Sun, L. Double-Layered NiO Photocathodes for p-Type DSSCs with Record IPCE. Adv. Mater. 2010, 22, 1759–1762. [Google Scholar] [CrossRef] [PubMed]
- Wu, L.; Guo, X.; Xu, Y.; Xiao, Y.; Qian, J.; Xu, Y.; Guan, Z.; He, Y.; Zeng, Y. Electrocatalytic activity of porous Ni–Fe–Mo–C–LaNi5 sintered electrodes for hydrogen evolution reaction in alkaline solution. RSC Adv. 2017, 7, 32264–32274. [Google Scholar] [CrossRef]
- Arce, E.M.; Lopez, V.M.; Martinez, L.; Dorantes, H.J.; Saucedo, M.L.; Hernandez, F. Electrocatalytic properties of mechanically alloyed Co-20 wt % Ni-10 wt % Mo and Co-70 wt % Ni-10 wt % Mo alloy powders. J. Mater. Sci. 2003, 38, 275–278. [Google Scholar] [CrossRef]
- Kedzierzawski, P.; Oleszak, D.; Janik-Czachor, M. Hydrogen evolution on hot and cold consolidated Ni-Mo alloys produced by mechanical alloying. Mater. Sci. Eng. A 2001, 300, 105–112. [Google Scholar] [CrossRef]
- Ngamlerdpokin, K.; Tantavichet, N. Electrodeposition of nickel–copper alloys to use as a cathode for hydrogen evolution in an alkaline media. Int. J. Hydrog. Energy 2014, 39, 2505–2515. [Google Scholar] [CrossRef]
- Solmaz, R.; Döner, A.; Kardaş, G. Electrochemical deposition and characterization of NiCu coatings as cathode materials for hydrogen evolution reaction. Electrochem. Commun. 2008, 10, 1909–1911. [Google Scholar] [CrossRef]
- Friend, W.Z. Corrosion of Nickel and Nickel Alloys; Wiley-Interscience: Manhattan, NY, USA, 1980. [Google Scholar]
- Solmaz, R.; Döner, A.; Kardaş, G. The stability of hydrogen evolution activity and corrosion behavior of NiCu coatings with long-term electrolysis in alkaline solution. Int. J. Hydrog. Energy 2009, 34, 2089–2094. [Google Scholar] [CrossRef]
- Bae, J.H.; Han, J.-H.; Chung, T.D. Electrochemistry at nanoporous interfaces: New opportunity for electrocatalysis. Phys. Chem. Chem. Phys. 2012, 14, 448–463. [Google Scholar] [CrossRef] [PubMed]
- Dominguez Crespo, M.A.; Plata Torres, M.; Torres Huerta, A.M.; Ortiz Rodriguez, I.A.; Ramirez Rodriguez, C.; Arce Estrada, E.M. Influence of Fe contamination and temperature on mechanically alloyed Co-Ni-Mo electrodes for hydrogen evolution reaction in alkaline water. Mater. Charact. 2006, 56, 138–146. [Google Scholar] [CrossRef]
- Aymard, L.; Dumont, B.; Viau, G. Production of Co-Ni alloys by mechanical-alloying. J. Alloys Compd. 1996, 242, 108–113. [Google Scholar] [CrossRef]
- Zhang, J.; Li, C.M. Nanoporous metals: fabrication strategies and advanced electrochemical applications in catalysis, sensing and energy systems. Chem. Soc. Rev. 2012, 41, 7016–7031. [Google Scholar] [CrossRef]
- Martínez, W.; Fernández, A.; Cano-Castillo, U. Synthesis of nickel-based skeletal catalyst for an alkaline electrolyzer. Int. J. Hydrog. Energy 2010, 35, 8457–8462. [Google Scholar] [CrossRef]
- Olurin, O.B.; Wilkinson, D.S.; Weatherly, G.C.; Paserin, V.; Shu, J. Strength and ductility of as-plated and sintered CVD nickel foams. Compos. Sci. Technol. 2003, 63, 2317–2329. [Google Scholar] [CrossRef]
- Paserin, V.; Marcuson, S.; Shu, J.; Wilkinson, D.S. CVD Technique for Inco Nickel Foam Production. Adv. Eng. Mater. 2004, 6, 454–459. [Google Scholar] [CrossRef]
- Marozzi, C.; Chialvo, A. Development of electrode morphologies of interest in electrocatalysis. Part 1: Electrodeposited porous nickel electrodes. Electrochim. Acta 2000, 45, 2111–2120. [Google Scholar] [CrossRef]
- Li, Y.; Xiao, X.; Zhao, R.; Yu, K.; Hou, C.; Liang, J. Study of the fabrication and characterization of porous ni using polystyrene sphere template. Synth. React. Inorg. Met.-Org. Nano-Met. Chem. 2016, 46, 286–290. [Google Scholar] [CrossRef]
- Böhme, O.; Leidich, F.U.; Salge, H.J.; Wendt, H. Development of materials and production technologies for molten carbonate fuel cells. Int. J. Hydrog. Energy 1994, 19, 349–355. [Google Scholar] [CrossRef]
- Rahman, A.; Zhu, X.; Wen, C. Fabrication of Nanoporous Ni by chemical dealloying Al from Ni-Al alloys for lithium-ion batteries. Int. J. Electrochem. Sci. 2015, 10, 3767–3783. [Google Scholar]
- Sun, L.; Chien, C.L.; Searson, P.C. Fabrication of Nanoporous Nickel by Electrochemical Dealloying. Chem. Mater. 2004, 16, 3125–3129. [Google Scholar] [CrossRef]
- Chang, J.K.; Hsu, S.H.; Sun, I.W.; Tsai, W.T. Formation of Nanoporous Nickel by Selective Anodic Etching of the Nobler Copper Component from Electrodeposited Nickel−Copper Alloys. J. Phys. Chem. C 2008, 112, 1371–1376. [Google Scholar] [CrossRef]
- Jeong, M.G.; Zhuo, K.; Cherevko, S.; Chung, C.H. Formation of nanoporous nickel oxides for supercapacitors prepared by electrodeposition with hydrogen evolution reaction and electrochemical dealloying. Korean J. Chem. Eng. 2012, 29, 1802–1805. [Google Scholar] [CrossRef]
- Zhang, J.; Zhan, Y.; Bian, H.; Li, Z.; Tsang, C.K.; Lee, C.; Cheng, H.; Shu, S.; Li, Y.Y.; Lu, J. Electrochemical dealloying using pulsed voltage waveforms and its application for supercapacitor electrodes. J. Power Sources 2014, 257, 374–379. [Google Scholar] [CrossRef]
- Erlebacher, J.; Aziz, M.J.; Karma, A.; Dimitrov, N.; Sieradzki, K. Evolution of nanoporosity in dealloying. Nature 2001, 410, 450–453. [Google Scholar] [CrossRef] [PubMed]
- Losiewicz, B.; Budniok, A.; Rowinski, E.; Lagiewka, E.; Lasia, A. The structure, morphology and electrochemical impedance study of the hydrogen evolution reaction on the modified nickel electrodes. Int. J. Hydrog. Energy 2004, 29, 145–157. [Google Scholar] [CrossRef]
- Panek, J.; Serek, A.; Budniok, A.; Rowinski, E.; Lagiewka, E. Ni + Ti composite layers as cathode materials for electrolytic hydrogen evolution. Int. J. Hydrog. Energy 2003, 28, 169–175. [Google Scholar] [CrossRef]
- Hiltz, C.; Lasia, A. Experimental study and modeling of impedance of the her on porous Ni electrodes. J. Electroanal. Chem. 2001, 500, 213–222. [Google Scholar] [CrossRef]
- Armstrong, R.D.; Henderson, M. Impedance plane display of a reaction with an adsorbed intermediate. J. Electroanal. Chem. 1972, 39, 81–90. [Google Scholar] [CrossRef]
- Lasia, A.; Rami, A. Kinetics of hydrogen evolution on Nickel electrodes. J. Electroanal. Chem. 1990, 294, 123–141. [Google Scholar] [CrossRef]
- Birry, L.; Lasia, A. Studies of the hydrogen evolution reaction on Raney nickel molybdenum electrodes. J. Appl. Electrochem. 2004, 34, 735–749. [Google Scholar] [CrossRef]
- Herraiz-Cardona, I.; Ortega, E.; Vazquez-Gomez, L.; Perez-Herranz, V. Double-template fabrication of three-dimensional porous nickel electrodes for hydrogen evolution reaction. Int. J. Hydrog. Energy 2012, 37, 2147–2156. [Google Scholar] [CrossRef]
- Orazem, M.E.; Tribollet, B. Electrochemcial Impedance Spectroscopy; John Wiley & Sons, Inc.: Hoboken, NJ, USA, 2008. [Google Scholar]
- Herraiz-Cardona, I.; Ortega, E.; Pérez-Herranz, V. Impedance study of hydrogen evolution on Ni/Zn and Ni–Co/Zn stainless steel based electrodeposits. Electrochim. Acta 2011, 56, 1308–1315. [Google Scholar] [CrossRef]
- Borresen, B.; Hagen, G.; Tunold, R. Hydrogen evolution on RuxTi1−xO2 in 0.5 M H2SO4. Electrochim. Acta 2002, 47, 1819–1827. [Google Scholar] [CrossRef]
- Castro, E.B.; De Giz, M.J.; Gonzalez, E.R.; Vilche, J.R. An electrochemical impedance study on the kinetics and mechanism of the hydrogen evolution reaction on nickel molybdenite electrodes. Electrochim. Acta 1997, 42, 951–959. [Google Scholar] [CrossRef]
- Abouelamaiem, D.I.; He, G.; Neville, T.P.; Patel, D.; Ji, S.; Wang, R.; Parkin, I.P.; Jorge, A.B.; Titirici, M.M.; Shearing, P.R.; et al. Correlating electrochemical impedance with hierarchical structure for porous carbon-based supercapacitors using a truncated transmission line model. Electrochim. Acta 2018, 284, 597–608. [Google Scholar] [CrossRef]
- Brug, G.J.; Van den Eeden, A.L.G.; Sluyters-Rehbach, M.; Sluyters, J.H. The Analysis of Electrode Impedances Complicated by the Presence of a Constant Phase Element. J. Electroanal. Chem. 1984, 176, 275–295. [Google Scholar] [CrossRef]
- Valero-Vidal, C.; Herraiz-Cardona, I.; Pérez-Herranz, V.; Igual-Munoz, A. Stability of 3D-porous Ni/Cu cathodes under real alkaline electrolyzer operating conditions and its effect on catalytic activity. Appl. Catal. B Environm. 2016, 198, 142–153. [Google Scholar] [CrossRef]
- Pletcher, D.; Greff, R.; Peat, R.; Peter, L.M.; Robinson, J. Instrumental Methods in Electrochemistry; Woodhead Publishing Limited: Philadelphia, PA, USA, 2010. [Google Scholar]
- Delgado, D.; Minakshi, M.; Kim, D.J.; Kyeong, C.W. Influence of the Oxide Content in the Catalytic Power of Raney Nickel in Hydrogen Generation. Anal. Lett. 2017, 50, 2386–2401. [Google Scholar] [CrossRef]
- Xu, P.; McCool, N.S.; Mallouk, T.E. Water splitting dye-sensitized solar cells. Nano Today 2017, 14, 42–58. [Google Scholar] [CrossRef]


| tcorr/s | trelax/s | φ | d/nm | XNi | XCu | |
|---|---|---|---|---|---|---|
| S1–5 | 1 | 5 | 0.2 | 200–350 | 0.90 | 0.064 |
| S0.1–0.5 | 0.1 | 0.5 | 0.2 | 140–300 | 0.86 | 0.086 |
| S0.01–0.05 | 0.01 | 0.05 | 0.2 | 50–150 | 0.76 | 0.195 |
| S1–50 | 1 | 50 | 0.02 | 170–250 | 0.81 | 0.14 |
| S0.1–5 | 0.1 | 5 | 0.02 | 170–250 | 0.89 | 0.083 |
| S0.01–0.5 | 0.01 | 0.5 | 0.02 | 70–250 | 0.82 | 0.11 |
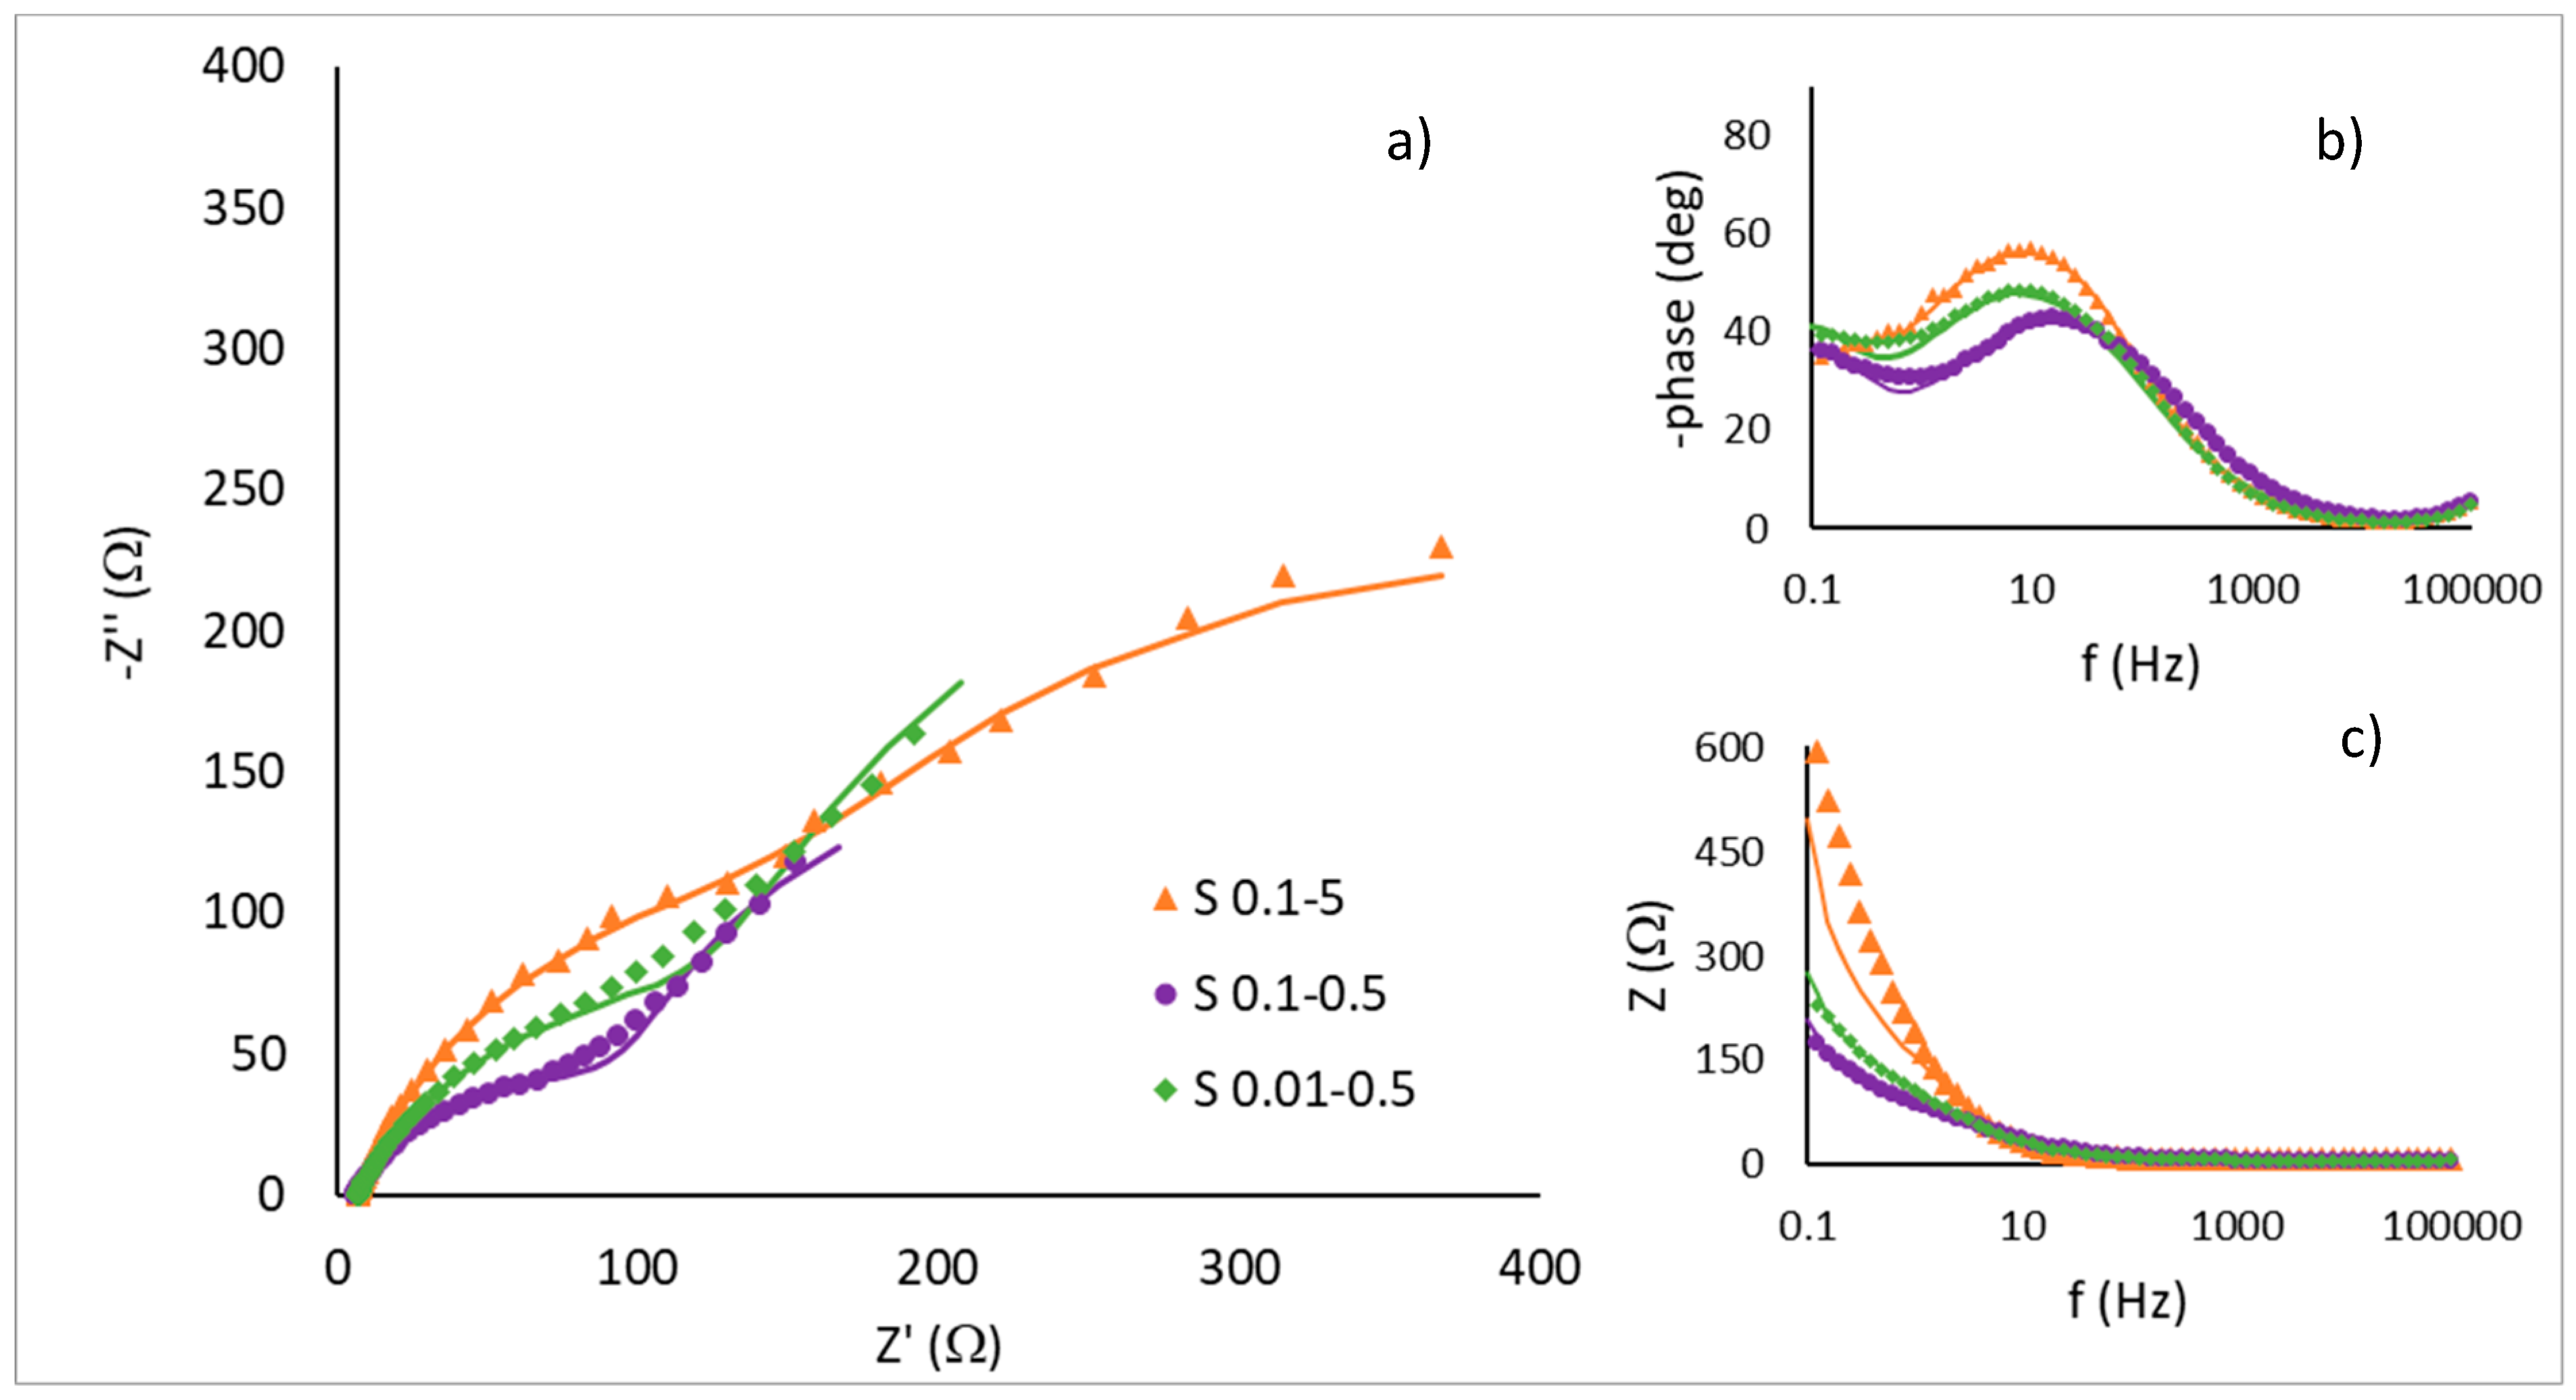
| Samples | S1–5 | S0.1–0.5 | S0.01–0.05 | S1–50 | S0.1–5 | S0.01–0.5 |
|---|---|---|---|---|---|---|
| χ2 | 2.06 × 10⁻⁴ | 8.33 × 10⁻⁴ | 7.69 × 10⁻⁴ | 9.51 × 10⁻⁴ | 5.84 × 10⁻⁴ | 9.82 × 10⁻⁴ |
| Rs/Ω cm2 | 3.16 | 3.16 | 3.44 | 3.70 | 3.28 | 3.38 |
| Rct/Ω cm2 | 829 | 65.90 | 784.5 | 433.4 | 140.65 | 103.60 |
| Q1/mS sn cm−2 | 0.52 | 3.18 | 0.242 | 0.76 | 1.99 | 3.24 |
| n1 | 0.86 | 0.68 | 1.00 | 1.00 | 0.80 | 0.72 |
| R2/Ω cm2 | 6.055 | 141.4 | 4.71 | 3.4 | 157.7 | 239.8 |
| Q2/mS sn cm−2 | 1.60 | 16.66 | 1.17 | 2.08 | 6.82 | 12.14 |
| n2 | 0.71 | 1.00 | 0.85 | 0.73 | 0.99 | 1.00 |
| Cdl/μF cm−2 | 454 | 1522 | 242 | 760 | 1439 | 2118 |
| C2/μF cm−2 | 250 | 16660 | 460 | 335 | 6821 | 12140 |
| τ1 (s) | 0.38 | 0.10 | 0.19 | 0.33 | 0.20 | 0.22 |
| τ2 (s) | 0.0015 | 2.36 | 0.0022 | 0.0011 | 1.08 | 2.91 |
| Rf | 22.7 | 76.1 | 12.1 | 38.0 | 71.9 | 105.9 |
| Ar (cm2) | 11 | 38 | 6 | 19 | 36 | 53 |
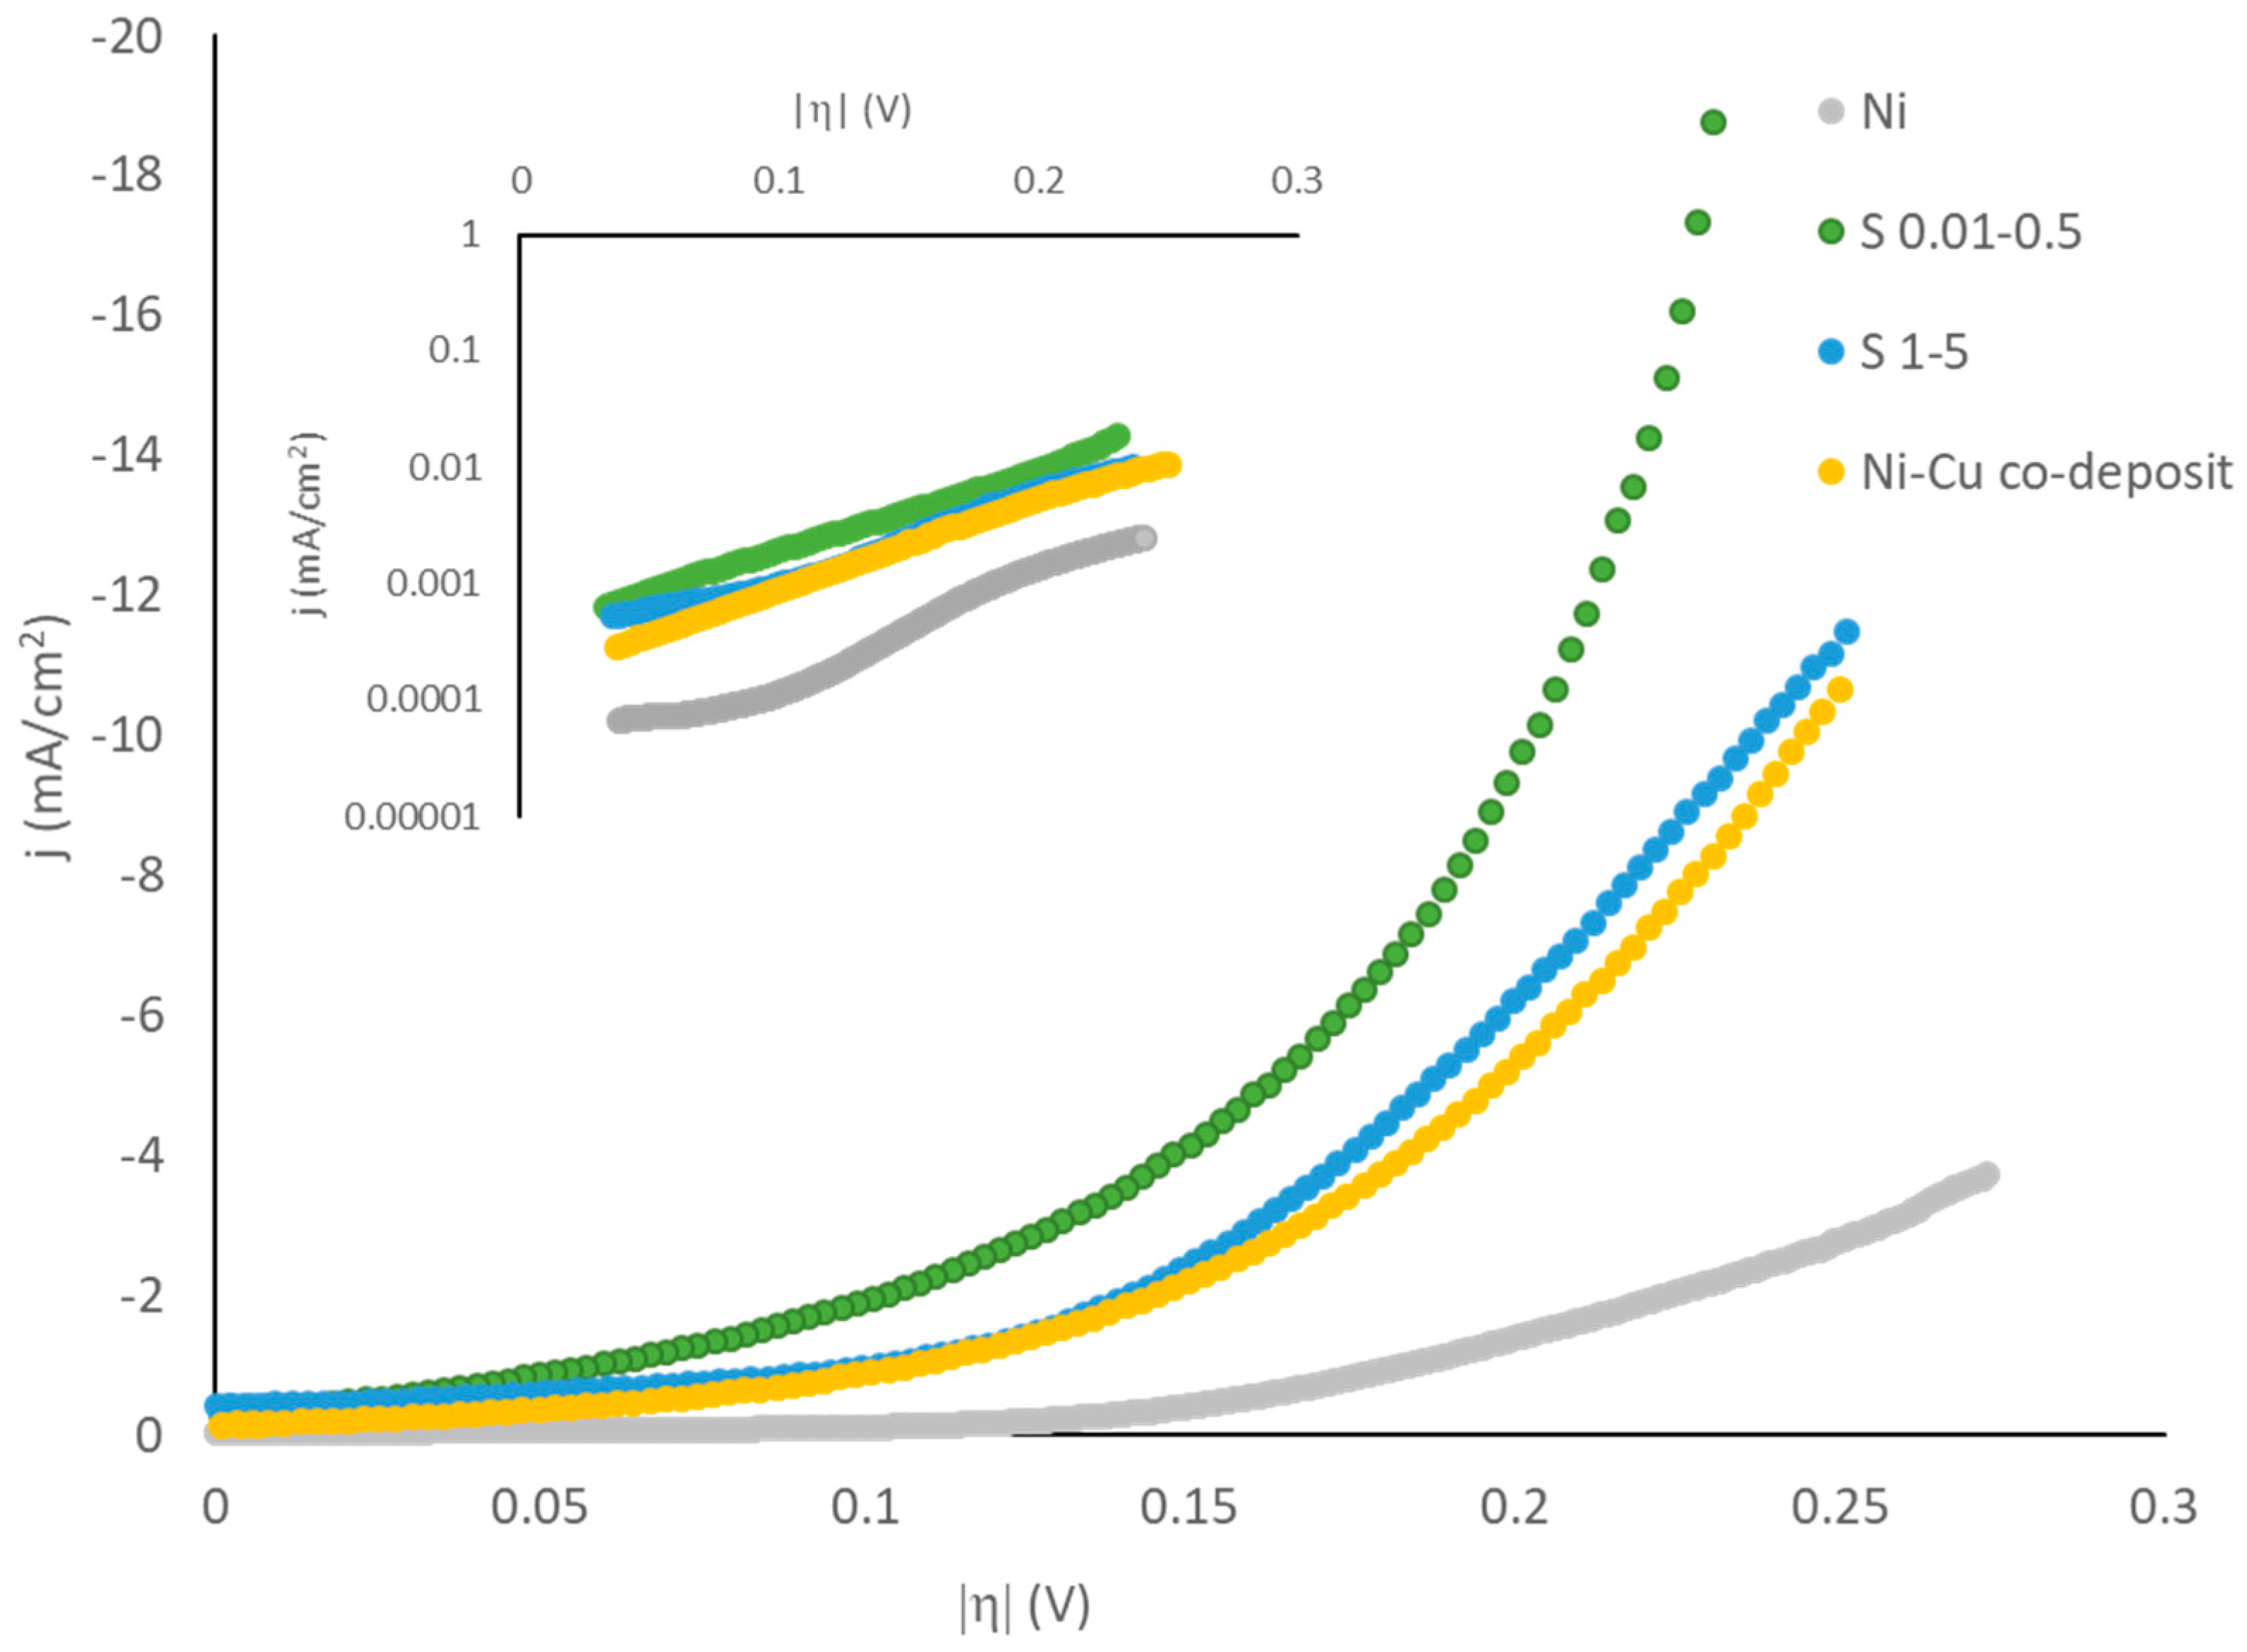
| Sample | Rf | b (mV/dec) | j0 (mA/cm2) | j0r (μA/cm2) |
|---|---|---|---|---|
| Ni | 8 | 130 | 0.02 | 4.2 |
| Cu-Ni co-deposit | 13 | 124 | 0.13 | 12 |
| S1–5 | 23 | 158 | 0.29 | 8.6 |
| S0.01–0.5 | 106 | 138 | 0.35 | 4.6 |
© 2019 by the authors. Licensee MDPI, Basel, Switzerland. This article is an open access article distributed under the terms and conditions of the Creative Commons Attribution (CC BY) license (http://creativecommons.org/licenses/by/4.0/).
Share and Cite
Mais, L.; Palmas, S.; Mascia, M.; Sechi, E.; Casula, M.F.; Rodriguez, J.; Vacca, A. Porous Ni Photocathodes Obtained by Selective Corrosion of Ni-Cu Films: Synthesis and Photoelectrochemical Characterization. Catalysts 2019, 9, 453. https://doi.org/10.3390/catal9050453
Mais L, Palmas S, Mascia M, Sechi E, Casula MF, Rodriguez J, Vacca A. Porous Ni Photocathodes Obtained by Selective Corrosion of Ni-Cu Films: Synthesis and Photoelectrochemical Characterization. Catalysts. 2019; 9(5):453. https://doi.org/10.3390/catal9050453
Chicago/Turabian StyleMais, Laura, Simonetta Palmas, Michele Mascia, Elisa Sechi, Maria Francesca Casula, Jesus Rodriguez, and Annalisa Vacca. 2019. "Porous Ni Photocathodes Obtained by Selective Corrosion of Ni-Cu Films: Synthesis and Photoelectrochemical Characterization" Catalysts 9, no. 5: 453. https://doi.org/10.3390/catal9050453
APA StyleMais, L., Palmas, S., Mascia, M., Sechi, E., Casula, M. F., Rodriguez, J., & Vacca, A. (2019). Porous Ni Photocathodes Obtained by Selective Corrosion of Ni-Cu Films: Synthesis and Photoelectrochemical Characterization. Catalysts, 9(5), 453. https://doi.org/10.3390/catal9050453