Formation of CuO on TiO2 Surface Using its Photocatalytic Activity

Abstract
: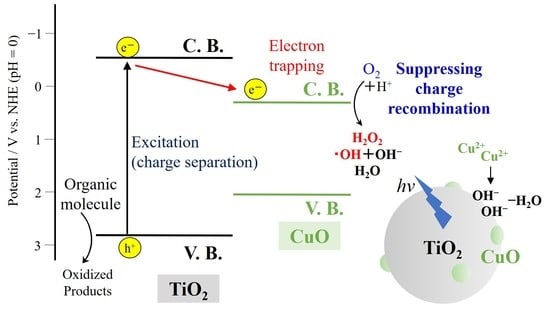
1. Introduction
2. Results and Discussion
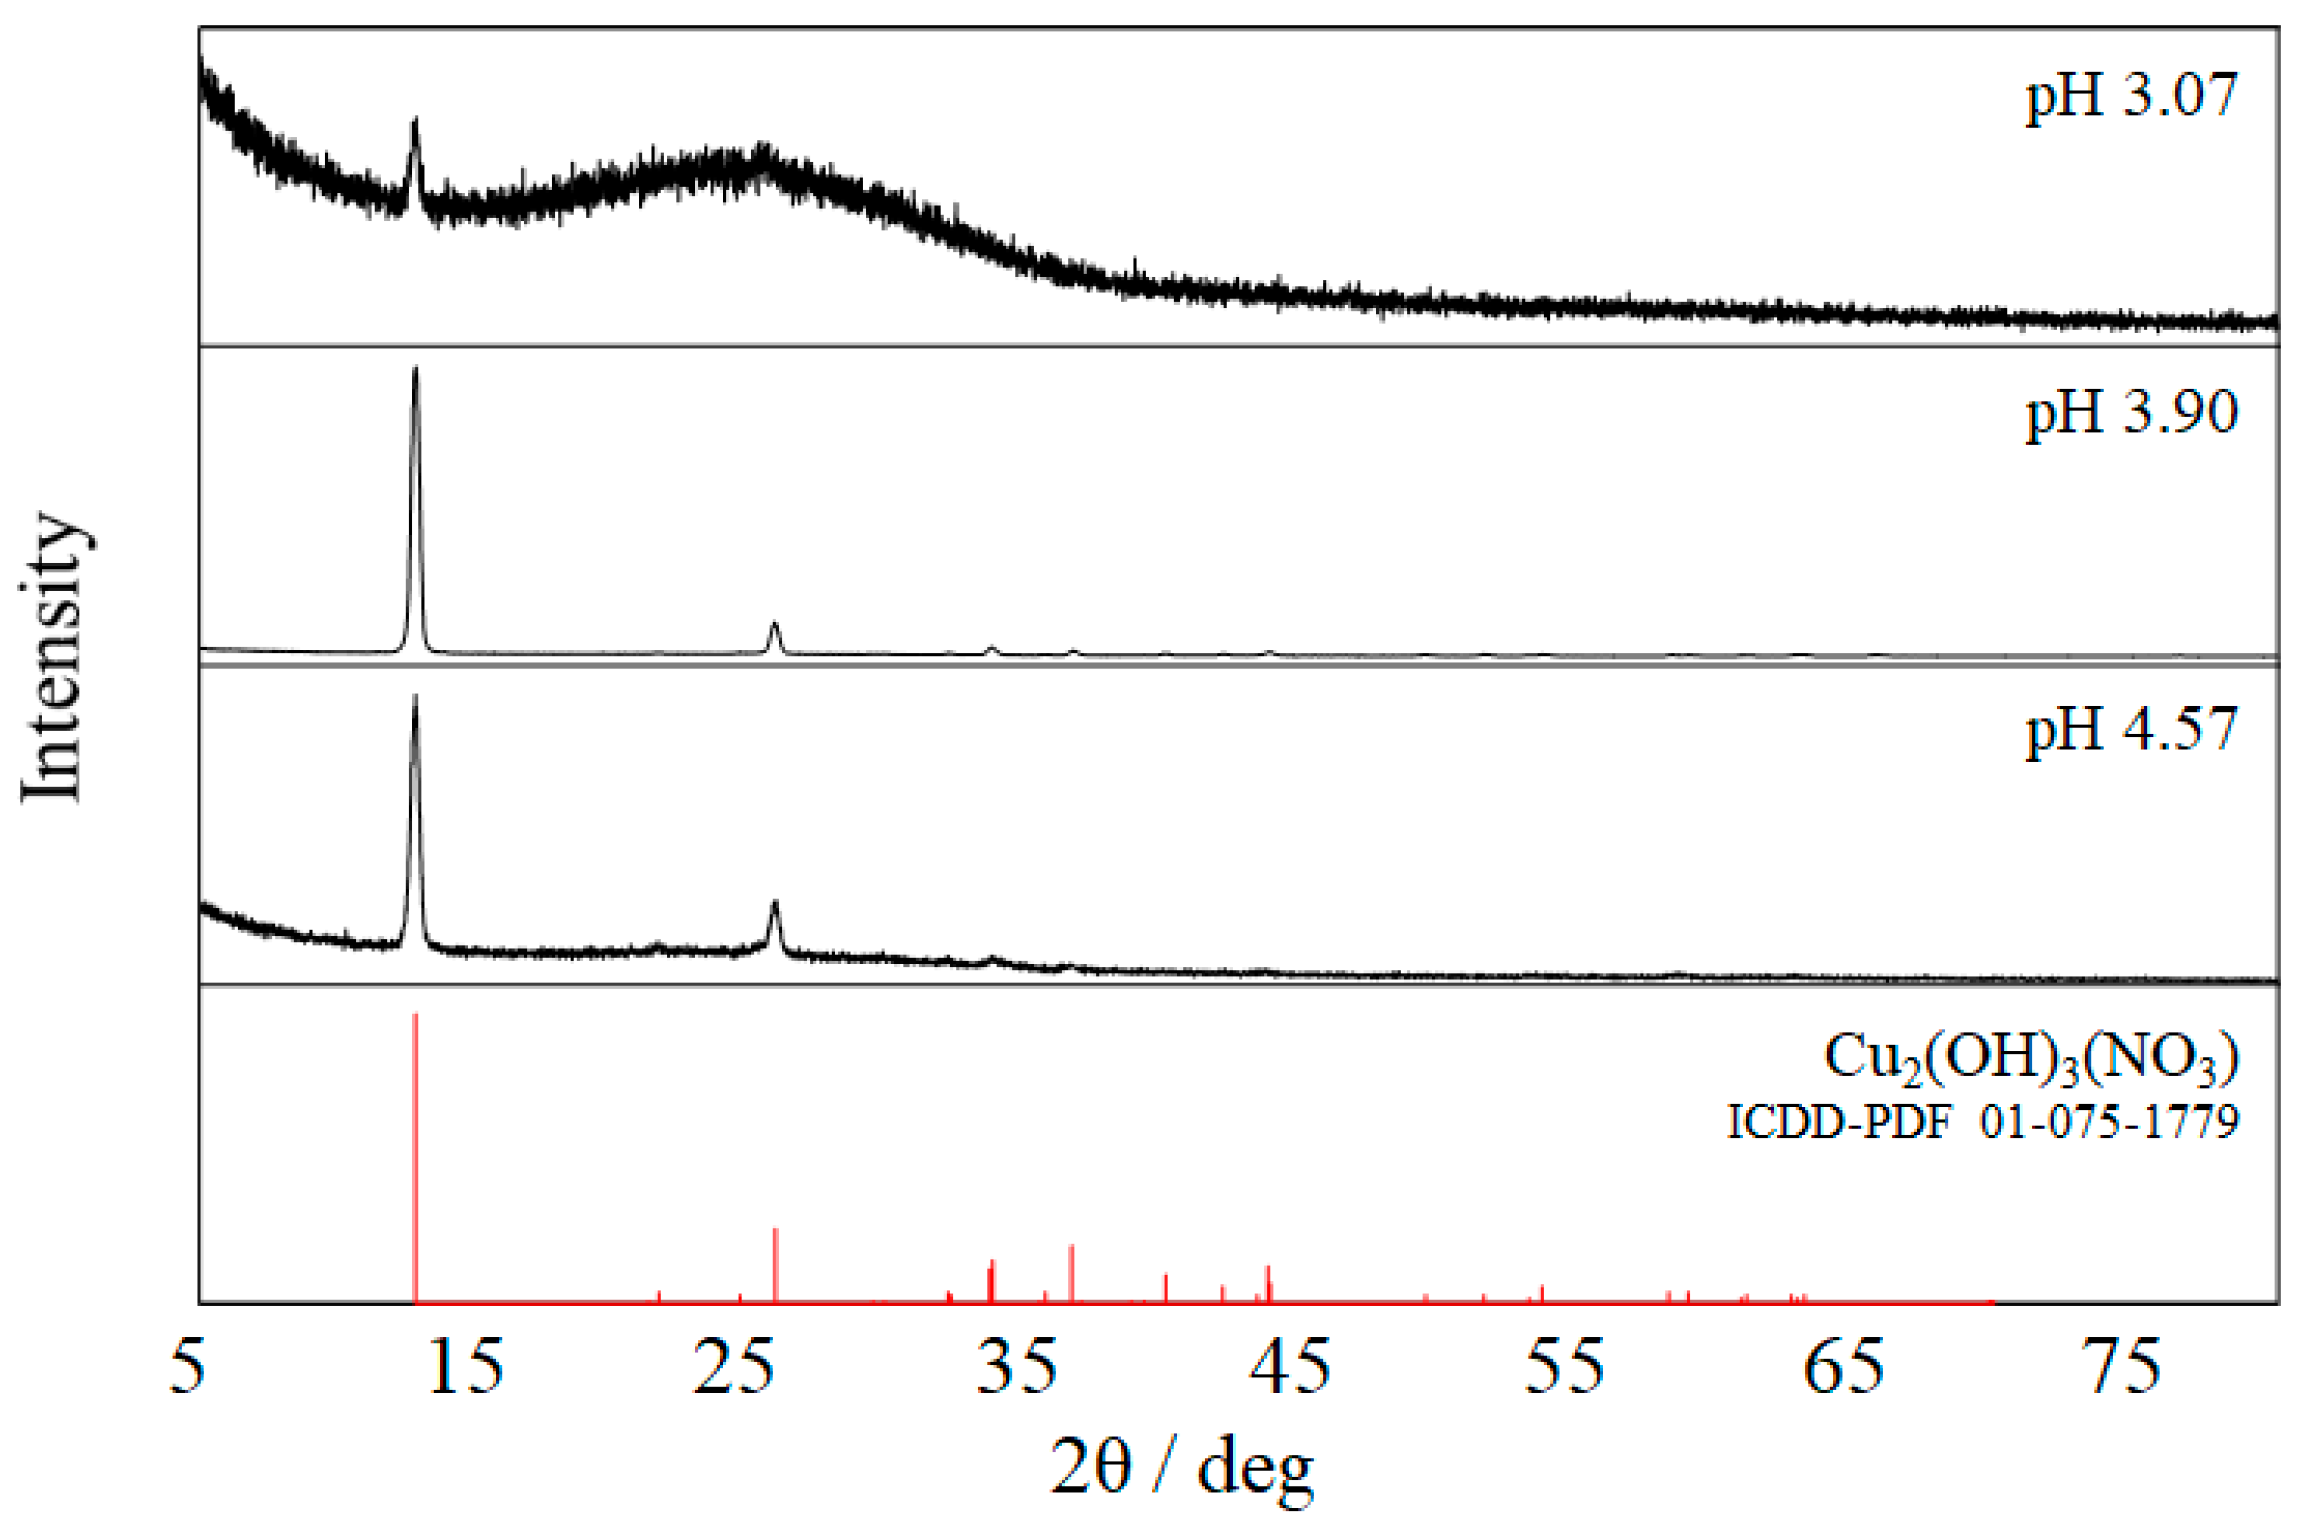
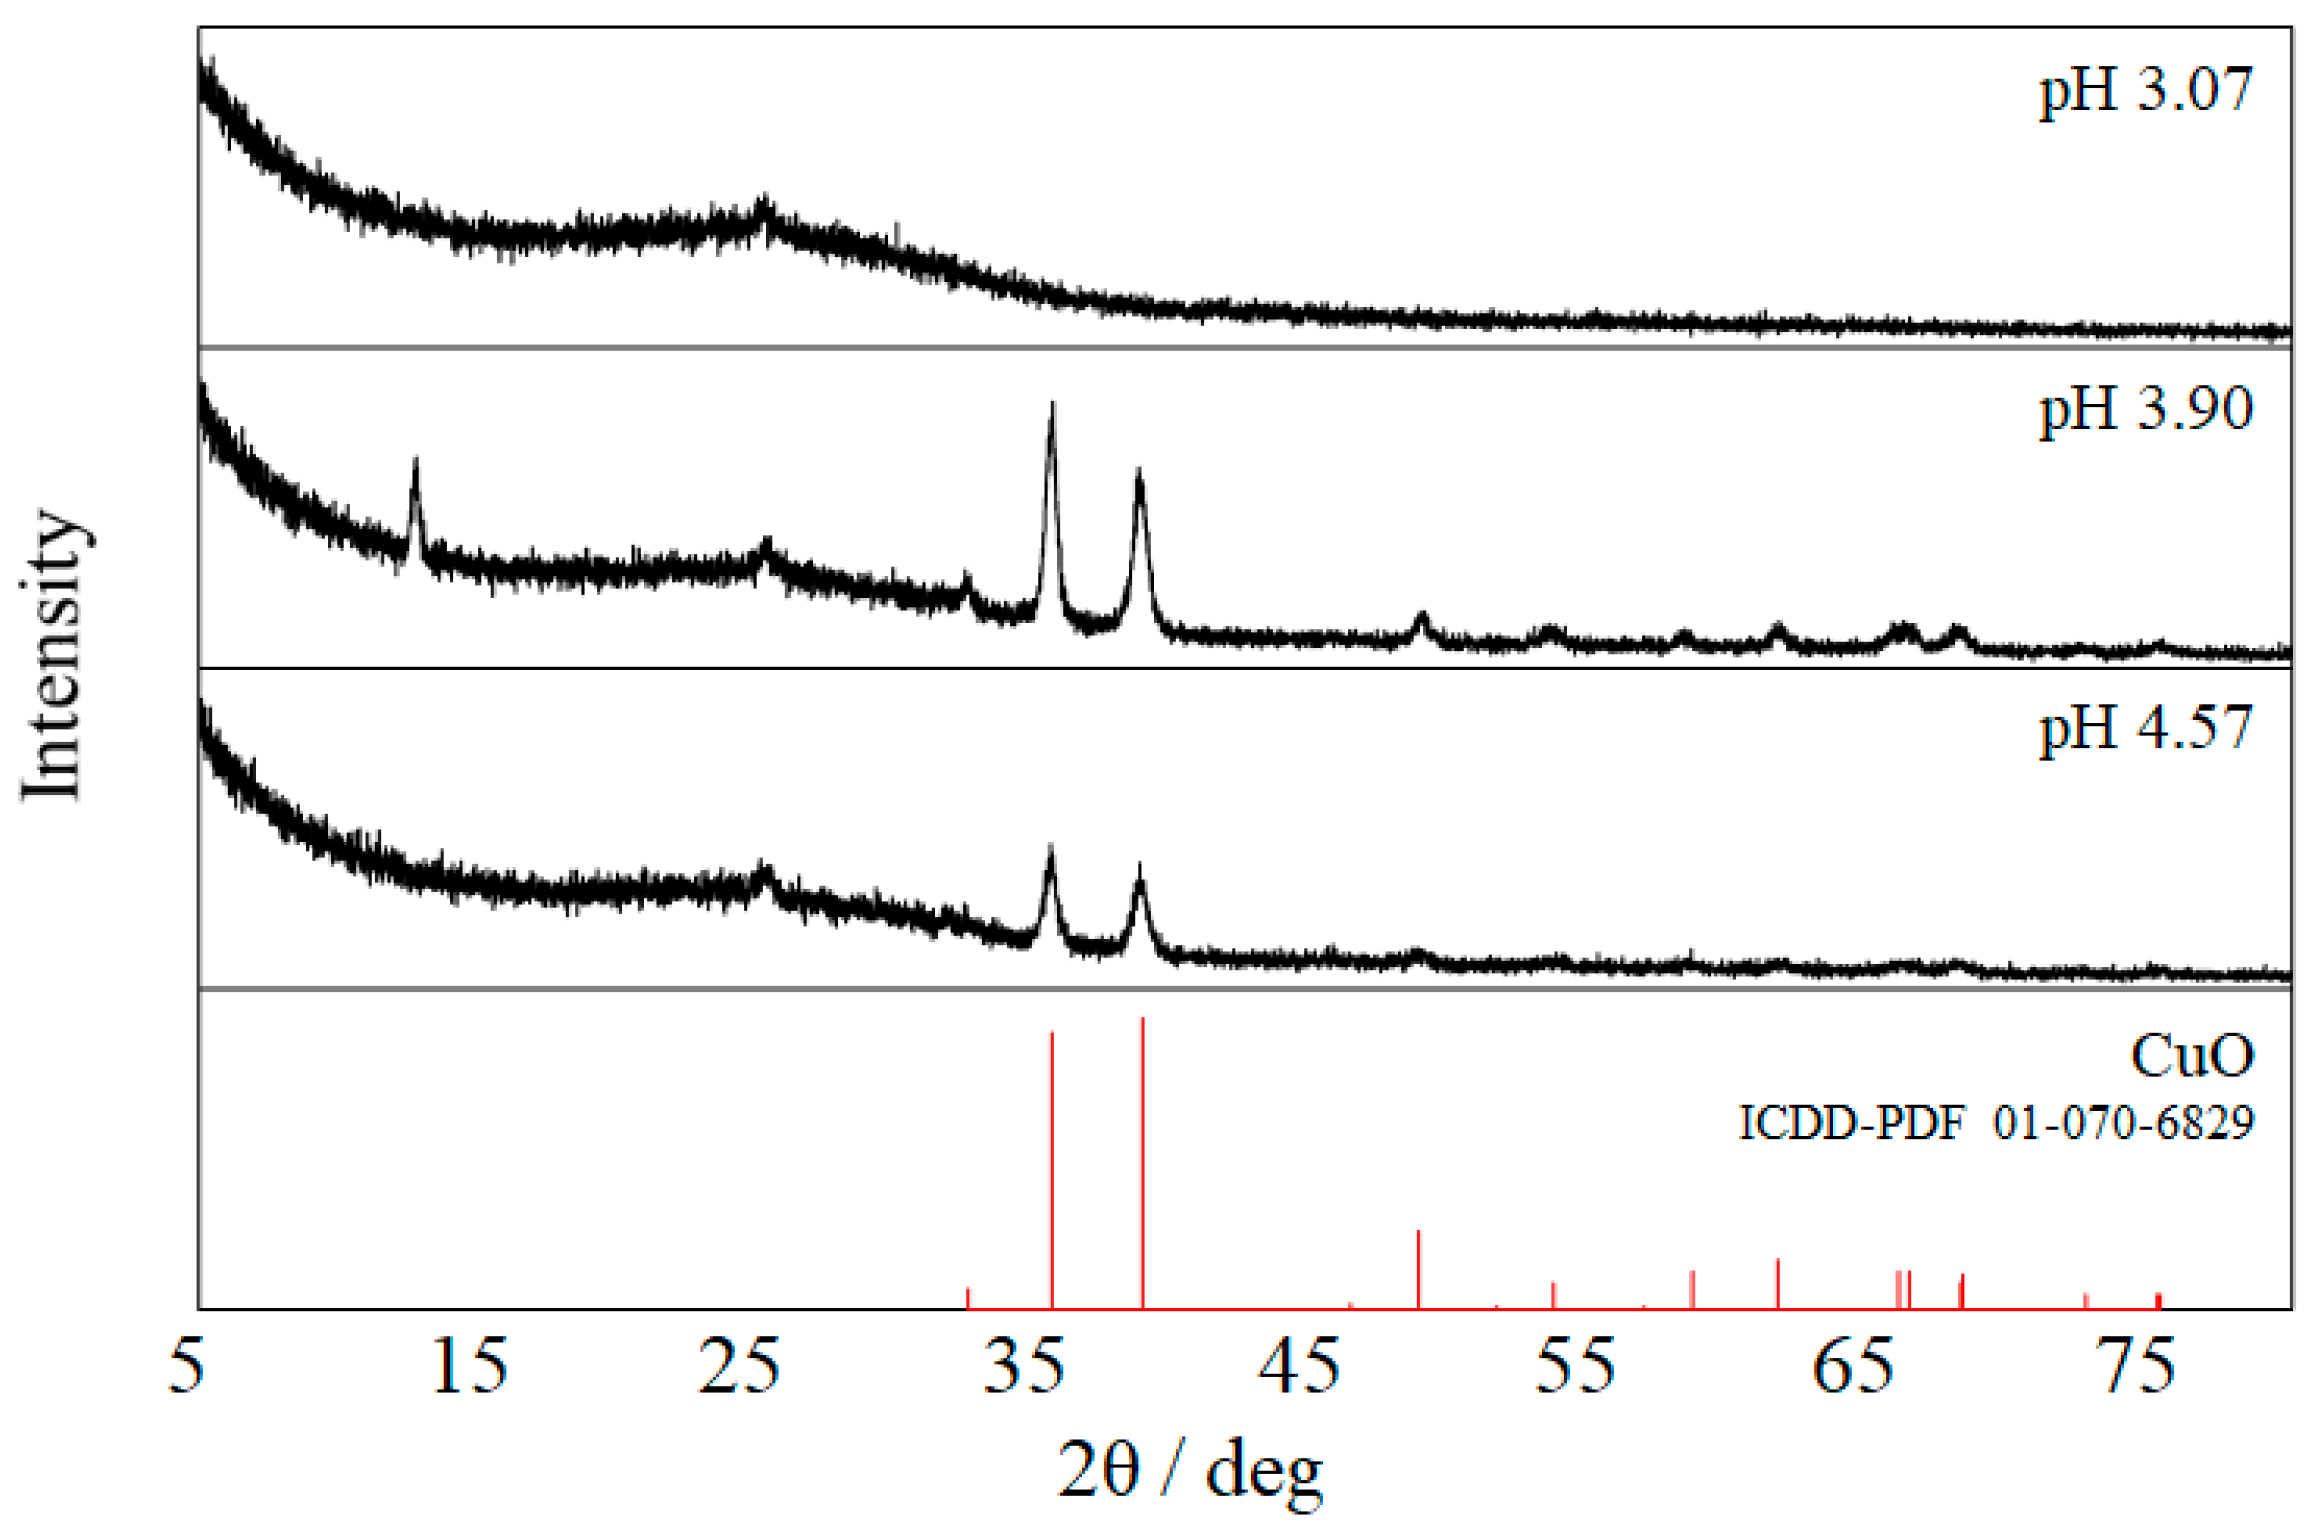
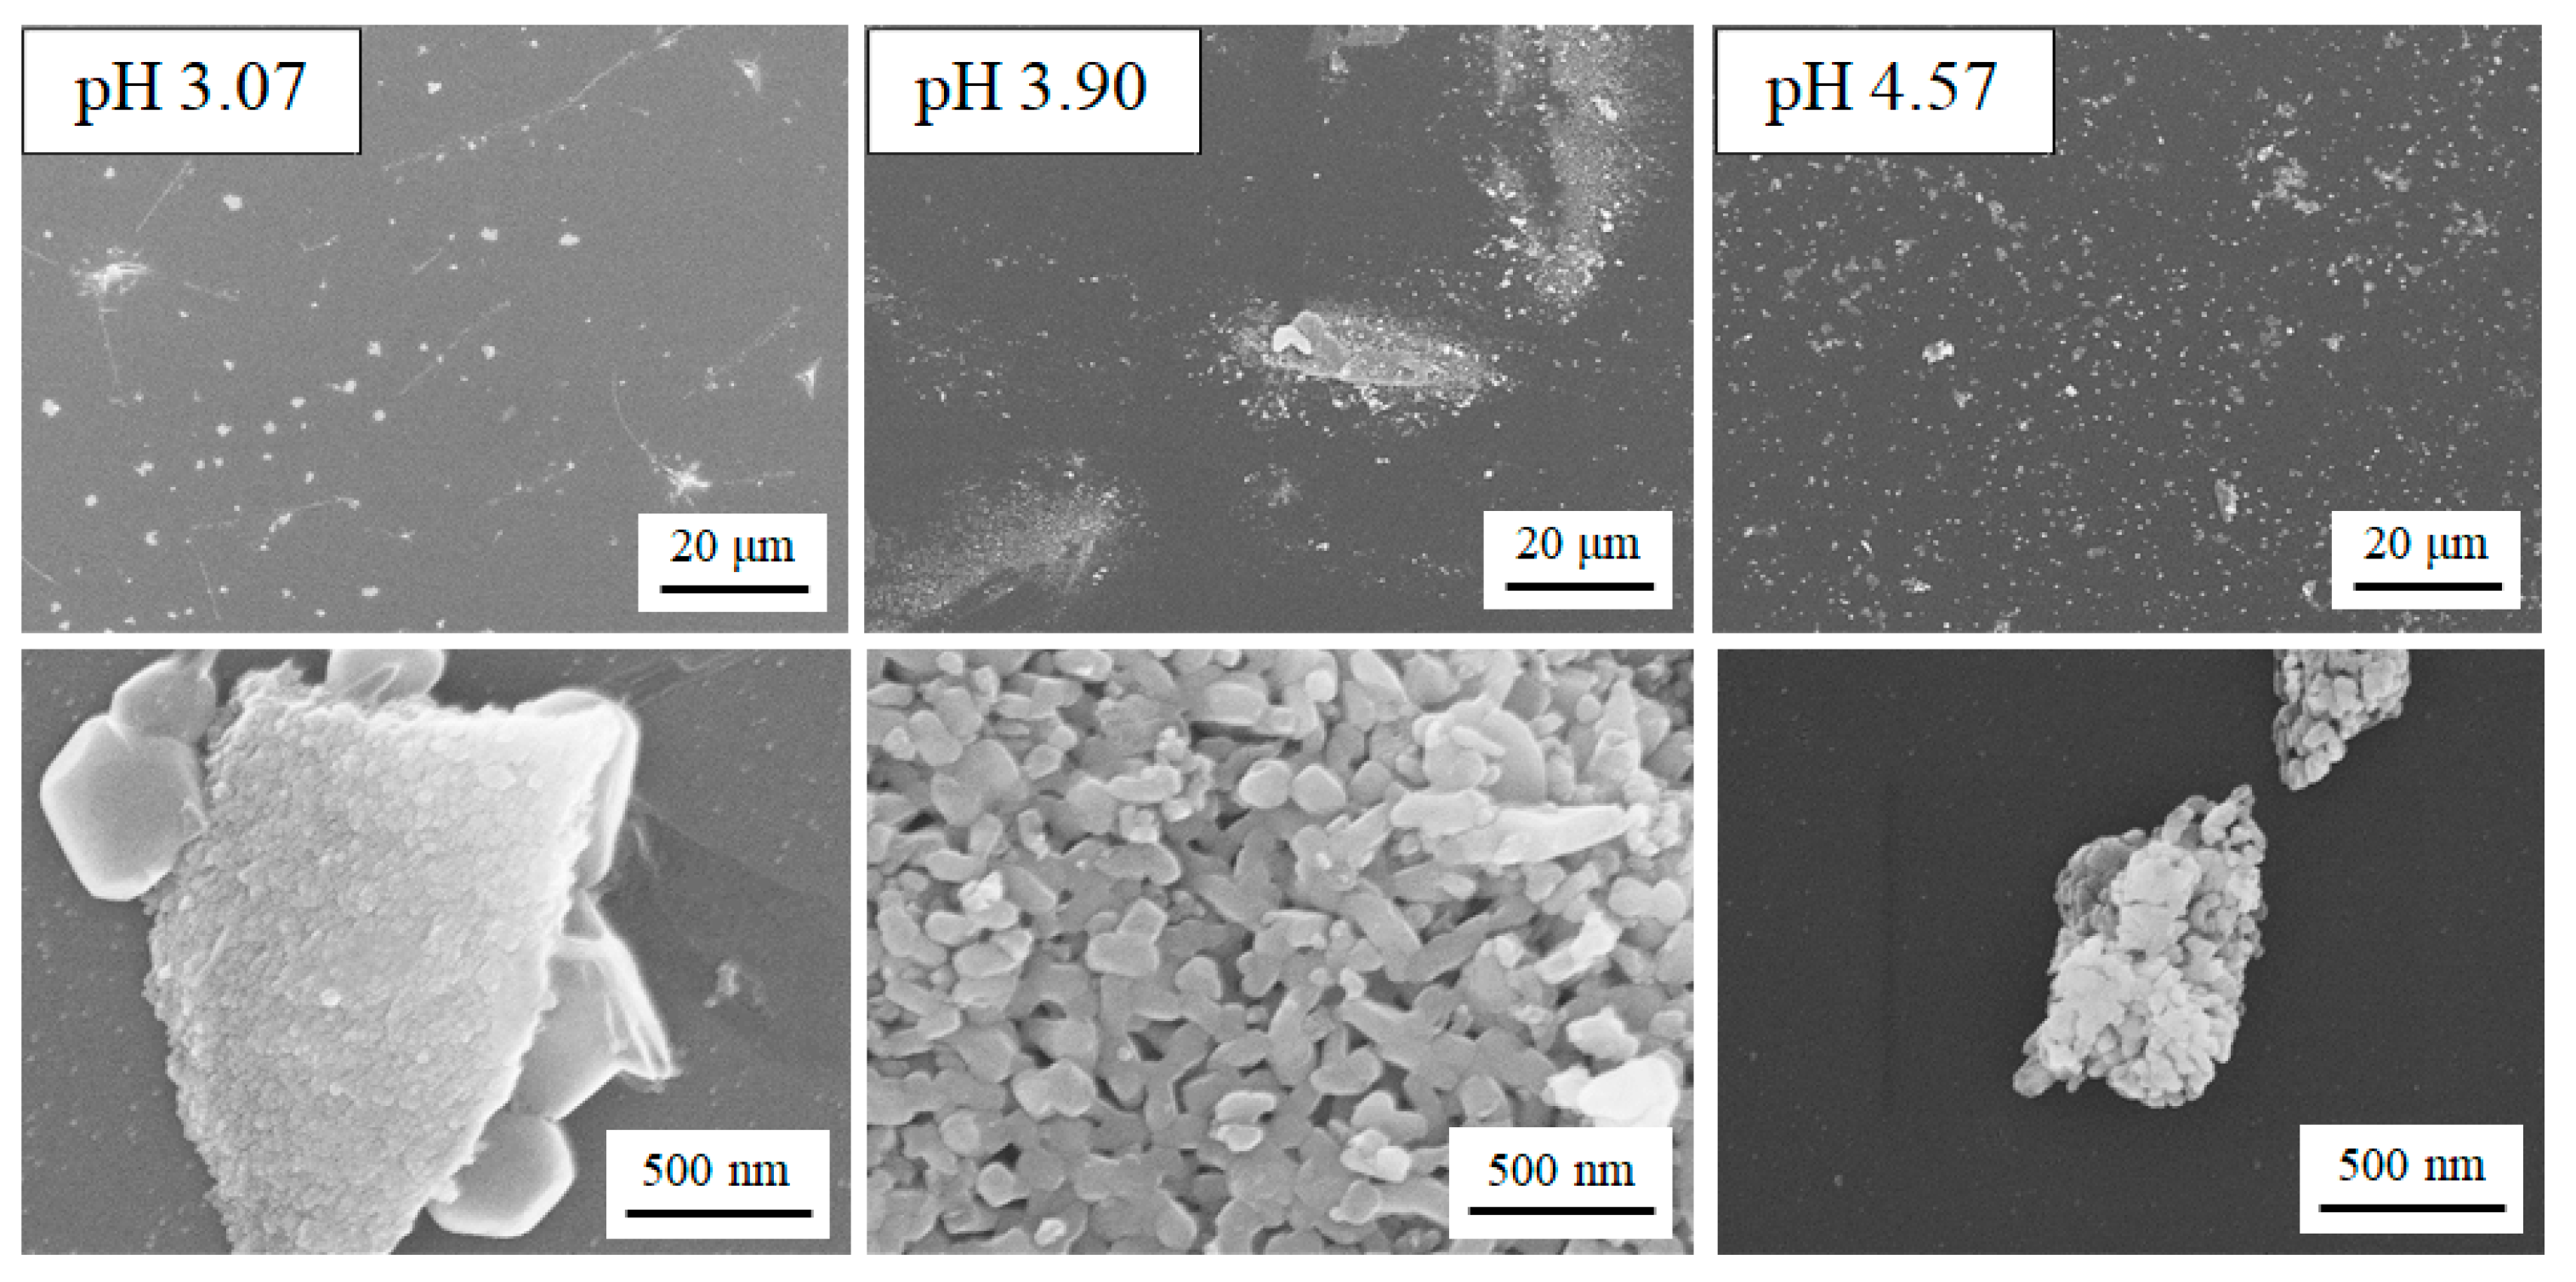
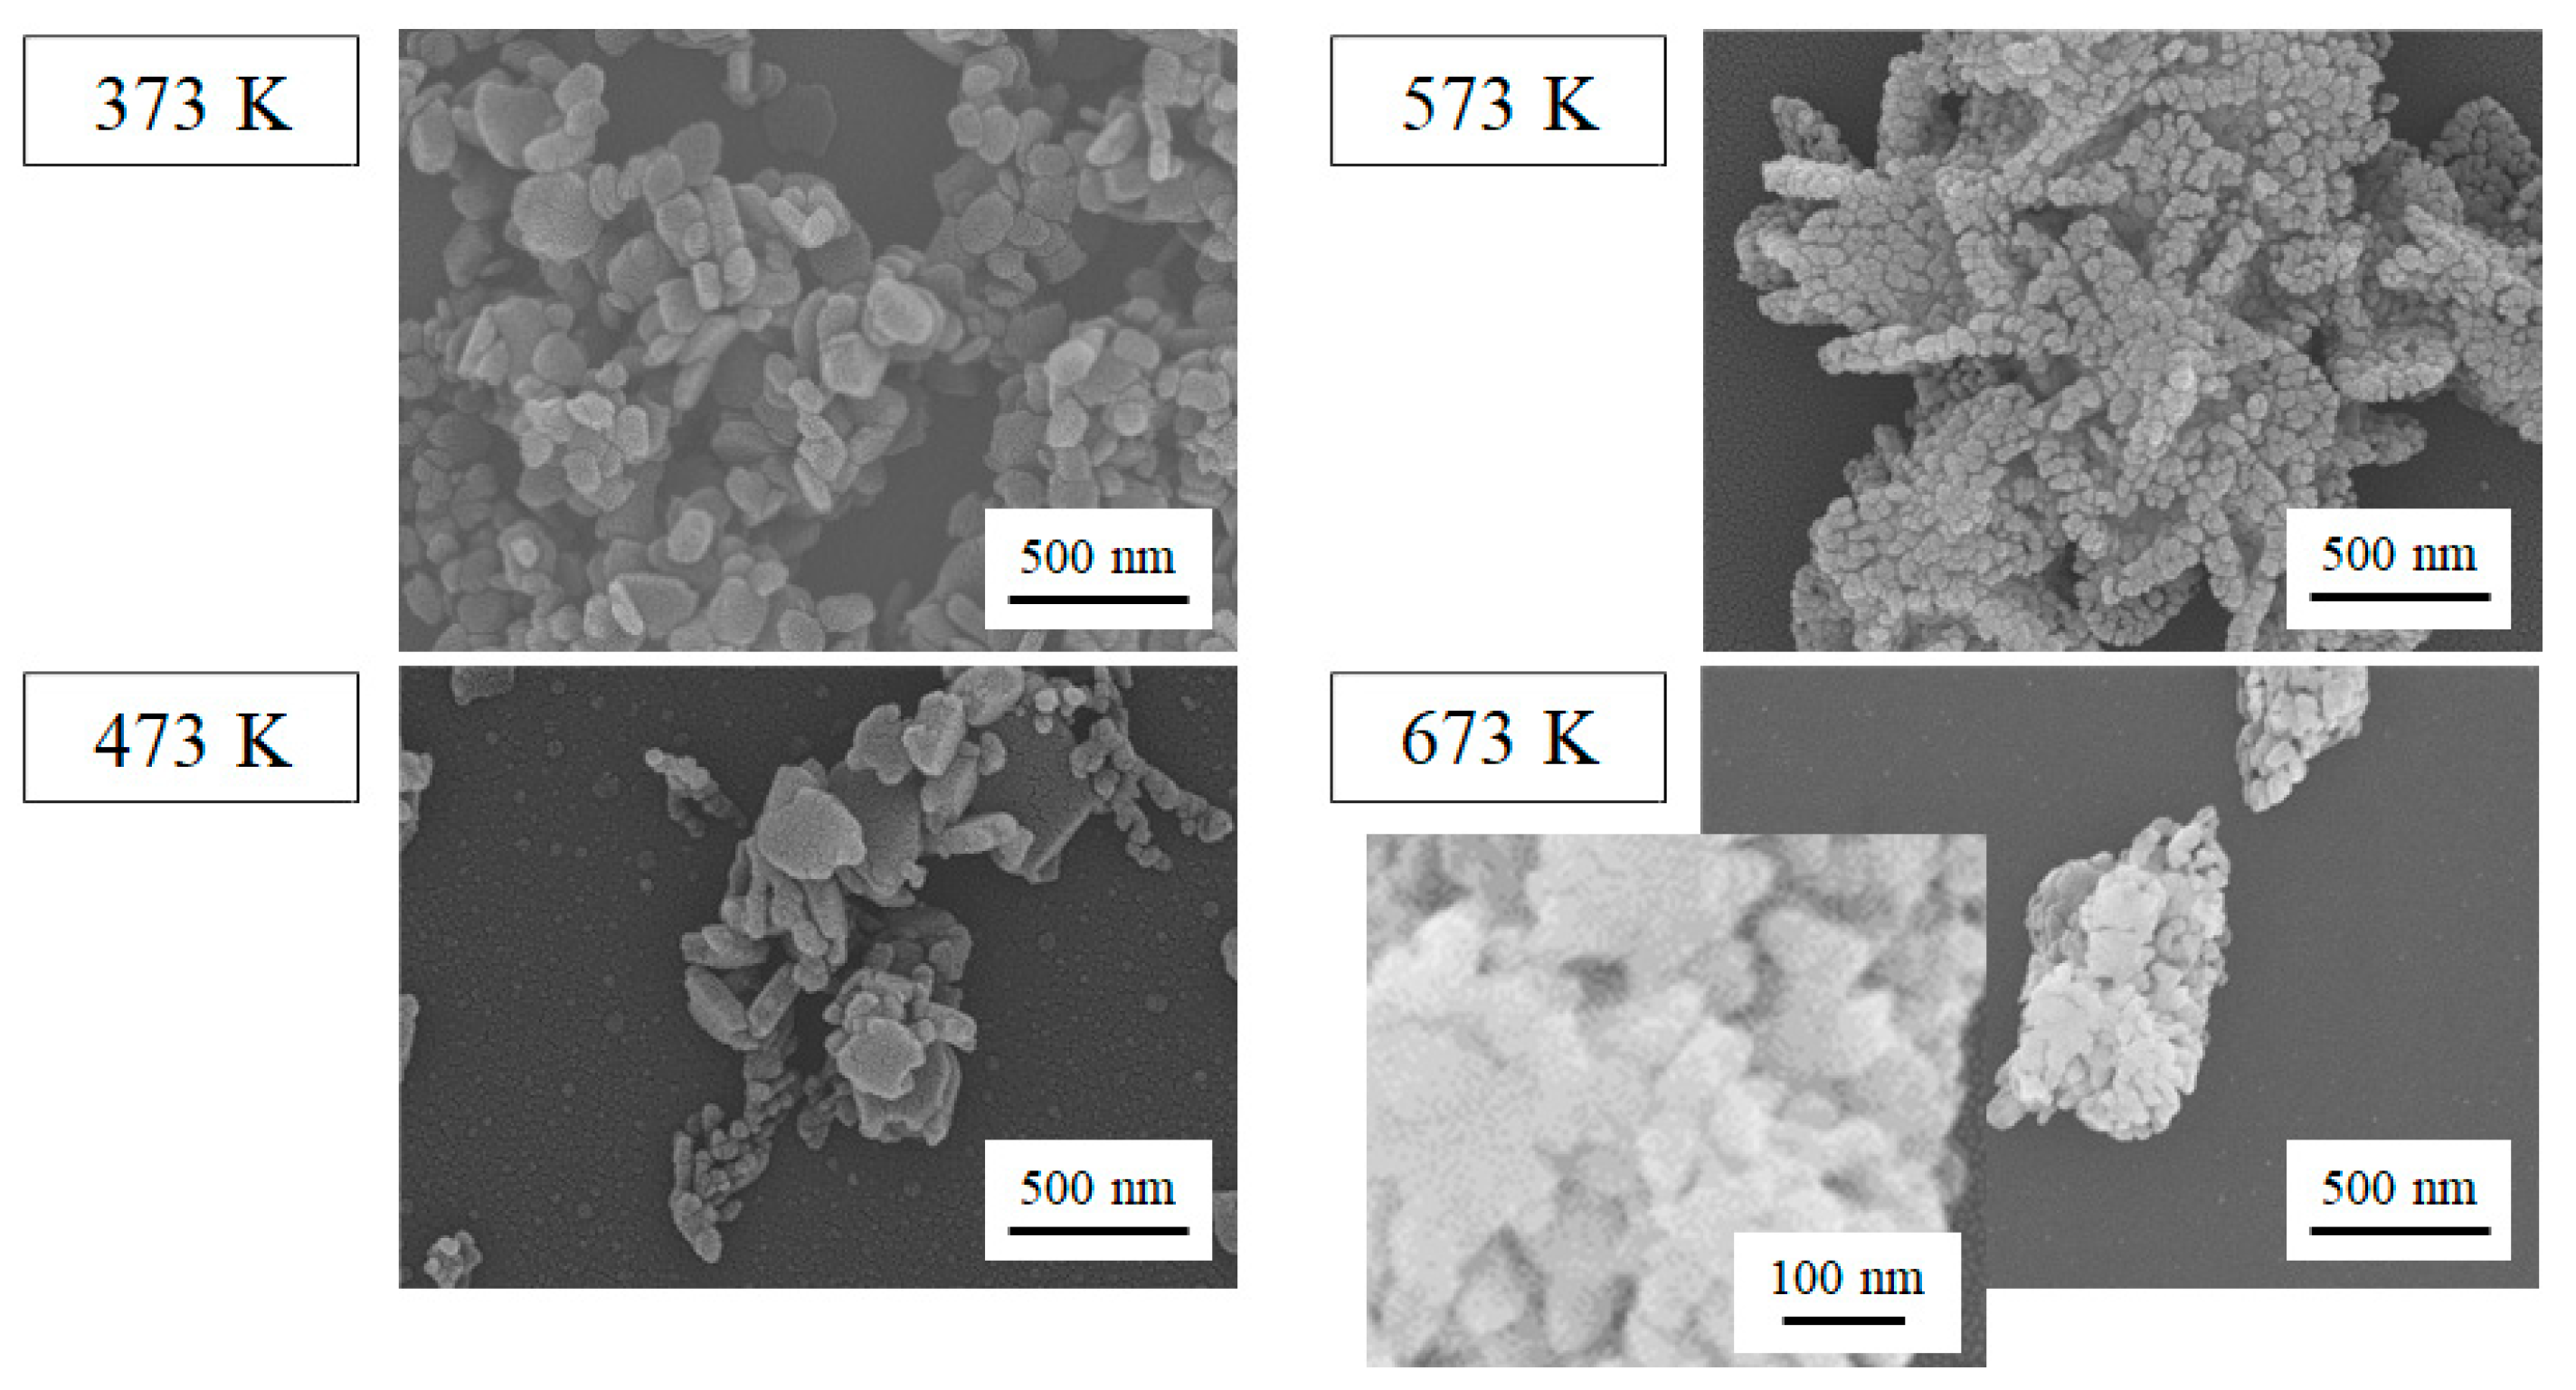
2.1. Characterization of the Film Surface
2.2. Photocatalytic Activity of the CuO-Modified TiO2 Powders
3. Materials and Methods
3.1. Sample Preparation
3.2. Measurements
4. Conclusions
Supplementary Materials
Author Contributions
Funding
Conflicts of Interest
References
- Yang, J.; Wang, D.; Han, H.; Li, C. Roles of cocatalysts in photocatalysis and photoelectrocatalysis. Acc. Chem. Res. 2013, 46, 1900–1909. [Google Scholar] [CrossRef]
- Ran, J.; Zhang, J.; Yu, J.; Jaroniec, M.; Qiao, S.Z. Earth-abundant cocatalysts for semiconductor-based photocatalytic water splitting. Chem. Soc. Rev. 2014, 43, 7787–7812. [Google Scholar] [CrossRef]
- Zhou, X.; Wu, J.; Li, Q.; Zeng, T.; Ji, Z.; He, P.; Pan, W.; Qi, X.; Wang, C.; Liang, P. Carbon decorated In2O3/TiO2 heterostructures with enhanced visible-light-driven photocatalytic activity. J. Catal. 2017, 355, 26–39. [Google Scholar] [CrossRef]
- Bandara, J.; Udawatta, C.P.K.; Rajapakse, C.S.K. Highly stable CuO incorporated TiO2 catalyst for photocatalytic hydrogen production from H2O. Photochem. Photobiol. Sci. 2005, 4, 857–861. [Google Scholar] [CrossRef]
- Choi, H.-J.; Kang, M. Hydrogen production from methanol/water decomposition in a liquid photosystem using the anatase structure of Cu loaded TiO2. Int. J. Hydrogen Energy 2007, 32, 3841–3848. [Google Scholar] [CrossRef]
- Li, G.; Dimitrijevic, N.M.; Chen, L.; Rajh, T.; Gray, K.A. Role of surface/interfacial Cu2+ sites in the photocatalytic activity of coupled CuO-TiO2 nanocomposites. J. Phys. Chem. C 2008, 112, 19040–19044. [Google Scholar] [CrossRef]
- Xu, S.; Sun, D.D. Significant improvement of photocatalytic hydrogen generation rate over TiO2 with deposited CuO. Int. J. Hydrogen Energy 2009, 34, 6096–6104. [Google Scholar] [CrossRef]
- Gombac, V.; Sordelli, L.; Montini, T.; Delgado, J.J.; Adamski, A.; Adami, G.; Cargnello, M.; Bernal, S.; Fornasiero, P. CuOx-TiO2 photocatalysts for H2 production from ethanol and glycerol solutions. J. Phys. Chem. A 2010, 114, 3916–3925. [Google Scholar] [CrossRef]
- Yu, J.; Ran, J. Facile preparation and enhanced photocatalytic H2-production activity of Cu(OH)2 cluster modified TiO2. Energy Environ. Sci. 2011, 4, 1364–1371. [Google Scholar] [CrossRef]
- Yu, J.; Hai, Y.; Jaroniec, M. Photocatalytic hydrogen production over CuO-modified titania. J. Colloid Interface Sci. 2011, 357, 223–228. [Google Scholar] [CrossRef]
- Wang, Z.; Liu, Y.; Martin, D.J.; Wang, W.; Tang, J.; Huang, W. CuOx–TiO2 junction: what is the active component for photocatalytic H2 production? Phys. Chem. Chem. Phys. 2013, 15, 14956–14960. [Google Scholar] [CrossRef]
- Yang, R.; Yang, L.; Tao, T.; Ma, F.; Xu, M.; Zhang, Z. Contrastive study of structure and photocatalytic performance with three-dimensionally ordered macroporous CuO–TiO2 and CuO/TiO2. Appl. Surface Sci. 2014, 288, 363–368. [Google Scholar] [CrossRef]
- Moniz, S.J.A.; Tang, J. Charge transfer and photocatalytic activity in CuO/TiO2 nanoparticle heterojunctions synthesised through a rapid, one-pot, microwave solvothermal route. ChemCatChem 2015, 7, 1659–1667. [Google Scholar] [CrossRef]
- Nagaya, S.; Nishikiori, H. Deposition of ZnO particles by photocatalytic reaction. Chem. Lett. 2012, 41, 993–995. [Google Scholar] [CrossRef]
- Nishikiori, H.; Nagaya, S.; Takikawa, T.; Kikuchi, A.; Yamakami, T.; Wagata, H.; Teshima, K.; Fujii, T. Formation of ZnO thin films by photocatalytic reaction. Appl. Catal. B 2014, 160–161, 651–657. [Google Scholar] [CrossRef]
- Nishikiori, H.; Fujiwara, S.; Miyagawa, S.; Zettsu, N.; Teshima, K. Crystal growth of titania by photocatalytic reaction. Appl. Catal. B 2017, 217, 241–246. [Google Scholar] [CrossRef]
- Nishikiori, H.; Matsunaga, S.; Iwasaki, M.; Zettsu, N.; Yamakawa, M.; Kikuchi, A.; Yamakami, T.; Teshima, K. Formation of silica nanolayer on titania surface by photocatalytic reaction. Appl. Catal. B 2019, 241, 299–304. [Google Scholar] [CrossRef]
- Sakai, N.; Fujishima, A.; Watanabe, T.; Hashimoto, K. Enhancement of the photoinduced hydrophilic conversion rate of TiO2 film electrode surfaces by anodic polarization. J. Phys. Chem. B 2001, 105, 3023–3026. [Google Scholar] [CrossRef]
- Sakai, N.; Fujishima, A.; Watanabe, T.; Hashimoto, K. Quantitative evaluation of the photoinduced hydrophilic conversion properties of TiO2 thin film surfaces by the reciprocal of contact angle. J. Phys. Chem. B 2003, 107, 1028–1035. [Google Scholar] [CrossRef]
- Nishikiori, H.; Tagami, K.; Matsunaga, S.; Teshima, K. In situ probing of photoinduced hydrophilicity on titania surface using dye molecules. ACS Omega 2019, 4, 5944–5949. [Google Scholar] [CrossRef]
- Bovio, B.; Locchi, S. Crystal structure of the orthorhombic basic copper nitrate, Cu2(OH)3NO3. J. Crystallogr. Spectrosc. Res. 1982, 12, 507–517. [Google Scholar] [CrossRef]
- Di, L.; Duan, D.; Zhan, Z.; Zhang, X. Gas–liquid cold plasma for synthesizing copper hydroxide nitrate nanosheets with high adsorption capacity. Adv. Mater. Interfaces 2016, 3, 1600760. [Google Scholar] [CrossRef]
- Schildermans, I.; Mullens, J.; Van der Veken, B.J.; Yperman, J.; Franco, D.; Van Poucke, L.C. Preparation and thermal decomposition of Cu2(OH)3NO3. Thermochimica Acta 1993, 224, 227–232. [Google Scholar] [CrossRef]
- Zhang, T.; Oyama, T.; Aoshima, A.; Hidaka, H.; Zhao, J.; Serpone, N. Photooxidative N-demethylation of methylene blue in aqueous TiO2 dispersions under UV irradiation. J. Photochem. Photobiol. A 2001, 140, 163–172. [Google Scholar] [CrossRef]
- Zhang, T.; Oyama, T.; Horikoshi, S.; Hidaka, H.; Zhao, J.; Serpone, N. Photocatalyzed N-demethylation and degradation of methylene blue in titania dispersions exposed to concentrated sunlight. Sol. Energy Mater. Sol. Cells 2002, 73, 287–303. [Google Scholar] [CrossRef]
- Hirakawa, T.; Nosaka, Y. Properties of O2•− and OH• formed in TiO2 aqueous suspensions by photocatalytic reaction and the influence of H2O2 and some ions. Langmuir 2002, 18, 3247–3254. [Google Scholar] [CrossRef]
- Hirakawa, T.; Yawata, K.; Nosaka, Y. Photocatalytic reactivity for O2•− and OH• radical formation in anatase and rutile TiO2 suspension as the effect of H2O2 addition. Appl. Catal. A 2007, 325, 105–111. [Google Scholar] [CrossRef]


| Cu(NO3)2/mmol dm−3 | 0.500 | 1.00 | 10.0 | 100 |
|---|---|---|---|---|
| Cu/Ti ratio | 0.22% | 0.67% | 1.30% | 7.98% |
| Cu(NO3)2/mmol dm−3 | 0 | 0.500 | 1.00 | 10.0 | 100 |
|---|---|---|---|---|---|
| Specific surface area (/m2 g−1) | 49 ± 5 | 52 ± 4 | 57 ± 3 | 40 ± 1 | 28 ± 1 |
© 2019 by the authors. Licensee MDPI, Basel, Switzerland. This article is an open access article distributed under the terms and conditions of the Creative Commons Attribution (CC BY) license (http://creativecommons.org/licenses/by/4.0/).
Share and Cite
Nishikiori, H.; Harata, N.; Yamaguchi, S.; Ishikawa, T.; Kondo, H.; Kikuchi, A.; Yamakami, T.; Teshima, K. Formation of CuO on TiO2 Surface Using its Photocatalytic Activity. Catalysts 2019, 9, 383. https://doi.org/10.3390/catal9040383
Nishikiori H, Harata N, Yamaguchi S, Ishikawa T, Kondo H, Kikuchi A, Yamakami T, Teshima K. Formation of CuO on TiO2 Surface Using its Photocatalytic Activity. Catalysts. 2019; 9(4):383. https://doi.org/10.3390/catal9040383
Chicago/Turabian StyleNishikiori, Hiromasa, Naoya Harata, Saho Yamaguchi, Takashi Ishikawa, Hayato Kondo, Ayaka Kikuchi, Tomohiko Yamakami, and Katsuya Teshima. 2019. "Formation of CuO on TiO2 Surface Using its Photocatalytic Activity" Catalysts 9, no. 4: 383. https://doi.org/10.3390/catal9040383
APA StyleNishikiori, H., Harata, N., Yamaguchi, S., Ishikawa, T., Kondo, H., Kikuchi, A., Yamakami, T., & Teshima, K. (2019). Formation of CuO on TiO2 Surface Using its Photocatalytic Activity. Catalysts, 9(4), 383. https://doi.org/10.3390/catal9040383