Article

Facet-Dependent Reactivity of Fe2O3/CeO2 Nanocomposites: Effect of Ceria Morphology on CO Oxidation

by
Maria Lykaki
1,
Sofia Stefa
1,
Sόnia A. C. Carabineiro
2,
Pavlos K. Pandis
3,
Vassilis N. Stathopoulos
3 and
Michalis Konsolakis
1,*
1
Industrial, Energy and Environmental Systems Lab (IEESL), School of Production Engineering and Management, Technical University of Crete, GR-73100 Chania, Greece
2
Laboratório de Catálise e Materiais (LCM), Laboratório Associado LSRE-LCM, Faculdade de Engenharia, Universidade do Porto, 4200-465 Porto, Portugal
3
Laboratory of Chemistry and Materials Technology, General Department, School of Sciences, National and Kapodistrian University of Athens, GR-34400 Psachna Campus, Evia, Greece
*
Author to whom correspondence should be addressed.
Catalysts 2019, 9(4), 371; https://doi.org/10.3390/catal9040371
Submission received: 19 March 2019 / Revised: 11 April 2019 / Accepted: 15 April 2019 / Published: 19 April 2019

Abstract

:
Ceria has been widely studied either as catalyst itself or support of various active phases in many catalytic reactions, due to its unique redox and surface properties in conjunction to its lower cost, compared to noble metal-based catalytic systems. The rational design of catalytic materials, through appropriate tailoring of the particles’ shape and size, in order to acquire highly efficient nanocatalysts, is of major significance. Iron is considered to be one of the cheapest transition metals while its interaction with ceria support and their shape-dependent catalytic activity has not been fully investigated. In this work, we report on ceria nanostructures morphological effects (cubes, polyhedra, rods) on the textural, structural, surface, redox properties and, consequently, on the CO oxidation performance of the iron-ceria mixed oxides (Fe2O3/CeO2). A full characterization study involving N2 adsorption at –196 °C, X-ray diffraction (XRD), transmission electron microscopy (TEM), scanning electron microscopy-energy dispersive X-ray spectroscopy (SEM-EDS), temperature programmed reduction (TPR), and X-ray photoelectron spectroscopy (XPS) was performed. The results clearly revealed the key role of support morphology on the physicochemical properties and the catalytic behavior of the iron-ceria binary system, with the rod-shaped sample exhibiting the highest catalytic performance, both in terms of conversion and specific activity, due to its improved reducibility and oxygen mobility, along with its abundance in Fe2+ species.

1. Introduction

Ceria (CeO2), or cerium oxide, has been extensively used in a variety of catalytic applications such as oxidation processes, steam reforming, water-gas shift reaction, reduction of NOx, among others [1,2,3]. Ceria’s unique properties, such as improved thermal stability, high oxygen storage capacity (OSC), and oxygen mobility render it an exceptional component for ceria-based catalytic materials [2,4,5,6]. Actually, its ability to switch between the oxidation states Ce3+ and Ce4+, supplemented by the formation of surface defects, such as oxygen vacancies, is accounted for its enhanced redox properties [2,3,7,8]. Such a behavior is identified in other oxide systems such as manganese oxides [9,10,11] and perovskites [12,13], but ceria still remains one of the best redox materials [14].
Recent studies [14,15,16,17,18,19,20,21,22,23] have focused on the synthesis of nanostructured materials with well-defined morphology. By tailoring particles’ shape and size, certain crystal facets can be exposed, leading to different structural and redox properties, hence, resulting in improved catalytic activity [8,15,17,19]. In fact, it has been shown that the anionic vacancies energy formation strongly depends on the exposed facets, following the order: {111} > {100} > {110}.
In addition, as the crystallite size decreases, materials in the nanoscale exhibit a plethora of oxygen defects and enhanced catalytic performance [7]. It has been revealed that there is a strong dependence between support morphology and catalytic activity, a fact showing the significance of the fine-tuning of ceria with predefined textural and structural characteristics [17,18,21,22].
Several reports [22,24,25,26,27,28,29] have shown that the introduction of transition metal oxides into the ceria lattice improves the catalytic performance of the mixed oxides compared to bare ones because of the “synergistic” effect induced by the interactions between the oxide phases, a phenomenon that has not been fully comprehended. In this regard, it is of great importance to develop cost-effective and highly efficient catalysts based on iron oxide (Fe2O3), which is considered to be one of the cheapest metal oxides [30]. Among the various catalytic systems, iron-ceria mixed oxides have been studied in several catalytic reactions, such as oxidation processes [30,31,32,33,34], reduction processes [35,36], decomposition reactions [37,38], soot combustion [39,40], etc.
However, the Fe2O3/CeO2 binary system has not been extensively investigated in relation to the support shape dependence of catalytic activity, which is a highly engaging topic. To fully address this, most of the studies concern the effect of iron content [39,41], calcination temperature [42], or the distribution of iron ions in solid solutions [43] of Fe-doped CeO2 catalysts. Moreover, others have focused on the improvement of OSC and oxygen mobility of iron-doped ceria catalysts [44]. In a similar manner, Bao et al. [31] investigated the oxidation of CO in Fe2O3/CeO2 catalysts from the perspective of solid solution formation and surface oxygen vacancies.
Only a few studies have focused on the Fe2O3/CeO2 system from the perspective of ceria shape effect. For instance, Torrente-Murciano et al. [45] have shown that the control of support morphology in the hydrogenation of CO2 to hydrocarbons leads to the exposure of different crystal facets, resulting in enhanced metal-support interactions, a fact corroborated by the reducibility studies. The structure-dependent catalytic performance of iron-ceria nanorods and nanopolyhedra for NO reduction has been studied, and this dependence was mainly attributed to the exposed facets of ceria nanoshapes, along with the synergistic effect between iron and ceria [35]. Furthermore, the support role on the decomposition of sulfuric acid has been studied through the development of a series of supported iron oxide-based catalysts [37]. Also, Sudarsanam et al. [40] studied the role of support morphology in copper-ceria and iron-ceria nanorods for diesel soot combustion, and revealed an abundance in oxygen vacancies in both catalytic systems, with copper-ceria nanorods, however, exhibiting the best catalytic performance, which was ascribed to the high reducibility of ceria and the large amount of acid sites.
Despite the various studies regarding the iron-ceria mixed oxides, there is still plenty of room to elaborate on the morphology dependence of catalytic activity. In the present work, three different ceria nanostructures (nanorods (ΝR), nanopolyhedra (NP), nanocubes (NC)) were hydrothermally synthesized and used as supports for the iron oxide phase (Fe2O3/CeO2). For comparison purposes, two additional samples were investigated: bare iron oxide sample prepared by thermal decomposition (Fe2O3-D) and iron-ceria mixed oxide prepared by a physical mixture of Fe2O3-D and CeO2-NR (Fe2O3-D + CeO2-NR). Several characterization techniques, namely N2 adsorption at –196 °C (Brunauer–Emmett–Teller (BET) method), X-ray diffraction (XRD), transmission electron microscopy (TEM), temperature programmed reduction using H2 (H2-TPR), and X-ray photoelectron spectroscopy (XPS), have been employed in order to gain insight into the effect of support morphology on the textural, structural, redox, surface properties and, consequently, on the catalytic performance of the iron-ceria binary system. The oxidation of CO was employed as probe reaction in order to disclose structure–activity relationships.

2. Results and Discussion

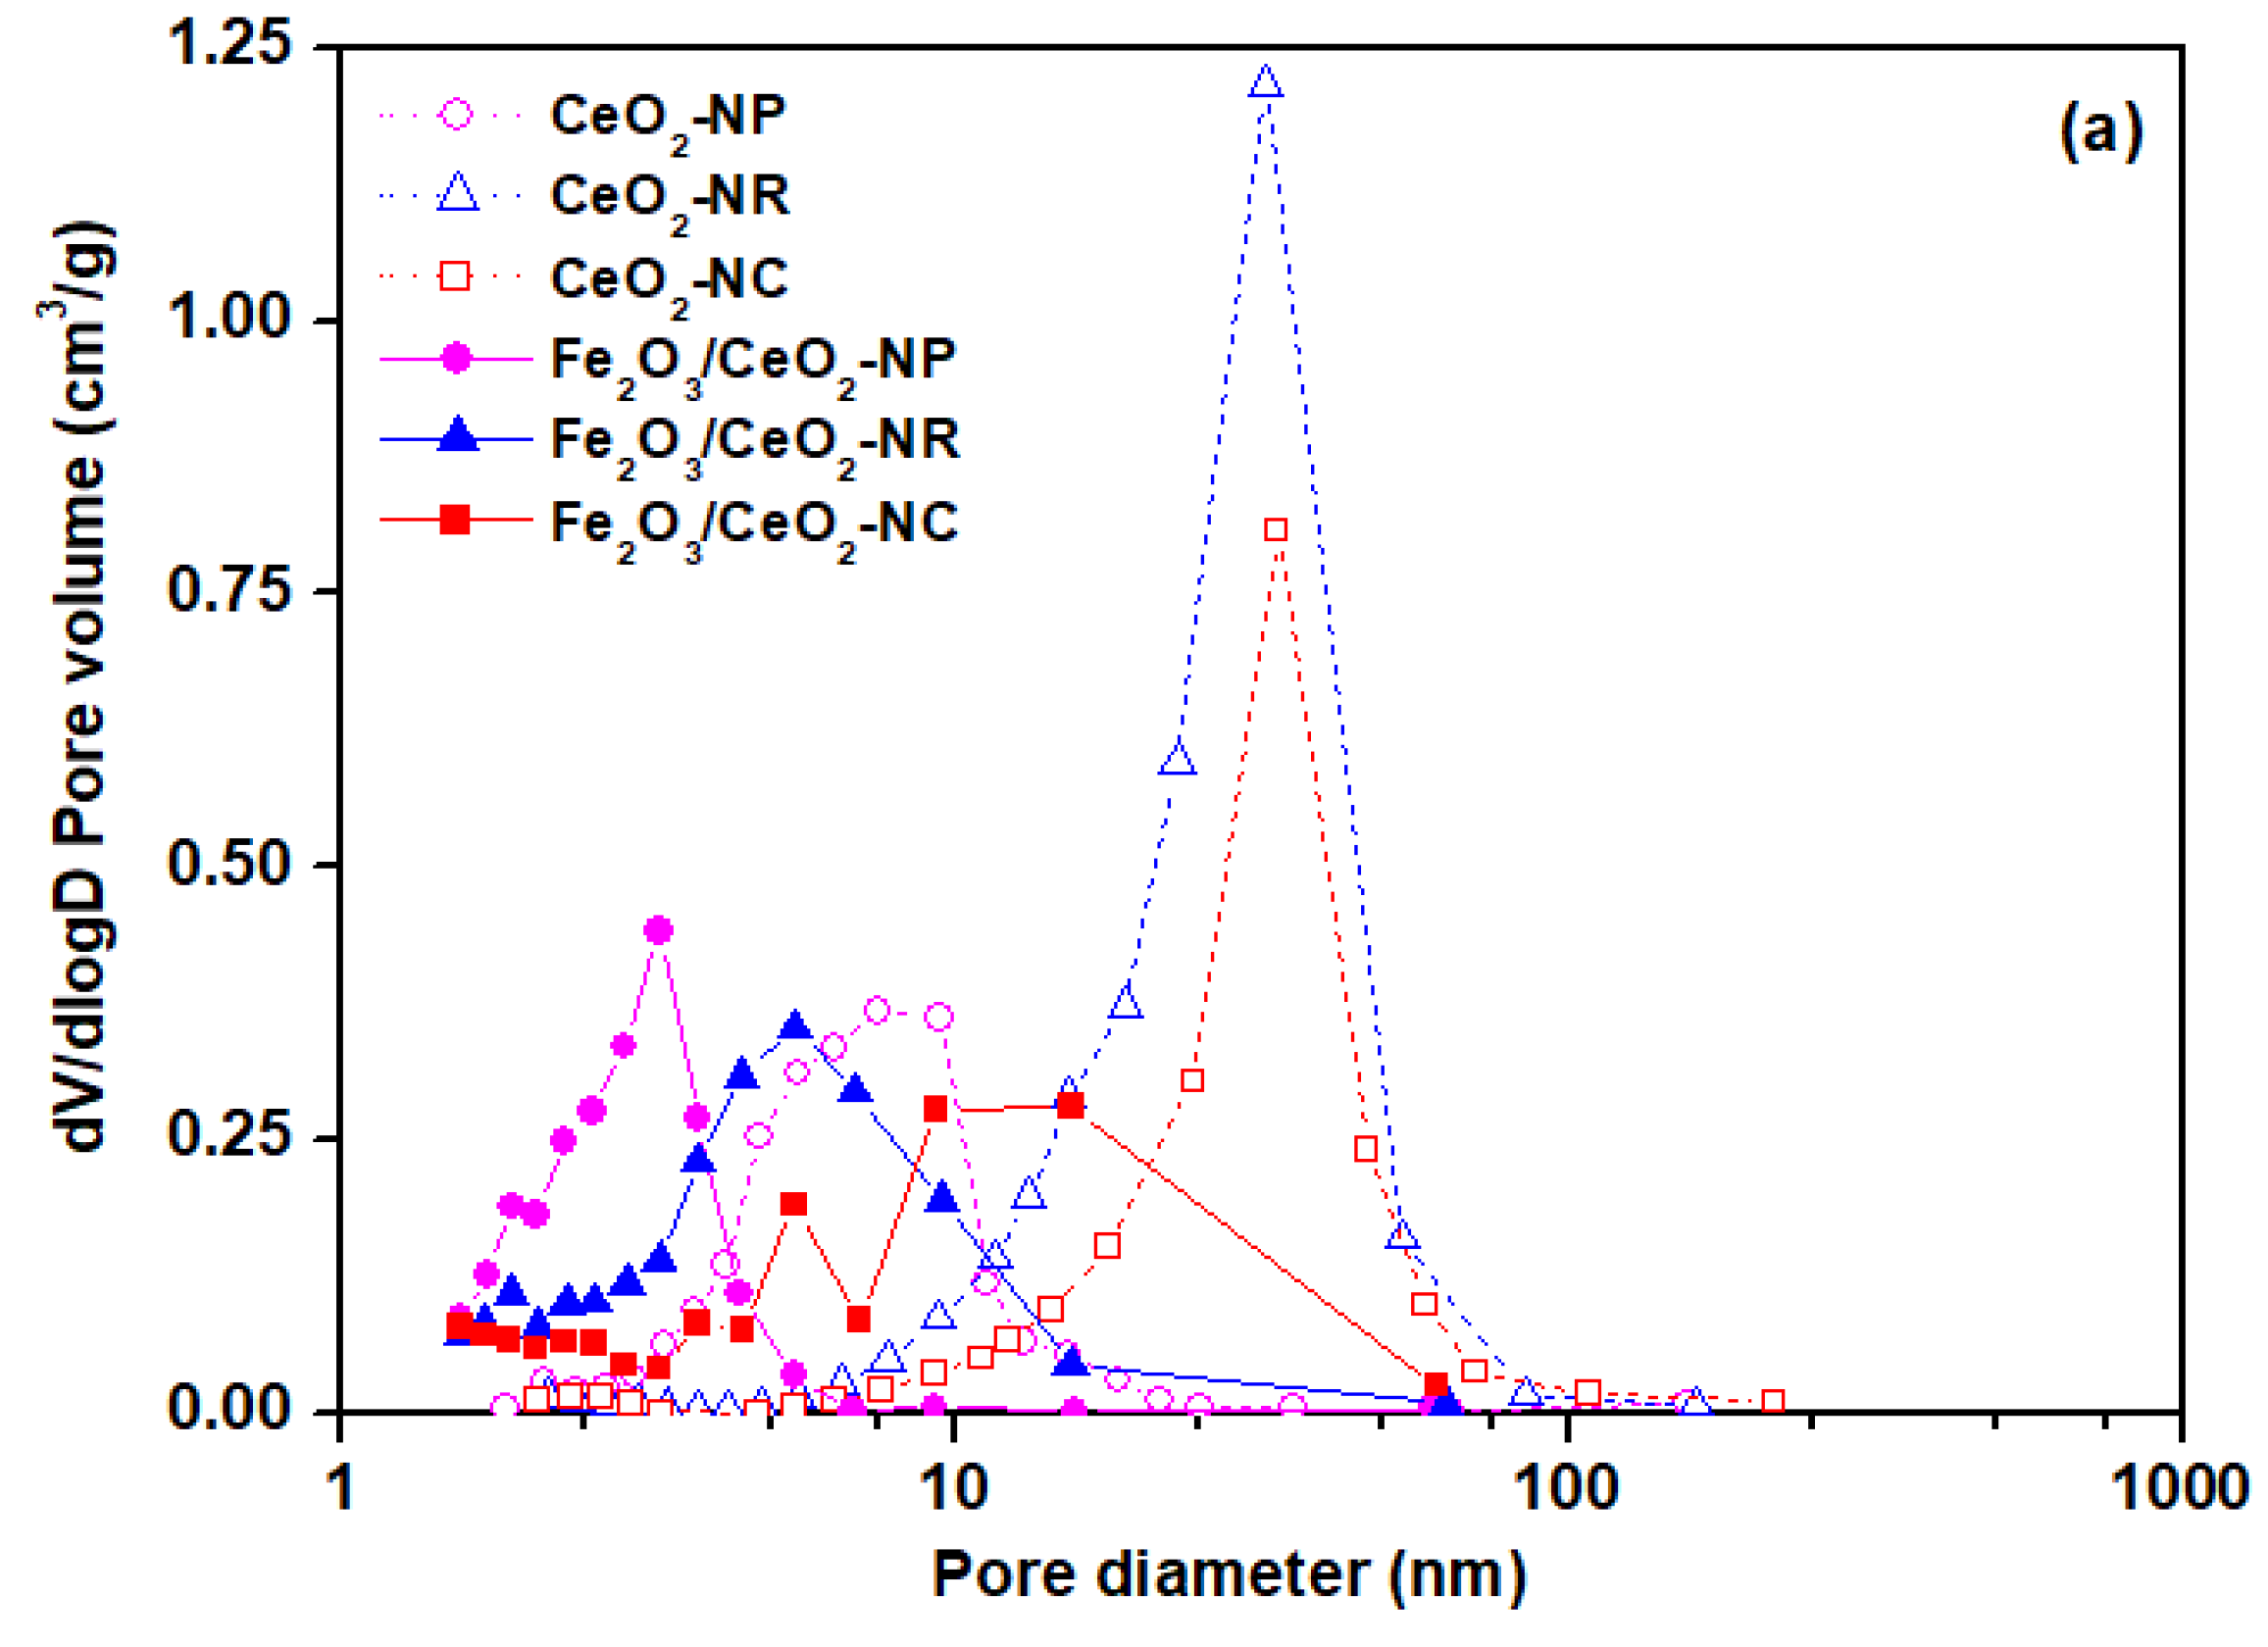
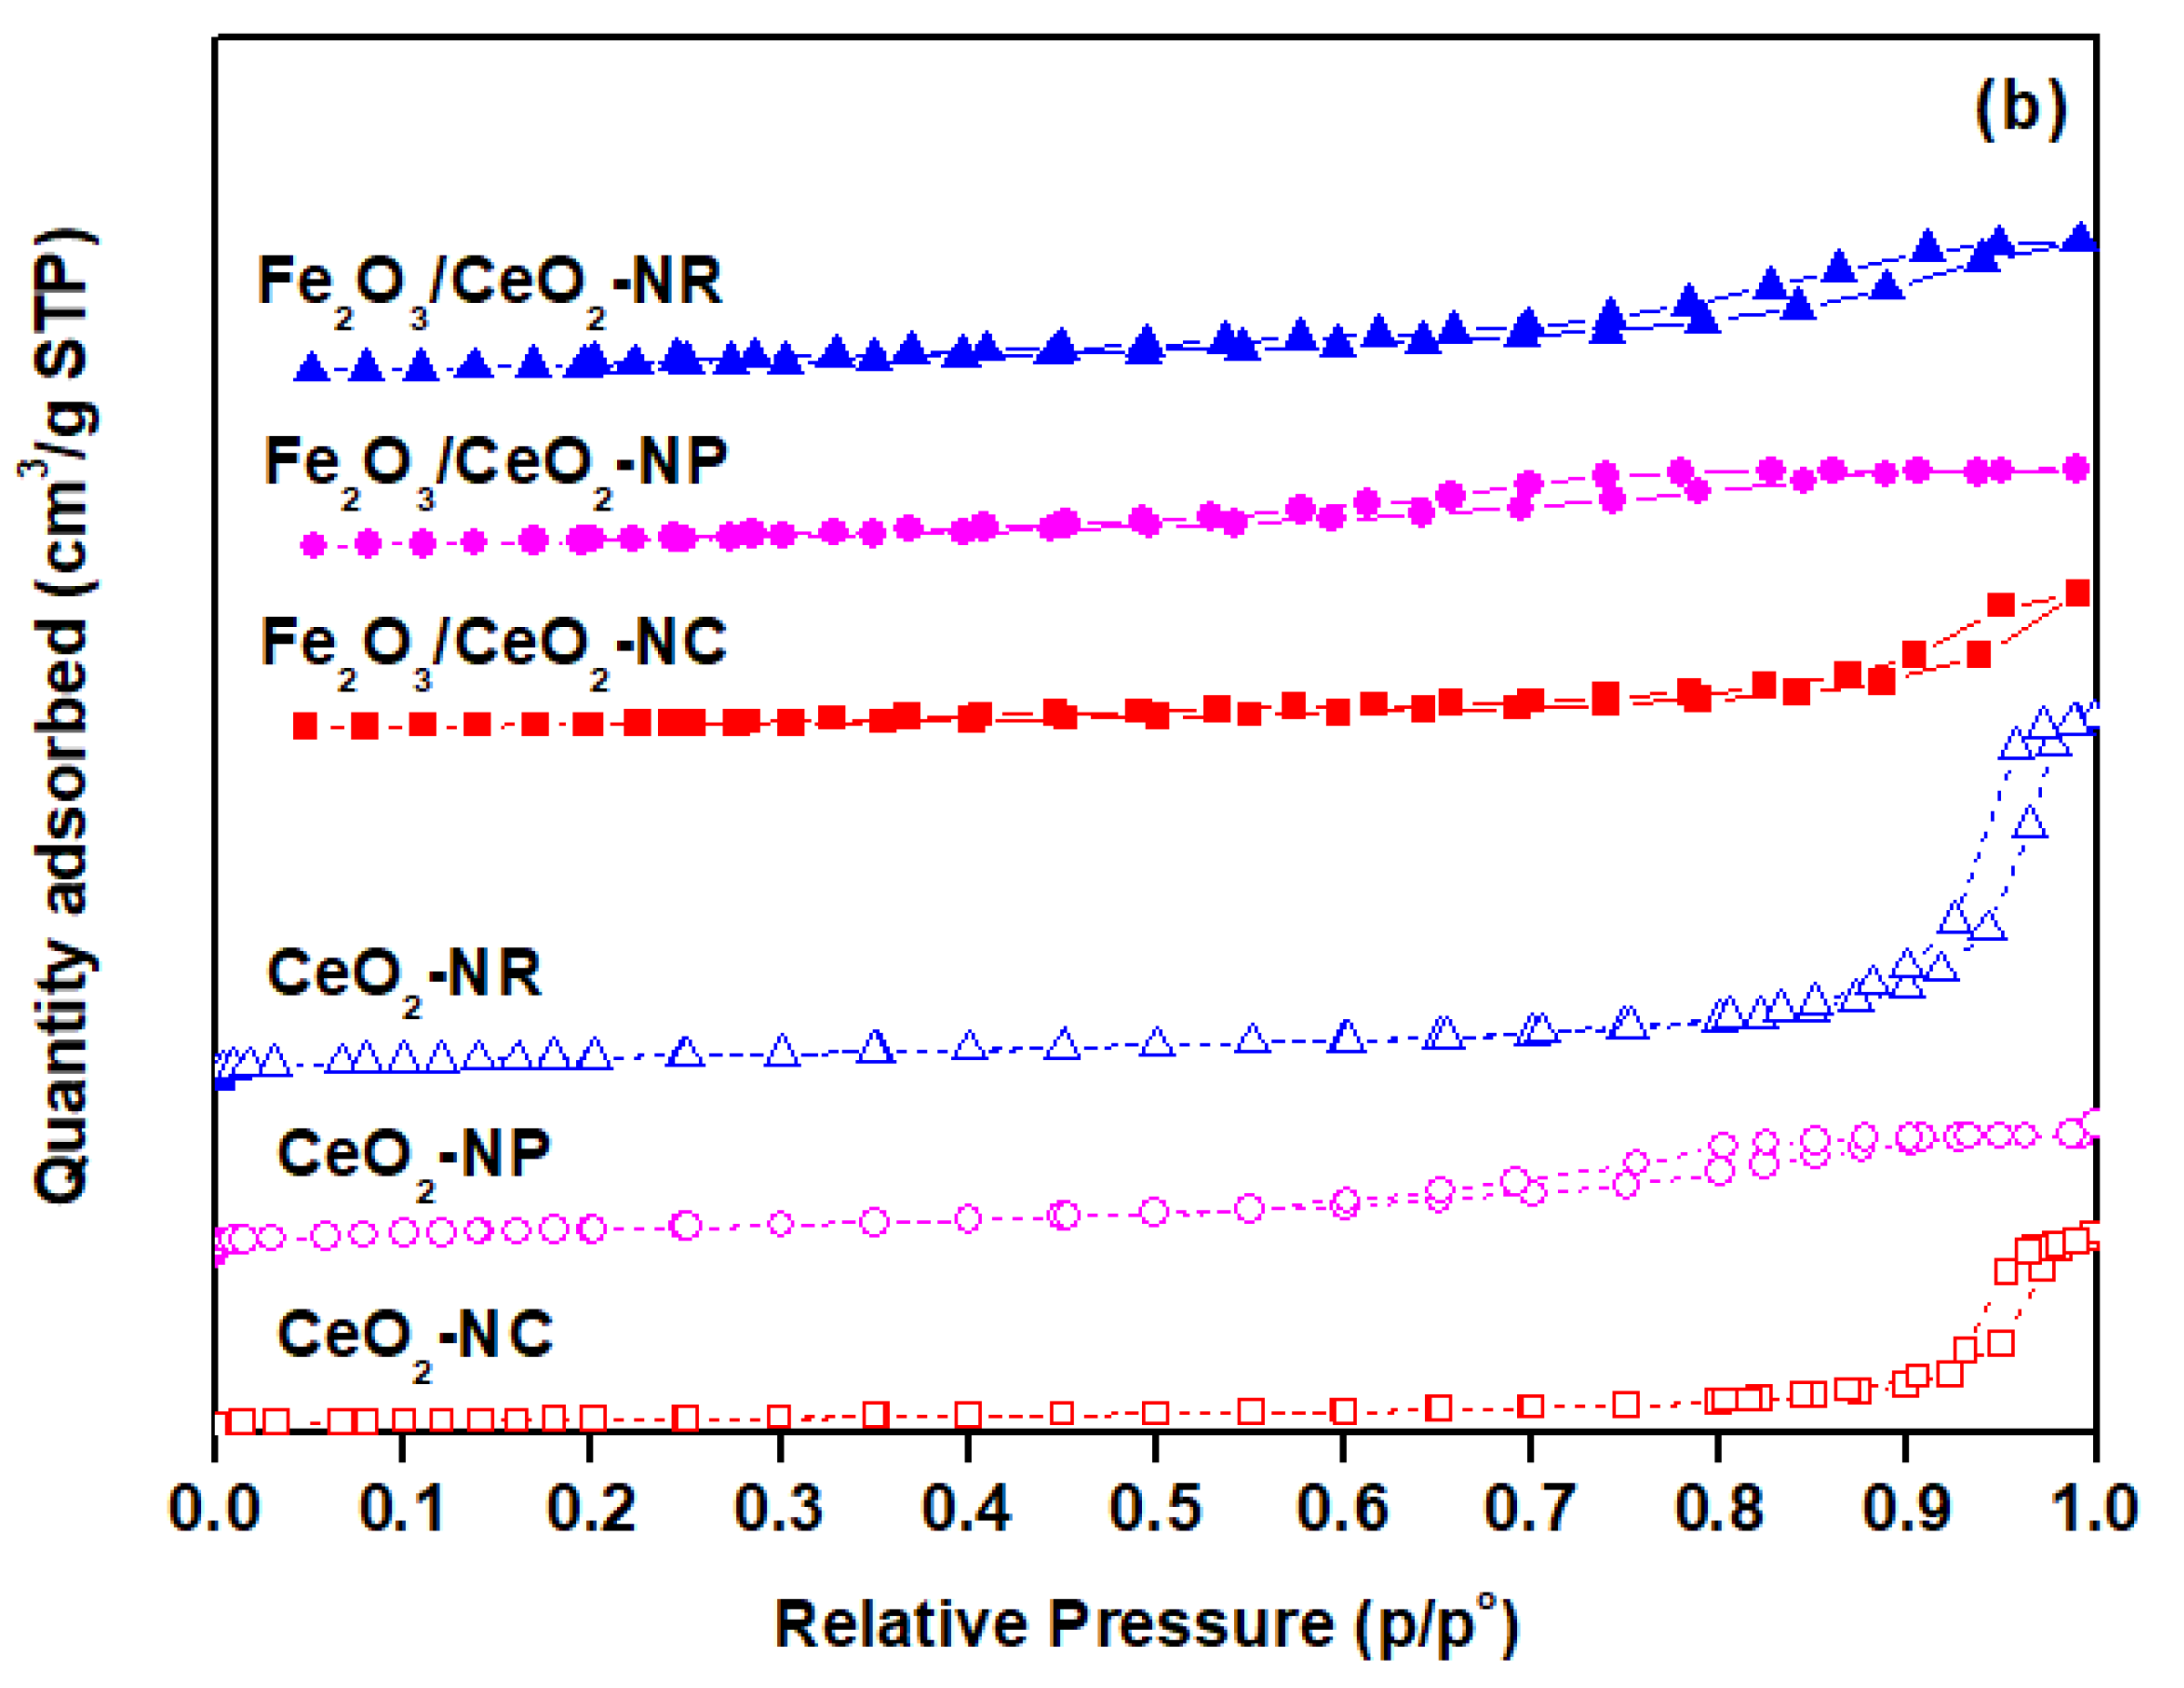
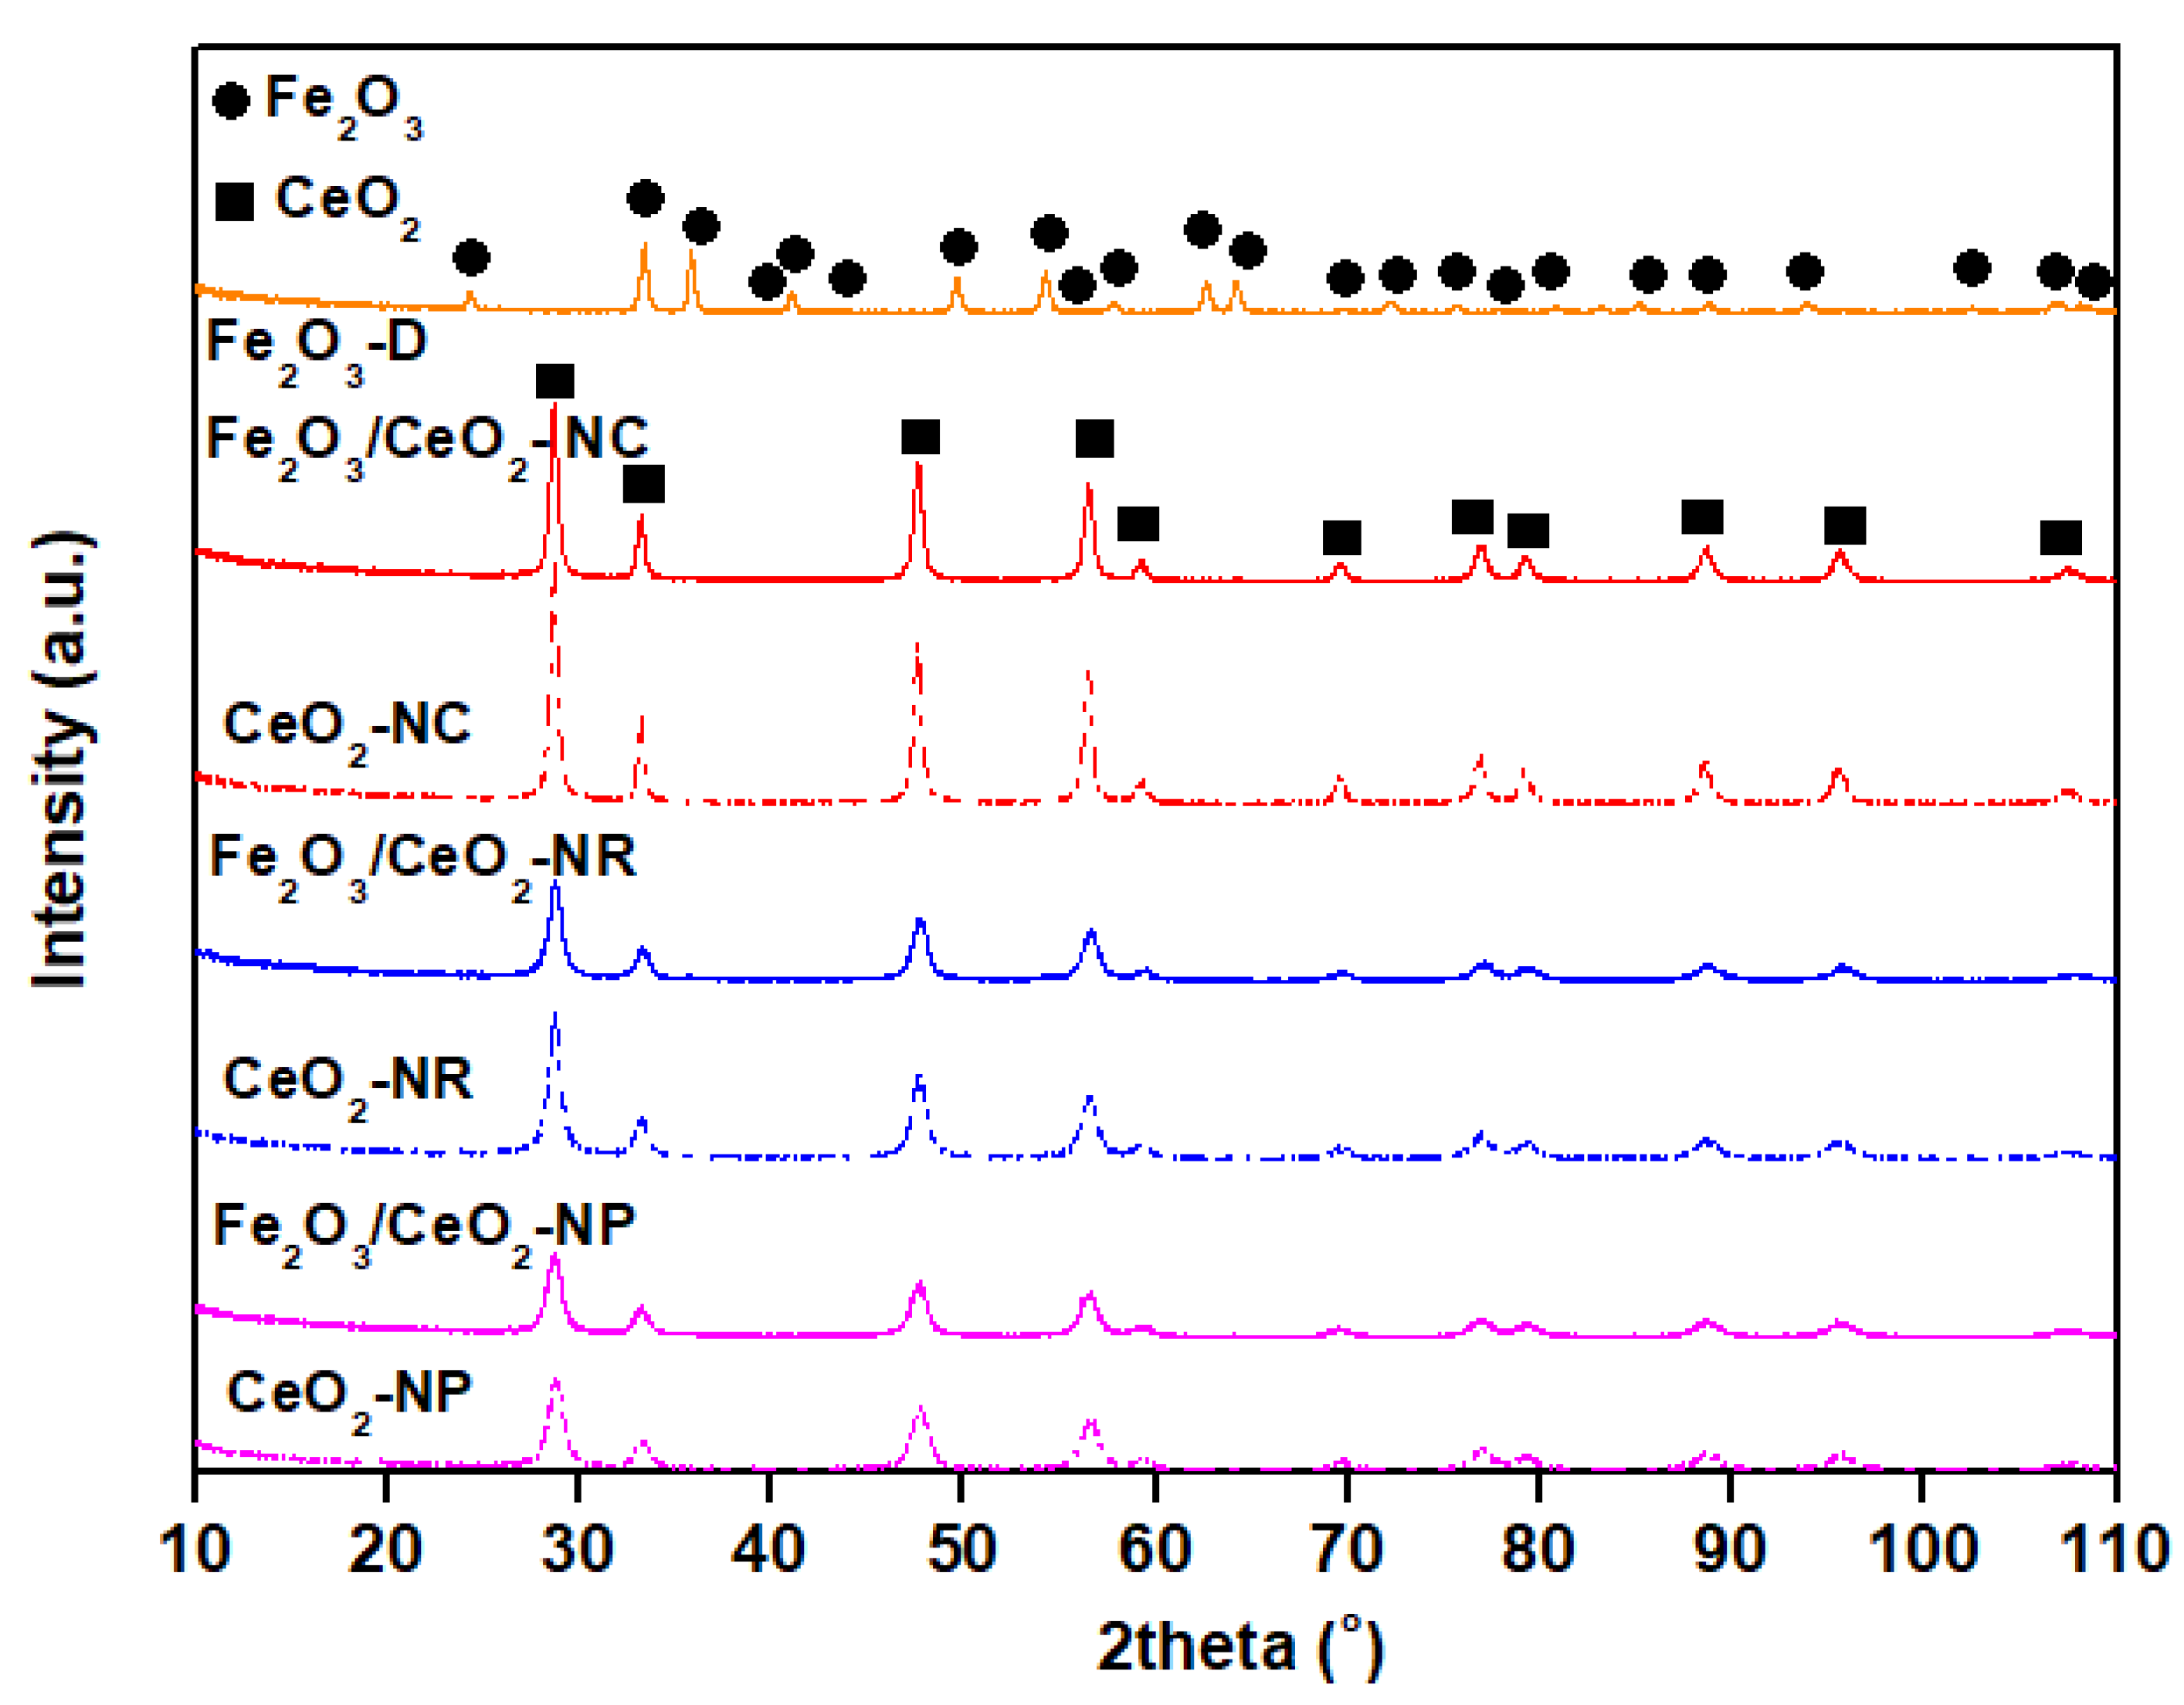
2.1. Textural and Structural Characteristics (BET/XRD)

The main textural/structural characteristics of bare ceria and Fe2O3/CeO2 samples are summarized in Table 1. On the basis of the BET surface area, the following order was obtained for the bare ceria samples: CeO2-NP (87.9 m2/g) > CeO2-NR (79.3 m2/g) > CeO2-NC (37.3 m2/g). A decrease in the surface area was observed by the addition of iron into the ceria support, with the Fe2O3/CeO2-NR sample exhibiting the highest BET surface area (68.6 m2/g), accompanied by Fe2O3/CeO2-NP (64.2 m2/g) and Fe2O3/CeO2-NC (32.2 m2/g).
Figure 1a shows the Barrett–Joyner–Halenda (BJH) desorption pore size distribution (PSD) of as-prepared samples. The corresponding adsorption–desorption isotherms are depicted in Figure 1b. In all cases, maxima at pore diameters higher than 3 nm are obtained, implying the presence of mesopores which can be further corroborated by the existence of adsorption–desorption isotherms of type IV with hysteresis loop at a relative pressure above 0.5 (Figure 1b) [33,35,46,47]. As observed in Table 1 and Figure 1a, the incorporation of iron into the ceria lattice results in a decrease in pore volume and average pore diameter, with the sample of rod-like morphology exhibiting the highest reduction percentages (60% and 53%, respectively), while nanocubes and nanopolyhedra show a much lower percentage decrease, namely 27% and 29% in pore volume and 15% and 3.8% in average pore diameter, respectively.
The obtained order in BET surface can be mainly interpreted on the basis of the different pore volume and pore size distribution of ceria and iron-ceria samples. In particular, CeO2-NR and CeO2-NP possess a pore volume of 0.48 and 0.17 cm3/g, respectively, exhibiting, however, a completely different pore size distribution (mean pore size at 24.2 and 7.9 nm, respectively, Figure 1a). On the other hand, CeO2-NC exhibits an intermediate pore volume (0.26 cm3/g) along with a higher mean pore size (27.4 nm). These differences in pore volume and pore size distribution, linked to different ceria morphologies, can be mainly accounted for the observed variations in BET surface area. Moreover, it is worth noticing that the BET surface area follows, in general, the reverse order of the crystallite size of both CeO2 and Fe2O3 phases (Table 1), i.e., the larger the crystallite size the lower the BET surface area.
The XRD patterns of all samples are demonstrated in Figure 2. The main peaks can be indexed to (111), (200), (220), (311), (222), (400), (331), (420), (422), (511), and (440) planes which are attributed to ceria face-centered cubic fluorite structure (Fm3m symmetry, no. 225) [48,49,50]. In the Fe2O3-D sample, the peaks observed correspond to (012), (104), (110), (006), (113), (202), (024), (116), (018), (122), (214), (300), (208), (119), (220), (036), (312), (134), (226), (042), (232), (324), and (410) planes of the hematite phase [51]. There are two very small peaks at 2θ values ~35.96 and 54.26° in Fe2O3/CeO2 samples which correspond to the hematite (Fe2O3) phase (JCPDS card 33-0664) [40,52]. However, the peak at 2θ 41.03° present in the Fe2O3-D sample, which is attributed to the hematite phase [40], is not observed in the mixed oxides. The peaks are characteristic of the cerianite and hematite phases in accordance with the nominal composition of the mixed oxides (Table 1). By applying the Williamson–Hall plot after Rietveld refinement of diffractograms, the average crystallite sizes of cerianite and hematite phases were calculated (Table 1). In particular, the CeO2 crystallite size is 27.0, 15.0, and 11.0 nm for CeO2-NC, CeO2-NR, and CeO2-NP, respectively, following the same order in Fe2O3/CeO2 samples, i.e., 16.8, 9.7, and 8.5 nm for Fe2O3/CeO2-NC, Fe2O3/CeO2-NR, and Fe2O3/CeO2-NP, respectively. Taking into account the crystallite size of iron oxide phase, the following order was obtained: Fe2O3/CeO2-NC (52.3 nm) > Fe2O3/CeO2-NP (16.5 nm) > Fe2O3/CeO2-NR (7.2 nm). The lower crystallite size of ceria in Fe2O3/CeO2 samples as compared to bare ceria samples should be mentioned. The addition of iron ions through the wet impregnation method and the subsequent calcination of iron-ceria composites could be considered responsible for the decrease of ceria crystallite size. In a similar manner, the high dispersibility of the iron-ceria mixed oxides and/or the formation of solid solutions have been considered as contributing factors to this decrease in ceria crystallite size [53,54,55,56,57].

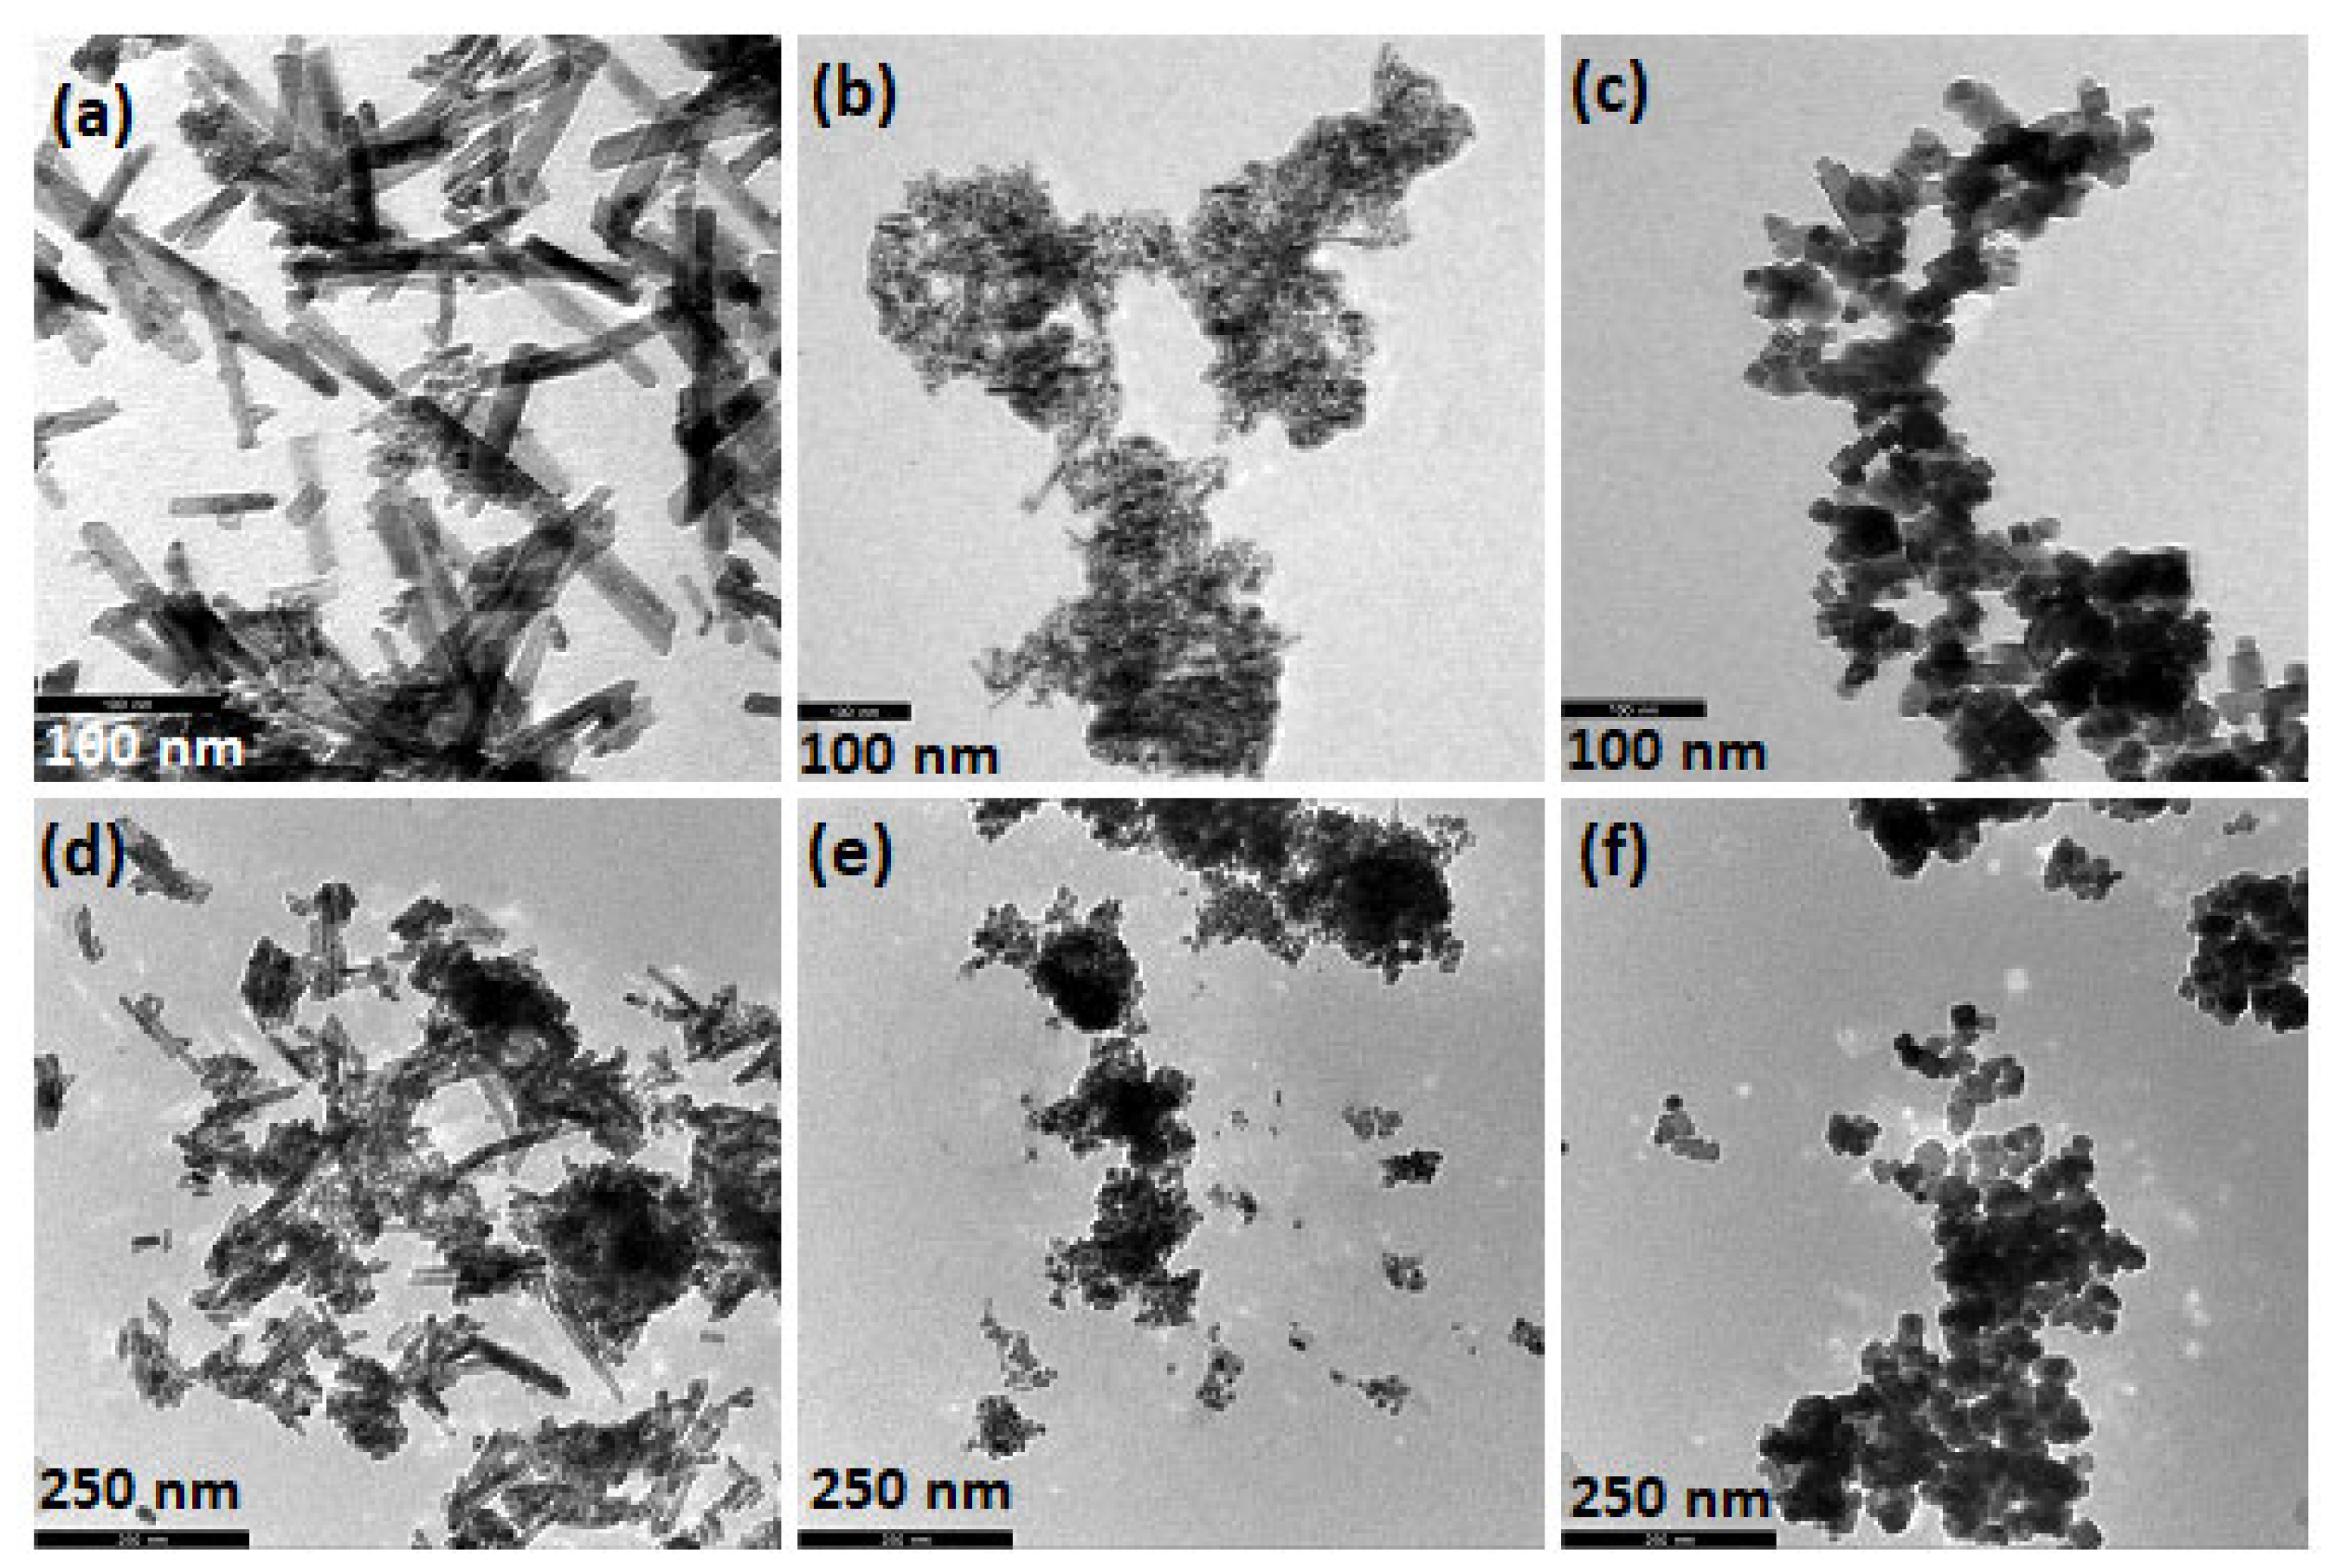
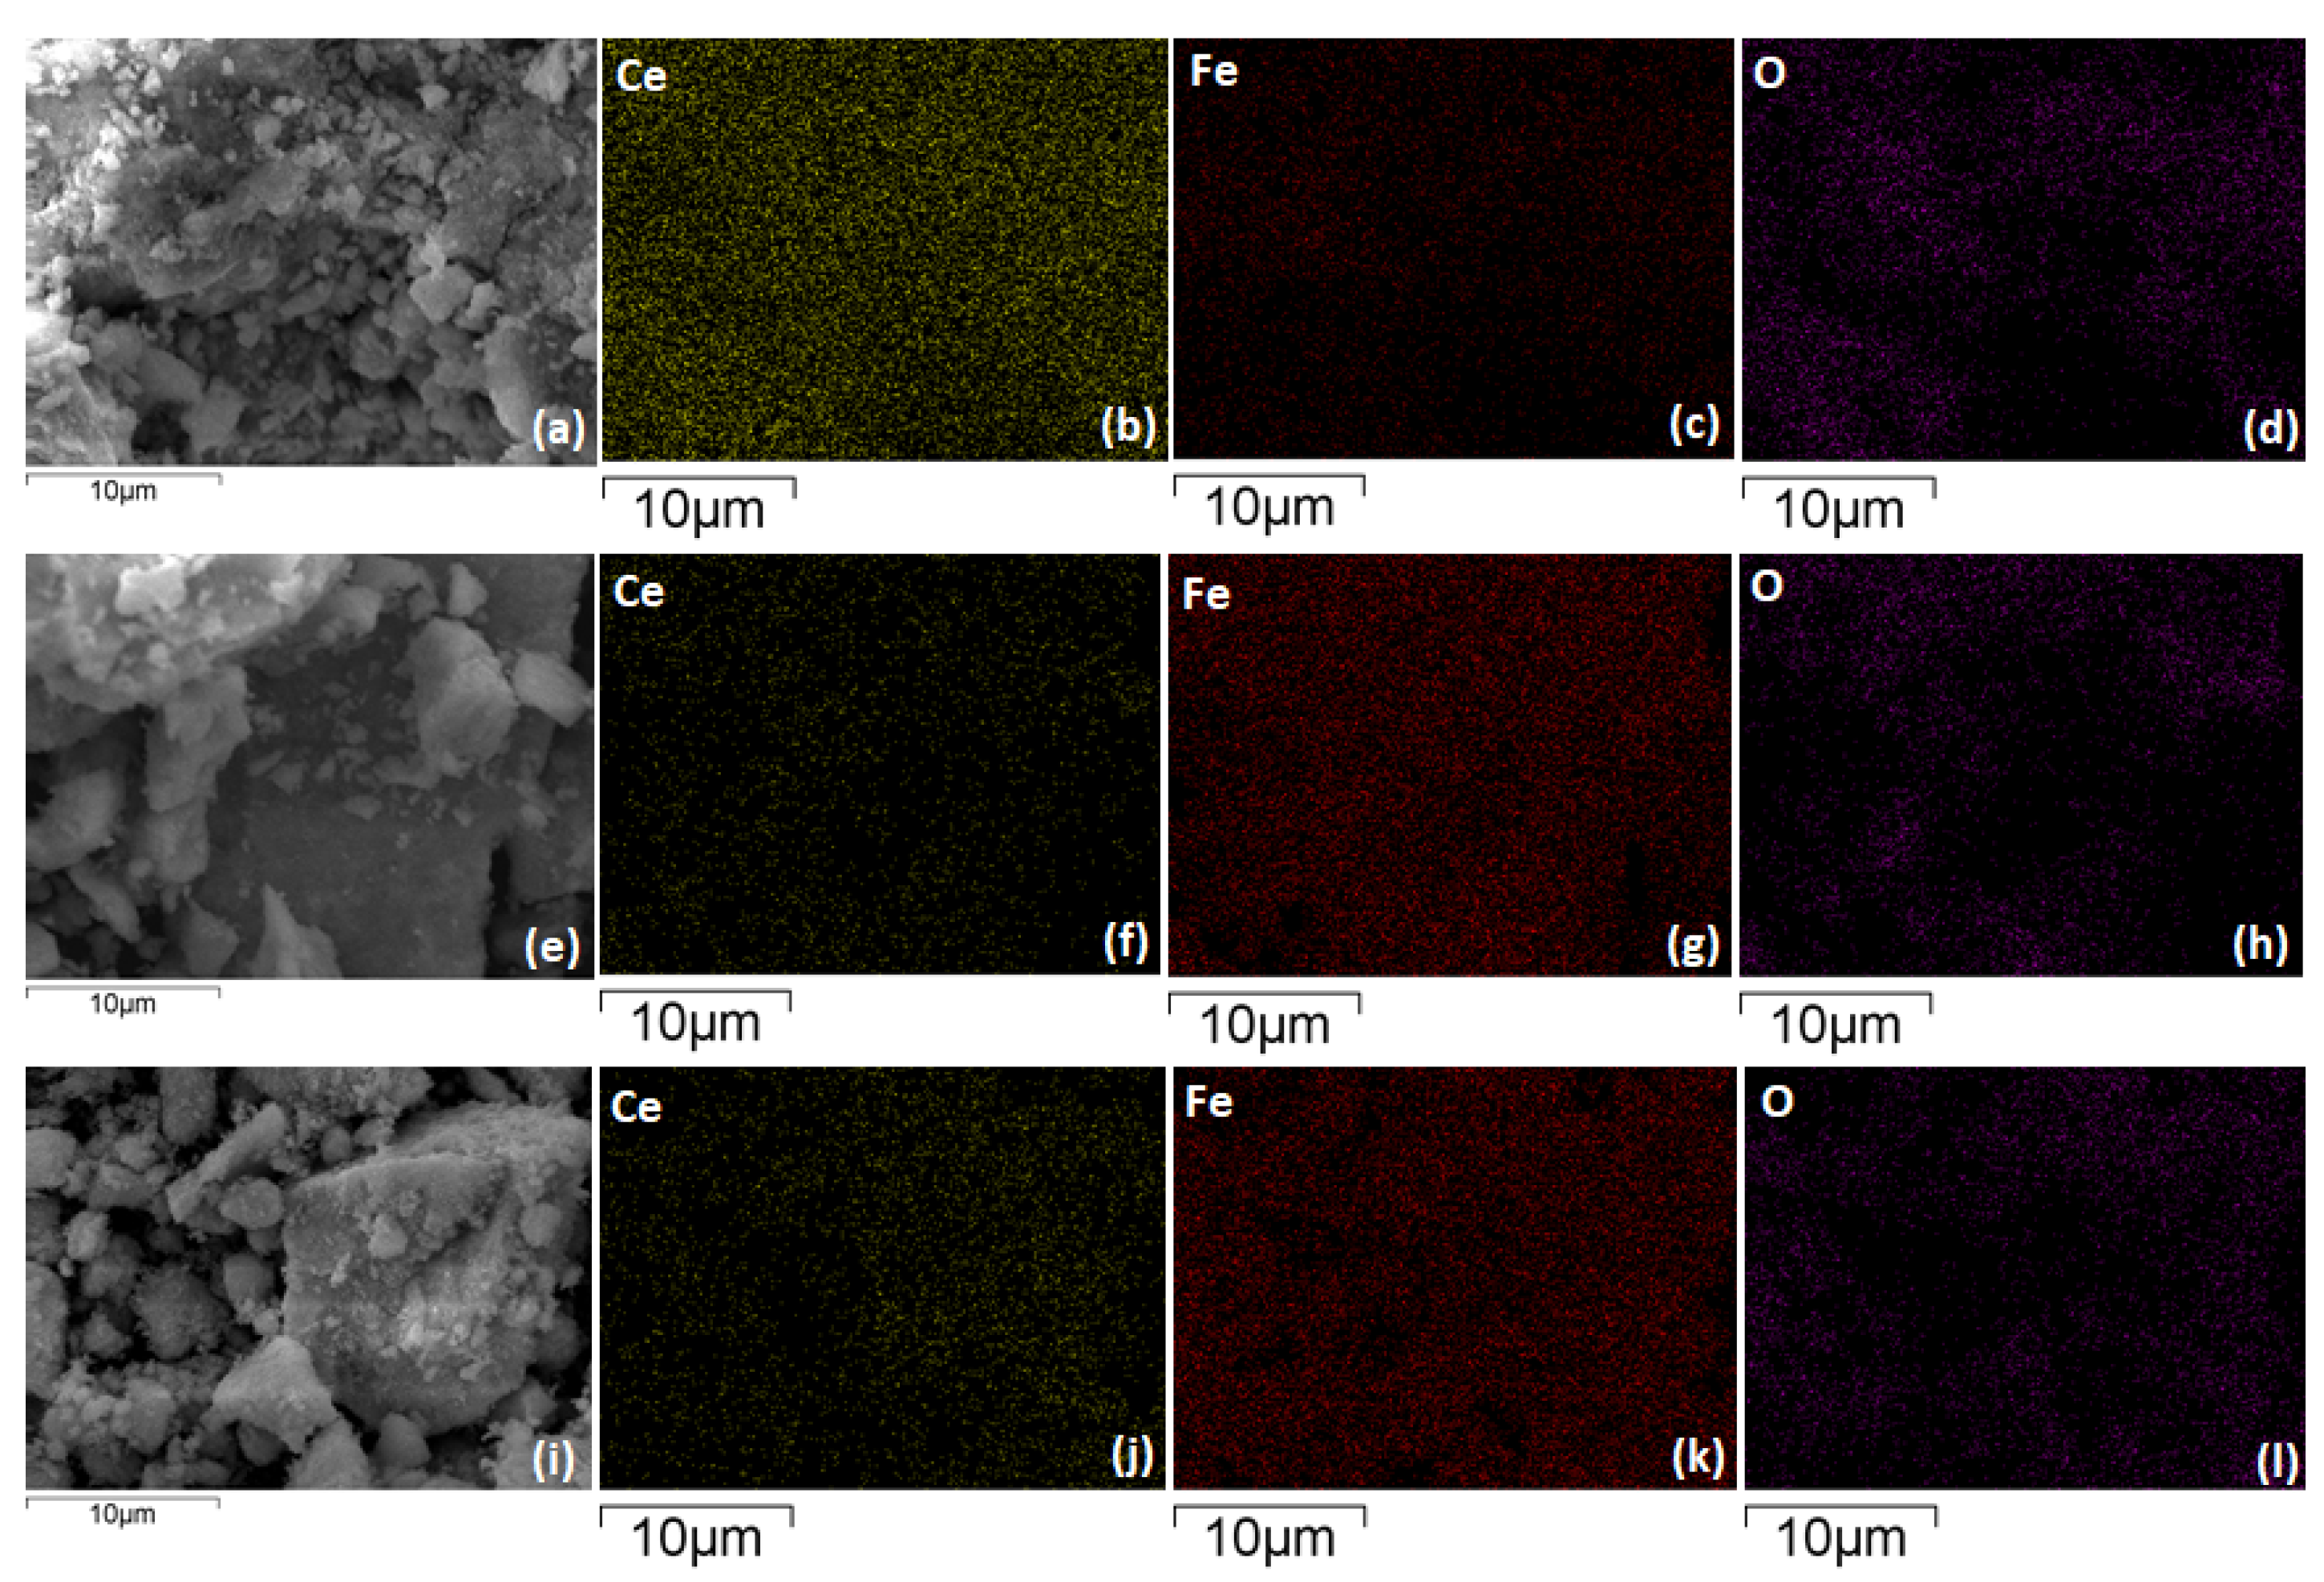
2.2. Morphological Characteristics (TEM, SEM-EDS)

Transmission electron microscopy analyses were performed so as to further investigate the morphological features of the various ceria nanostructures. The TEM images of bare ceria samples as well as those of iron-ceria mixed oxides are presented in Figure 3a–c and Figure 3d–f, respectively. CeO2-NR displays ceria in the rod-like morphology (Figure 3a) with 25–200 nm in length. Nanopolyhedra of irregular shapes and cubes are shown in Figure 3b and c, respectively. As it can be observed by the TEM images of iron-ceria mixed oxides (Figure 3d–f), the support morphology remains unaffected by the addition of iron to the ceria carrier. Scanning electron microscopy analyses along with energy dispersive X-ray spectrometry (EDS) were performed in addition to obtain the elemental mapping images of the Fe2O3/CeO2 samples (Figure 4). The SEM images of Fe2O3/CeO2-NR, Fe2O3/CeO2-NP, and Fe2O3/CeO2-NC are depicted in Figure 4a,e,i, respectively, while the corresponding elemental mapping images are shown in Figure 4b–d, Figure 4f–h, and Figure 4j–l, respectively. As it is obvious from SEM-EDS analysis, there is a uniform distribution of all elements (Ce, Fe, O) in the iron-ceria mixed oxides. Noteworthy, the Fe2O3/CeO2-NR sample (Figure 4b–c) exhibits a higher amount of cerium than compared to iron, while iron-ceria nanopolyhedra (Figure 4f–g) and iron-ceria nanocubes (Figure 4j–k) exhibit a larger population in iron. To further gain insight into the surface elemental composition of the iron-ceria samples, XPS analysis was performed in addition, which corroborated the above findings (see below).

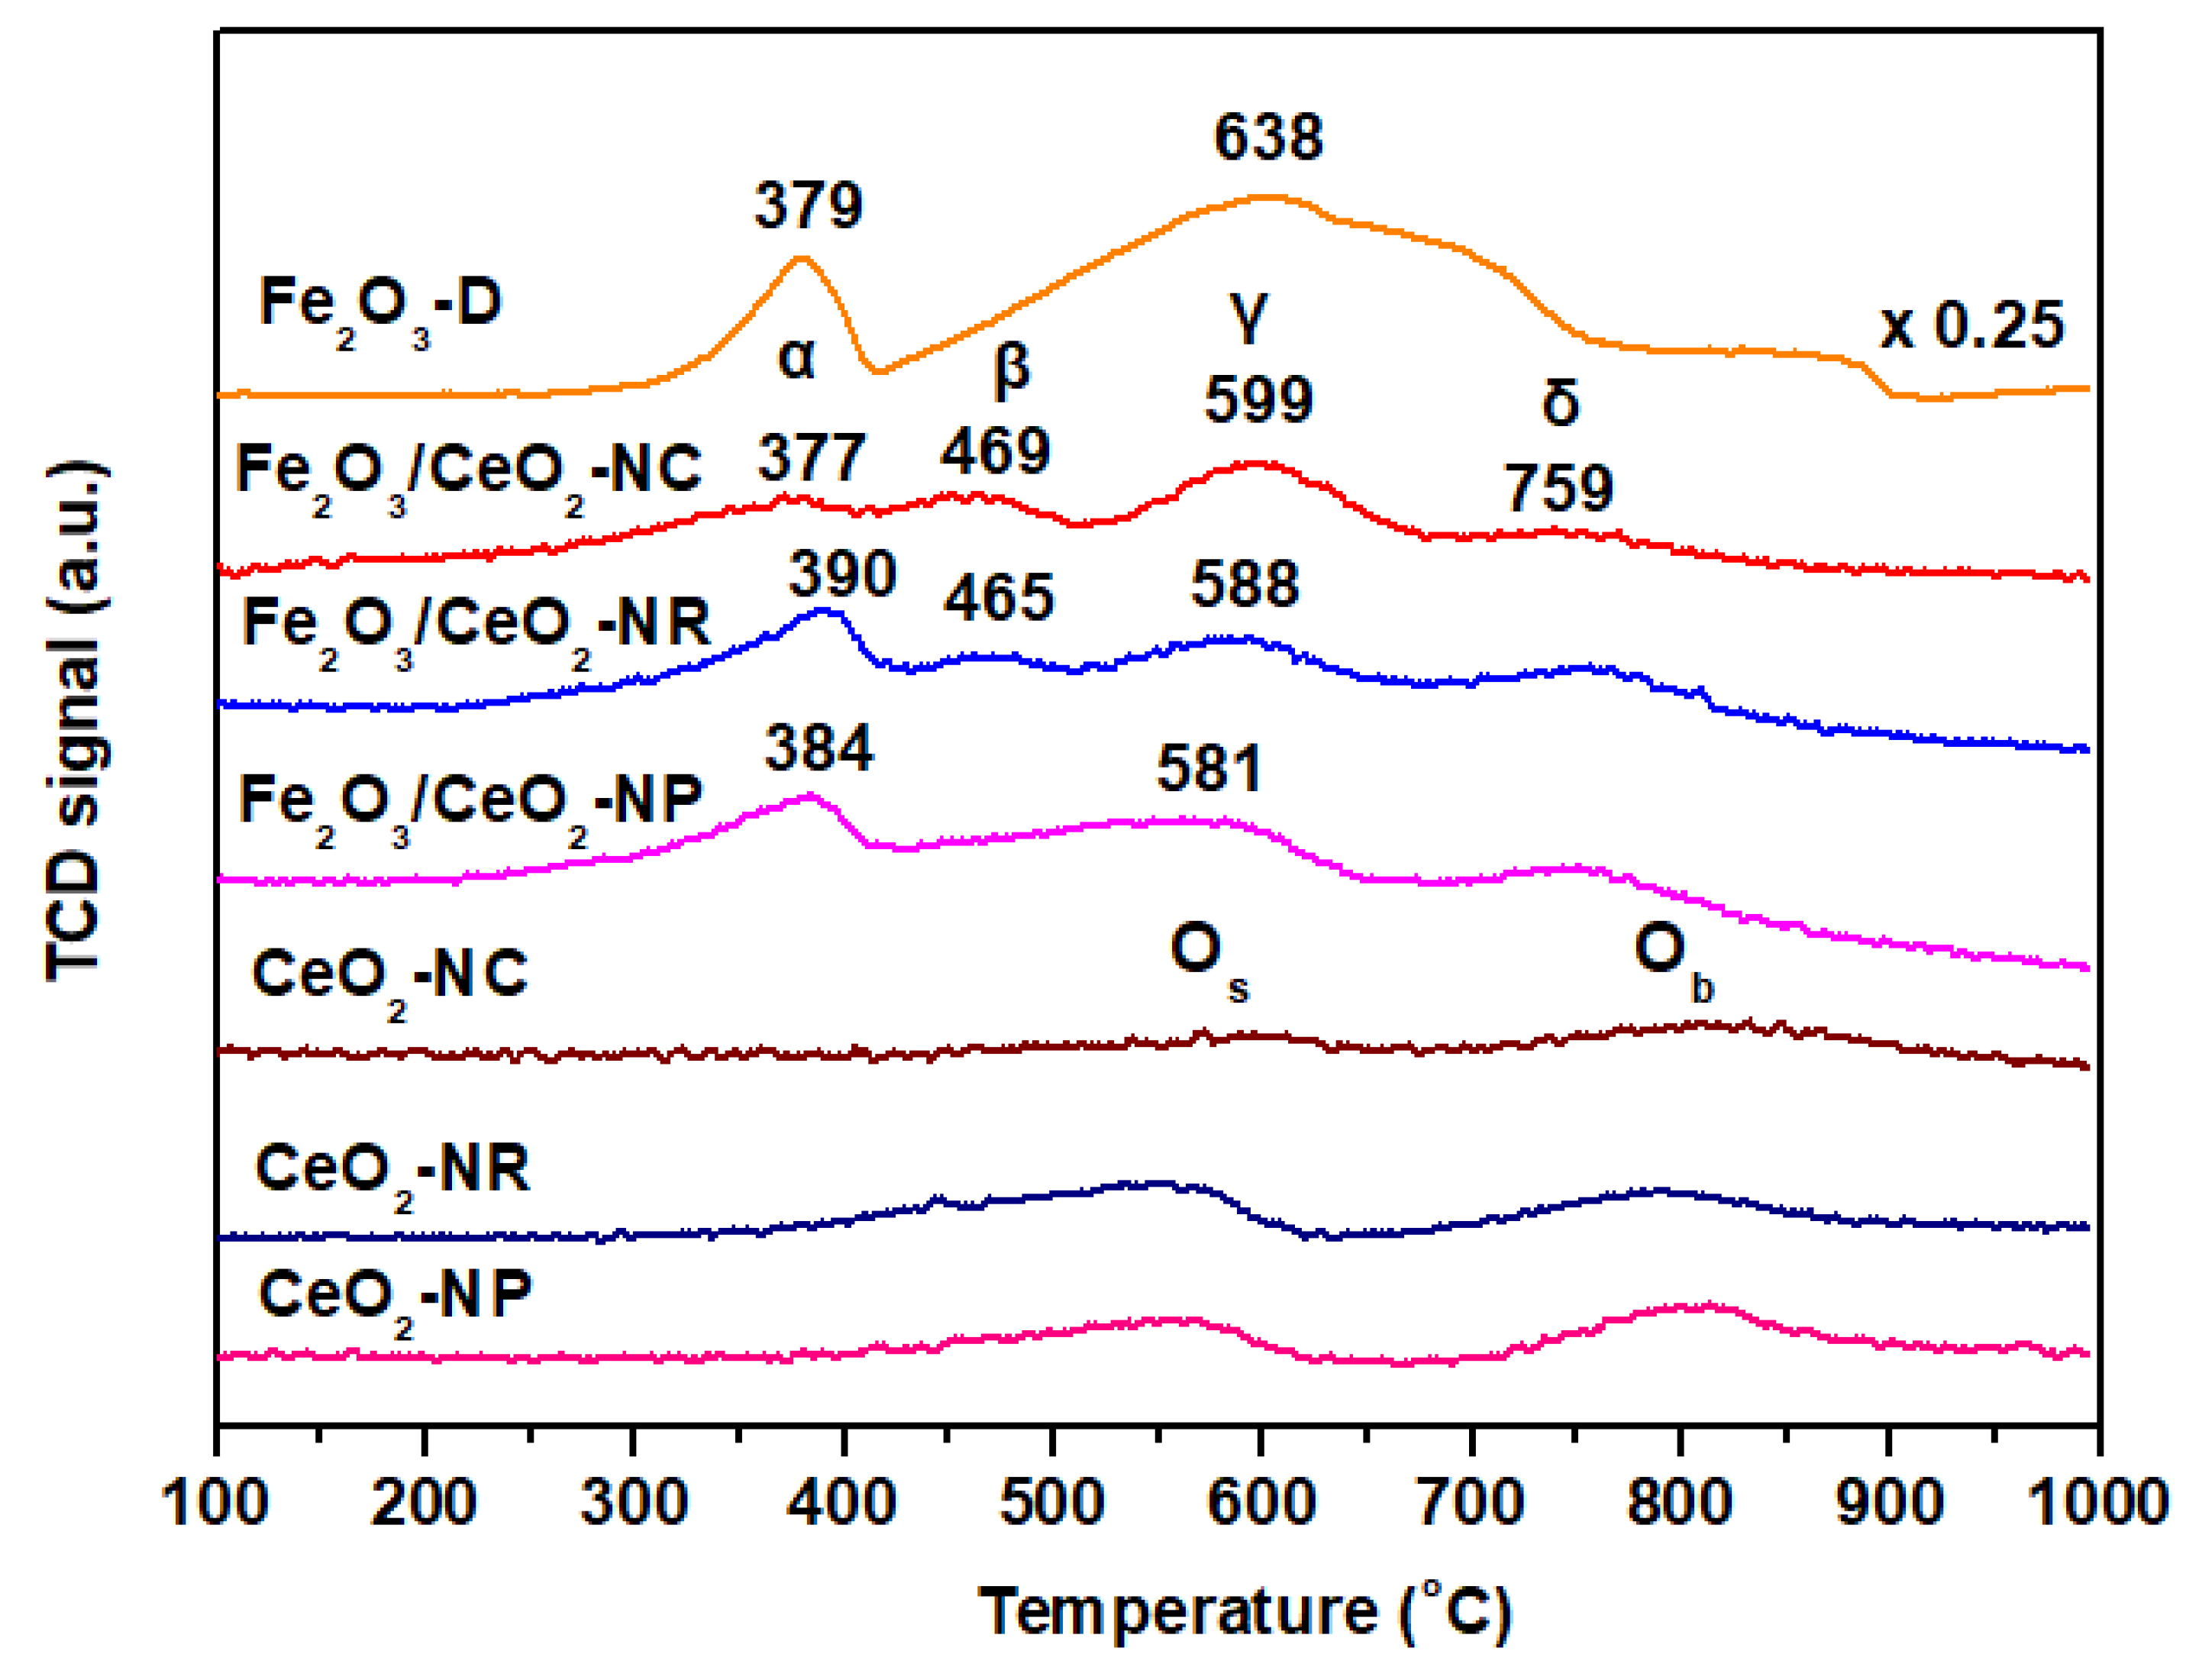
2.3. Redox Properties (H2-TPR)

The effect of support morphology on the reducibility of the samples was investigated by TPR experiments. The reduction profiles of bare ceria samples are depicted in Figure 5 and they include two broad peaks centered at 526–551 °C and 789–813 °C, which are attributed to the surface oxygen (Os) and bulk oxygen (Ob) ceria reduction, respectively [58,59]. As observed in Figure 5, in ceria nanocubes, the Os peak is smaller in comparison with ceria nanorods and nanopolyhedra due to the smaller amount of easily reducible oxygen available in the cubic sample, a fact closely related to the exposed crystal facets, as it has been reported in previous studies [45,60]. In Table 2, the hydrogen consumption that corresponds to ceria surface and bulk oxygen reduction is presented. Regarding the ratio of surface to bulk oxygen for the bare ceria samples, the following order is obtained: CeO2-NR (1.13) > CeO2-NP (0.94) > CeO2-NC (0.71), indicating the higher reducibility of the rod-shaped sample which possesses the largest population of weakly bound oxygen species. It is of note that the catalytic conversion follows the same trend with the surface-to-bulk ratio, signifying the interrelationship between the reducibility and the catalytic performance, as will be further discussed in the sequence.
Figure 5 also shows the reduction profiles of Fe2O3/CeO2 samples, as well as that of bare Fe2O3-D material. The main TPR peaks accompanied by the corresponding H2 consumption (mmol H2/g) are presented in Table 2. The Fe2O3-D sample exhibits a sharp peak at 379 °C along with a broader peak at ~638 °C, consisting of two overlapping bands, which are ascribed to the stepwise reduction of hematite to magnetite and magnetite to metallic iron, respectively, i.e., Fe2O3 → Fe3O4 and Fe3O4 → Fe0 [44,58]. However, the number of steps (two or three) involved in the reduction of pure iron oxide has not been fully clarified [61], as it is considered to be dependent on the amount ratio of hydrogen to water present in the reduction process, an issue addressed by Zielinski et al. [62]. It should be also mentioned that the reduction of FeO (wustite) to Fe0 cannot be easily observed because of the metastable nature of FeO as well as its disproportion to Fe3O4 and metallic iron (4FeO → Fe3O4 + Fe) at a temperature below 619 °C [38].
The Fe2O3/CeO2-NC and Fe2O3/CeO2-NR samples exhibit four reduction peaks in the range of ~377–390 °C (peak α), 465–469 °C (peak β), 588–599 °C (peak γ), and 759 °C (peak δ), whereas Fe2O3/CeO2-NP shows three reduction peaks centered at ~384 °C (peak α), 581 °C (peak γ), and 759 °C (peak δ), as the second and third peaks could have been merged, therefore justifying the absence of peak β [63]. The peaks at 465–469 °C (peak β) and 759 °C (peak δ) are attributed to the ceria surface oxygen and bulk oxygen reduction, respectively, while the peaks at ~377–390 °C (peak α) and 581–599 °C (peak γ) are ascribed to the iron species reduction, namely Fe2O3 → Fe3O4 and Fe3O4 → Fe0, respectively [40,44]. In particular, the two aforementioned peaks could be referring to dispersed and clustered Fe2O3, accordingly [64]. Interestingly, the high-temperature peak δ (759 °C) that corresponds to ceria bulk oxygen reduction remains unaffected by the addition of iron, which can be attributed to the preferred existence of iron at the outermost shell of the nanoparticles [50]. It should also be noted that the addition of iron to ceria supports results into a downward shift of surface ceria TPR peaks, implying the pronounced effect of iron-ceria interactions on the reducibility [35,38].
According to the hydrogen consumed (Table 2), iron-ceria nanorods exhibit the highest value of H2 consumption (3.42 mmol H2/g) followed by nanopolyhedra (2.93 mmol H2/g) and nanocubes (2.47 mmol H2/g) perfectly matched to the catalytic conversion order (see below). It is also worth noticing that the amount of H2 required for the reduction of Fe2O3/CeO2 samples always surpasses the theoretical amount of H2 for the complete reduction of Fe2O3 to Fe (~2 mmol H2/g, on the basis of a Fe nominal loading of 7.5 wt.%). The latter reveals the facilitation of ceria capping oxygen reduction in the presence of iron, further corroborating the above findings and the synergistic function of metal and support. The H2 excess uptake (mmol/g, Table 2), reflecting the extent of ceria oxygen reduction, follows the sequence Fe2O3/CeO2-NR (1.42) > Fe2O3/CeO2-NP (0.93) > Fe2O3/CeO2-NC (0.47), in line to supports’ reducibility.

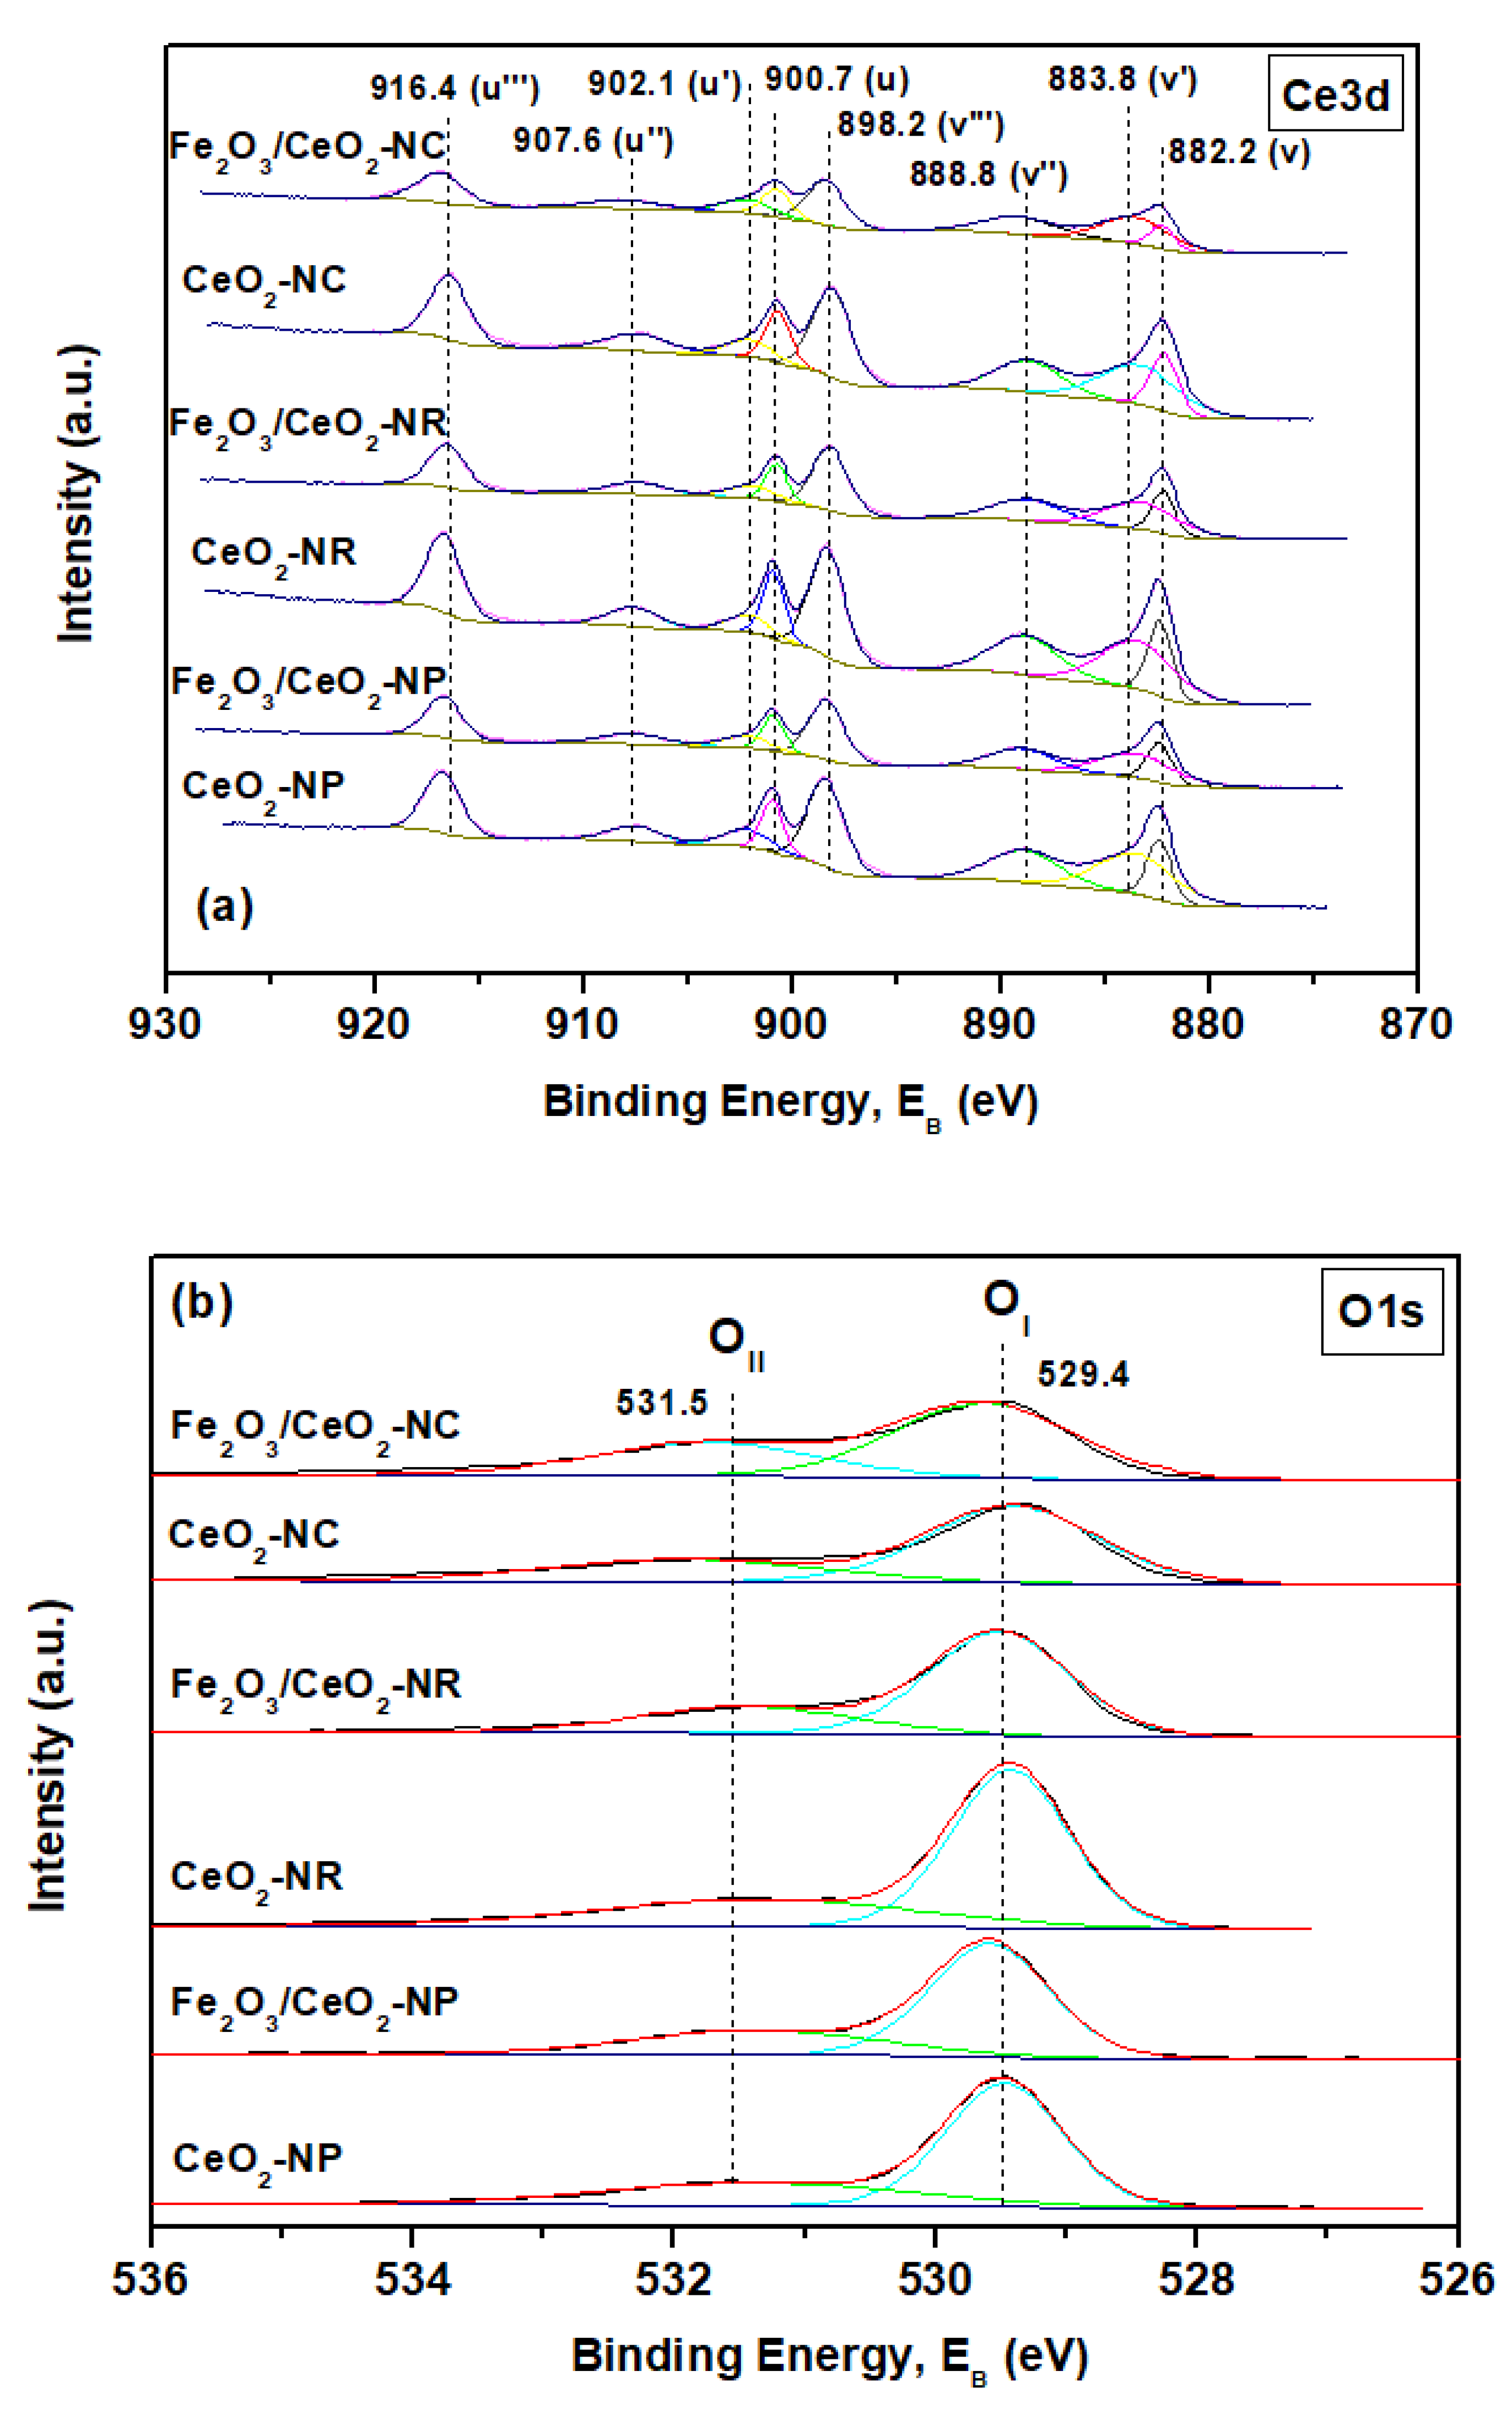
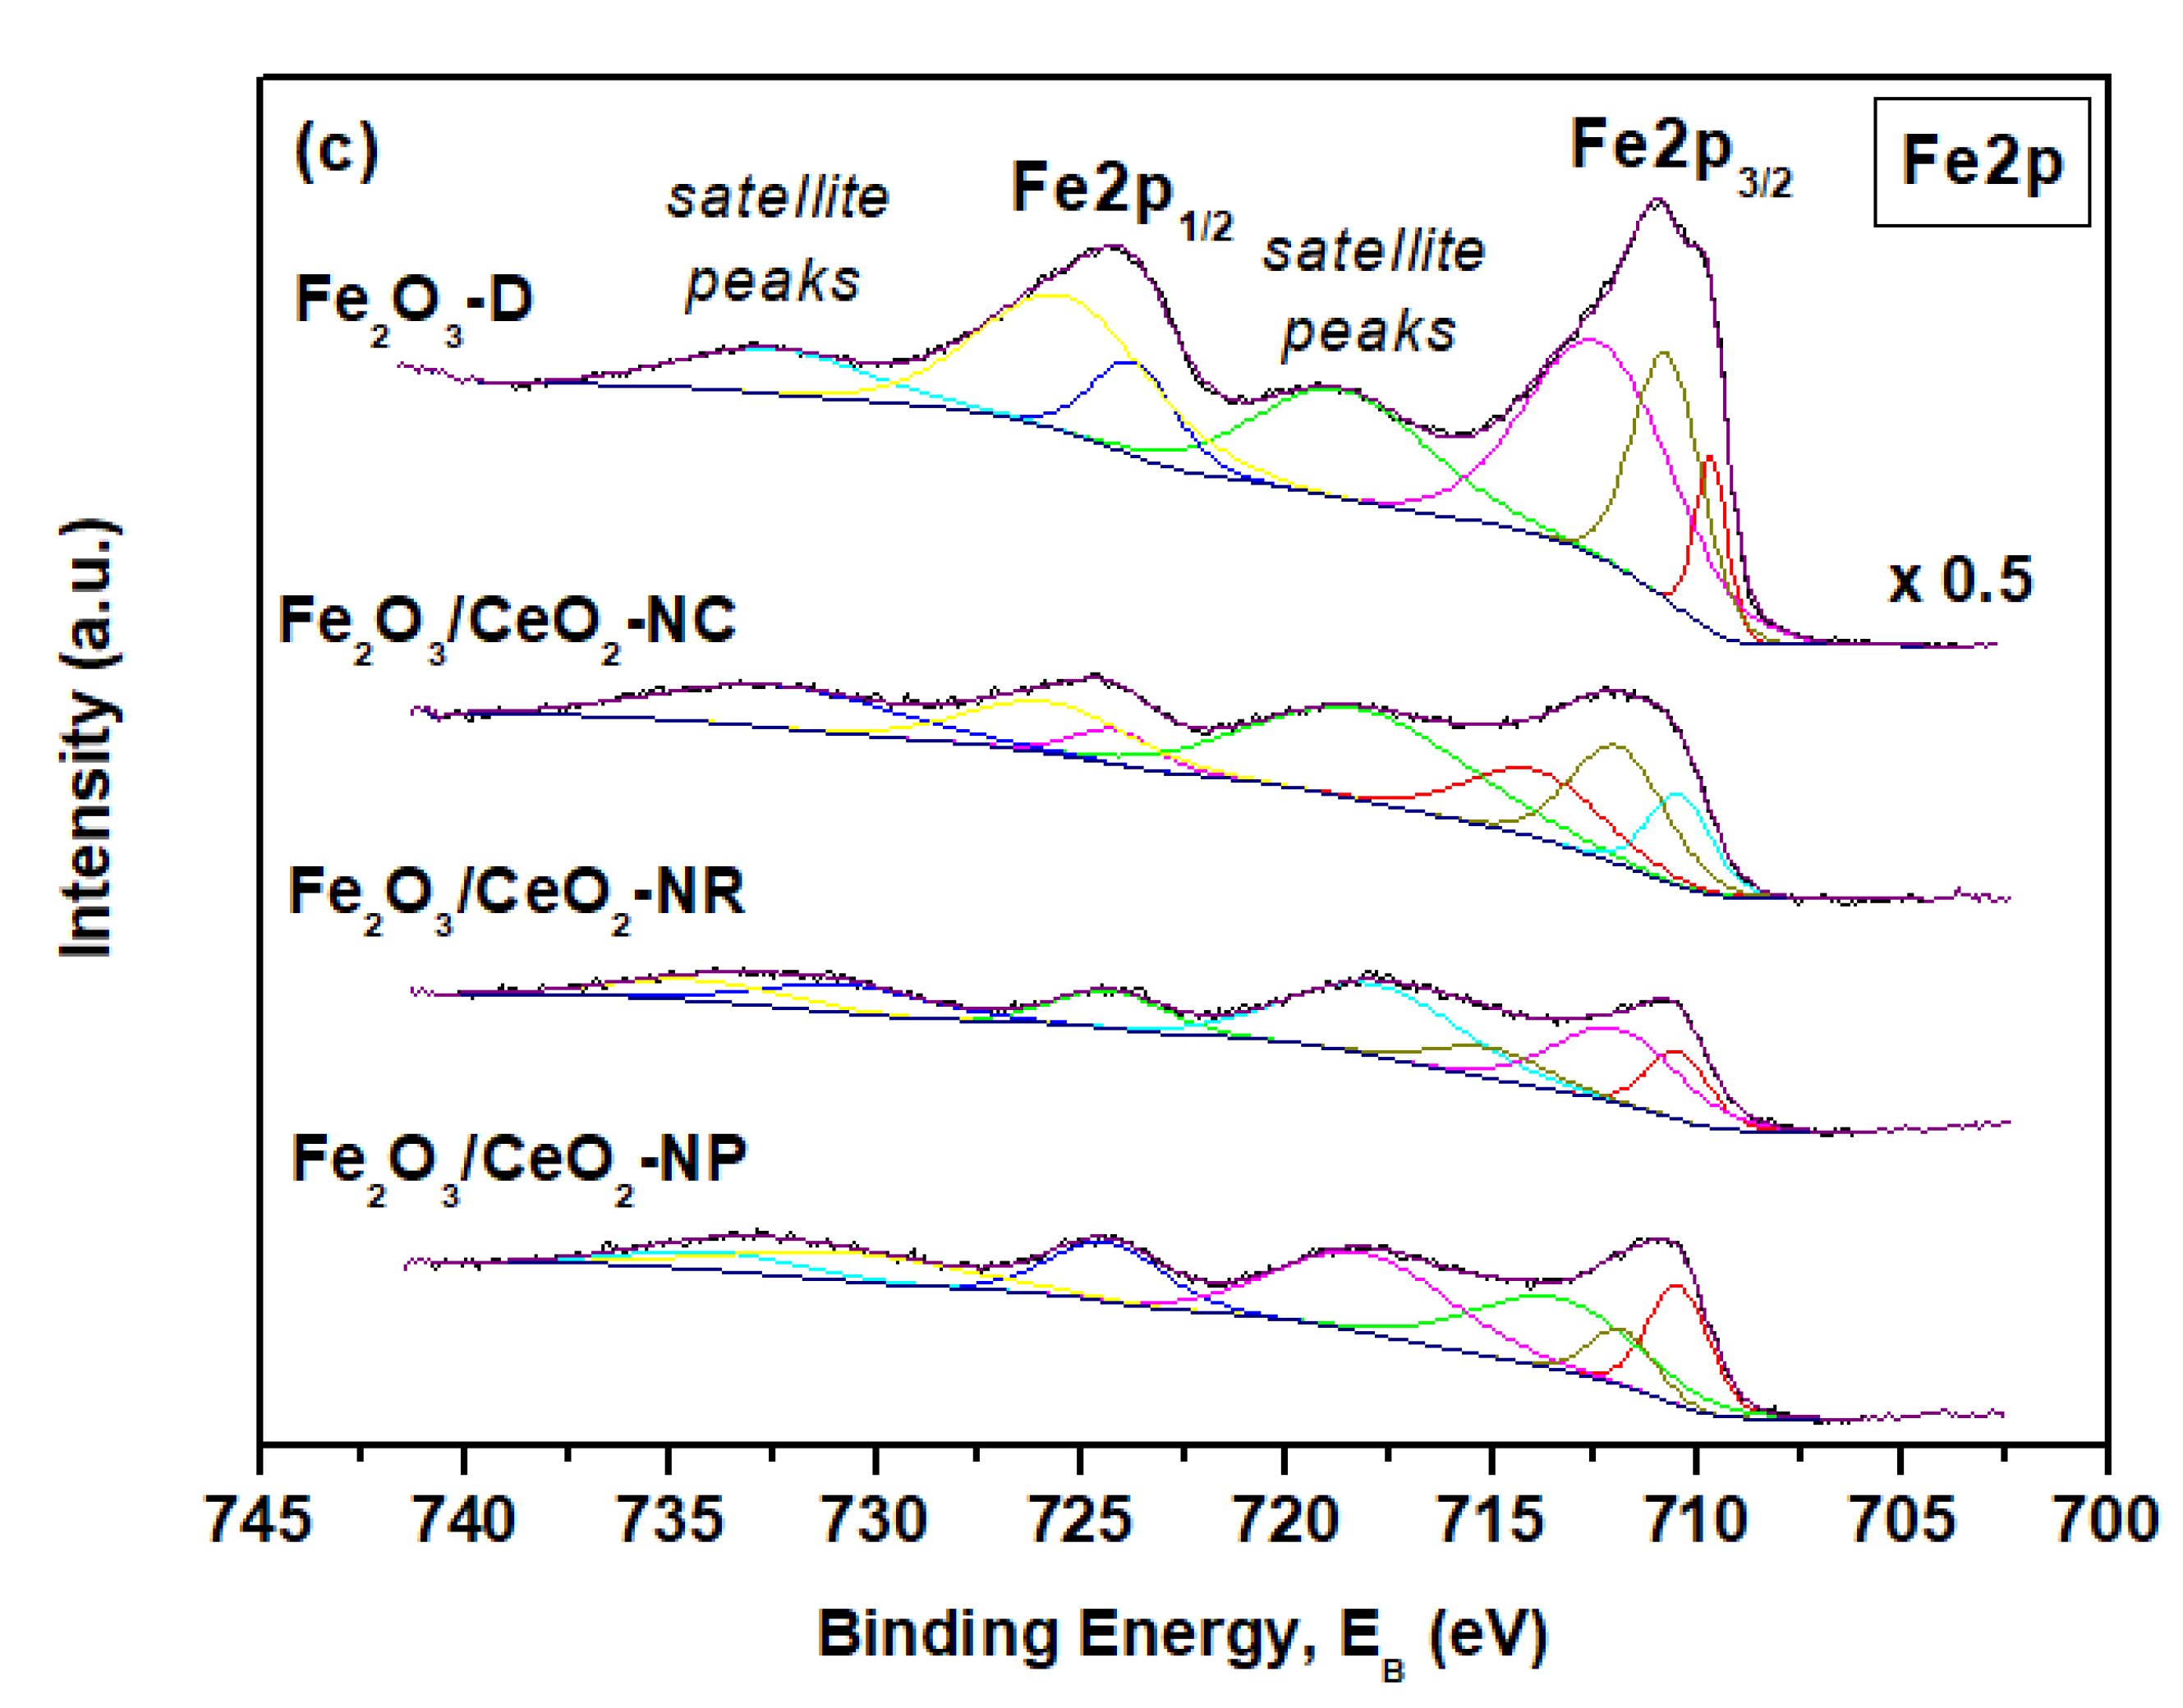
2.4. Surface Properties (XPS)

In order to further investigate the impact of support morphology on the chemical composition and oxidation state of the samples, XPS analysis was performed. The Ce 3d XPS spectra of the samples are shown in Figure 6a. The Ce3d core level spectra were deconvoluted into eight components consisting of three pairs of spin-orbit doublets of Ce4+ and two peaks corresponding to Ce3+ [44,59,65]. In particular, the Ce 3d3/2 spin-obit components represented by the u lines include three characteristic peaks labeled as u (900.7 eV), u′′ (907.6 eV), and u′′′ (916.4 eV). The Ce 3d5/2 spin-orbit components represented by the v lines, contain three peaks labeled as v (882.2 eV), v′′ (888.8 eV), and v′′′ (898.2 eV). The aforementioned three pairs of peaks are ascribed to Ce4+ while the two lines denoted as u’ (902.1 eV) and v’ (883.8 eV) are attributed to Ce3+. The proportion of Ce3+ ions with regard to the total cerium is calculated from the area ratio of the sum of the Ce3+ species to that of the total cerium species [66]. Table 3 summarizes the results derived by XPS analysis for all the samples. Bare ceria supports show similar amounts of the Ce3+ species between 23.3 and 25.3%. With regard to the iron-ceria samples, the population of Ce3+ ions is slightly higher than bare ceria samples, varying between 25.3 and 28.5%, without, however, exhibiting significant alterations between the samples of different morphology. In a similar manner, it has been shown that the relative amount of reduced Ce3+ species is similar among CuO/CeO2 samples of different morphology [67,68].
Figure 6b shows the O 1s XPS spectra of the samples, which consist of two peaks. In general, the peak at lower binding energy (529.4 eV) corresponds to lattice oxygen (OI) of the metal oxide phases, such as O2−, whereas the peak at higher binding energy (531.5 eV) is ascribed to chemisorbed oxygen (OII) including adsorbed oxygen (O/O22−), adsorbed water, hydroxyl (OH), and carbonate (CO32−) species [40,69,70]. Upon iron addition, a slight shift in the OI band (Figure 5b) to higher binding energy occurs, which can be attributed to the electronegative effect of iron on the environment surrounding the cerium-oxygen bond [40,44]. As can be observed from Table 3, the following order, in terms of OI/OII ratio, is obtained for bare ceria samples: CeO2-NR (2.13) > CeO2-NP (2.04) > CeO2-NC (1.99), which is well-correlated with the catalytic performance order (see below). The latter indicates the key role of lattice oxygen on the CO oxidation, as discussed in the sequence. Interestingly, exactly the same trend is obtained for iron-ceria samples, i.e., Fe2O3/CeO2-NR (2.52) > Fe2O3/CeO2-NP (2.25) > Fe2O3/CeO2-NC (1.84) (Table 3), indicating the key role of support on the OI/OII ratio. These results, in conjunction to TPR studies, demonstrate that the samples with the rod-like morphology exhibit the highest concentration of easily reduced oxygen species, offering the optimum reducibility and oxygen kinetics.
Figure 6c shows the Fe 2p XPS spectra of Fe2O3-D and Fe2O3/CeO2 samples. All samples exhibit two main peaks around 710.8 eV and 724.1 eV, corresponding to Fe 2p3/2 and Fe 2p1/2, respectively, as well as two satellite peaks at 717.9 and 732.6 eV which indicate the existence of Fe3+, in agreement with the XRD results (Figure 2) [40]. However, it is worth noticing that the peak observed at 709.6-710.5 eV could be assigned to Fe2+ species [71], which is suggested to be formed by the interaction between the two oxide phases, through an interfacial redox process: xFe2O3 + (2 − y)CeO2−x → xFe2O3 − y + (2 − y)CeO2 [72,73,74]. Taking into account the Fe2+ (%) amount (Table 3), calculated by curve fitting including the satellite peaks (Figure 6c), the following order is obtained for the Fe2O3/CeO2 samples of different morphology: Fe2O3/CeO2-NR (14.4) > Fe2O3/CeO2-NP (13.3) > Fe2O3/CeO2-NC (13.1), which again coincides with the catalytic conversion order as described in the sequence and it is indicative of the interfacial interaction between the two oxide phases [72]. It should be pointed out that the aforementioned Fe2+ (%) amount order is in full compliance with the order of Os/Ob ratio and the reducibility of the mixed oxides (Table 2), disclosing the interrelationship between electronic and redox properties induced by iron-ceria interactions.
The surface atomic ratio Fe/(Fe + Ce) of the Fe2O3/CeO2 samples is presented in Table 3. Obviously, the surface atomic ratio of the rod-shaped sample is near to the nominal one (0.2), indicating a uniform distribution of iron and cerium species over the entire sample. However, nanopolyhedra and nanocubes exhibit higher values of surface atomic ratio than the nominal composition, namely 0.34 and 0.43, respectively, indicating an enrichment of the catalyst’s surface in iron species or equally an impoverishment of catalyst’s surface to cerium species. These results further corroborate the SEM-EDS analysis (Figure 4), as previously discussed.

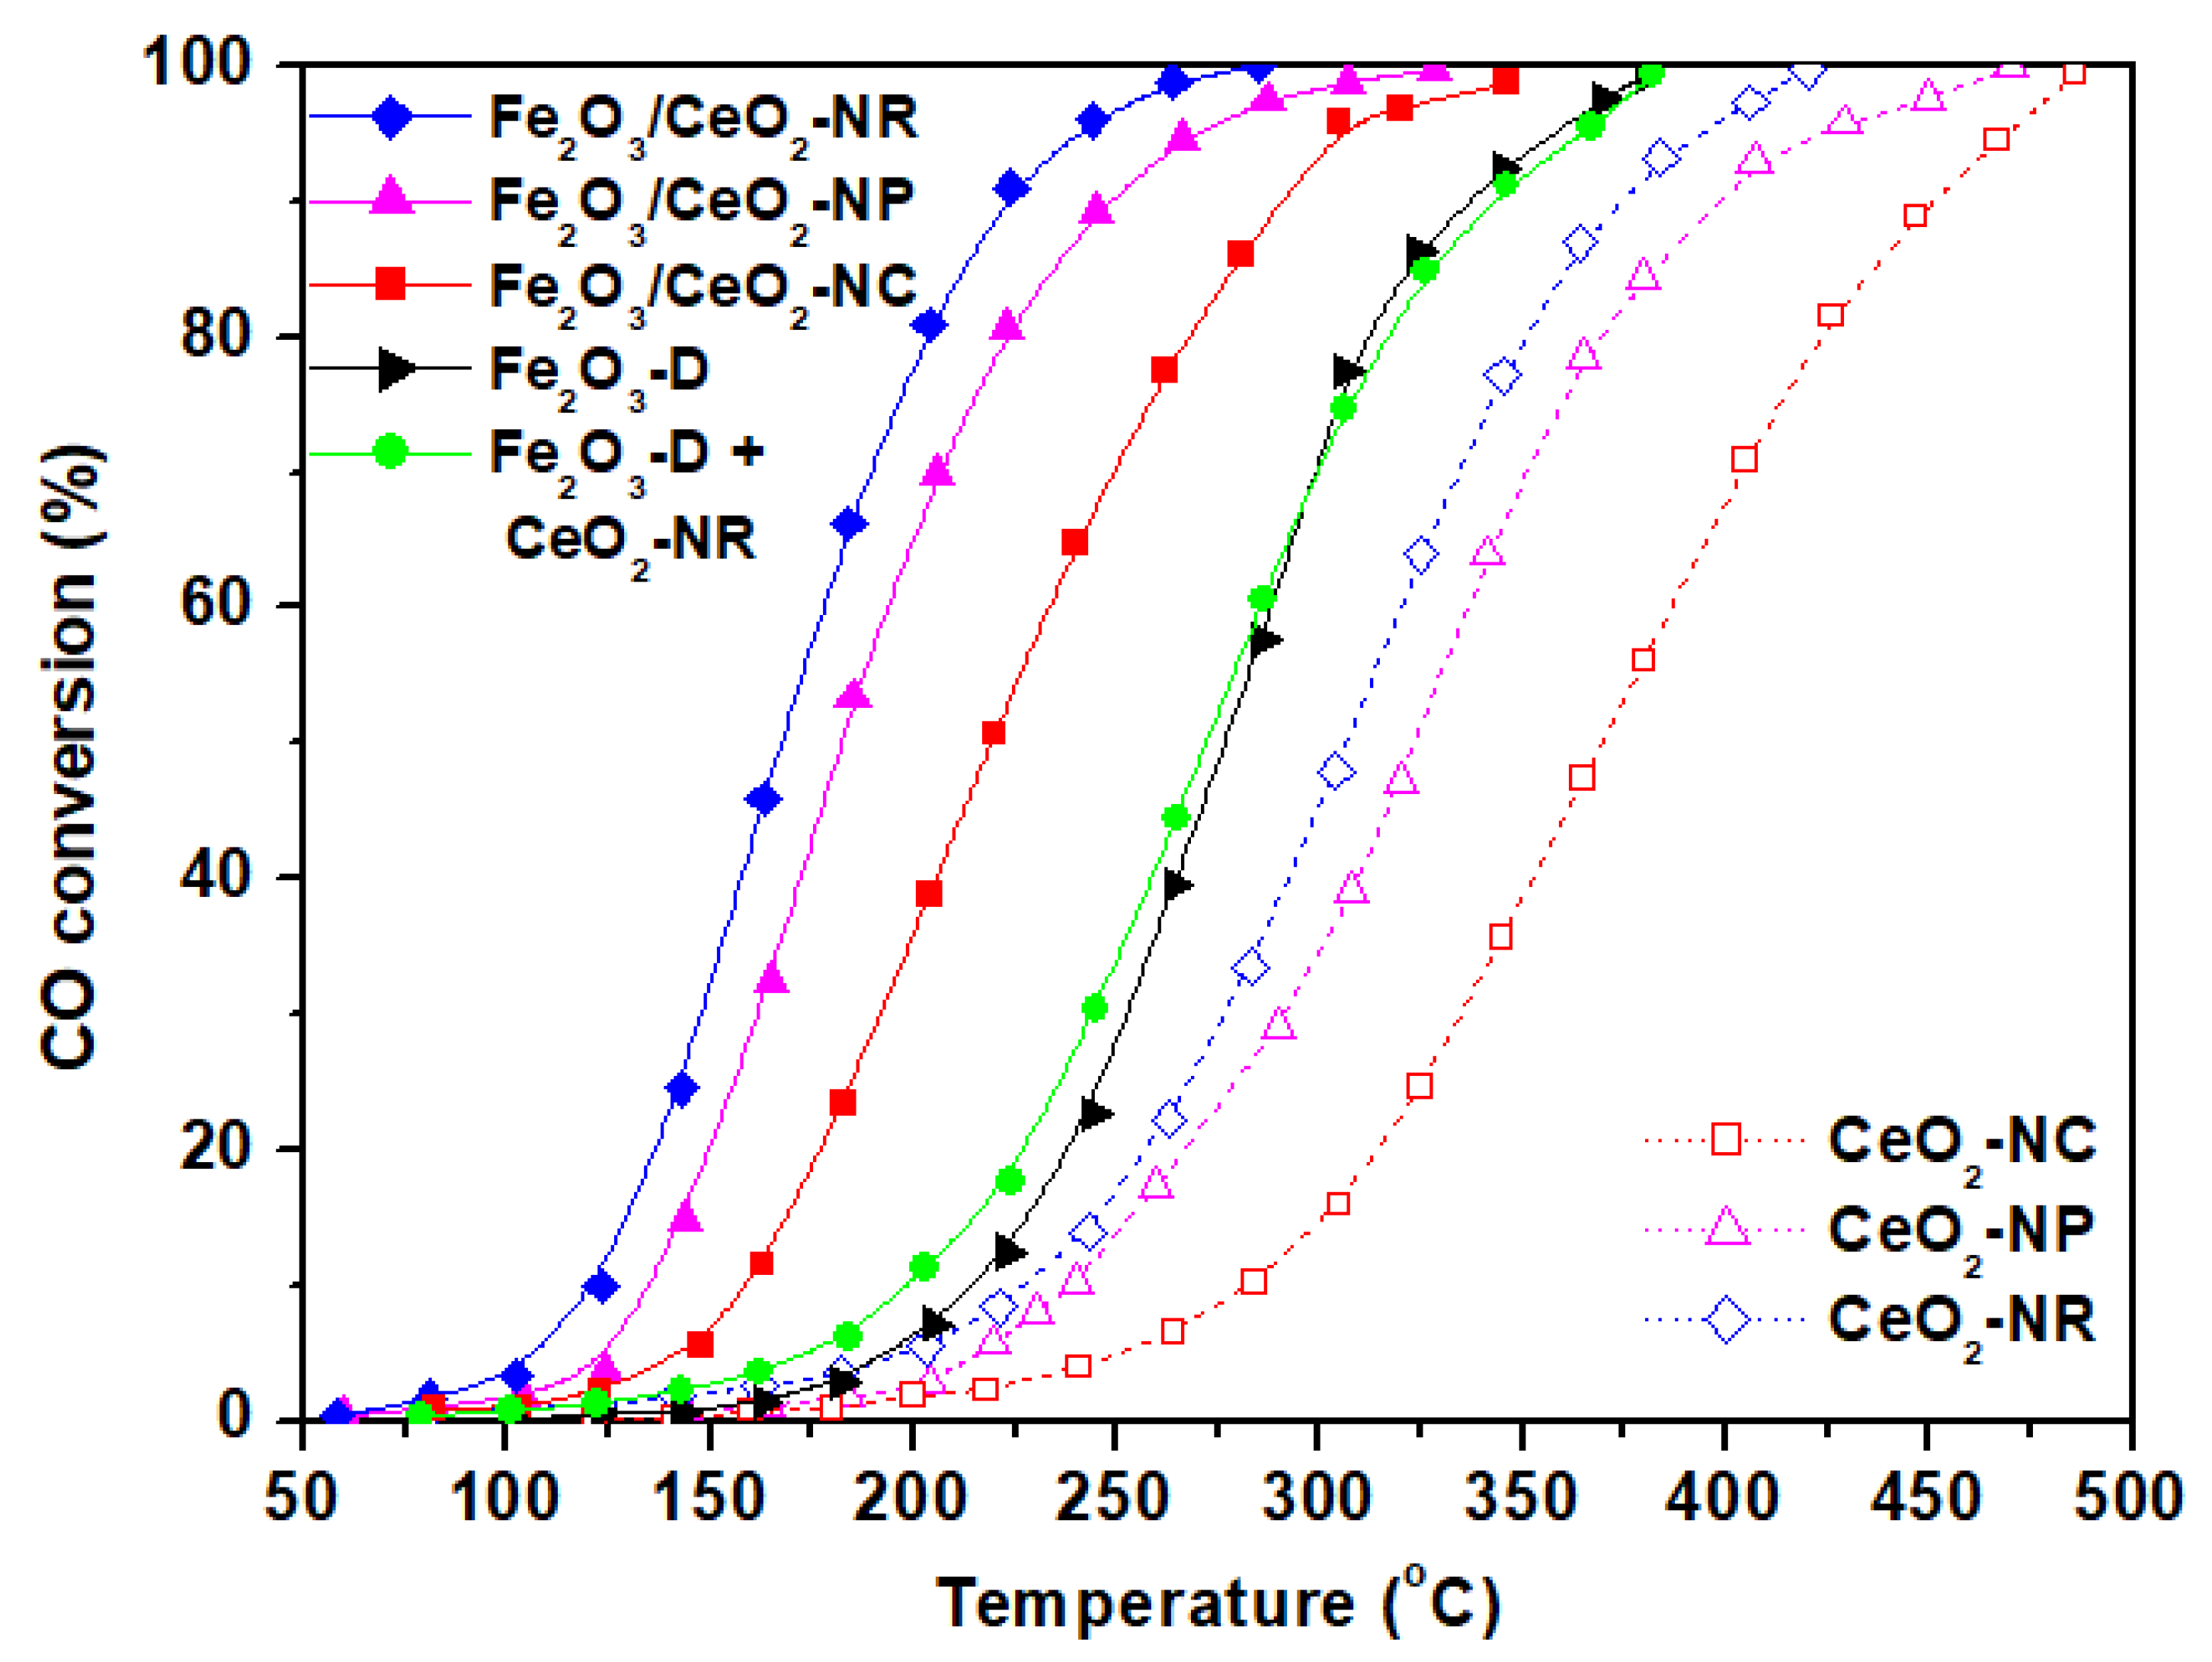
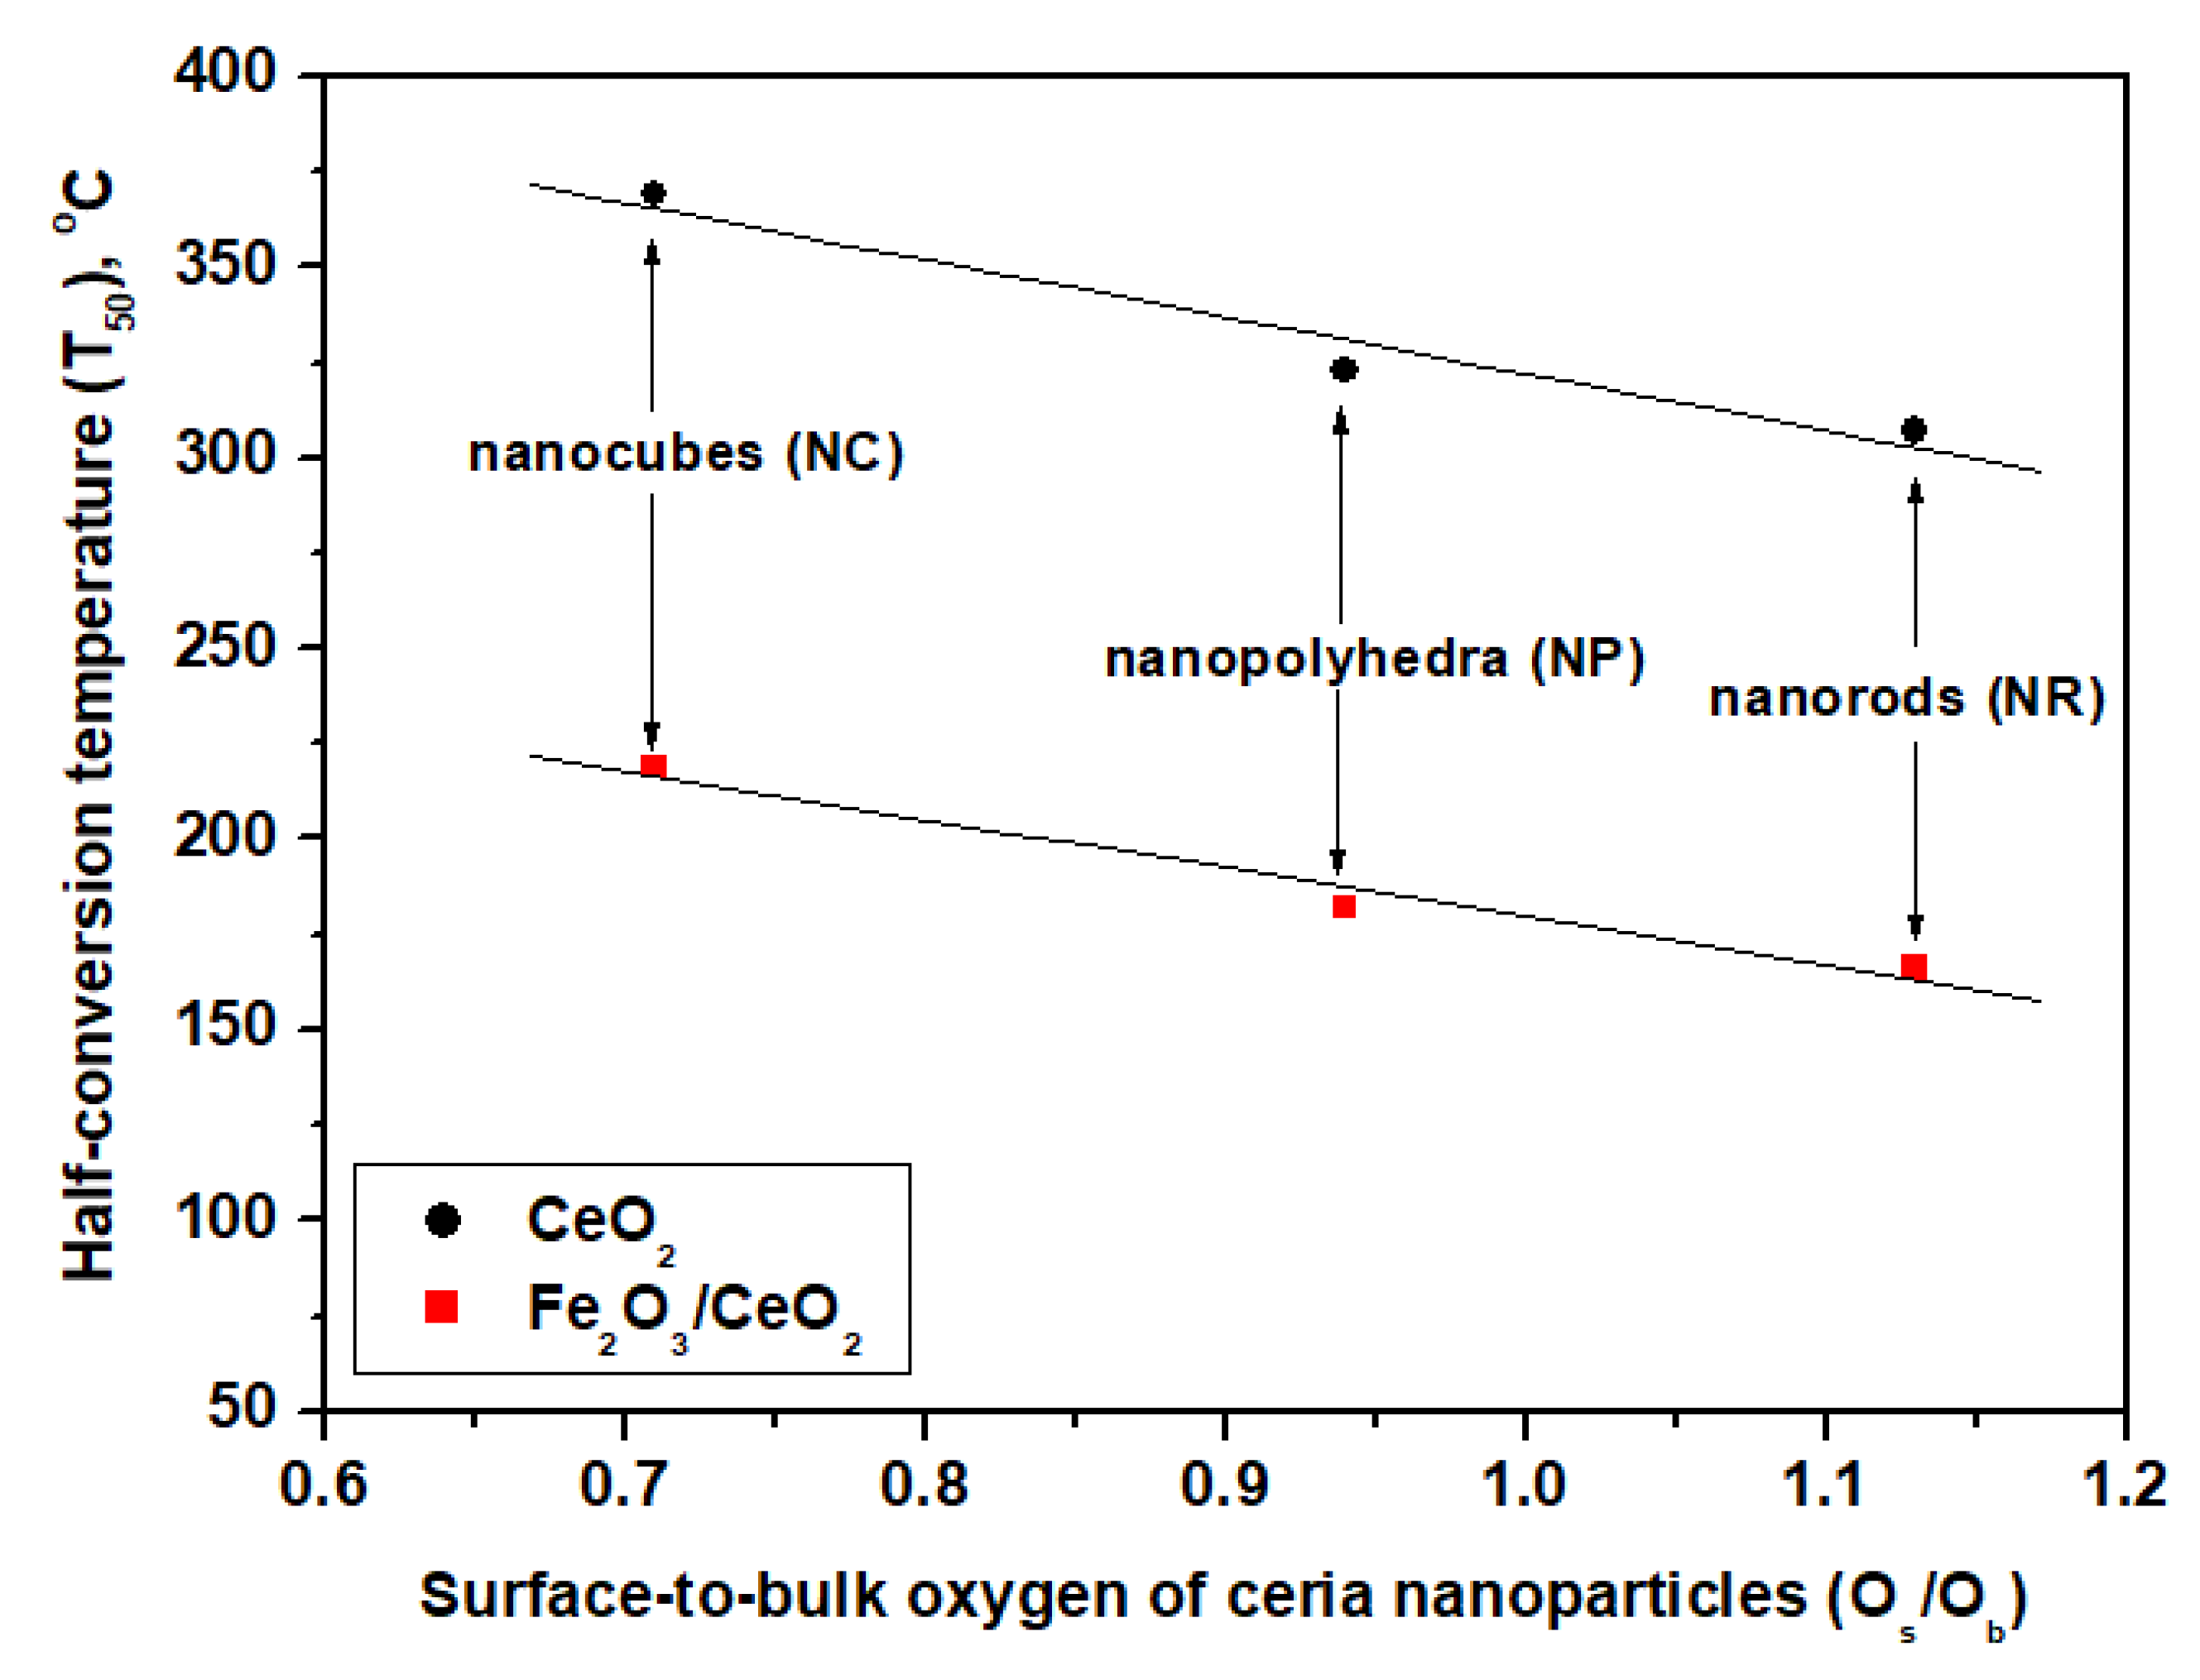
2.5. Catalytic Evaluation Studies

In order to gain insight into the morphological effect of ceria support on the catalytic performance of the Fe2O3/CeO2 binary system, the oxidation of CO was investigated, as a model reaction. Figure 7 shows the CO conversion as a function of temperature of bare ceria carriers of different morphology as well as of the corresponding Fe2O3/CeO2 samples. For comparison purposes, the catalytic performance of bare Fe2O3 as well as of a mechanical mixture of Fe2O3-D + CeO2-NR (see experimental section) was investigated in parallel to reveal the individual or synergistic effect of catalyst’s counterparts. Bare ceria carriers demonstrate inferior performance with, however, significant alterations between the samples of different morphology. In particular, in terms of half-conversion temperature (T50), the following trend is obtained for bare ceria samples: CeO2-NR (307 °C) > CeO2-NP (323 °C) > CeO2-NC (369 °C). Notably, the incorporation of iron into the ceria lattice clearly enhances the catalytic performance without, however, affecting the CO conversion order of bare ceria carriers: Fe2O3/CeO2-NR (166 °C) > Fe2O3/CeO2-NP (182 °C) > Fe2O3/CeO2-NC (219 °C) > Fe2O3-D + CeO2-NR (272 °C) > Fe2O3-D (277 °C). It is also worth noticing that the preparation method significantly affects the catalytic performance. Specifically, the hydrothermal method, which results in the development of ceria nanoparticles of different morphology, in conjunction to the addition of iron through the wet impregnation method, leads to highly active iron-ceria composites, as compared to the iron-ceria mixed oxide prepared by mechanical mixing (Fe2O3-D + CeO2-NR, green line in Figure 7). More specifically, the conversion profile of Fe2O3/CeO2-NR has been shifted by more than 100 °C to lower temperatures as compared to that of bare Fe2O3-D, CeO2-NR, and Fe2O3-D + CeO2-NR mechanical mixture, clearly revealing the synergistic interaction between CeO2 and Fe2O3 induced by the preparation procedure followed. At this point it should be noted that a stable conversion performance (~80%) was attained at 200 °C during a short term (24 h) stability experiment over the most active Fe2O3/CeO2-NR sample (not shown for brevity).
To more closely gain insight into the intrinsic reactivity of as-prepared samples, the reaction rate under differential conditions (Gas Hourly Space Velocity (GHSV) = 40,000 h−1, mcat = 100 mg, XCO < 15%) was obtained in the form of Arrhenius plots (Figure 8), and the corresponding activation energies (Ea) are summarized in Table 4. The superiority of Fe2O3/CeO2 samples as compared to bare CeO2 and Fe2O3 at a given temperature is again obvious (Figure 8), clearly revealing the synergistic iron-ceria interactions. Moreover, the same activity order to the CO conversion performance (Figure 7) is obtained, further validating the aforementioned structure–activity relationships. In relation to the activation energies, the bare nanorod sample (CeO2-NR) exhibits the lowest activation energy (44.2 kJ·mol−1), followed by nanopolyhedra (46.7 kJ·mol−1) and nanocubes (49.8 kJ·mol−1), a trend identical to their CO conversion performance. A similar trend is shown for the mixed oxides, with Fe2O3/CeO2-NR showing the lowest activation energy among Fe2O3 supported samples, followed by the Fe2O3/CeO2-NP and Fe2O3/CeO2-NC samples. On the other hand, the bare Fe2O3 sample exhibits a much higher activation energy (63.3 kJ mol−1) compared to bare ceria and iron-ceria samples, indicating a higher energy barrier for CO oxidation over Fe2O3. In view of this fact, the higher activation energy of iron supported ceria samples (53.5–58.6 kJ mol−1) compared to bare ceria samples (44.2–49.8 kJ mol−1) can receive a consistent explanation. However, it is worth noticing that iron-ceria catalysts demonstrate the highest activity (Figure 8, Table 4), despite their higher Ea, implying a more facile reaction path most probably induced by the iron-ceria interfacial sites. These findings clearly reveal the pivotal role of ceria support morphology in conjunction with iron-ceria interface towards determining the activation energy and the catalytic activity of Fe2O3/CeO2 samples.
The enhanced textural properties (BET surface area and pore volume) of the Fe2O3/CeO2-NR sample in comparison with the Fe2O3/CeO2-NP and Fe2O3/CeO2-NC samples should be also mentioned, which could be further accounted for its enhanced CO conversion performance. In order to further elucidate the relationship between CO oxidation activity and the aforementioned textural properties, the specific activity, normalized both per unit of catalyst mass (nmol g−1 s−1) and surface area (nmol m−2 s−1) was calculated under differential reaction conditions (XCO < 15%, T = 125 °C, GHSV = 40,000 h−1). These specific parameters can reflect more accurately the impact of intrinsic properties of the Fe2O3/CeO2 mixed oxides on the catalytic performance. The results are summarized in Table 5. It is evident that Fe2O3/CeO2-NR exhibits the best catalytic performance (both in terms of conversion and specific activity) as compared to the other two iron-ceria polymorphs, revealing the pivotal role of the exposed crystal planes and the redox characteristics, rather than that of textural characteristics, on the CO oxidation performance. Similar conclusions have been already drawn in our previous work on CO oxidation over CuO/CeO2 mixed oxides [18].
Summarizing, the nanorod-shaped sample (Fe2O3/CeO2-NR) exhibits the best catalytic performance, followed by nanopolyhedra (Fe2O3/CeO2-NP) and nanocubes (Fe2O3/CeO2-NC). The same order, however much inferior, is observed for the bare ceria samples as well, demonstrating the fundamental role of support morphology. This enhanced catalytic behavior of the nanorod sample can be mainly attributed, on the basis of the present findings, to its improved reducibility and oxygen mobility, enforced by the strong interaction between ceria nanorods and iron species, along with the abundance of ceria nanorods in oxygen vacancies. The latter has been clearly established by in situ Raman spectroscopy, revealing the following trend in the relative abundance of structural defects: CeO2-NR > CeO2-NP > CeO2-NC [18].
More specifically, the oxidation of CO over ceria-based materials follows a Mars-van Krevelen-type of mechanism, in which the reaction includes alternating reduction/oxidation steps that result in the formation of surface oxygen vacancies, which is considered to be a reactivity descriptor on doped ceria surfaces [75], and their subsequent refill by gas phase oxygen [31]. In view of this fact, it has been shown that there is a close relationship between the fundamental steps of the above mentioned mechanism and the oxygen species of ceria’s {111} crystal plane [75] and this could also be the case for the nanorod sample, which shows abundance in lattice oxygen (Table 3) and easily reduced (Table 2) species. The aforementioned mechanism reveals the significance of the support’s redox properties, as the synergism observed in the Fe2O3/CeO2 samples is mainly due to the Ce4+/Ce3+ and Fe3+/Fe2+ redox couples [50]. In a similar manner, Luo et al. [74] have shown that high ratios of Fe2+/Fe3+ and Ce3+/Ce4+ favor the conversion of CO in the inverse CeO2-Fe2O3 catalysts. In general, the Fe2+/Fe3+ pairs are considered catalytic centers for the oxidation of CO as the coexistence of Fe2+/Fe3+ and Ce4+/Ce3+ pairs facilitate the electron transfer between the mixed sites Fe2+-Ce4+ and/or Fe3+-Ce3+, leading to enhanced CO oxidation activity [74,76], while the presence of Fe2+ and Ce3+ ions is related to the formation of oxygen vacancies [74]. Moreover, Chen et al. [77] have shown by DFT computational studies of CO oxidation over iron-modified ceria {111} surfaces that the CO molecule is adsorbed to the iron adatom which is then oxidized by the lattice oxygen, resulting in the desorption of CO2 and the formation of oxygen vacancies, which is considered to be the rate-determining step.
In conclusion, the enhanced catalytic behavior of the Fe2O3/CeO2 sample of rod-like morphology could be mainly attributed to its superior reducibility and oxygen kinetics, closely related to the abundance in weakly bound oxygen species (Table 2) and Fe2+ ions (Table 3). In view of this fact, the above statements regarding structure–function relationships can be further corroborated by the perfect relationship between the catalytic performance and the surface-to-bulk ratio (Os/Ob) (Figure 9), as it has been similarly reported by our group [18] for CO oxidation in copper-ceria samples. Furthermore, it is worth pointing out that the CO oxidation performance follows the same order, namely nanorods > nanopolyhedra > nanocubes, regardless of the active phase used, as the above mentioned trend was also observed in CuO/CeO2 nanoparticles of the same morphology, clearly reflecting the key role of support morphology on the catalytic behavior [18].

3. Materials and Methods

3.1. Materials Synthesis

In the present work, all chemicals were of analytical reagent grade. Ce(NO3)3·6H2O (purity ≥ 99.0%, Fluka, Bucharest, Romania) and Fe(NO3)3·9H2O (≥ 98%, Sigma-Aldrich, St. Louis, MO, USA) were the precursors used for the synthesis of bare ceria and iron-ceria samples. NaOH (purity ≥ 98%, Sigma-Aldrich, St. Louis, MO, USA) and absolute ethanol (≥ 98%, Honeywell, Charlotte, North Carolina, USA) were also used during preparation procedures. Firstly, the bare ceria samples were prepared by the hydrothermal method as thoroughly described in our previous work [18]. In brief, appropriate amounts of Ce(NO3)3·6H2O and NaOH were dissolved in double deionized water, mixed under vigorous stirring for 1 h and aged for 24 h, at 90 °C for ceria nanorods and nanopolyhedra and at 180 °C for ceria nanocubes. Subsequently, centrifugation was used for the recovery of the solid products which were extensively washed with double deionized water until pH 7 for the removal of any co-precipitated salts, as well as absolute ethanol in order to avoid the agglomeration of the nanoparticles. Finally, the resulting precipitate was dried at 90 °C for 12 h and calcined at 500 °C for 2 h under air flow (heating ramp 5 °C/min). The bare ceria samples are denoted as CeO2-NX, where NX corresponds to NR–nanorods, NP–nanopolyhedra, and NC–nanocubes.
The Fe2O3/CeO2-NX mixed catalysts were prepared by the wet impregnation method, employing an aqueous solution of Fe(NO3)3·9H2O, in order to obtain an atomic ratio Fe/(Fe+Ce) of 0.2, which corresponds to a Fe loading of 7.5 wt.%. This particular ratio was dictated from our previous studies over a series of MOx/CeO2 catalysts where the M/(M + Ce) atomic content is always kept constant to 0.2 [18,78]. Moreover, relevant literature studies over FeOx/CeO2 catalysts revealed that optimum redox/surface properties can be obtained at similar metal contents, e.g., [40,50]. Heating of the resulting suspensions under stirring until water evaporation, drying at 90 °C for 12 h, and final calcination at 500 °C for 2 h under air flow (heating ramp 5 °C/min) occurred.
For comparison purposes, two additional samples were synthesized. A bare iron oxide sample denoted as Fe2O3-D was prepared by thermal decomposition of Fe(NO3)3·9H2O at 500 °C for 2 h, and an iron-ceria mixed oxide was prepared as a physical mixture of 7.5 wt.% Fe2O3-D and 92.5 wt.% CeO2-NR, as it was mixed in agate by hand.

3.2. Materials Characterization

The porosity of the materials was evaluated by the N2-adsorption isotherms at –196 °C, using an ASAP 2010 (Micromeritics, Norcross, GA, USA) apparatus (from ReQuimTe Analyses Laboratory, Universidade Nova de Lisboa, Portugal). Samples were previously degassed at 300 °C for 6 h. The specific surface area was calculated by the Brunauer-Emmett-Teller (BET) equation [79].
Structural characterization was carried out by means of XRD in a PAN’alytical X’Pert MPD (PANanalytical, Almelo, Netherlands) equipped with a X’Celerator detector and secondary monochromator (Cu Kα λ = 0.154 nm, 50 kV, 40 mA; data recorded at a 0.017° step size, 100 s/step) in University of Trás-os-Montes e Alto Douro. The collected spectra were analyzed by Rietveld refinement using PowderCell software (by Werner Kraus and Gert Nolze, http://www.ccp14.ac.uk), allowing the determination of crystallite sizes by means of the Williamson–Hall plot.
The samples were imaged by TEM. The analyses were performed on a Leo 906E apparatus (Austin, TX, USA), at 120 kV in University of Trás-os-Montes e Alto Douro. Samples were prepared ultrasonically dispersion and a 400 mesh formvar/carbon copper grid (Agar Scientific, Essex, UK) was dipped into the solution for the TEM analysis.
The surface morphology was also investigated by Scanning Electron Microscopy (SEM, JEOL JSM-6390LV, JEOL Ltd., Akishima, Tokyo, Japan), operating at 20 keV, equipped with an energy dispersive X-ray spectrometry (EDS) system. The powders were placed on double-sided adhesive tape and sputtered with Au for 39 seconds in order to create a coating with a thickness of 10 nm, approximately. The specimens were observed under two different detection modes: secondary and backscattered electrons.
The redox properties were assessed by TPR experiments in an AMI-200 Catalyst Characterization Instrument (Altamira Instruments, Pittsburgh, PA, USA), employing H2 as a reducing agent. In a typical H2-TPR experiment, 50 mg of the sample (grain size 180–355 μm) was heated up to 1100 °C (10 °C/min), under H2 flow (1.5 cm3) balanced with He (29 cm3). The amount of H2 consumed (mmol g−1) was calculated by taking into account the integrated area of TPR peaks, calibrated against a known amount of CuO standard sample [80,81].
The surface composition and the chemical state of each element were determined by XPS analyses, performed on a VG Scientific ESCALAB 200A spectrometer using Al Kα radiation (1486.6 eV) in CEMUP. The charge effect was corrected using the C1s peak as a reference (binding energy of 285 eV). The CASAXPS software (http://www.casaxps.com/) was used for data analysis.

3.3. Catalytic Evaluation Studies

Catalytic oxidation of CO was performed in a quartz fixed-bed tubular microreactor (12.95 mm i.d.) at atmospheric pressure, loaded with 0.10 g of catalyst. The reaction stream consisted of 2000 ppm of CO and 1 vol.% O2 balanced with He in a total feed stream of 80 mL min−1 which was controlled by EL-Flow Bronkhorst Mass Flow controllers (Bronkhorst High-Tech B.V., Ruurlo, Netherlands) and homogenized by a mixing chamber. The catalyst temperature was recorded using a K-Type thermocouple placed in the catalyst bed and the gas hour space velocity (GHSV) of the feed stream was 40,000 h−1.
Prior to catalytic experiments, all samples were treated under a 20 cm3/min flow of 20 vol.% O2 in He heating up to 480 °C with 10 degrees/min. Samples remained at 480 °C for 30 min and then the temperature was decreased to 25 °C with the same rate. Final purge with He flow was carried out in order to remove physiosorbed species.
Catalytic evaluation measurements were carried out every 20 degrees up to 500 °C. CO and CO2 in the effluent gas were analyzed by gas chromatography (GC) using a fast response micro GC Varian CP-4900 equipped with 2 fully equipped channels with separated TCD detectors, injectors and 2 capillary columns (Molecular Sieve 5X and PoraPlot Q), all provided from Varian B.V., Middelburg, Netherlands. The conversion of CO (XCO) was calculated from the difference in CO concentration between the inlet and outlet gas streams, according to the equation:
X C O ( % ) = [ C O ] i n [ C O ] o u t [ C O ] i n × 100
The specific reaction rate (r, mol m−2 s−1) of the CO conversion was also estimated under differential reaction conditions (XCO < 15%, T=125oC, W/F = 0.075 g s cm−3) using the following formula:
r ( mol   m 2   s 1 )   =   X CO × [ CO ] in × F ( cm 3 min ) 100 × 60 ( s min ) × V m ( cm 3 mol ) × m cat ( g ) × S BET ( m 2 g )
where F and Vm are the total flow rate and gas molar volume, respectively, at standard ambient temperature and pressure conditions (298 K and 1 bar), mcat is the catalyst’s mass, and SBET is the surface area.

4. Conclusions

In the present work, ceria nanostructures of different morphology (cubes, polyhedra, rods) were synthesized by the hydrothermal method and used as carriers for the iron oxide phase. The bare ceria samples, as well as the iron-ceria mixed oxides, were catalytically evaluated in the oxidation of CO. Regarding the CO conversion performance, the same trend was observed in both bare ceria and Fe2O3/CeO2 mixed oxides, namely nanorods > nanopolyhedra > nanocubes, demonstrating the crucial role of support morphology, with iron addition, however, significantly enhancing the catalytic behavior. In terms of half-conversion temperature (T50), iron-ceria nanorods (Fe2O3/CeO2-NR) exhibit the best catalytic performance (T50 = 166 °C), attributed mainly to their enhanced reducibility and oxygen kinetics linked to their abundance in loosely bound oxygen species, their highest amount in lattice oxygen, and their largest amount of Fe2+. The present findings demonstrate that the co-doping of cheap and abundant transition metals (such as iron) on a reducible carrier (such as ceria), along with the fine-tuning of their morphology, should be considered as a novel approach towards developing highly active, noble metal-free, catalysts.

Author Contributions

M.L. and S.S contributed to materials synthesis and characterization, results interpretation and paper writing; S.A.C.C. contributed to materials characterization; P.K.P. and V.N.S. contributed to catalytic evaluation studies, results interpretation and paper writing; M.K. contributed to the conception, design, results interpretation and writing of the paper; All authors contributed to the discussion, read and approved the final version of the manuscript.

Funding

This research has been co-financed by the European Union and Greek national funds through the Operational Program Competitiveness, Entrepreneurship and Innovation, under the call RESEARCH–CREATE–INNOVATE (project code: T1EDK-00094). This work was also financially supported by Associate Laboratory LSRE-LCM—UID/EQU/50020/2019—funded by national funds through FCT/MCTES (PIDDAC). S.A.C.C. acknowledges Fundação para a Ciência e a Tecnologia (Portugal) for Investigador FCT program (IF/01381/2013/CP1160/CT0007), with financing from the European Social Fund and the Human Potential Operational Program.

Acknowledgments

We are grateful to Carlos Sá (CEMUP) for the assistance with the XPS measurements, Pedro Tavares (UTAD) for the TEM and XRD analyses and Nuno Costa (ReQuimTe) for the N2 adsorption results.

Conflicts of Interest

The authors declare no conflict of interest.

References

  1. Paier, J.; Penschke, C.; Sauer, J. Oxygen defects and surface chemistry of ceria: Quantum chemical studies compared to experiment. Chem. Rev. 2013, 113, 3949–3985. [Google Scholar] [CrossRef]
  2. Montini, T.; Melchionna, M.; Monai, M.; Fornasiero, P. Fundamentals and Catalytic Applications of CeO2-Based Materials. Chem. Rev. 2016, 116, 5987–6041. [Google Scholar] [CrossRef] [PubMed]
  3. Tang, W.-X.; Gao, P.-X. Nanostructured cerium oxide: preparation, characterization, and application in energy and environmental catalysis. MRS Commun. 2016, 6, 311–329. [Google Scholar] [CrossRef]
  4. Sun, C.; Xue, D. Size-dependent oxygen storage ability of nano-sized ceria. Phys. Chem. Chem. Phys. 2013, 15, 14414–14419. [Google Scholar] [CrossRef] [PubMed]
  5. Nolan, M. Surface Effects in the Reactivity of Ceria: A First Principles Perspective; Elsevier Inc.: Amsterdam, The Netherlands, 2015; ISBN 9780128013403. [Google Scholar]
  6. Devaiah, D.; Reddy, L.H.; Park, S.E.; Reddy, B.M. Ceria–zirconia mixed oxides: Synthetic methods and applications. Catal. Rev. Sci. Eng. 2018, 60, 177–277. [Google Scholar] [CrossRef]
  7. Zhang, D.; Du, X.; Shi, L.; Gao, R. Shape-controlled synthesis and catalytic application of ceria nanomaterials. Dalton Trans. 2012, 41, 14455–14475. [Google Scholar] [CrossRef]
  8. Melchionna, M.; Fornasiero, P. The role of ceria-based nanostructured materials in energy applications. Mater. Today 2014, 17, 349–357. [Google Scholar] [CrossRef]
  9. Stathopoulos, V.N.; Costa, C.N.; Pomonis, P.J.; Efstathiou, A.M. The CH4/NO/O2 “lean-deNOx” reaction on mesoporous Mn-based mixed oxides. Top. Catal. 2001, 16, 231–235. [Google Scholar] [CrossRef]
  10. Stathopoulos, V.N.; Petrakis, D.E.; Hudson, M.; Falaras, P.; Neofytides, S.G.; Pomonis, P.J. Novel Mn-based Mesoporous Mixed Oxidic Solids. Stud. Surf. Sci. Catal. 2000, 128, 593–602. [Google Scholar] [CrossRef]
  11. Stathopoulos, V.N.; Belessi, V.C.; Costa, C.N.; Neophytides, S.; Falaras, P.; Efstathiou, A.M.; Pomonis, P.J. Catalytic activity of high surface area mesoporous Mn-based mixed oxides for the deep oxidation of methane and lean-NOx reduction. Stud. Surf. Sci. Catal. 2000, 130, 1529–1534. [Google Scholar] [CrossRef]
  12. Stathopoulos, V.N.; Belessi, V.C.; Bakas, T.V.; Neophytides, S.G.; Costa, C.N.; Pomonis, P.J.; Efstathiou, A.M. Comparative study of La–Sr–Fe–O perovskite-type oxides prepared by ceramic and surfactant methods over the CH4 and H2 lean-deNOx. Appl. Catal. B Environ. 2009, 93, 1–11. [Google Scholar] [CrossRef]
  13. Stathopoulos, V.N.; Belessi, V.C.; Ladavos, A.K. Samarium based high surface area perovskite type oxides SmFe1-XAlXO3 (X = 0.00, 0.50, 0.95). Part II, Catalytic combustion of CH4. React. Kinet. Catal. Lett. 2001, 72, 49–55. [Google Scholar] [CrossRef]
  14. Corberán, V.C.; Rives, V.; Stathopoulos, V. Chapter 7—Recent Applications of Nanometal Oxide Catalysts in Oxidation Reactions. In Advanced Nanomaterials for Catalysis and Energy; Synthesis, Characterization and Applications; Elsevier: Amsterdam, The Netherlands, 2019; pp. 227–293. ISBN 9780128148075. [Google Scholar]
  15. Qiao, Z.A.; Wu, Z.; Dai, S. Shape-controlled ceria-based nanostructures for catalysis applications. ChemSusChem 2013, 6, 1821–1833. [Google Scholar] [CrossRef] [PubMed]
  16. Matte, L.P.; Kilian, A.S.; Luza, L.; Alves, M.C.M.; Morais, J.; Baptista, D.L.; Dupont, J.; Bernardi, F. Influence of the CeO2 Support on the Reduction Properties of Cu/CeO2 and Ni/CeO2 Nanoparticles. J. Phys. Chem. C 2015, 119, 26459–26470. [Google Scholar] [CrossRef]
  17. Zabilskiy, M.; Djinović, P.; Tchernychova, E.; Tkachenko, O.P.; Kustov, L.M.; Pintar, A. Nanoshaped CuO/CeO2 Materials: Effect of the Exposed Ceria Surfaces on Catalytic Activity in N2O Decomposition Reaction. ACS Catal. 2015, 5, 5357–5365. [Google Scholar] [CrossRef]
  18. Lykaki, M.; Pachatouridou, E.; Carabineiro, S.A.C.; Iliopoulou, E.; Andriopoulou, C.; Kallithrakas-Kontos, N.; Boghosian, S.; Konsolakis, M. Ceria nanoparticles shape effects on the structural defects and surface chemistry: Implications in CO oxidation by Cu/CeO2 catalysts. Appl. Catal. B Environ. 2018, 230, 18–28. [Google Scholar] [CrossRef]
  19. Wu, Z.; Li, M.; Overbury, S.H. On the structure dependence of CO oxidation over CeO2 nanocrystals with well-defined surface planes. J. Catal. 2012, 285, 61–73. [Google Scholar] [CrossRef]
  20. Vilé, G.; Colussi, S.; Krumeich, F.; Trovarelli, A.; Pérez-Ramírez, J. Opposite face sensitivity of CeO2 in hydrogenation and oxidation catalysis. Angew. Chem. Int. Ed. 2014, 53, 12069–12072. [Google Scholar] [CrossRef] [PubMed]
  21. Aneggi, E.; Wiater, D.; De Leitenburg, C.; Llorca, J.; Trovarelli, A. Shape-dependent activity of ceria in soot combustion. ACS Catal. 2014, 4, 172–181. [Google Scholar] [CrossRef]
  22. Cargnello, M.; Doan-Nguyen, V.V.T.; Gordon, T.R.; Diaz, R.E.; Stach, E.A.; Gorte, R.J.; Fornasiero, P.; Murray, C.B. Control of Metal Nanocrystal Size Reveals Metal-Support Interface Role for Ceria Catalysts. Science 2013, 341, 771–773. [Google Scholar] [CrossRef] [PubMed]
  23. Ahmadi, M.; Mistry, H.; Roldan Cuenya, B. Tailoring the Catalytic Properties of Metal Nanoparticles via Support Interactions. J. Phys. Chem. Lett. 2016, 7, 3519–3533. [Google Scholar] [CrossRef] [PubMed]
  24. Qiu, N.; Zhang, J.; Wu, Z. Peculiar surface–interface properties of nanocrystalline ceria–cobalt oxides with enhanced oxygen storage capacity. Phys. Chem. Chem. Phys. 2014, 16, 22659–22664. [Google Scholar] [CrossRef] [PubMed]
  25. Konsolakis, M.; Carabineiro, S.A.C.; Papista, E.; Marnellos, G.E.; Tavares, P.B.; Agostinho Moreira, J.; Romaguera-Barcelay, Y.; Figueiredo, J.L. Effect of preparation method on the solid state properties and the deN2O performance of CuO-CeO2 oxides. Catal. Sci. Technol. 2015, 5, 3714–3727. [Google Scholar] [CrossRef]
  26. Konsolakis, M. The role of Copper–Ceria interactions in catalysis science: Recent theoretical and experimental advances. Appl. Catal. B Environ. 2016, 198, 49–66. [Google Scholar] [CrossRef]
  27. Wu, K.; Sun, L.D.; Yan, C.H. Recent Progress in Well-Controlled Synthesis of Ceria-Based Nanocatalysts towards Enhanced Catalytic Performance. Adv. Energy Mater. 2016, 6, 1600501. [Google Scholar] [CrossRef]
  28. Devaiah, D.; Thrimurthulu, G.; Smirniotis, P.G.; Reddy, B.M. Nanocrystalline alumina-supported ceria-praseodymia solid solutions: Structural characteristics and catalytic CO oxidation. RSC Adv. 2016, 6, 44826–44837. [Google Scholar] [CrossRef]
  29. Devaiah, D.; Tsuzuki, T.; Thirupathi, B.; Smirniotis, P.G.; Reddy, B.M. Ce0.80M0.12Sn0.08O2–δ (M = Hf, Zr, Pr, and La) ternary oxide solid solutions with superior properties for CO oxidation. RSC Adv. 2015, 5, 30275–30285. [Google Scholar] [CrossRef]
  30. Zhu, X.; Du, Y.; Wang, H.; Wei, Y.; Li, K.; Sun, L. Chemical interaction of Ce-Fe mixed oxides for methane selective oxidation. J. Rare Earths 2014, 32, 824–830. [Google Scholar] [CrossRef]
  31. Bao, H.; Chen, X.; Fang, J.; Jiang, Z.; Huang, W. Structure-activity Relation of Fe2O3–CeO2 Composite Catalysts in CO Oxidation. Catal. Lett. 2008, 125, 160–167. [Google Scholar] [CrossRef]
  32. Wang, W.; Li, W.; Guo, R.; Chen, Q.; Wang, Q.; Pan, W.; Hu, G. A CeFeOx catalyst for catalytic oxidation of NO to NO2. J. Rare Earths 2016, 34, 876–881. [Google Scholar] [CrossRef]
  33. Tan, L.; Tao, Q.; Gao, H.; Li, J.; Jia, D.; Yang, M. Preparation and catalytic performance of mesoporous ceria-base composites CuO/CeO2, Fe2O3/CeO2 and La2O3/CeO2. J. Porous Mater. 2017, 24, 795–803. [Google Scholar] [CrossRef]
  34. Massa, P.; Dafinov, A.; Cabello, F.M.; Fenoglio, R. Catalytic wet peroxide oxidation of phenolic solutions over Fe2O3/CeO2 and WO3/CeO2 catalyst systems. Catal. Commun. 2008, 9, 1533–1538. [Google Scholar] [CrossRef]
  35. Han, J.; Meeprasert, J.; Maitarad, P.; Nammuangruk, S.; Shi, L.; Zhang, D. Investigation of the Facet-Dependent Catalytic Performance of Fe2O3/CeO2 for the Selective Catalytic Reduction of NO with NH3. J. Phys. Chem. C 2016, 120, 1523–1533. [Google Scholar] [CrossRef]
  36. Prieto-Centurion, D.; Eaton, T.R.; Roberts, C.A.; Fanson, P.T.; Notestein, J.M. Catalytic reduction of NO with H2 over redox-cycling Fe on CeO2. Appl. Catal. B Environ. 2015, 168–169, 68–76. [Google Scholar] [CrossRef]
  37. Nadar, A.; Banerjee, A.M.; Pai, M.R.; Pai, R.V.; Meena, S.S.; Tewari, R.; Tripathi, A.K. Catalytic properties of dispersed iron oxides Fe2O3/MO2 (M = Zr, Ce, Ti and Si) for sulfuric acid decomposition reaction: Role of support. Int. J. Hydrogen Energy 2018, 43, 37–52. [Google Scholar] [CrossRef]
  38. Perez-Alonso, F.J.; Melián-Cabrera, I.; López Granados, M.; Kapteijn, F.; Fierro, J.L.G. Synergy of FexCe1-xO2 mixed oxides for N2O decomposition. J. Catal. 2006, 239, 340–346. [Google Scholar] [CrossRef]
  39. Shen, Q.; Lu, G.; Du, C.; Guo, Y.; Wang, Y.; Guo, Y.; Gong, X. Role and reduction of NOx in the catalytic combustion of soot over iron—ceria mixed oxide catalyst. Chem. Eng. J. 2013, 218, 164–172. [Google Scholar] [CrossRef]
  40. Sudarsanam, P.; Hillary, B.; Amin, M.H.; Rockstroh, N.; Bentrup, U.; Brückner, A.; Bhargava, S.K. Heterostructured Copper-Ceria and Iron-Ceria Nanorods: Role of Morphology, Redox, and Acid Properties in Catalytic Diesel Soot Combustion. Langmuir 2018, 34, 2663–2673. [Google Scholar] [CrossRef]
  41. Lu, F.; Jiang, B.B.; Wang, J.; Huang, Z.; Liao, Z.; Yang, Y. Insights into the improvement effect of Fe doping into the CeO2 catalyst for vapor phase ketonization of carboxylic acids. Mol. Catal. 2018, 444, 22–33. [Google Scholar] [CrossRef]
  42. Li, K.; Wang, H.; Wei, Y.; Yan, D. Transformation of methane into synthesis gas using the redox property of Ce-Fe mixed oxides: Effect of calcination temperature. Int. J. Hydrogen Energy 2011, 36, 3471–3482. [Google Scholar] [CrossRef]
  43. Bao, H.; Qian, K.; Fang, J.; Huang, W. Fe-doped CeO2 solid solutions: Substituting-site doping versus interstitial-site doping, bulk doping versus surface doping. Appl. Surf. Sci. 2017, 414, 131–139. [Google Scholar] [CrossRef]
  44. Reddy, A.S.; Chen, C.Y.; Chen, C.C.; Chien, S.H.; Lin, C.J.; Lin, K.H.; Chen, C.L.; Chang, S.C. Synthesis and characterization of Fe/CeO2 catalysts: Epoxidation of cyclohexene. J. Mol. Catal. A Chem. 2010, 318, 60–67. [Google Scholar] [CrossRef]
  45. Torrente-Murciano, L.; Chapman, R.S.L.; Narvaez-Dinamarca, A.; Mattia, D.; Jones, M.D. Effect of nanostructured ceria as support for the iron catalysed hydrogenation of CO2 into hydrocarbons. Phys. Chem. Chem. Phys. 2016, 18, 15496–15500. [Google Scholar] [CrossRef]
  46. Kumar, S.; Sharma, C. Synthesis, characterization and catalytic wet air oxidation property of mesoporous Ce1-xFexO2 mixed oxides. Mater. Chem. Phys. 2015, 155, 223–231. [Google Scholar] [CrossRef]
  47. Trens, P.; Stathopoulos, V.; Hudson, M.J.; Pomonis, P. Synthesis and characterization of packed mesoporous tungsteno-silicates: application to the catalytic dehydrogenation of 2-propanol. Appl. Catal. A Gen. 2004, 263, 103–108. [Google Scholar] [CrossRef]
  48. Farahmandjou, M.; Zarinkamar, M. Synthesis of nano-sized ceria (CeO2) particles via a cerium hydroxy carbonate precursor and the effect of reaction temperature on particle morphology. J. Ultrafine Grained Nanostructured Mater. 2015, 48, 5–10. [Google Scholar] [CrossRef]
  49. Sharma, V.; Eberhardt, K.M.; Sharma, R.; Adams, J.B.; Crozier, P.A. A spray drying system for synthesis of rare-earth doped cerium oxide nanoparticles. Chem. Phys. Lett. 2010, 495, 280–286. [Google Scholar] [CrossRef]
  50. Sahoo, T.R.; Armandi, M.; Arletti, R.; Piumetti, M.; Bensaid, S.; Manzoli, M.; Panda, S.R.; Bonelli, B. Pure and Fe-doped CeO2 nanoparticles obtained by microwave assisted combustion synthesis: Physico-chemical properties ruling their catalytic activity towards CO oxidation and soot combustion. Appl. Catal. B Environ. 2017, 211, 31–45. [Google Scholar] [CrossRef]
  51. Carabineiro, S.A.C.; Papista, E.; Marnellos, G.E.; Tavares, P.B.; Maldonado-Hódar, F.J.; Konsolakis, M. Catalytic decomposition of N2O on inorganic oxides: Effect of doping with Au nanoparticles. Mol. Catal. 2017, 436, 78–89. [Google Scholar] [CrossRef]
  52. Trpkov, D.; Panjan, M.; Kopanja, L.; Tadić, M. Hydrothermal synthesis, morphology, magnetic properties and self-assembly of hierarchical α-Fe2O3 (hematite) mushroom-, cube- and sphere-like superstructures. Appl. Surf. Sci. 2018, 457, 427–438. [Google Scholar] [CrossRef]
  53. Zhu, X.; Wei, Y.; Wang, H.; Li, K. Ce-Fe oxygen carriers for chemical-looping steam methane reforming. Int. J. Hydrogen Energy 2013, 38, 4492–4501. [Google Scholar] [CrossRef]
  54. Ma, S.; Chen, S.; Zhu, M.; Zhao, Z.; Hu, J.; Wu, M.; Toan, S.; Xiang, W. Enhanced sintering resistance of Fe2O3/CeO2 oxygen carrier for chemical looping hydrogen generation using core-shell structure. Int. J. Hydrogen Energy 2019, 44, 6491–6504. [Google Scholar] [CrossRef]
  55. Li, K.; Wang, H.; Wei, Y.; Yan, D. Syngas production from methane and air via a redox process using Ce-Fe mixed oxides as oxygen carriers. Appl. Catal. B Environ. 2010, 97, 361–372. [Google Scholar] [CrossRef]
  56. Channei, D.; Inceesungvorn, B.; Wetchakun, N.; Phanichphant, S.; Nakaruk, A.; Koshy, P.; Sorrell, C.C. Photocatalytic activity under visible light of Fe-doped CeO2 nanoparticles synthesized by flame spray pyrolysis. Ceram. Int. 2013, 39, 3129–3134. [Google Scholar] [CrossRef]
  57. Hosseini, S.Y.; Khosravi-Nikou, M.R.; Shariati, A. Production of hydrogen and syngas using chemical looping technology via cerium-iron mixed oxides. Chem. Eng. Process. Process Intensif. 2019, 139, 23–33. [Google Scholar] [CrossRef]
  58. Qiao, D.; Lu, G.; Liu, X.; Guo, Y.; Wang, Y.; Guo, Y. Preparation of Ce1-xFexO2 solid solution and its catalytic performance for oxidation of CH4 and CO. J. Mater. Sci. 2011, 46, 3500–3506. [Google Scholar] [CrossRef]
  59. Li, D.; Li, K.; Xu, R.; Wang, H.; Tian, D.; Wei, Y.; Zhu, X.; Zeng, C.; Zeng, L. Ce1-xFexO2-δ catalysts for catalytic methane combustion: Role of oxygen vacancy and structural dependence. Catal. Today 2018, 318, 73–85. [Google Scholar] [CrossRef]
  60. Désaunay, T.; Bonura, G.; Chiodo, V.; Freni, S.; Couzinié, J.P.; Bourgon, J.; Ringuedé, A.; Labat, F.; Adamo, C.; Cassir, M. Surface-dependent oxidation of H2 on CeO2 surfaces. J. Catal. 2013, 297, 193–201. [Google Scholar] [CrossRef]
  61. Alvarez, P.; Araya, P.; Rojas, R.; Guerrero, S.; Aguila, G. Activity of alumina supported Fe catalysts for N2O decomposition: effects of the iron content and thermal treatment. J. Chil. Chem. Soc. 2017, 62, 3752–3759. [Google Scholar] [CrossRef]
  62. Zieliński, J.; Zglinicka, I.; Znak, L.; Kaszkur, Z. Reduction of Fe2O3 with hydrogen. Appl. Catal. A Gen. 2010, 381, 191–196. [Google Scholar] [CrossRef]
  63. Pudukudy, M.; Yaakob, Z.; Jia, Q.; Takriff, M.S. Catalytic decomposition of methane over rare earth metal (Ce and La) oxides supported iron catalysts. Appl. Surf. Sci. 2019, 467, 236–248. [Google Scholar] [CrossRef]
  64. Cheng, X.; Zhang, X.; Su, D.; Wang, Z.; Chang, J.; Ma, C. NO reduction by CO over copper catalyst supported on mixed CeO2 and Fe2O3: Catalyst design and activity test. Appl. Catal. B Environ. 2018, 239, 485–501. [Google Scholar] [CrossRef]
  65. Zhang, X.; Wang, J.; Song, Z.; Zhao, H.; Xing, Y.; Zhao, M.; Zhao, J.; Ma, Z.; Zhang, P.; Tsubaki, N. Promotion of surface acidity and surface species of doped Fe and SO42− over CeO2 catalytic for NH3-SCR reaction. Mol. Catal. 2019, 463, 1–7. [Google Scholar] [CrossRef]
  66. Wang, C.; Cheng, Q.; Wang, X.; Ma, K.; Bai, X.; Tan, S.; Tian, Y.; Ding, T.; Zheng, L.; Zhang, J.; et al. Enhanced catalytic performance for CO preferential oxidation over CuO catalysts supported on highly defective CeO2 nanocrystals. Appl. Surf. Sci. 2017, 422, 932–943. [Google Scholar] [CrossRef]
  67. Piumetti, M.; Andana, T.; Bensaid, S.; Russo, N.; Fino, D.; Pirone, R. Study on the CO Oxidation over Ceria-Based Nanocatalysts. Nanoscale Res. Lett. 2016, 11, 165. [Google Scholar] [CrossRef]
  68. Wu, Z.; Li, M.; Howe, J.; Meyer, H.M.; Overbury, S.H. Probing defect sites on CeO2 nanocrystals with well-defined surface planes by Raman spectroscopy and O2 adsorption. Langmuir 2010, 26, 16595–16606. [Google Scholar] [CrossRef]
  69. Hillary, B.; Sudarsanam, P.; Amin, M.H.; Bhargava, S.K. Nanoscale Cobalt-Manganese Oxide Catalyst Supported on Shape-Controlled Cerium Oxide: Effect of Nanointerface Configuration on Structural, Redox, and Catalytic Properties. Langmuir 2017, 33, 1743–1750. [Google Scholar] [CrossRef]
  70. Andana, T.; Piumetti, M.; Bensaid, S.; Veyre, L.; Thieuleux, C.; Russo, N.; Fino, D.; Quadrelli, E.A.; Pirone, R. CuO nanoparticles supported by ceria for NOx-assisted soot oxidation: insight into catalytic activity and sintering. Appl. Catal. B Environ. 2017, 216, 41–58. [Google Scholar] [CrossRef]
  71. Konsolakis, M.; Ioakimidis, Z.; Kraia, T.; Marnellos, G.E. Hydrogen Production by Ethanol Steam Reforming (ESR) over CeO2 Supported Transition Metal (Fe, Co, Ni, Cu) Catalysts: Insight into the Structure-Activity Relationship. Catalysts 2016, 6, 39. [Google Scholar] [CrossRef]
  72. Wang, H.; Jin, B.; Wang, H.; Ma, N.; Liu, W.; Weng, D.; Wu, X.; Liu, S. Study of Ag promoted Fe2O3@CeO2 as superior soot oxidation catalysts: The role of Fe2O3 crystal plane and tandem oxygen delivery. Appl. Catal. B Environ. 2018, 237, 251–262. [Google Scholar] [CrossRef]
  73. Liu, F.; Wang, Z.; Wang, D.; Chen, D.; Chen, F.; Li, X. Morphology and Crystal-Plane Effects of Fe/W-CeO2 for Selective Catalytic Reduction of NO with NH3. Catalysts 2019, 9, 288. [Google Scholar] [CrossRef]
  74. Luo, Y.; Chen, R.; Peng, W.; Tang, G.; Gao, X. Inverse CeO2-Fe2O3 catalyst for superior low-temperature CO conversion efficiency. Appl. Surf. Sci. 2017, 416, 911–917. [Google Scholar] [CrossRef]
  75. Kim, K.; Han, J.W. Mechanistic study for enhanced CO oxidation activity on (Mn,Fe) co-doped CeO2 (111). Catal. Today 2017, 293–294, 82–88. [Google Scholar] [CrossRef]
  76. Said, A.E.A.A.; Abd El-Wahab, M.M.M.; Goda, M.N. Synthesis and characterization of pure and (Ce, Zr, Ag) doped mesoporous CuO-Fe2O3 as highly efficient and stable nanocatalysts for CO oxidation at low temperature. Appl. Surf. Sci. 2016, 390, 649–665. [Google Scholar] [CrossRef]
  77. Chen, H.T.; Chang, J.G. Computational investigation of CO adsorption and oxidation on iron-modified cerium oxide. J. Phys. Chem. C 2011, 115, 14745–14753. [Google Scholar] [CrossRef]
  78. Lykaki, M.; Papista, E.; Kaklidis, N.; Carabineiro, S.A.C.; Konsolakis, M. Ceria Nanoparticles’ Morphological Effects on the N2O Decomposition Performance of Co3O4/CeO2 Mixed Oxides. Catalysts 2019, 9, 233. [Google Scholar] [CrossRef]
  79. Brunauer, S.; Emmett, P.H.; Teller, E. Adsorption of Gases in Multimolecular Layers. J. Am. Chem. Soc. 1938, 60, 309–319. [Google Scholar] [CrossRef]
  80. Xu, J.; Harmer, J.; Li, G.; Chapman, T.; Collier, P.; Longworth, S.; Tsang, S.C. Size dependent oxygen buffering capacity of ceria nanocrystals. Chem. Commun. 2010, 46, 1887–1889. [Google Scholar] [CrossRef]
  81. Barthos, R.; Hegyessy, A.; Klébert, S.; Valyon, J. Vanadium dispersion and catalytic activity of Pd/VOx/SBA-15 catalysts in the Wacker oxidation of ethylene. Microporous Mesoporous Mater. 2015, 207, 1–8. [Google Scholar] [CrossRef]
Figure 1. (a) Barrett–Joyner–Halenda (BJH) desorption pore size distribution (PSD) and (b) adsorption–desorption isotherms of bare CeO2 and Fe2O3/CeO2 samples.
Catalysts 09 00371 g001aCatalysts 09 00371 g001b
Figure 2. XRD patterns of bare CeO2, Fe2O3-D, and Fe2O3/CeO2 samples.
Catalysts 09 00371 g002
Figure 3. TEM images of the samples: (a) CeO2-NR, (b) CeO2-NP, (c) CeO2-NC, (d) Fe2O3/CeO2-NR, (e) Fe2O3/CeO2-NP, and (f) Fe2O3/CeO2-NC.
Catalysts 09 00371 g003
Figure 4. SEM-EDS elemental mapping images of the samples: (ad) Fe2O3/CeO2-NR, (eh) Fe2O3/CeO2-NP, (i-l) Fe2O3/CeO2-NC.
Catalysts 09 00371 g004
Figure 5. H2-TPR profiles of bare CeO2, Fe2O3-D, and Fe2O3/CeO2 samples.
Catalysts 09 00371 g005
Figure 6. XPS spectra of (a) Ce 3d, (b) O 1s, and (c) Fe 2p of bare CeO2, Fe2O3-D, and Fe2O3/CeO2 samples.
Catalysts 09 00371 g006aCatalysts 09 00371 g006b
Figure 7. CO conversion as a function of temperature for bare CeO2 and Fe2O3/CeO2 samples of different morphology (NR, NC, and NP, as indicated in each curve). Reaction conditions: 2000 ppm CO, 1 vol.% O2, Gas Hourly Space Velocity (GHSV) = 40,000 h−1.
Catalysts 09 00371 g007
Figure 8. Arrhenius plots for CO conversion as a function of temperature for Ceria and Fe2O3/Ceria samples of different morphology (NR, NC, and NP, as indicated). Reaction conditions: 2000 ppm CO, 1 vol.% O2, GHSV = 40,000 h−1.
Catalysts 09 00371 g008
Figure 9. Relationship between the half-conversion temperature (T50) and the surface-to-bulk oxygen ratio (Os/Ob).
Catalysts 09 00371 g009
Table 1. Textural/structural characteristics of bare CeO2, Fe2O3-D, and Fe2O3/CeO2 samples.
SampleBET AnalysisXRD Analysis
BET Surface Area (m2/g)Pore Volume (cm3/g)Average Pore Diameter (nm)Crystallite Size (nm), DXRD 1
CeO2Fe2O3
CeO2-NR79.30.4824.215.0-
CeO2-NP87.90.177.911.0-
CeO2-NC37.30.2627.427.0-
Fe2O3/CeO2-NR68.60.1911.39.77.2
Fe2O3/CeO2-NP64.20.127.68.516.5
Fe2O3/CeO2-NC32.20.1923.316.852.3
Fe2O3-D27.00.1522.3-23.3
1 Calculated applying the Williamson–Hall plot after Rietveld refinement of diffractograms.
Table 2. Redox properties of bare CeO2, Fe2O3-D, and Fe2O3/CeO2 samples.
SampleH2 consumption (mmol H2/g) aOs/Ob RatioPeak Temperature (°C)
Os PeakOb PeakTotalOs PeakOb Peak
CeO2-NR0.590.521.111.13545788
CeO2-NP0.480.510.990.94555804
CeO2-NC0.410.580.990.71589809
H2 Consumption
(mmol H2/g) a
H2 Excess
(mmol H2/g) b
Peak αPeak βPeak γPeak δ
Fe2O3/CeO2-NR3.421.42390465588759
Fe2O3/CeO2-NP2.930.93384-581759
Fe2O3/CeO2-NC2.470.47377469599759
Fe2O3-D17.59-379-638-
a Estimated by the area of the corresponding TPR peaks, which is calibrated against a known amount of CuO standard sample. b Estimated by the subtraction of H2 amount required for Fe2O3 reduction in 7.5 wt.% Fe2O3/CeO2 samples (~2 mmol/g) from the total H2 consumption.
Table 3. XPS results of bare CeO2 and Fe2O3/CeO2 samples.
SampleFe2+ (%)Ce3+ (%)OI/OIIFe/(Fe + Ce)
CeO2-NR-24.32.13-
CeO2-NP-25.32.04-
CeO2-NC-23.31.99-
Fe2O3/CeO2-NR14.425.32.520.28
Fe2O3/CeO2-NP13.326.52.250.34
Fe2O3/CeO2-NC13.128.51.840.43
Table 4. Activation Energies (Ea) for the CO oxidation reaction over bare CeO2 and Fe2O3/CeO2 samples.
SampleEa (kJ mol−1) (± 0.1)R2 (from Fitting Procedure)
CeO2-NR44.20.9943
46.70.9906
CeO2-NC49.80.9916
Fe2O3/CeO2-NR53.50.9875
Fe2O3/CeO2-NP55.70.9853
Fe2O3/CeO2-NC58.60.9959
Fe2O3-D63.30.9995
Fe2O3-D + CeO2-NR48.10.9983
Table 5. CO conversion and specific activity of Fe2O3/CeO2 samples at 125 °C. Reaction conditions: 2000 ppm CO, 1 vol.% O2, GHSV = 40,000 h−1.
SampleCO Conversion (%)Specific Activity
r (nmol g−1 s−1)r (nmol m−2 s−1)
Fe2O3/CeO2-NC2.40260.80
Fe2O3/CeO2-NP4.46480.75
Fe2O3/CeO2-NR11.691261.84

