Morphology and Crystal-Plane Effects of Fe/W-CeO2 for Selective Catalytic Reduction of NO with NH3


Abstract
:1. Introduction
2. Results
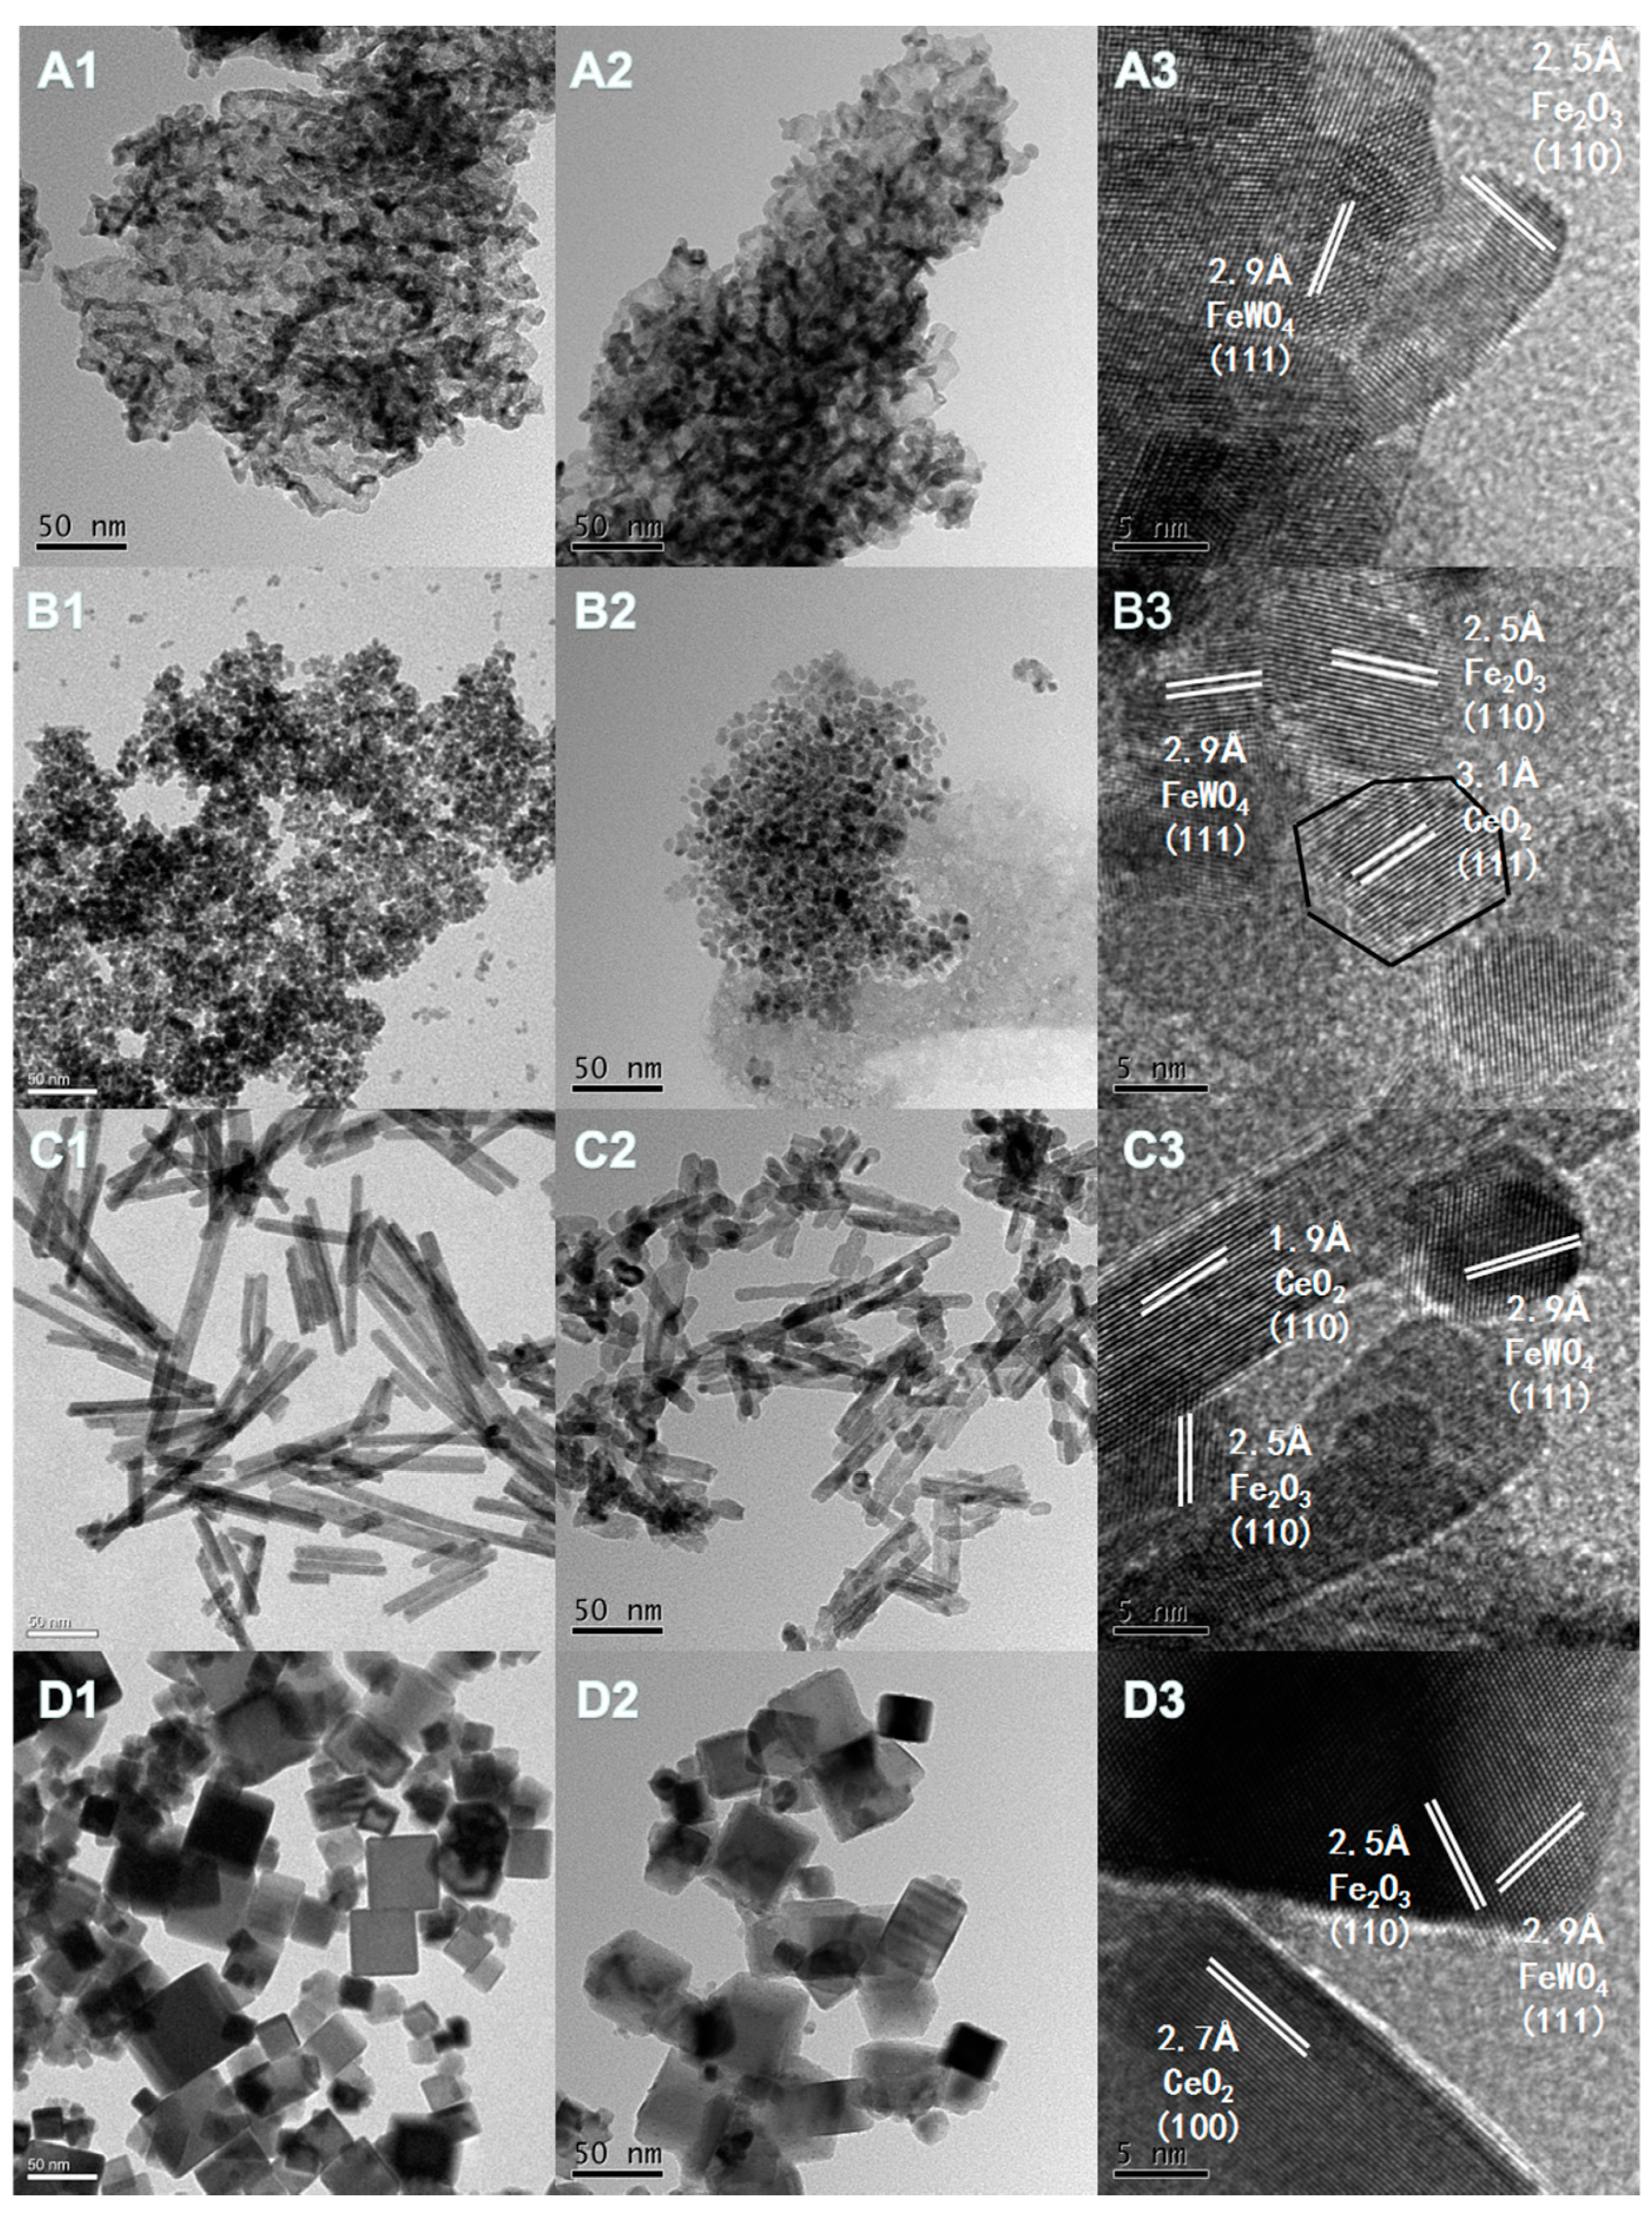
2.1. TEM and HRTEM Analysis
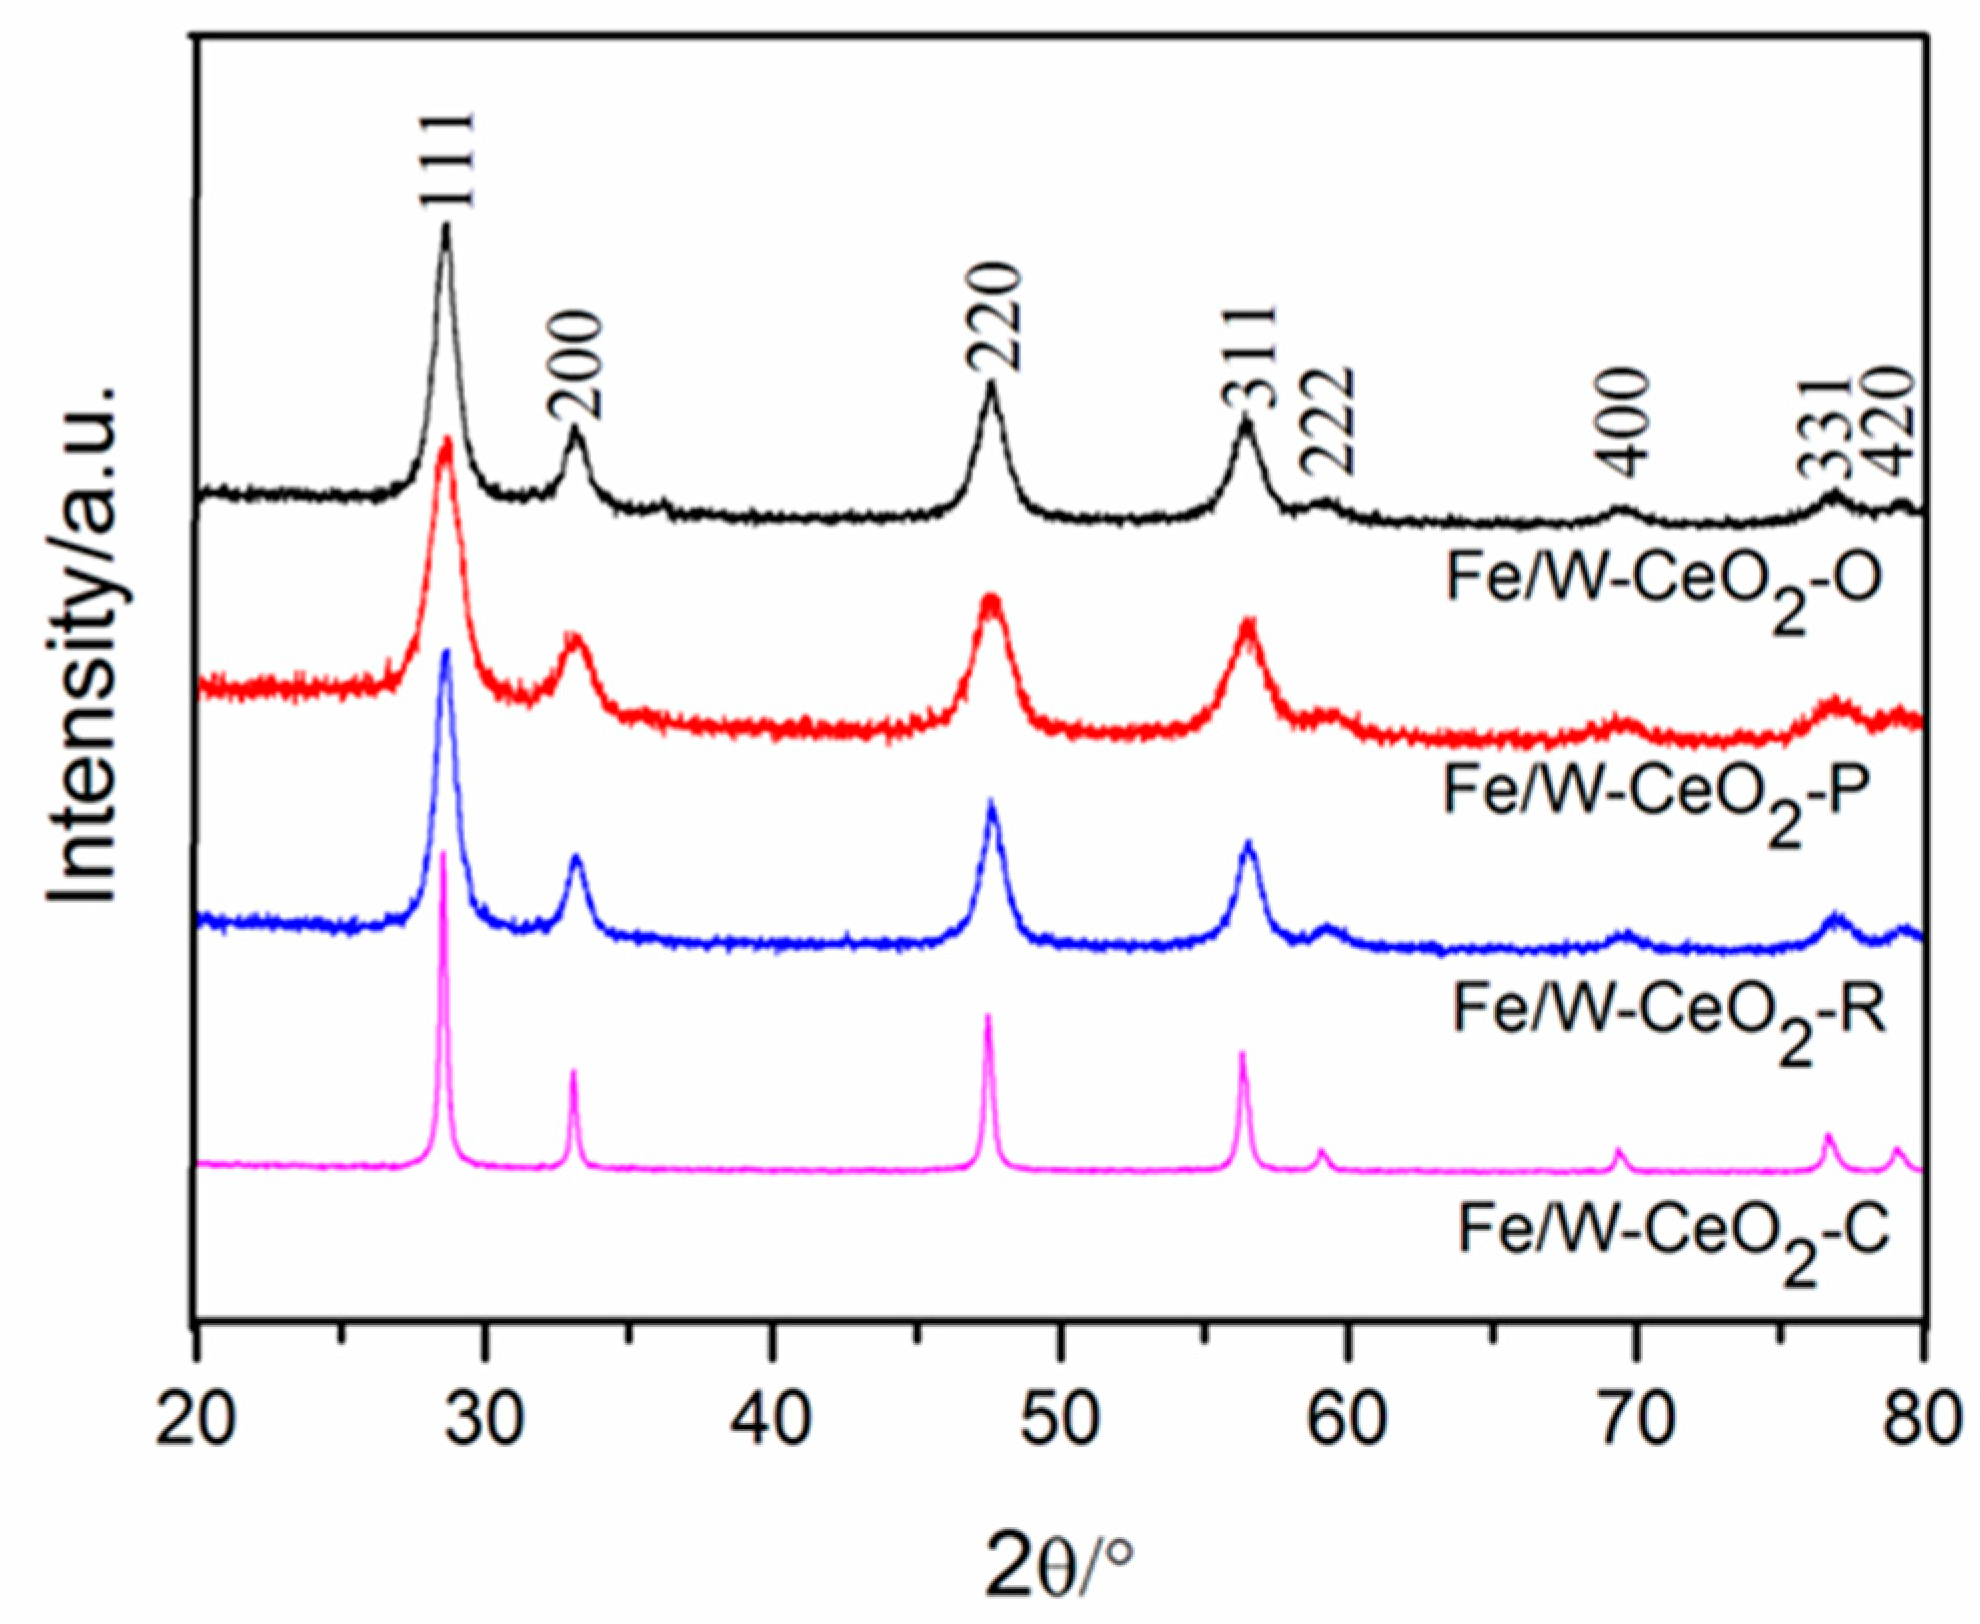
2.2. XRD
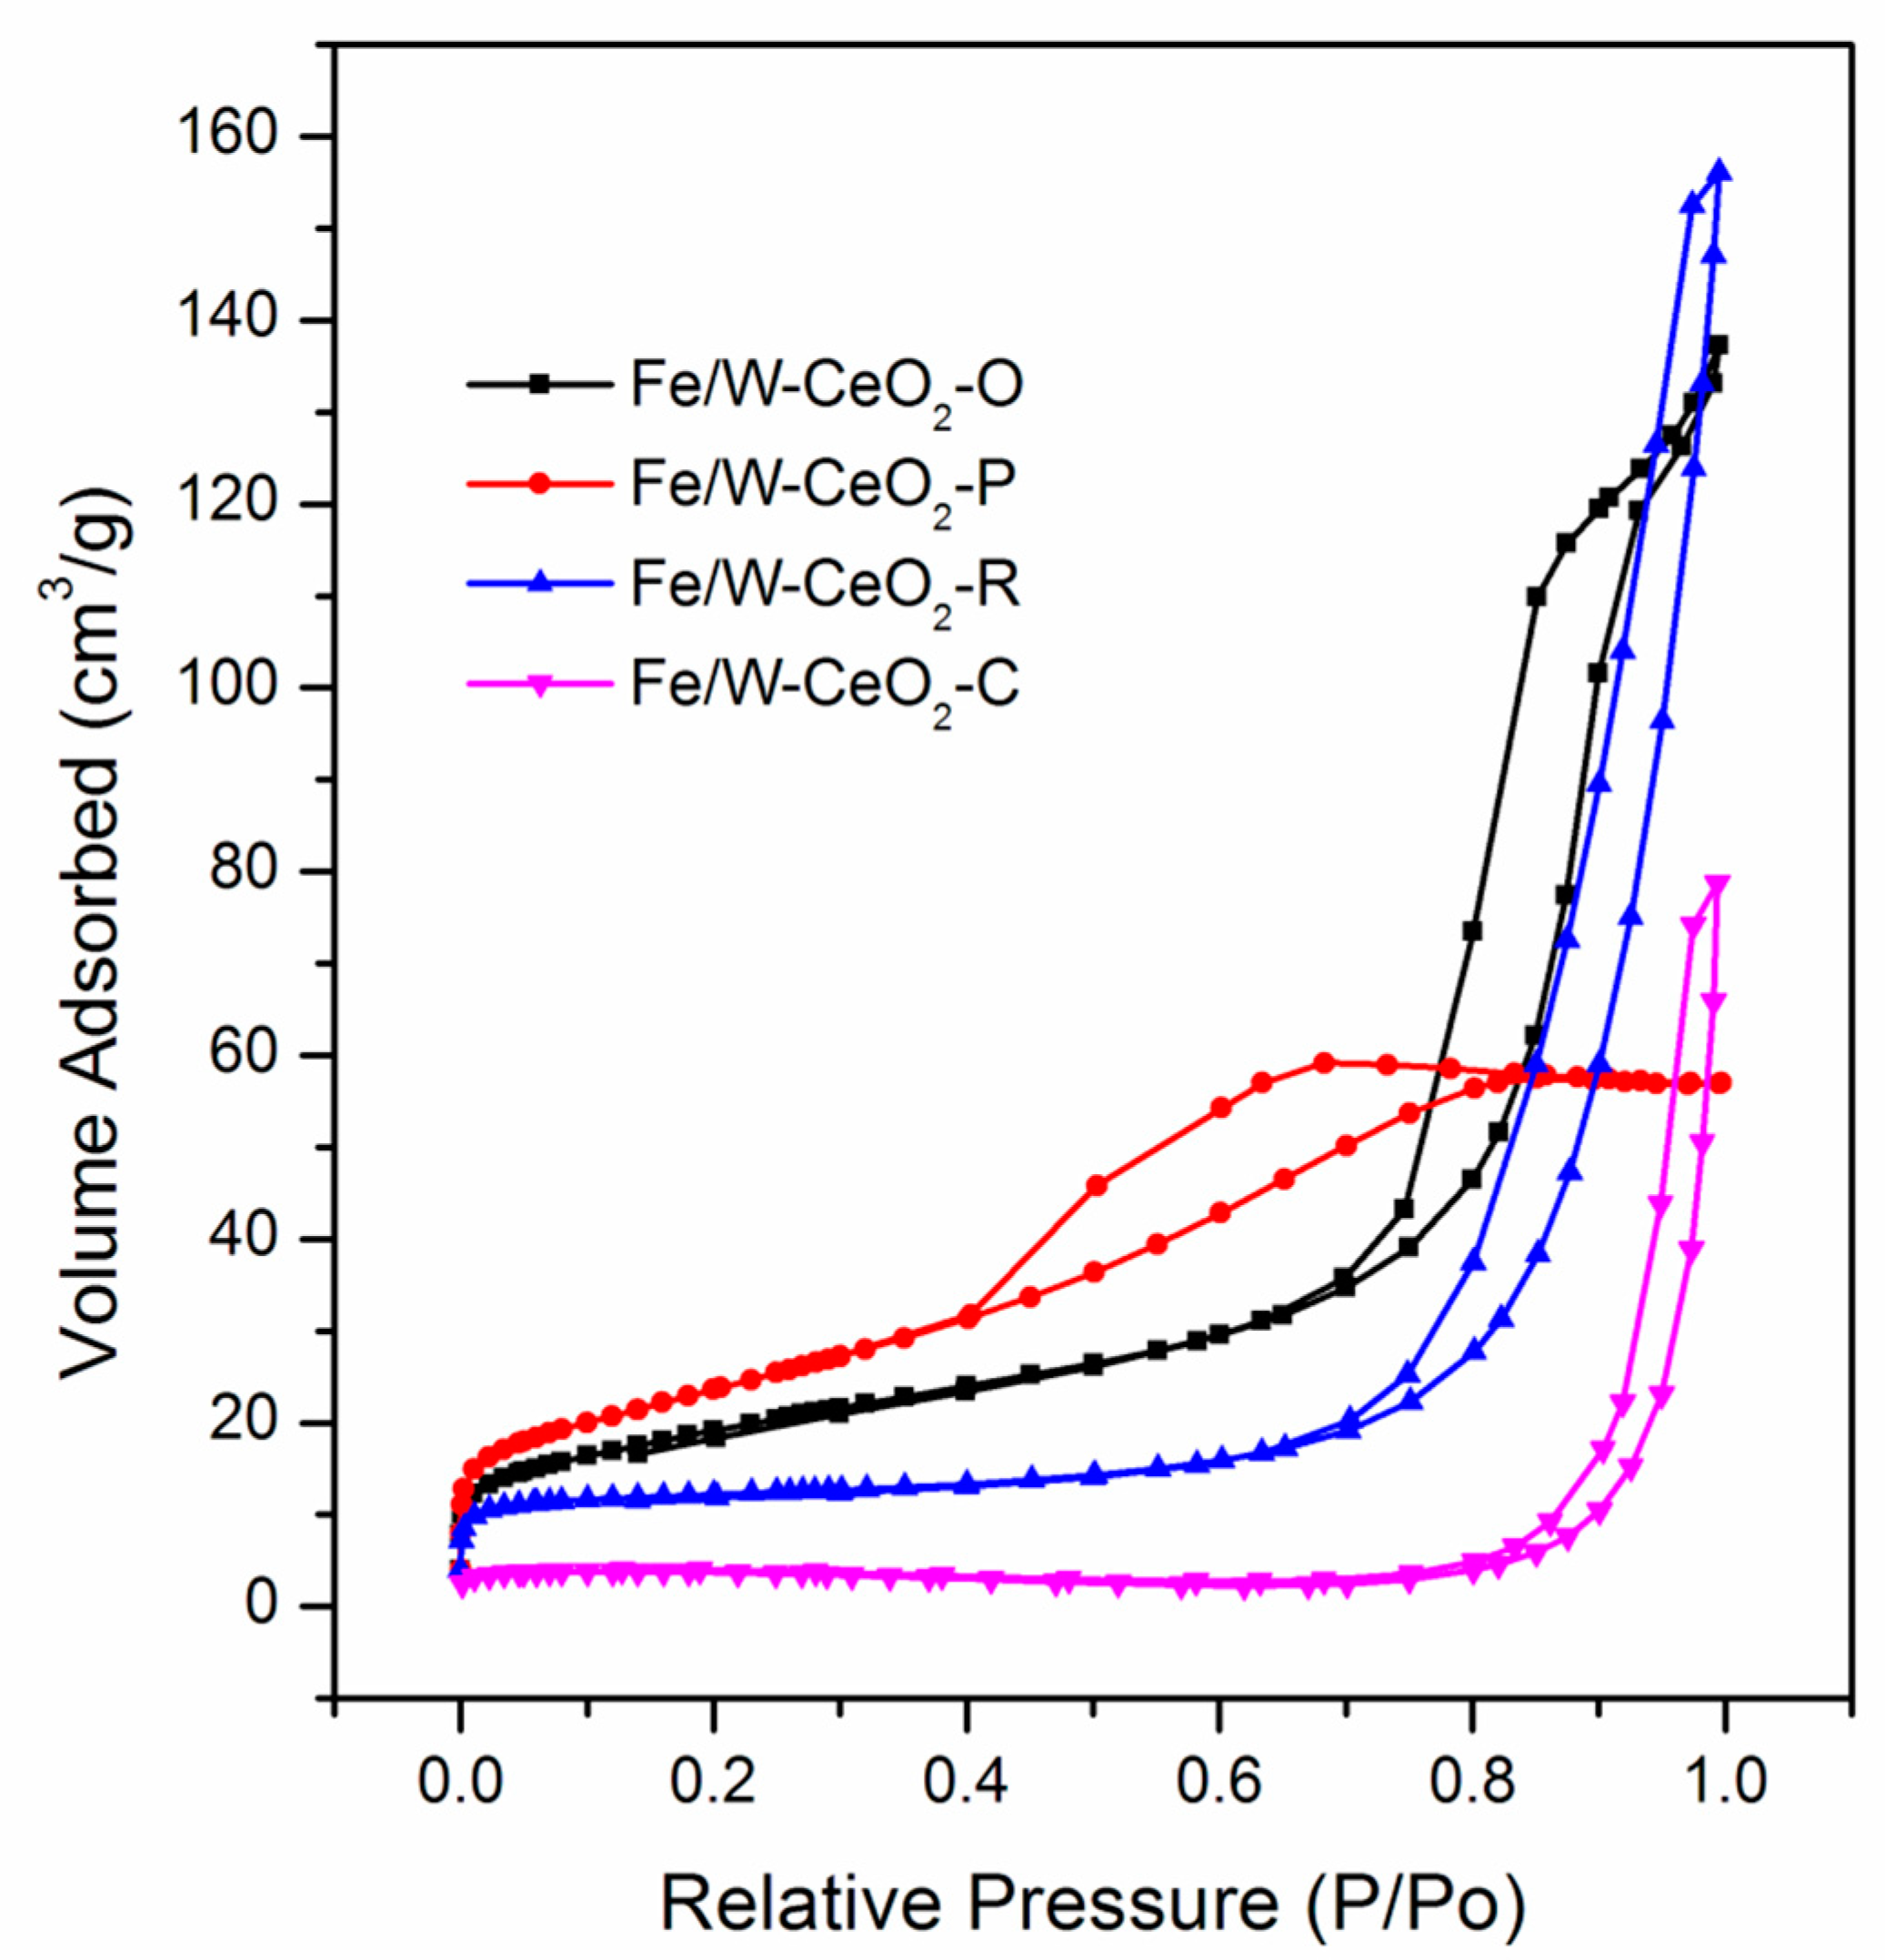
2.3. BET
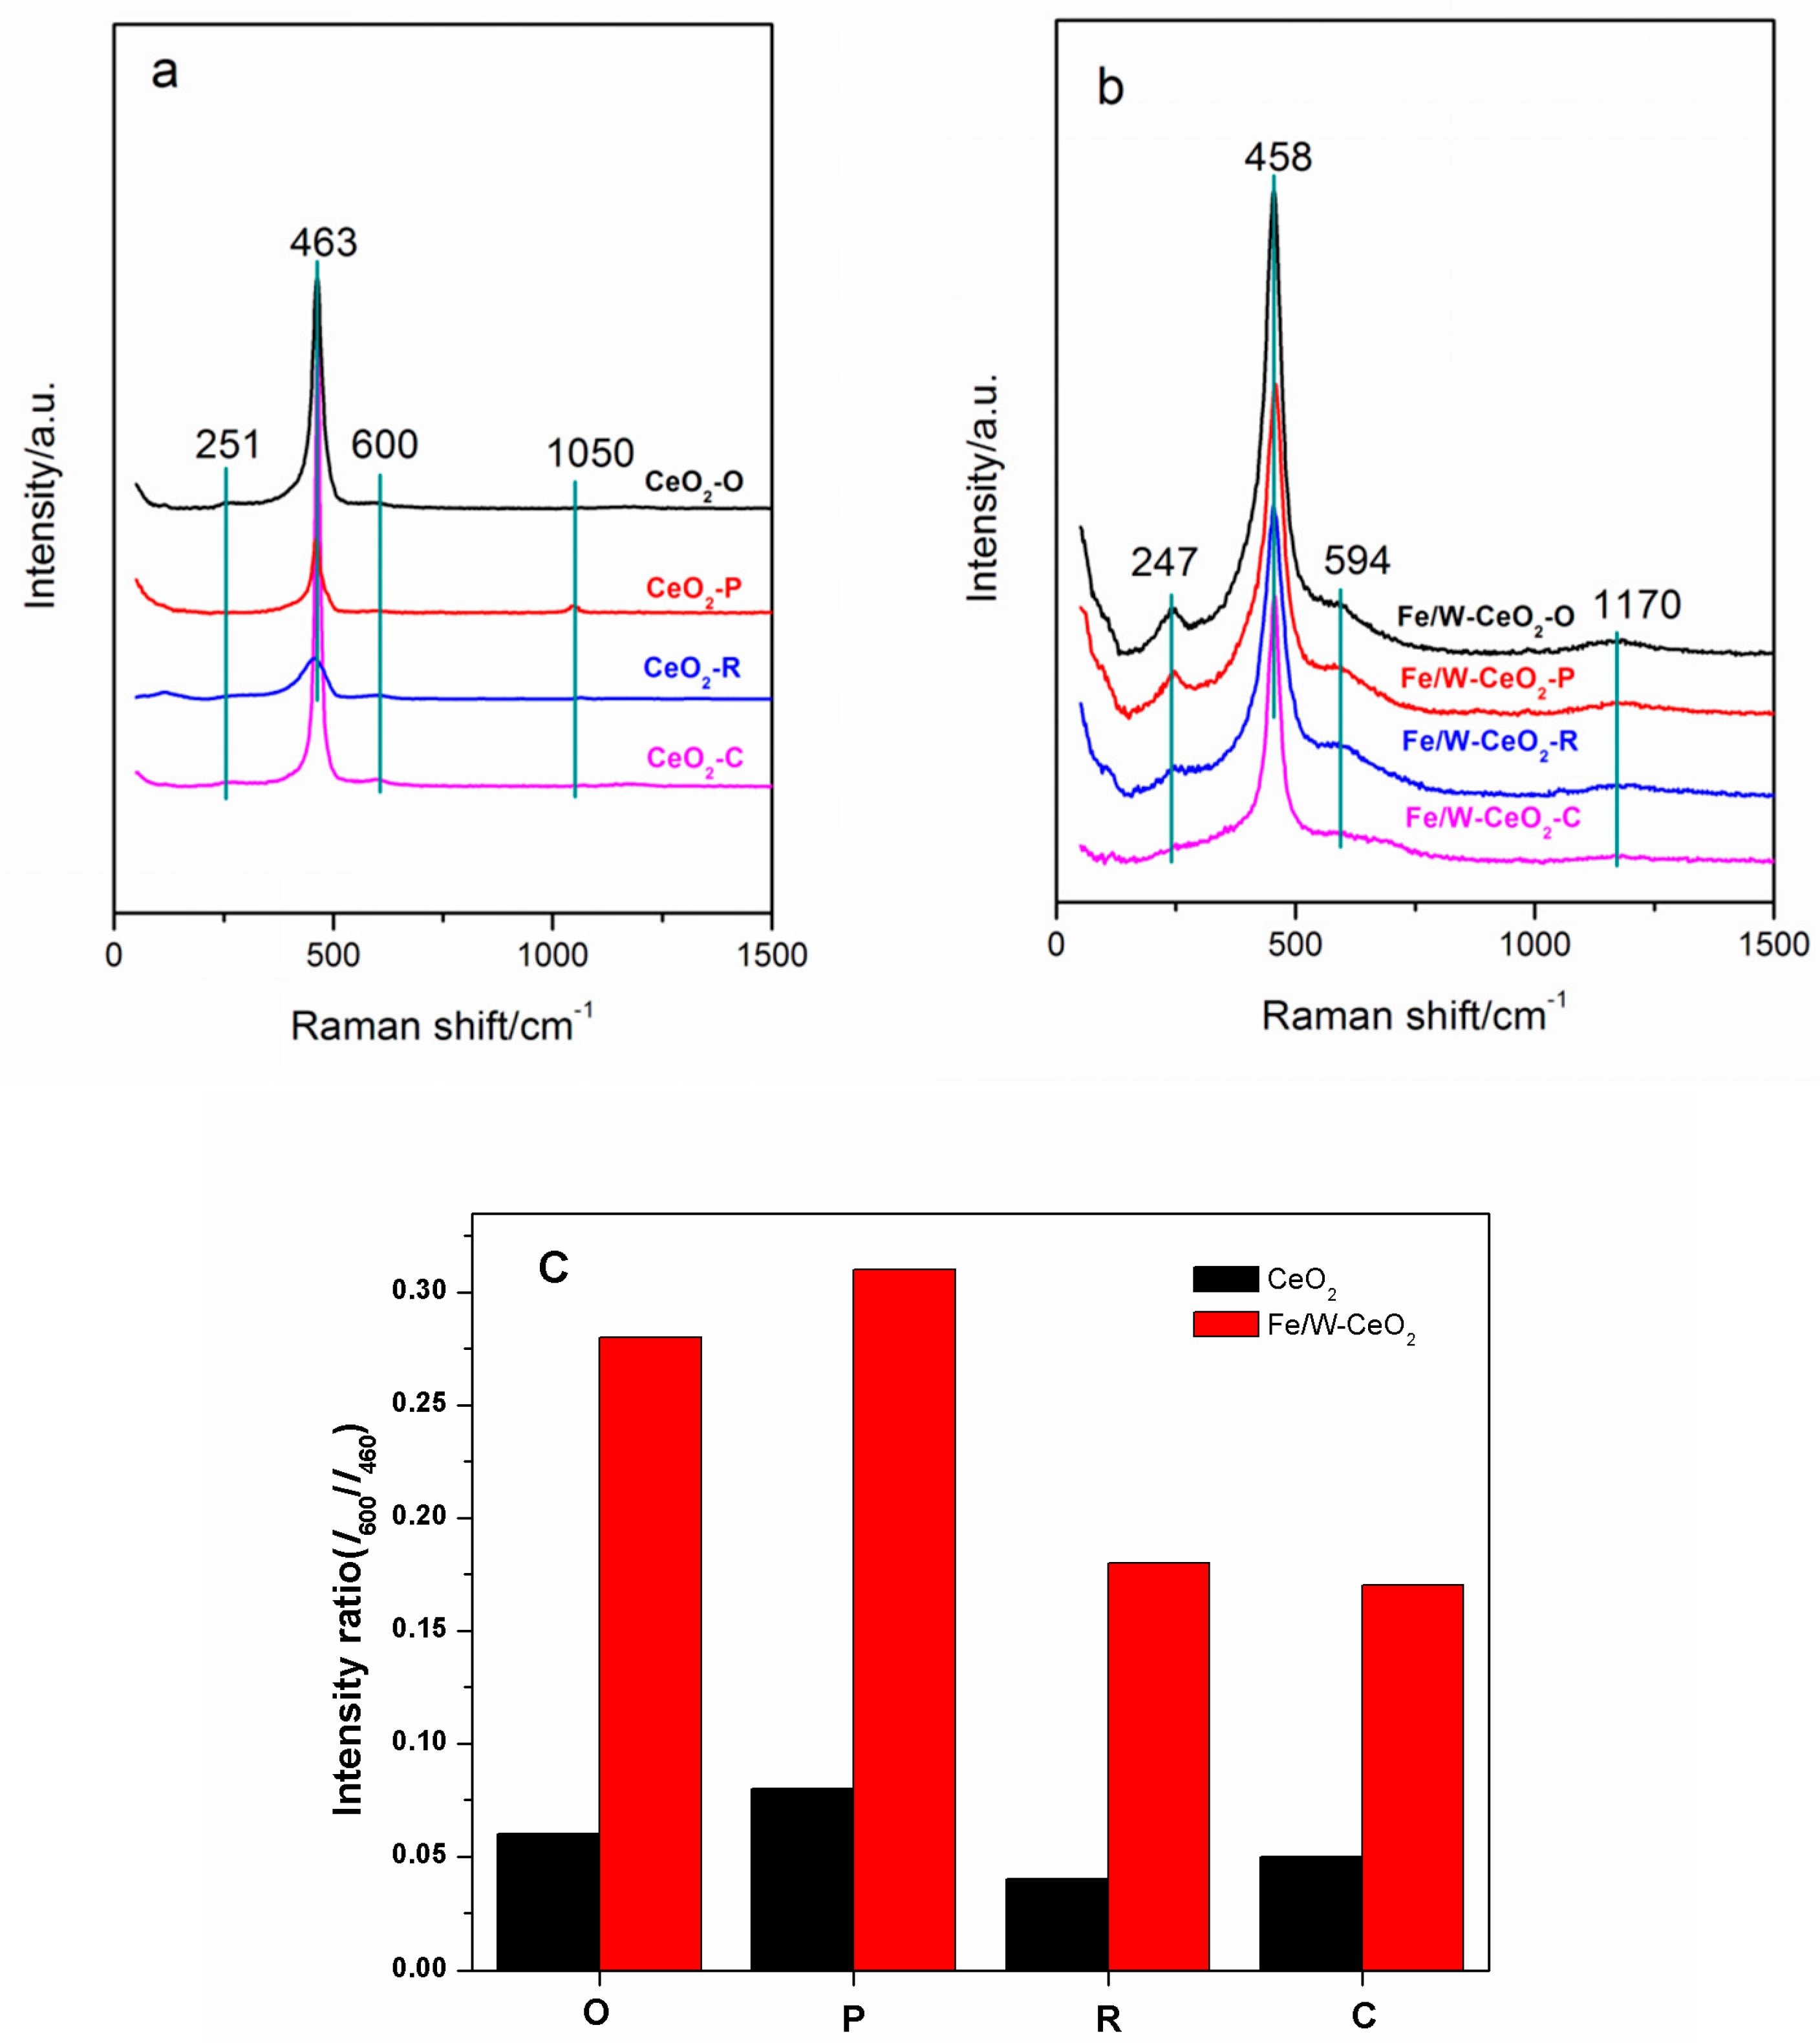
2.4. Raman
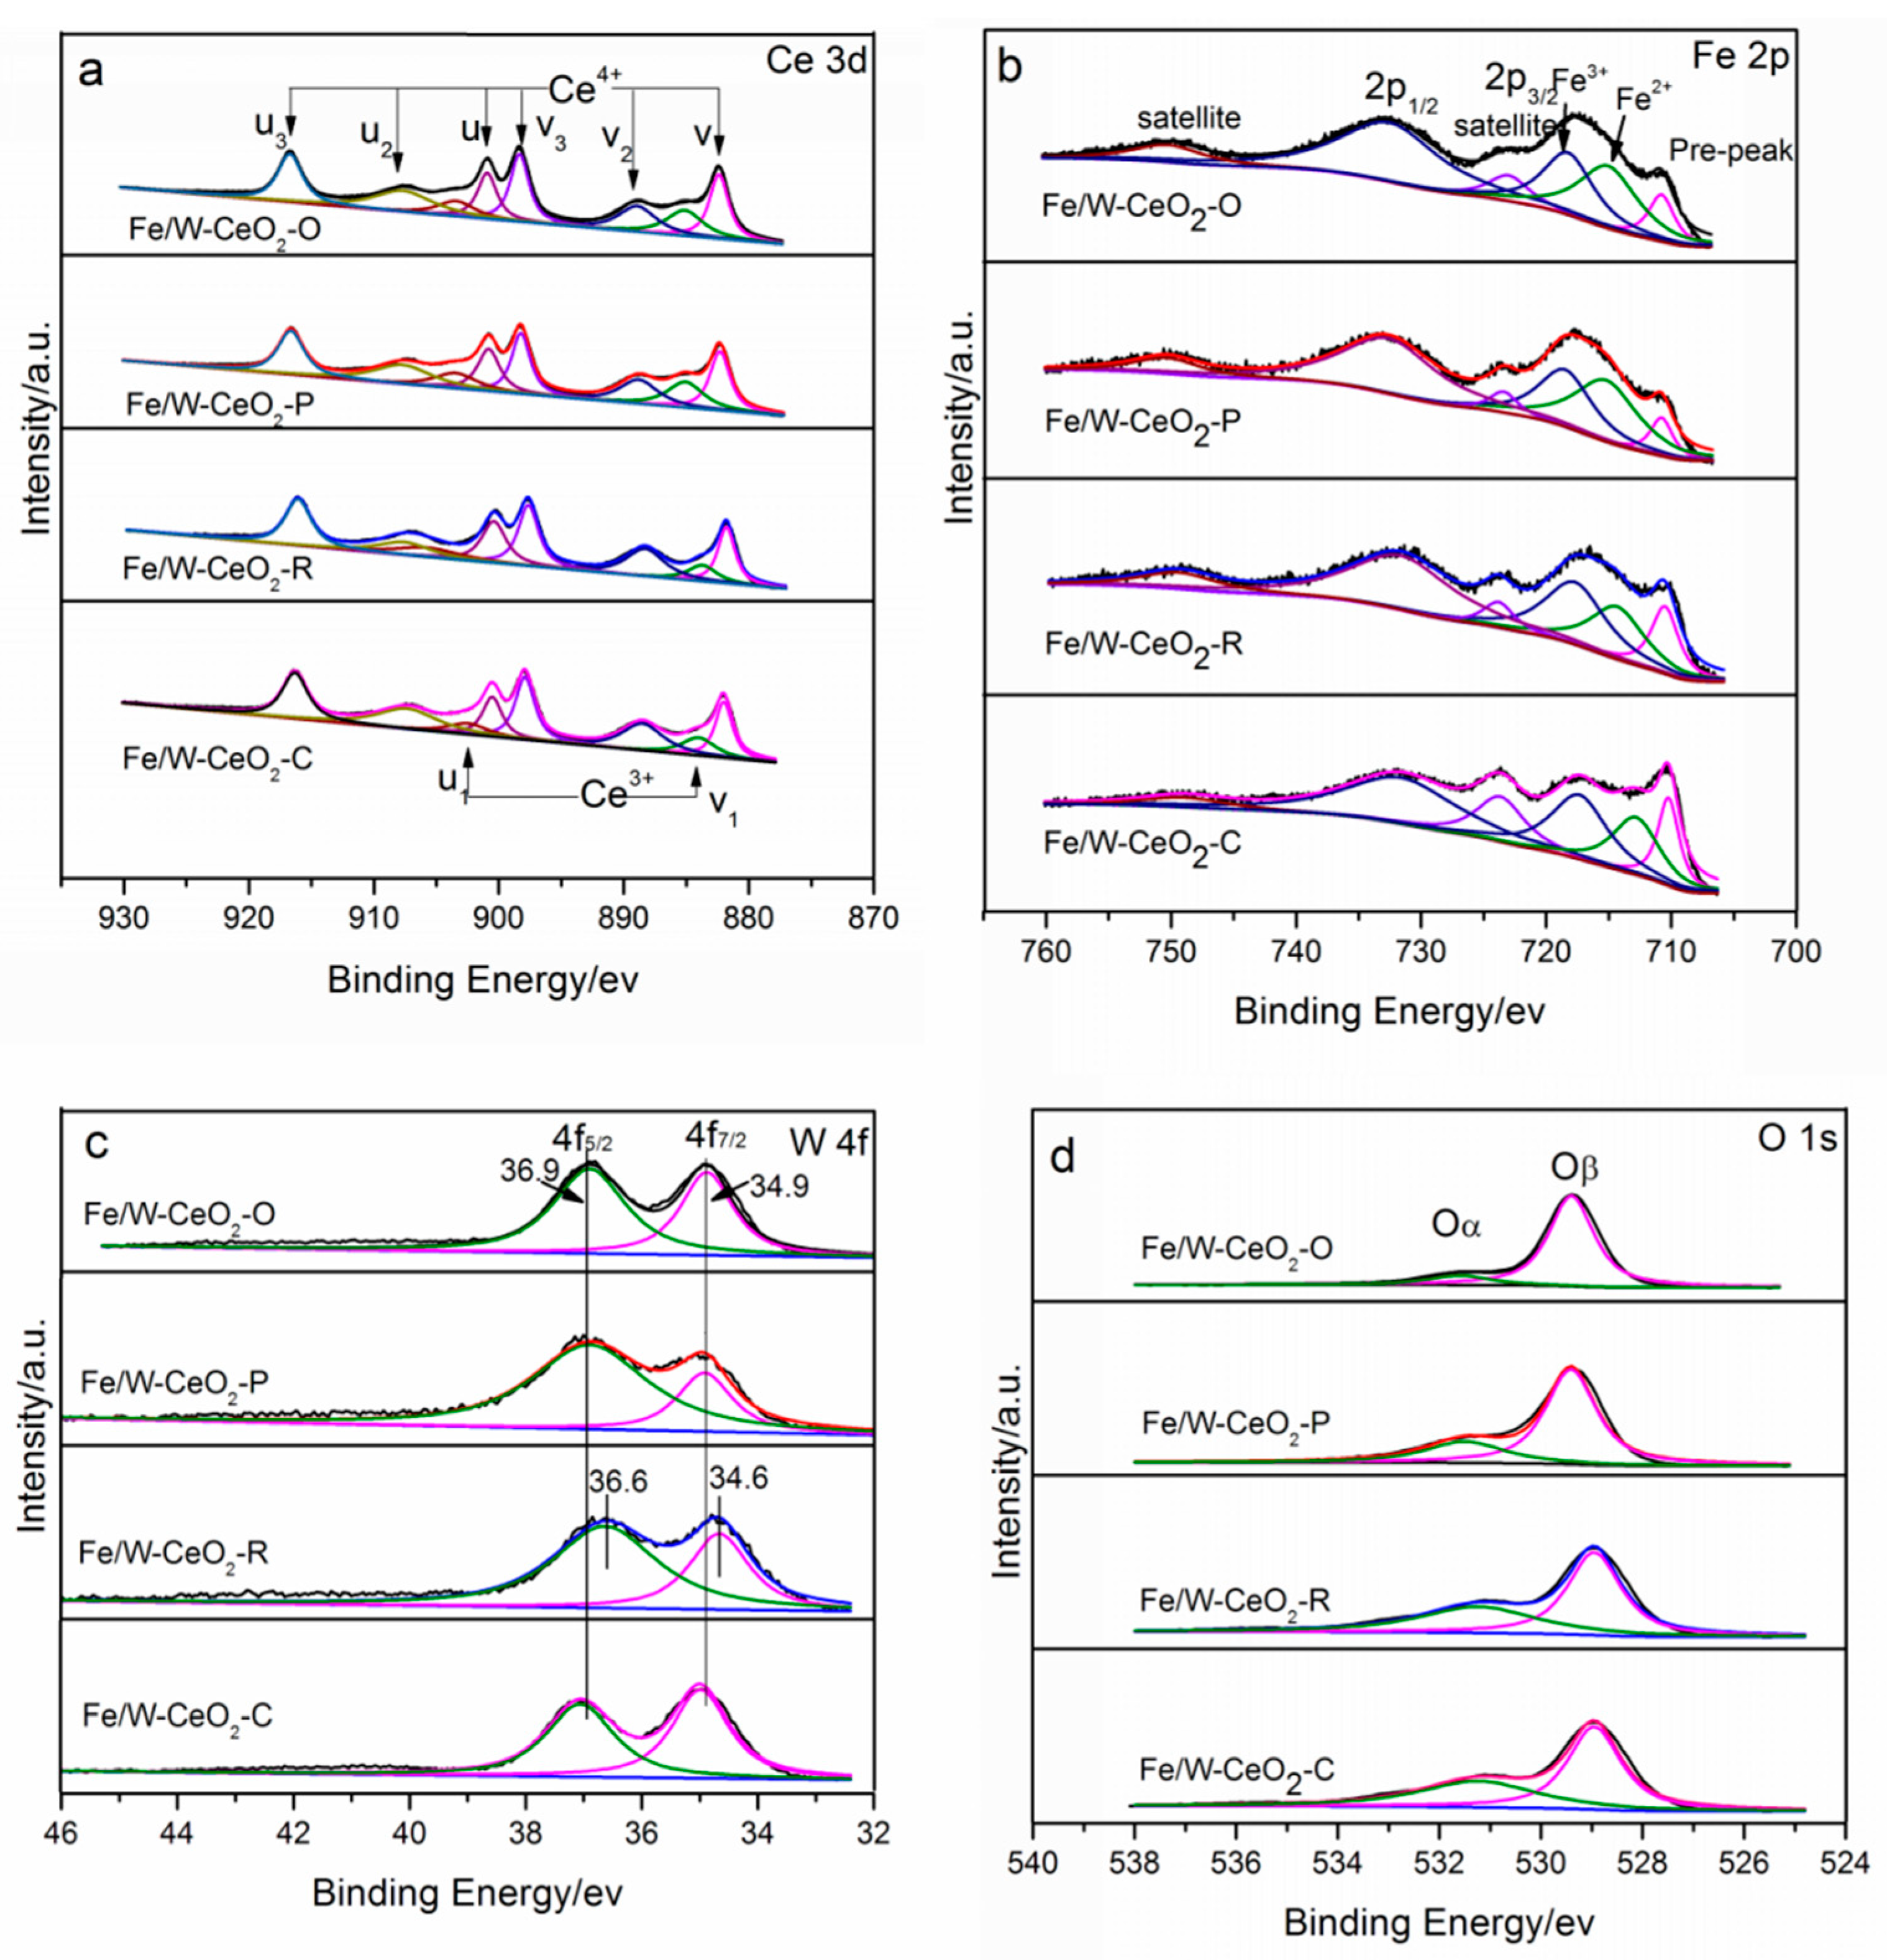
2.5. XPS
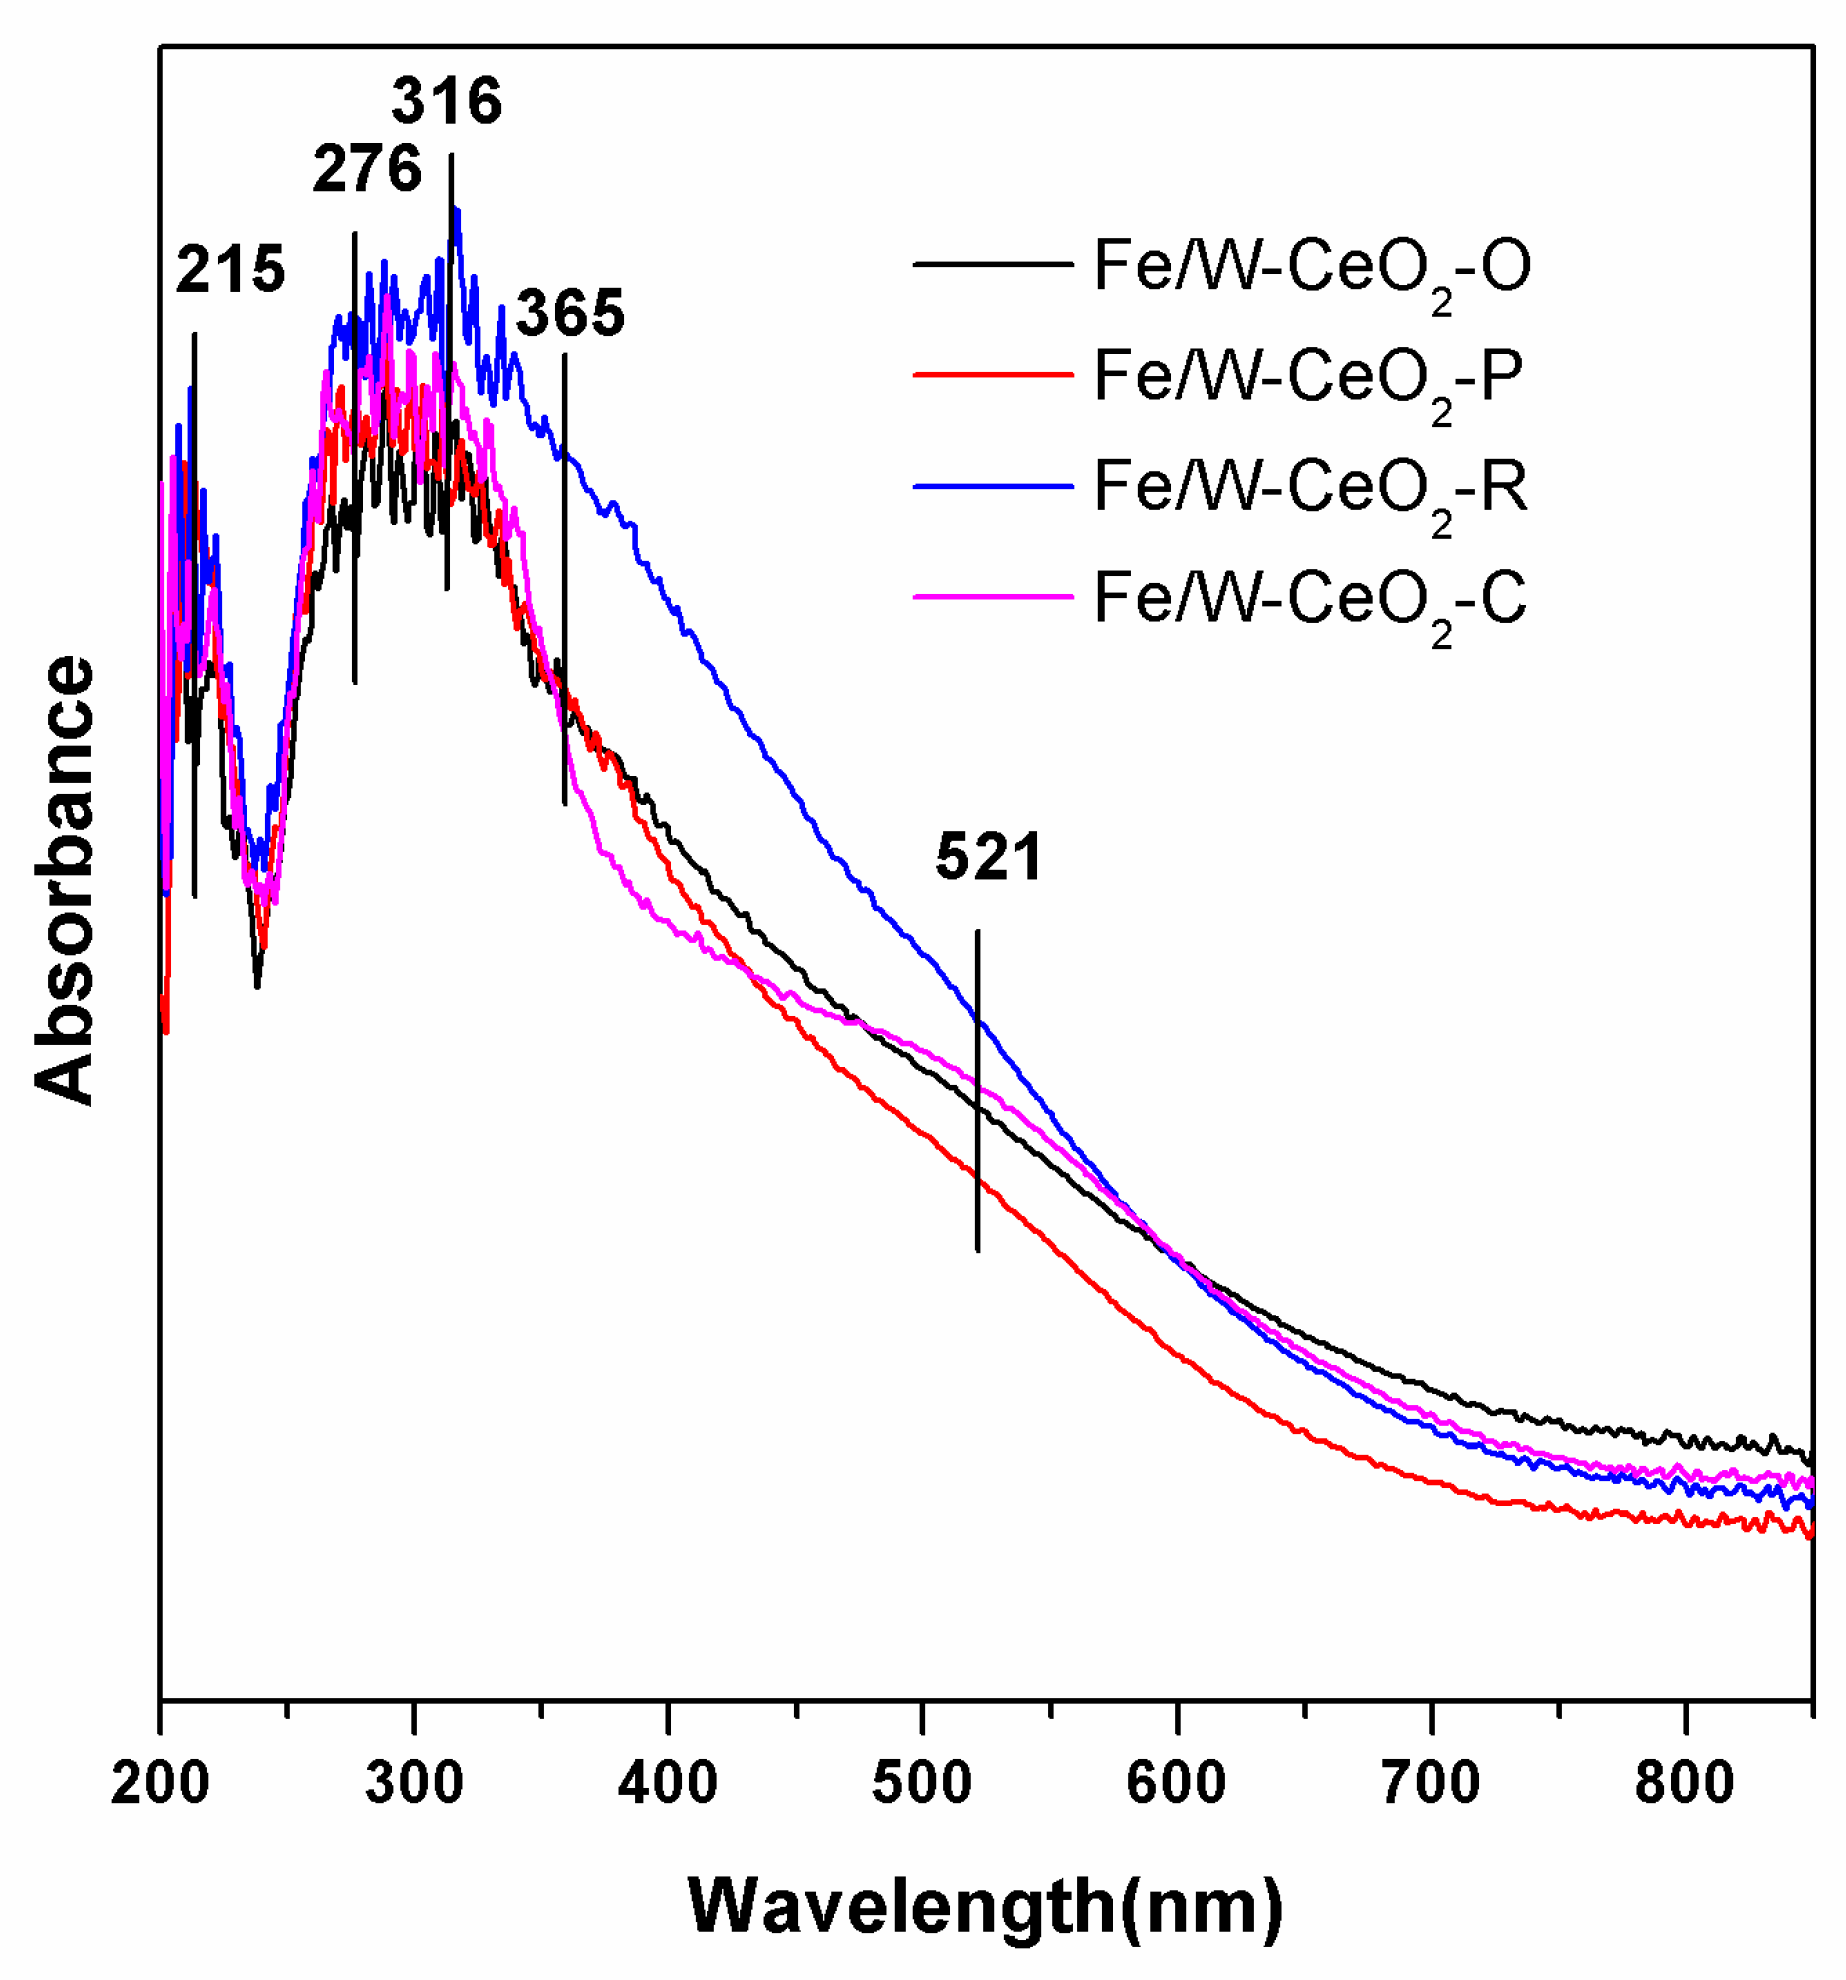
2.6. UV–VIS Diffuse Reflectance Spectra
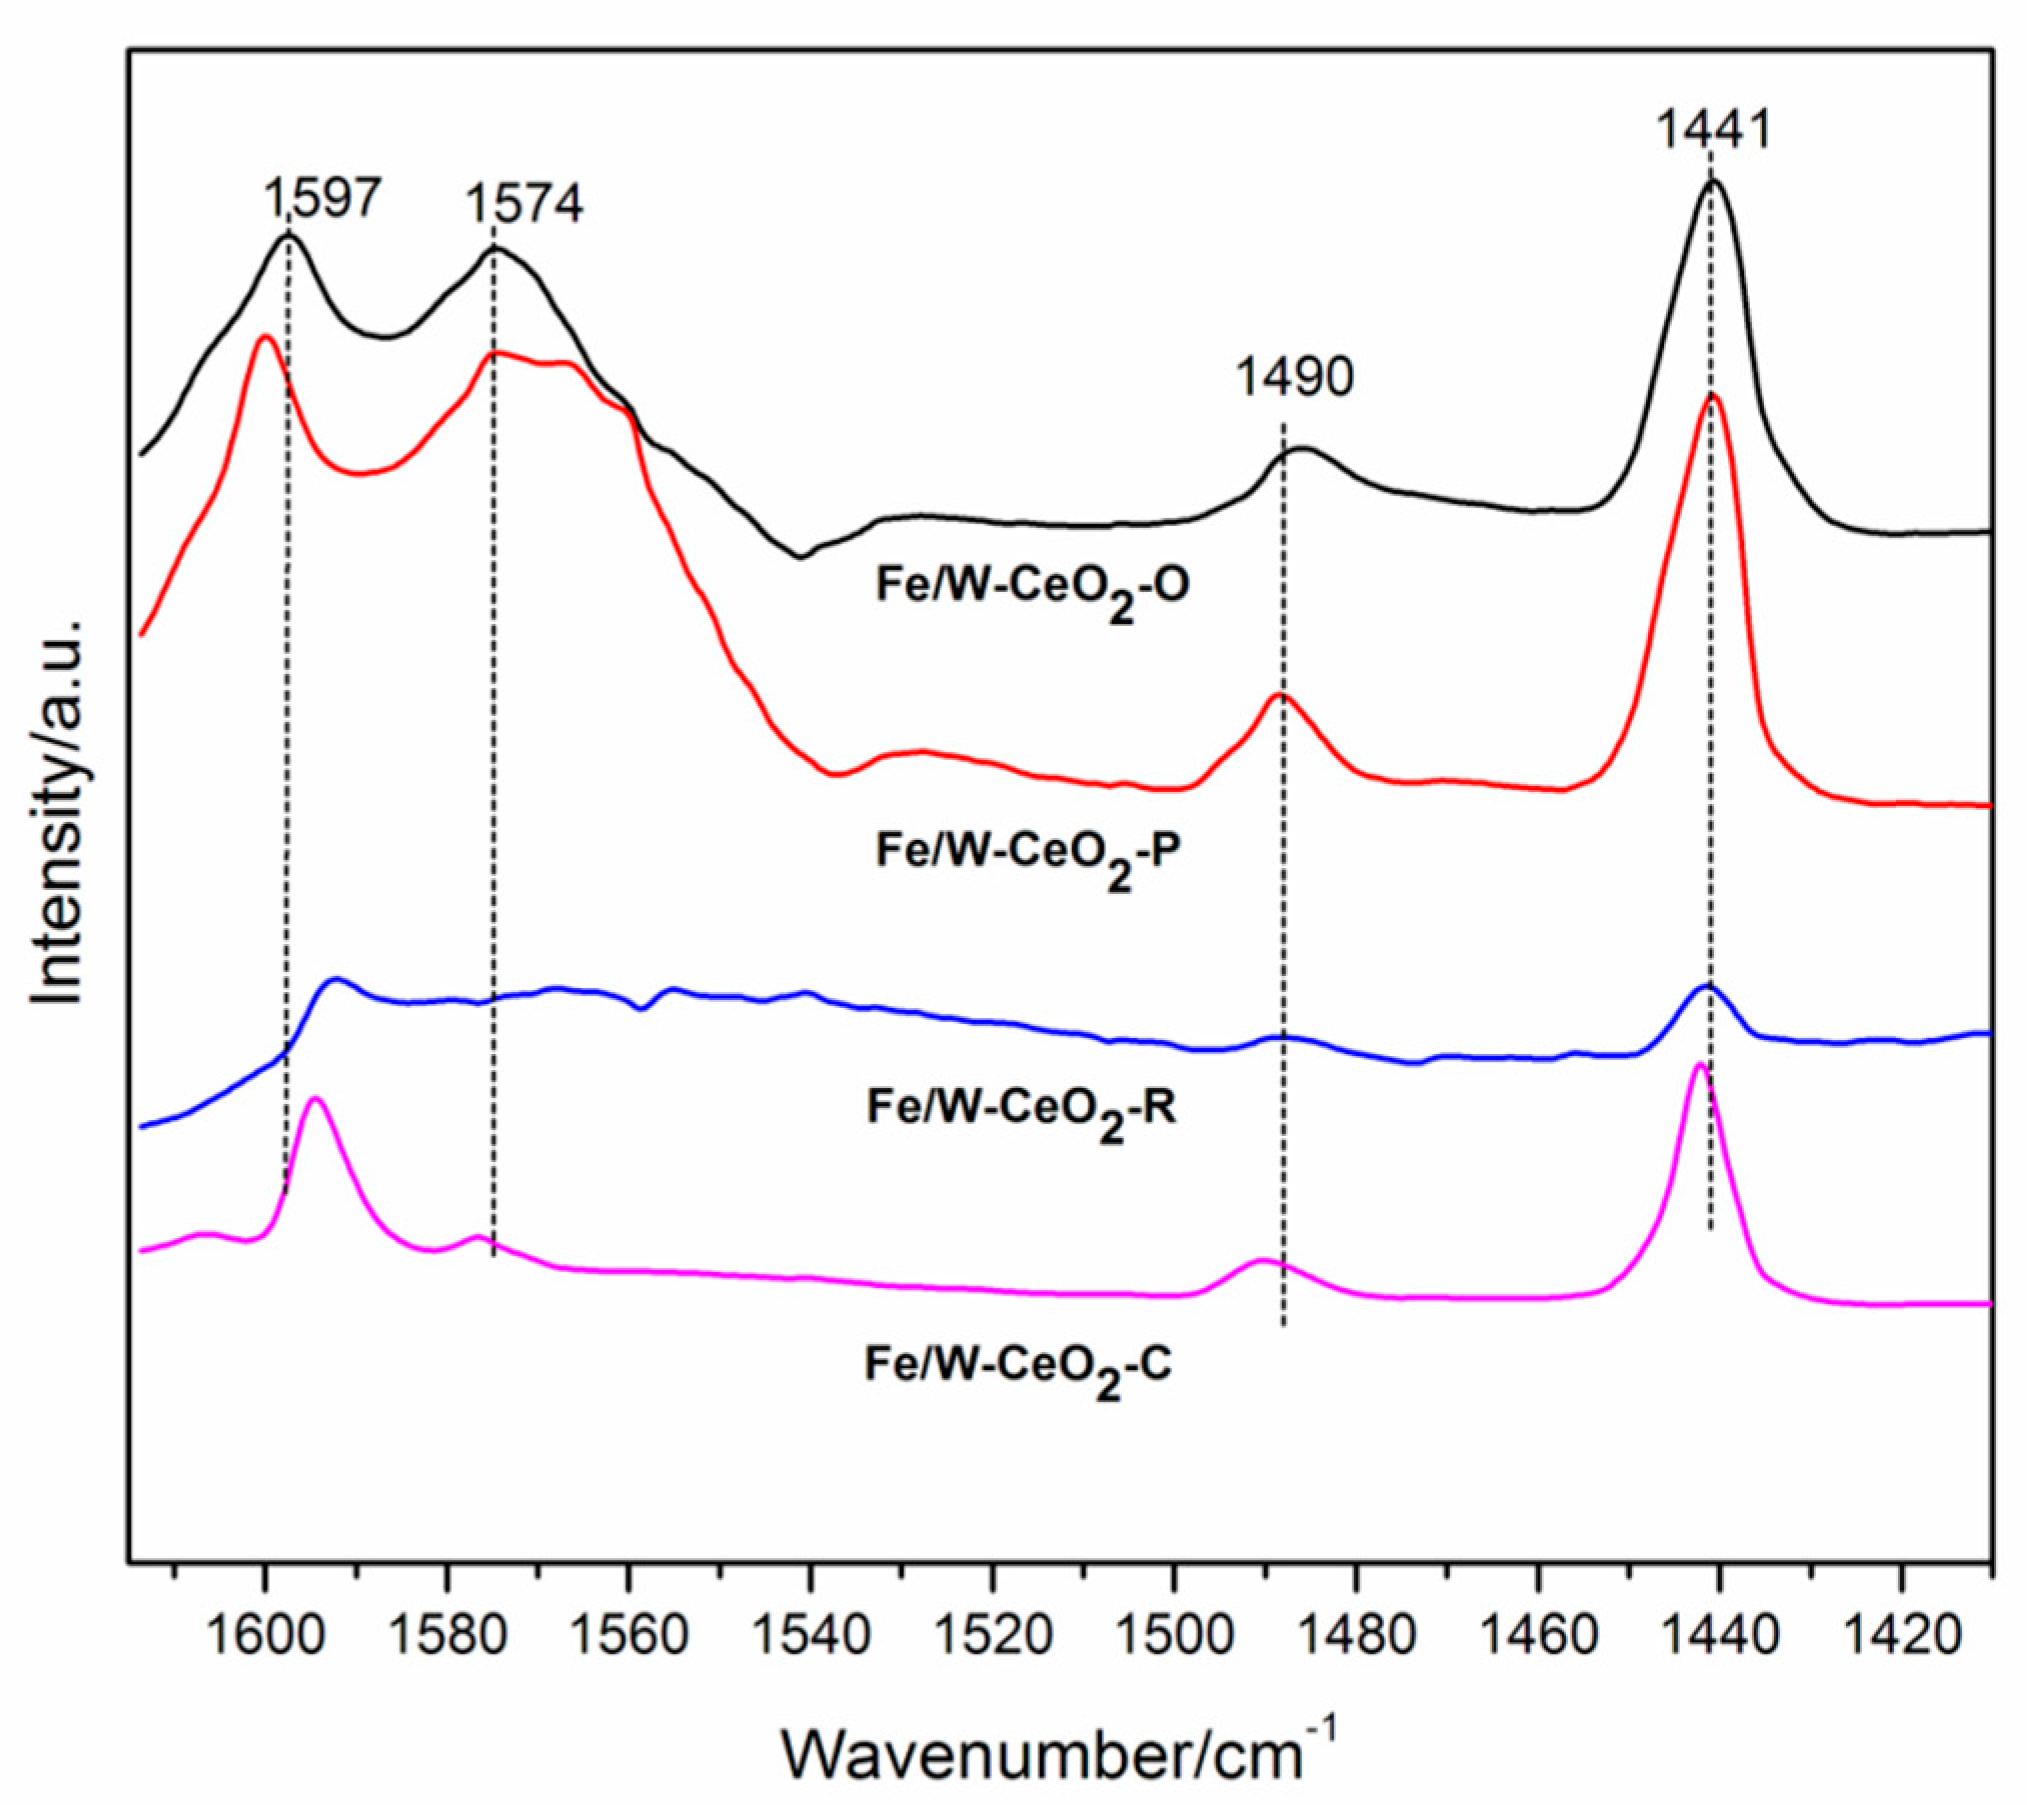
2.7. Py-IR Spectra
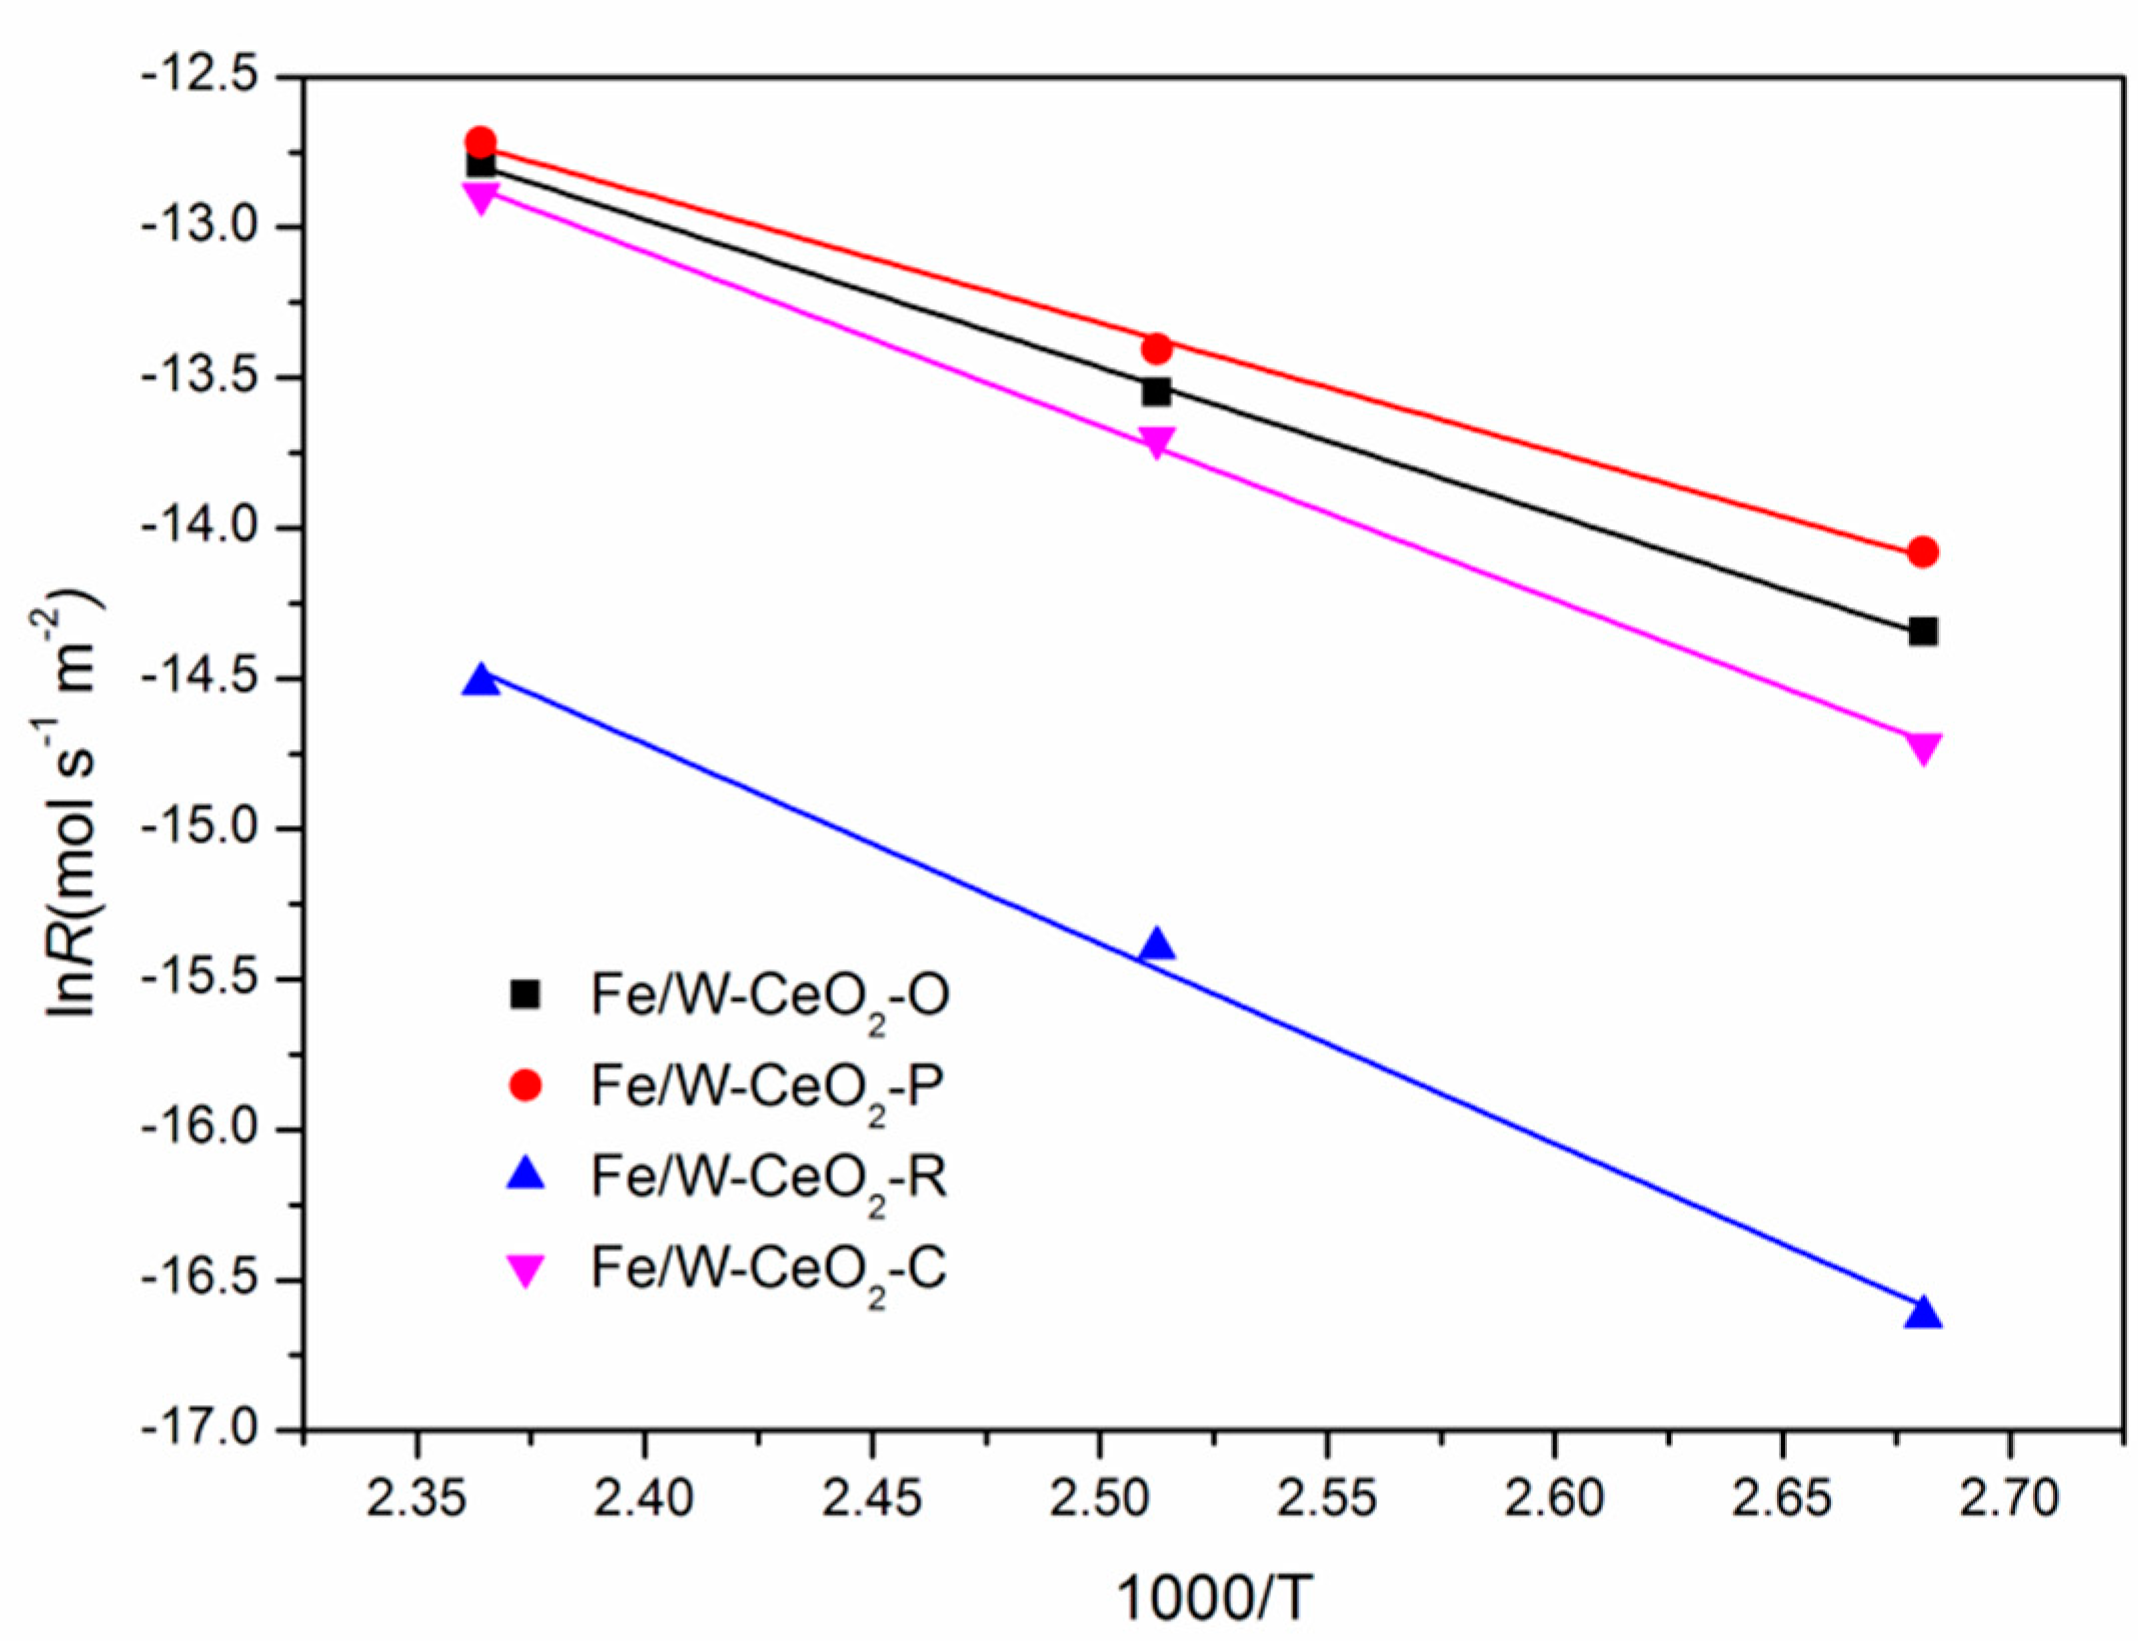
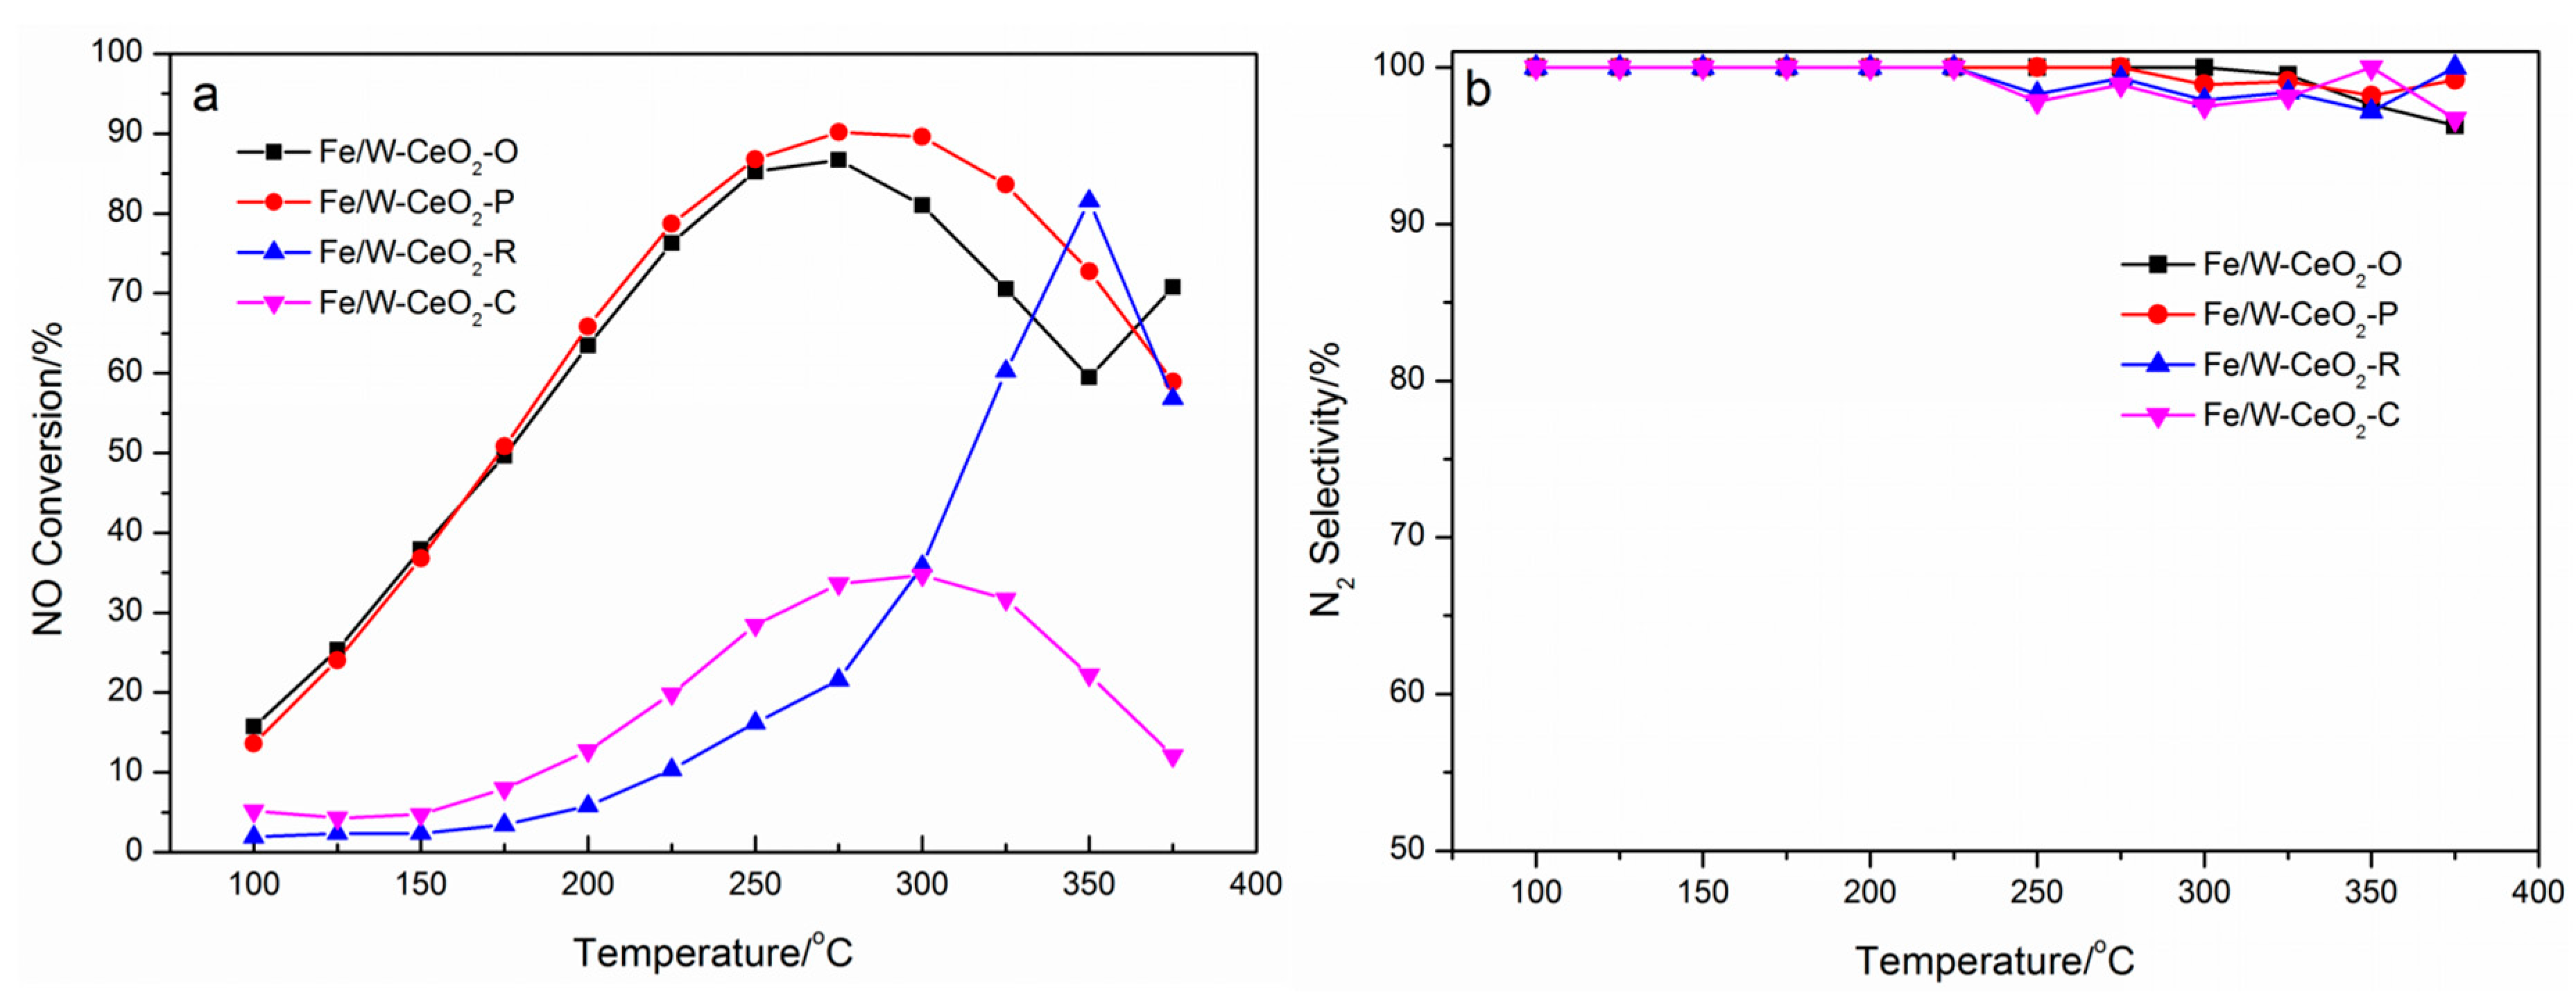
2.8. Activity Measurement
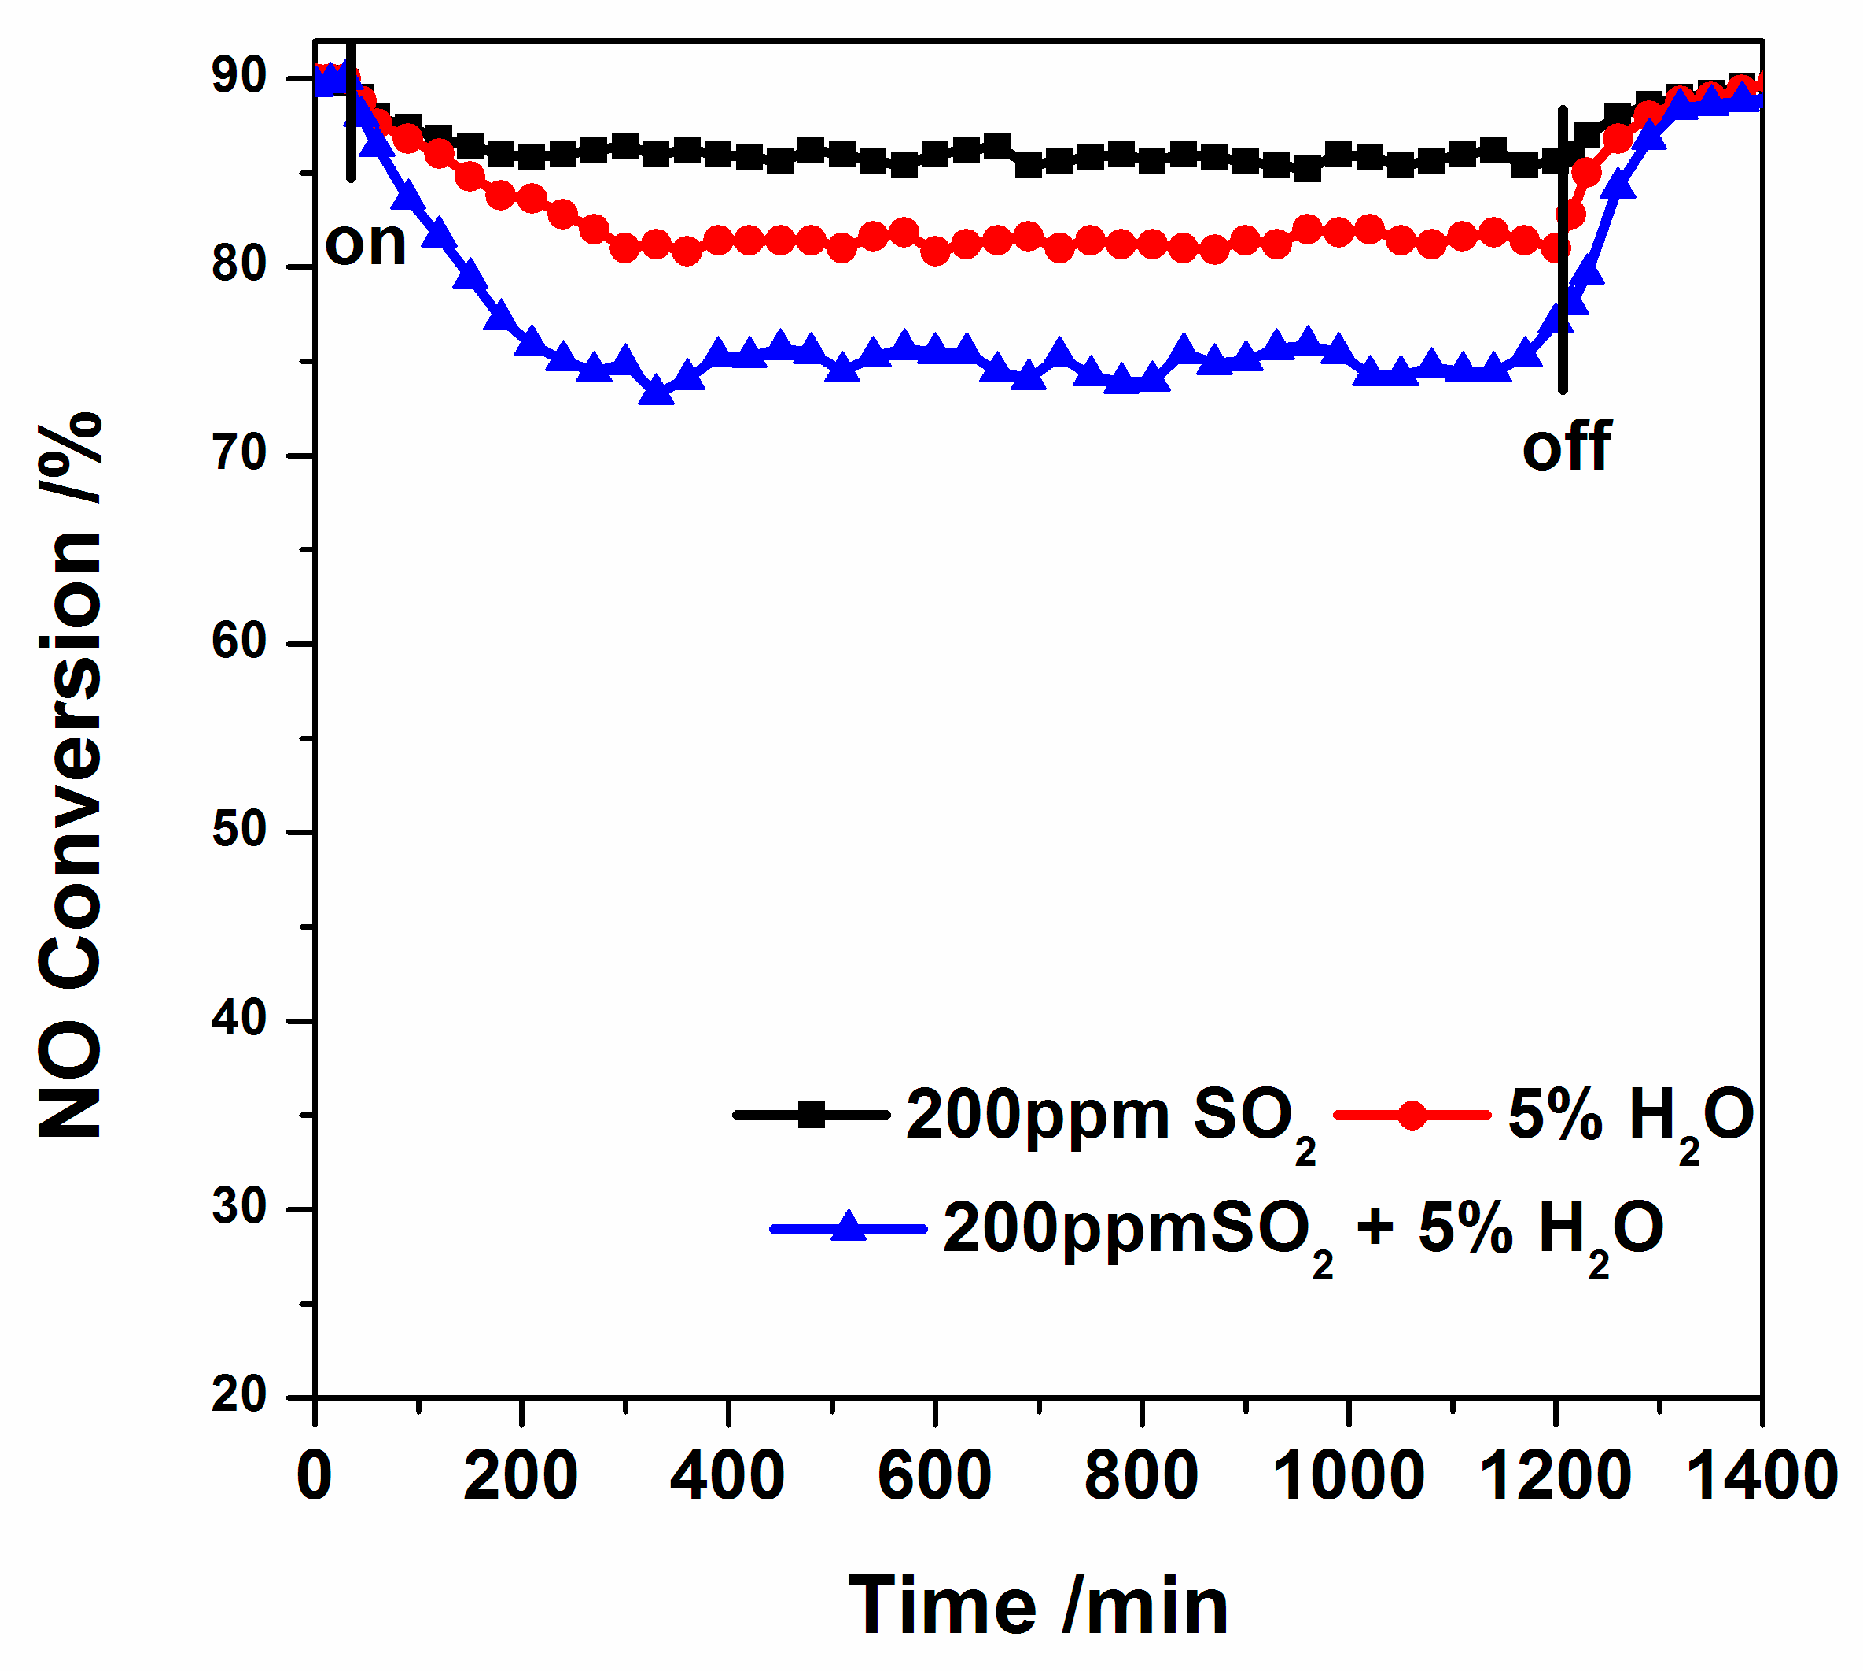
2.9. The Effect of SO2 and H2O
3. Discussion
4. Materials and Methods
4.1. Catalysts Preparation
4.2. Characterizations of Catalysts
4.3. Activity Measurement
5. Conclusions
Supplementary Materials
Author Contributions
Funding
Conflicts of Interest
References
- Li, J.; Chang, H.; Ma, L.; Hao, J.; Yang, R.T. Low-temperature selective catalytic reduction of NOx with NH3 over metal oxide and zeolite catalysts: A review. Catal. Today 2011, 175, 147–156. [Google Scholar] [CrossRef]
- Liu, G.; Gao, P.X. A review of NOx storage/reduction catalysts: mechanism, materials and degradation studies. Catal. Sci. Technol. 2011, 1, 552–568. [Google Scholar] [CrossRef]
- Wu, D.W.; Zhang, Q.L.; Lin, T.; Gong, M.C.; Chen, Y.Q. Effect of Fe on the Selective Catalytic Reduction of NO by NH3 at Low Temperature over Mn/CeO2-TiO2 Catalyst. J. Inorg. Mater. 2012, 27, 495–500. [Google Scholar] [CrossRef]
- Liu, Z.; Zhu, J.; Li, J.; Ma, L.; Woo, S.I. Novel Mn–Ce–Ti Mixed-Oxide Catalyst for the Selective Catalytic Reduction of NOx with NH3. ACS Appl. Mater. Interfaces 2014, 6, 14500–14508. [Google Scholar] [CrossRef] [PubMed]
- Zhang, X.; Lv, X.; Shi, X.; Yang, Y.; Yang, Y. Enhanced hydrophobic UiO-66 (University of Oslo 66) metal-organic framework with high capacity and selectivity for toluene capture from high humid air. J. Colloid Interface Sci. 2018, 539, 152–160. [Google Scholar] [CrossRef]
- Liu, F.; Yu, Y.; He, H. Environmentally-benign catalysts for the selective catalytic reduction of NOx from diesel engines: structure-activity relationship and reaction mechanism aspects. Chem. Commun. 2014, 50, 8445–8463. [Google Scholar] [CrossRef]
- Zhang, X.; Yang, Y.; Lv, X.; Wang, Y.; Liu, N.; Chen, D.; Cui, L. Adsorption/desorption kinetics and breakthrough of gaseous toluene for modified microporous-mesoporous UiO-66 metal organic framework. J. Hazard. Mater. 2018, 366, 140–150. [Google Scholar] [CrossRef]
- Xie, X.; Yong, L.; Liu, Z.Q.; Haruta, M.; Shen, W.J.C. ChemInform Abstract: Low-Temperature Oxidation of CO Catalyzed by Co3O4 Nanorods. Nature 2010, 40, 746–749. [Google Scholar] [CrossRef]
- Sun, Y.; Liu, Q.; Gao, S.; Cheng, H.; Lei, F.; Sun, Z.; Jiang, Y.; Su, H.; Wei, S.; Xie, Y. Pits confined in ultrathin cerium(IV) oxide for studying catalytic centers in carbon monoxide oxidation. Nature Commun. 2013, 4. [Google Scholar] [CrossRef]
- Zhou, K.B.; Wang, X.; Sun, X.M.; Peng, Q.; Li, Y.D. Enhanced catalytic activity of ceria nanorods from well-defined reactive crystal planes. J. Catal. 2005, 229, 206–212. [Google Scholar] [CrossRef]
- Mai, H.X.; Sun, L.D.; Zhang, Y.W.; Si, R.; Feng, W.; Zhang, H.P.; Liu, H.C.; Yan, C.H. Shape-selective synthesis and oxygen storage behavior of ceria nanopolyhedra, nanorods, and nanocubes. J. Phys. Chem. B 2005, 109, 24380–24385. [Google Scholar] [CrossRef]
- Yang, H.G.; Liu, G.; Qiao, S.Z.; Sun, C.H.; Jin, Y.G.; Smith, S.C.; Zou, J.; Cheng, H.M.; Lu, G.Q. Solvothermal Synthesis and Photoreactivity of Anatase TiO2 Nanosheets with Dominant {001} Facets. J. Am. Chem. Soc. 2009, 131, 4078–4083. [Google Scholar] [CrossRef]
- Yang, H.G.; Sun, C.H.; Qiao, S.Z.; Zou, J.; Liu, G.; Smith, S.C.; Cheng, H.M.; Lu, G.Q. Anatase TiO2 single crystals with a large percentage of reactive facets. Nature 2008, 453, 638–641. [Google Scholar] [CrossRef]
- Boningari, T.; Pappas, D.K.; Smirniotis, P.G. Metal oxide-confined interweaved titania nanotubes M/TNT (M = Mn, Cu, Ce, Fe, V, Cr, and Co) for the selective catalytic reduction of NOx in the presence of excess oxygen. J. Catal. 2018, 365, 320–333. [Google Scholar] [CrossRef]
- Hua, Q.; Cao, T.; Gu, X.K.; Lu, J.; Jiang, Z.; Pan, X.; Luo, L.; Li, W.X.; Huang, W. Crystal-Plane-Controlled Selectivity of Cu2O Catalysts in Propylene Oxidation with Molecular Oxygen. Angew. Chem. Int. Ed. 2014, 53, 4856–4861. [Google Scholar] [CrossRef]
- Laursen, S.; Combita, D.; Hungria, A.B.; Boronat, M.; Corma, A. First-Principles Design of Highly Active and Selective Catalysts for Phosgene-Free Synthesis of Aromatic Polyurethanes. Angew. Chem. Int. Ed. 2012, 51, 4190–4193. [Google Scholar] [CrossRef]
- Montini, T.; Melchionna, M.; Monai, M.; Fornasiero, P. Fundamentals and Catalytic Applications of CeO2-Based Materials. Chem. Rev. 2016, 116, 5987–6041. [Google Scholar] [CrossRef]
- Damma, D.; Boningari, T.; Ettireddy, P.R.; Reddy, B.M.; Smirniotis, P.G. Direct Decomposition of NOx over TiO2 Supported Transition Metal Oxides at Low Temperatures. Ind. Eng. Chem. Res. 2018, 57, 16615–16621. [Google Scholar] [CrossRef]
- Wang, Z.L.; Feng, X.D. Polyhedral shapes of CeO2 nanoparticles. J. Phys. Chem. B 2003, 107, 13563–13566. [Google Scholar] [CrossRef]
- Zhang, X.; Hou, F.; Yang, Y.; Wang, Y.; Ning, L.; Dan, C.; Yang, Y.Q. A facile synthesis for cauliflower like CeO2 catalysts from Ce-BTC precursor and their catalytic performance for CO oxidation. Appl. Surf. Sci. 2017, 423, 771–779. [Google Scholar] [CrossRef]
- Prieto-Centurion, D.; Eaton, T.R.; Roberts, C.A.; Fanson, P.T.; Notestein, J.M. Catalytic reduction of NO with H2 over redox-cycling Fe on CeO2. Appl. Catal. B Environ. 2015, 168–169, 68–76. [Google Scholar] [CrossRef]
- Wang, H.; Qu, Z.; Dong, S.; Xie, H.; Tang, C.J. Superior Performance of Fe1-xWxOδ for the Selective Catalytic Reduction of NOx with NH3: Interaction between Fe and W. Environ. Sci. Technol. 2016, 50, 13511. [Google Scholar] [CrossRef] [PubMed]
- Huang, X.S.; Sun, H.; Wang, L.C.; Liu, Y.M.; Fan, K.N.; Cao, Y. Morphology effects of nanoscale ceria on the activity of Au/CeO2 catalysts for low-temperature CO oxidation. Appl. Catal. B Environ. 2009, 90, 224–232. [Google Scholar] [CrossRef]
- Pan, C.; Zhang, D.; Shi, L. Template-Free Synthesis, Controlled Conversion, and CO Oxidation Properties of CeO2 Nanorods, Nanotubes, Nanowires, and Nanocubes. Eur. J. Inorg. Chem. 2008, 15, 2429–2436. [Google Scholar] [CrossRef]
- Zhang, J.; Zhang, Y.; Yan, J.Y.; Li, S.K.; Wang, H.S.; Huang, F.Z.; Shen, Y.H.; Xie, A.J. A novel synthesis of star-like FeWO4 nanocrystals via a biomolecule-assisted route. J. Nanopart. Res. 2012, 14, 1–10. [Google Scholar] [CrossRef]
- Liu, F.; He, H. Structure-Activity Relationship of Iron Titanate Catalysts in the Selective Catalytic Reduction of NOx with NH3. J. Phys. Chem. C 2010, 114, 16929–16936. [Google Scholar] [CrossRef]
- Zhang, Q.; Song, Z.; Ning, P.; Liu, X.; Li, H.; Gu, J. Novel promoting effect of acid modification on selective catalytic reduction of NO with ammonia over CeO2 catalyst. Catal. Commun. 2015, 59, 170–174. [Google Scholar] [CrossRef]
- Zhang, X.; Hou, F.; Li, H.; Yang, Y.; Wang, Y.; Liu, N.; Yang, Y. A strawsheave-like metal organic framework Ce-BTC derivative containing high specific surface area for improving the catalytic activity of CO oxidation reaction. Microporous Mesoporous Mater. 2018, 259, 211–219. [Google Scholar] [CrossRef]
- Hao, Y.; Wang, Y.; Wang, L.; Ni, Z.; Wang, Z.; Wang, R.; Koo, C.K.; Shen, Z.; Thong, J.T.L. Probing Layer Number and Stacking Order of Few-Layer Graphene by Raman Spectroscopy. Small 2010, 6, 195–200. [Google Scholar] [CrossRef]
- Wu, Z.; Li, M.; Howe, J.; Meyer, H.M., III; Overbury, S.H. Probing Defect Sites on CeO2 Nanocrystals with Well-Defined Surface Planes by Raman Spectroscopy and O2 Adsorption. Langmuir 2010, 26, 16595–16606. [Google Scholar] [CrossRef]
- Li, Y.; Wei, Z.; Gao, F.; Kovarik, L.; Peden, C.H.F.; Wang, Y. Effects of CeO2 support facets on VOx/CeO2 catalysts in oxidative dehydrogenation of methanol. J. Catal. 2014, 315, 15–24. [Google Scholar] [CrossRef]
- Zhang, X.; Yang, Y.; Liang, S.; Wang, Y.; Chi, H.; Zhong, W.; Cui, L.J. High and stable catalytic activity of Ag/Fe2O3 catalysts derived from MOFs for CO oxidation. Mol. Catal. 2018, 447, 80–89. [Google Scholar] [CrossRef]
- Larachi, F.; Pierre, J.; Adnot, A.; Bernis, A. Ce 3d XPS study of composite CexMn1-xO2-y wet oxidation catalysts. Appl. Surf. Sci. 2002, 195, 236–250. [Google Scholar] [CrossRef]
- Liu, X.; Zhou, K.; Wang, L.; Wang, B.; Li, Y. Oxygen Vacancy Clusters Promoting Reducibility and Activity of Ceria Nanorods. J. Am. Chem. Soc. 2009, 131, 3140–3141. [Google Scholar] [CrossRef]
- Grosvenor, A.P.; Kobe, B.A.; Biesinger, M.C.; Mcintyre, N.S.; Analysis, I. Investigation of Multiplet Splitting of Fe 2p XPS Spectra and Bonding in Iron Compounds. Surf. Interface Anal. 2004, 36, 1564–1574. [Google Scholar] [CrossRef]
- Wang, H.; Jin, B.; Wang, H.; Ma, N.; Wei, L.; Duan, W.; Wu, X.; Shuang, L.J. Study of Ag promoted Fe2O3@CeO2 as superior soot oxidation catalysts: The role of Fe2O3 crystal plane and tandem oxygen delivery. Appl. Catal. B Environ. 2018, 237, 251–262. [Google Scholar] [CrossRef]
- Xiaodong, Z.; Xialu, Z.; Liang, S.; Fulin, H.; Yiqiang, Y.; Yuxin, W.; Ning, L.J. Enhanced catalytic performance for CO oxidation and preferential CO oxidation over CuO/CeO2 catalysts synthesized from metal organic framework: Effects of preparation methods. Int. J. Hydrogen Energy 2018, 43, 18279–18288. [Google Scholar] [CrossRef]
- Liu, F.; Shan, W.; Lian, Z.; Liu, J.; Hong, H.J. The smart surface modification of Fe2O3 by WOx for significantly promoting the selective catalytic reduction of NOx with NH3. Appl. Catal. B Environ. 2018, 230. [Google Scholar] [CrossRef]
- Liu, Z.; Liu, Y.; Li, Y.; Su, H.; Ma, L. WO3 promoted Mn–Zr mixed oxide catalyst for the selective catalytic reduction of NOx with NH3. Chem. Eng. J. 2016, 283, 1044–1050. [Google Scholar] [CrossRef]
- Feng, Z.; Kim, C.Y.; Elam, J.W.; Ma, Q.; Zhang, Z.; Bedzyk, M.J. Direct atomic-scale observation of redox-induced cation dynamics in an oxide-supported monolayer catalyst: WOx/α-Fe2O3(0001). J. Am. Chem. Soc. 2009, 131, 18200–18201. [Google Scholar] [CrossRef]
- Si, Z.; Wu, X.; Duan, W.; Ma, Z.; Jing, M.J. Tailored temperature window of CuOx/WOx–ZrO2 for NOx reduction via adjusting the calcination temperature of WOx–ZrO2. Mater. Chem. Phys. 2013, 138, 399–404. [Google Scholar] [CrossRef]
- Hong, W.J.; Ueda, M.; Iwamoto, S.; Hosokawa, S.; Wada, K.; Kanai, H.; Deguchi, H.; Inoue, M.J. Effect of Fe content on physical properties of BaO–CeOx –FeOy catalysts for direct NO decomposition. J. Catal. 2011, 106, 142–148. [Google Scholar] [CrossRef]
- Liu, F.; He, H.; Zhang, C.; Feng, Z.; Zheng, L.; Xie, Y.; Hu, T.J. Selective catalytic reduction of NO with NH3 over iron titanate catalyst: Catalytic performance and characterization. Appl. Catal. B Environ. 2010, 96, 408–420. [Google Scholar] [CrossRef]
- Zhang, X.; Yang, Y.; Lv, X.; Wang, Y.; Cui, L. Effects of Preparation Method on the Structure and Catalytic Activity of Ag-Fe2O3 Catalysts Derived from MOFs. Catalysts 2017, 7, 382. [Google Scholar] [CrossRef]
- Parry, E.P. An infrared study of pyridine adsorbed on acidic solids. Characterization of surface acidity. J. Catal. 1963, 2, 371–379. [Google Scholar] [CrossRef]
- Emeis, C.A. Determination of Integrated Molar Extinction Coefficients for Infrared Absorption Bands of Pyridine Adsorbed on Solid Acid Catalysts. J. Catal. 1993, 141, 347–354. [Google Scholar] [CrossRef]
- Xin, Z.; Tao, L.; Rong, L.; Bai, T.; Zhang, G.J.I.; Research, E.C. Properties and Reactivity of Fe–P–O Catalysts Prepared by Different Methods for Benzylation of Benzene. Ind. Eng. Chem. Res. 2012, 51, 3541–3549. [Google Scholar] [CrossRef]
- Shi, A.; Wang, X.; Yu, T.; Shen, M.J. The effect of zirconia additive on the activity and structure stability of V2O5/WO3-TiO2 ammonia SCR catalysts. Appl. Catal. B Environ. 2011, 106, 359–369. [Google Scholar] [CrossRef]
- Wu, Z.; Jiang, B.; Liu, Y.; Zhao, W.; Guan, B. Experimental study on a low-temperature SCR catalyst based on MnOx/TiO2 prepared by sol-gel method. J. Hazard. Mater. 2007, 145, 488–494. [Google Scholar] [CrossRef]
- Shen, B.; Liu, T.; Zhao, N.; Yang, X.; Deng, L. Iron-doped Mn-Ce/TiO2 catalyst for low temperature selective catalytic reduction of NO with NH3. J. Environ. Sci. 2010, 22, 1447–1454. [Google Scholar] [CrossRef]
- Kwon, D.W.; Nam, K.B.; Hong, S.C. Influence of tungsten on the activity of a Mn/Ce/W/Ti catalyst for the selective catalytic reduction of NO with NH3 at low temperatures. Appl. Catal. A Gen. 2015, 497, 160–166. [Google Scholar] [CrossRef]
- Fang, D.; Xie, J.L.; Hu, H.; Zhang, Z.; He, F.; Zheng, Y.; Zhang, Q. Effects of precursors and preparation methods on the potassium deactivation of MnOx/TiO2 catalysts for NO removal. Fuel Process. Technol. 2015, 134, 465–472. [Google Scholar] [CrossRef]
- Li, B.; Wang, H.; Ding, F.C.; Li, C.Q.; Song, Y.J.; Ke, M.; Ren, C.T. Effects of Preparation Methods on the Catalytic Performance of Selective Catalytic Reduction of NO with CH4 over Co-MOR Catalysts. Acta Phys.-Chim. Sin. 2013, 29, 1289–1296. [Google Scholar] [CrossRef]
- He, L.F.; Liu, J.D.; Huang, W.; Li, Z. Effect of Preparation Methods on Performance of Mn-Ce/ZSM-5 Catalyst for Low-temperature Selective Catalytic Reduction of NO. Chem. J. Chin. Univ. 2012, 33, 2532–2536. (In Chinese) [Google Scholar] [CrossRef]
- Liu, J.; Li, G.Q.; Zhang, Y.F.; Liu, X.Q.; Wang, Y.; Li, Y. Novel Ce-W-Sb mixed oxide catalyst for selective catalytic reduction of NOx with NH3. Appl. Surf. Sci. 2017, 401, 7–16. [Google Scholar] [CrossRef]
- Catlow, C.R.A. Atomistic mechanisms of ionic transport in fast-ion conductors. J. Chem. Soc.-Faraday Tran. 1990, 86, 1167–1176. [Google Scholar] [CrossRef]
- Liu, F.; He, H.; Ding, Y.; Zhang, C. Effect of manganese substitution on the structure and activity of iron titanate catalyst for the selective catalytic reduction of NO with NH3. Appl. Catal. B-Environ. 2009, 93, 194–204. [Google Scholar] [CrossRef]
- Wang, H.; Qu, Z.; Dong, S.; Tang, C. Mechanism study of FeW mixed oxides to the selective catalytic reduction of NOx with NH3: in situ DRIFTS and MS. Catal. Today 2018, 307, 35–40. [Google Scholar] [CrossRef]
- Devaiah, D.; Reddy, L.H.; Park, S.-E.; Reddy, B.M. Ceria–zirconia mixed oxides: Synthetic methods and applications. Catal. Rev. 2018, 60, 177–277. [Google Scholar] [CrossRef]
- Xu, H.; Li, Y.; Xu, B.; Cao, Y.; Feng, X.; Sun, M.; Gong, M.; Chen, Y. Effectively promote catalytic performance by adjusting W/Fe molar ratio of FeWx/Ce0.68Zr0.32O2 monolithic catalyst for NH3-SCR. J. Ind. Eng. Chem. 2016, 36, 334–345. [Google Scholar] [CrossRef]
- Qi, G.S.; Yang, R.T. Performance and kinetics study for low-temperature SCR of NO with NH3 over MnOx-CeO2 catalyst. J. Catal. 2003, 217, 434–441. [Google Scholar] [CrossRef]
- Qi, G.S.; Yang, R.T.; Chang, R. MnOx-CeO2 mixed oxides prepared by co-precipitation for selective catalytic reduction of NO with NH3 at low temperatures. Appl. Catal. B Environ. 2004, 51, 93–106. [Google Scholar] [CrossRef]


| Samples | SBET a (m2 g−1) | VBJH b (cm3 g−1) | DBJH c (nm) | Crystallite Size d (nm) | St-plot e (m2 g−1) |
|---|---|---|---|---|---|
| Fe/W–CeO2–O | 67.03 | 0.21 | 10.69 | 9.5 | 7.35 |
| Fe/W–CeO2–P | 80.06 | 0.09 | 3.51 | 6.3 | 9.84 |
| Fe/W–CeO2–R | 47.05 | 0.24 | 16.04 | 10.3 | 5.91 |
| Fe/W–CeO2–C | 15.75 | 0.12 | 28.95 | 36.5 | 2.15 |
| Samples | Fe/W | Ce3+/(Ce3+ + Ce4+) | Oα/(Oα + Oβ) | Fe2+/(Fe2+ + Fe3+) |
|---|---|---|---|---|
| Fe/W–CeO2–O | 0.073 | 0.18 | 0.13 | 0.54 |
| Fe/W–CeO2–P | 0.092 | 0.20 | 0.26 | 0.56 |
| Fe/W–CeO2–R | 0.083 | 0.15 | 0.41 | 0.43 |
| Fe/W–CeO2–C | 0.063 | 0.14 | 0.27 | 0.42 |
© 2019 by the authors. Licensee MDPI, Basel, Switzerland. This article is an open access article distributed under the terms and conditions of the Creative Commons Attribution (CC BY) license (http://creativecommons.org/licenses/by/4.0/).
Share and Cite
Liu, F.; Wang, Z.; Wang, D.; Chen, D.; Chen, F.; Li, X. Morphology and Crystal-Plane Effects of Fe/W-CeO2 for Selective Catalytic Reduction of NO with NH3. Catalysts 2019, 9, 288. https://doi.org/10.3390/catal9030288
Liu F, Wang Z, Wang D, Chen D, Chen F, Li X. Morphology and Crystal-Plane Effects of Fe/W-CeO2 for Selective Catalytic Reduction of NO with NH3. Catalysts. 2019; 9(3):288. https://doi.org/10.3390/catal9030288
Chicago/Turabian StyleLiu, Feihu, Zhong Wang, Da Wang, Dan Chen, Fushan Chen, and Xuebing Li. 2019. "Morphology and Crystal-Plane Effects of Fe/W-CeO2 for Selective Catalytic Reduction of NO with NH3" Catalysts 9, no. 3: 288. https://doi.org/10.3390/catal9030288
APA StyleLiu, F., Wang, Z., Wang, D., Chen, D., Chen, F., & Li, X. (2019). Morphology and Crystal-Plane Effects of Fe/W-CeO2 for Selective Catalytic Reduction of NO with NH3. Catalysts, 9(3), 288. https://doi.org/10.3390/catal9030288