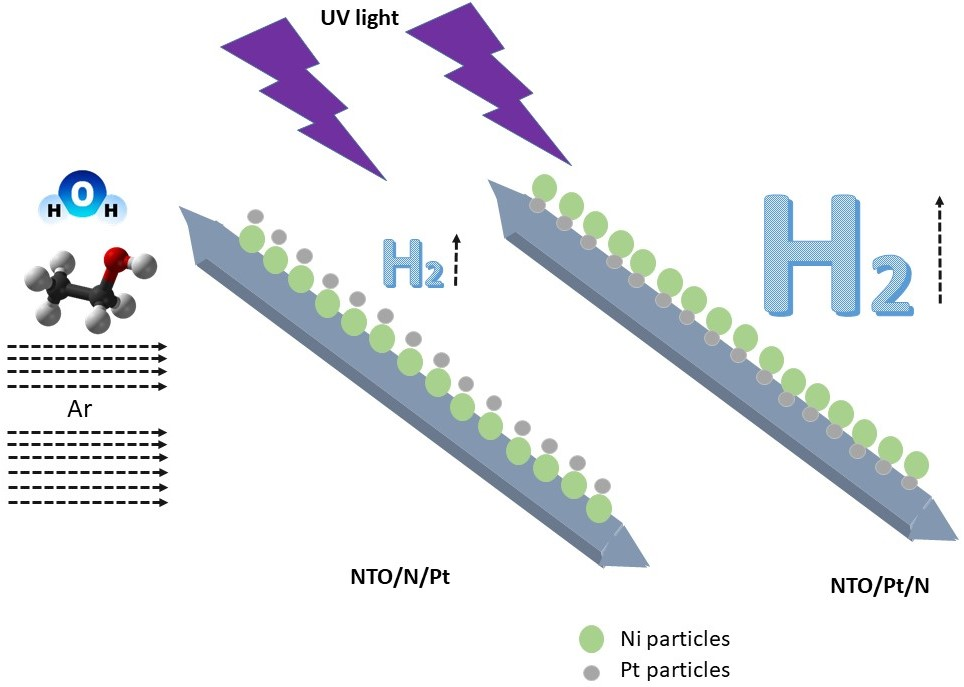
Photocatalytic Hydrogen Evolution Using Bi-Metallic (Ni/Pt) Na2Ti3O7 Whiskers: Effect of the Deposition Order


 , ,
, , 
Abstract
:
1. Introduction
2. Results and Discussion
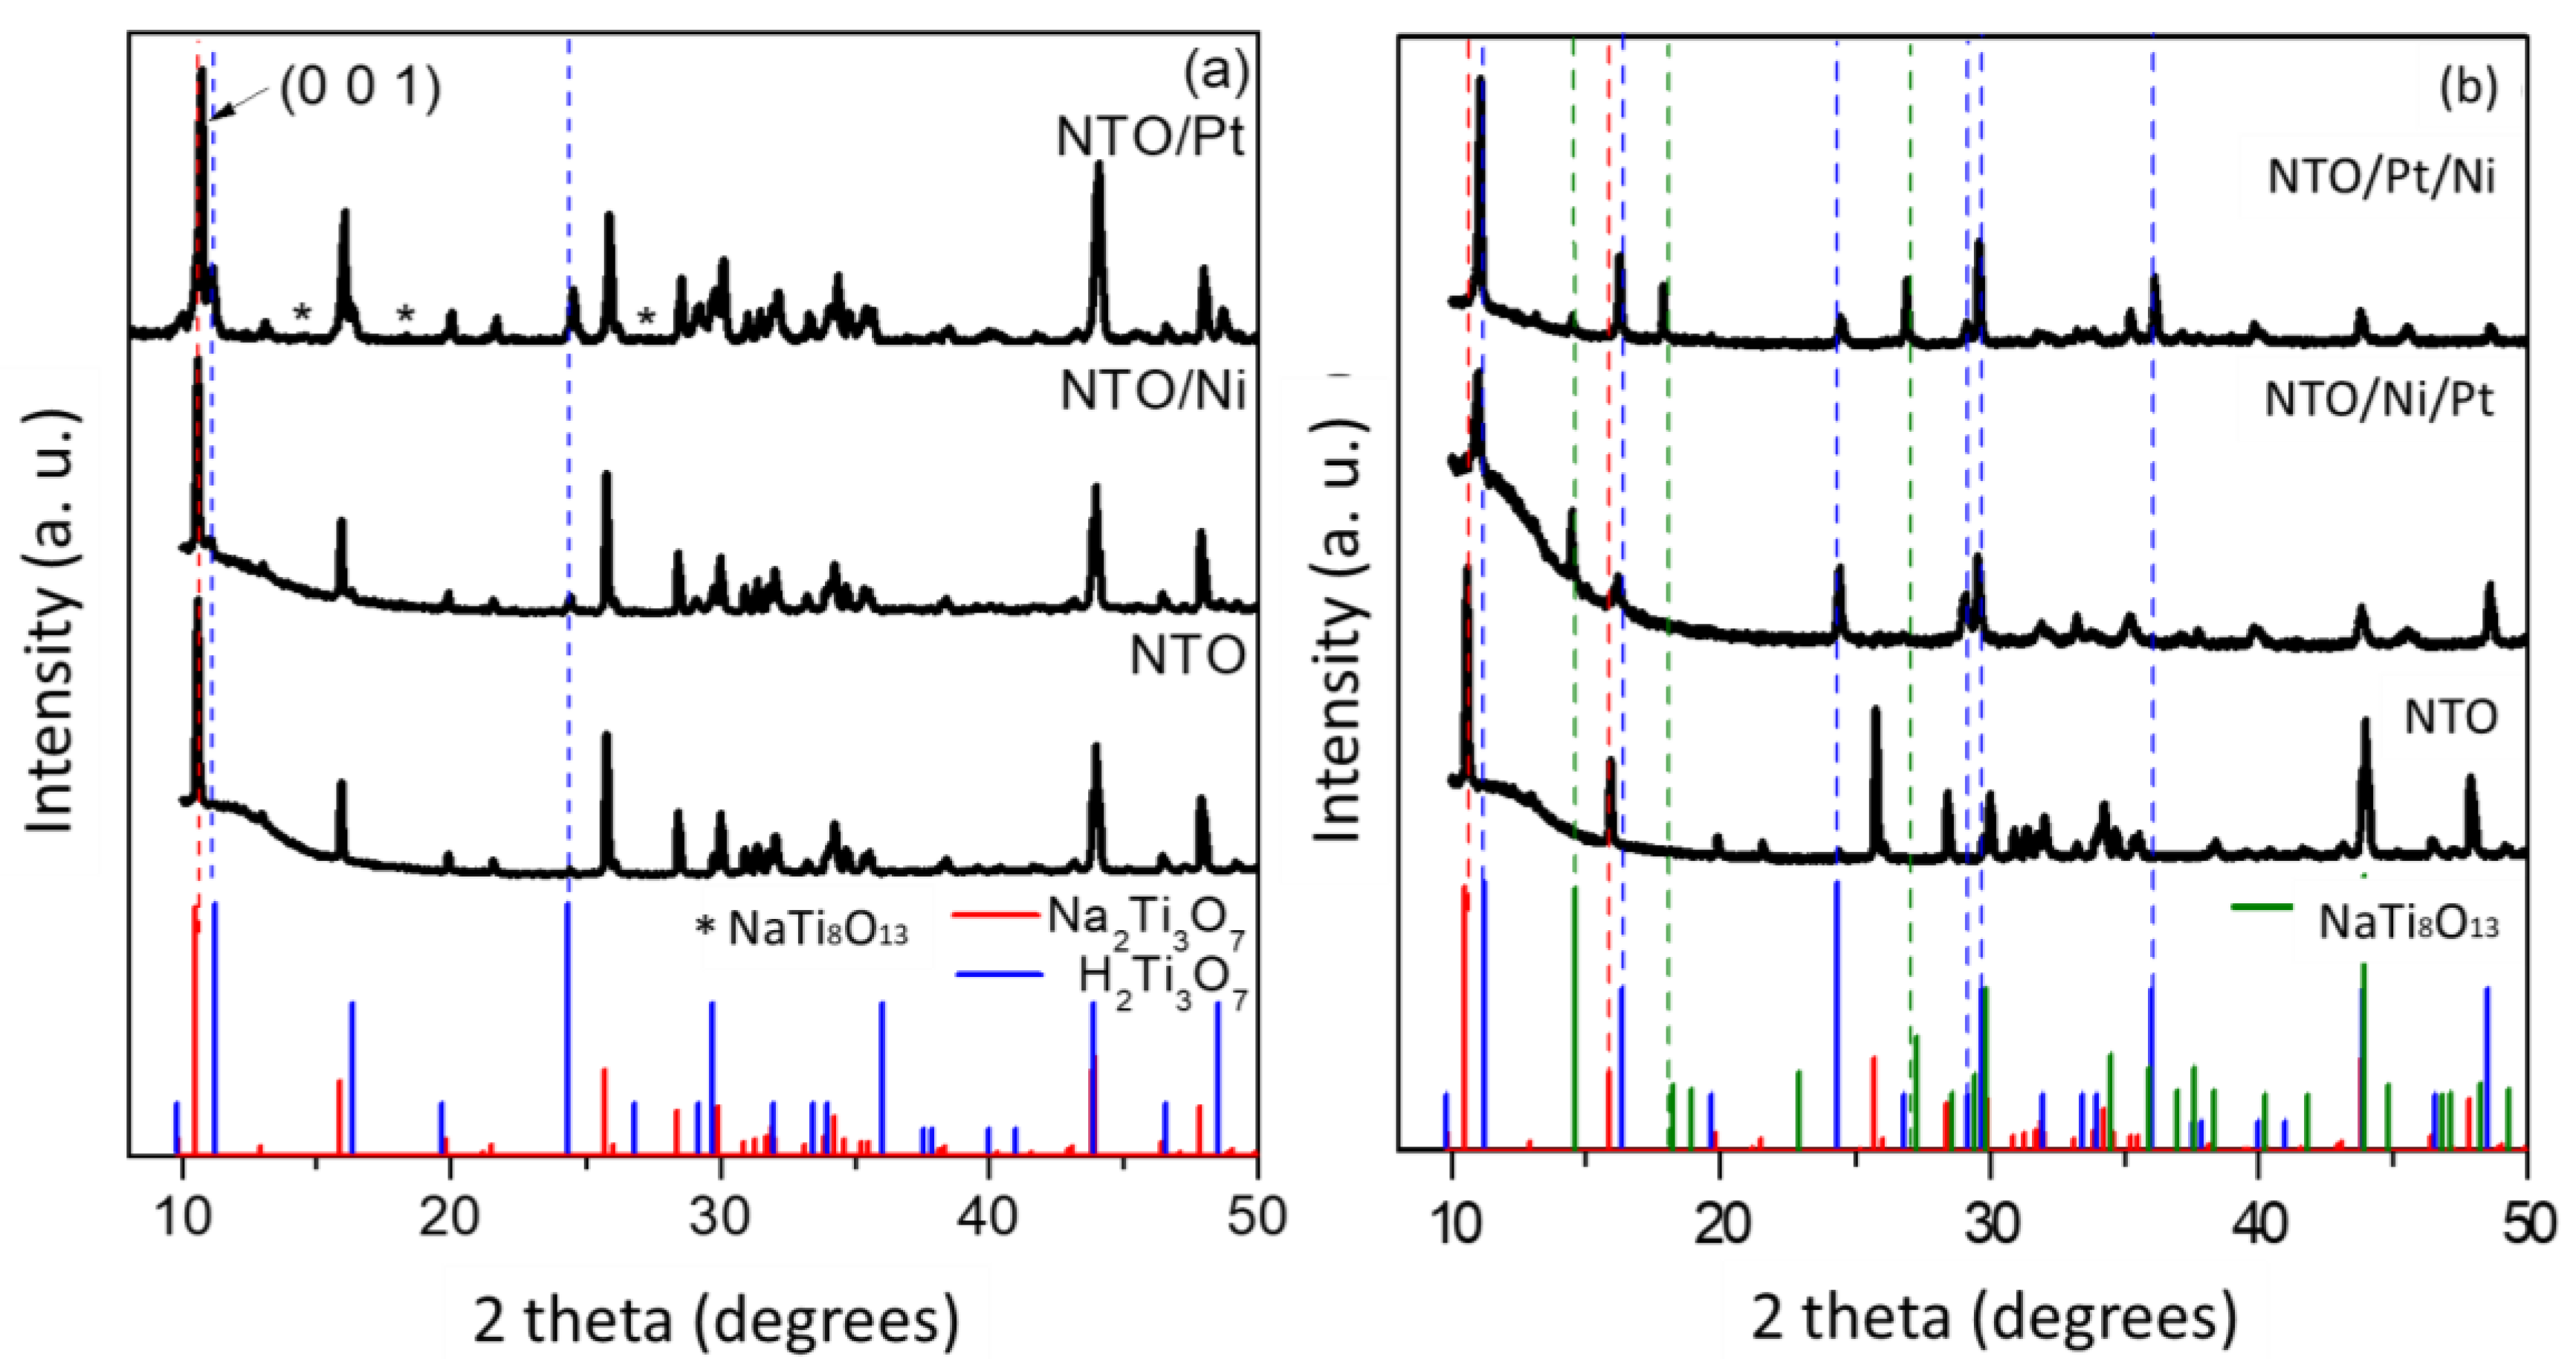
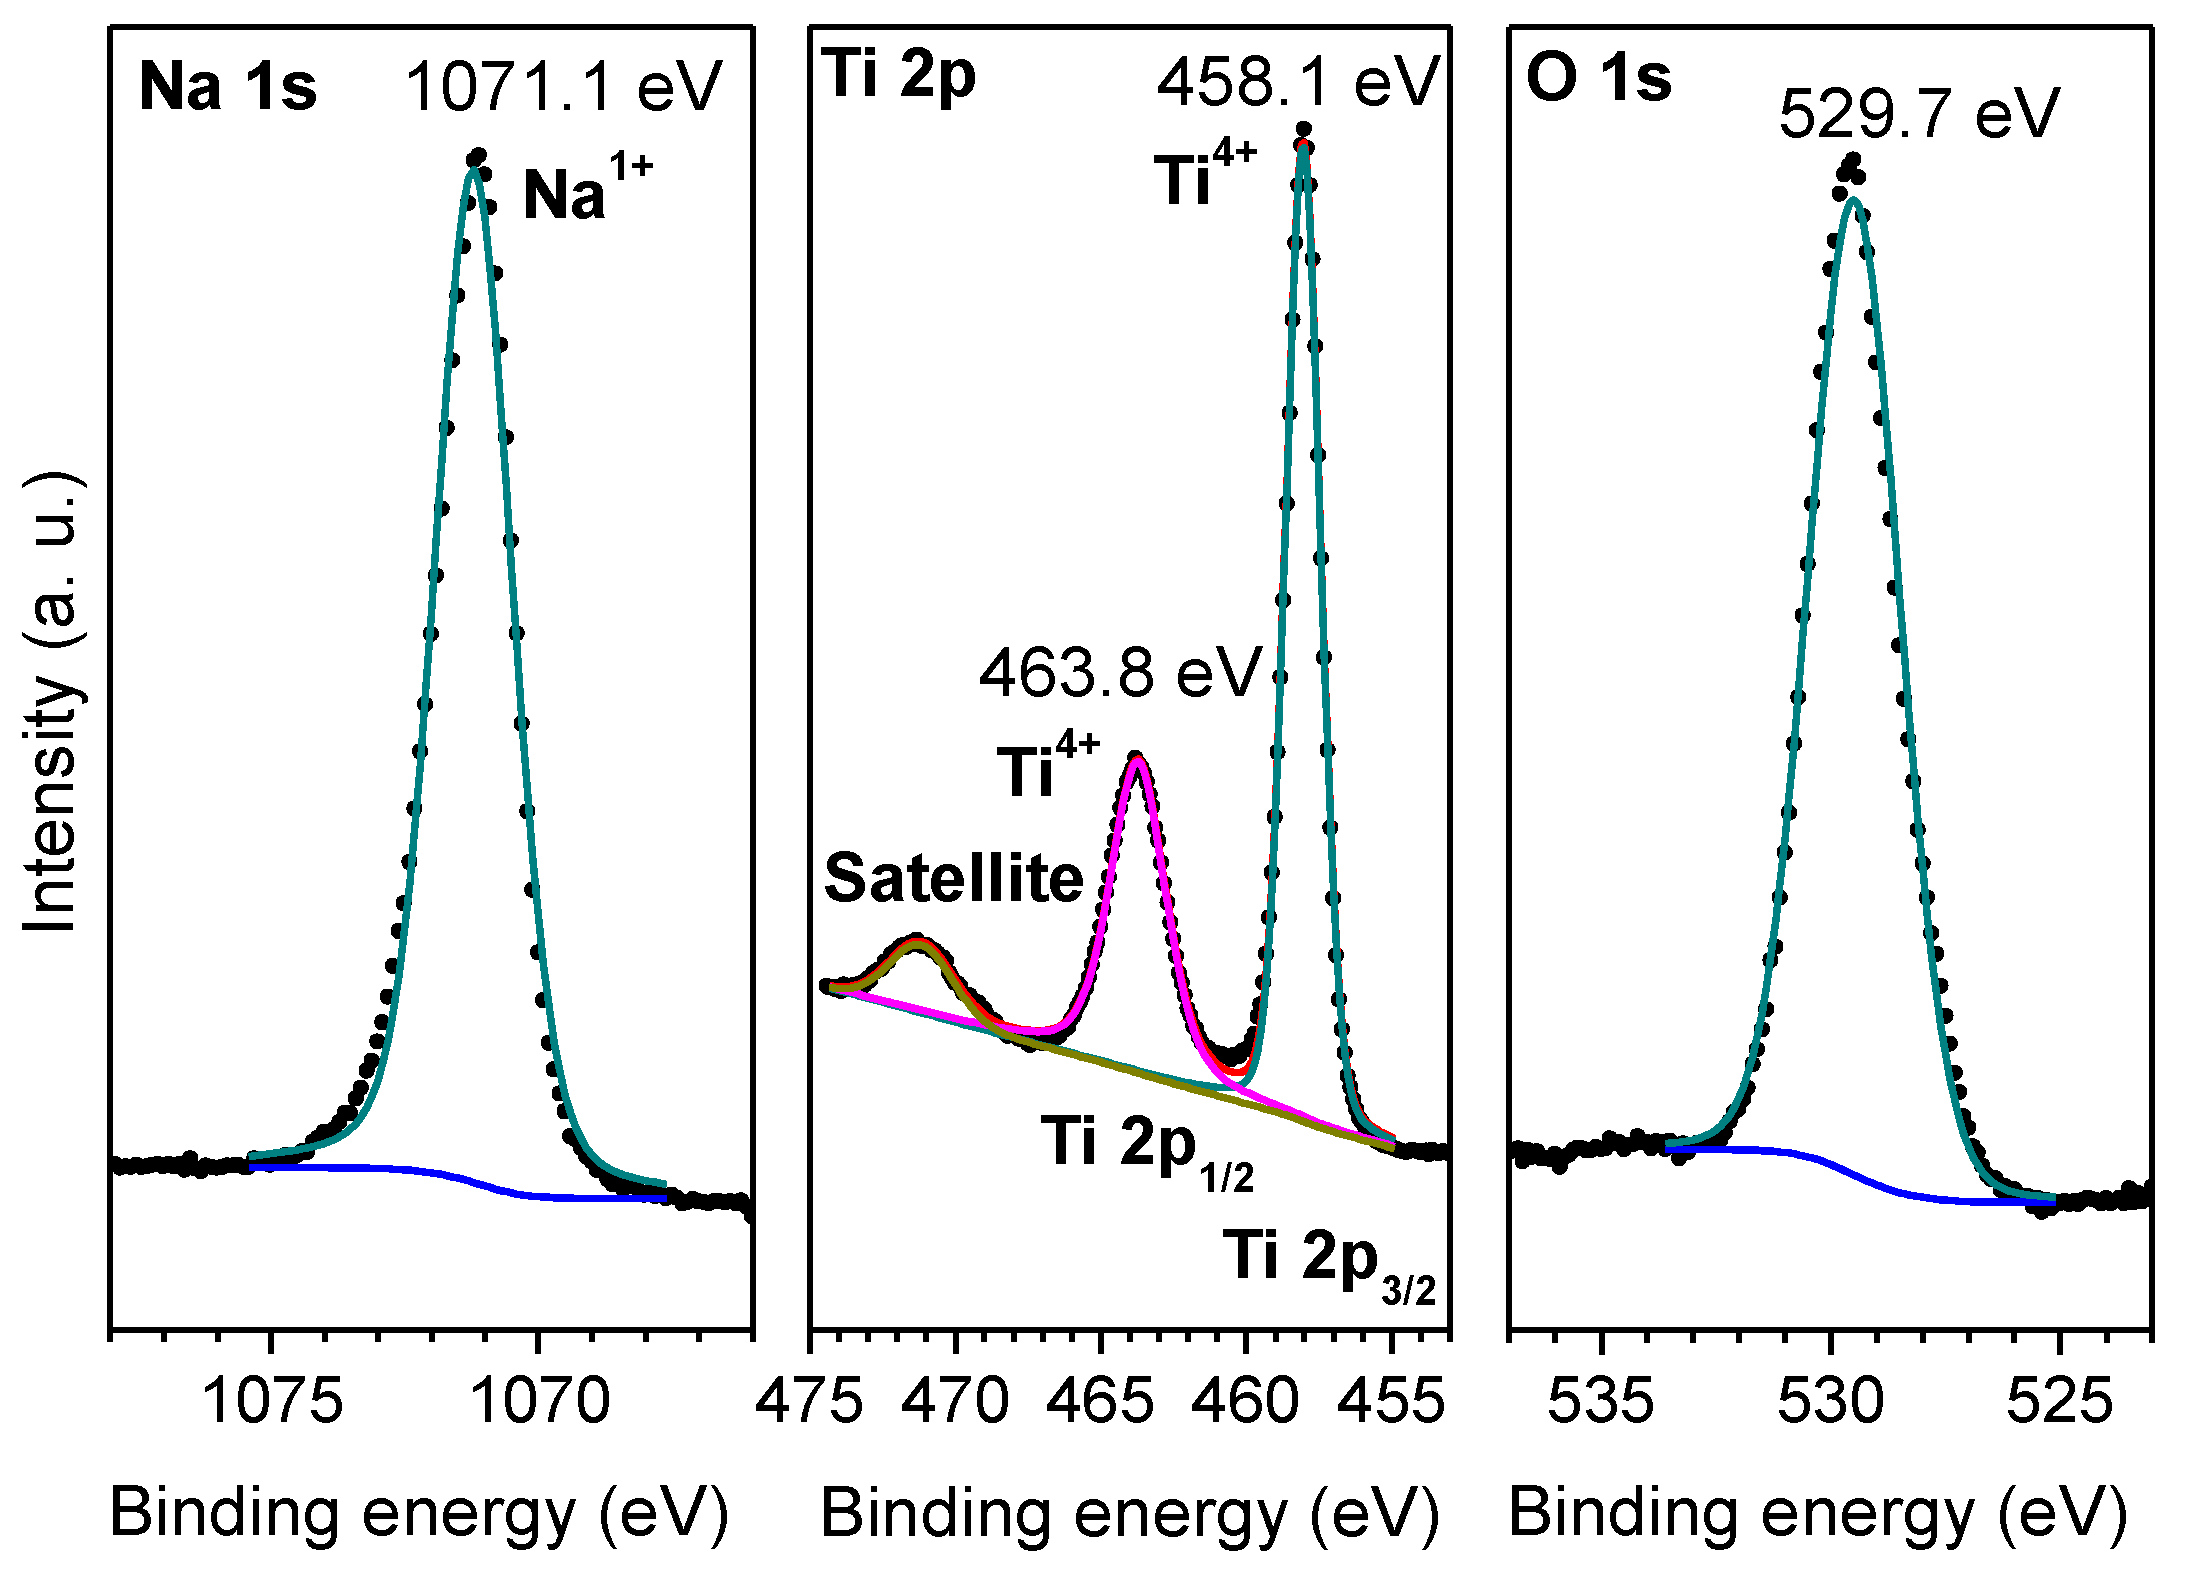
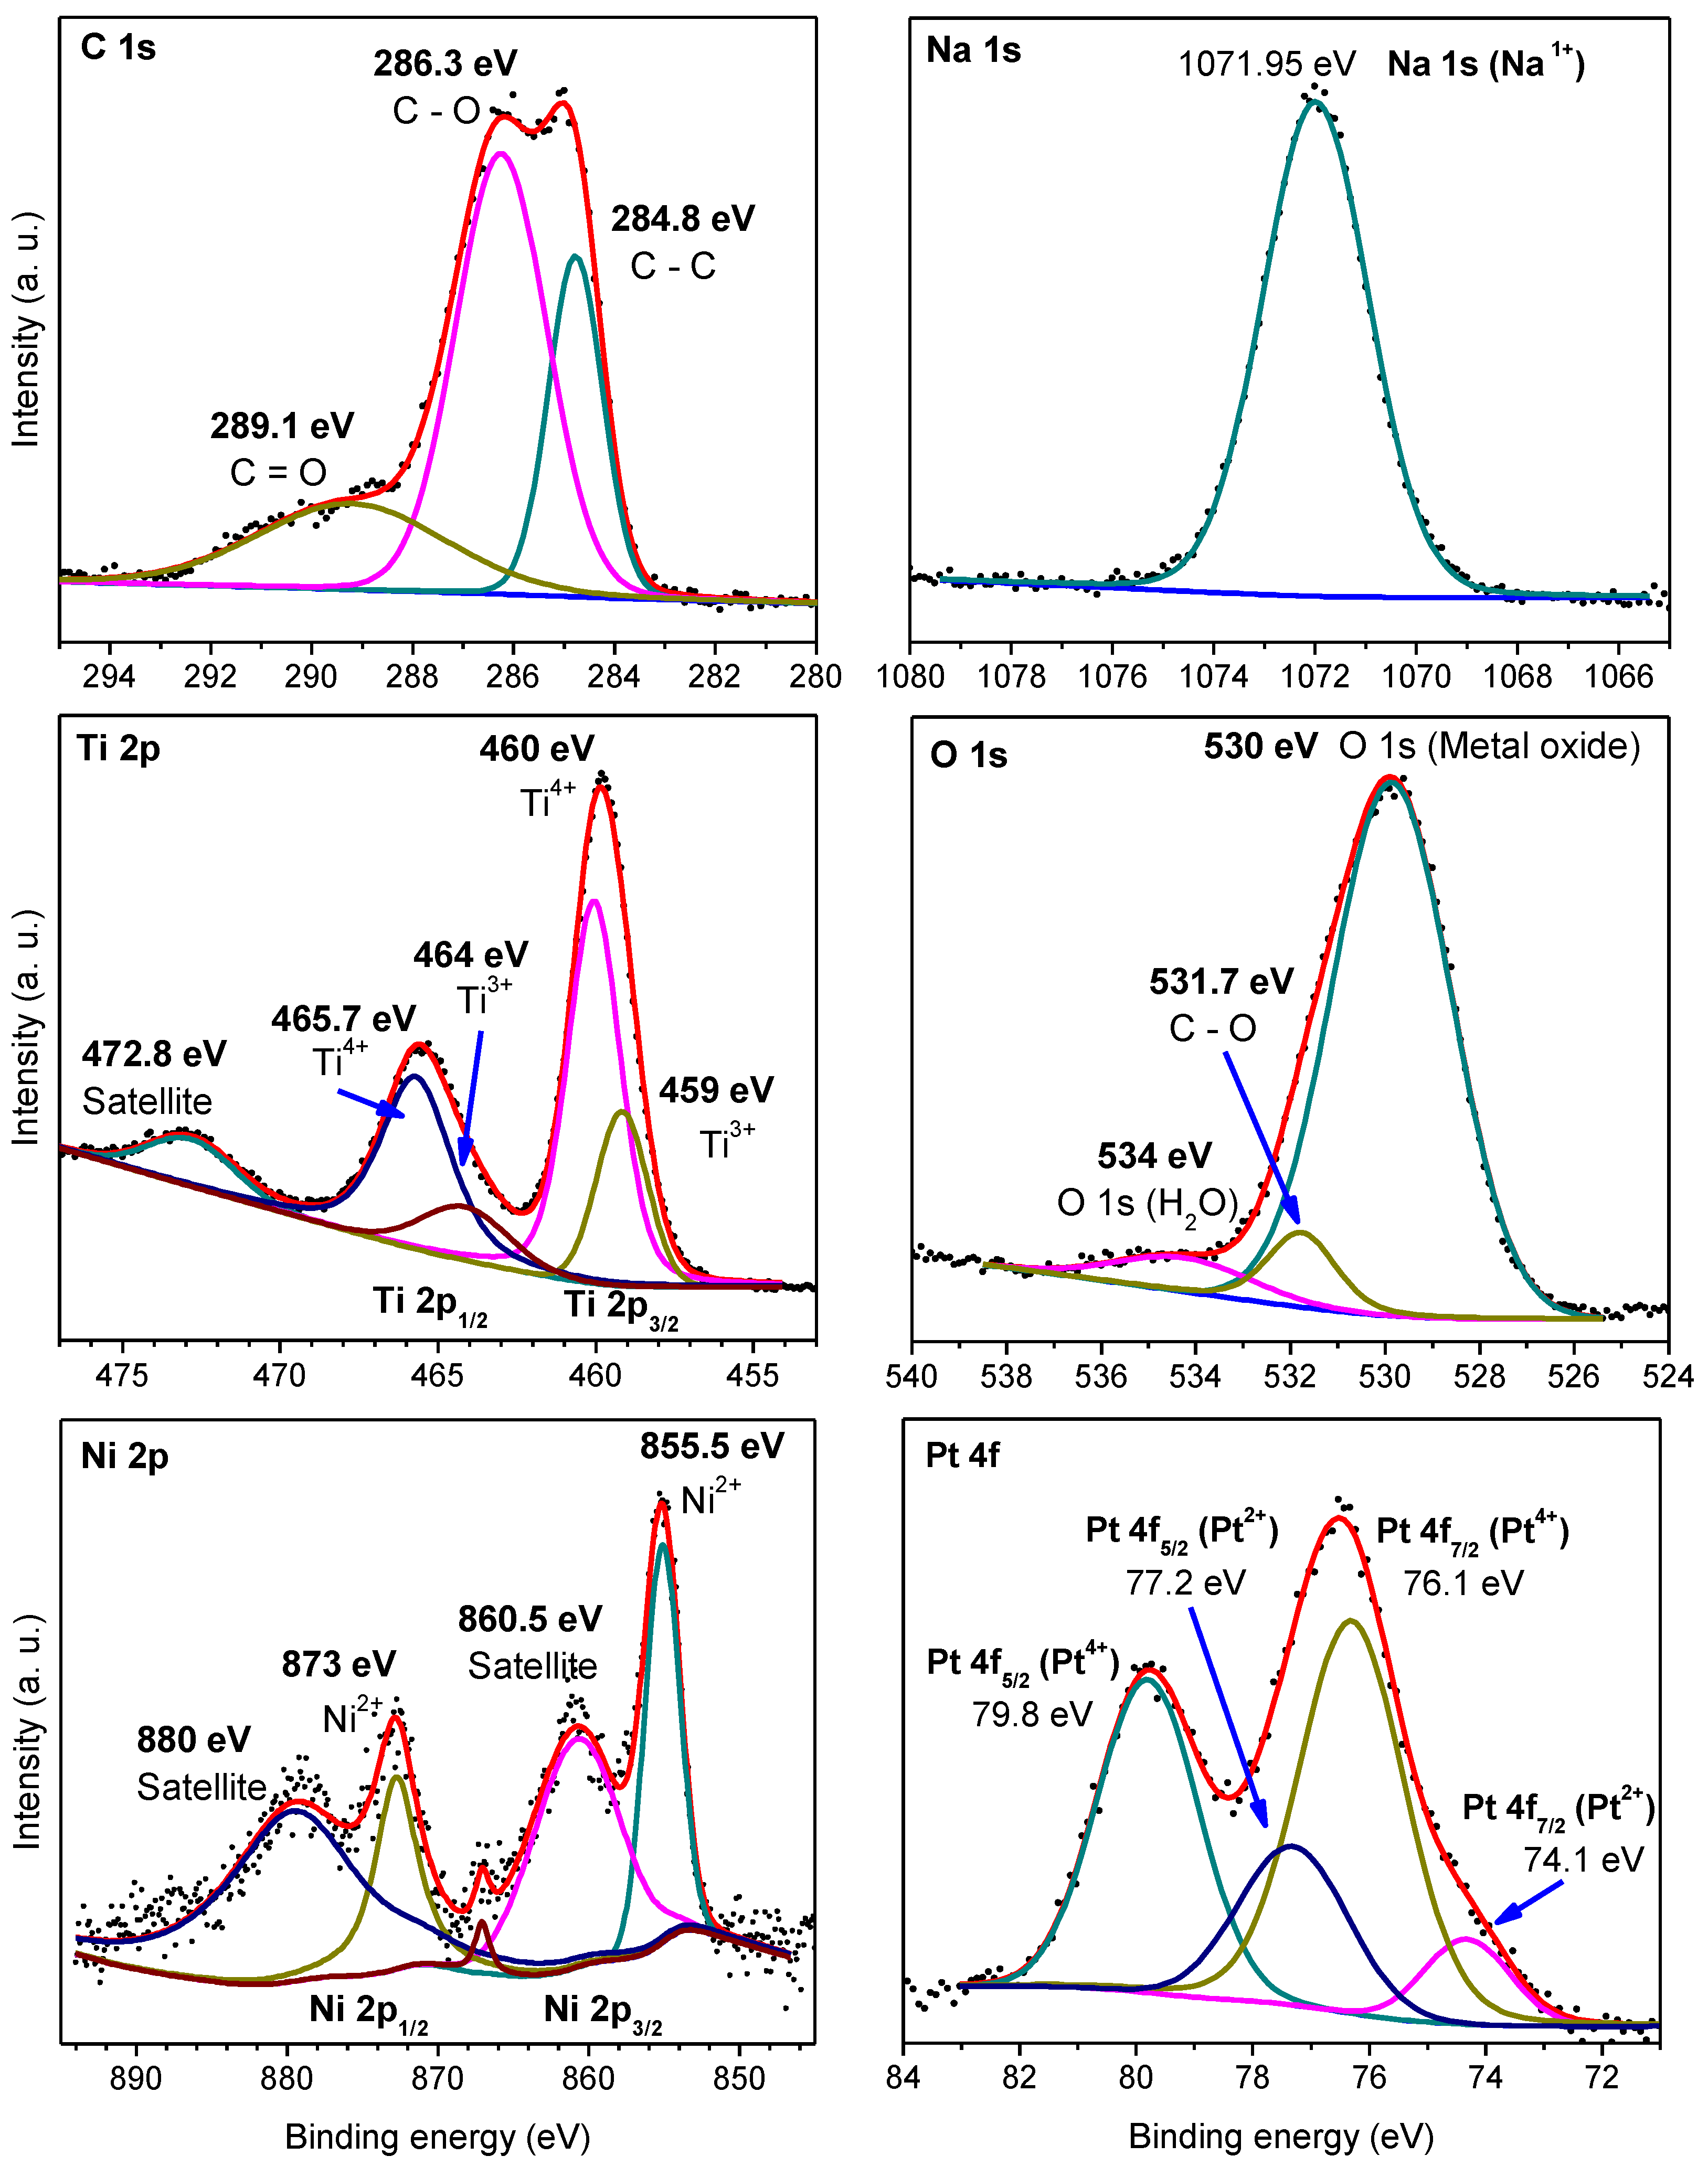
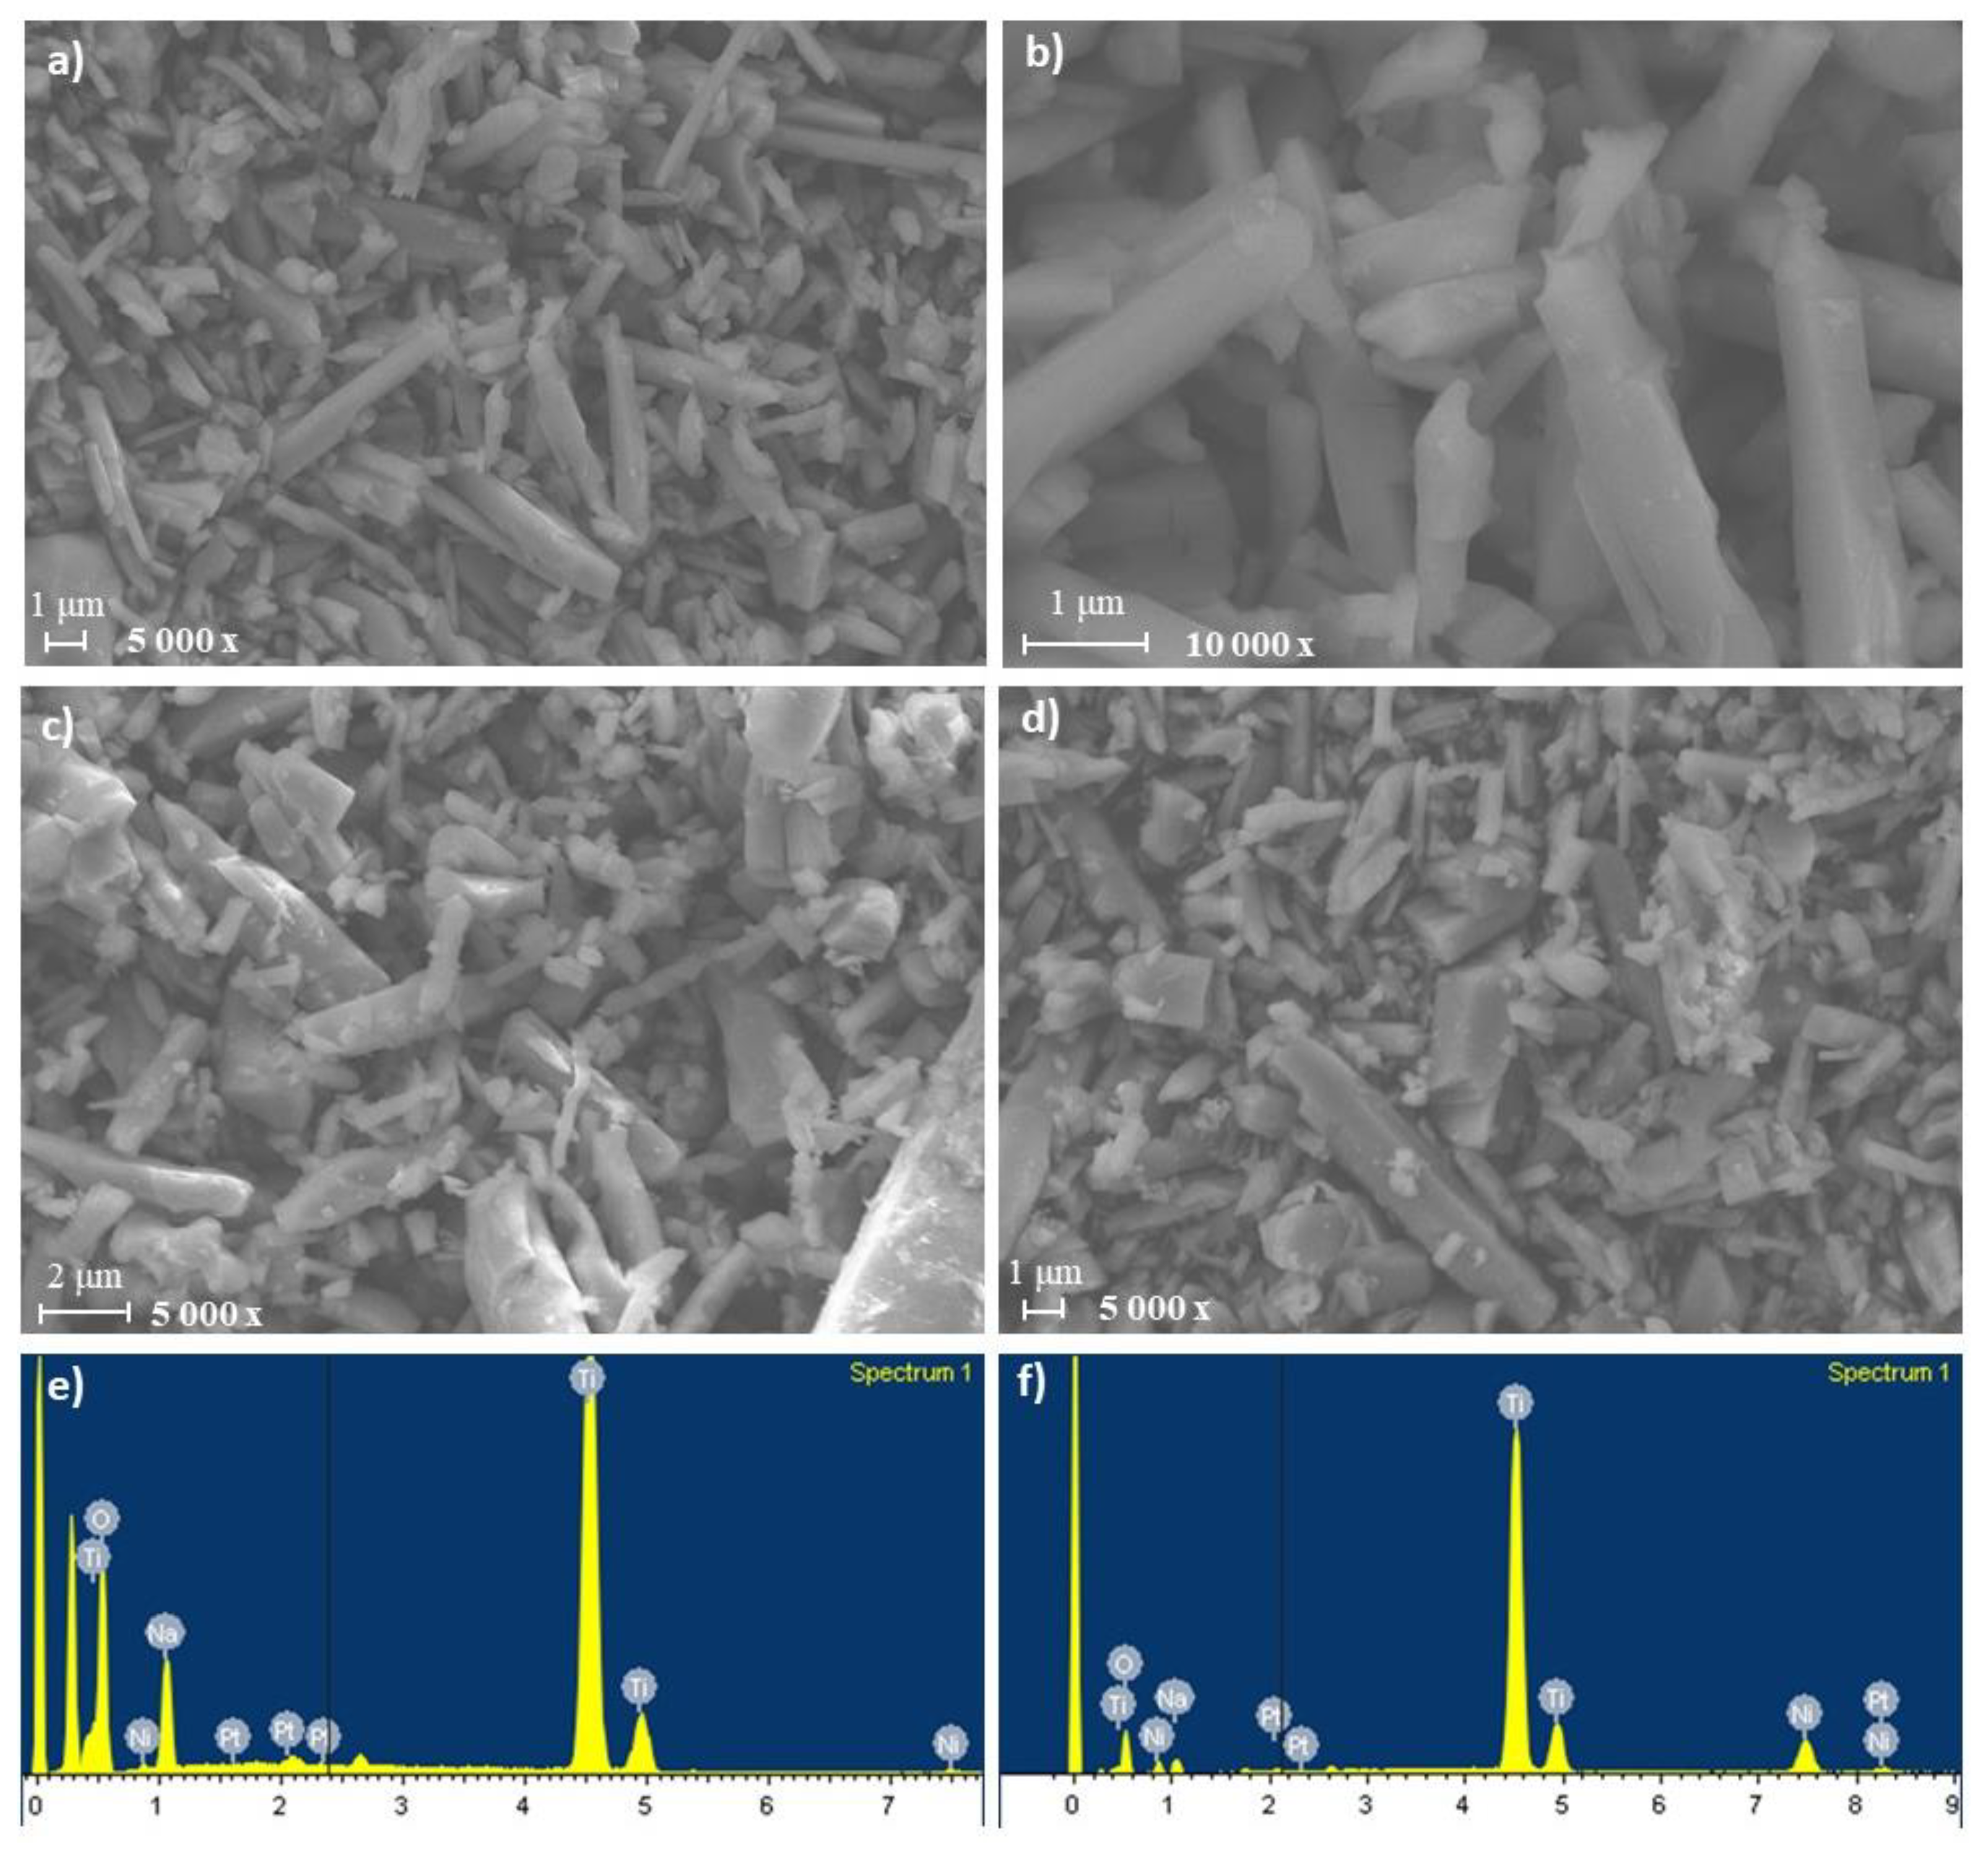
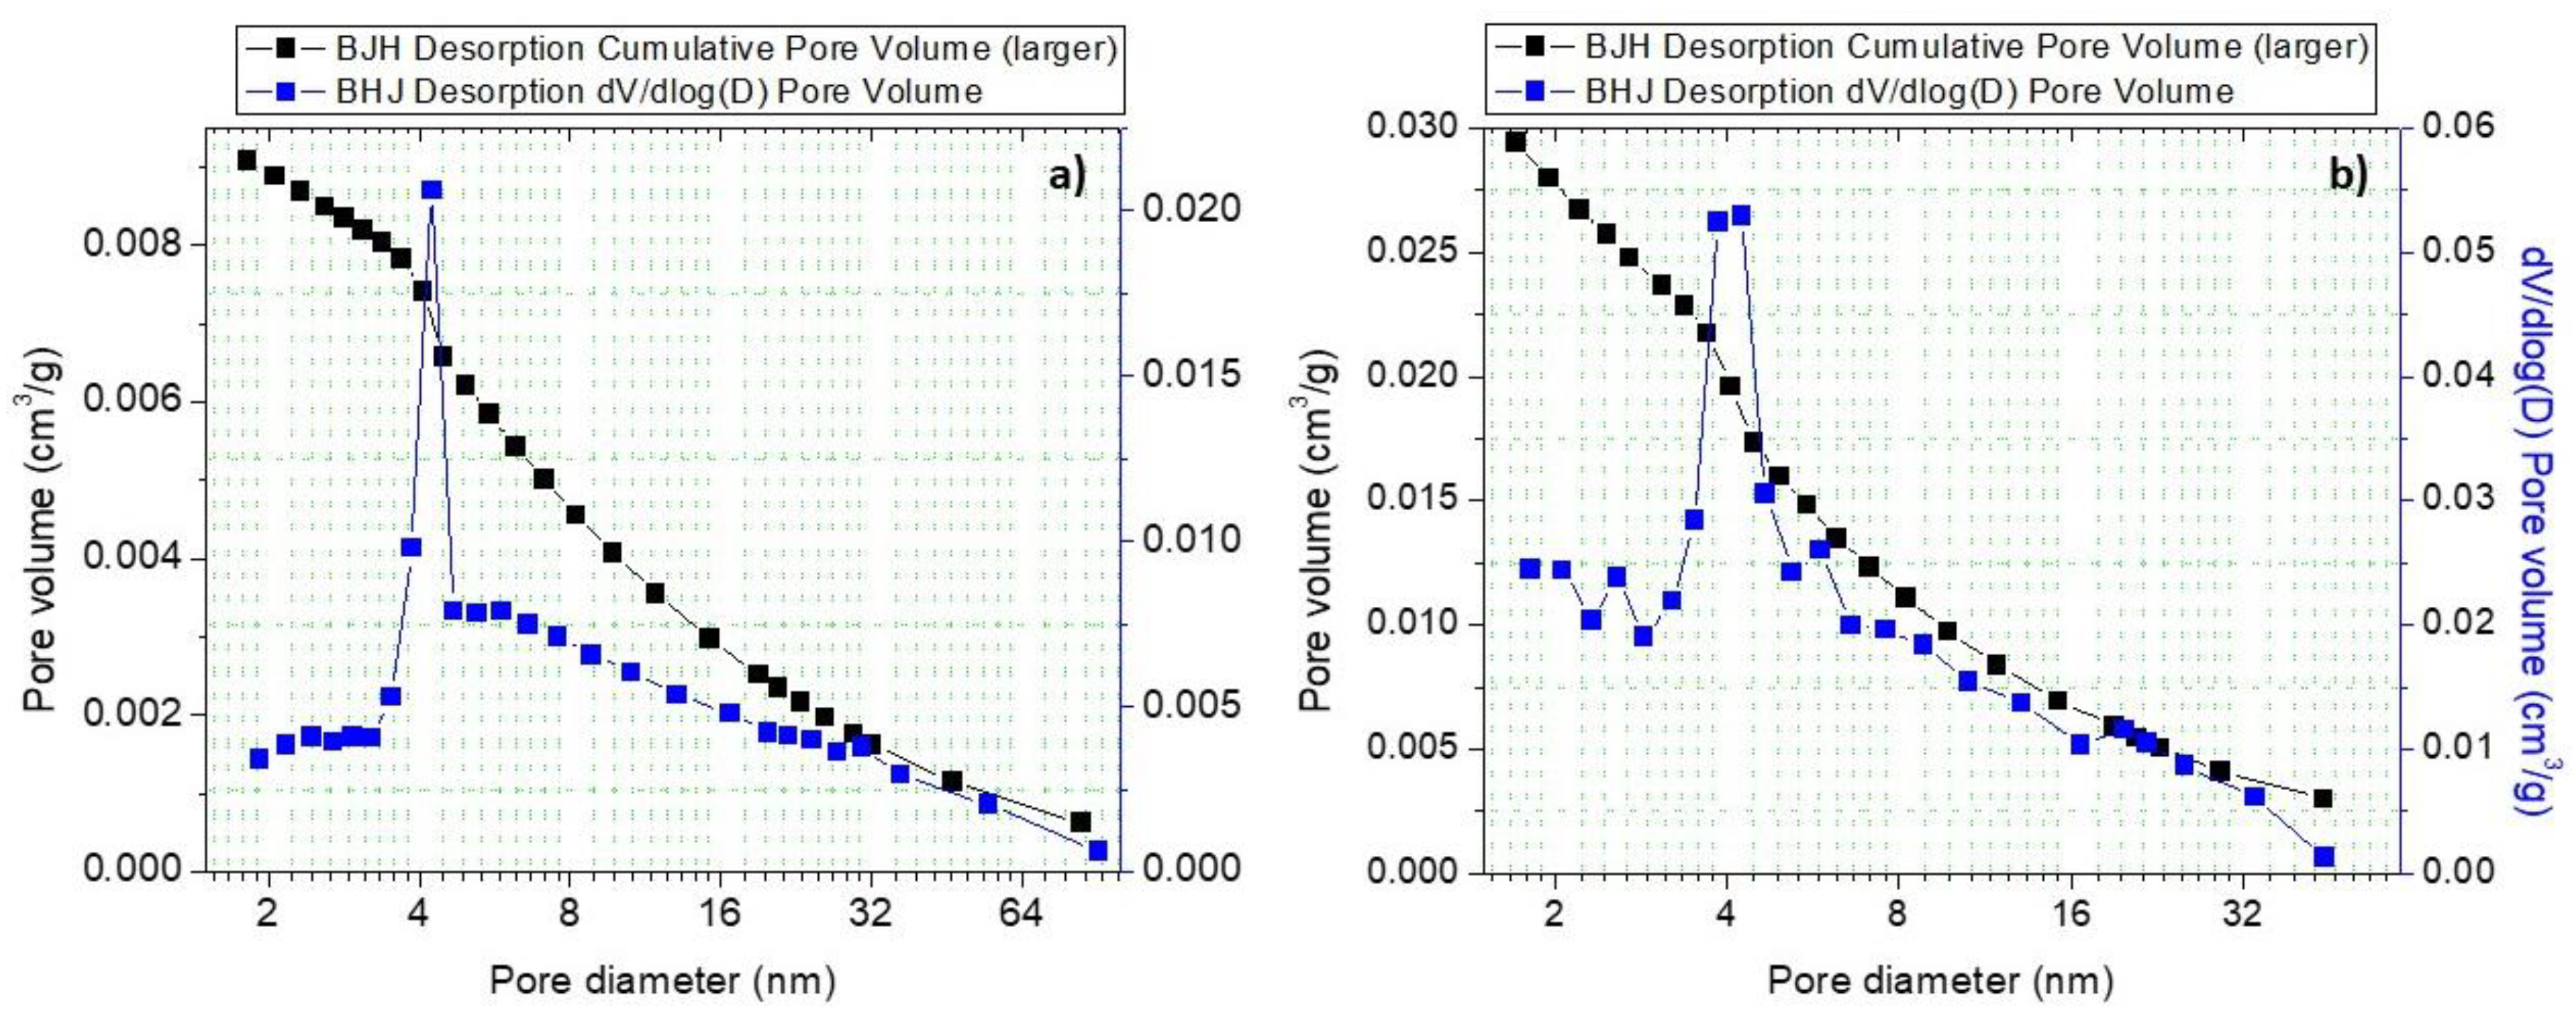
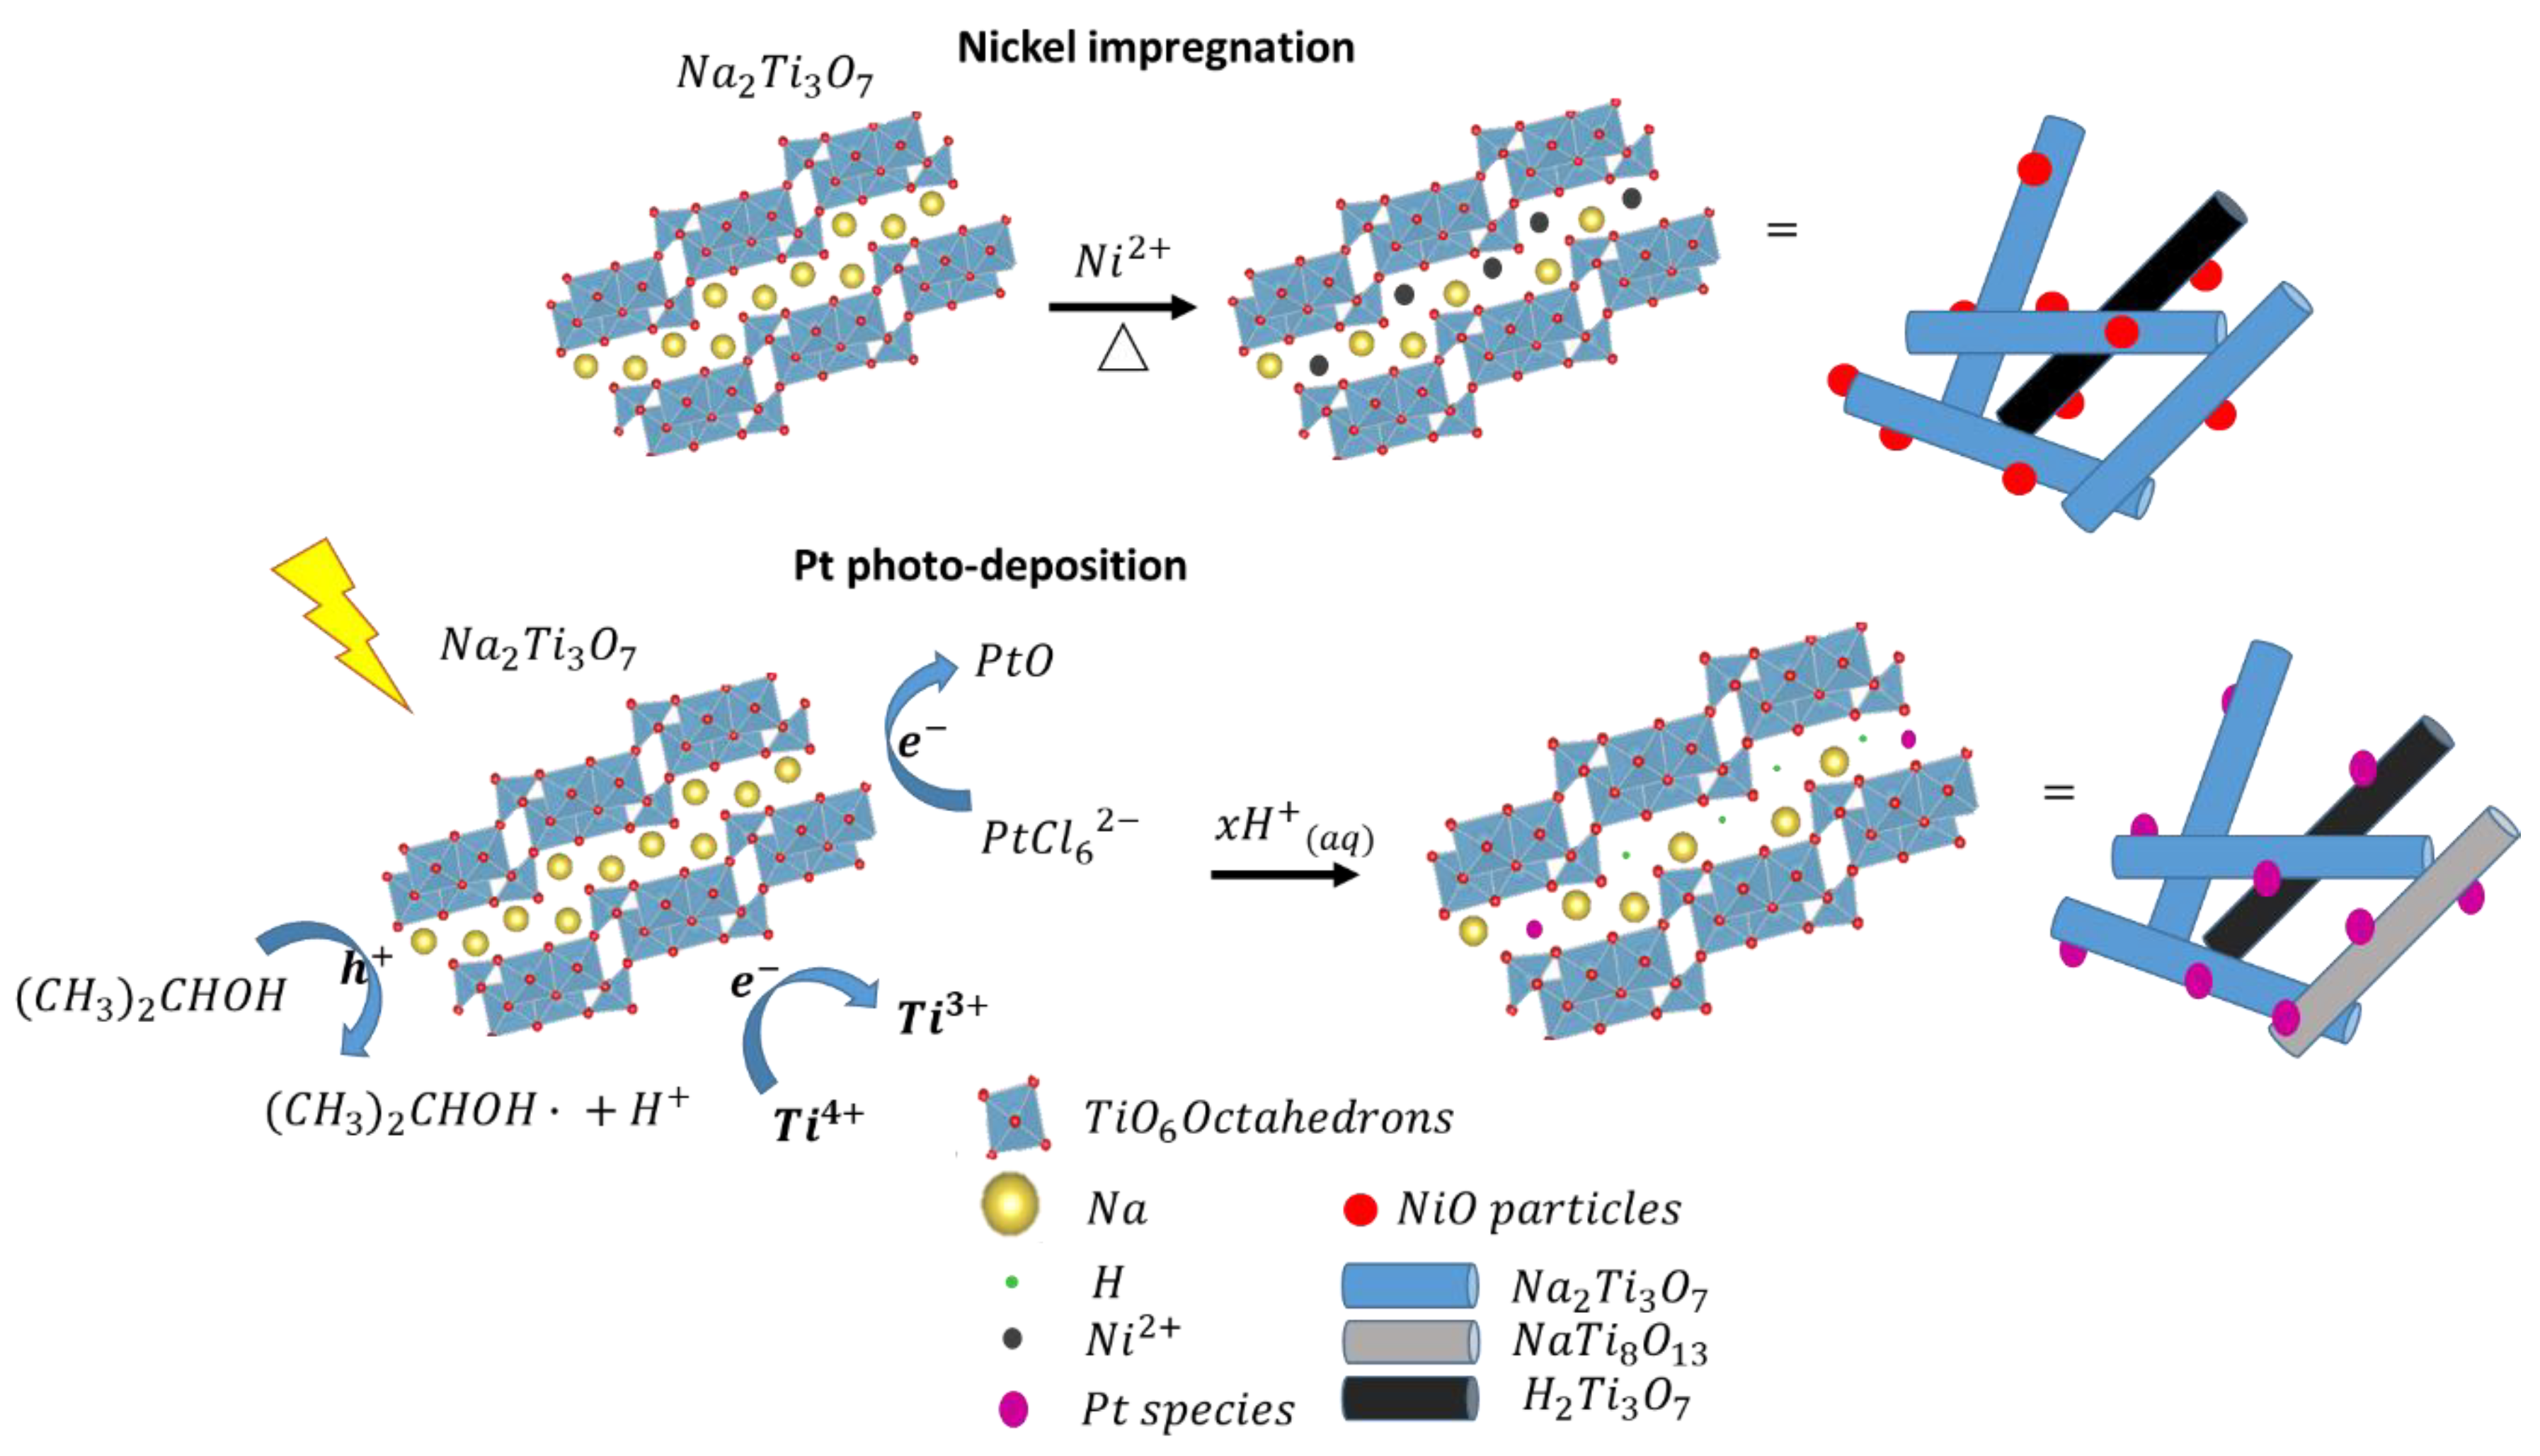
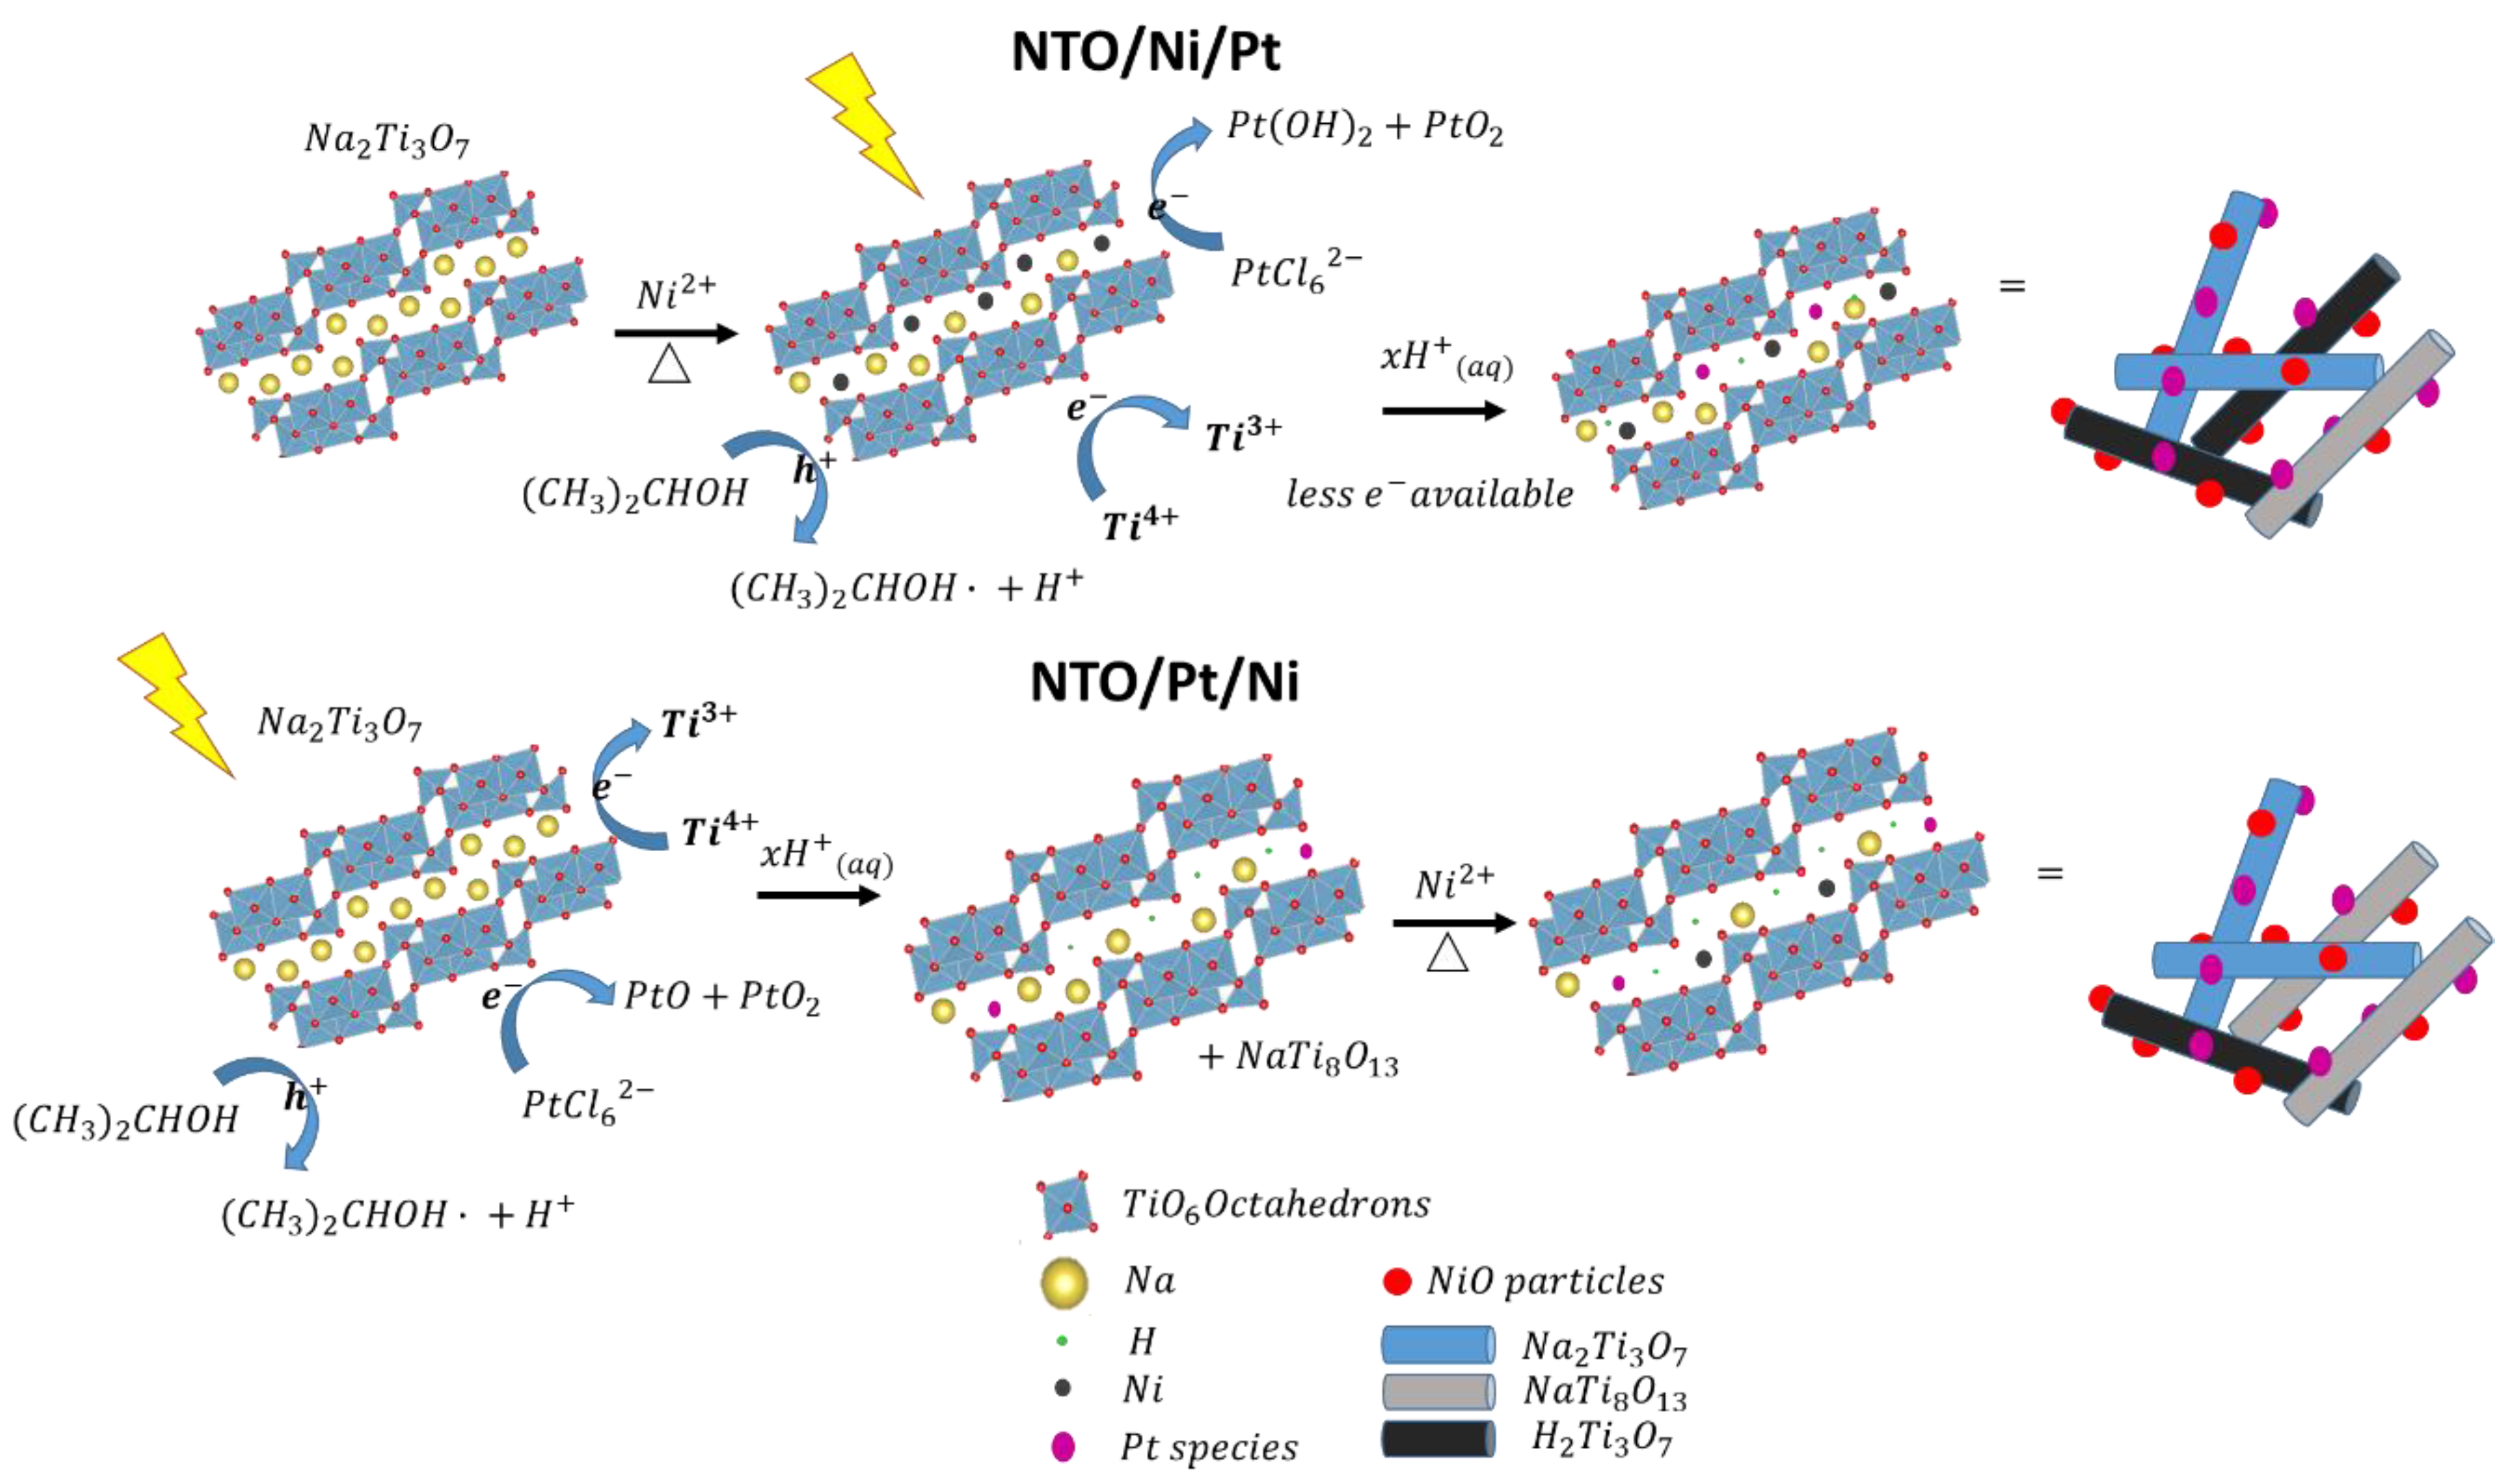
2.1. Characterization
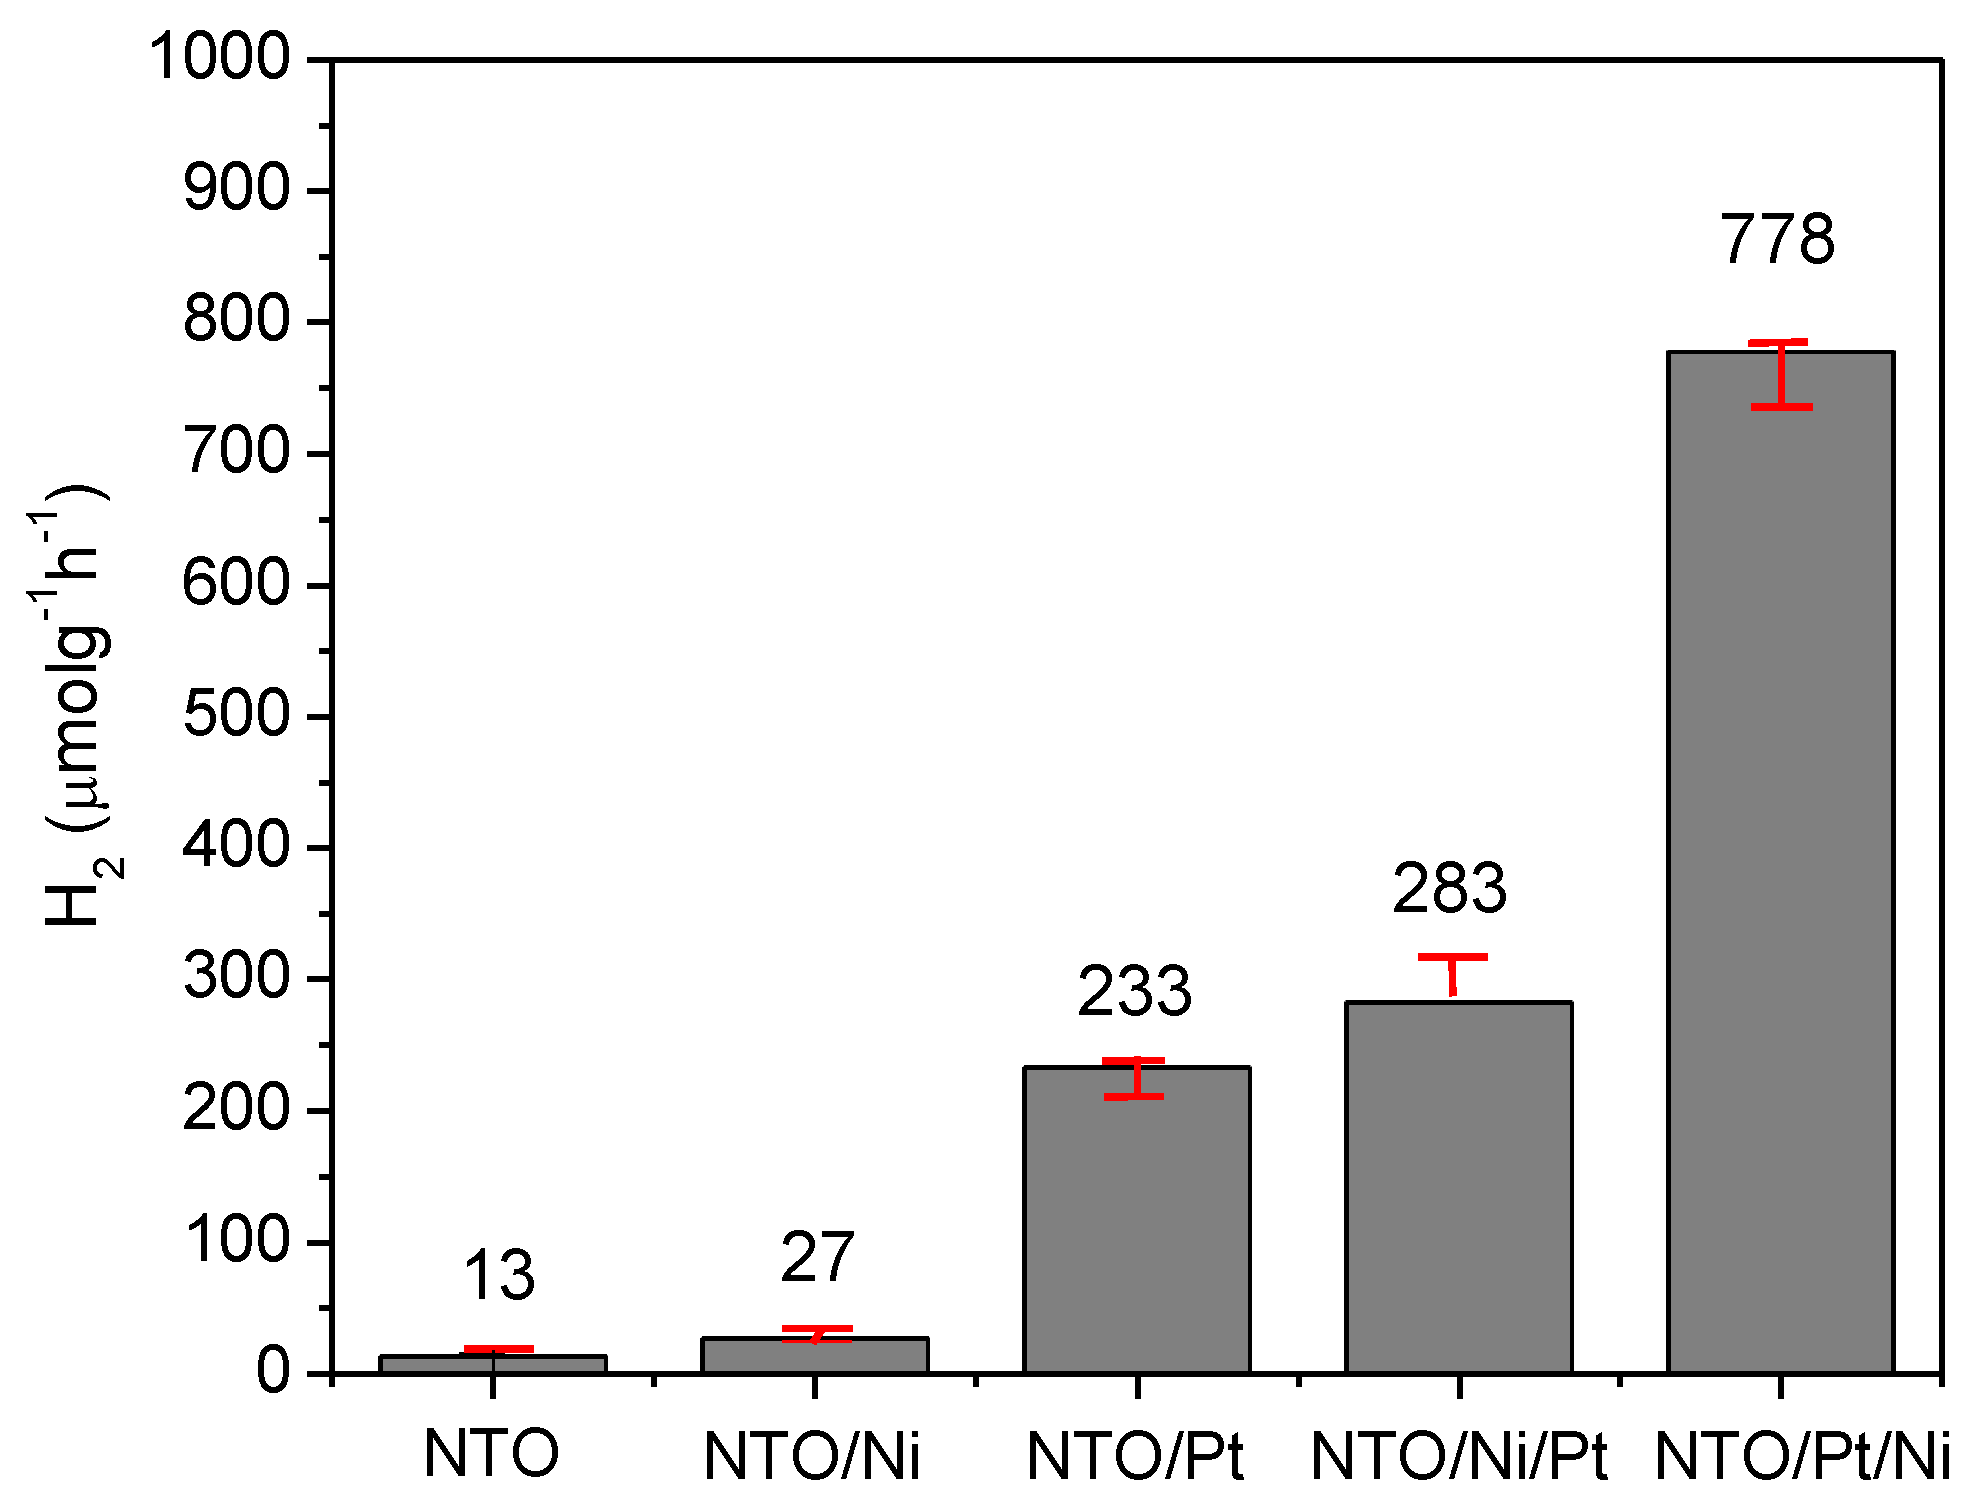
2.2. Photocatalytic Evaluation
3. Materials and Methods
3.1. Catalysts Synthesis
3.2. Characterization
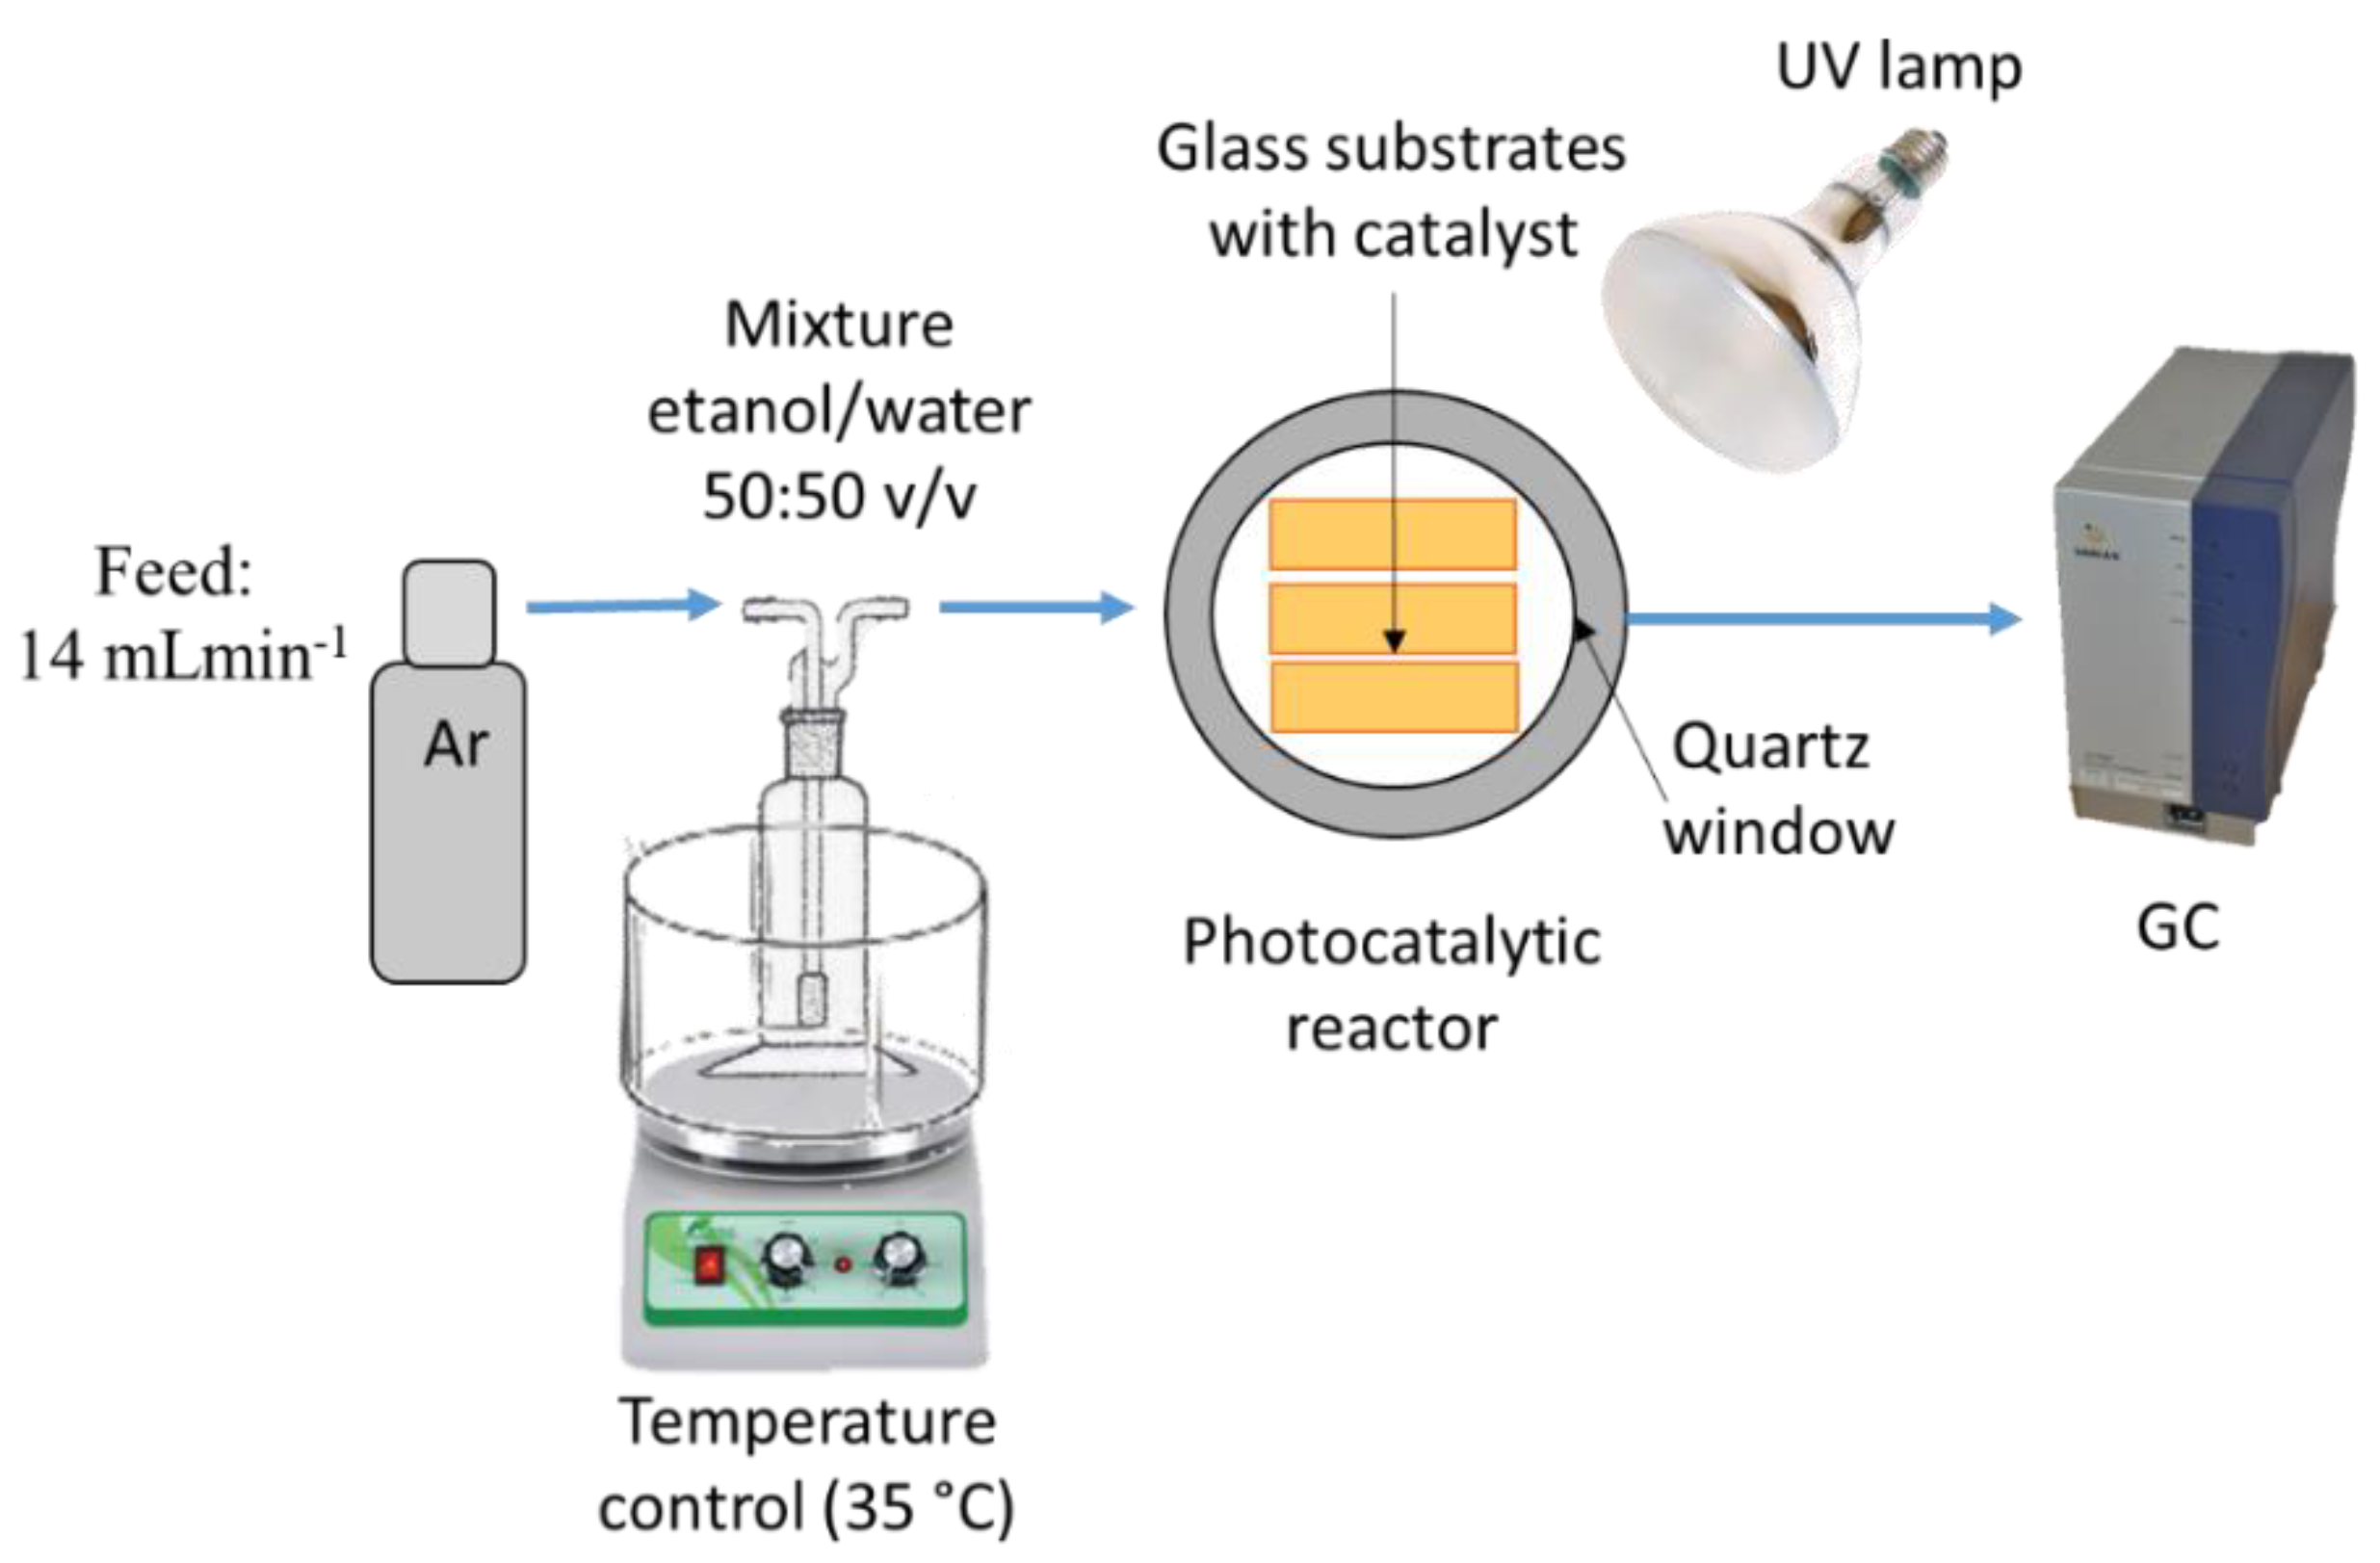
3.3. Photocatalytic Reactions
4. Conclusions
Supplementary Materials
Author Contributions
Funding
Acknowledgments
Conflicts of Interest
References
- Ahmed, A.; Al-Amin, A.Q.; Ambrose, A.F.; Saidur, R. Hydrogen fuel and transport system: A sustainable and environmental future. Int. J. Hydrogen Energy 2016, 41, 1369–1380. [Google Scholar] [CrossRef]
- Singh, S.; Jain, S.; Ps, V.; Tiwari, A.K.; Nouni, M.R.; Pandey, J.K.; Goel, S. Hydrogen: A sustainable fuel for future of the transport sector. Renew. Sustain. Energy Rev. 2015, 51, 623–633. [Google Scholar] [CrossRef]
- Kawai, T.; Sakata, T. Photocatalytic hydrogen production from liquid methanol and water. J. Chem. Soc. Chem. Commun. 1980, 15, 694–695. [Google Scholar] [CrossRef]
- Lin, W.-C.; Yang, W.-D.; Huang, I.-L.; Wu, T.-S.; Chung, Z.-J. Hydrogen production from methanol/water photocatalytic decomposition using Pt/TiO2−xNx catalyst. Energy Fuels 2009, 23, 2192–2196. [Google Scholar] [CrossRef]
- Strataki, N.; Bekiari, V.; Kondarides, D.I.; Lianos, P. Hydrogen production by photocatalytic alcohol reforming employing highly efficient nanocrystalline titania films. Appl. Catal. B Environ. 2007, 77, 184–189. [Google Scholar] [CrossRef]
- Petala, A.; Ioannidou, E.; Georgaka, A.; Bourikas, K.; Kondarides, D.I. Hysteresis phenomena and rate fluctuations under conditions of glycerol photo-reforming reaction over CuOx/TiO2 catalysts. Appl. Catal. B Environ. 2015, 178, 201–209. [Google Scholar] [CrossRef]
- Gombac, V.; Sordelli, L.; Montini, T.; Delgado, J.J.; Adamski, A.; Adami, G.; Cargnello, M.; Bernal, S.; Fornasiero, P. CuOx-TiO2 photocatalysts for H2 production from ethanol and glycerol solutions. J. Phys. Chem. A 2010, 114, 3916–3925. [Google Scholar] [CrossRef] [PubMed]
- Chen, W.-T.; Chan, A.; Sun-Waterhouse, D.; Moriga, T.; Idriss, H.; Waterhouse, G.I.N. Ni-TiO2: A promising low-cost photocatalytic system for solar H2 production from ethanol-water mixtures. J. Catal. 2015, 326, 43–53. [Google Scholar] [CrossRef]
- Liu, R.; Yoshida, H.; Fujita, S.-I.; Arai, M. Photocatalytic hydrogen production from glycerol and water with NiOx/TiO2 catalysts. Appl. Catal. B Environ. 2014, 144, 41–45. [Google Scholar] [CrossRef]
- Luna, A.L.; Novoseltceva, E.; Louarn, E.; Beaunier, P.; Kowalsa, E.; Ohtani, B.; Valenzuela, M.A.; Remita, H.; Colbeau-Justin, C. Synergetic effect of Ni and Au nanoparticles synthesized on titania particles for efficient hydrogen production. Appl. Catal. B Environ. 2016, 191, 18–28. [Google Scholar] [CrossRef]
- Luna, A.L.; Dragoe, D.; Wang, K.; Beaunier, P.; Kowalska, E.; Ohtani, B.; Uribe, D.B.; Valenzuela, M.A.; Remita, H.; Colbeau-Justin, C. Photocatalytic hydrogen evolution using Ni-Pd/TiO2: Correlation of light absorption, charge-carrier dynamics, and quantum efficiency. J. Phys. Chem. C 2017, 121, 14302–14311. [Google Scholar] [CrossRef]
- Ramírez-Salgado, J.; Djurado, E.; Fabry, P. Synthesis of sodium titanate composites by sol-gel method for use in gas potentiometric sensors. J. Eur. Ceram. Soc. 2004, 24, 2477–2483. [Google Scholar] [CrossRef]
- Ogura, S.; Kohno, M.; Sato, K.; Inoue, Y. Effects of RuO2 on activity for water decomposition of a RuO2/Na2Ti3O7 photocatalysts with a zigzag layer structure. J. Mater. Chem. 1998, 8, 2335–2337. [Google Scholar] [CrossRef]
- Ogura, S.; Kohno, M.; Sato, K.; Inoue, Y. Photocatalytic properties of M2Ti6O13 (M = Na, K, Rb, Cs) with rectangular tunnel and layer structures: Behavior of a surface radical produced by UV irradiation and photocatalytic activity for water decomposition. Phys. Chem. Chem. Phys. 1999, 1, 179–183. [Google Scholar] [CrossRef]
- Cech, O.; Castkova, K.; Chladil, L.; Dohnal, P.; Cudek, P.; Libich, J.; Vanysek, P. Synthesis and characterization of Na2Ti6O13 and Na2Ti6O13/Na2Ti3O7 sodium titanates with nanorod-like structure as negative electrode materials for sodium-ion batteries. J. Energy Storage 2017, 14, 391–398. [Google Scholar] [CrossRef]
- Pérez-Flores, J.C.; García-Alvarado, F.; Hoelzel, M.; Sobrados, I.; Sanz, J.; Kuhn, A. Insight into the channel ion distribution and influence on the lithium insertion properties of hexatitanates A2Ti6O13 (A = Na, Li, H) as candidates for anode materials in lithium-ion batteries. Dalt. Trans. 2012, 41, 14633–14642. [Google Scholar] [CrossRef] [PubMed]
- Feng, M.; You, W.; Wu, Z.; Chen, Q.; Zhan, H. Mildly alkaline preparation and methylene blue adsorption capacity of hierarchical flower-like sodium titanate. ACS Appl. Mater. Interfaces 2013, 5, 12654–12662. [Google Scholar] [CrossRef]
- Wang, Y.; Liu, H. Preparation and characterizations of Na2Ti3O7, H2Ti3O7 and TiO2 nanobelts. Adv. Mater. Res. 2011, 306–307, 1233–1237. [Google Scholar] [CrossRef]
- Ma, X.W.; Shen, J.X.; Zhang, K.C.; Kong, L.K.; le Sun, J.; Zhang, J.Y. Self-toughness porous sodium titanate bioceramics prepared via in situ grown Na2Ti6O13 rods. Key Eng. Mater 2017, 727, 806–814. [Google Scholar] [CrossRef]
- Becker, I.; Hofmann, I.; Müller, F.A. Preparation of bioactive sodium titanate ceramics. J. Eur. Ceram. Soc. 2007, 27, 4547–4553. [Google Scholar] [CrossRef]
- Ogura, S.; Sato, K.; Inoue, Y. Effects of RuO2 dispersion on photocatalytic activity for water decomposition of BaTi4O9 with a pentagonal prism tunnel and K2Ti4O9 with zigzag layer structure. Phys. Chem. Chem. Phys. 2000, 2, 2449–2454. [Google Scholar] [CrossRef]
- Inoue, Y.; Kubokawa, T.; Sato, K. Photocatalytic activity of alkali-metal titanates combined with Ru in the decomposition of water. J. Phys. Chem. 1991, 95, 4059–4063. [Google Scholar] [CrossRef]
- Mancic, L.T.; Marinkovic, B.A.; Jardim, P.M.; Milosevic, O.B.; Rizzo, F. Precursor particle size as the key parameter for isothermal tuning of morphology from nanofibers to nanotubes in the Na2−xHxTinO2n+1 system through hydrothermal alkali treatment of rutile mineral sand. Cryst. Growth Des. 2009, 9, 2152–2158. [Google Scholar] [CrossRef]
- Zhang, X.Y.; Zhang, Y.J.; Gong, H.Y.; Song, Y.N. Preparation and characterization of sodium hexatitanate whiskers. Adv. Mater. Res. 2013, 602–604, 1339–1343. [Google Scholar] [CrossRef]
- Vithal, M.; Krishna, S.R.; Ravi, G.; Palla, S.; Velchuri, R.; Pola, S. Synthesis of Cu2+ and Ag+ doped Na2Ti3O7 by a facile ion-exchange method as visible-light driven photocatalysts. Ceram. Int. 2013, 39, 8429–8439. [Google Scholar] [CrossRef]
- Liu, J.; Ding, T.; Li, Z.; Zhao, J.; Li, S.; Liu, J. Photocatalytic hydrogen production over In2S3-Pt-Na2Ti3O7 nanotube films under visible light irradiation. Ceram. Int. 2013, 39, 8059–8063. [Google Scholar] [CrossRef]
- Araújo-Filho, A.A.; Silva, F.L.R.; Righi, A.; da Silva, M.B.; Silva, B.P.; Caetano, E.W.S.; Freire, V.N. Structural, electronic and optical properties of monoclinic Na2Ti3O7 from density functional theory calculations: A comparison with XDR and optical absorption measurements. J. Solid State Chem. 2017, 250, 68–74. [Google Scholar] [CrossRef]
- Murcia, J.J.; Navío, J.A.; Hidalgo, M.C. Insights towards the influence of Pt features on the photocatalytic activity improvement of TiO2 platinization. Appl. Catal. B Environ. 2012, 126, 76–85. [Google Scholar] [CrossRef]
- Prasad, M.S.; Chen, R.; Ni, H.; Kumar, K.K. Directly grown of 3D-nickel oxide nano flowers on TiO2 nanowire arrays by hydrothermal route for electrochemical determination of naringenin flavonoid in vegetable samples. Arab. J. Chem. 2018. [Google Scholar] [CrossRef]
- Akimoto, J. Synthesis and crystal structure of NaTi8O13. J. Solid State Chem. 1991, 90, 147–154. [Google Scholar] [CrossRef]
- Xu, H.; Li, C.; He, D.; Jinag, Y. Stability and structure changes of Na-titanate nanotubes at high temperature and high pressure. Powder Diffr. 2014, 29, 147–150. [Google Scholar] [CrossRef]
- Lai, S.-W.; Park, J.-W.; Yoo, S.-H.; Ha, J.-M.; Song, E.-H.; Cho, S.-O. Surface synergism of Pd/H2Ti3O7 composite nanowires for catalytic and photocatalytic hydrogen production from ammonia borane. Int. J. Hydrogen Energy 2016, 41, 3428–3435. [Google Scholar] [CrossRef]
- Xing, J.-H.; Xia, Z.-B.; Hu, J.-F.; Zhang, Y.-H.; Zhong, L. Growth and crystallization of titanium oxide films at different anodization modes. J. Elctrochem. Soc. 2013, 160, C239–C246. [Google Scholar] [CrossRef]
- Murai, S.; Fujita, K.; Kawase, S.; Ukon, S.; Tanaka, K. Formation of silver nanoparticles under anodic surface of tellurite glass via thermal poling-assisted ion implantation across solid-solid interface. J. Appl. Phys. 2007, 102, 073515. [Google Scholar] [CrossRef]
- Chia-Ching, W.; Cheng-Fu, Y. Investigation of the properties of nanostructured Li-doped NiO films using the modified spray pyrolysis method. Nanoscale Res. Lett. 2013, 8, 33. [Google Scholar] [CrossRef]
- Bharti, B.; Kumar, S.; Lee, H.-N.; Kumar, R. Formation of oxygen vacancies and Ti3+ state in TiO2 thin film and enhanced optical properties by air plasma treatment. Sci. Rep. 2016, 6, 32355–32367. [Google Scholar] [CrossRef]
- George, G.; Anandhan, S. Synthesis and characterization of nickel oxide nanofiber webs with alcohol sensing characteristics. RSC Adv. 2014, 4, 62009–62020. [Google Scholar] [CrossRef]
- Matin, M.A.; Lee, E.; Kim, H.; Yoon, W.-S.; Kwon, Y.-U. Rational syntheses of core-shell Fe@(PtRu) nanoparticle electrocatalysts for the methanol oxidation reaction with complete suppression of CO-poisoning and highly enhanced activity. J. Mater. Chem. A 2015, 3, 17154–17164. [Google Scholar] [CrossRef]
- Wenderich, K.; Mul, G. Methods, mechanism, and applications of the photodeposition in photocatalysis: A review. Chem. Rev. 2016, 116, 14587–14619. [Google Scholar] [CrossRef]
- Wang, W.; Yu, C.; Liu, Y.; Hou, J.; Zhu, H.; Jiao, S. Single crystalline Na2Ti3O7 rods as an anode material for sodium-ion batteries. RSC Adv. 2013, 3, 1041–1044. [Google Scholar] [CrossRef]
- Hall, D.S.; Lockwood, D.J.; Bock, C.; MacDougall, B.R. Nickel hydroxides and related materials: A review of their structures, synthesis and properties. Proc. Math. Phys. Eng. Sci. 2015, 471, 20140792. [Google Scholar] [CrossRef] [PubMed]
- Vorontsov, A.V.; Savinov, E.N.; Zhensheng, J. Influence of the form of photodeposited platinum on titania upon its photocatalytic activity in CO and acetone oxidation. J. Photochem. Photobiol. A Chem. 1999, 125, 113–117. [Google Scholar] [CrossRef]
- Li, F.B.; Li, X.Z. The enhancement of photodegradation efficiency using Pt-TiO2 catalyst. Chemosphere 2002, 48, 1103–1111. [Google Scholar] [CrossRef]
- Machida, M.; Ma, X.W.; Taniguchi, H.; Yabunaka, J.-I.; Kijima, T. Pillaring and photocatalytic properties of partially substituted layered titanates, Na2Ti3−xMxO7 and K2Ti4−xMxO9 (M = Mn, Fe, Co, Ni, Cu). J. Mol. Catal. A Chem. 2000, 155, 131–142. [Google Scholar] [CrossRef]
- Li, N.; Zhang, L.; Chen, Y.; Fang, M.; Zhang, J.; Wang, H. Highly efficient, irreversible and selective ion exchange property of layered titanate nanostructures. Adv. Funct. Mater. 2012, 22, 835–841. [Google Scholar] [CrossRef]
- Wenderich, K.; Han, K.; Mul, G. The effect of methanol on the photodeposition of Pt nanoparticles on tungsten oxide. Part. Part. Syst. Charact. 2018, 35, 1700250. [Google Scholar] [CrossRef]
- Xiong, L.-B.; Li, J.-L.; Yang, B.; Yu, Y. Ti3+ in the surface of titanium dioxide: Generation, properties and photocatalytic application. J. Nanomater. 2012, 2012, 831524. [Google Scholar] [CrossRef]
- Townsend, T.K.; Browning, D.; Osterloh, F.E. Overall photocatalytic water splitting with NiOx-SrTiO3—A revised mechanism. Energy Environ. Sci. 2012, 5, 9543–9550. [Google Scholar] [CrossRef]
- Du, Q.; Lu, G. Controllable synthesis and photocatalytic properties study of Na2Ti3O7 and H2Ti3O7 nanotubes with high exposed facet (0 1 0). J. Nanosci. Nanotechnol. 2015, 15, 4385–4391. [Google Scholar] [CrossRef]
- Liu, J.; Ma, X.; Yang, L.; Liu, X.; Han, A.; Lv, H.; Zhang, C.; Xu, S. In situ green oxidation synthesis of Ti3+ and N self-doped SrTiOxNy nanoparticles with enhanced photocatalytic activity under visible light. RSC Adv. 2018, 8, 7142–7158. [Google Scholar] [CrossRef]
- Parayil, S.K.; Kibombo, H.S.; Wu, C.-M.; Peng, R.; Kindle, T.; Mishra, S.; Ahrenkiel, S.P.; Baltrusaitis, J.; Dimitrijevic, N.M.; Rajh, T.; et al. Synthesis-dependent oxidation state of platinum on TiO2 and their influences on the solar simulated photocatalytic hydrogen production from water. J. Phys. Chem. C 2013, 33, 16850–16862. [Google Scholar] [CrossRef]
- Wang, Y.; Wang, Y.; Xu, R. Photochemical deposition of Pt on CdS for H2 evolution from water: Markedly enhanced activity by controlling Pt reduction environment. J. Phys. Chem. C 2013, 117, 783–790. [Google Scholar] [CrossRef]
- Majrik, K.; Pászti, Z.; Korecz, L.; Trif, L.; Domján, A.; Bonura, G.; Cannilla, C.; Frusteri, F.; Tompos, A.; Tálas, E. Study of PtOx/TiO2 photocatalysts in the photocatalytic reforming of glycerol: The role of co-catalyst formation. Materials 2018, 11, 1927. [Google Scholar] [CrossRef]
- Murcia-López, S.; Vaiano, V.; Hidalgo, M.C.; Navío, J.A.; Sannino, D. Photocatalytic reduction of CO2 over platinized Bi2WO6-based materials. Photochem. Photobiol. Sci. 2015, 14, 678–685. [Google Scholar] [CrossRef]


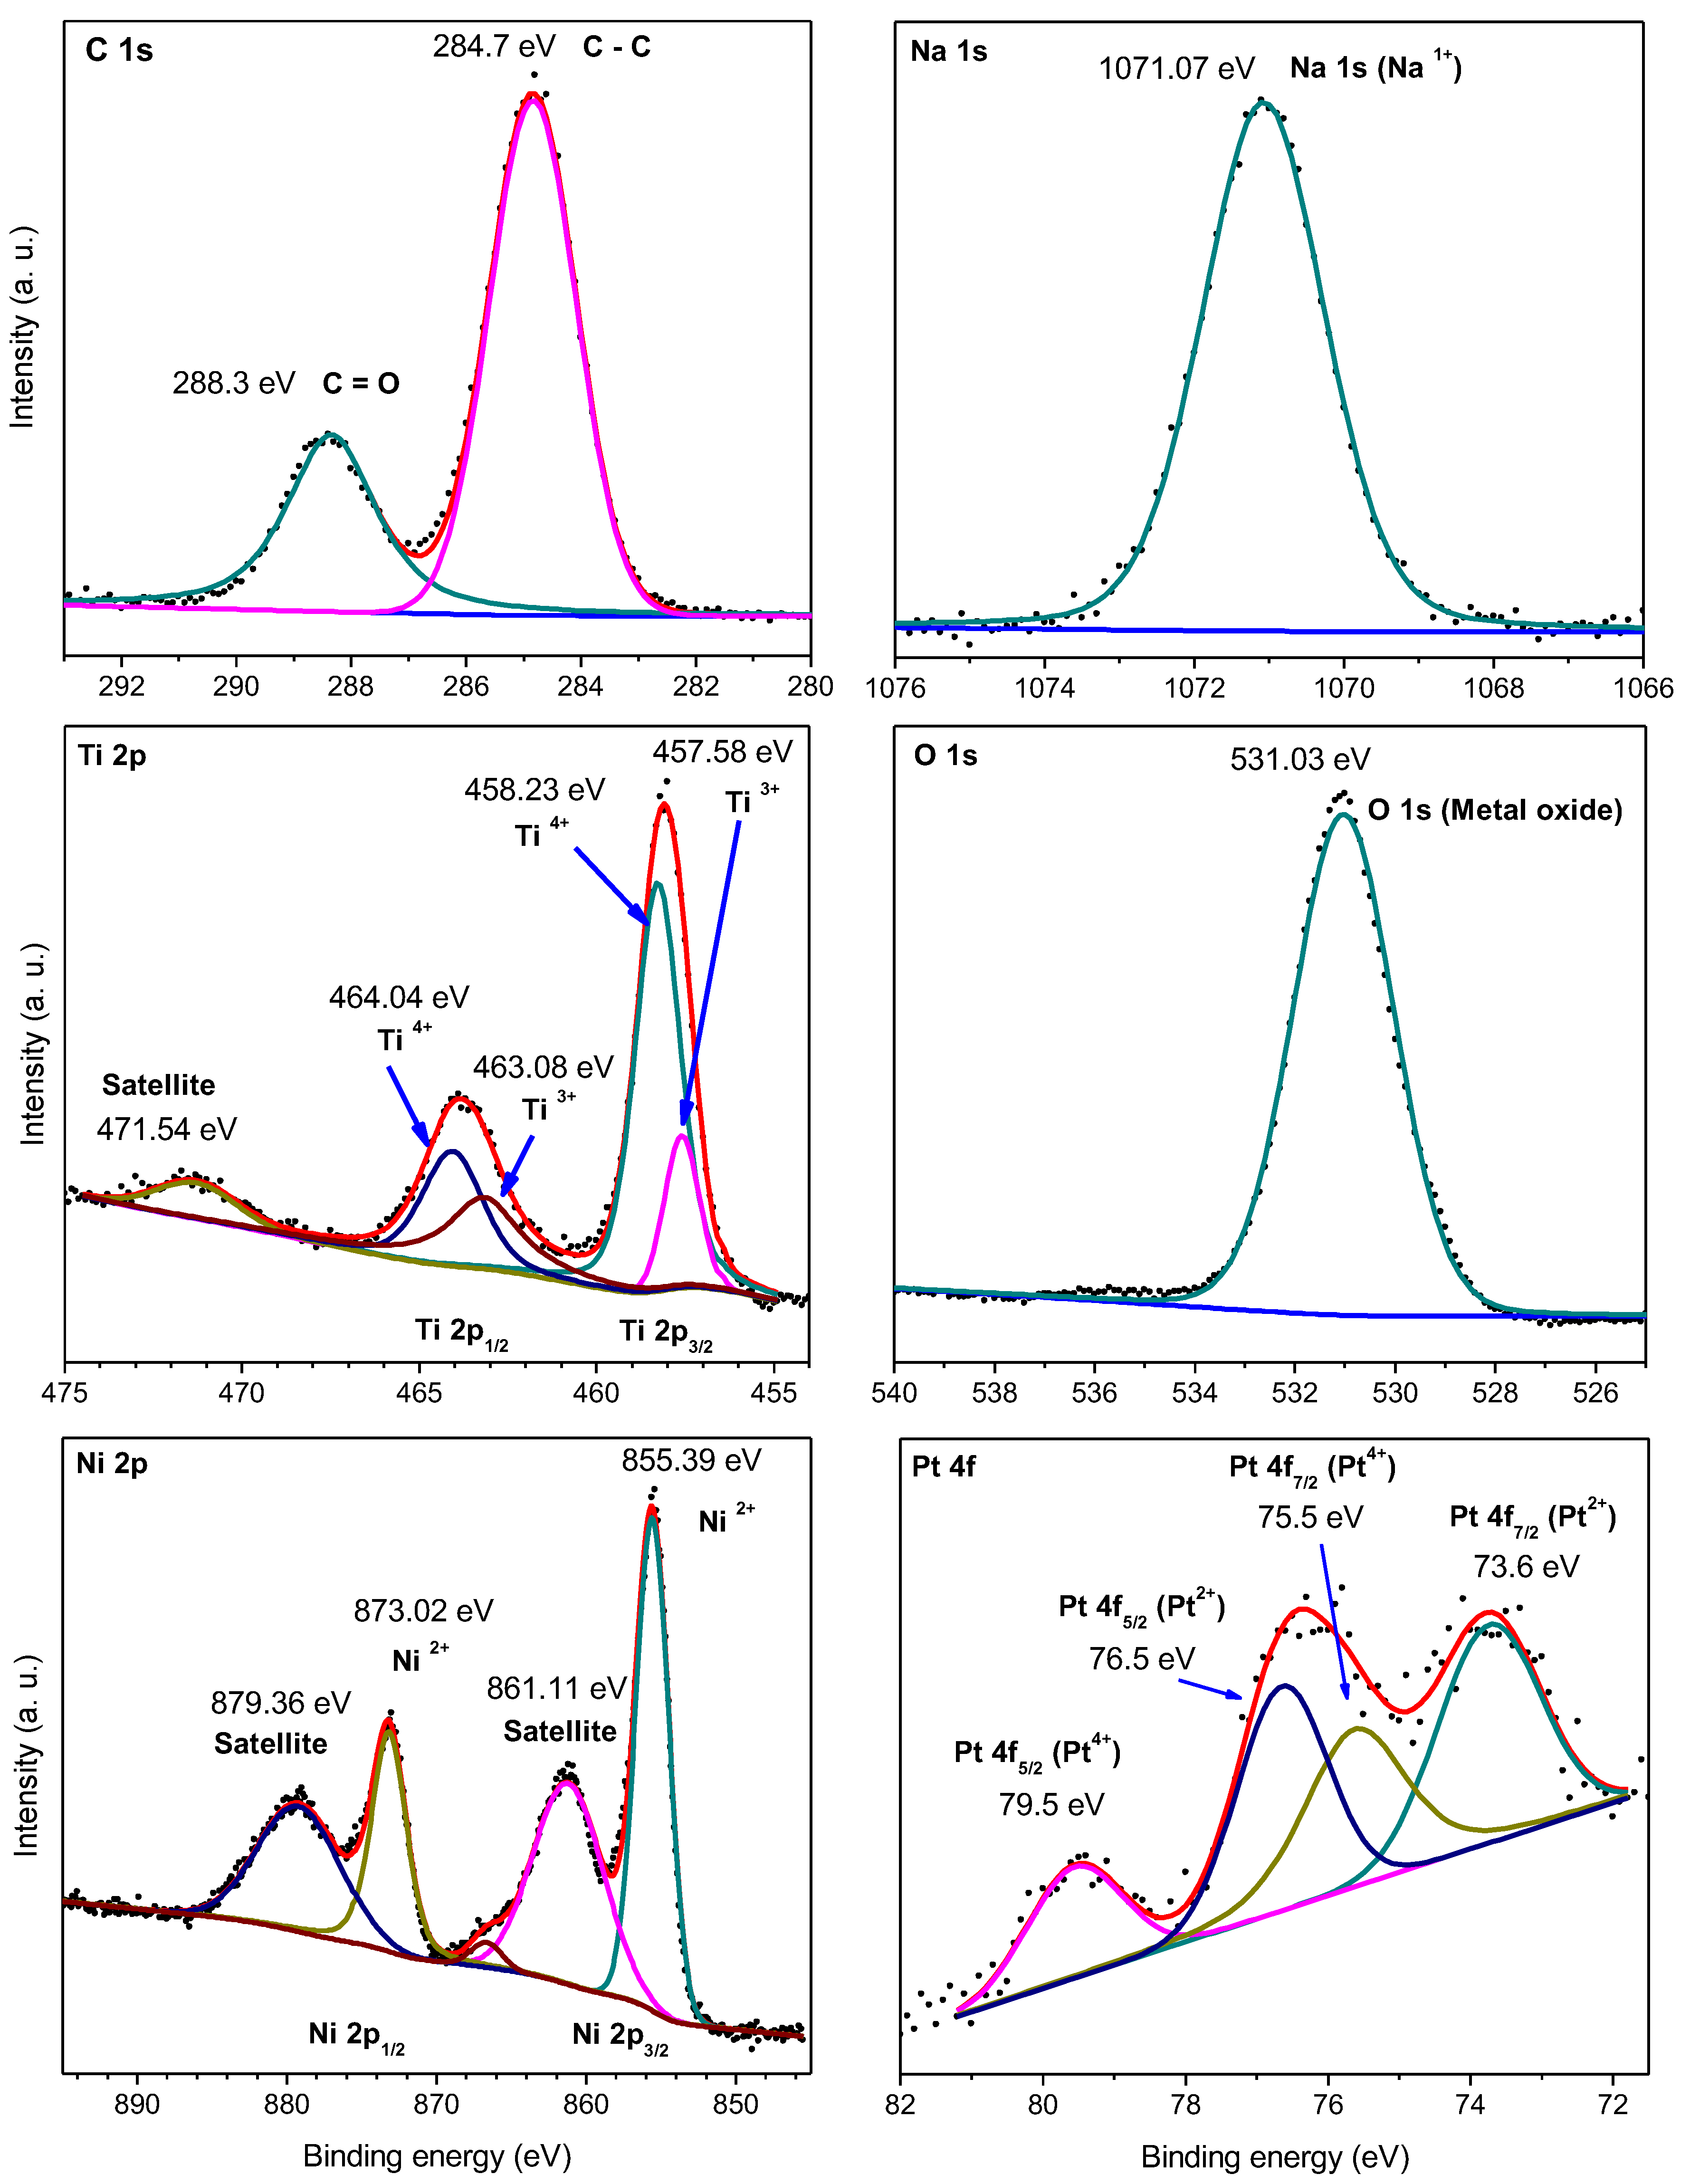
| Sample | Ti4+/Na | Ti3+/Ti4+ | Pt2+/Pt4+ |
|---|---|---|---|
| NTO/Ni/Pt | 0.78 | 0.36 | 0.32 |
| NTO/Pt/Ni | 0.28 | 0.46 | 1.45 |
| Material | Atomic (%) Quantification | Weight (%) Quantification | ||||
|---|---|---|---|---|---|---|
| Na | Pt | Ni | Na | Pt | Ni | |
| NTO | 8.5 | -- | -- | 9.2 | -- | -- |
| NTO/Ni | 8.4 | -- | 0.7 | 8.9 | -- | 1.2 |
| NTO/Pt | 8.1 | 0.1 | -- | 8.4 | 0.8 | -- |
| NT/Ni/Pt | 7.4 | 0.2 | 0.5 | 7.9 | 1.0 | 1.1 |
| NT/Pt/Ni | 3.4 | 0.1 | 0.9 | 4.8 | 0.7 | 1.0 |
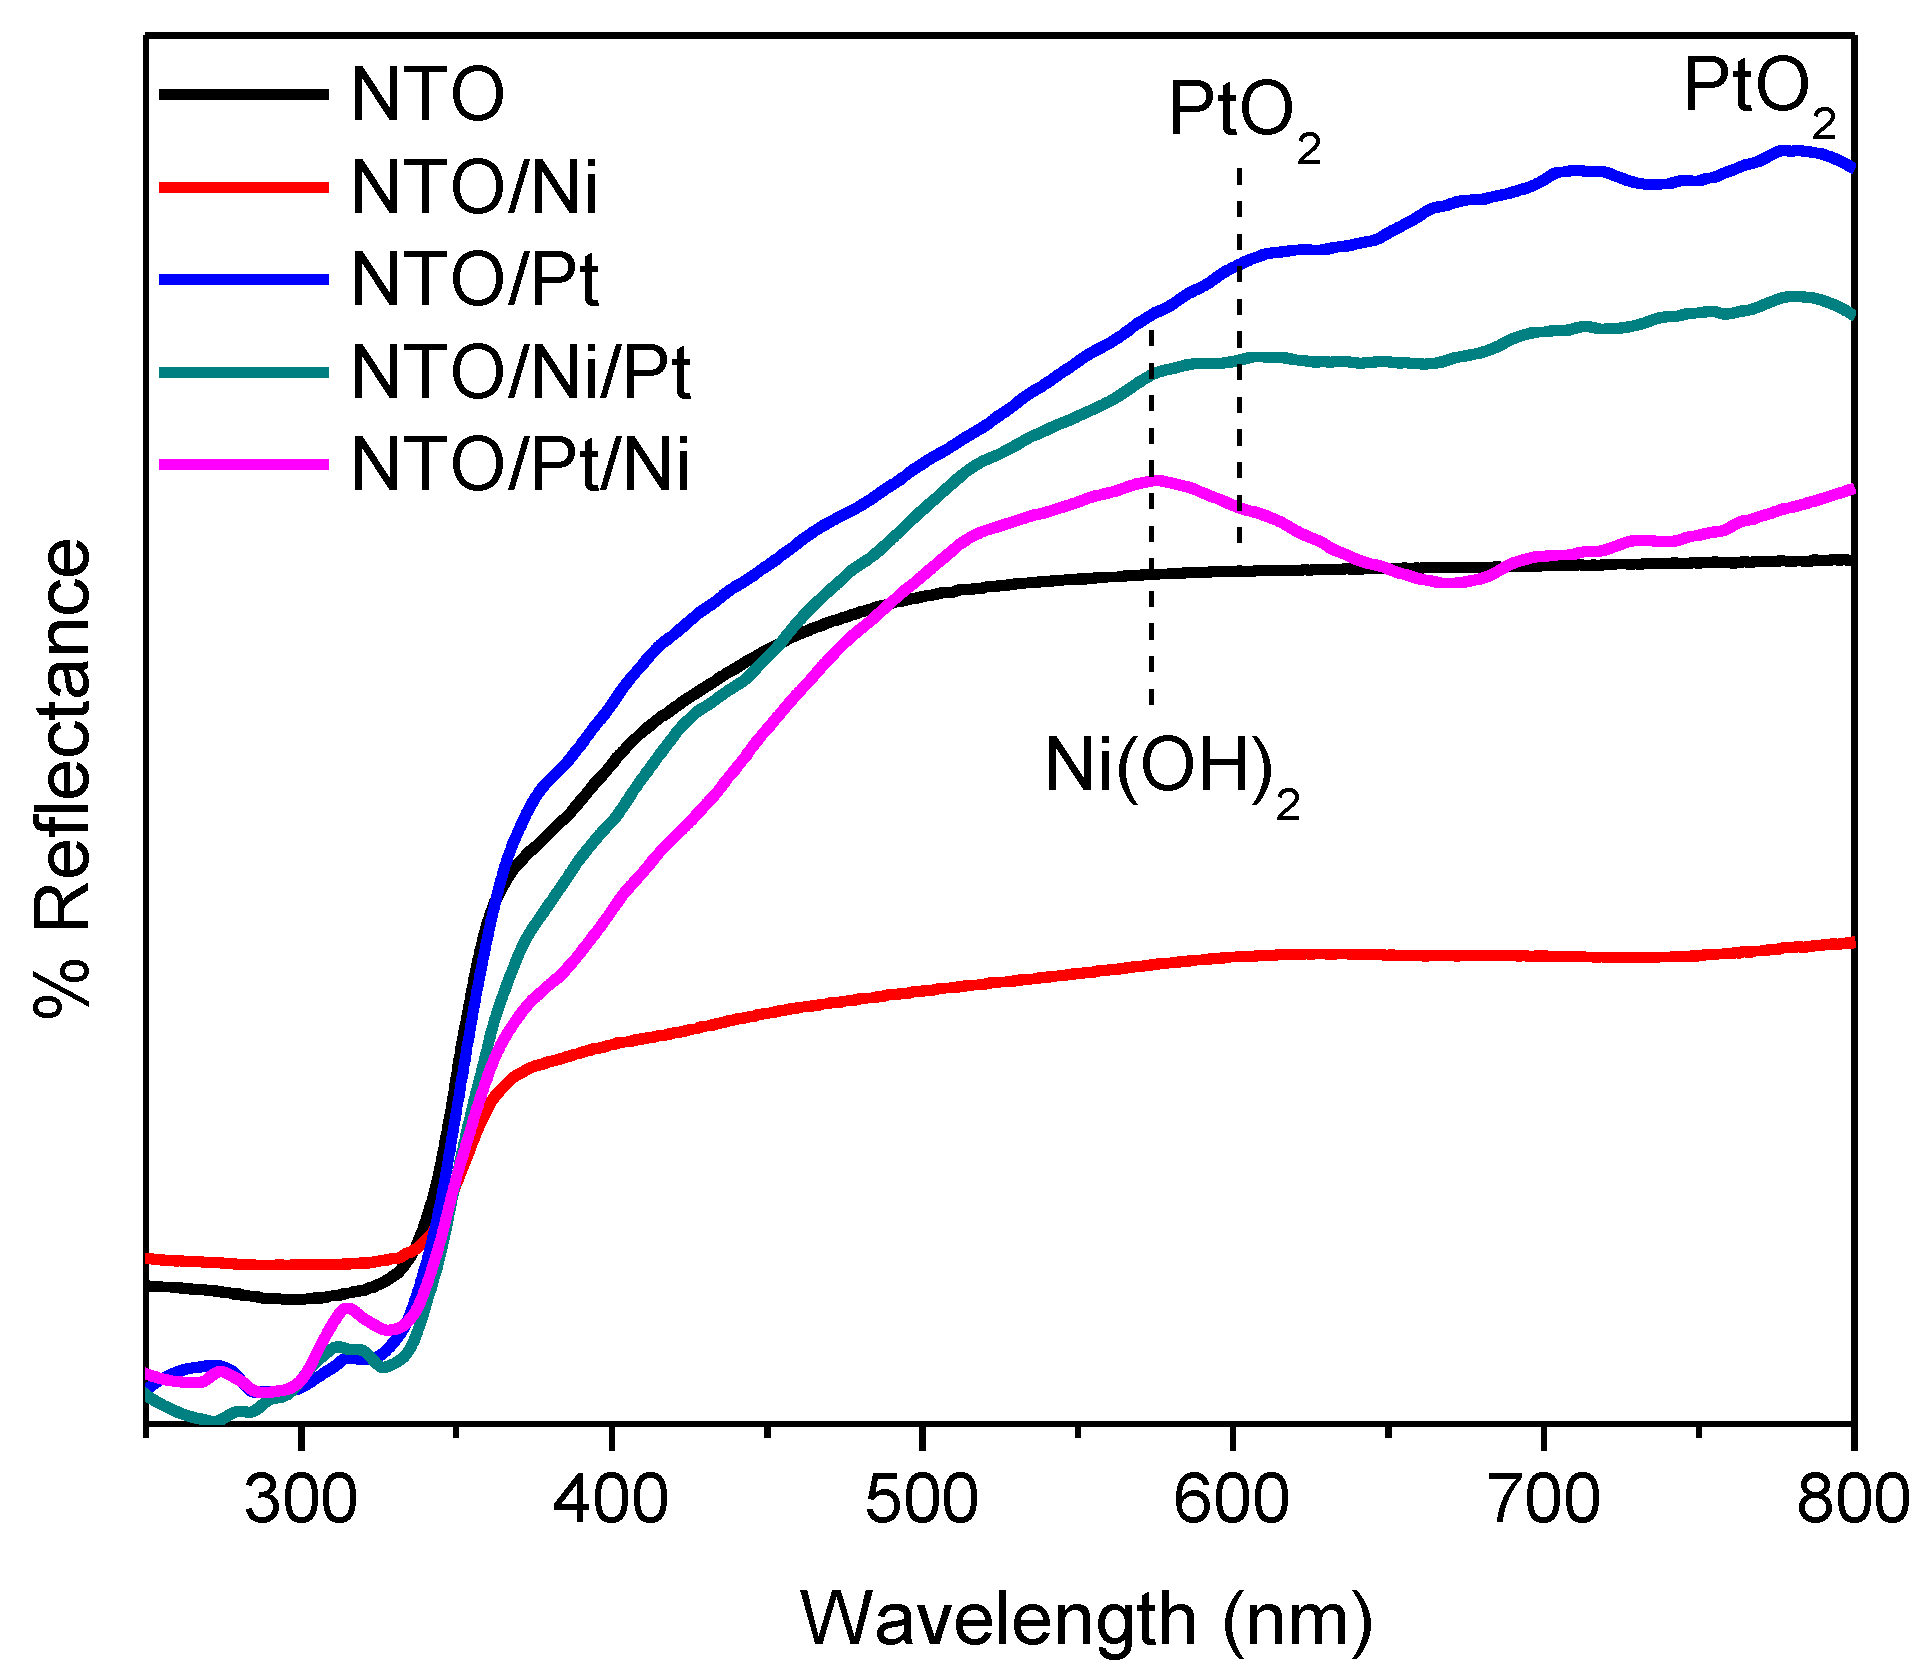
| Surface Area (m2/g) | Pore Volume (cm3/g) | Bandgap (eV) |
|---|---|---|
| 2 | 0.002 | 3.40 |
| 3 | 0.003 | 3.25 |
| 4 | 0.004 | 3.43 |
| 7 | 0.009 | 3.45 |
| 28 | 0.029 | 3.36 |
© 2019 by the authors. Licensee MDPI, Basel, Switzerland. This article is an open access article distributed under the terms and conditions of the Creative Commons Attribution (CC BY) license (http://creativecommons.org/licenses/by/4.0/).
Share and Cite
Garay-Rodríguez, L.F.; Murcia-López, S.; Andreu, T.; Moctezuma, E.; Torres-Martínez, L.M.; Morante, J.R. Photocatalytic Hydrogen Evolution Using Bi-Metallic (Ni/Pt) Na2Ti3O7 Whiskers: Effect of the Deposition Order. Catalysts 2019, 9, 285. https://doi.org/10.3390/catal9030285
Garay-Rodríguez LF, Murcia-López S, Andreu T, Moctezuma E, Torres-Martínez LM, Morante JR. Photocatalytic Hydrogen Evolution Using Bi-Metallic (Ni/Pt) Na2Ti3O7 Whiskers: Effect of the Deposition Order. Catalysts. 2019; 9(3):285. https://doi.org/10.3390/catal9030285
Chicago/Turabian StyleGaray-Rodríguez, Luis F., S. Murcia-López, T. Andreu, Edgar Moctezuma, Leticia M. Torres-Martínez, and J. R. Morante. 2019. "Photocatalytic Hydrogen Evolution Using Bi-Metallic (Ni/Pt) Na2Ti3O7 Whiskers: Effect of the Deposition Order" Catalysts 9, no. 3: 285. https://doi.org/10.3390/catal9030285
APA StyleGaray-Rodríguez, L. F., Murcia-López, S., Andreu, T., Moctezuma, E., Torres-Martínez, L. M., & Morante, J. R. (2019). Photocatalytic Hydrogen Evolution Using Bi-Metallic (Ni/Pt) Na2Ti3O7 Whiskers: Effect of the Deposition Order. Catalysts, 9(3), 285. https://doi.org/10.3390/catal9030285