Article

Kinetic Study of the Selective Hydrogenation of Acetylene over Supported Palladium under Tail-End Conditions

1
IRCELYON CNRS, UMR 5256, Univ Lyon, Université Claude Bernard Lyon 1, 2 avenue Albert Einstein, 69626 Villeurbanne Cedex, France
2
IFP Energies nouvelles, Etablissement de Lyon, Rond-point de l’échangeur de Solaize, BP3, 69360 Solaize, France
*
Author to whom correspondence should be addressed.
Catalysts 2019, 9(2), 180; https://doi.org/10.3390/catal9020180
Submission received: 9 January 2019 / Revised: 30 January 2019 / Accepted: 31 January 2019 / Published: 14 February 2019

Abstract

:
The kinetics of the selective hydrogenation of acetylene in the presence of an excess of ethylene has been studied over a 0.05 wt. % Pd/α-Al2O3 catalyst. The experimental reaction conditions were chosen to operate under intrinsic kinetic conditions, free from heat and mass transfer limitations. The data could be described adequately by a Langmuir–Hinshelwood rate-equation based on a series of sequential hydrogen additions according to the Horiuti–Polanyi mechanism. The mechanism involves a single active site on which both the conversion of acetylene and ethylene take place.

1. Introduction

Ethylene is the largest of the basic chemical building blocks with a global market estimated at more than 140 million tons per year with an increasing growth rate. It is used mainly as precursor for polymers production, for instance polyethylene, vinyl chloride, ethylbenzene, or even ethylene oxide synthesis. New ways of production of ethylene are emerging, such as ethanol dehydration, but steam cracking of naphtha and gas remains the major producer of alkenes. The C2 fraction at the outlet of a steam cracker contains mainly ethane and ethylene, but also traces of acetylene. These trace amounts need to be removed as acetylene is known to poison the Ziegler–Natta catalyst that is used for the polymerization of ethylene. This important issue is done by selective hydrogenation of acetylene, important process in petrochemical industry. Thus, the initial acetylene content, approximately 0.8–1.6%, needs to be reduced to less than 5 ppmv for chemical grade and less than 1 ppmv for polymer grade ethylene. Depending on plant design, selective hydrogenation is carried in two different ways: front-end and tail-end [1]. In the tail-end configuration, which corresponds to 70% of all units worldwide, the process is placed after CH4 and H2 separation. The hydrogen is added in an amount slightly higher than the acetylene concentration and the majority of the stream is ethylene [1,2]. In front-end configuration, the selective hydrogenation unit is placed upstream of the demethanizer and a larger amount of hydrogen is available (around 20%).
Alumina-supported palladium or bimetallic palladium-silver catalysts are used for this process, assuring very high activity and selectivity for acetylene hydrogenation. The main goal is to reduce the acetylene content without the hydrogenation of ethylene to ethane. Catalyst deactivation by coke formation is very common under tail-end conditions as is the formation of C4 byproducts.
The kinetics of this reaction have been the subject of several studies [3,4,5,6,7,8,9] and have been analyzed in detail by Borodziński and Bond [8]. The most elaborate models consist of 2 or 3 distinct sites, each catalyzing a specific reaction [8]. In the case of multiple active sites, a small and a large size site are considered. Small sites favour the adsorption and selective hydrogenation of acetylene to ethylene, whereas the adsorption of ethylene seems to be only possible on the large sites. Pachulski et al. [9], in a systematic study of acetylene hydrogenation over Pd-Ag/Al2O3, evaluated 77 different rate equations and found that the best rate equation was based on two different sites.
However, few studies discriminate between different models and in some cases, the need for a more elaborate mechanism might be due to additional factors such as the addition of carbon monoxide or the use of a catalyst promotor. For example, Bos et al. [6] discarded a single-site Langmuir–Hinshelwood mechanism because of its inability to predict the observed change of the ethane selectivity when carbon monoxide was added to the feed. An alternative explanation can be that addition of carbon monoxide actually creates an additional site by either an electronic or geometric effect.
In this study, we derived rate equations based on a sequence of elementary steps. Several rate equations were obtained depending on the assumption of the rate-determining step. A regression analysis was then performed to select the most appropriate mechanism based on our experimental data and to estimate the rate parameters.

2. Results

An analysis of the repeatability of the experiments has been performed. Several operating conditions have been tested at both temperatures:
-
Operating conditions 1: y C 2 H 2 = 1.0 % ;   y H 2 = 4.3 % ;   y C 2 H 4 = 70 %   a n d   y A r = 24.7 %
-
Operating conditions 2, 51 °C: y C 2 H 2 = 0.6 % ;   y H 2 = 4.3 % ;   y C 2 H 4 = 70 %   a n d   y A r = 25.1 %
-
Operating conditions 2, 62 °C: y C 2 H 2 = 0.8 % ;   y H 2 = 4.3 % ;   y C 2 H 4 = 70 %   a n d   y A r = 24.9 %
Each operating condition was tested three times per catalyst loading. Two catalyst loadings were used. All this data was used to calculate the relative standard deviations of both the acetylene conversion and the ethane exit molar flow rate. The relative standard deviations are given in Table 1. Rather large (10–20%) relative standard deviations were found for the molar exit flows of ethane.
The variation of the relative flows of acetylene, ethylene, hydrogen, and argon allowed determination of the apparent reaction orders with respect to acetylene, ethylene, and hydrogen. Apparent reaction orders are based on power law expressions for the rates as follows:
r C 2 H 2 = k 1 P C 2 H 2 α 1 P H 2 β 1 P C 2 H 4 γ 1
r C 2 H 6 = k 2 P C 2 H 2 α 2 P H 2 β 2 P C 2 H 4 γ 2
As no C4 products were experimentally observed, the kinetic analysis is restricted to the hydrogenation of acetylene to ethylene and ethylene to ethane. Both rate equations were integrated numerically and the reaction orders were determined by regression analysis of the acetylene conversion and the molar exit flow rate of ethane of the data set at each temperature separately. The estimated values of the reaction orders are given in Table 2.
A negative reaction order for acetylene was observed, −0.9 with respect to acetylene consumption, and (−1)–(−1.5) with respect to ethane formation. This correspond to a strong adsorption of acetylene on the surface of the catalyst. This order is lower than the values reported in the literature for acetylene consumption, which are between 0–(−0.7) [7,10,11,12,13,14] depending on the conditions.
The order for hydrogen, approximately 1.5, is high and hard to explain mechanistically. However, the same range of magnitude was found by Aduriz and al.: 1.3–1.6 [10], but under front-end conditions. Most studies report an order of +1 [6,11,12]. Molero et al. observed a reaction order of hydrogen between 1–1.25, depending on the temperature for acetylene hydrogenation over a Pd foil [7]. From a careful analysis of the data, they derived that the hydrogen reaction order can vary between values of 1 and 1.5. Excess hydrogen can remove strongly adsorbed carbonaceous species from the catalyst surface and so creates free surface sites.
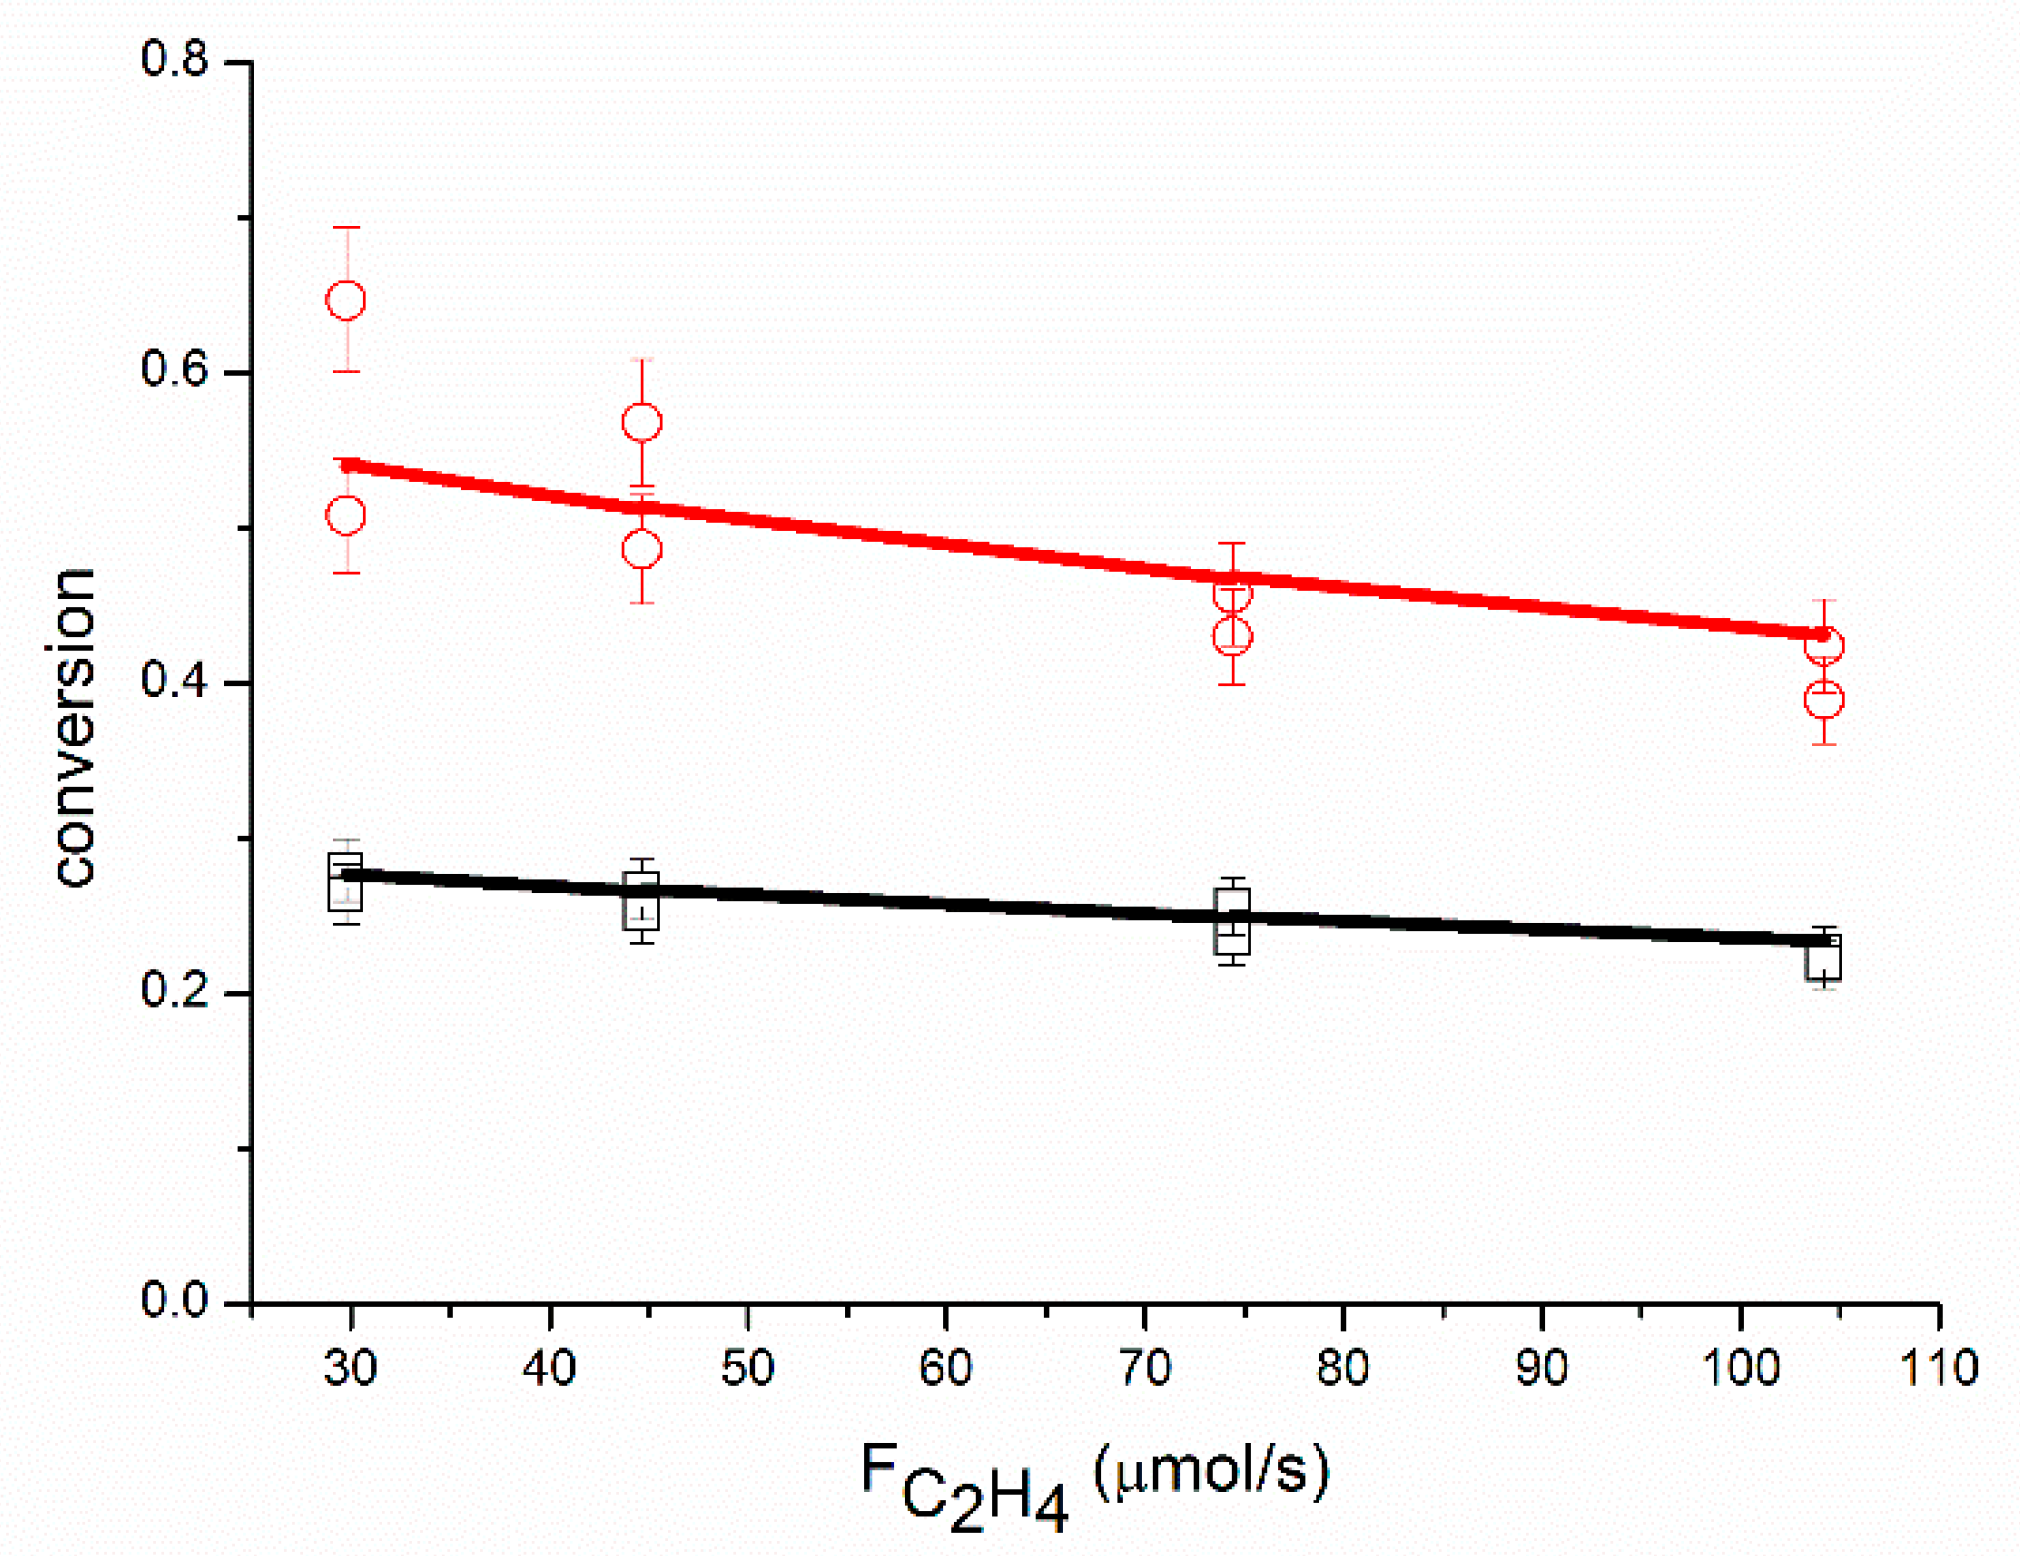
Regarding the rate of consumption of acetylene, no strong effect is observed for ethylene. The order is close to zero as shown by numerous studies [12]. However, some ethylene adsorption occurs as indicated by the small negative value of the reaction order. For ethane formation, the reaction order in ethylene is much higher, between 0.3 and 1. This is related to the fact that ethylene is the reactant for ethane production.
Inspection of the reaction orders give valuable insights into the reaction mechanism. However, this needs to be further validated by deriving the corresponding rate equation based on a sequence of elementary steps. Catalytic hydrogenation reactions of unsaturated hydrocarbons often follow a series of sequential hydrogen additions according to the Horiuti–Polanyi mechanism [13,15]. This mechanism is given for acetylene hydrogenation via ethylene to ethane in Table 3. A single site for all surface species has been assumed. This assumption will be discussed later on.
Hydrogen adsorbs dissociatively on palladium, requiring two free neighboring surface sites (step (1)). The adsorbed hydrogen atom can react with adsorbed acetylene to form a vinyl intermediate in step (2). This intermediate can react with a second hydrogen atom to form adsorbed ethylene. Neurock and van Santen studied ethylene adsorption on a Pd(111) surface by DFT and found that ethylene adsorbs at low coverages as a di-σ species and at high coverage as a π-bonded species [16]. Ethylene can desorb or react with atomic hydrogen to form an ethyl intermediate. This intermediate can react again with a second hydrogen atom to form ethane, which has little interaction with the Pd surface and therefore desorbs instantaneously (step (7)).
Even though the reaction mechanism is still rather simple, the derivation of the corresponding rate-equation requires several assumptions. We assume that the adsorption take place according to the Langmuir isotherm [17]. The next assumption is with respect to the rate-determining step for the formation of ethylene and ethane. Since for both steps the reaction order in hydrogen was found to be larger than 1, the additions of the second hydrogen atom to the vinyl and ethyl intermediates are assumed to be rate-determining (steps (4) and (7), respectively). All other steps are assumed to be in quasi-equilibrium. To reduce the number of parameters in the rate equation only the most abundant reaction intermediates are kept in the site balance. The full site balance is given as:
θ * + θ H + θ C 2 H 2 + θ C 2 H 3 + θ C 2 H 4 + θ C 2 H 5 = 1
Here, we assume that the coverages of vinyl and ethyl intermediates are much smaller than those of adsorbed acetylene and ethylene and thus can be left out of the site balance. A combined DFT Monte-Carlo study for acetylene hydrogenation over Pd(111) at a hydrogen to acetylene ratio of 1, showed that this is indeed the case [13]. This same study indicates that the hydrogen coverage is not negligible and that it is larger than the ethylene coverage. Here, we take into account the ethylene coverage, because a negative reaction order in ethylene was observed. The last model assumption states that the rate-determining steps, (4) and (7), are irreversible (or one-way) under the given reaction conditions.
The rates for the two rate-determining steps can be written as:
r 4 = k 4 θ C 2 H 3 θ H = k 4 K 1 K 2 K 3 P C 2 H 2 P H 2 θ * 2
r 7 = k 7 θ C 2 H 5 θ H = k 7 K 1 K 5 K 6 P C 2 H 2 P H 2 θ * 2
and the site balance is given by:
1 = θ * + θ H + θ C 2 H 2 + θ C 2 H 4
or:
θ * = 1 ( 1 + K 2 P C 2 H 2 + P C 2 H 4 K 5 + K 1 P H 2 )
By introducing the number of palladium surface atoms per catalyst mass, NS (mol Pds/kgcat), and attributing all temperature effects to the change of the rate constant in the rate-determining steps, thus assuming that the adsorption equilibrium constants do not change between 51 and 62 °C, the following rate equations are obtained for the consumption of acetylene and the production of ethane, respectively:
r C 2 H 2 = N S k 4 0 exp ( E 4 R T ) K 1 K 2 P C 2 H 2 P H 2 ( 1 + K 1 P H 2 + K 2 P C 2 H 2 + P C 2 H 4 K 5 ) 2
r C 2 H 6 = N S k 7 0 exp ( E 7 R T ) ( K 1 K 5 ) P C 2 H 4 P H 2 ( 1 + K 1 P H 2 + K 2 P C 2 H 2 + P C 2 H 4 K 5 ) 2
Notice that k4 and k7 in the above equation are actually a combination of k4*K3 and k7*K6, respectively. Table 4 gives the correspondence between the reaction orders of the rate equations and the surface coverages as well as the range of reaction orders that are covered by the model.
The reaction order with respect to acetylene is smaller for the ethane production than for the acetylene consumption, whereas the reaction order with respect to ethylene is larger for the ethane production than for the acetylene consumption, in agreement with the experimental results. Taking the experimental reaction orders from Table 3, the mean coverage averaged over all tested reaction conditions of acetylene, hydrogen and ethylene can be estimated as ƟC2H2 = 0.65–0.95, ƟH2 ≈ 0 and ƟC2H4 = 0.06–0.15.
In order to estimate the 7 parameters in the two rate equations, a multi-response regression analysis of the two data sets at 51 and 62 °C was carried out simultaneously. Initial results showed that all parameters were strongly correlated and no accurate estimates could be determined. Therefore, the hydrogen equilibrium constant was set at a fixed value, calculated from literature data. The following expression is used to calculate the adsorption equilibrium constant:
K i = σ s A S 2 π M w R T 1 10 13 e ( E d R T ) ( P a 1 )
where σs is the sticking coefficient, AS the surface area of Pd (1.26 104 m2/mol), Mw the molecular weight (kg/mol) and Ed the desorption activation energy (J/mol). A typical value for the pre-exponential factor for desorption of 1013 s−1 was assumed. Assuming a sticking coefficient for hydrogen adsorption of 0.16 (0.1–0.2 [18] and 0.17 [19]) and a desorption energy of 69 kJ/mol [20], a value of 611 Pa−1 was estimated for K1. Fixing the adsorption equilibrium constant for hydrogen forces the model to account for the hydrogen coverage, else due to the hydrogen reaction order ≥1 the hydrogen coverage would be close to zero. Further regression analysis still showed an unacceptable correlation between the parameters. To get an accurate estimate of the adsorption equilibrium constant for acetylene the adsorption equilibrium constant for ethylene had to be set at a fixed value. Although it is not evident from the two rate equations, the correlation between these two equilibrium constants (K2 and K5) can be revealed by expressing the ethane selectivity as:
S C 2 H 6 = r C 2 H 6 r C 2 H 2 + r C 2 H 6 r C 2 H 6 r C 2 H 2 = k 7 k 4 P C 2 H 4 P C 2 H 2 1 K 2 K 5
Apparently, the rate constants k7 and k4 can be decoupled by fitting the conversion and ethane production but not the term K2*K5. However, the absolute values of k7 and k4 will depend on the values of K2 and K5.
As stated above, ethylene is adsorbed at low coverages as a di-σ species or at high coverage as a π-bonded species with adsorption enthalpies of −60 and −30 kJ/mol, respectively [16]. A TPD study gave a value of the adsorption enthalpy of −59 kJ/mol [21]. This value was used to estimate the equilibrium constant for ethylene at a value of 0.14 Pa−1. Table 5 reports the values of the parameter estimates with their 95% confidence intervals from the regression analysis of all data. The parameters can be accurately estimated with 95% confidence intervals at the 10% level for those related the acetylene conversion and 20% for the ethane production, similar as the relative standard deviations on the repeated runs (Table 1). No strong parameter correlation was observed; the highest value of 0.85 was between k04 and E4. The value of the equilibrium adsorption constant for acetylene is approximately 3 orders of magnitude higher than that of ethylene. This corresponds to an enthalpy of adsorption for acetylene of (−80)–(−90) kJ/mol. Vattuone et al. [22] measured differential heat of adsorptions of acetylene over a single crystal of Pd(100) by calorimetry from 110–40 kJ/mol, decreasing with increasing acetylene coverage.
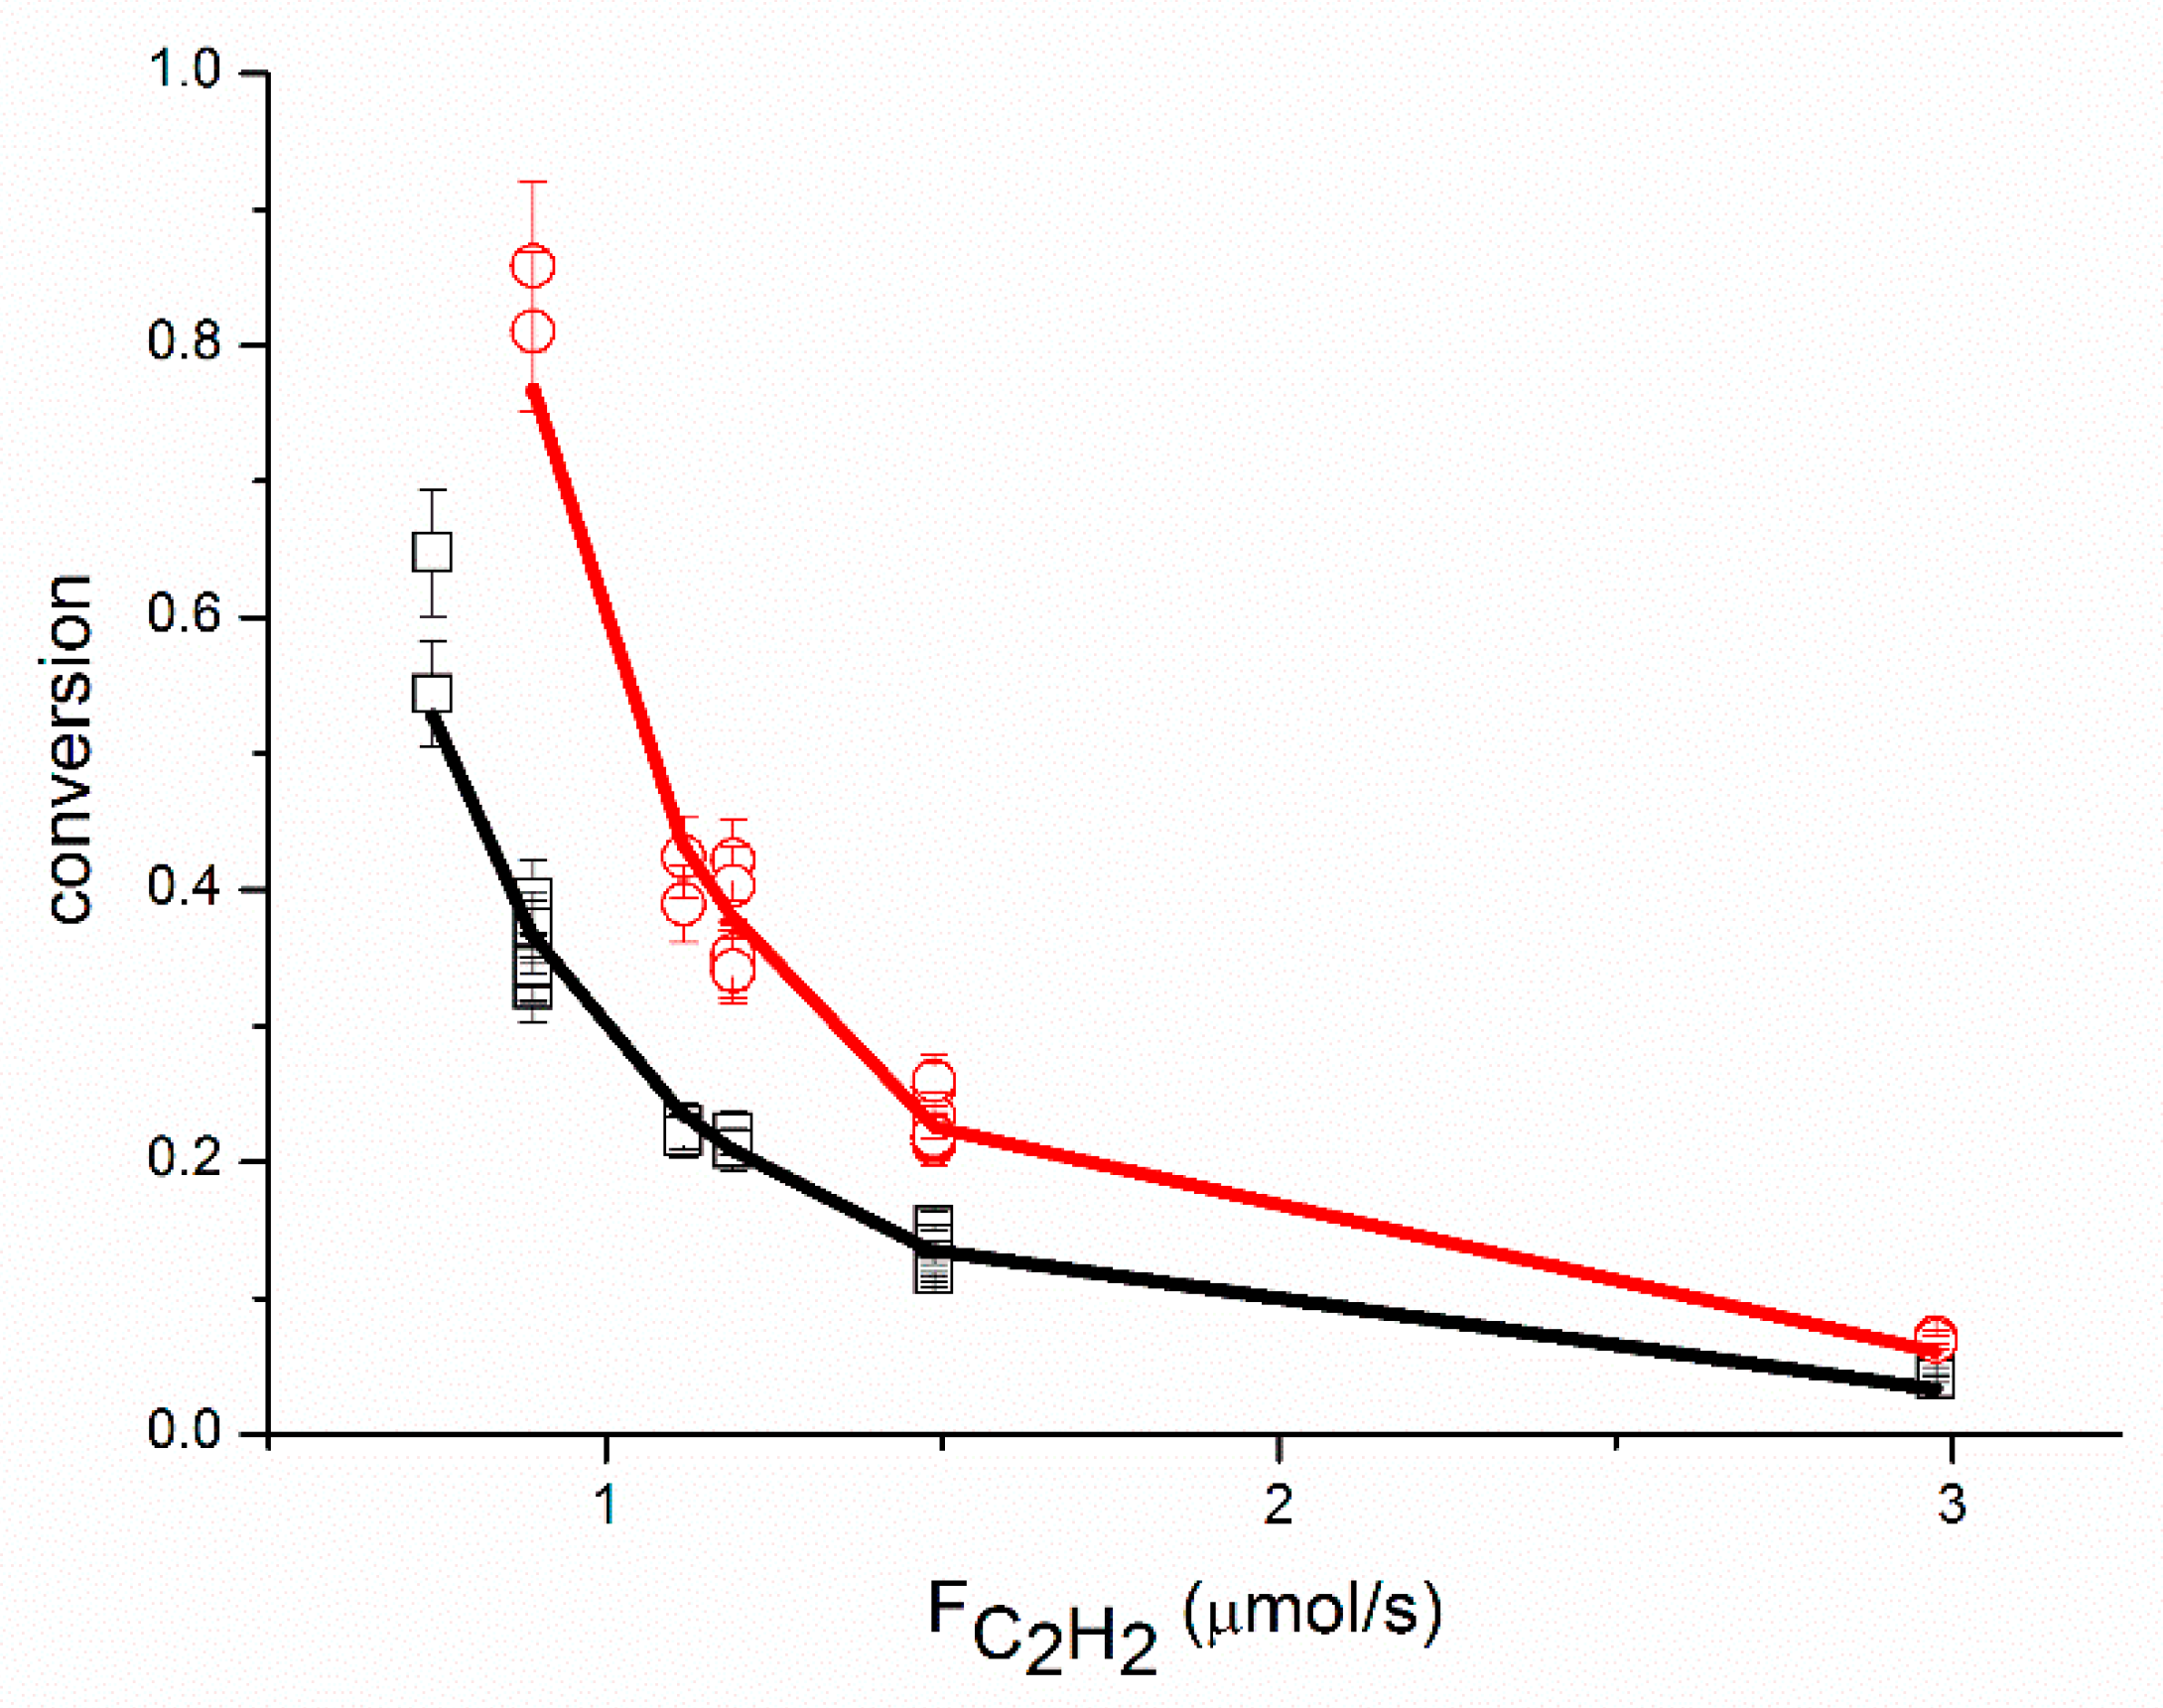
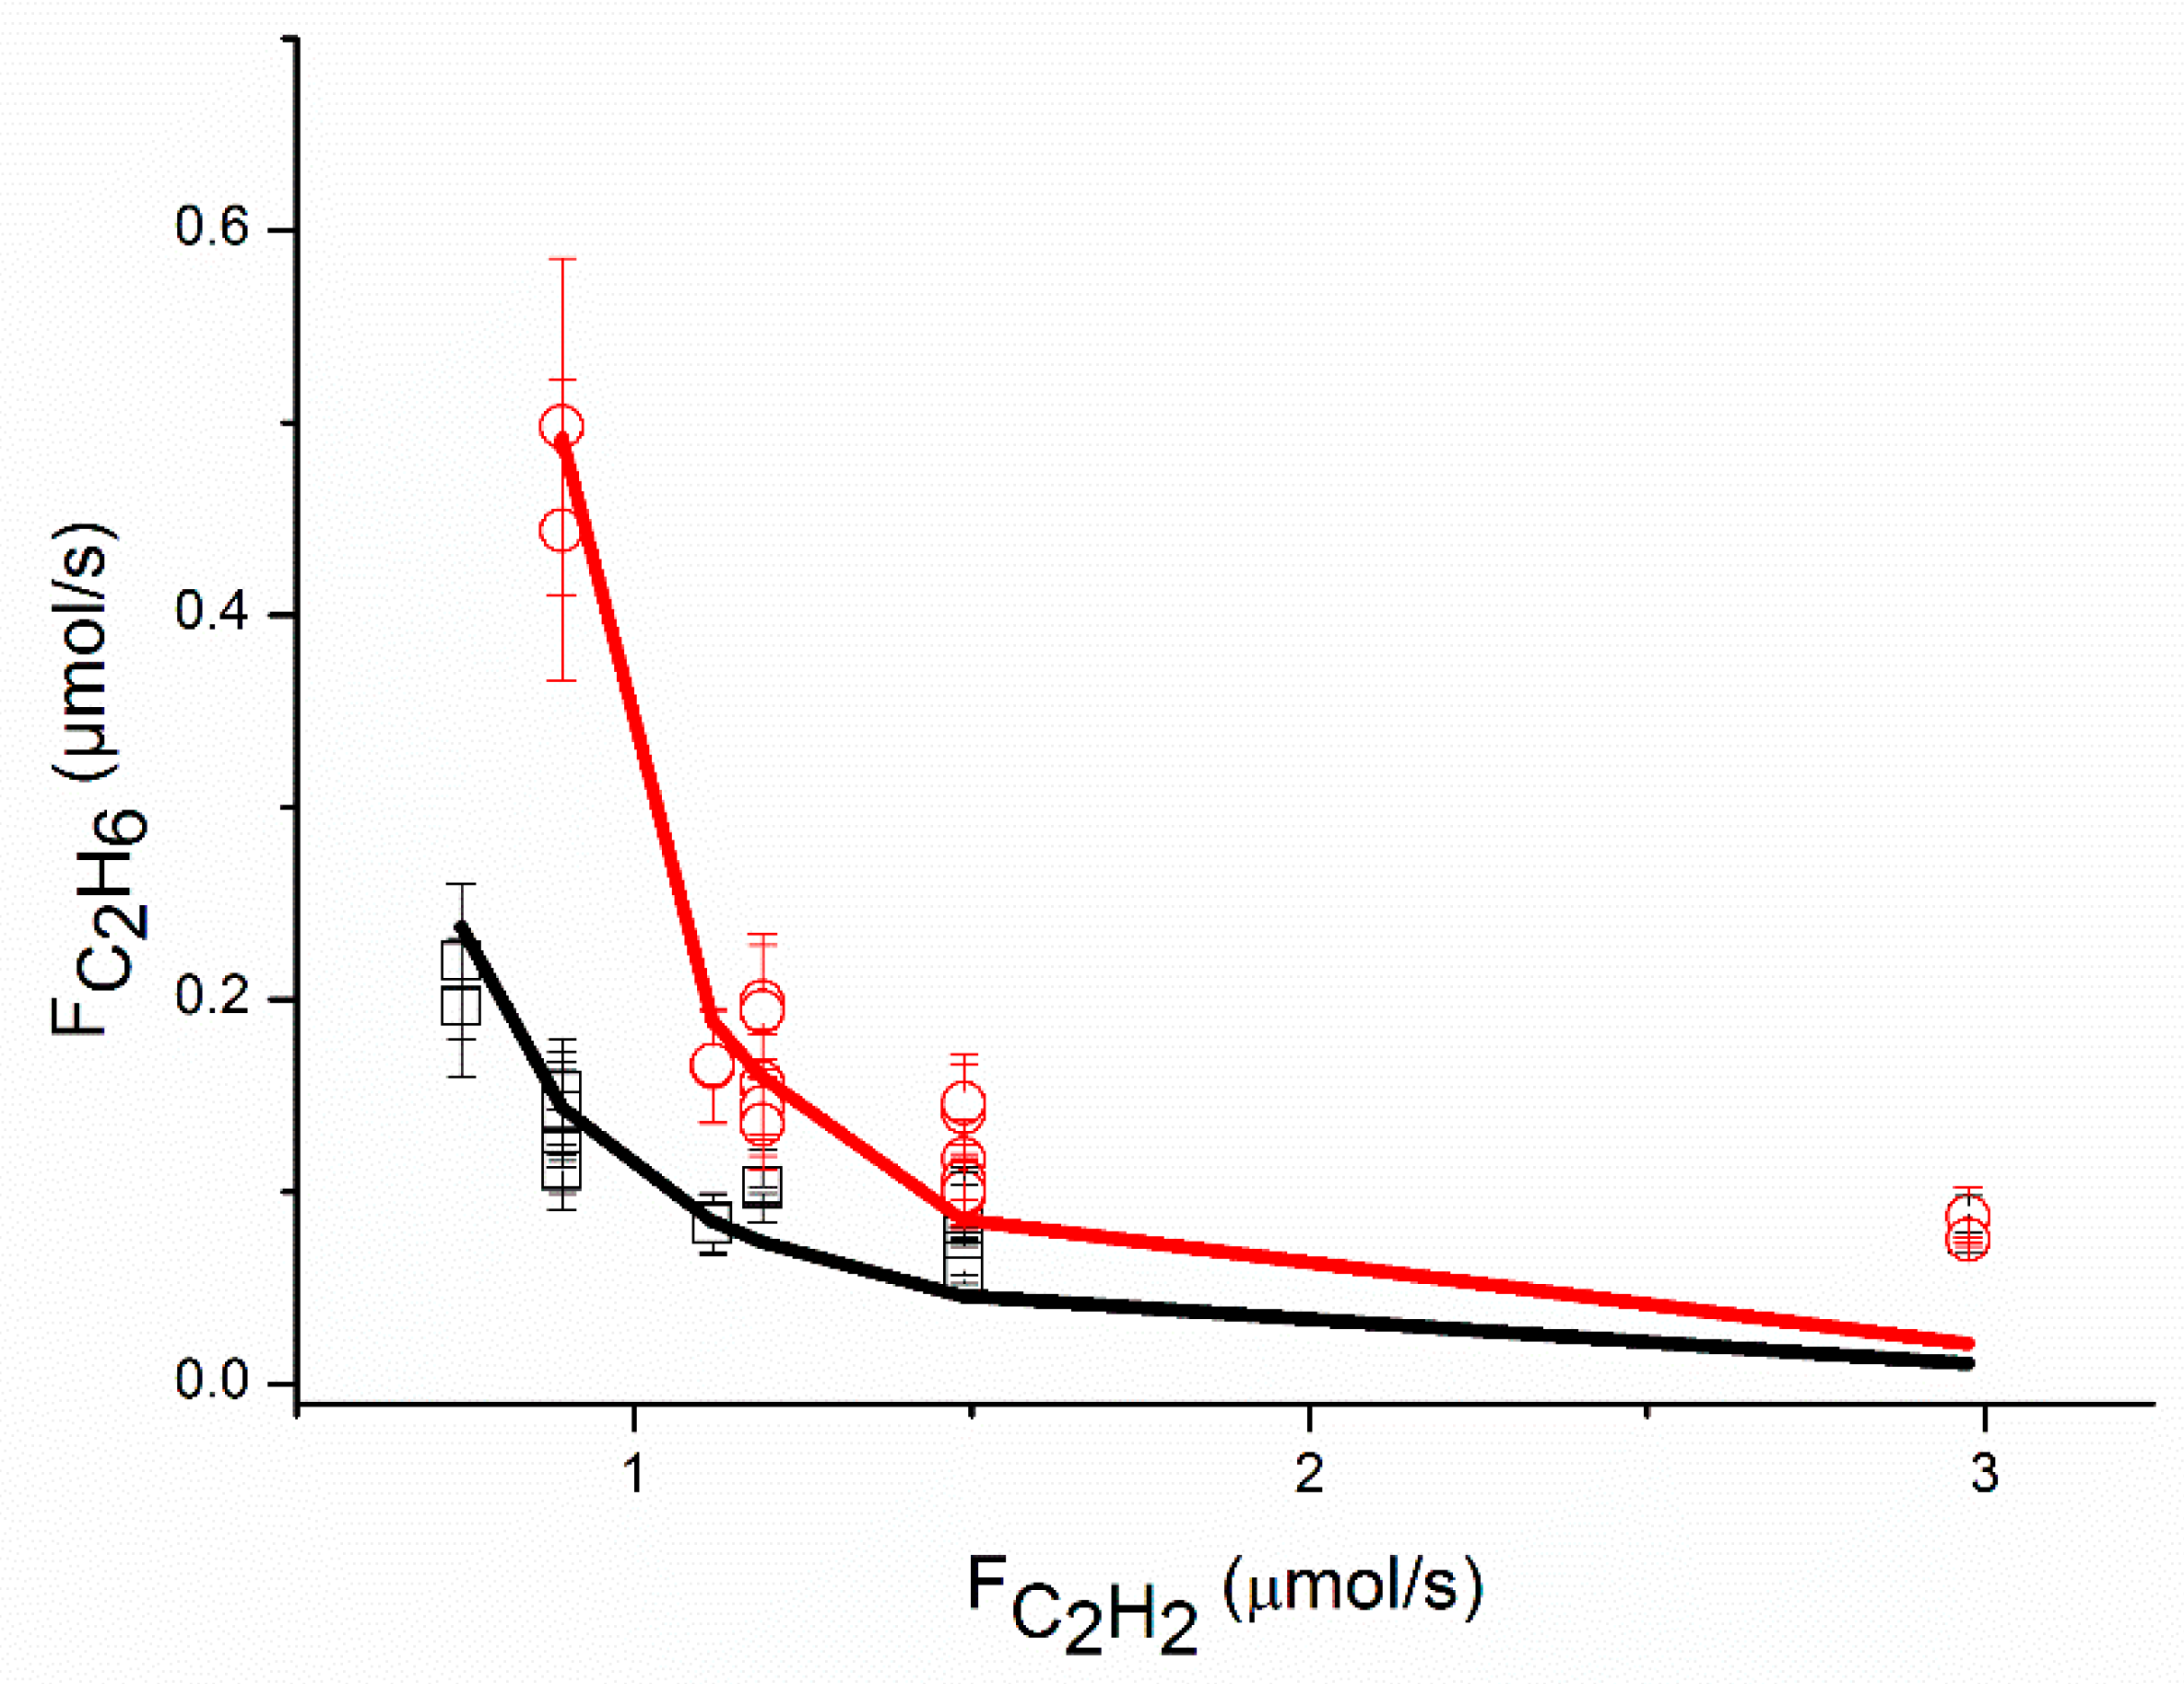
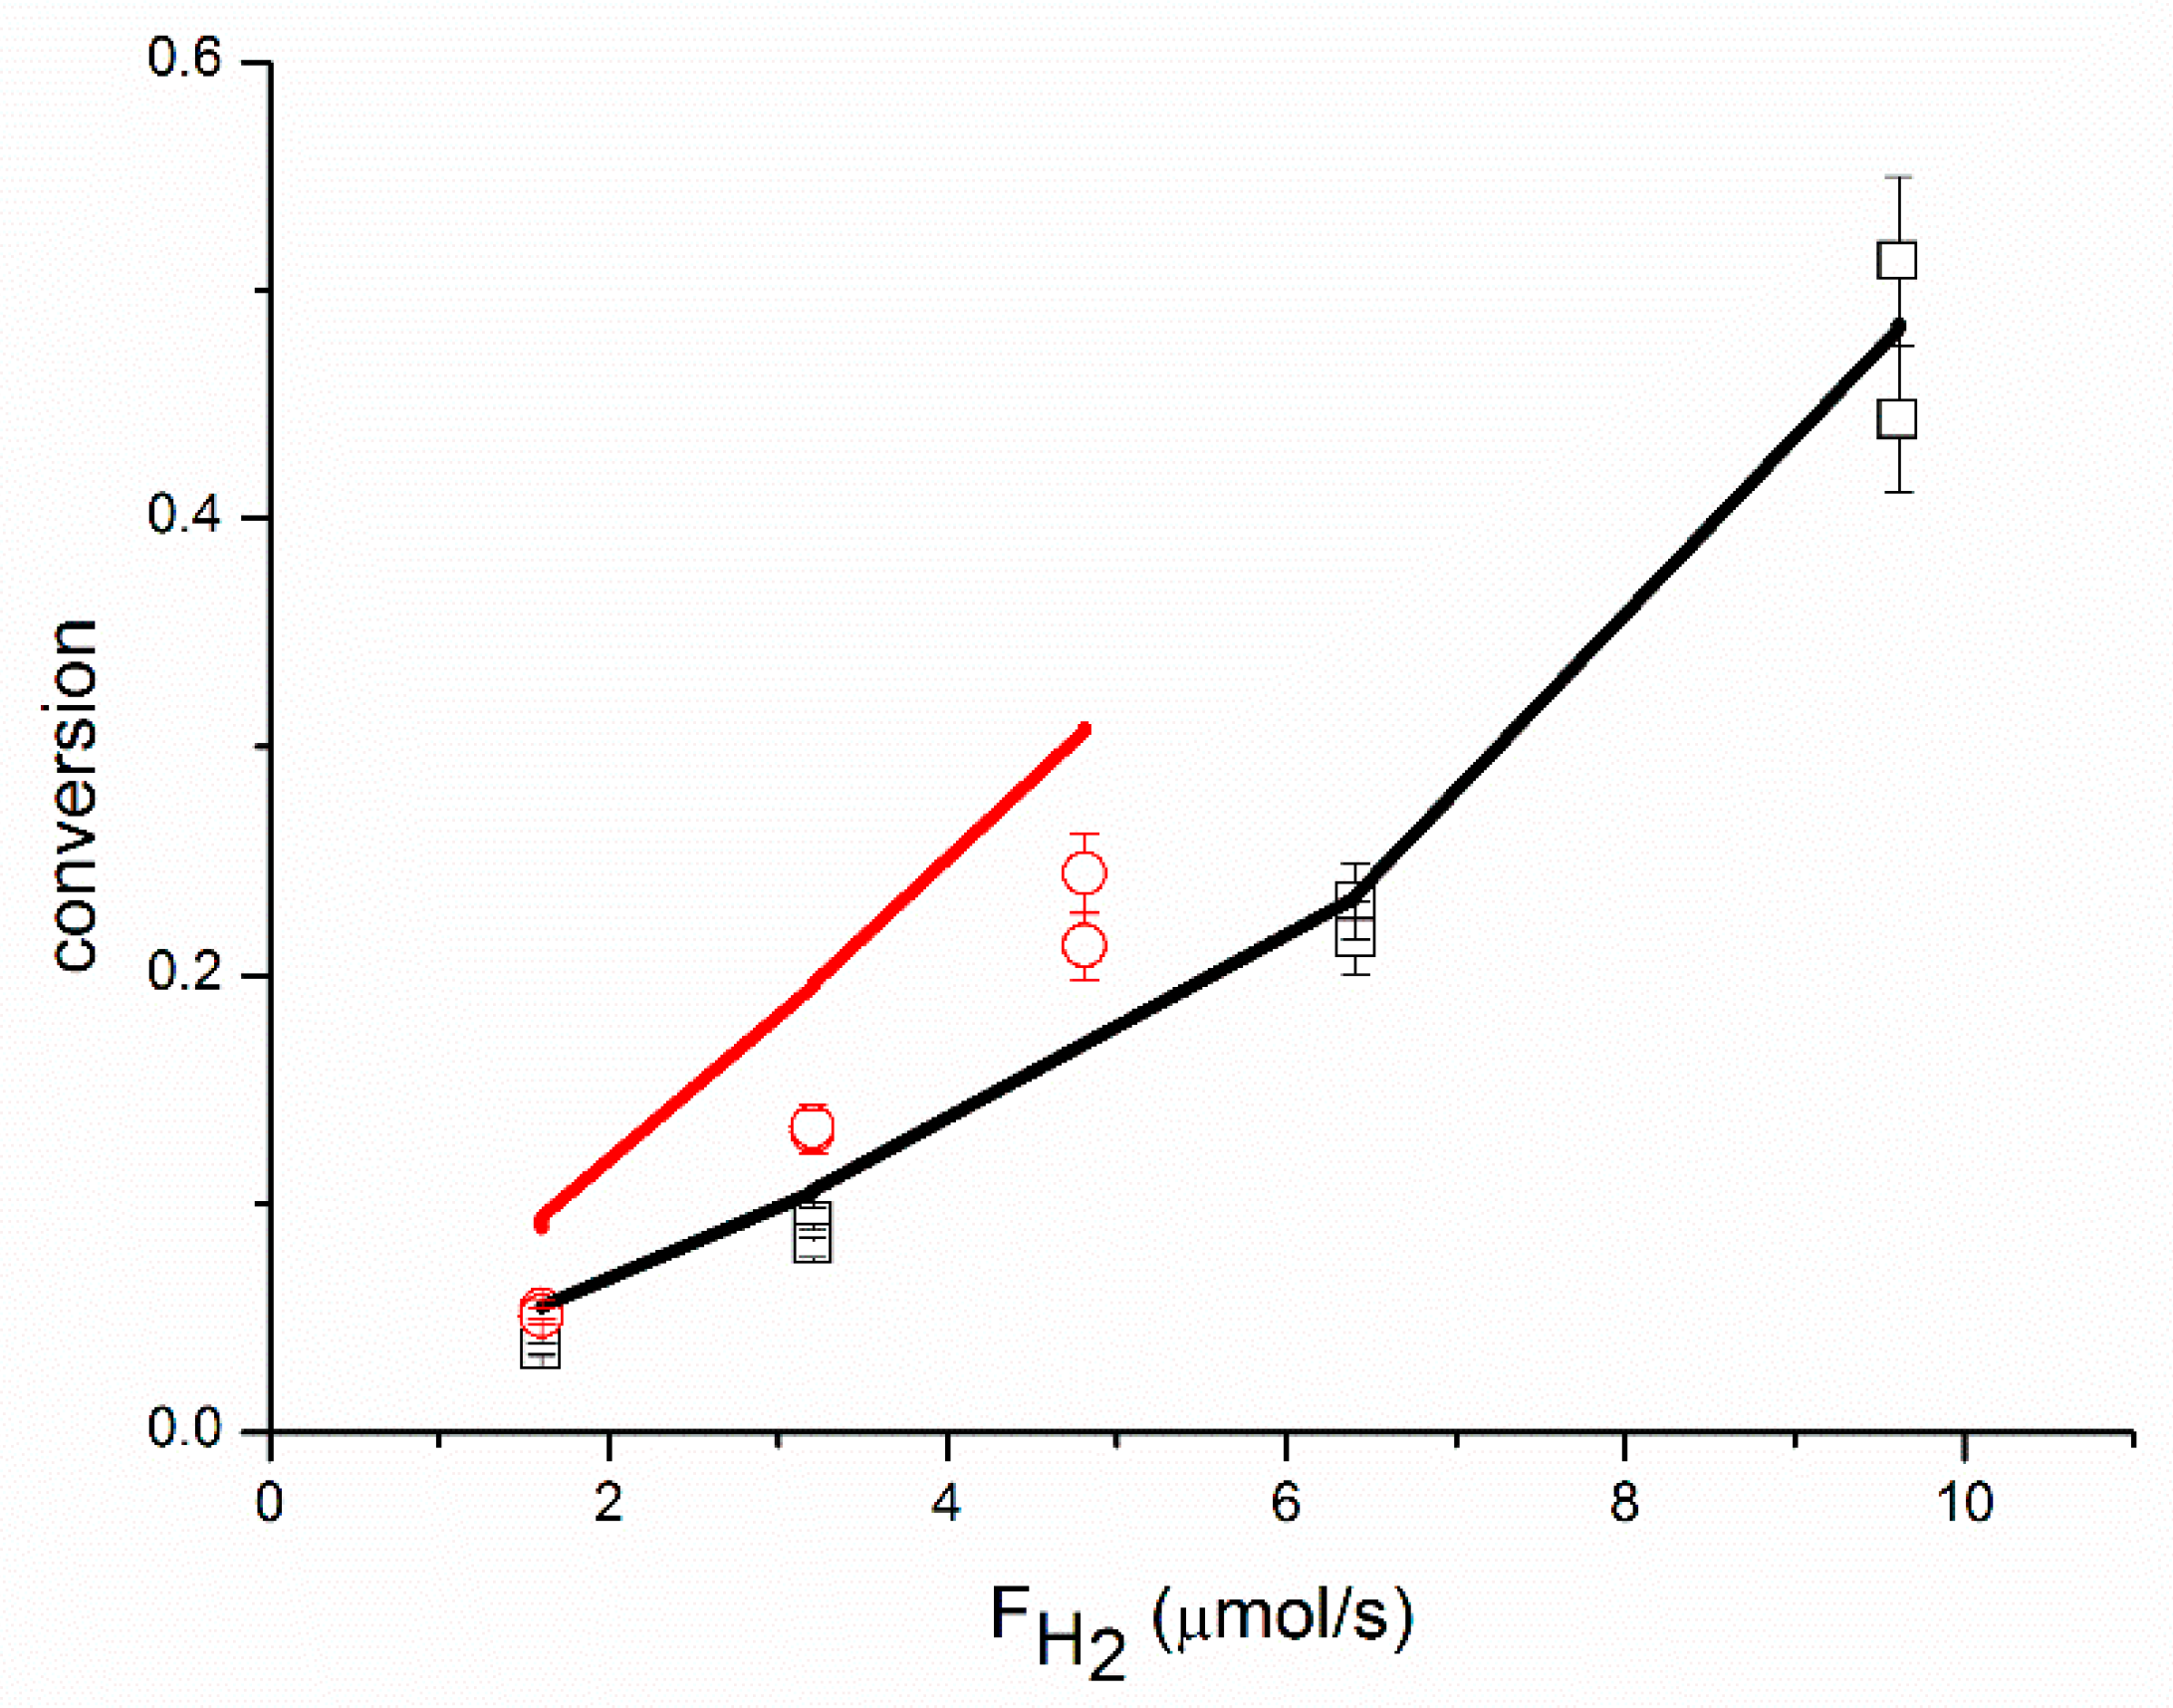
An adequate fit of the data was obtained, as shown in Figure 1, Figure 2, Figure 3, Figure 4, Figure 5 and Figure 6, organized per inlet flow of acetylene, ethane and hydrogen for both the acetylene conversion and ethane production. Although the model corresponds to a hydrogen reaction order of approximately 1, both the acetylene conversion and ethane production are well fitted by the model, especially at 51 °C. The power law model gave a significantly larger value for the hydrogen reaction order (~1.45 at 51 °C, Table 2). The cause of this discrepancy between the two models is not clear. The surface coverages as calculated by the model are in the range of ƟC2H2 = 0.62–0.95, ƟH2 = 0.002–0.01 and ƟC2H4 = 0.04–0.36.
This is in good agreement with the surface coverages as calculated from the reaction orders. The apparent activation energy for the conversion of acetylene compares well with the value of 40 kJ/mol reported in the literature for acetylene hydrogenation over a Pd foil [7].
The proposed reaction mechanism based on a single site can adequately represent the experimental data, as shown in Figure 1, Figure 2, Figure 3, Figure 4, Figure 5 and Figure 6. Neurock and coll. [13] could describe independent experimental data correctly by the same reaction mechanism as the one proposed in this study using also a single site. Bos et al. [6] could describe their experimental data by very similar rate equations as used here, in the absence of carbon monoxide. However, the addition of carbon monoxide to the feed resulted in a change of the ethane selectivity, which cannot be explained by the above model. As mentioned in the introduction, it could well be that the second site is related to the presence of carbon monoxide on the surface, which is known to have a strong electronic effect and can cause surface reconstruction.
Numerous other studies [2,3,4,8,9] and notably the model proposed by Borodziński and Cybulski [4] are based on two distinct active sites. We therefore performed a regression analysis of the model proposed by Borodziński and Cybulski to our data set (we used the equations given in the Appendix A of their article, which differ from the text) [4]. The regression analysis showed that the parameters associated with the second site were not statistically significant and the model was reduced to a single site model. The arguments of Borodziński and Cybulski [
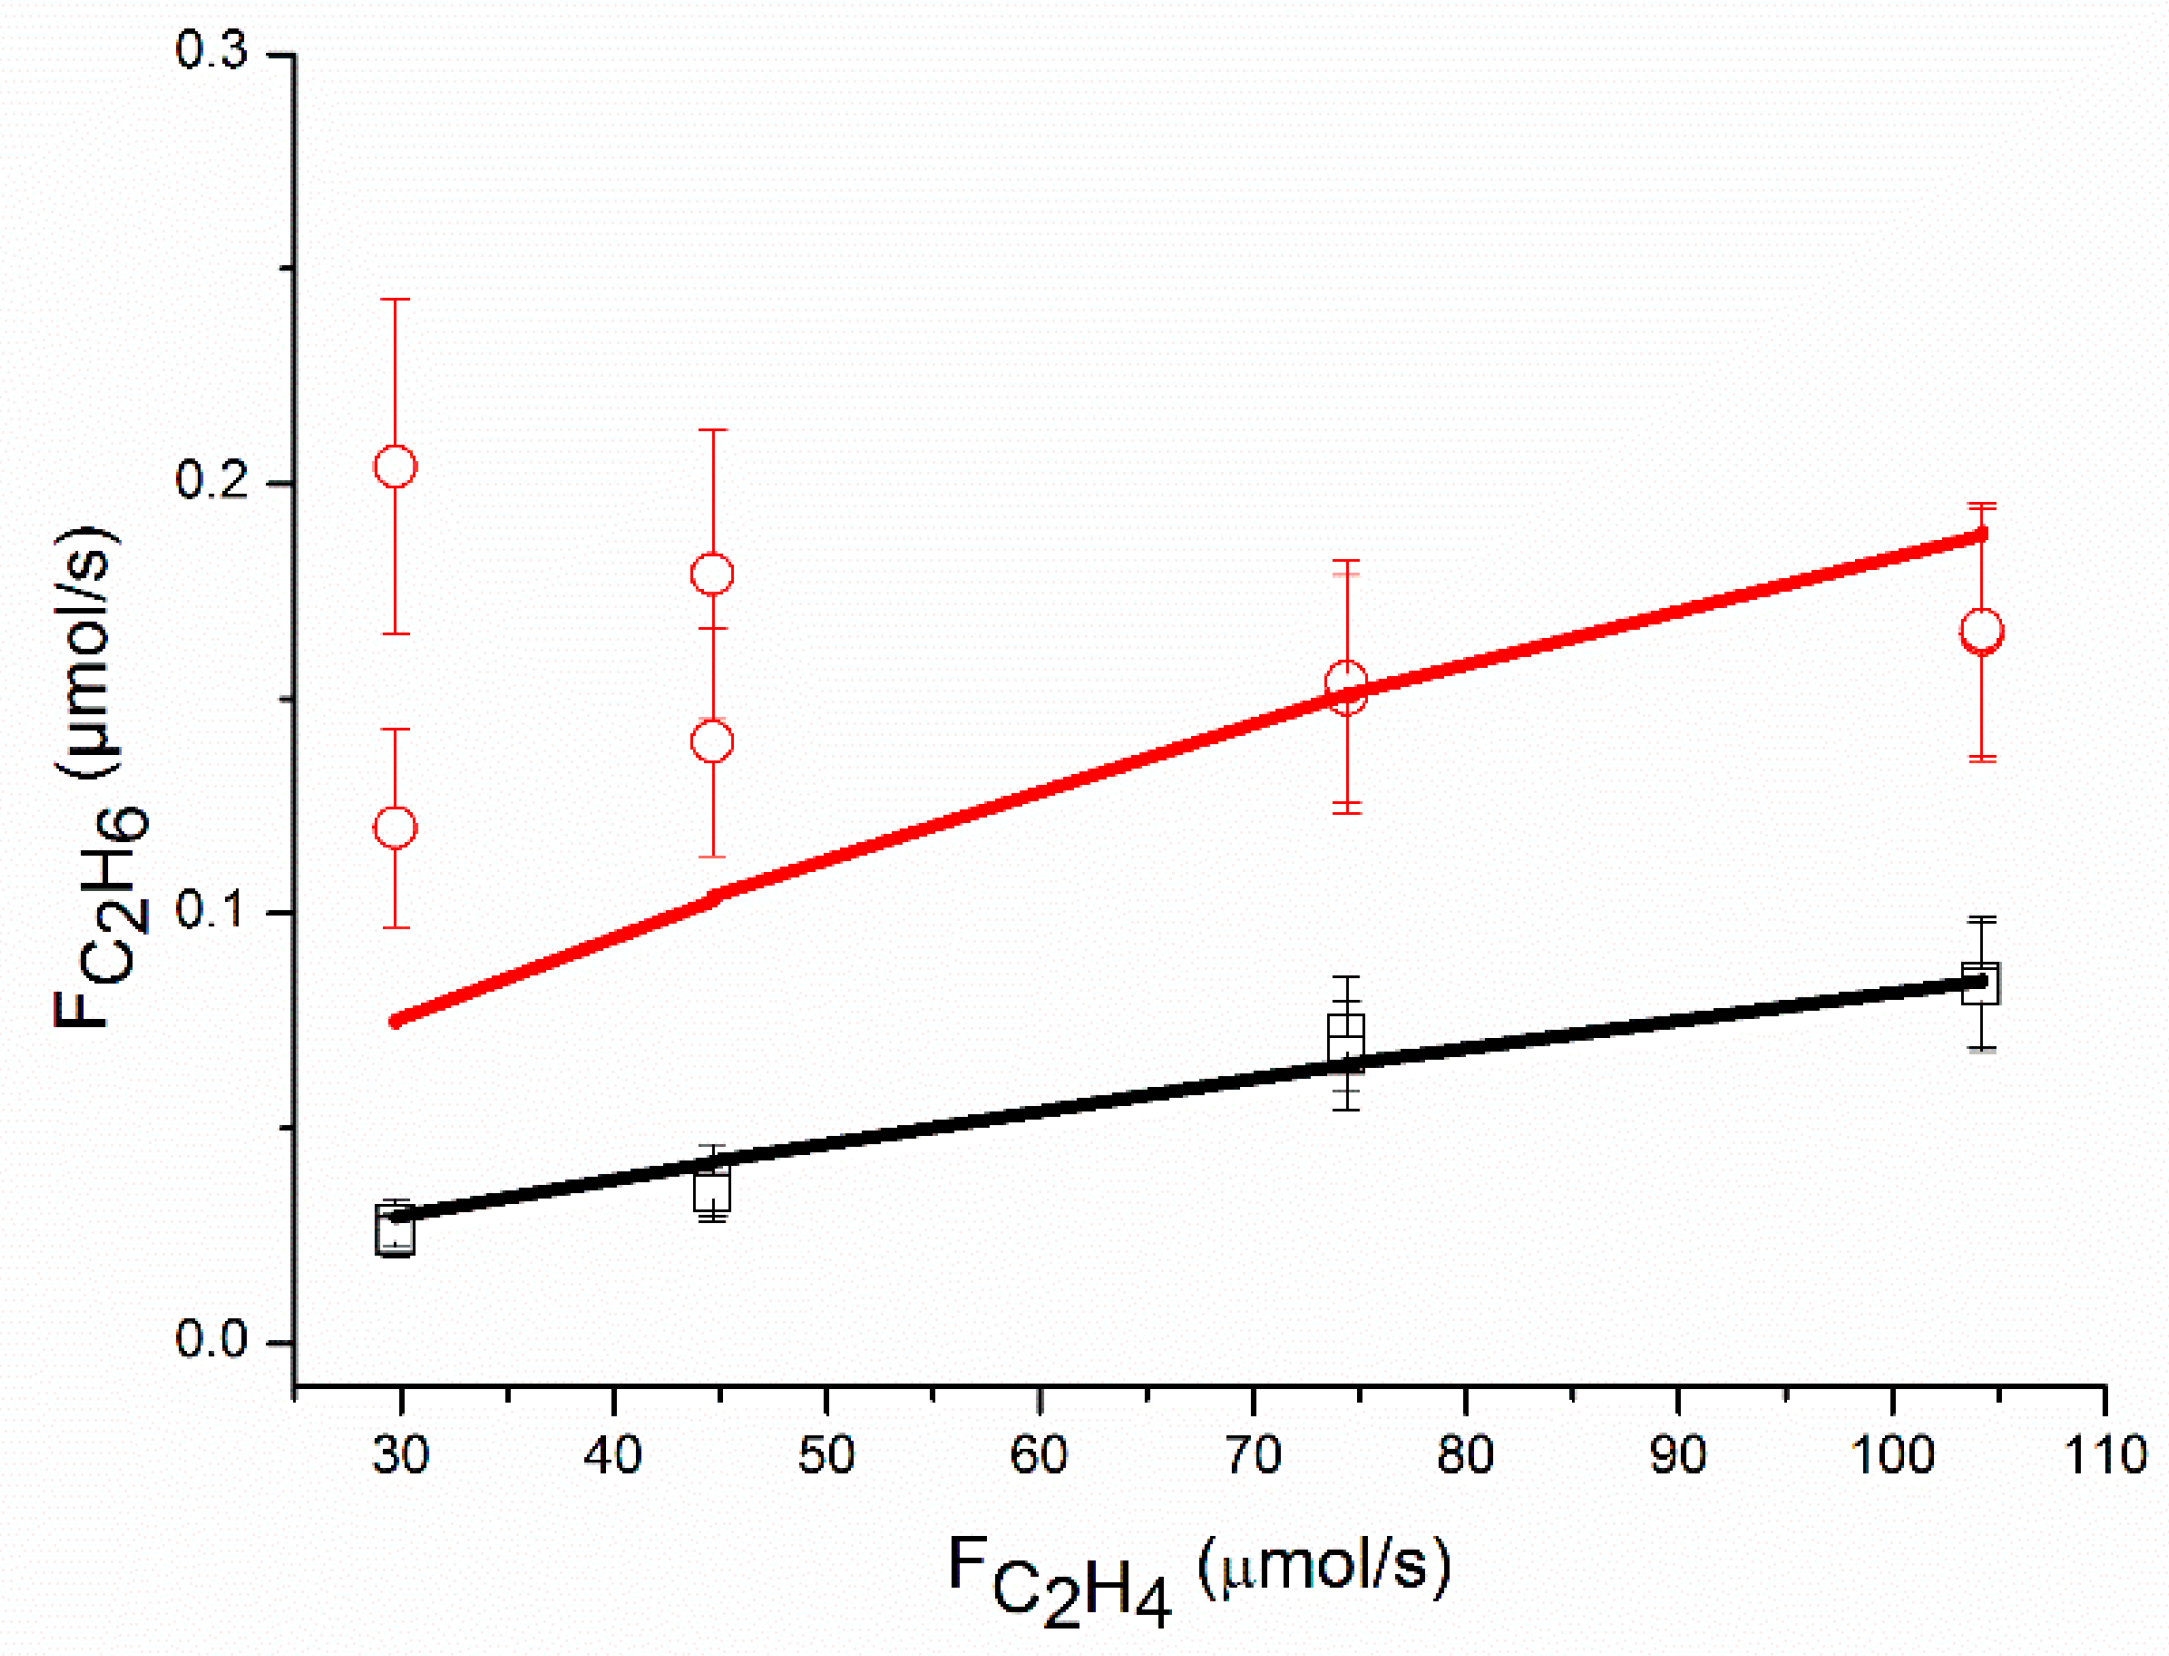
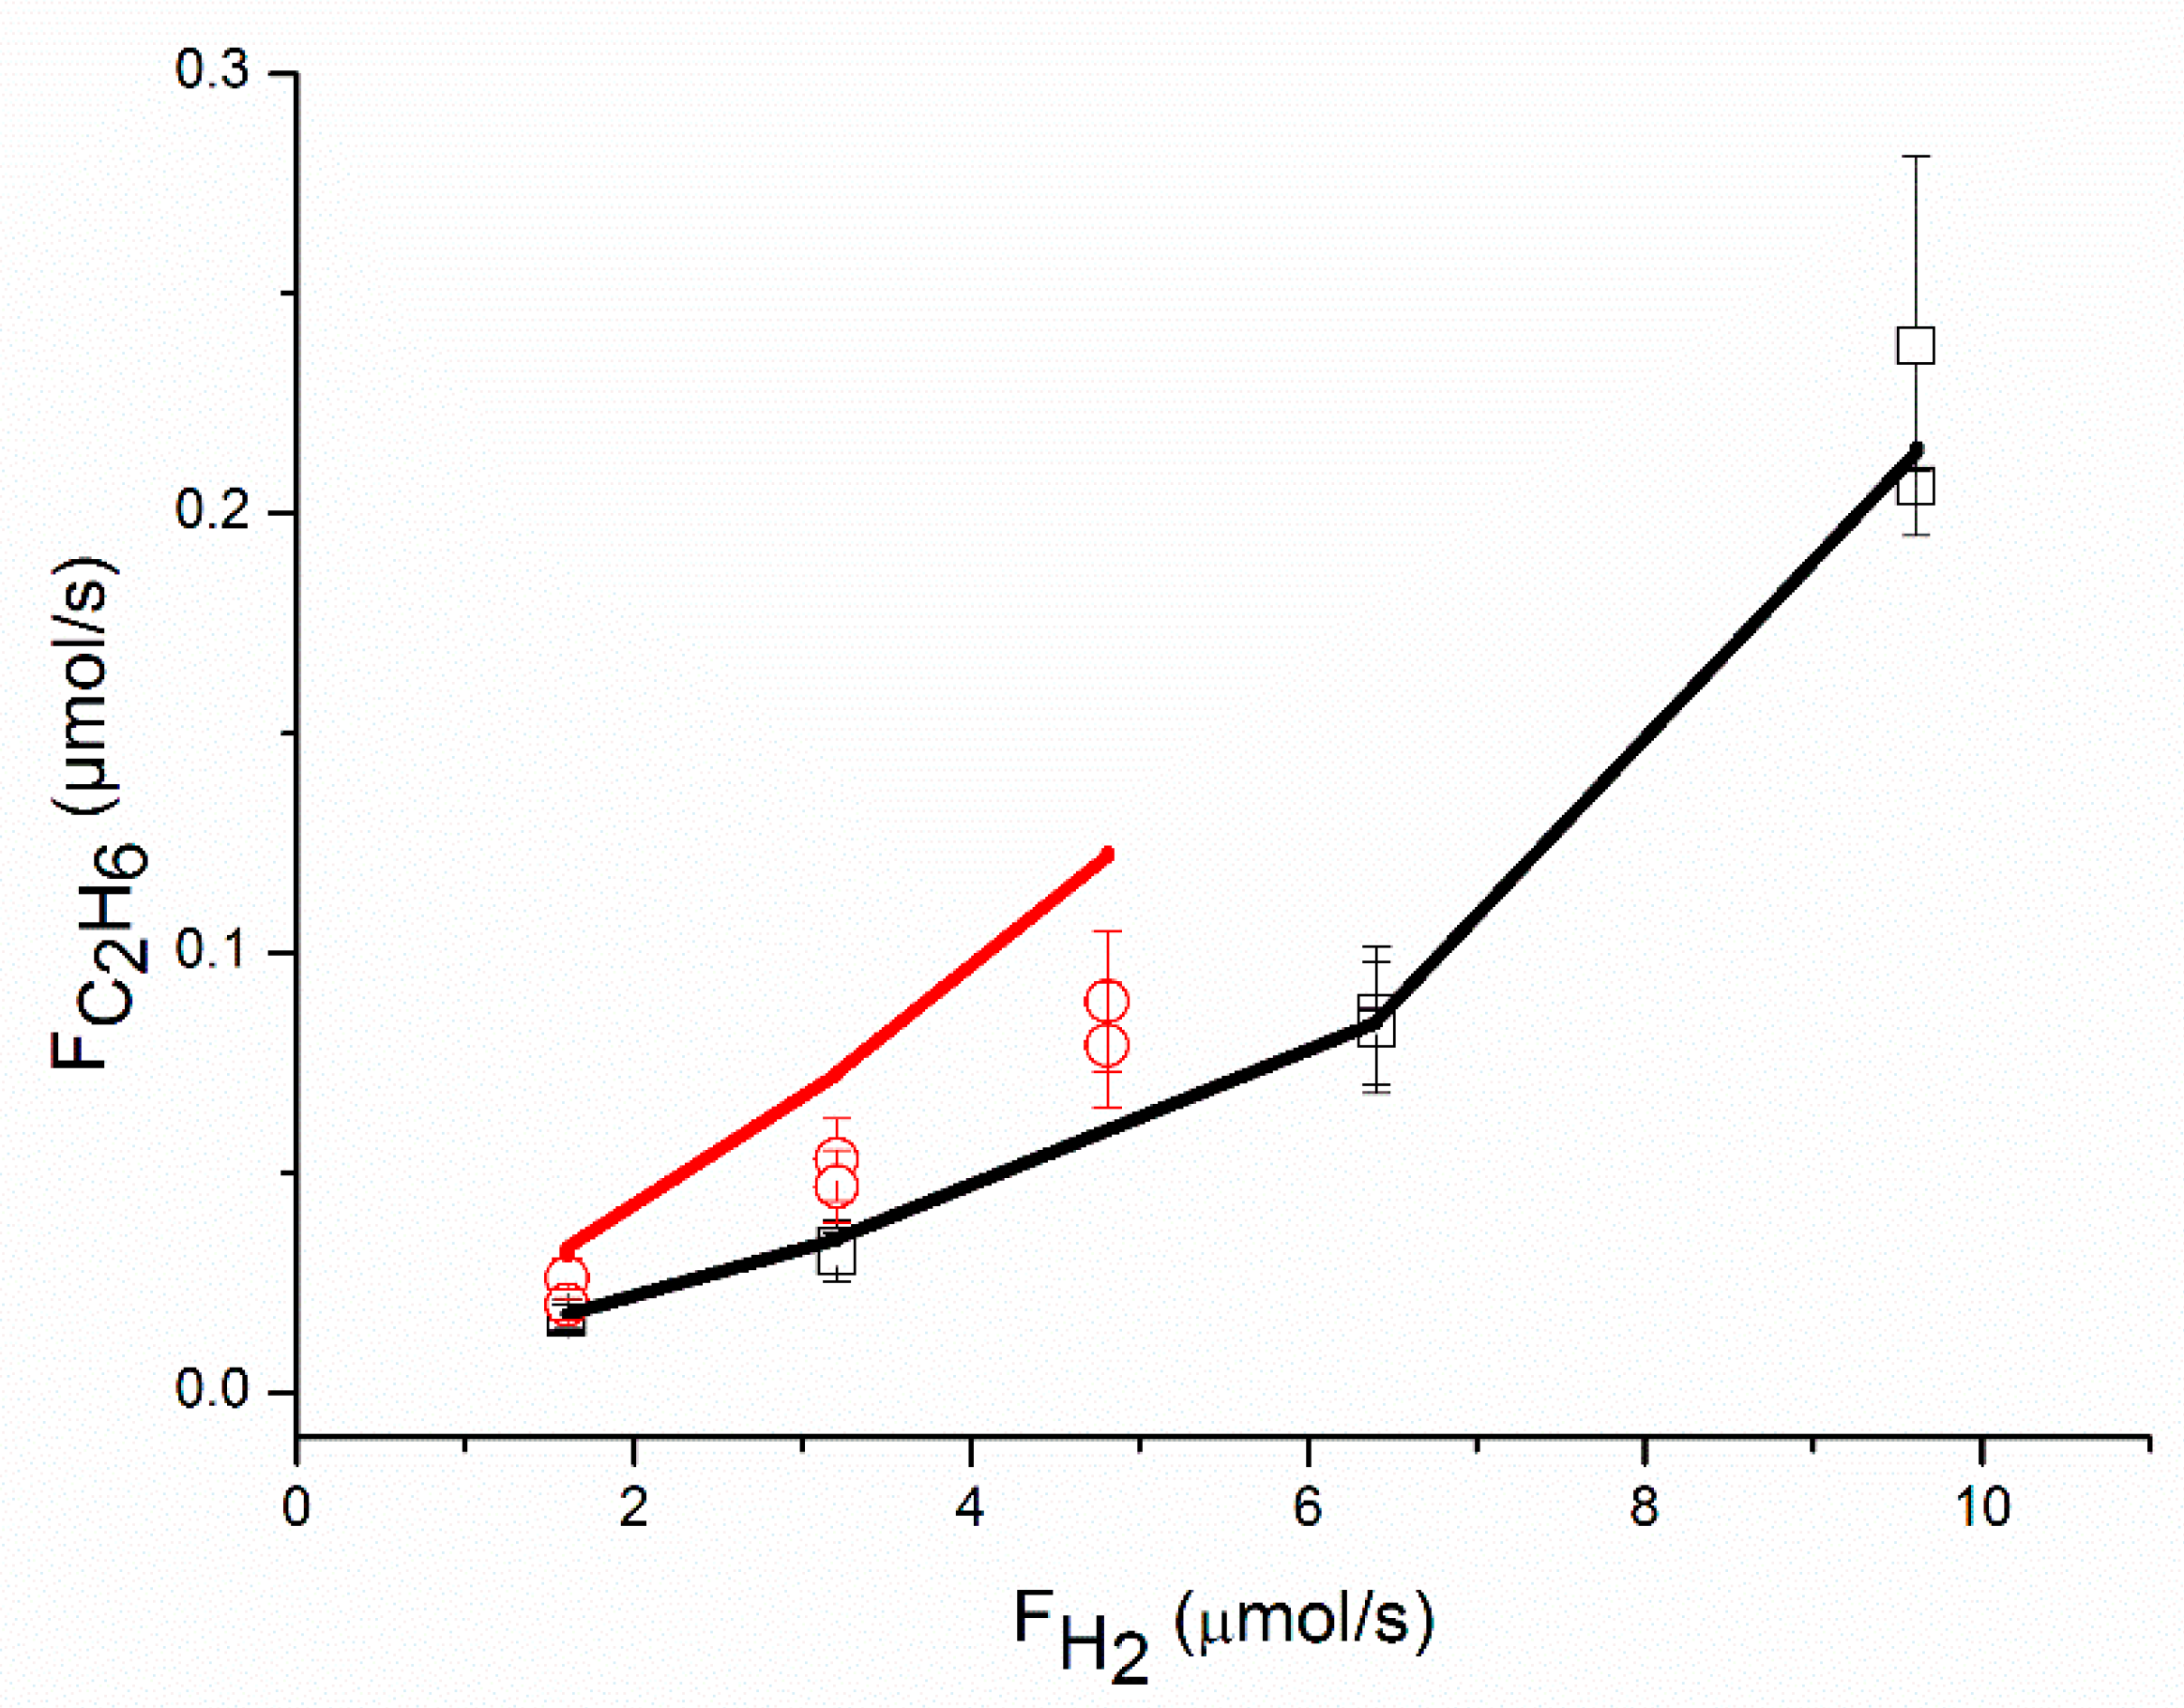
4] for a two-site model was that they observed a lack of the effect of the partial pressure of ethylene on rC2H2/PH2, indicating that the coverage of active sites by ethylene is negligible, while they observed an effect of the partial pressure of ethylene on rC2H4/PH2. The latter effect is also observed in this study and corresponds to the data in Figure 4. The rate of ethane production increases with the partial pressure of ethylene (the partial pressure of ethylene is proportional to the molar flow of ethylene in 
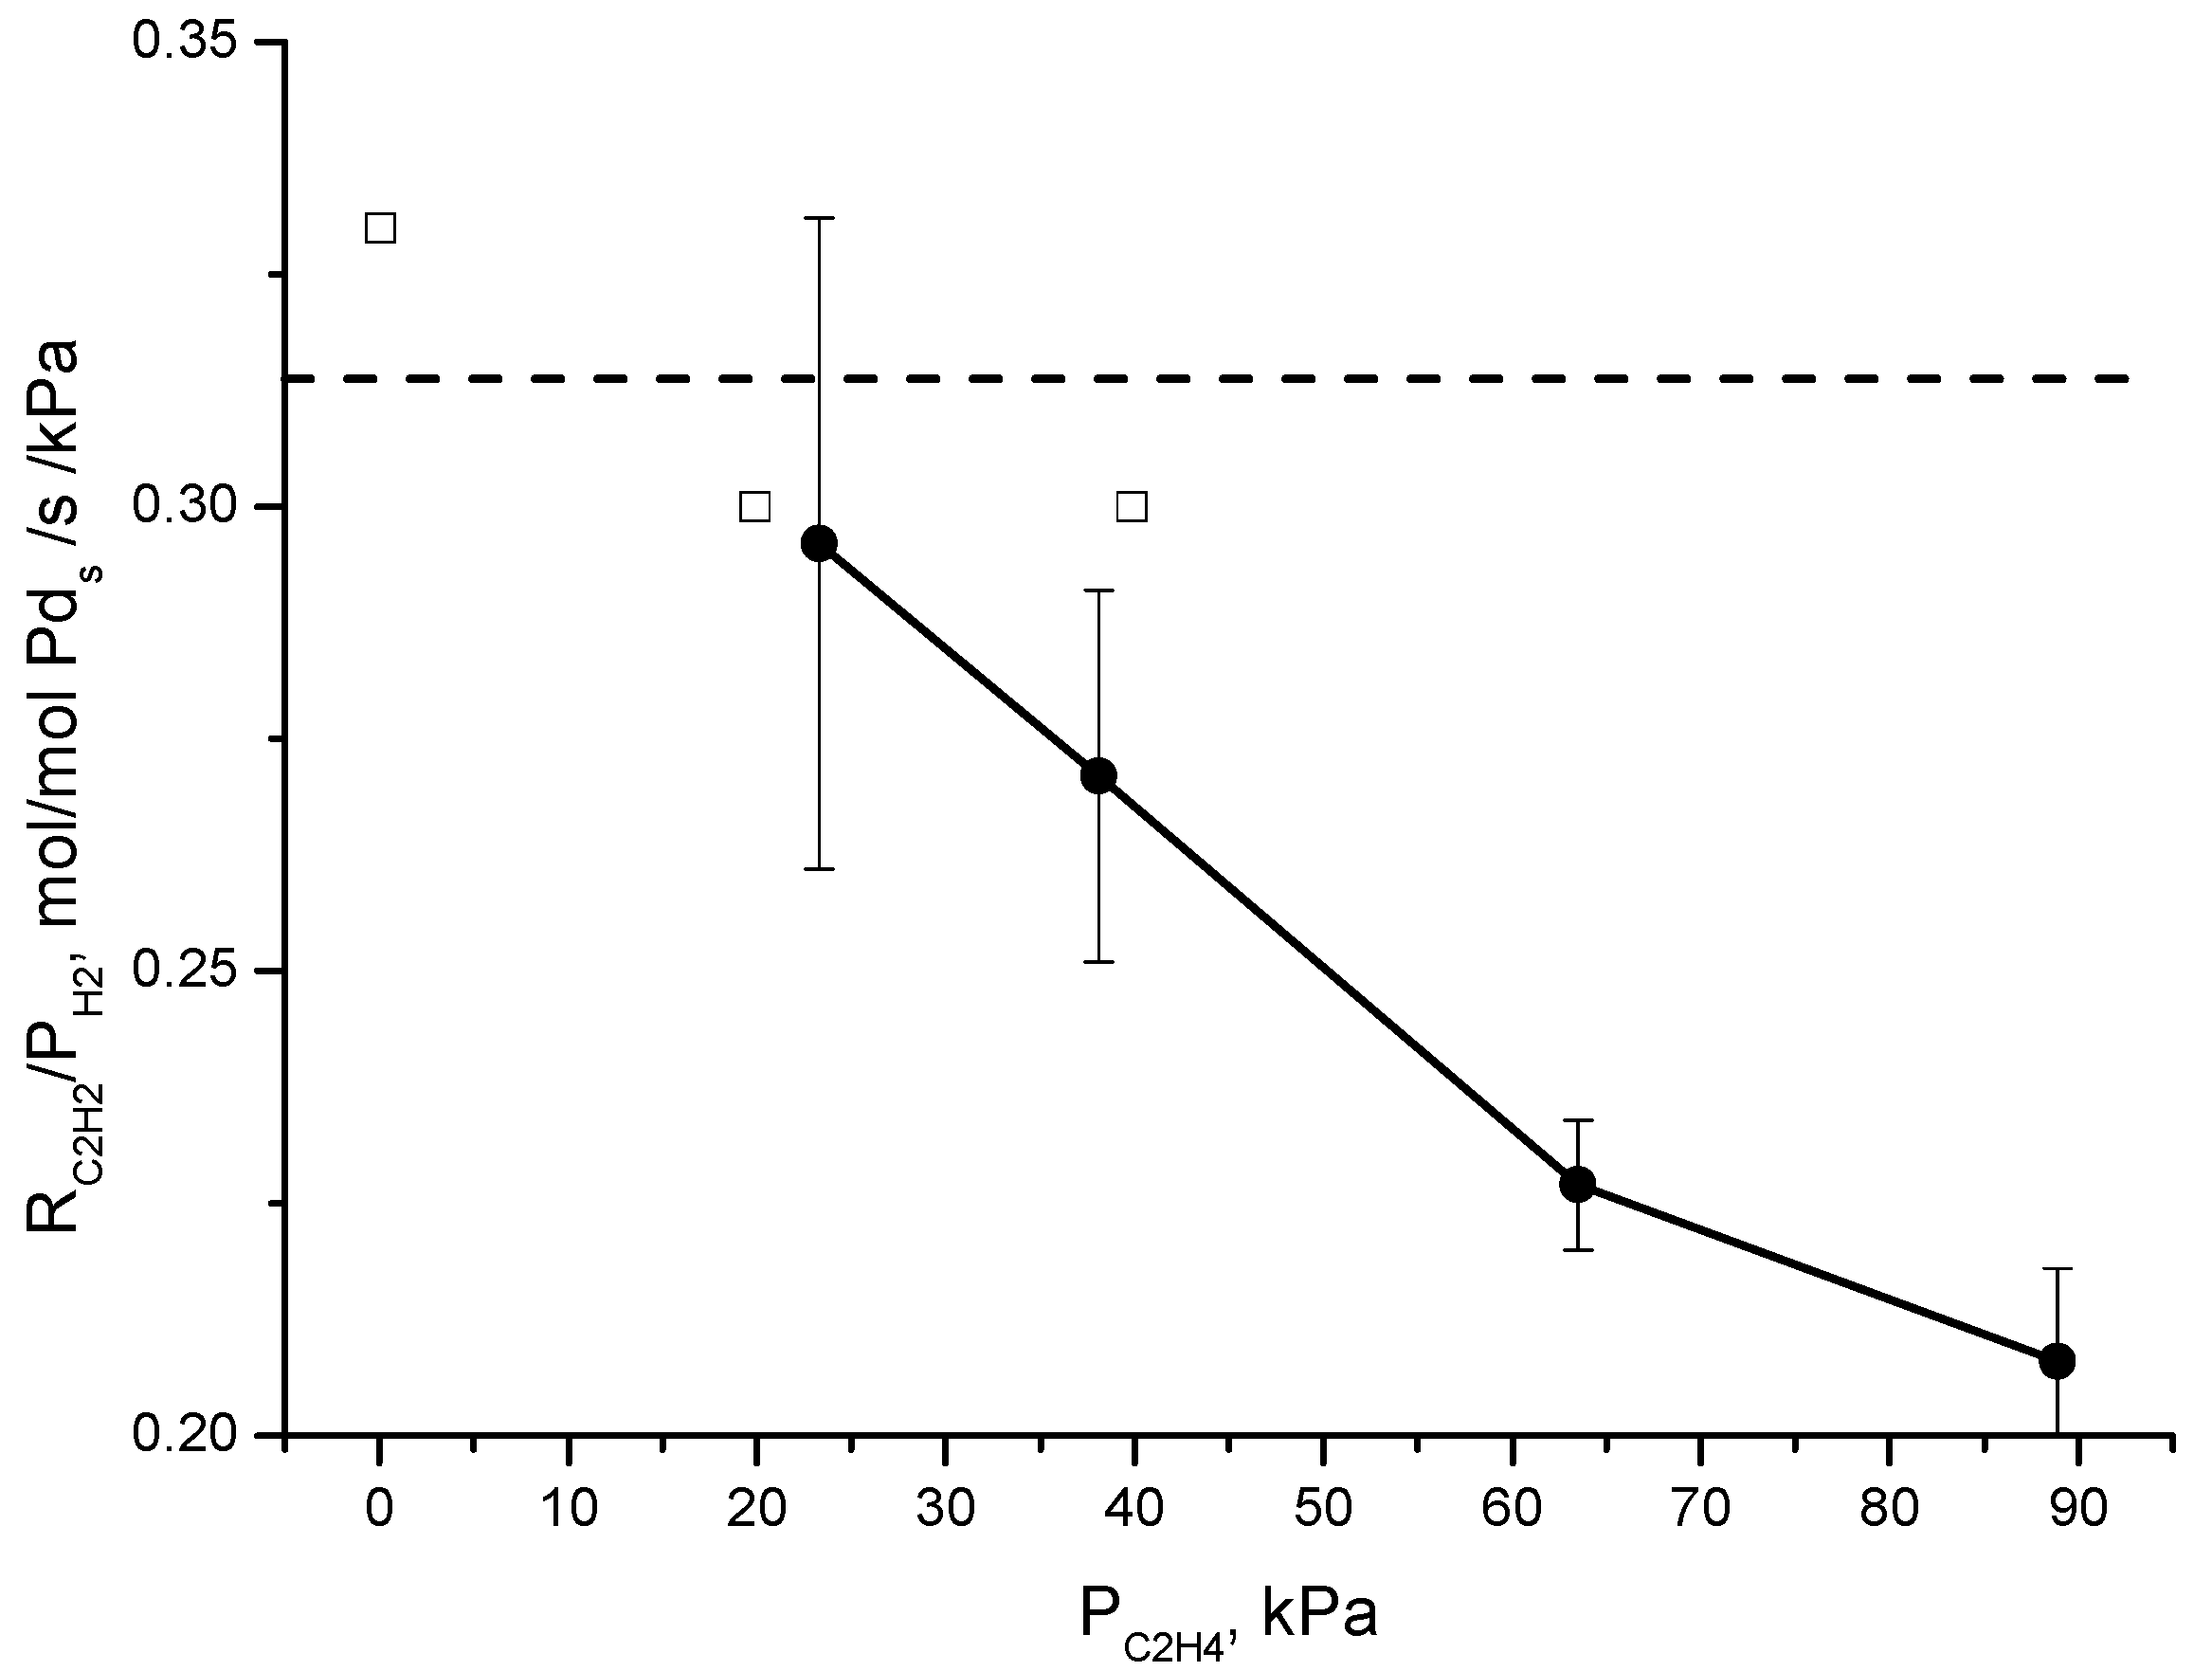
Figure 4, where the partial pressure of acetylene and the partial pressure of hydrogen are constant). Contrary to Borodziński and Cybulski, we do observe an effect of the partial pressure of ethylene on rC2H2/PH2. This is demonstrated in Figure 7 where we trace both the data of Borodziński and Cybulski [4] and our data for rC2H2/PH2 as a function of the partial pressure of ethylene. Despite the rather different conditions of both studies, the rC2H2/PH2 values are very similar. However, whereas rC2H2/PH2 is independent of the ethylene partial pressure in the case of the data of Borodziński and Cybulski, in our case, rC2H2/PH2 decreases with increasing ethylene partial pressure. A single site mechanism is thus validated for the conditions used in this study, or at least if two sites are present on the catalyst, the adsorption behavior of ethylene and acetylene on both sites is not different enough to be distinguished from the experiments under these conditions. Borodziński and Cybulski [4] attributed the different active sites on palladium to the deposit of carbonaceous species, creating pockets of different sizes that induce size dependent reactivity. In our study, the amount of carbonaceous species might be rather low, due to the short time on stream of the catalyst and the much higher stoichiometric ratio of hydrogen to acetylene. This is also consistent with the reaction order of hydrogen greater than 1, which was explained by Molero et al. [7] by excess hydrogen that removes adsorbed carbonaceous species from the catalyst surface and creates free palladium sites.

3. Materials and Methods

3.1. Experimental set-up and testing

Kinetic experiments for acetylene hydrogenation were carried out in an integral fixed bed reactor over 0.05 wt. % Pd/α-Al2O3 catalysts under typical tail-end conditions. During the experiment, 0.1 g of catalyst sieved between 100 and 200 µm was used, diluted with 0.5 g of the α-Al2O3 support, crushed and sieved identically, to improve the isothermicity of the catalytic bed. The fixed-bed reactor consisted of a quartz tube with an inner diameter of 4 mm, inserted in a cylindrical oven. A thermocouple was inserted into the catalyst bed. The reaction was carried out at 51 and 62 °C. A flow consisting of different ratios of acetylene, ethylene, hydrogen, and argon, using mass flow controllers, at a total flow rate of 200 mL/min was used and the reactor was operated at 1.26 bar. The experiment at standard conditions was performed regularly to check the stability of the catalyst and the data repeatability. The reactor was loaded twice with a fresh catalyst sample and the experiments were conducted twice. Before the experiments the catalyst was reduced under a flow of 100 mL/min of 50% hydrogen in argon at 150 °C for 2 h. The catalyst activity and selectivity were found to be stable during the kinetic runs.
Online analysis was done by passing the outlet gas flow through a small volume infrared gas cell connected to a FTIR spectrometer. Quantitative FTIR analysis of acetylene, ethylene and ethane was carried out. No C4 products were observed. The carbon balance was closed within 5%. Experimental conditions are given in Table 6. By using appropriate criteria, the kinetic measurements were shown to be free from heat and mass transfer limitations [23]. This can be easily verified using the tool developed by Eurokin [24]. The maximum observed rate of acetylene consumption of 9 mmol/kgcat/s was used to check the criteria given in Table 7. As shown in Table 7 all criteria were met.

3.2. Catalyst

0.05 wt. % Pd supported on α-alumina was used as a catalyst. It was prepared by impregnation of the alumina by an aqueous palladium nitrate solution. The material was then dried at 120 °C under ambient air and calcined at 425 °C for 2 h. The detailed protocol has been previously described together with extensive XRD and HRTEM characterization [25,26]. The alumina support has a porous volume of 0.54 mL/g and a BET surface area of 10 m2/g. Electron Transmission Microscopy analysis showed a mean particle diameter of 2.4 ± 0.7 nm, corresponding to a dispersion of ca. 40%. From this and the wt. % of Pd the number of surface palladium atoms was calculated as NS = 2 × 10⁻³ mol/kg. The catalyst was sieved between 100 and 200 µm to improve the heat transfer during the kinetic experiments. Runs under standard conditions using the original catalyst spheres in a single pellet reactor configuration showed similar performance as the crushed sample.

3.3. Modeling

An integral reactor operation was used and the rate equations have been integrated numerically using the ODEPACK library [27]. A one-dimensional homogeneous reactor model has been used, in agreement with the absence of mass and heat transfer limitations. A non-linear least-square multi-response regression analysis has been performed by a Levenberg–Marquardt minimization algorithm [28,29]. The fractional acetylene conversion and the molar exit flow of ethane (µmol/s) have been used for the objective function. No weighing factor has been applied. After regression analysis several statistical tests were performed, including the t-test, the 95% confidence intervals of the parameter estimates, the F-value, and binary correlation coefficients.

4. Conclusions

The kinetics of the selective hydrogenation of acetylene over a 0.05 wt. % Pd/α-Al2O3 catalyst was studied under intrinsic kinetic conditions. The operating conditions were chosen according to the tail-end process. Analysis of the experimental reaction orders gave good insight into the reaction mechanism. It allowed us to estimate the mean surface coverages of hydrogen, acetylene, and ethylene. The proposed reaction mechanism consists of a series of sequential hydrogen additions according to the Horiuti–Polanyi mechanism. The derived rate equations are based on the addition of the second hydrogen atom as rate-determining step for both acetylene and ethylene hydrogenation. Accurate parameter estimation was only possible after fixing the values of the equilibrium adsorption constant of ethylene. The relatively simple Langmuir–Hinshelwood-type rate-equations describe the experimental data adequately. It is based on physically meaningful parameters. The reaction mechanism involves only one active site, which was carefully verified.

Author Contributions

Conceptualization, J.-M.S., Y.S. and A.C.; methodology, J.-M.S., Y.S.; software, Y.S.; validation, Y.S., J.-M.S.; formal analysis, C.U., Y.S.; investigation, C.U.; resources, A.C.; data curation, Y.S.; writing—original draft preparation, C.U.; writing—review and editing, J.-M.S., Y.S. and A.C.; visualization, C.U.; supervision, J.-M.S., Y.S. and A.C.; project administration, J.-M.S.; funding acquisition, J.-M.S., A.C.

Funding

This research received no external funding.

Conflicts of Interest

The authors declare no conflict of interest.

Appendix A

Nomenclature

ASSurface area of Pd 1.26 × 10⁴ m2/mol
dpCatalyst particle diameterm
dRReactor diameterm
EActivation energykJ/mol
FMolar flowrateµmol s−1
hBed heightm
k0Pre-exponential factor(mol/mol Pds/s) or s−1
kRate constant (mol/mol Pds/s)
KAdsorption equilibrium constantPa−1
MwMolecular weightkg/mol
NSNumber of surface Pd atomsmol Pds/kg
P(Partial) pressurebar, Pa or kPa
RGas constantJ/mol/K
ri or RiReaction rate for species i or step imol/kg/s
SC2H6Selectivity of ethane-
TTemperature°C, K
WcatCatalyst massg
XConversion%mol

Greek letters and symbols

*Active site
αiAcetylene reaction order for reaction i
βiHydrogen reaction order for reaction i
γiEthylene reaction order for reaction i
σStoichiometric number
σsSticking coefficient
θiFractional surface coverage of species i

References

  1. Derrien, M. Selective hydrogenation applied to refining of petrochemical raw materials produced by steam cracking. Stud. Surf. Catal. 1986, 27, 613–666. [Google Scholar]
  2. Borodzinski, A.; Bond, G.C. Selective Hydrogenation of Ethyne in Ethene-Rich Streams on Palladium Catalysts. Part 1. Effect of Changes to the Catalyst During Reaction. Catal. Rev. 2006, 48, 91–144. [Google Scholar] [CrossRef]
  3. Bos, A.N.R.; Westerterp, K.R. Mechanism and kinetics of the selective hydrogenation of ethyne and ethane. Chem. Eng. Process. 1993, 32, 1–7. [Google Scholar] [CrossRef]
  4. Borodzinski, A.; Cybulski, A. The kinetic model of hydrogenation of acetylene-ethylene mixtures over palladium surface covered by carbonaceous deposits. Appl. Catal. A Gen. 2000, 198, 51–66. [Google Scholar] [CrossRef]
  5. Cider, L.; Schöön, N.-H. Kinetics of cross-desorption of carbon monoxide by the influence of ethyne over palladium/alumina. Appl. Catal. 1991, 68, 207–216. [Google Scholar] [CrossRef]
  6. Bos, A.N.R.; Bootsma, E.S.; Foeth, F.; Sleyster, H.W.J.; Westerterp, K.R. A kinetic study of the hydrogenation of ethyne and ethene on a commercial Pd/Al2O3 catalyst. Chem. Eng. Process. 1993, 32, 53–63. [Google Scholar] [CrossRef]
  7. Molero, H.; Bartlett, B.F.; Tysoe, W.T. The Hydrogenation of Acetylene Catalyzed by Palladium: Hydrogen Pressure Dependence. J. Catal. 1999, 181, 49–56. [Google Scholar] [CrossRef]
  8. Borodzinski, A.; Bond, G.C. Selective Hydrogenation of Ethyne in Ethene-Rich Streams on Palladium Catalysts, Part 2: Steady-State Kinetics and Effects of Palladium Particle Size, Carbon Monoxide, and Promoters. Catal. Rev. 2008, 50, 379–469. [Google Scholar] [CrossRef]
  9. Pachulski, A.; Schödel, R.; Claus, P. Kinetics and reactor modeling of a Pd-Ag/Al2O3 catalyst during selective hydrogenation of ethyne. Appl. Catal. A Gen. 2012, 445–446, 107–120. [Google Scholar] [CrossRef]
  10. Aduriz, H.R.; Bodnariuk, P.; Dennehy, M.; Gigola, C.E. Activity and Selectivity of Pd/Alpha-Al2O3 for Ethyne Hydrogenation in a large Excess of Ethene and Hydrogen. Appl. Catal. 1990, 58, 227–239. [Google Scholar] [CrossRef]
  11. McGowm, W.T.; Kemball, C.; Whan, D.A. Hydrogenation of Acetylene in Excess Ethylene on a Alumina-Supported Palladium Catalyst at Atmospheric Pressure in a Spinning Basket Reactor. J. Catal. 1978, 51, 173–184. [Google Scholar] [CrossRef]
  12. Vincent, M.J.; Gonzalez, R.D. A Langmuir–Hinshelwood model for a hydrogen transfer mechanism in the selective hydrogenation of acetylene over a Pd/γ-Al2O3 catalyst prepared by the sol-gel method. Appl. Catal. A Gen. 2001, 217, 143–156. [Google Scholar] [CrossRef]
  13. Mei, D.; Sheth, P.A.; Neurock, M.; Smith, C.M. First-principles-based kinetic Monte Carlo simulation of the selective hydrogenation of acetylene over Pd(111). J. Catal. 2006, 242, 1–15. [Google Scholar] [CrossRef]
  14. Bond, G.C.; Wells, P.B. The hydrogenation of acetylene: II. The reaction of acetylene with hydrogen catalyzed by alumina-supported palladium. J. Catal. 1965, 5, 65–67. [Google Scholar] [CrossRef]
  15. Saeys, M.; Reyniers, M.-F.; Thybaut, J.W.; Neurock, M.; Marin, G.B. First-principles based kinetic model for the hydrogenation of toluene. J Catal. 2005, 236, 129–138. [Google Scholar] [CrossRef]
  16. Neurock, M.; van Santen, R.A. A First Principles Analysis of C–H Bond Formation in Ethylene Hydrogenation. J. Phys. Chem. B 2000, 104, 11127–11145. [Google Scholar] [CrossRef]
  17. Langmuir, I. The constitution and fundamental properties of solids and liquids. Part 1. Solids. J. Am. Chem. Soc. 1916, 38, 2221–2295. [Google Scholar] [CrossRef]
  18. Conrad, H.; Ertl, G.; Latta, E.E. Adsorption of hydrogen on palladium single crystal surfaces. Surf. Sci. 1974, 41, 435–446. [Google Scholar] [CrossRef]
  19. Michalakab, W.D.; Millerab, J.B.; Alfonsoa, D.; Gellmana, A.J. Uptake, transport, and release of hydrogen from Pd(100). Surf. Sci. 2012, 606, 146–155. [Google Scholar] [CrossRef]
  20. Chou, P.; Vannice, M.A. Calorimetric heat of adsorption measurements on palladium: I. Influence of crystallite size and support on hydrogen adsorption. J. Catal. 1987, 104, 1–16. [Google Scholar] [CrossRef]
  21. Tysoe, W.T.; Nyberg, G.L.; Lambert, R.M. Structural, kinetic, and reactive properties of the palladium(111)-ethylene system. J. Phys. Chem. 1984, 88, 1960–1963. [Google Scholar] [CrossRef]
  22. Vattuone, L.; Yeo, Y.Y.; Kose, R.; King, D.A. Energetics and kinetics of the interaction of acetylene and ethylene with Pd{100} and Ni{100}. Surf. Sci. 2000, 447, 1–14. [Google Scholar] [CrossRef]
  23. Schuurman, Y. Aspects of kinetic modeling of fixed bed reactors. Catal. Today 2008, 138, 15–20. [Google Scholar] [CrossRef]
  24. Fixed-Bed Web Tool at the Eurokin Website. Available online: http://www.eurokin.org/ (accessed on 19 December 2018).
  25. Ramos-Fernandez, M.; Normand, L.; Sorbier, L. Structural and Morphological Characterization of Alumina Supported Pd Nanoparticles Obtained by Colloidal Synthesis. Oil Gas Sci. Technol. 2007, 62, 101–113. [Google Scholar] [CrossRef] [Green Version]
  26. Didillon, B.; Merlen, E.; Pagès, T.; Uzio, D. Studies in Surface Science and Catalysis; Delmon, B., Ed.; Elsevier: Amsterdam, The Netherlands, 1998; Volume 118, pp. 41–54. [Google Scholar]
  27. Hindmarsh, A.C. ODEPACK. A Systematized Collection of ODE Solvers; Elsevier: Amsterdam, The Netherlands, 1983. [Google Scholar]
  28. Levenberg, K. A Method for the Solution of Certain Non-Linear Problems in Least Squares. Q. Appl. Math. 1944, 11, 164–168. [Google Scholar] [CrossRef]
  29. Marquardt, D.W. An algorithm for least-squares estimation of nonlinear parameters. J. Soc. Ind. Appl. Math. 1963, 11, 431–441. [Google Scholar] [CrossRef]
Figure 1. Evolution of acetylene conversion as a function of the acetylene inlet molar flow. Circles: data at 62 °C, squares: data at 51 °C.
Catalysts 09 00180 g001
Figure 2. Ethane outlet molar flow as a function of the acetylene inlet molar flow. Circles: data at 62 °C, squares: data at 51 °C.
Catalysts 09 00180 g002
Figure 3. Evolution of acetylene conversion as a function of the ethylene inlet molar flow. Circles: data at 62 °C, squares: data at 51 °C.
Catalysts 09 00180 g003
Figure 4. Ethane outlet molar flow as a function of the ethylene inlet molar flow. Circles: data at 62 °C, squares: data at 51 °C.
Catalysts 09 00180 g004
Figure 5. Evolution of acetylene conversion as a function of the hydrogen inlet molar flow. Circles: data at 62 °C, squares: data at 51 °C.
Catalysts 09 00180 g005
Figure 6. Ethane outlet molar flow as a function of the hydrogen inlet molar flow. Circles: data at 62 °C, squares: data at 51 °C.
Catalysts 09 00180 g006
Figure 7. Plots of rC2H2/PH2 vs. ethylene partial pressure. Open symbols: data from Borodziński and Cybulski [4]: T = 70 °C, PC2H2 = 0.02 kPa, PH2 = 0.64 kPa. Closed symbols: data from this study: T = 62 °C, PC2H2 = 0.95 kPa, PH2 = 5.5 kPa. The dotted horizontal line indicates the extrapolated average values of rC2H2/PH2 for the data from Borodziński and Cybulski [4].
Catalysts 09 00180 g007
Table 1. Relative standard deviation (rsd) of 6 repeated experiments (3 for each catalyst loading, 2 loadings) for both conversion and ethane outlet flow at 2 conversion levels.
Operating Conditions 1Operating Conditions 2Operating Conditions 1Operating Conditions 2
T (°C)XC2H2rsd (%)XC2H2rsd (%)FC2H6rsd (%)FC2H6rsd (%)
510.139.30.366.20.07190.1311
620.237.80.378.50.11160.1615
Table 2. Estimated values of the reaction orders with their 95% confidence intervals.
T (°C)rC2H2rC2H6
α1 (C2H2)β1 (H2)γ1 (C2H4)α2 (C2H2)β2 (H2)γ2 (C2H4)
51−0.88 ± 0.091.46 ± 0.16−0.13 ± 0.07−1.00 ± 0.201.42 ± 0.701.09 ± 0.50
62−0.93 ± 0.071.49 ± 0.34−0.19 ± 0.04−1.56 ± 0.131.69 ± 0.880.30 ± 0.15
Table 3. Elementary steps for the reaction C2H2 + H2 ⇆ C2H4 and C2H4 + H2 ⇆ C2H6.
Elementary Stepσ
1H2 + 2* ⇆ 2H*2
2C2H2 + * ⇆ C2H2*1
3C2H2* + H* ⇆ C2H3* + *1
4C2H3* + H* ⇆ C2H4* + *1
5C2H4* ⇆ C2H4 + *1
6C2H4* + H* ⇆ C2H5* + *1
7C2H5* + H* ⇆ C2H6 + 2*1
Table 4. Reaction orders corresponding to the derived rate-equations.
Reaction OrderrC2H2rC2H6
C2H2H2C2H4C2H2H2C2H4
dependence on coverage1−2ƟC2H21−ƟH2−2ƟC2H4−2ƟC2H21−ƟH21−2ƟC2H4
Min–max(−1)–10–1(−2)–0(−2)–00–1(−1)–1
Table 5. Parameter estimates with their 95% confidence intervals.
ParameterEstimated Value
K1 (Pa−1)13 (fixed)
K2 (Pa−1)107 ± 7
k04 (mol/mol Pds/s)1.4 ± 0.1 × 10⁸
K5 (Pa)7.4 (fixed)
k07 (mol/mol Pds/s)3.6 ± 0.6 × 10⁹
E4 (kJ/mol)48.5 ± 4.2
E7 (kJ/mol)54.8 ± 11
NS (mol/kg)2 × 10−3 (fixed)
Table 6. Experimental conditions.
VariableValues
T (°C)51, 62
F C 2 H 2 (µmol/s)0.7–3
F H 2 (µmol/s)1.6–10
F C 2 H 4 (µmol/s)29–105
FAr (µmol/s)34–115
P (bar)1.26
Wcat (g)0.1
Ftot (µmol/s)149
Table 7. Criteria to assess the conditions for the absence of mass and heat transfer limitations.
Physical PhenomenonCriteria
plug flow (axial)h/dp = 193 > 6
plug flow (radial)dR/dp = 40 > 10
degree of dilution (vol./vol.)0.89 < 0.97
external mass transfer (Carberry number)3.3 × 10⁻⁴ < 0.05
internal mass transfer (Weisz-Prater)1.7 × 10⁻² < 0.33
external heat transfer (film)0.14 K < 1.1 K
external heat transfer (radial)0.17 K < 1.1 K
internal heat transfer3 × 10−3 K < 1.1 K

