Must the Best Laboratory Prepared Catalyst Also Be the Best in an Operational Application?

 ,
,  and
and
Abstract
: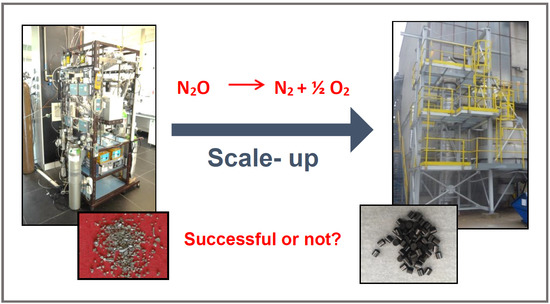
1. Introduction
2. Results
2.1. N2O Catalytic Decomposition
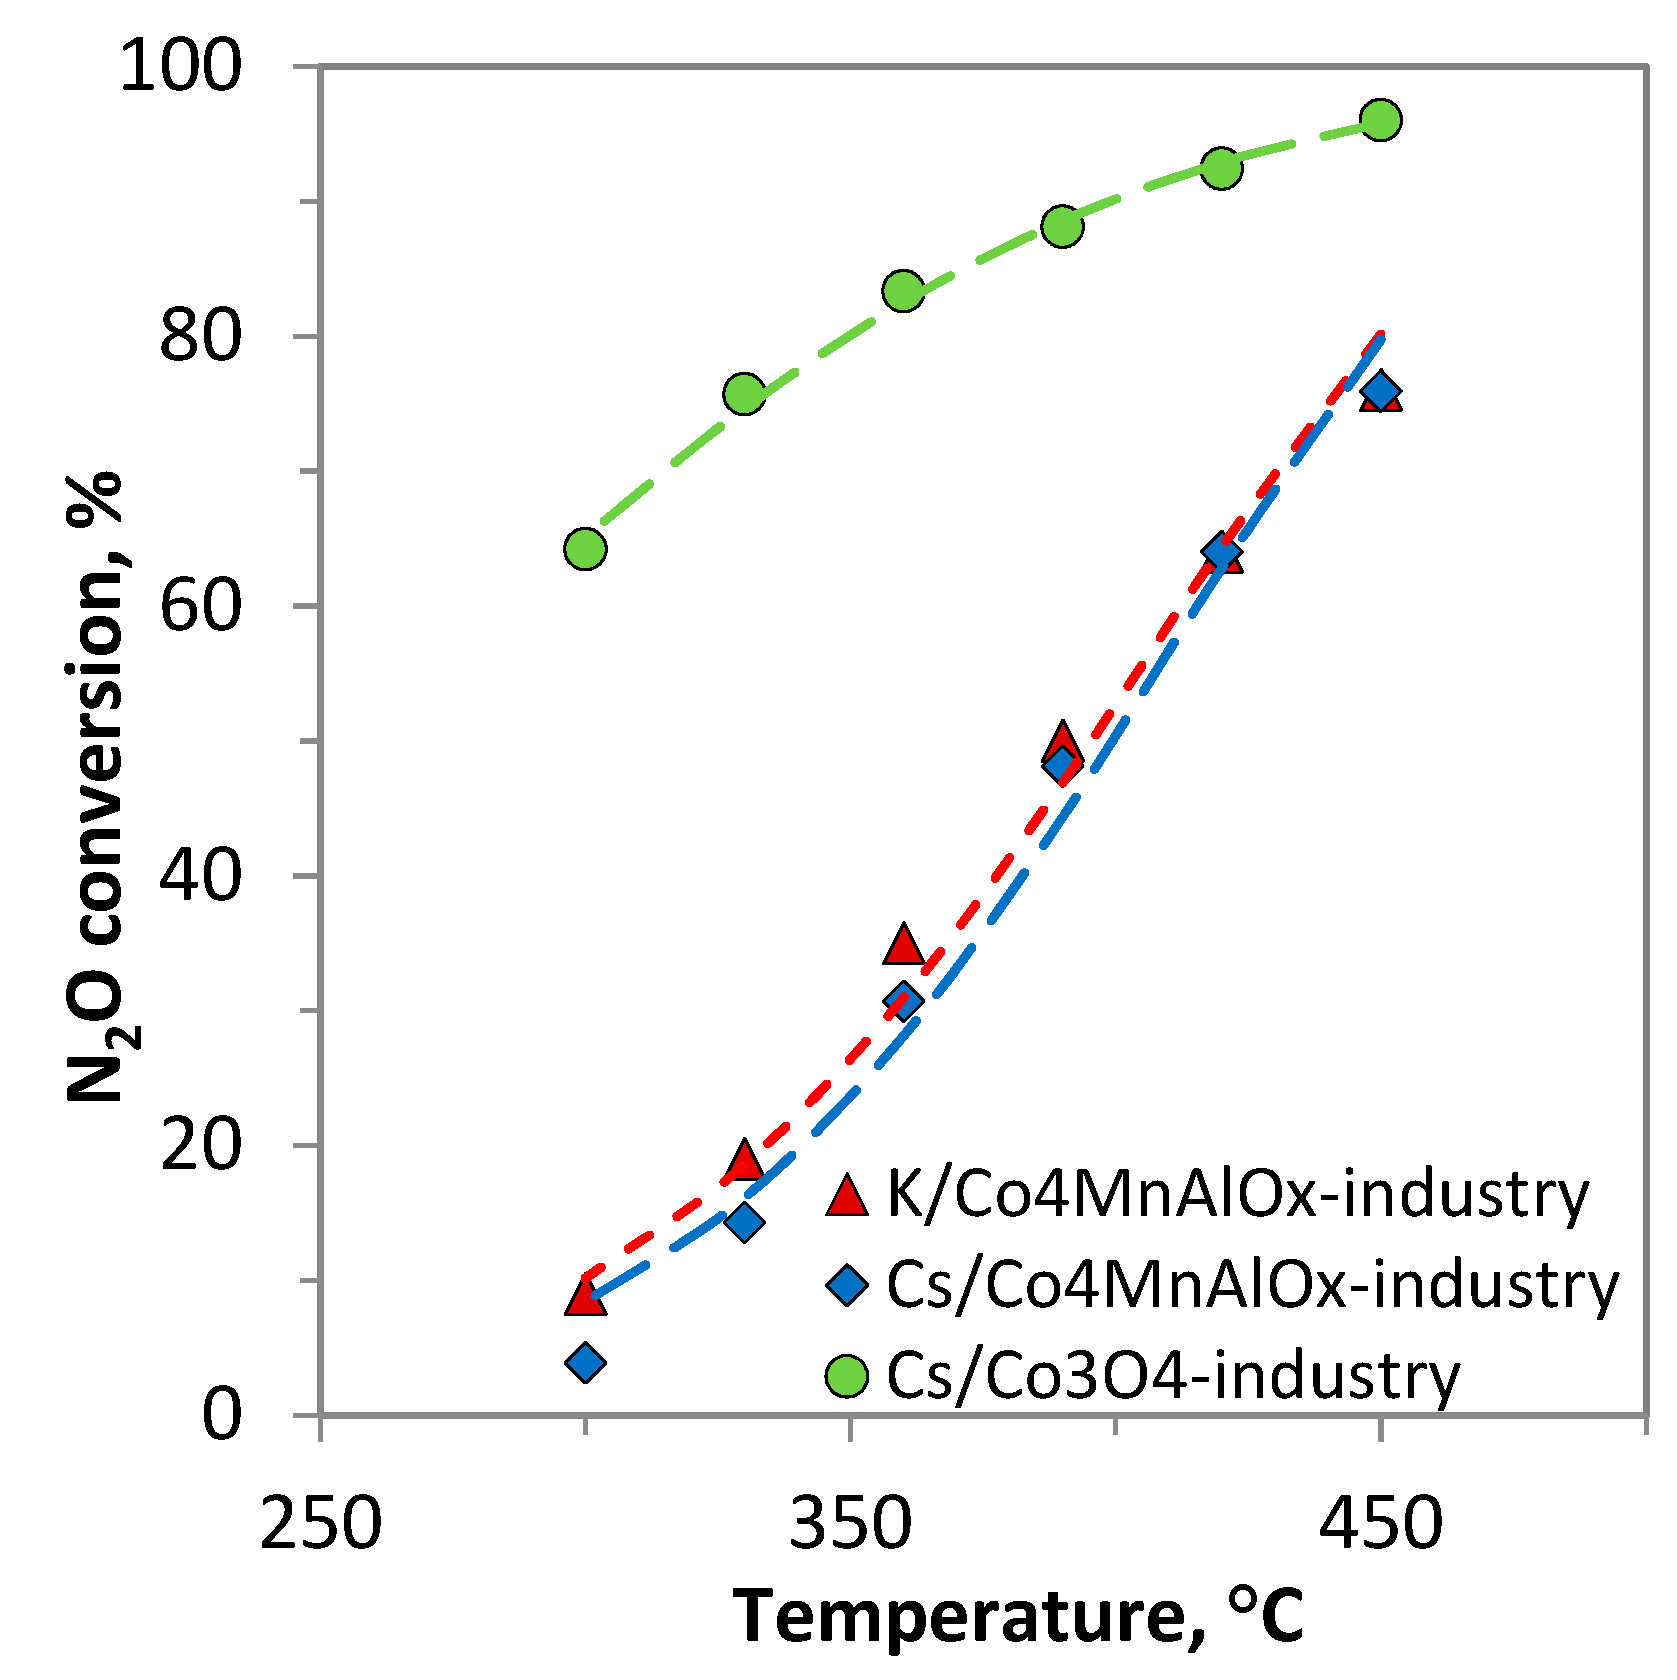
- What are the reasons for the different activity order of commercially prepared catalyst tablets compared to laboratory-prepared samples?
- Could our pilot-plant catalysts achieve higher activity (N2O conversions)?
- What are the theoretical limits of N2O conversions over catalyst tablets and how to approach them?
2.2. Physicochemical Properties of Catalysts
- The K/Co4MnAlOx catalysts demonstrated very similar characteristics for laboratory and commercially prepared samples. Both samples have the same chemical and phase composition; they differ slightly in K content, which is however still in the optimal range, similar to K normalized loading (atoms/nm2). The samples have the same specific surface areas and crystallite sizes (within the margin of error), which is manifested in also having similar reducibilities.
- While the commercially prepared Cs/Co4MnAlOx has the same chemical and phase composition as the laboratory prepared sample, its crystallite size is 1.8× higher than for the laboratory prepared sample, which leads to both lower specific surface area and worse reducibility. Our previous work proved a direct relationship between the crystallite size and reducibility of Co and Mn in their higher oxidation states (Co3+, Mn4+) in Co4MnAlOx [17]. Taking into account that the slowest step of N2O decomposition is the desorption of oxygen from the catalyst surface connected to the reduction of active sites, worse reducibility of Co3+ and probably even Mn4+ (corresponding to the temperature maxima of the 1st reduction peak in TPR-H2) causes a decrease in N2O conversion. This was observed in the case of the commercially prepared Cs/Co4MnAlOx.
- Similarly, the commercially prepared Cs/Co3O4 catalyst has the same chemical and phase composition as the laboratory prepared sample. However, the situation regarding crystallite size is completely reversed compared to Cs/Co4MnAlOx. The commercially prepared Cs/Co3O4 catalyst’s crystallite size is 2.7× lower than for the laboratory prepared sample, which corresponds with its higher specific surface area and lower normalized loading of Cs (atoms/nm2). The reducibility of Co3+ and Co2+ cannot be determined due to TPR peaks overlapping, but the results indicate different shapes of the cobalt spinel nanocrystals, which affect the catalytic activity [16].
3. Discussion
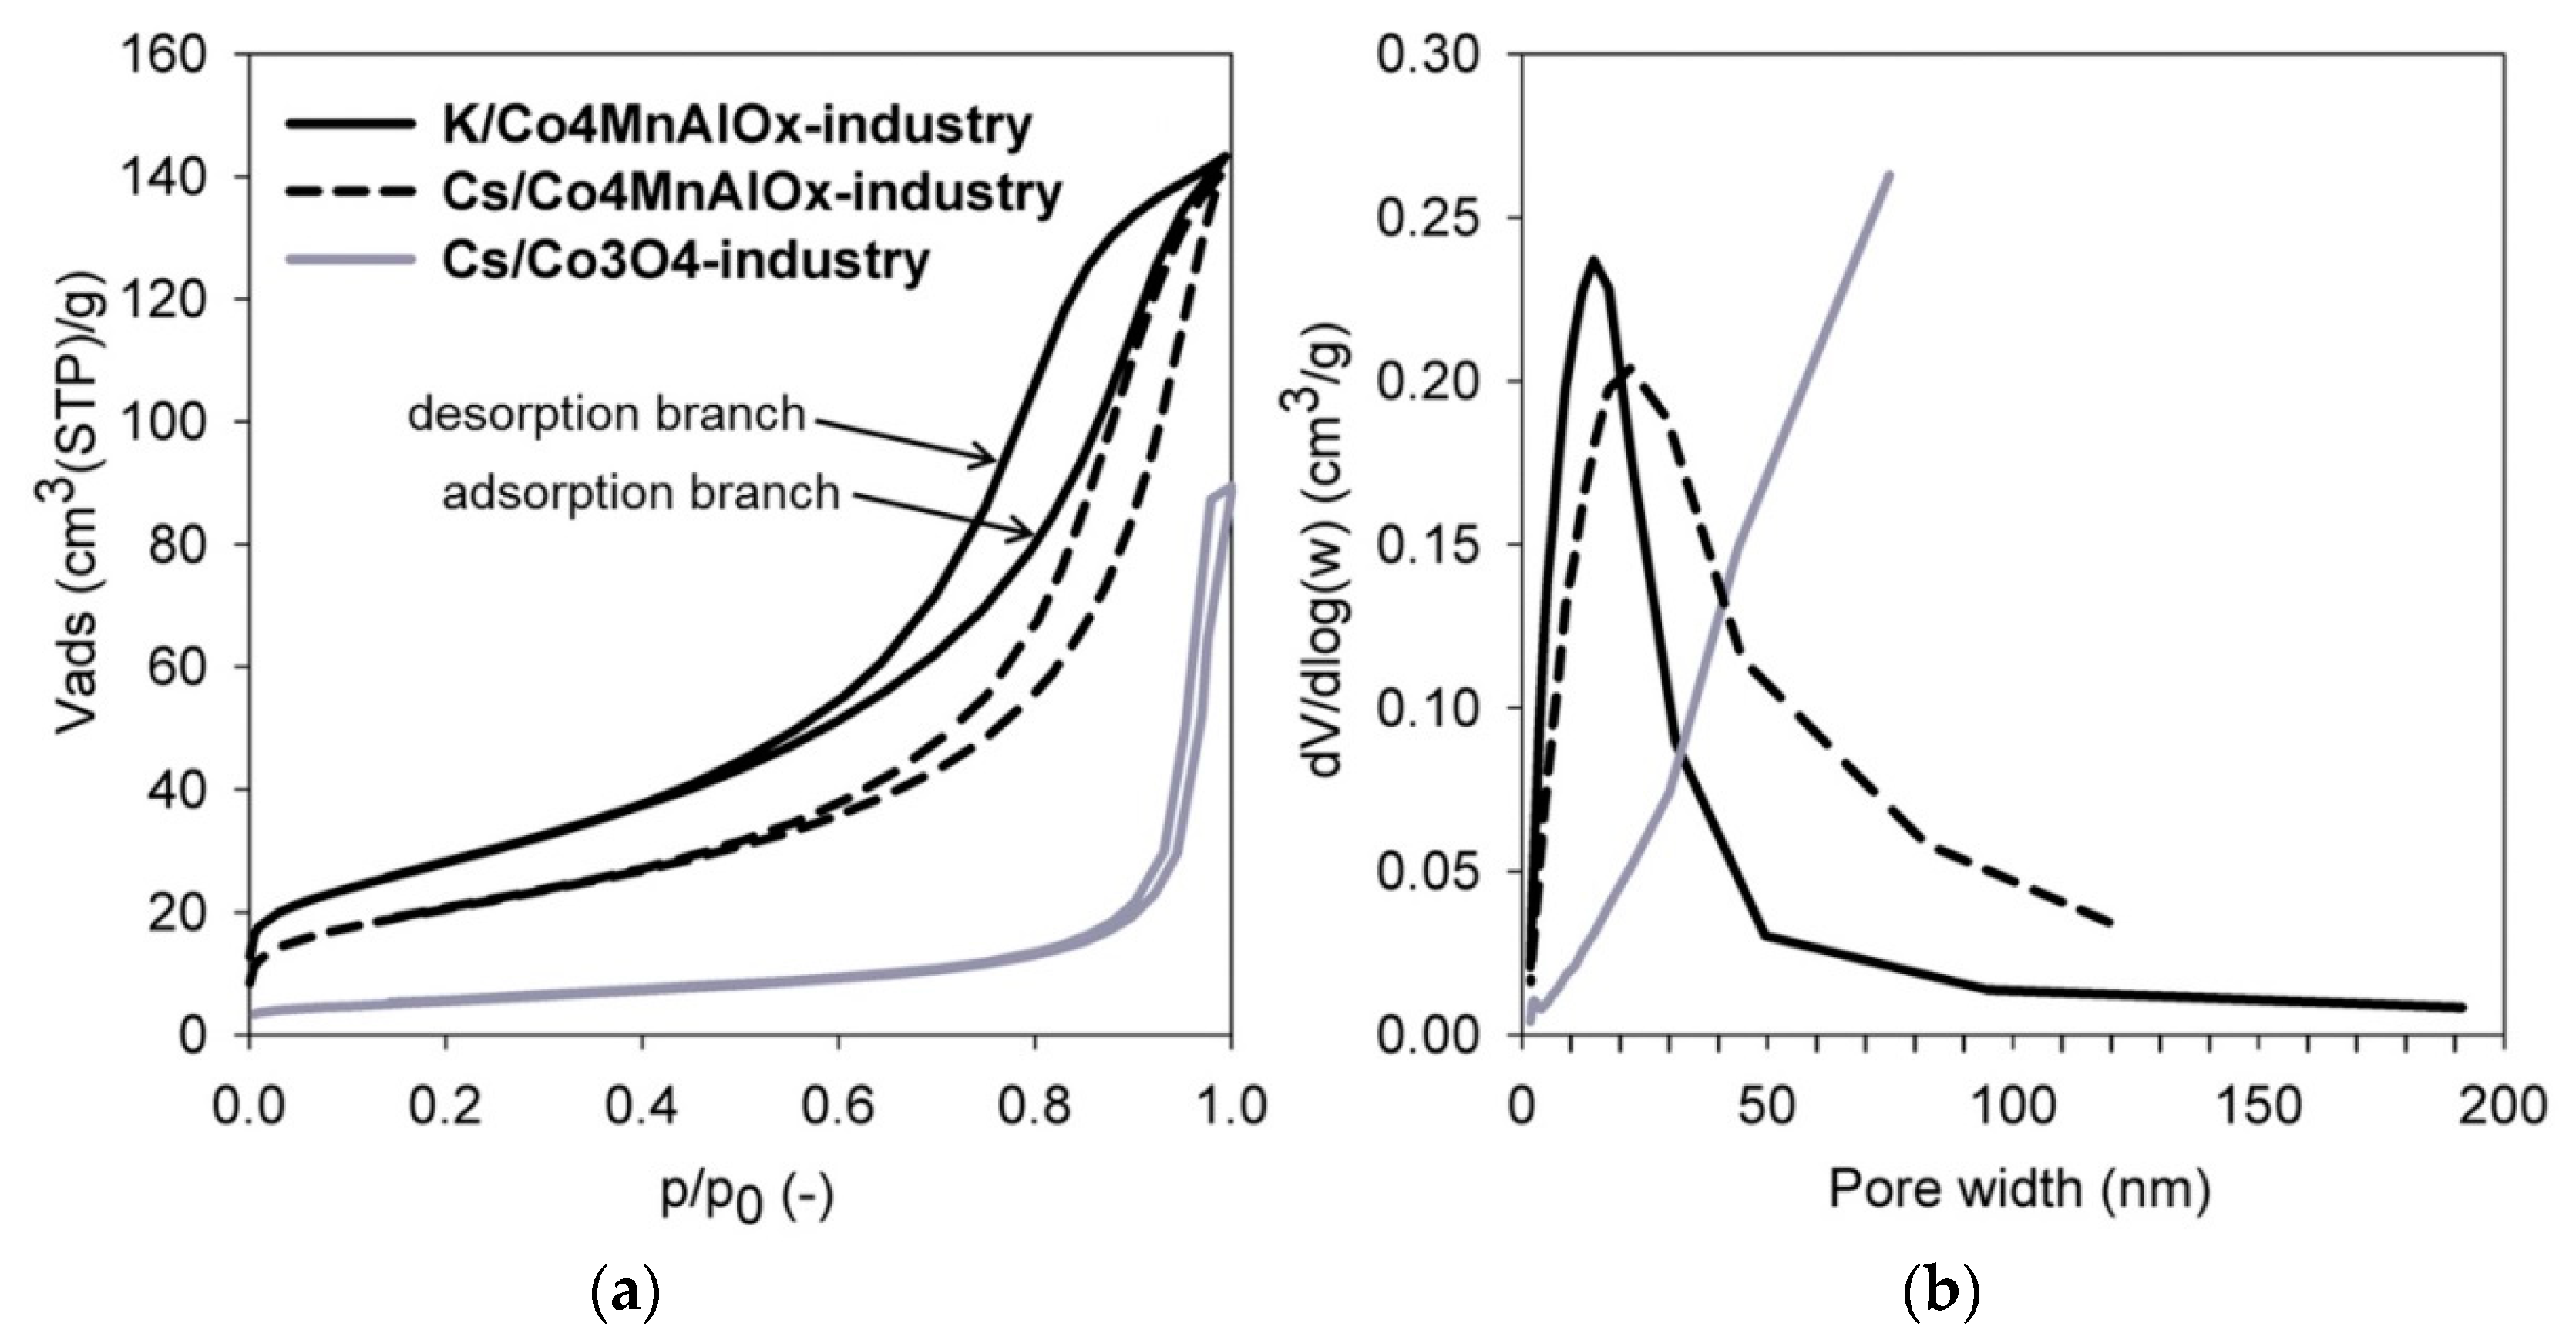
- The K/Co4MnAlOx-industry catalyst has the lowest Dk due to its smallest pores and therefore the lowest overall diffusivity. It also has the second highest tortuosity, which means the second highest εp/q ratio (0.07) (the porosity of all catalysts is approximately the same). As a result, it has the lowest effective diffusion coefficient of all three commercial catalysts. Its activity could theoretically be improved via enlargement of pores and lowering their tortuosity, which would lead to an increase of the internal effectiveness factor.
- The Cs/Co4MnAlOx-industry has the most favorable morphology for transport because it has the highest effective diffusion coefficient due to the lowest tortuosity and pore size, which is comparable to K/Co4MnAlOx-industry. As a result, this catalyst had the highest value of η (0.18) and there is still room to increase its value.
4. Materials and Methods
4.1. Preparation of Catalysts at Laboratory Scale
4.1.1. K/Co4MnAlOx and Cs/Co4MnAlOx
4.1.2. Cs/Co3O4
4.2. Preparation of Catalysts on Large Scale
4.2.1. K/Co4MnAlOx and Cs/Co4MnAlOx
4.2.2. Cs/Co3O4-industry
4.3. Characterization of Catalysts
4.4. Catalytic Tests on Laboratory Scale
4.5. Pilot Plant Catalytic Tests
4.6. Determination of Internal Effectiveness Factor
5. Conclusions
Author Contributions
Funding
Acknowledgments
Conflicts of Interest
Symbols
| a | lattice parameter (nm) |
| cA | concentration of component A (N2O) (mol.m−3) |
| cA0 | initial concentration of component A (N2O) (mol.m−3) |
| overall diffusivity (m2.s−1) | |
| Deff | effective diffusion coefficient (m2.s−1) |
| Dij | binary diffusion coefficient of molecular diffusivity (m2.s−1) |
| Dk | Knudsen diffusivity (m2.s−1) |
| dp | equal catalyst particle diameter (m) |
| k | kinetic constant, 1st order rate law (m3s−1kg−1) |
| k* | kinetic constant, 1st order rate law (s−1) |
| Lc | size of coherent domains |
| Mi | molar weight of compound i (g.mol−1) |
| q | tortuosity (-) |
| r | reaction rate per unit weight of catalyst (mol.kg−1.h−1) |
| ro | catalyst pore radius (m) |
| SBET | specific surface area (m2 g−1) |
| V | volume of the catalyst bed (m3) |
| total volumetric flow (m3 s−1) | |
| Vnet | total pore volume (cm3liq g−1) |
| vi | molar volume of component i (m3.kmol−1) |
| w | catalyst weight (g) |
| XA | conversion of component A (N2O) (-) |
| xN2O | molar fraction of N2O entering the reactor (-) |
| Greek symbols: | |
| εp | porosity of catalyst particle (-) |
| Φgen | generalized Thiele modul (-) |
| η | internal effectiveness factor (-) |
| ρc | bulk density of the catalyst (kg.m−3) |
References
- Chromčáková, Ž.; Obalová, L.; Kustrowski, P.; Drozdek, M.; Karásková, K.; Jirátová, K.; Kovanda, F. Optimization of Cs content in Co–Mn–Al mixed oxide as catalyst for N2O decomposition. Res. Chem. Intermed. 2015, 41, 9319–9332. [Google Scholar] [CrossRef]
- Obalová, L.; Karásková, K.; Jirátová, K.; Kovanda, F. Effect of potassium in calcined Co–Mn–Al layered double hydroxide on the catalytic decomposition of N2O. Appl. Catal. B Environ. 2009, 90, 132–140. [Google Scholar] [CrossRef]
- Lucie Obalová, S.M. Cesium doped Co3O4 spinel for N2O decomposition. In Proceedings of the 5th International Conference on Chemical Technology, Mikulov, Czech Republic, 10–12 April 2017. [Google Scholar]
- Pacultová, K.; Karásková, K.; Kovanda, F.; Jirátová, K.; Šrámek, J.; Kustrowski, P.; Kotarba, A.; Chromčáková, Ž.; Kočí, K.; Obalová, L. K-Doped Co–Mn–Al Mixed Oxide Catalyst for N2O Abatement from Nitric Acid Plant Waste Gases: Pilot Plant Studies. Ind. Eng. Chem. Res. 2016, 55, 7076–7084. [Google Scholar] [CrossRef]
- Pacultová, K.; Chromčáková, Ž.; Obalová, L. Cs doped cobalt based deN2O catalyst-Pilot plant results. Waste Forum 2017, 2, 54–63. [Google Scholar]
- Inger, M.; Kowalik, P.; Saramok, M.; Wilk, M.; Stelmachowski, P.; Maniak, G.; Granger, P.; Kotarba, A.; Sojka, Z. Laboratory and pilot scale synthesis, characterization and reactivity of multicomponent cobalt spinel catalyst for low temperature removal of N2O from nitric acid plant tail gases. Catal. Today 2011, 176, 365–368. [Google Scholar] [CrossRef]
- Inger, M.; Wilk, M.; Saramok, M.; Grzybek, G.; Grodzka, A.; Stelmachowski, P.; Makowski, W.; Kotarba, A.; Sojka, Z. Cobalt Spinel Catalyst for N2O Abatement in the Pilot Plant Operation–Long-Term Activity and Stability in Tail Gases. Ind. Eng. Chem. Res. 2014, 53, 10335–10342. [Google Scholar] [CrossRef]
- Obalová, L.; Karásková, K.; Wach, A.; Kustrowski, P.; Mamulová-Kutláková, K.; Michalik, S.; Jirátová, K. Alkali metals as promoters in Co–Mn–Al mixed oxide for N2O decomposition. Appl. Catal. A Gen. 2013, 462–463, 227–235. [Google Scholar]
- Karásková, K.; Obalová, L.; Jirátová, K.; Kovanda, F. Effect of promoters in Co–Mn–Al mixed oxide catalyst on N2O decomposition. Chem. Eng. J. 2010, 160, 480–487. [Google Scholar] [CrossRef]
- Yamada, K.; Pophal, C.; Segawa, K. Selective catalytic reduction of N2O by C3H6 over Fe-ZSM-5. Microporous Mesoporous Mater. 1998, 21, 549–555. [Google Scholar] [CrossRef]
- Chmielarz, L.; Kuśtrowski, P.; Rafalska-Łasocha, A.; Dziembaj, R. Selective oxidation of ammonia to nitrogen on transition metal containing mixed metal oxides. Appl. Catal. B Environ. 2005, 58, 235–244. [Google Scholar] [CrossRef]
- Obalová, L.; Jirátová, K.; Karásková, K.; Chromčáková, Ž. N2O catalytic decomposition – From laboratory experiment to industry reactor. Catal. Today 2012, 191, 116–120. [Google Scholar] [CrossRef]
- Pasha, N.; Lingaiah, N.; Babu, N.S.; Reddy, P.S.S.; Prasad, P.S.S. Studies on cesium doped cobalt oxide catalysts for direct N2O decomposition in the presence of oxygen and steam. Catal. Commun. 2008, 10, 132–136. [Google Scholar] [CrossRef]
- Stelmachowski, P.; Maniak, G.; Kotarba, A.; Sojka, Z. Strong electronic promotion of Co3O4 towards N2O decomposition by surface alkali dopants. Catal. Commun. 2009, 10, 1062–1065. [Google Scholar] [CrossRef]
- Galejová, K.; Obalová, L.; Jiratova, K.; Pacultová, K.; Kovanda, F. N2O catalytic decomposition—Effect of pelleting pressure on activity of Co-Mn-Al mixed oxide catalysts. Chem. Pap. 2009, 63, 172–179. [Google Scholar] [CrossRef]
- Gudyka, S.; Grzybek, G.; Gryboś, J.; Indyka, P.; Leszczyński, B.; Kotarba, A.; Sojka, Z. Enhancing the deN2O activity of the supported Co3O4|α-Al2O3 catalyst by glycerol-assisted shape engineering of the active phase at the nanoscale. Appl. Catal. B Environ. 2017, 201, 339–347. [Google Scholar] [CrossRef]
- Klyushina, A.; Pacultová, K.; Karásková, K.; Jirátová, K.; Ritz, M.; Fridrichová, D.; Volodarskaja, A.; Obalová, L. Effect of preparation method on catalytic properties of Co-Mn-Al mixed oxides for N2O decomposition. J. Mol. Catal. A Chem. 2016, 425, 237–247. [Google Scholar] [CrossRef]
- Kaczmarczyk, J.; Zasada, F.; Janas, J.; Indyka, P.; Piskorz, W.; Kotarba, A.; Sojka, Z. Thermodynamic Stability, Redox Properties, and Reactivity of Mn3O4, Fe3O4, and Co3O4 Model Catalysts for N2O Decomposition: Resolving the Origins of Steady Turnover. ACS Catal. 2016, 6, 1235–1246. [Google Scholar] [CrossRef]
- Obalová, L.; Maniak, G.; Karásková, K.; Kovanda, F.; Kotarba, A. Electronic nature of potassium promotion effect in Co–Mn–Al mixed oxide on the catalytic decomposition of N2O. Catal. Commun. 2011, 12, 1055–1058. [Google Scholar] [CrossRef]
- Maniak, G.; Stelmachowski, P.; Zasada, F.; Piskorz, W.; Kotarba, A.; Sojka, Z. Guidelines for optimization of catalytic activity of 3d transition metal oxide catalysts in N2O decomposition by potassium promotion. Catal. Today 2011, 176, 369–372. [Google Scholar] [CrossRef]
- Jirátová, K.; Mikulová, J.; Klempa, J.; Grygar, T.; Bastl, Z.; Kovanda, F. Modification of Co–Mn–Al mixed oxide with potassium and its effect on deep oxidation of VOC. Appl. Catal. A Gen. 2009, 361, 106–116. [Google Scholar] [CrossRef]
- Fogler, H.S. Elements of Chemical Reaction Engineering, 3rd ed.; Prentice Hall PTR: Upper Saddle River, NJ, USA, 1999. [Google Scholar]
- Kaptejn, F.; Moulijn, J.A. Handbook of Heterogeneous Catalysis; Ertl, G., Knözinger, H., Weitkamp, J., Eds.; Wiley: Weinheim, Germany, 1996. [Google Scholar]
- Fuller, E.N.; Schettler, P.D.; Giddings, J.C. New method for prediction of binary gas-phase diffusion coefficients. Ind. Eng. Chem. 1966, 58, 18–27. [Google Scholar] [CrossRef]

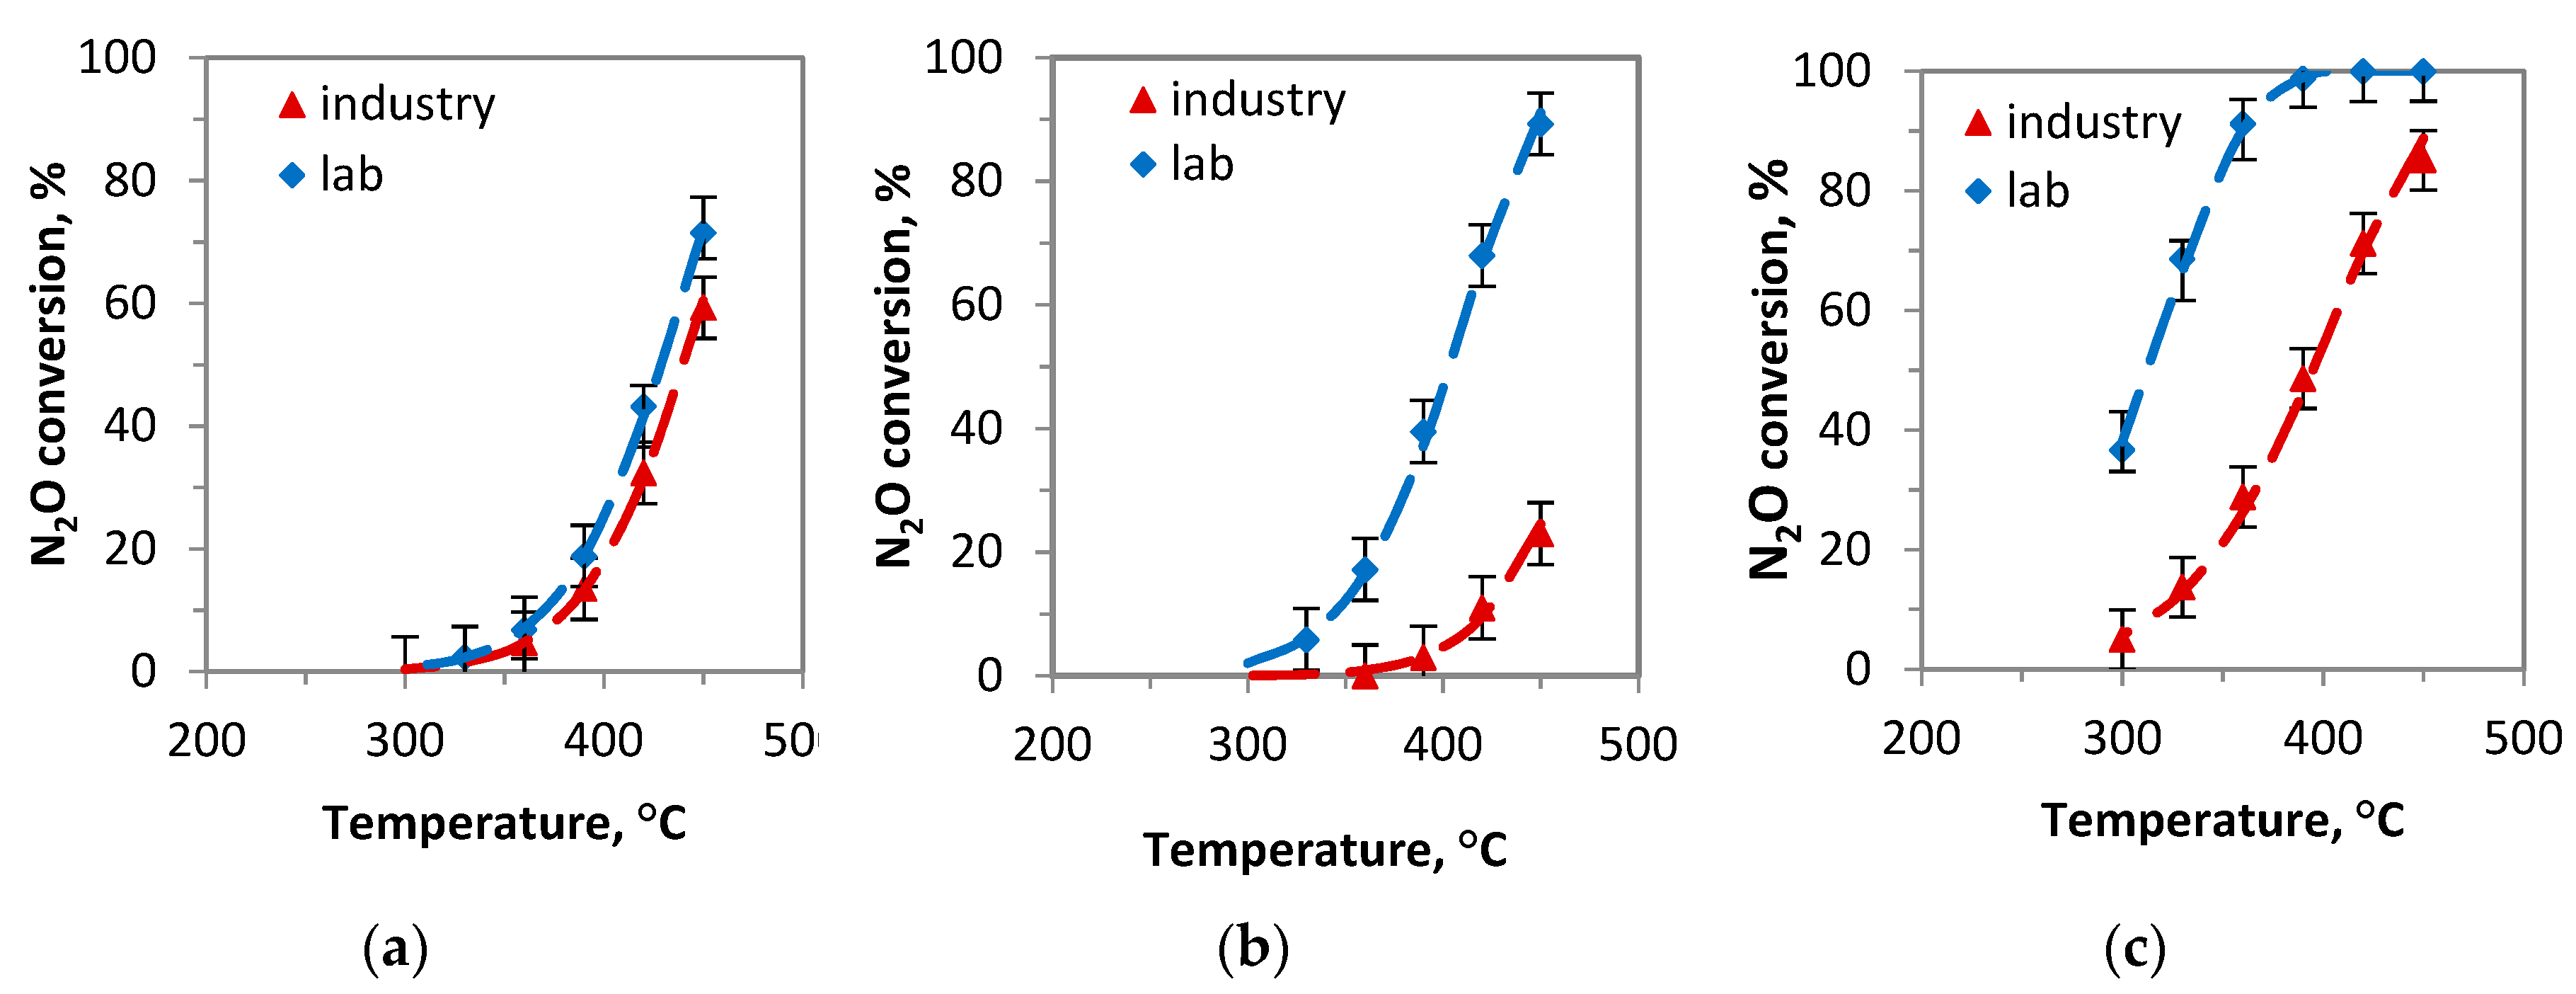

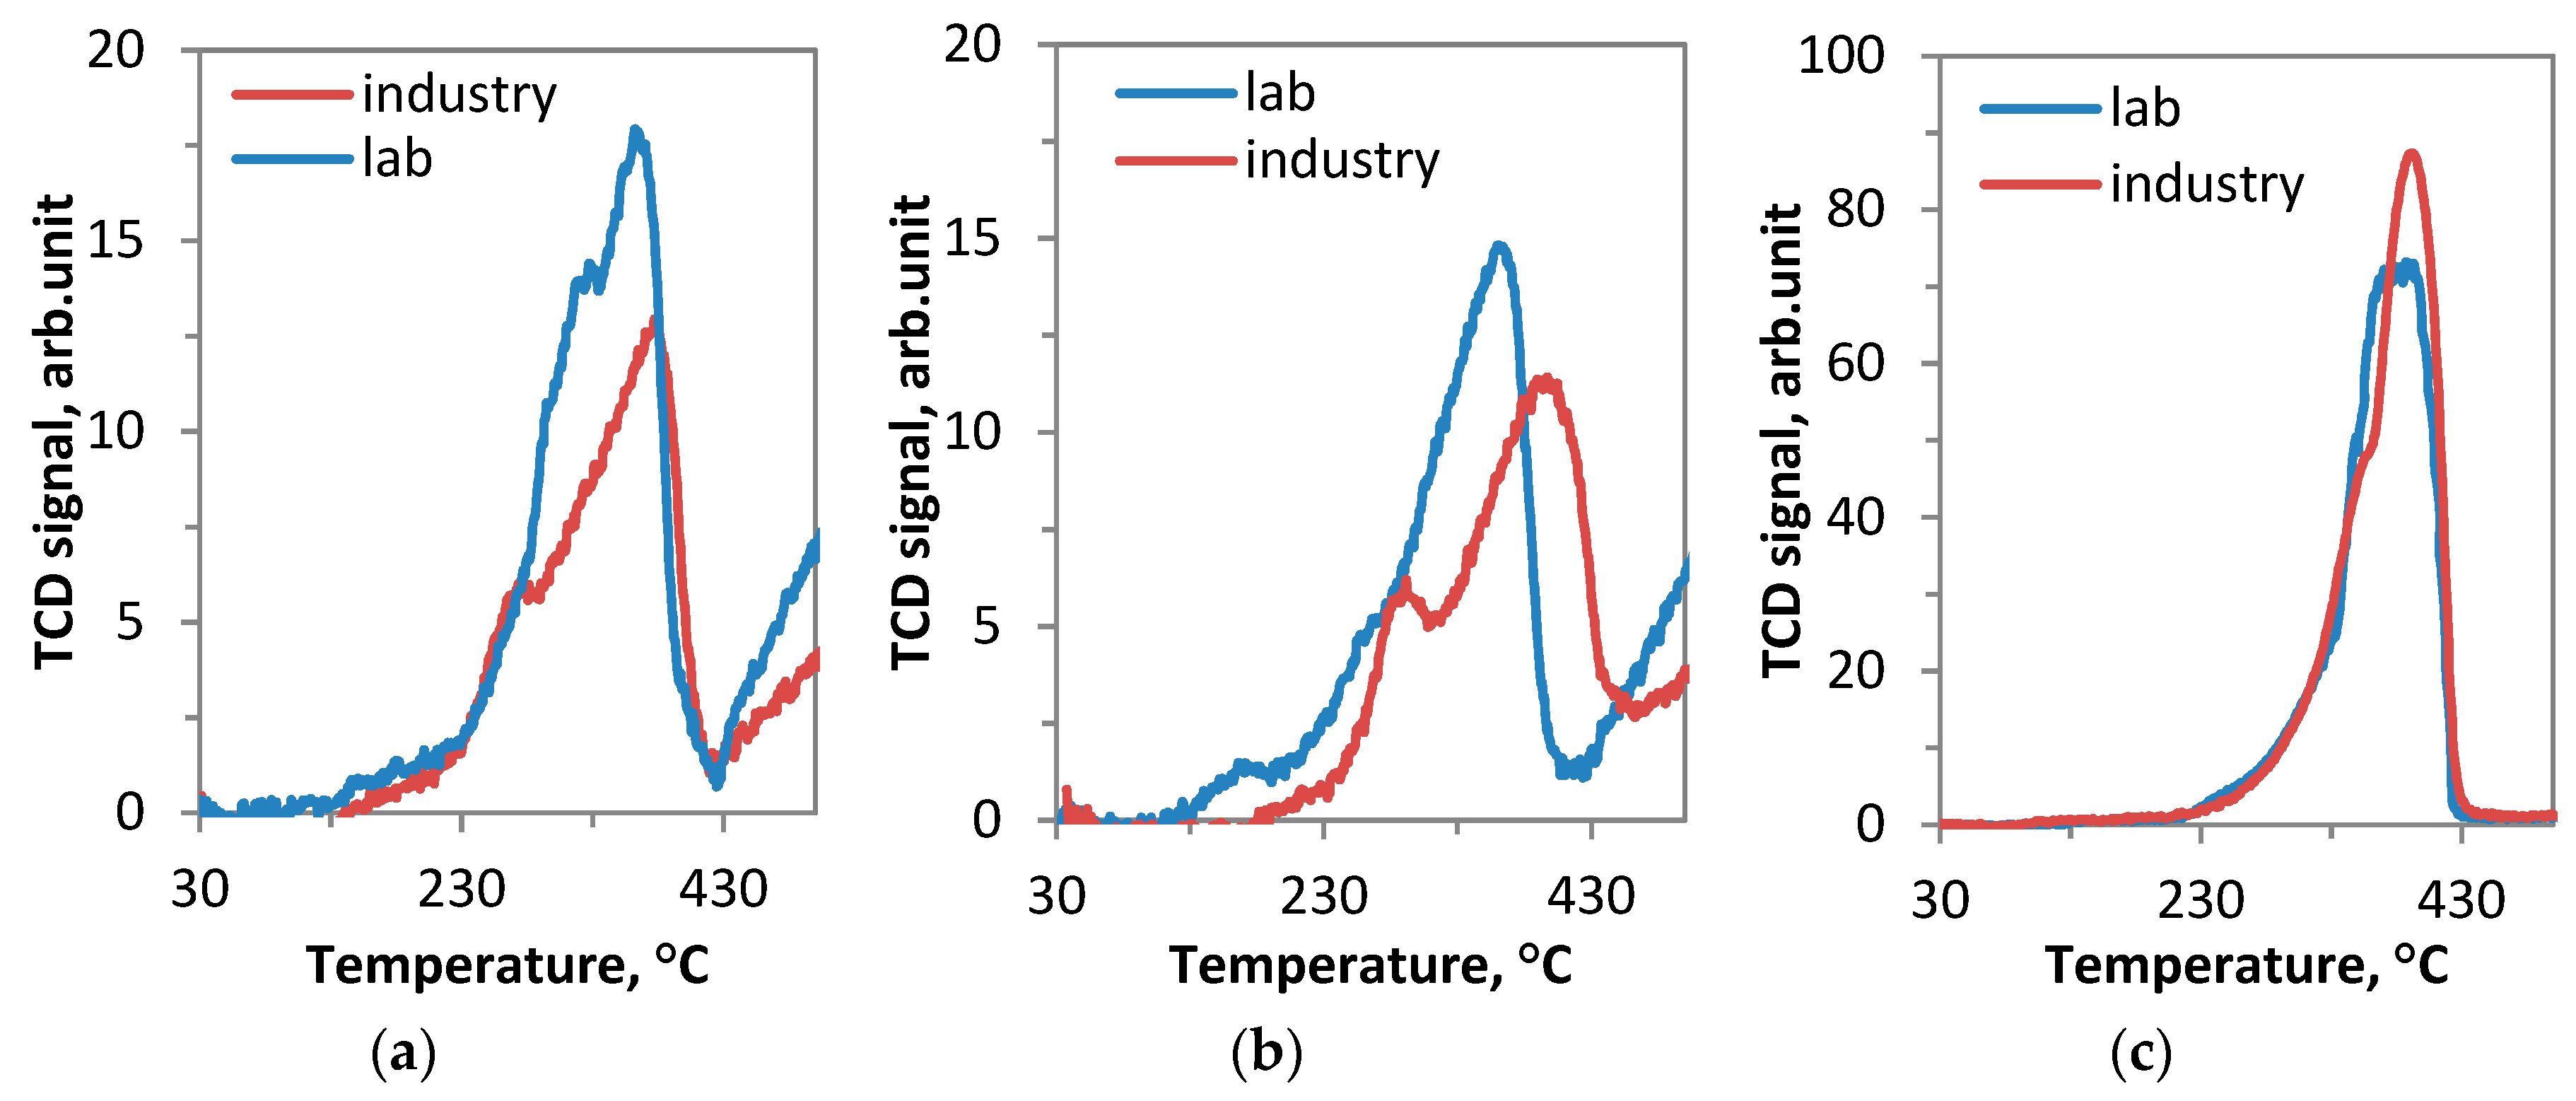
 Laboratory prepared catalysts. (a) 450 °C, GHSV = 20,000 l kg−1 h −1,
  K/Co4MnAlOx-industry; (b) 390 °C, GHSV = 60,000 l kg−1 h −1,
  Cs/Co4MnAlOx-industry; (c) 330 °C, GHSV = 60,000 l kg−1 h −1,
  Cs/Co3O4-industry.
Laboratory prepared catalysts. (a) 450 °C, GHSV = 20,000 l kg−1 h −1, K/Co4MnAlOx-industry; (b) 390 °C, GHSV = 60,000 l kg−1 h −1, Cs/Co4MnAlOx-industry; (c) 330 °C, GHSV = 60,000 l kg−1 h −1, Cs/Co3O4-industry.
Cs/Co3O4-industry.
Laboratory prepared catalysts. (a) 450 °C, GHSV = 20,000 l kg−1 h −1, K/Co4MnAlOx-industry; (b) 390 °C, GHSV = 60,000 l kg−1 h −1, Cs/Co4MnAlOx-industry; (c) 330 °C, GHSV = 60,000 l kg−1 h −1, Cs/Co3O4-industry.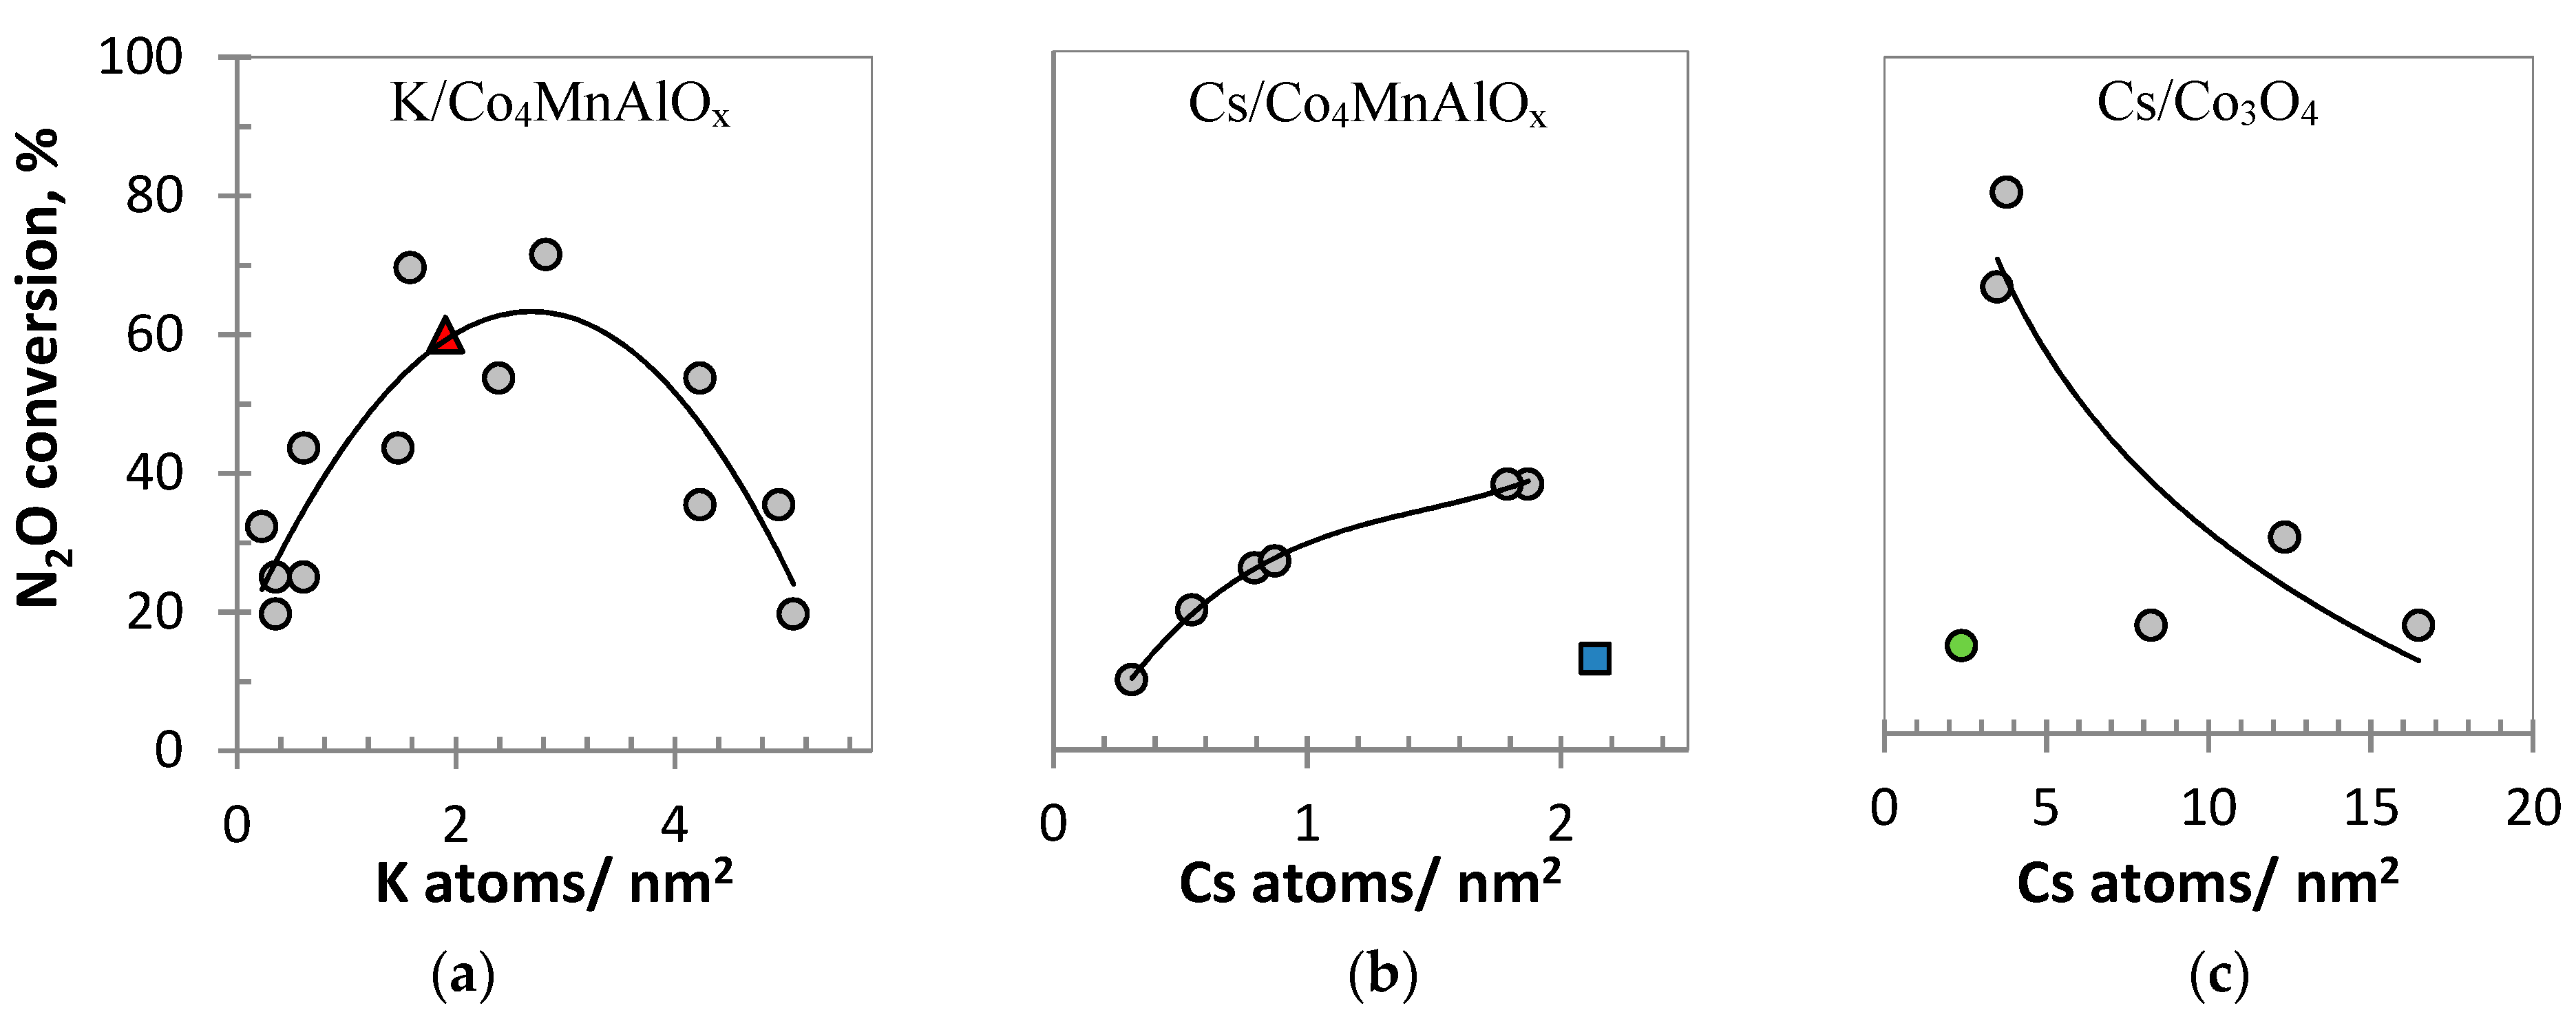 K/Co4MnAlOx-industry; Cs/Co4MnAlOx-industry; Cs/Co3O4-industry.
K/Co4MnAlOx-industry; Cs/Co4MnAlOx-industry; Cs/Co3O4-industry.
K/Co4MnAlOx-industry; Cs/Co4MnAlOx-industry; Cs/Co3O4-industry.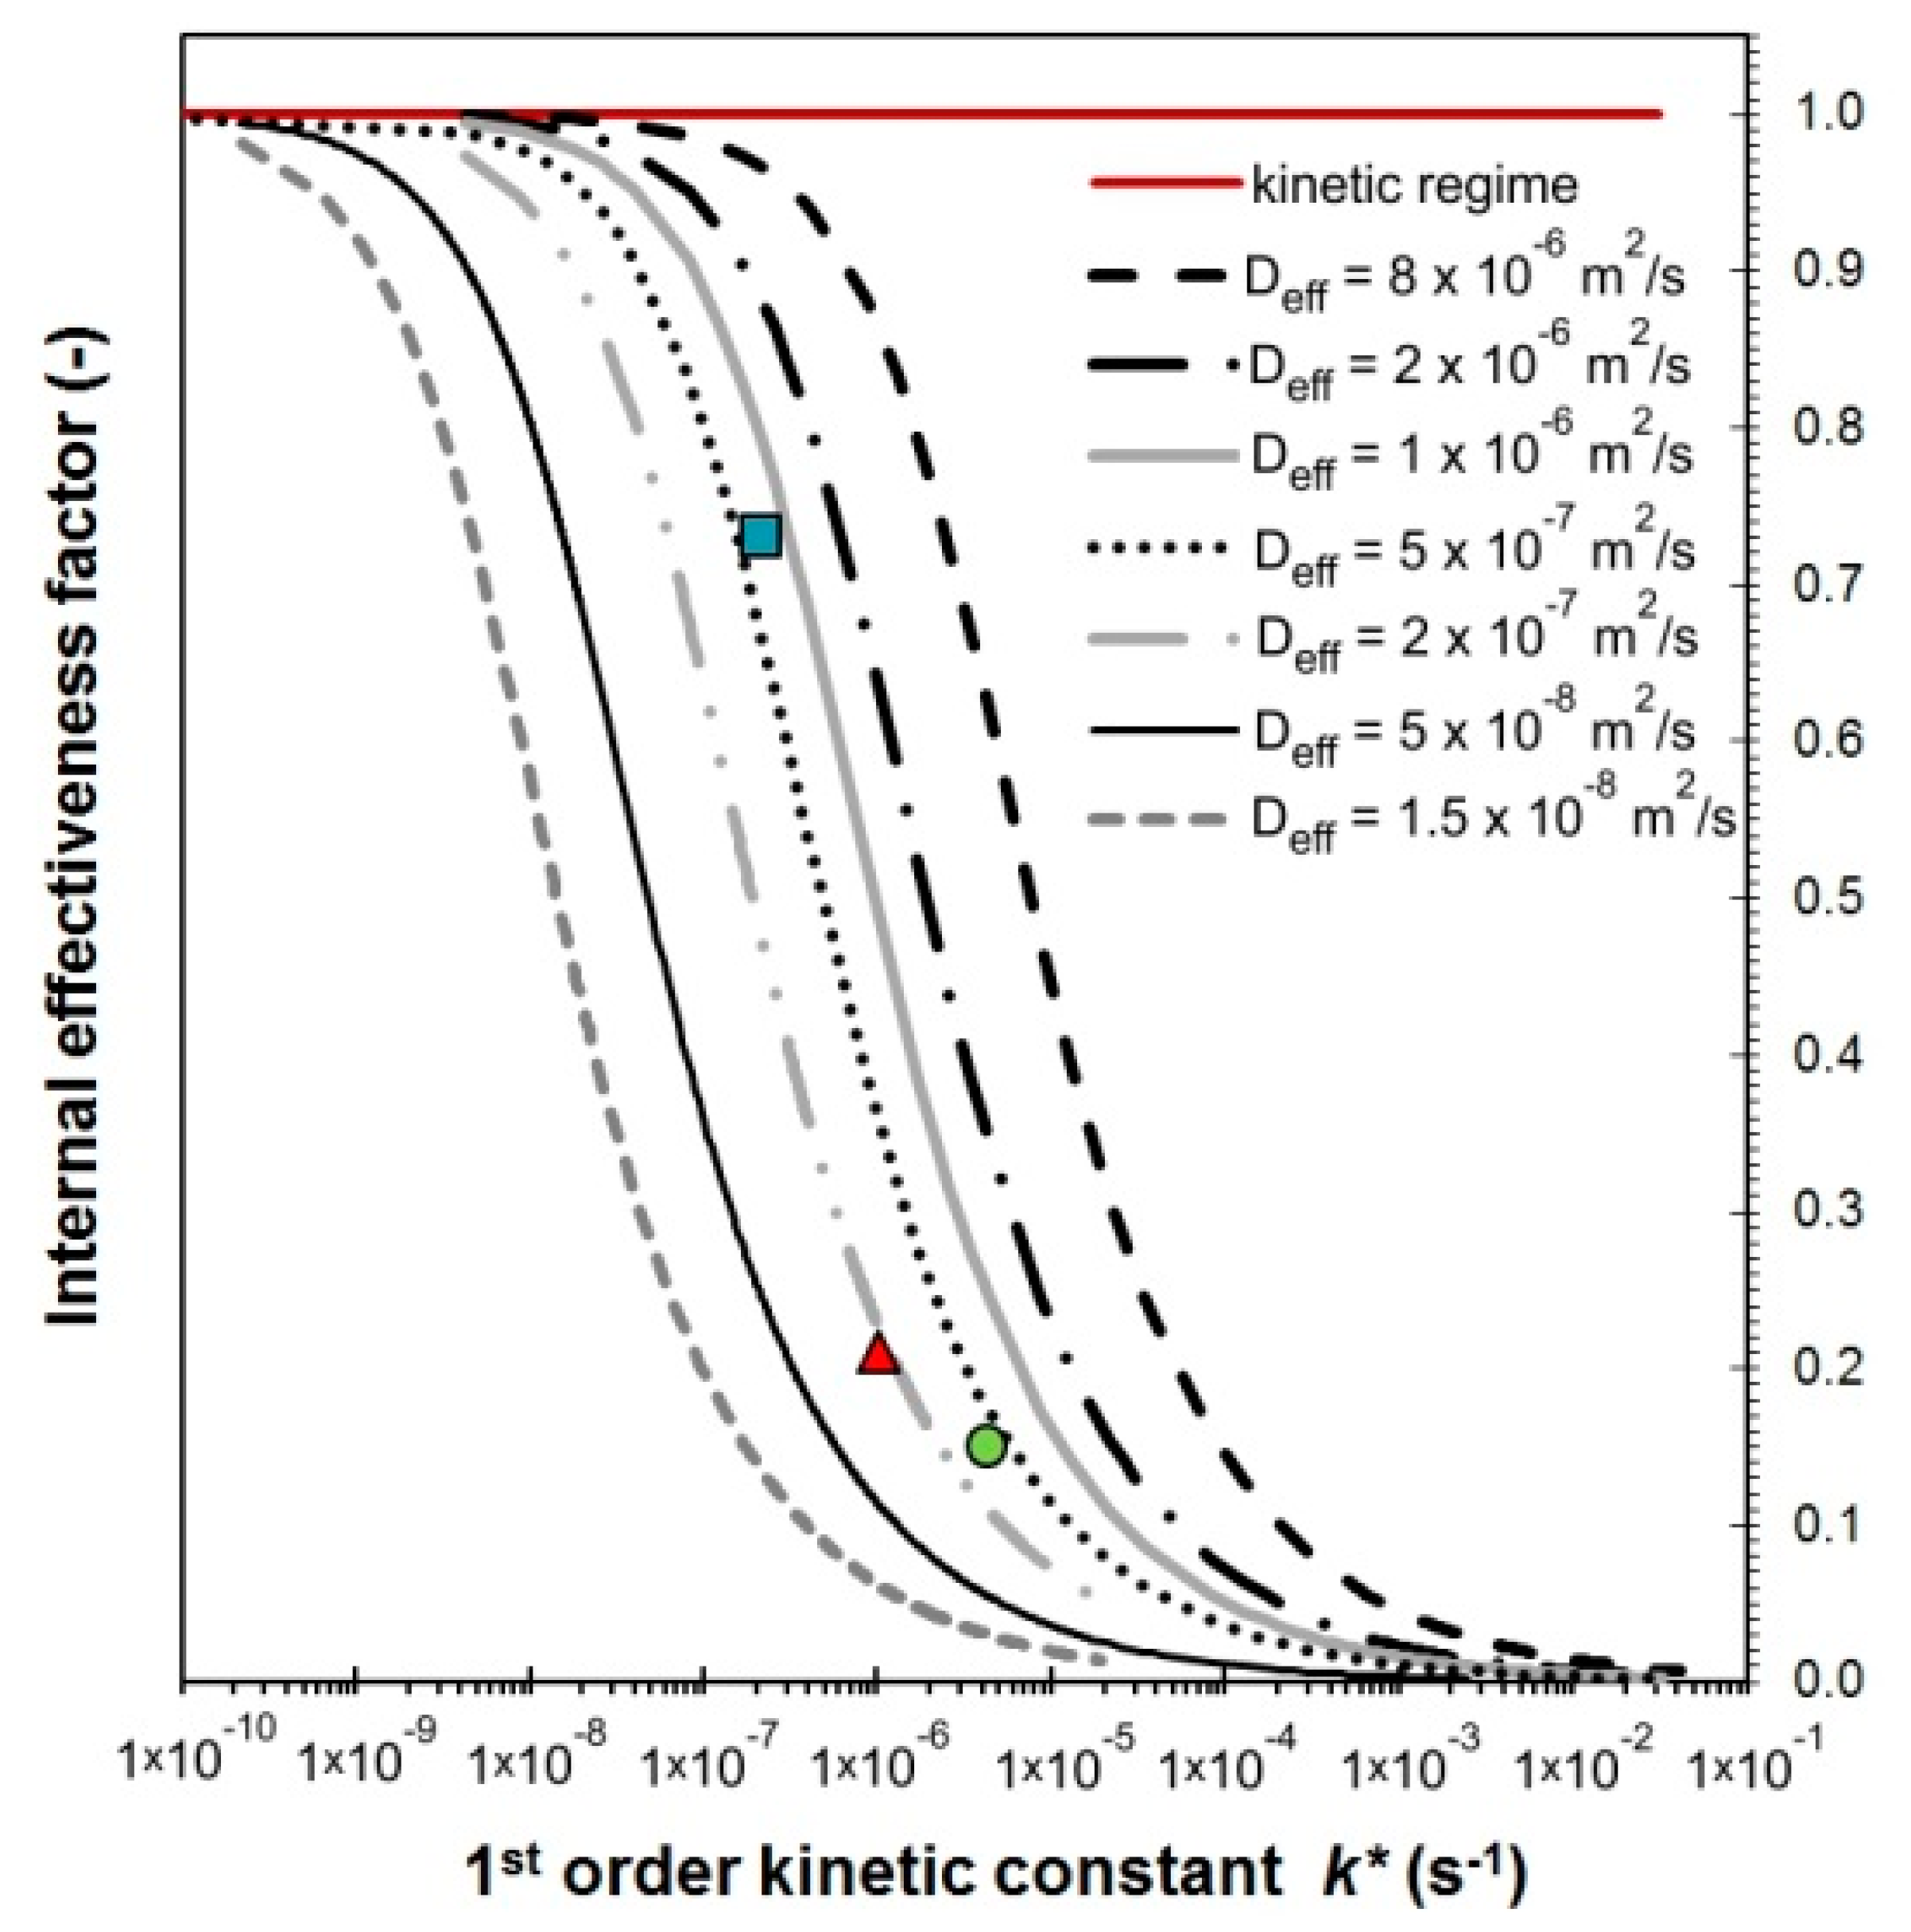 K/Co4MnAlOx-industry; Cs/Co4MnAlOx-industry; Cs/Co3O4-industry.
K/Co4MnAlOx-industry; Cs/Co4MnAlOx-industry; Cs/Co3O4-industry.
K/Co4MnAlOx-industry; Cs/Co4MnAlOx-industry; Cs/Co3O4-industry.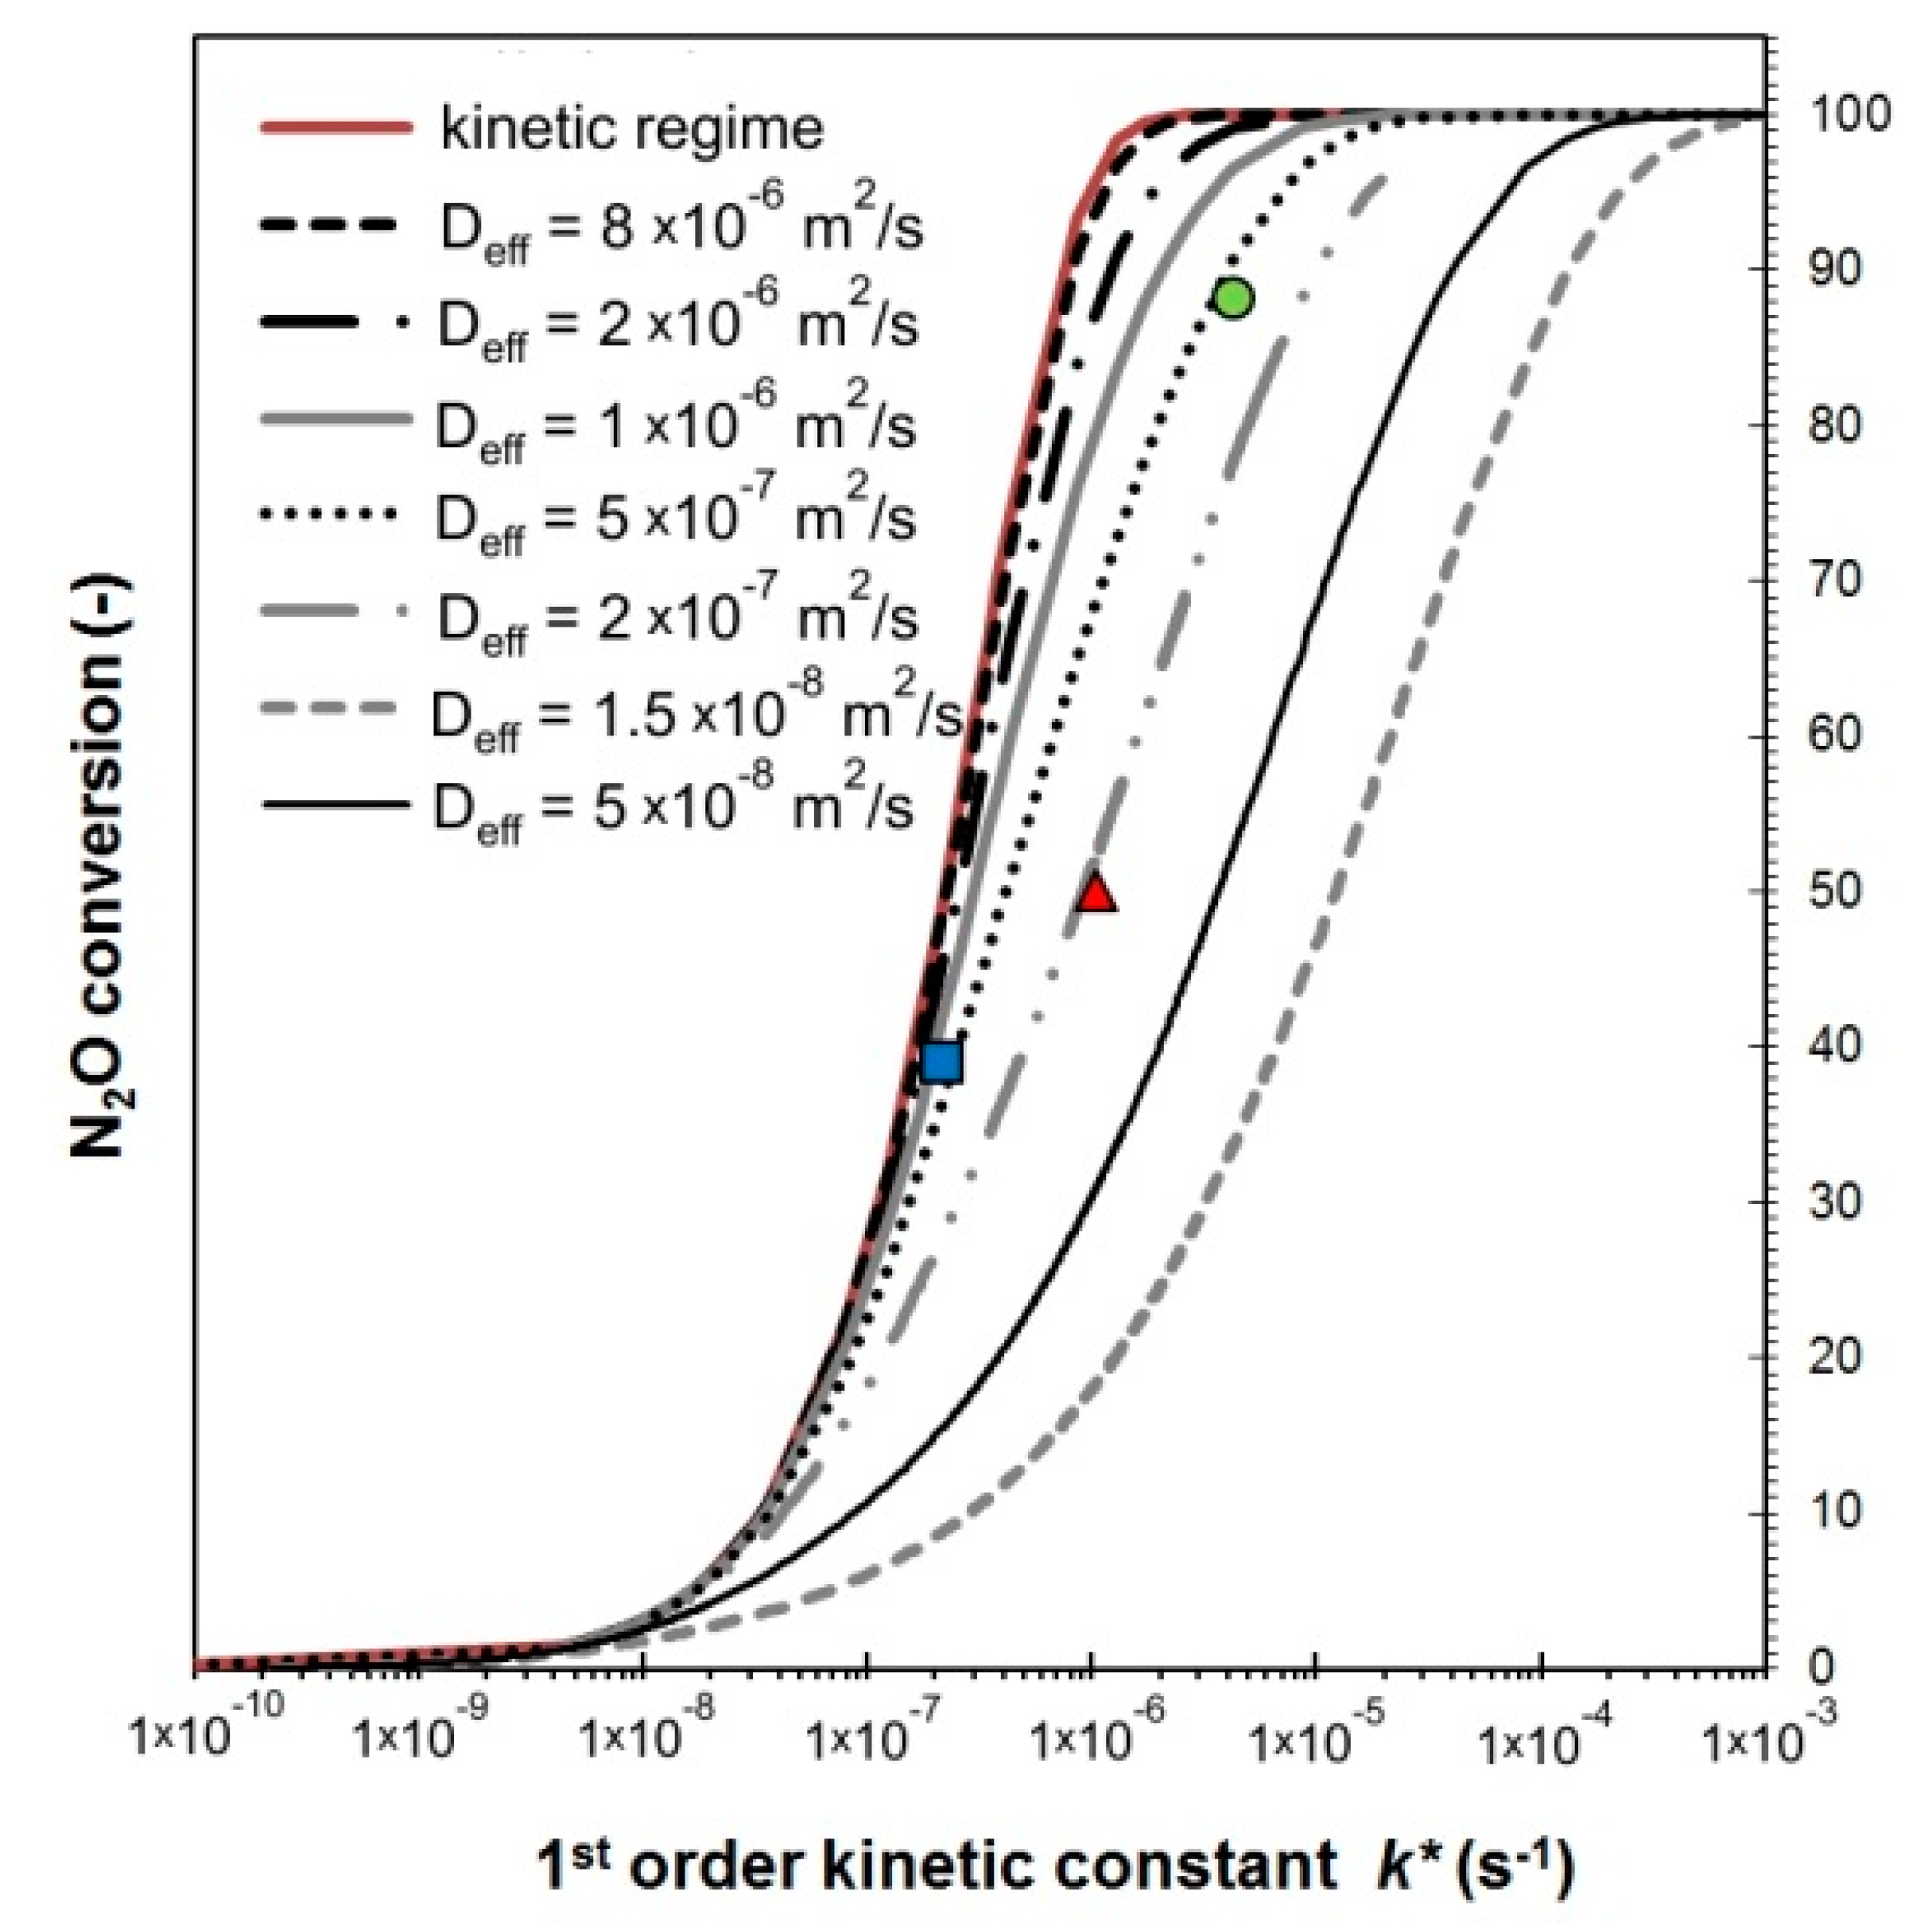

| Parameter/Catalyst | K/Co4MnAlOx | Cs/Co4MnAlOx | Cs/Co3O4 | |||
|---|---|---|---|---|---|---|
| Lab | Industry | Lab | Industry | Lab | Industry | |
| kgrain (m3 kg−1s−1) × 103 | 3.47 | 2.42 | 8.38 | 0.51 | 73.15 | 11.09 |
| kgrain* (s−1) × 106 1 | 1.51 | 1.05 | 3.54 | 0.22 | 28.24 | 4.28 |
| kpellet (m3 kg−1 s−1) × 103 | - | 0.47 | - | 0.37 | - | 1.32 |
| rgrain (mol kg−1h−1) × 102 | - | 3.37 | - | 0.75 | - | 12.12 |
| rpellet (mol kg−1 h−1) × 102 | - | 0.70 | - | 0.55 | - | 1.90 |
| η (-) 2 | - | 0.21 | - | 0.73 | - | 0.15 |
| K/Co4MnAlOx | Cs/Co4MnAlOx | Cs/Co3O4 | |||||
|---|---|---|---|---|---|---|---|
| Industry | Lab | Industry | Lab | Industry | Lab | ||
| Chemical composition (wt%) | Co | 45 | 49.6 | 45.7 | 46.0 | 63.4 | 68.0 |
| Mn | 9.3 | 13.3 | 8.5 | 10.6 | - | - | |
| Al | 5.2 | 8.9 | 5.1 | n.d. | - | - | |
| K/Cs | 1.3 | 1.8 | 3.4 | 3.5 | 1.0 | 1.0 | |
| Na | 0.1 | 0.1 | 0.1 | 0.5 | n.d. | 0.04 | |
| Co:Mn:Al mol. ratio | 4 : 0.7 : 0.7 | 4 : 1.2 : 1.6 | 4 : 0.9 : 1.0 | 4 : 1 : n.d. | - | - | |
| SBET (m2/g) | 93 | 98 | 68 | 86 | 20 | 13 | |
| r (nm) 1 | 3.8 | 12.3 | 5.3 | 7.1 | 10.2 | 13.5 | |
| Alkali metal normalized loading (atoms/nm2) 2 | 1.9 | 2.8 | 2.1 | 1.8 | 2.4 | 3.5 | |
| Phase composition | Spinel, graphite | Spinel | Spinel, graphite | Spinel | Spinel, graphite | Spinel | |
| Lc (nm) | 9 | 7 | 13 | 7 | 18 | 49 | |
| a (nm) | 0.8118 | 0.8110 | 0.8111 | 0.8116 | 0.8084 | 0.8086 | |
| Tmax (°C) 3 | 272; 377 | 320; 361 | 284; 390 | 168; 274; 359 | 352; 389 | 370 | |
| H2 (mmol/g) 4 | 4.5 | 4.8 | 4.2 | 4.1 | 14 | 12.9 | |
| Catalyst | SBET (m2/g) | Vnet (cm3liq/g) | Pore widthmax (nm) | ρc (kg m-3) | εp (-) |
|---|---|---|---|---|---|
| K/Co4MnAlOx-industry | 101 | 0.220 | 15 | 2300 | 0.48 |
| Cs/Co4MnAlOx-industry | 73 | 0.217 | 22 | 2370 | 0.50 |
| Cs/Co3O4-industry | 19 | 0.138 | above 75 | 2590 | 0.47 |
| Parameter/Catalyst | K/Co4MnAlOx-Industry | Cs/Co4MnAlOx-Industry | Cs/Co3O4-Industry |
|---|---|---|---|
| Dk (m2 s−1) | 2.82·10−6 | 4.14·10−6 | 1.41·10−5 |
| Dmol (m2 s−1) | 7·10−3 | 7·10−3 | 7·10−3 |
| (m2 s−1) | 2.82·10−6 | 4.14·10−6 | 1.41·10−5 |
| Deff (m2 s−1) 1 | 2·10−7 | 7.5·10−7 | 3.5·10−7 |
| model (%) 2 | 50 | 39 | 85 |
| experiment (%) 3 | 50 | 48 | 88 |
| q4 (-) | 6.78 | 2.76 | 18.92 |
| εp/q (-) | 0.07 | 0.18 | 0.02 |
© 2019 by the authors. Licensee MDPI, Basel, Switzerland. This article is an open access article distributed under the terms and conditions of the Creative Commons Attribution (CC BY) license (http://creativecommons.org/licenses/by/4.0/).
Share and Cite
Obalová, L.; Klegova, A.; Matějová, L.; Pacultová, K.; Fridrichová, D. Must the Best Laboratory Prepared Catalyst Also Be the Best in an Operational Application? Catalysts 2019, 9, 160. https://doi.org/10.3390/catal9020160
Obalová L, Klegova A, Matějová L, Pacultová K, Fridrichová D. Must the Best Laboratory Prepared Catalyst Also Be the Best in an Operational Application? Catalysts. 2019; 9(2):160. https://doi.org/10.3390/catal9020160
Chicago/Turabian StyleObalová, Lucie, Anna Klegova, Lenka Matějová, Kateřina Pacultová, and Dagmar Fridrichová. 2019. "Must the Best Laboratory Prepared Catalyst Also Be the Best in an Operational Application?" Catalysts 9, no. 2: 160. https://doi.org/10.3390/catal9020160
APA StyleObalová, L., Klegova, A., Matějová, L., Pacultová, K., & Fridrichová, D. (2019). Must the Best Laboratory Prepared Catalyst Also Be the Best in an Operational Application? Catalysts, 9(2), 160. https://doi.org/10.3390/catal9020160