Article

Phase Controlled Synthesis of Pt Doped Co Nanoparticle Composites Using a Metal-Organic Framework for Fischer–Tropsch Catalysis

1
Department of Nanochemistry, Gachon University, Sungnam 13120, Korea
2
Neutron Science Division, Korea Atomic Energy Research Institute, Daejeon 34057, Korea
*
Authors to whom correspondence should be addressed.
Both authors contributed equally to this work
Catalysts 2019, 9(2), 156; https://doi.org/10.3390/catal9020156
Submission received: 15 January 2019 / Revised: 29 January 2019 / Accepted: 30 January 2019 / Published: 5 February 2019
(This article belongs to the Special Issue Synthesis and Application of Zeolite Catalysts)

Abstract

:
Recently, metal nanoparticles embedded in porous carbon composite materials have been playing a significant role in a variety of fields as catalyst supports, sensors, absorbents, and in energy storage. Porous carbon composite materials can be prepared using various synthetic methods; recent efforts provide a facile way to prepare the composites from metal-organic frameworks (MOFs) by pyrolysis. However, it is usually difficult to control the phase of metal or metal oxides during the synthetic process. Among many types of MOF, recently, cobalt-based MOFs have attracted attention due to their unique catalytic and magnetic properties. Herein, we report the synthesis of a Pt doped cobalt based MOF, which is subsequently converted into cobalt nanoparticle-embedded porous carbon composites (Pt@Co/C) via pyrolysis. Interestingly, the phase of the cobalt metal nanoparticles (face centered cubic (FCC) or hexagonal closest packing (HCP)) can be controlled by tuning the synthetic conditions, including the temperature, duration time, and dosage of the reducing agent (NaBH4). The Pt doped Co/C was characterized using various techniques including PXRD (powder X-ray diffraction), XPS (X-ray photoelectron spectroscopy), gas sorption analysis, TEM (transmission electron microscopy), and SEM (scanning electron microscopy). The composite was applied as a phase transfer catalyst (PTC). The Fischer-Tropsch catalytic activity of the Pt@Co/C (10:1:2.4) composite shows 35% CO conversion under a very low pressure of syngas (1 MPa). This is one of the best reported conversion rates at low pressure. The 35% CO conversion leads to the generation of various hydrocarbons (C1, C2–C4, C5, and waxes). This catalyst may also prove useful for energy and environmental applications.

1. Introduction

Due to the extreme demand for fossil fuels, research on the conversion of carbon dioxide and methane to fossil fuels is one of the hottest topics [1]. This process generates fuels, while simultaneously decreasing the greenhouse effect of the gases in the environment [2]. However, while experiments to produce saturated hydrocarbons directly using carbon dioxide or methane are currently underway, thus far, only saturated lower hydrocarbons have been produced. [3]. Recently, the coal to liquid process (CTL) has drawn attention [4,5]. The CTL process has been performed in many ways, among which one of the most important is the Fischer-Tropsch synthesis (FTS). The Fischer Tropsch process effects the conversion of syngas into a variety of fuels including liquid hydrocarbons, diesel, naphtha, and gasoline, via the catalytic pathway:
FTS: CO + 2H2 → (CH2)n + H2O
FTS has become the most frequently used method to combat the fuel crisis worldwide [6]. The most active metals for FTS are Co, Fe, and Ru, among which Ru has high activity in FTS. However, for commercial use, it has some disadvantages including the high price, and scarcity [7,8,9]. In the case of Fe, the selectivity is low, and it is easily oxidized as it has less stability towards hydrocarbons [10,11,12]. Cobalt-based catalysts produce high molecular weight hydrocarbons (waxes) with high selectivity and high FTS catalytic activity for the formation of linear paraffins, compared with those of other active catalysts [13]. FTS catalytic activity depends on available metal active sites for catalytic interaction to extend the percentage of metal reduction [14,15]. The most effective size for the catalytic nanoparticles is in the range of 6 to 8 nanometers, which provides many active sites. Moreover, cobalt-based catalysts are low in price, and have high CO2 emissions and high selectivity, which make cobalt one of the most widely used catalysts for FTS [16]. In addition, trace amount of metals such as Pt and Ru have been used to increase the rate of reaction and lower the reduction temperature [17,18,19,20]. Moreover, porous carbon acts as an FTS promoter.
MOFs have high surface areas, porosities, and crystallinities, and a variety of applications, in gas adsorption, catalysis, sensor development, drug delivery, and luminescence have been actively developed [21,22,23,24,25]. In the past, Al2O3 or SiO2 were used as a support in Fischer-Tropsch catalysis. Currently, FTS studies are being carried out using carbon supports, such as graphene, carbon nanotubes, and graphene oxides [26,27,28,29]. The most challenging aspect of the FTS process using metal-organic structures is that the structures are easily deformed by water, which causes the structures to change or collapse. To overcome this drawback, experiments have been conducted to carbonize MOFs, which generates metal nanoparticles in the interstitial spaces of porous composites.
For heterogeneous catalysis, carbon-supported cobalt-based materials have scarcely been reported. The carbonization of Co-MOFs provides catalysts, which are superior to conventional catalysts, as all the cobalt centers in the MOF structure can be reduced to metallic Co [30], and since cobalt has a relatively low molecular weight, it is easily dispersed on surfaces [31,32,33]. However, previously reported cobalt-based materials have been in the FCC phase rather than the HCP phase. In the HCP phase, CO molecules can more readily bind to and dissociate from the Co center than in the FCC phase. This indicates that catalysts containing cobalt in the HCP are more effective in the FTS process [34,35].
In this study, we have developed a Co-based metal organic framework in the HCP phase. The cobalt-based catalyst can be readily prepared by the carbonization of the MOF Co2(bdc)2(dabco). To produce the highly active porous sites, we embedded platinum into the Co-MOF precursor and then carbonized the resulting material, to afford the Pt doped Co/C nanocomposite. Subsequently, we investigated the transition of the cobalt phase from FCC to HCP using a variety of synthetic conditions. This transition is very important for the FTS process as it generates active metallic cobalt nanoparticles from the Co2O intermediate, in the HCP phase [36]. From the experimental results, the conversion of carbon monoxide (CO) was determined to be approximately 35%. To the best of our knowledge, this is one of the best conversion values reported, even though the reaction was carried out under very low pressure, at 1 MPa of syngas. Additionally, the investigation was carried out using other metal-based nanocomposites such as Pt@Ni2(bdc)2(dabco) and Pt@Zn2(bdc)2(dabco), in order to understand the influence of the metal in the FT catalysis.

2. Results

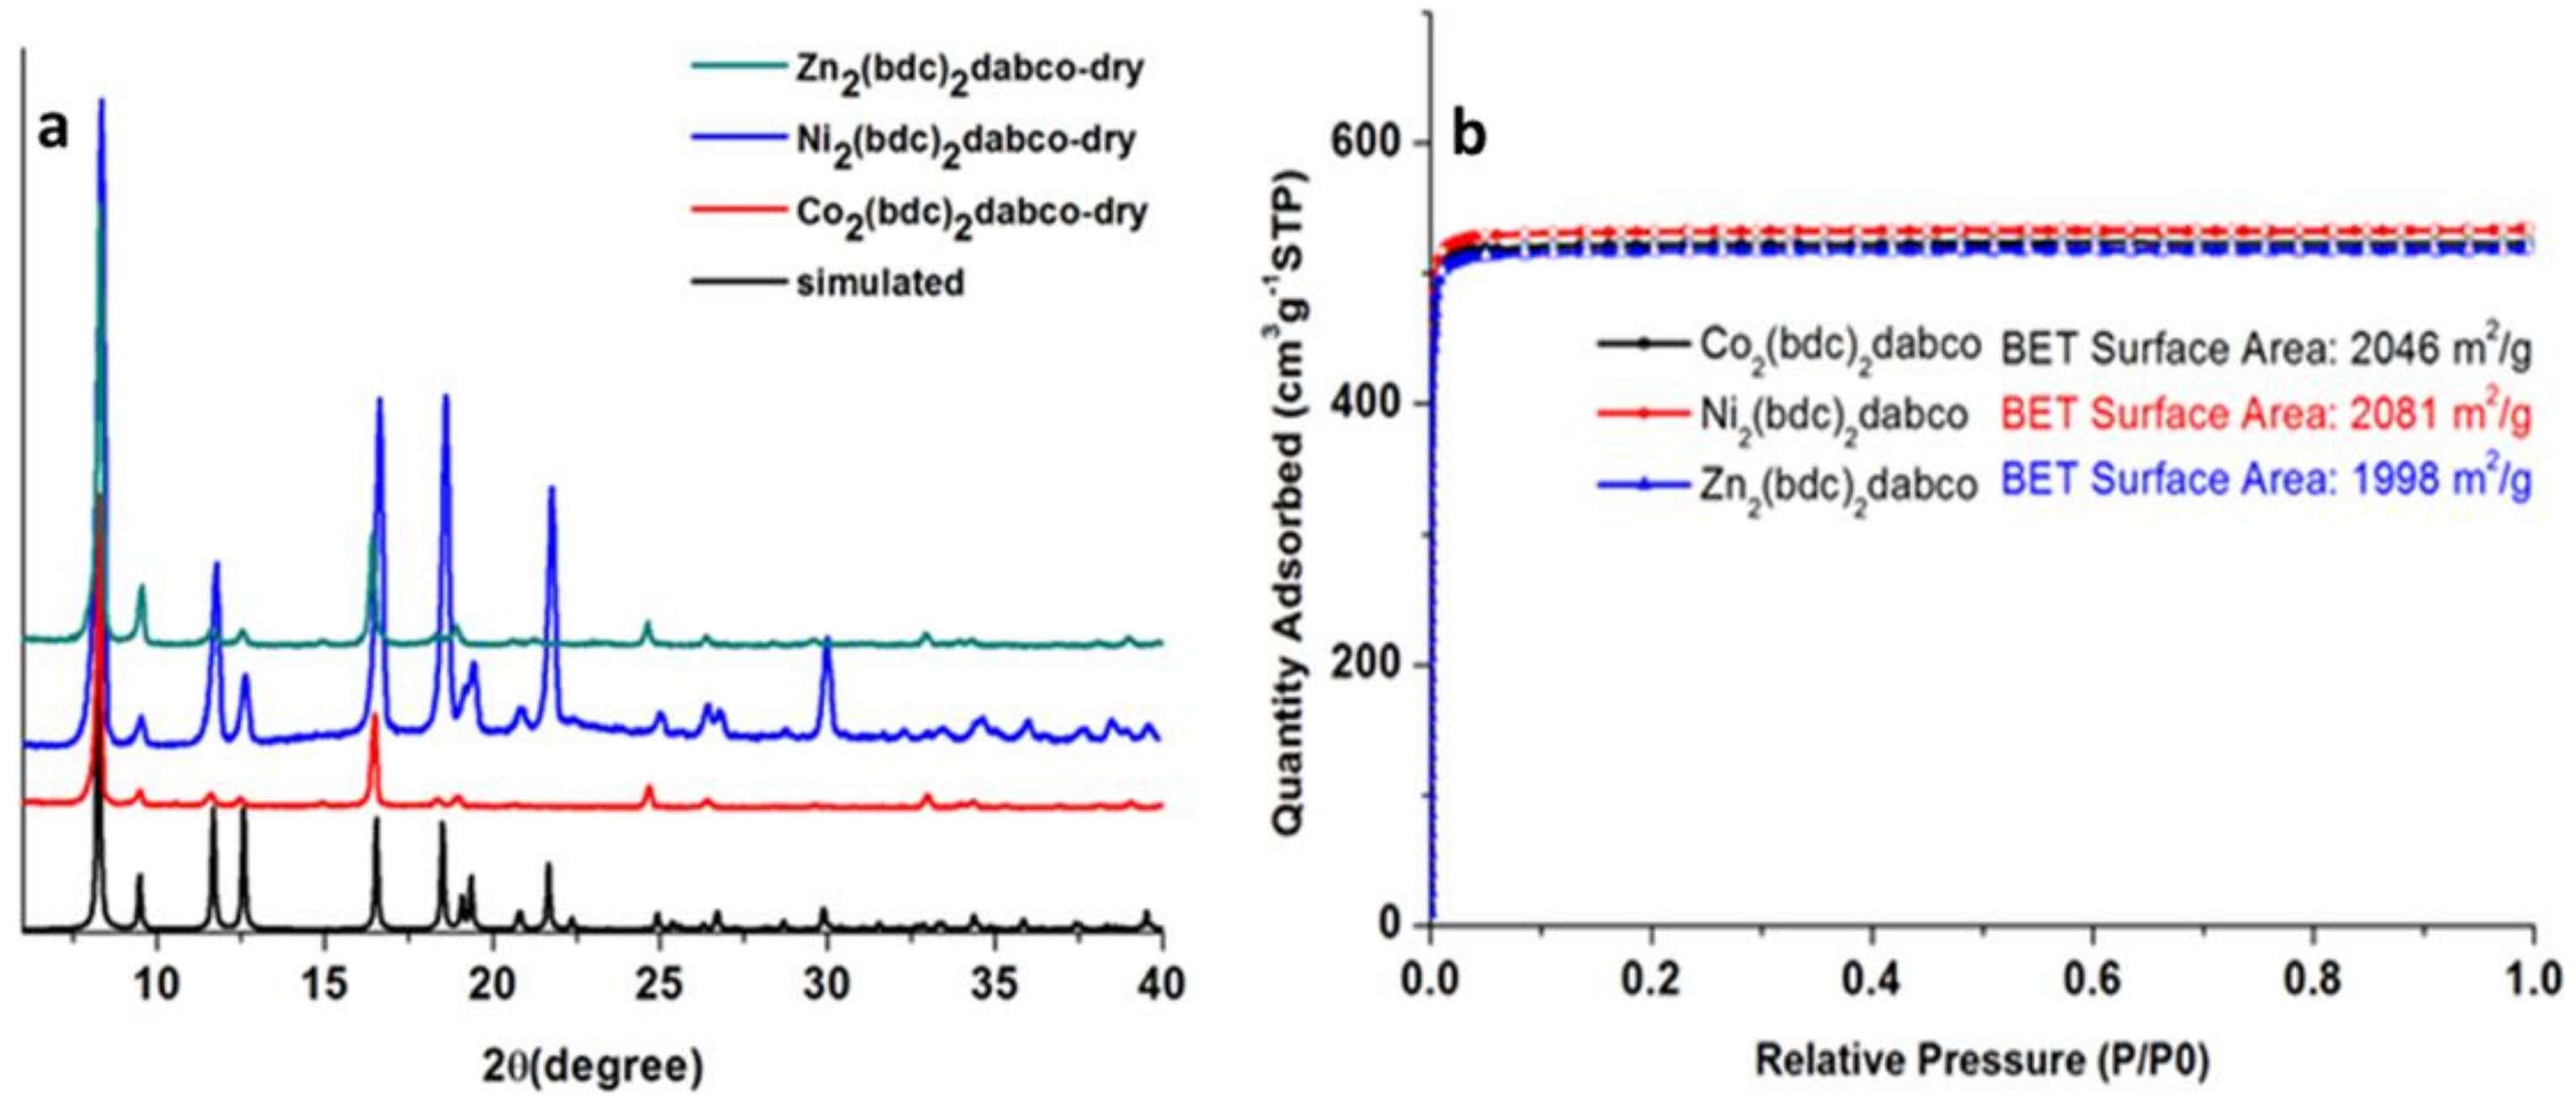
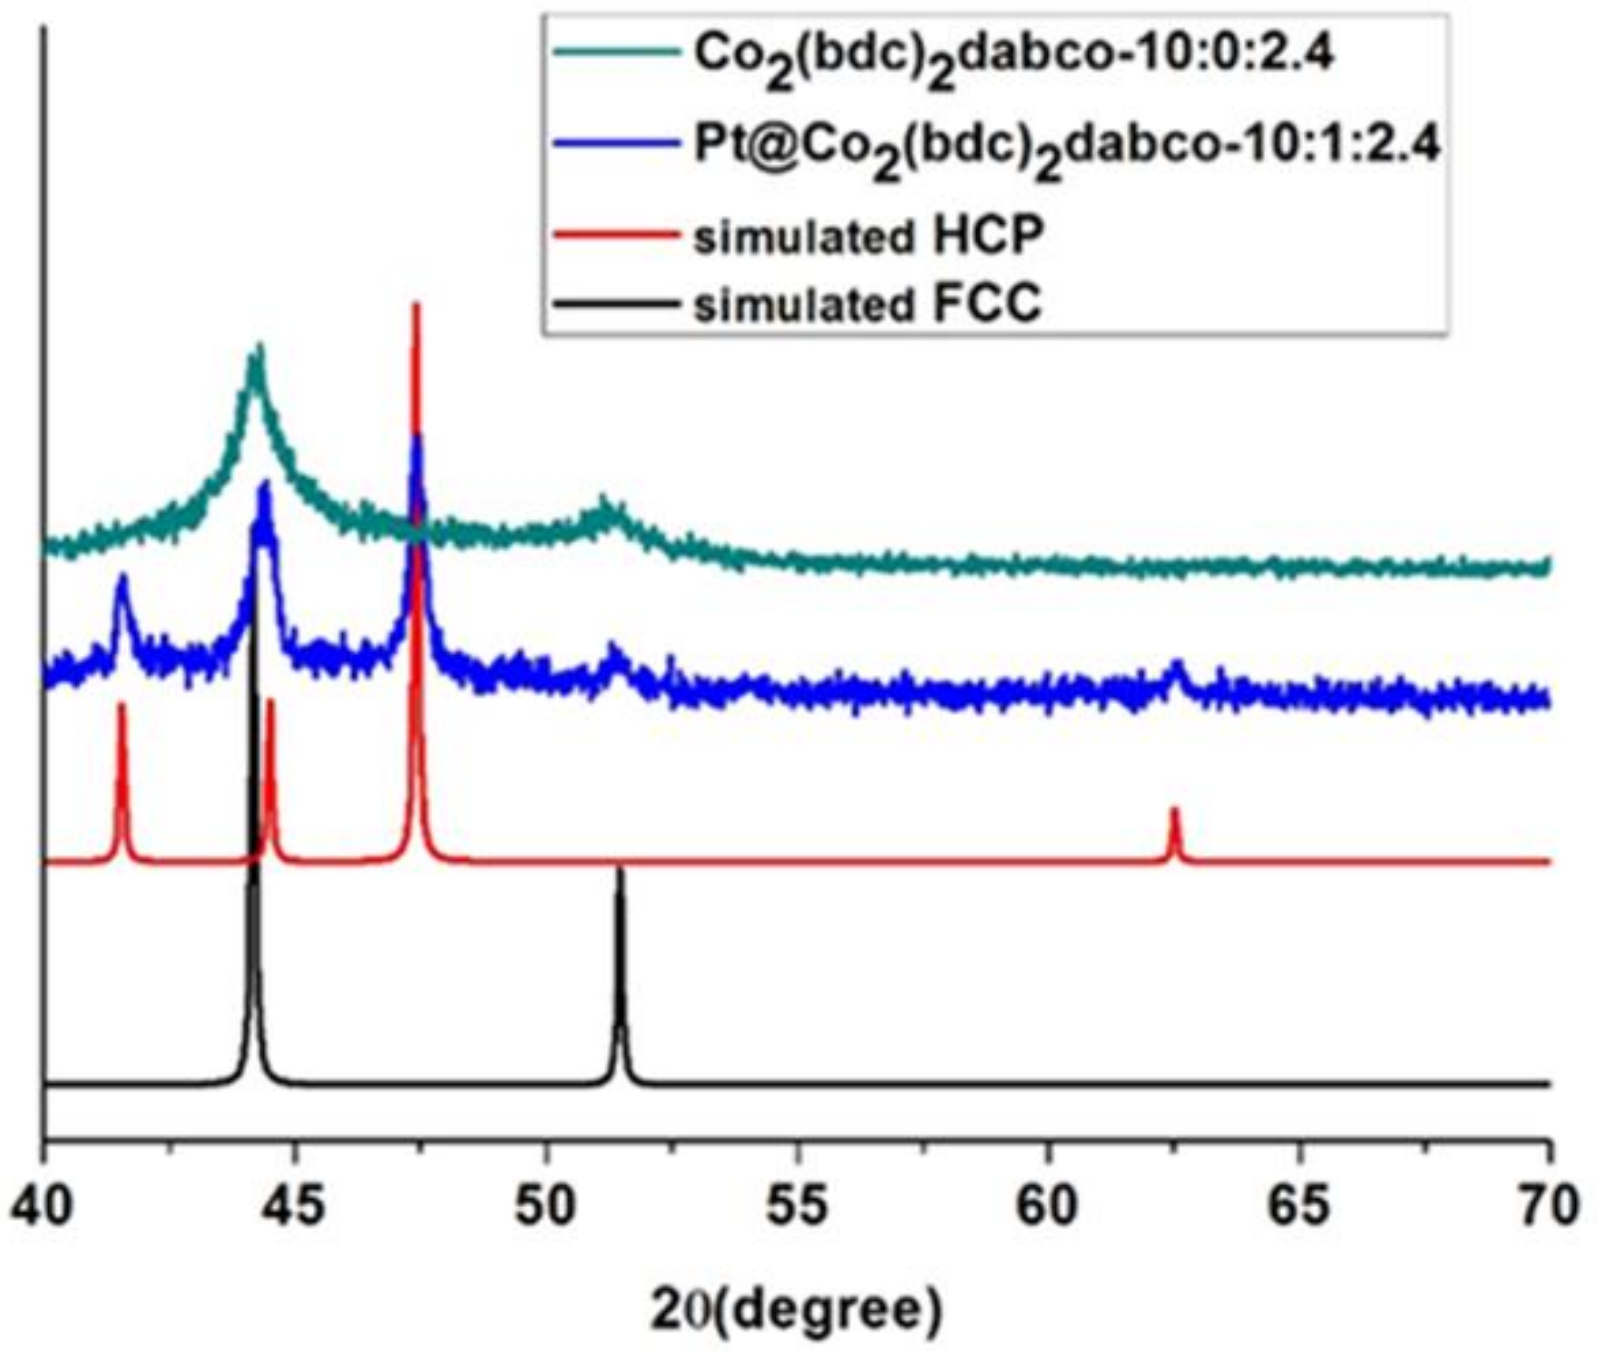
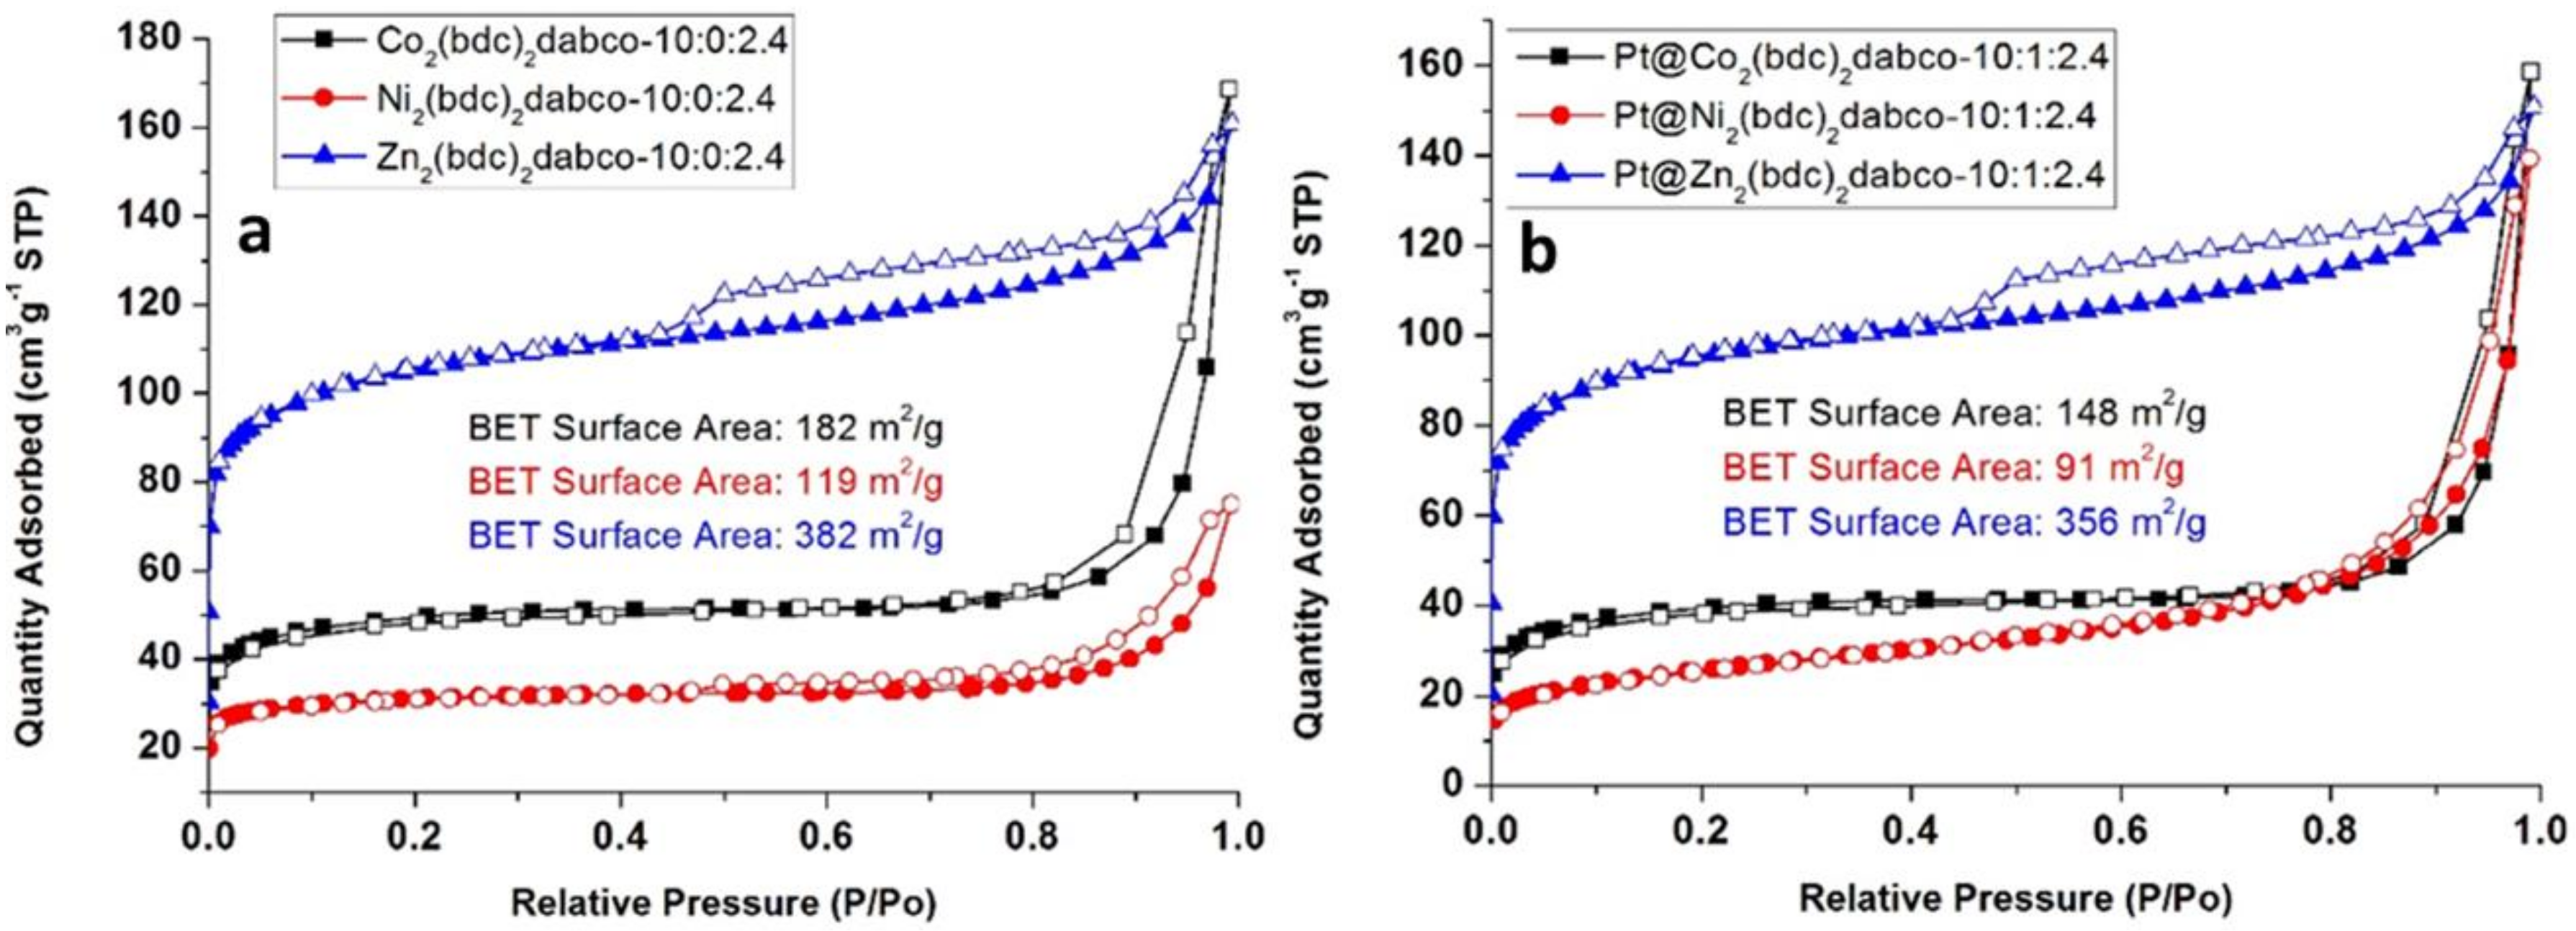
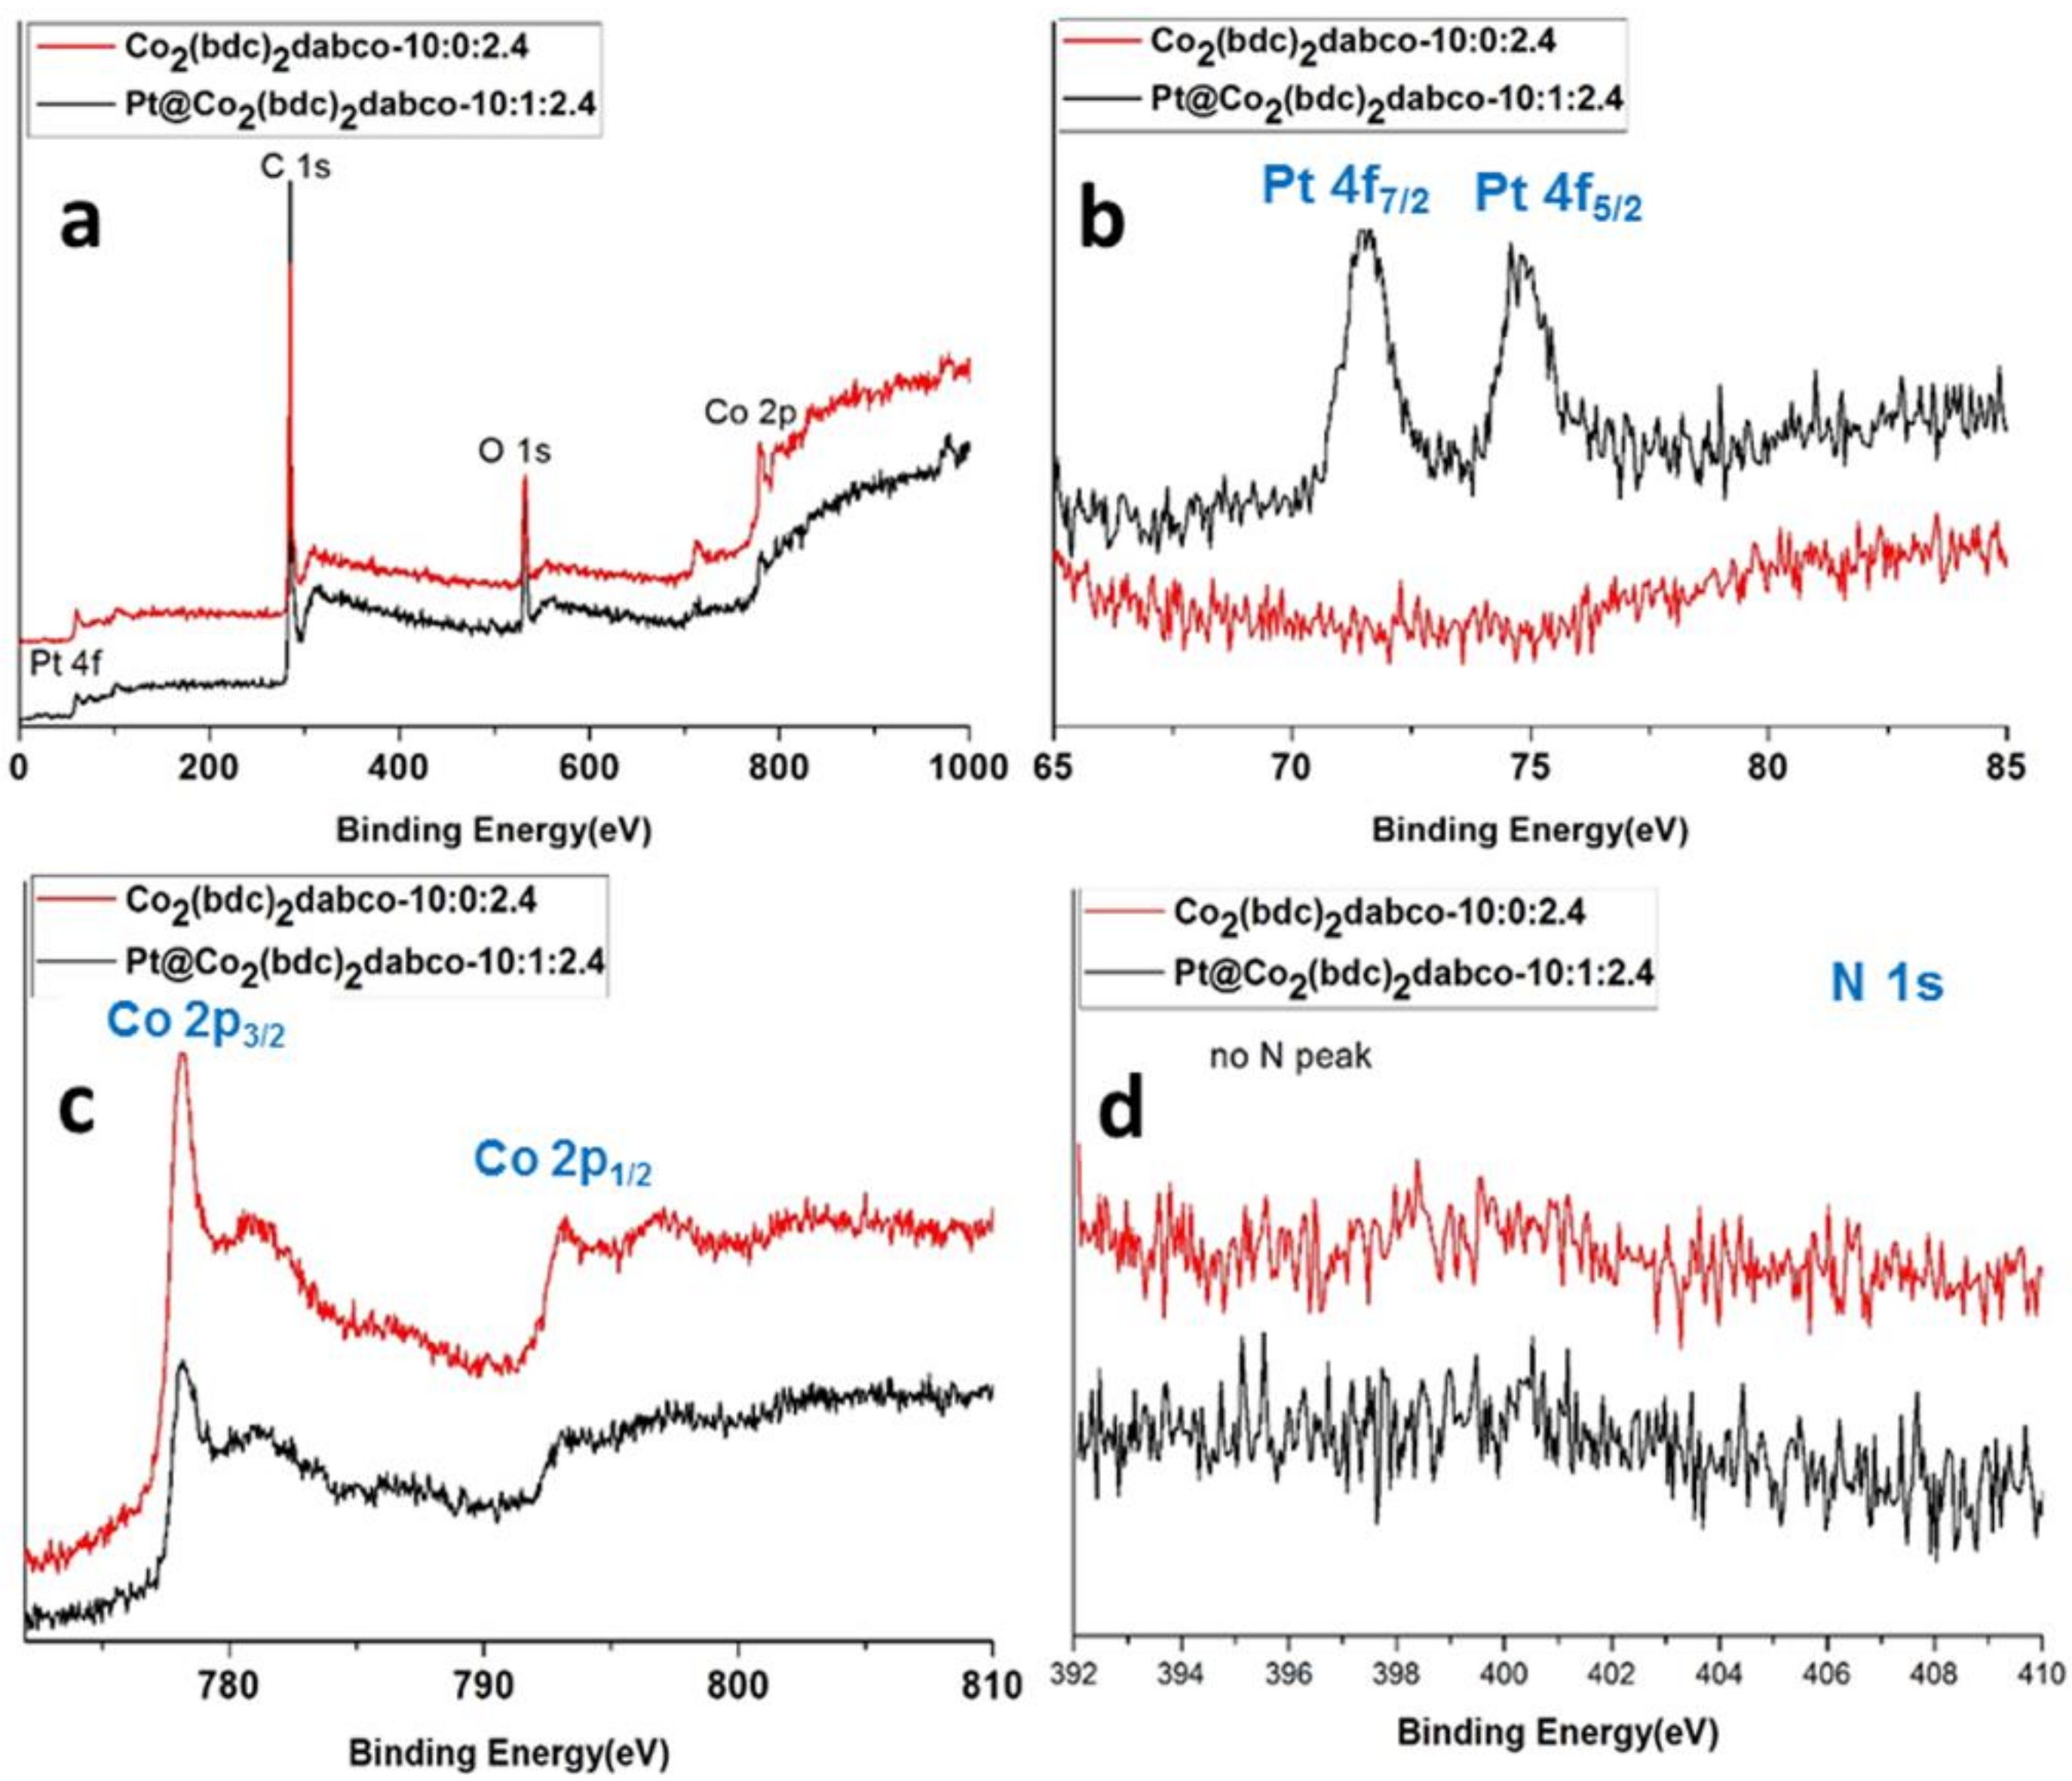
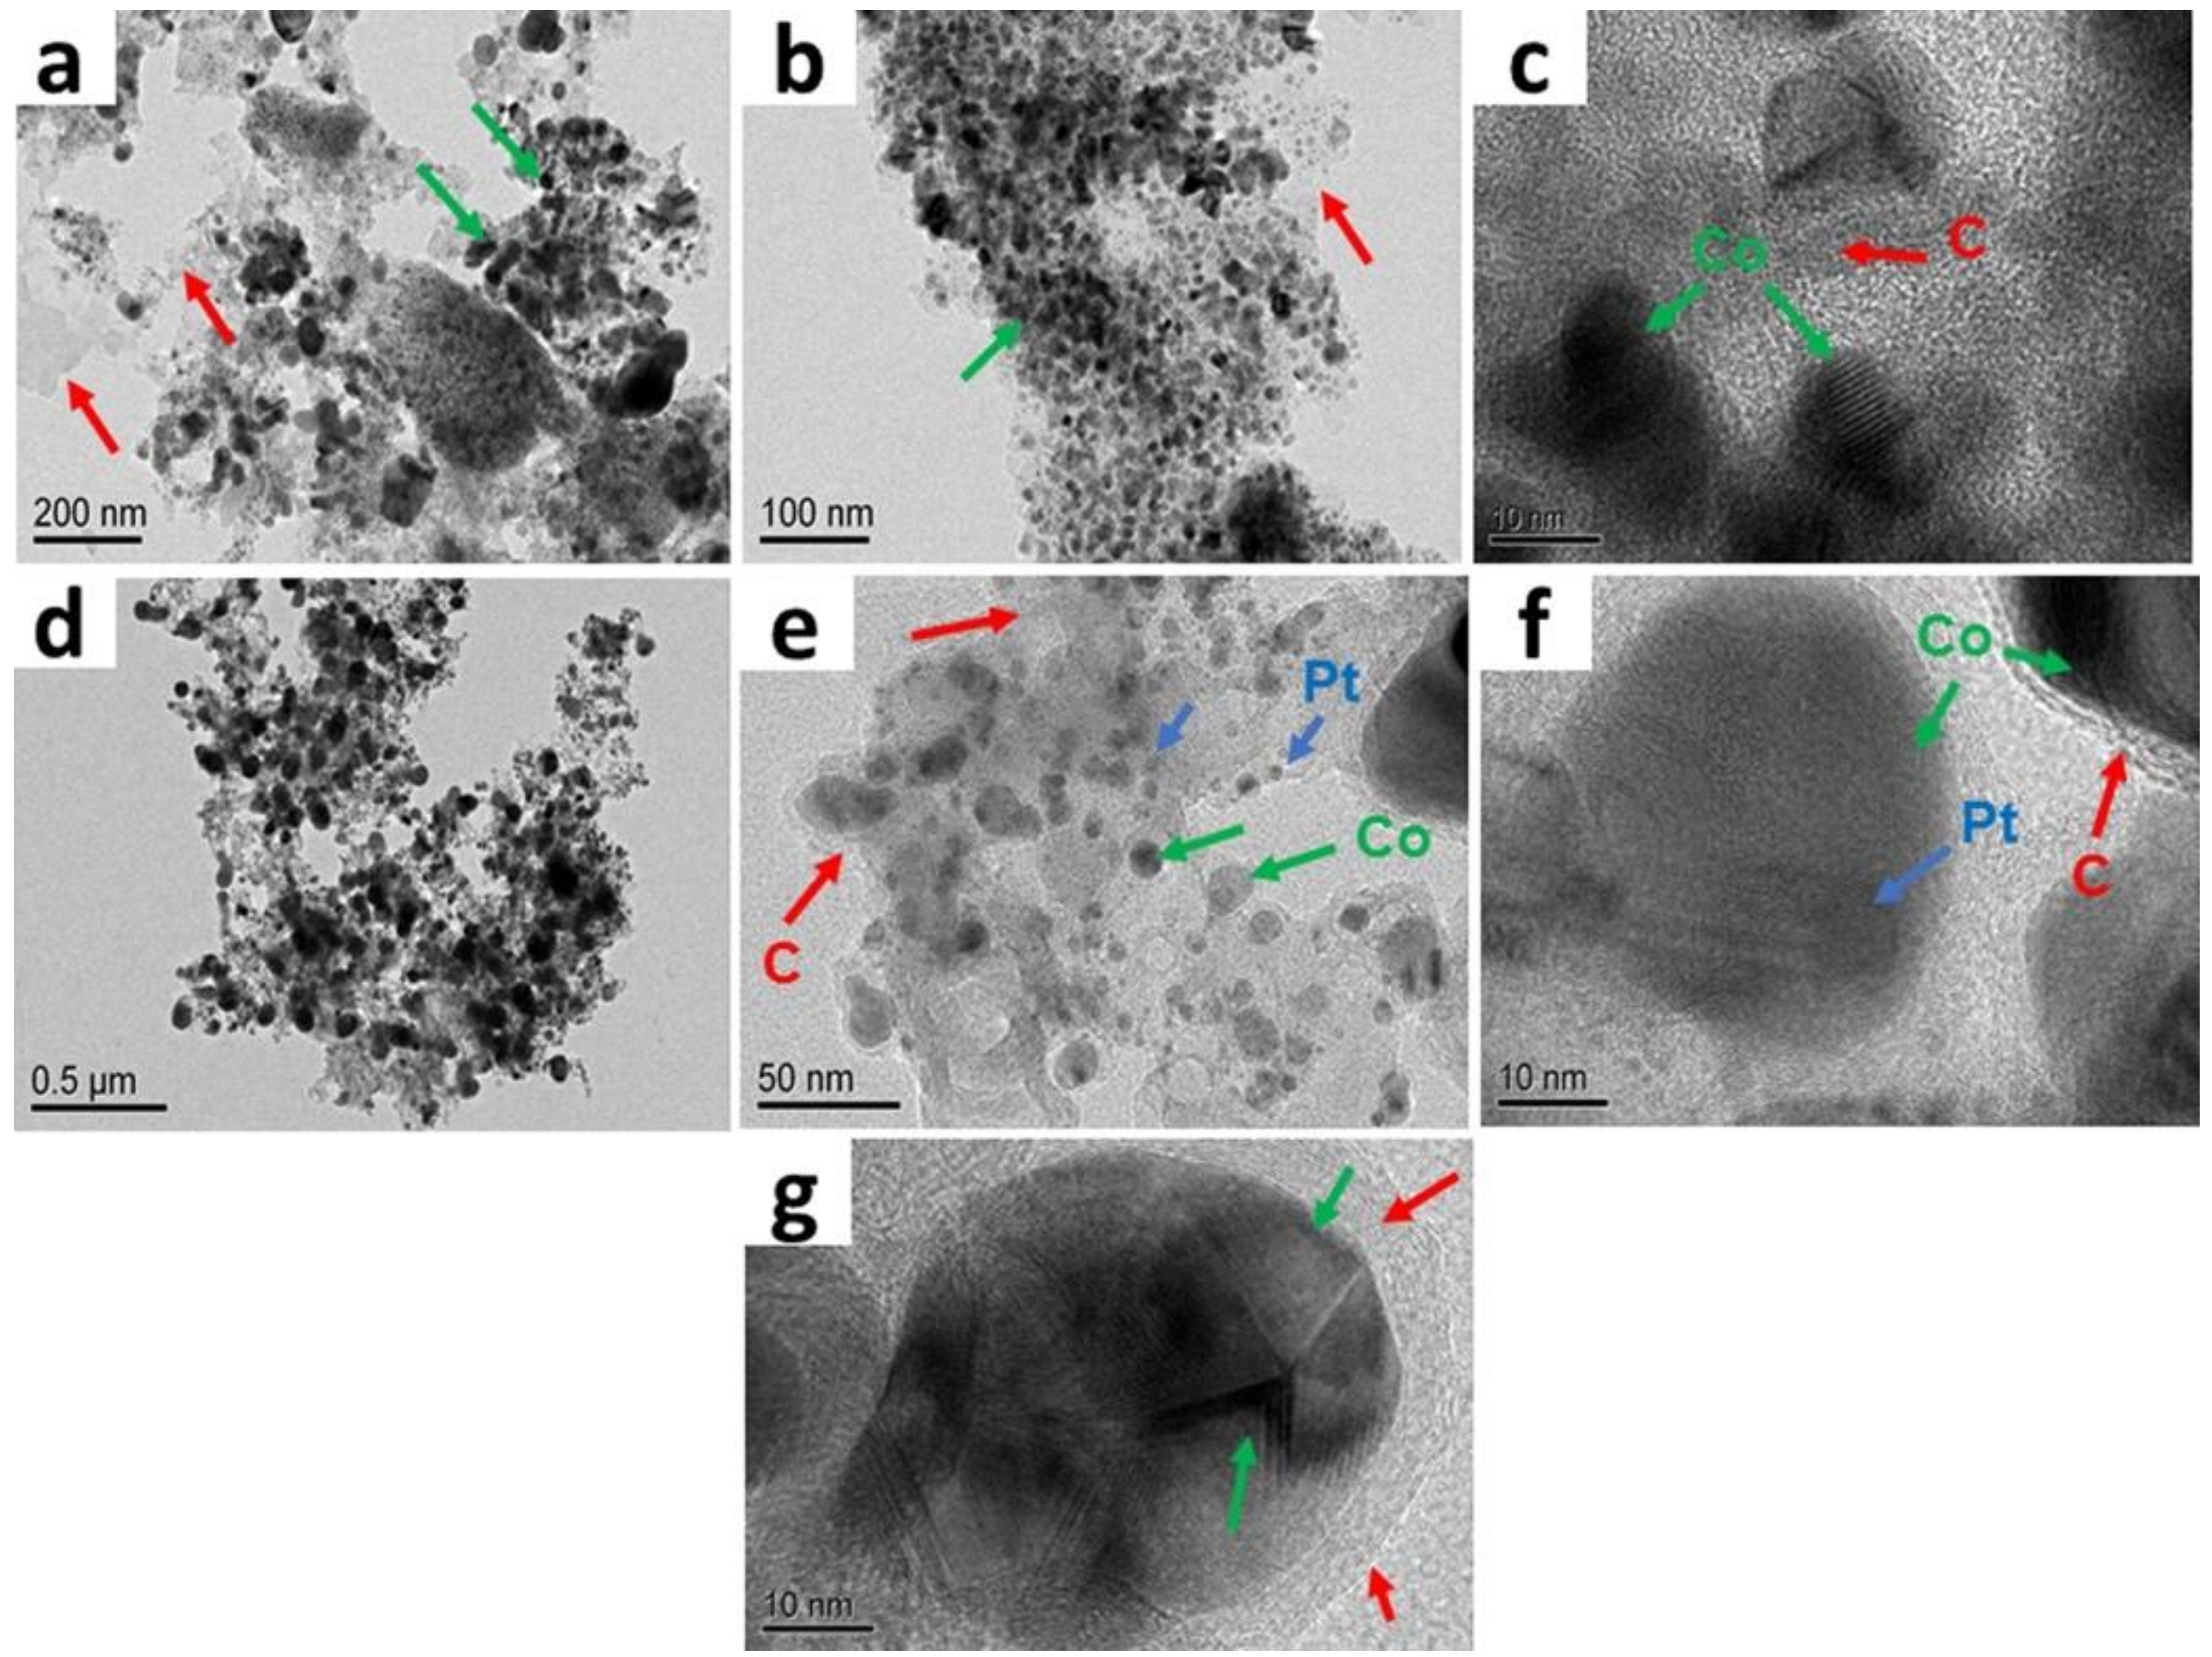
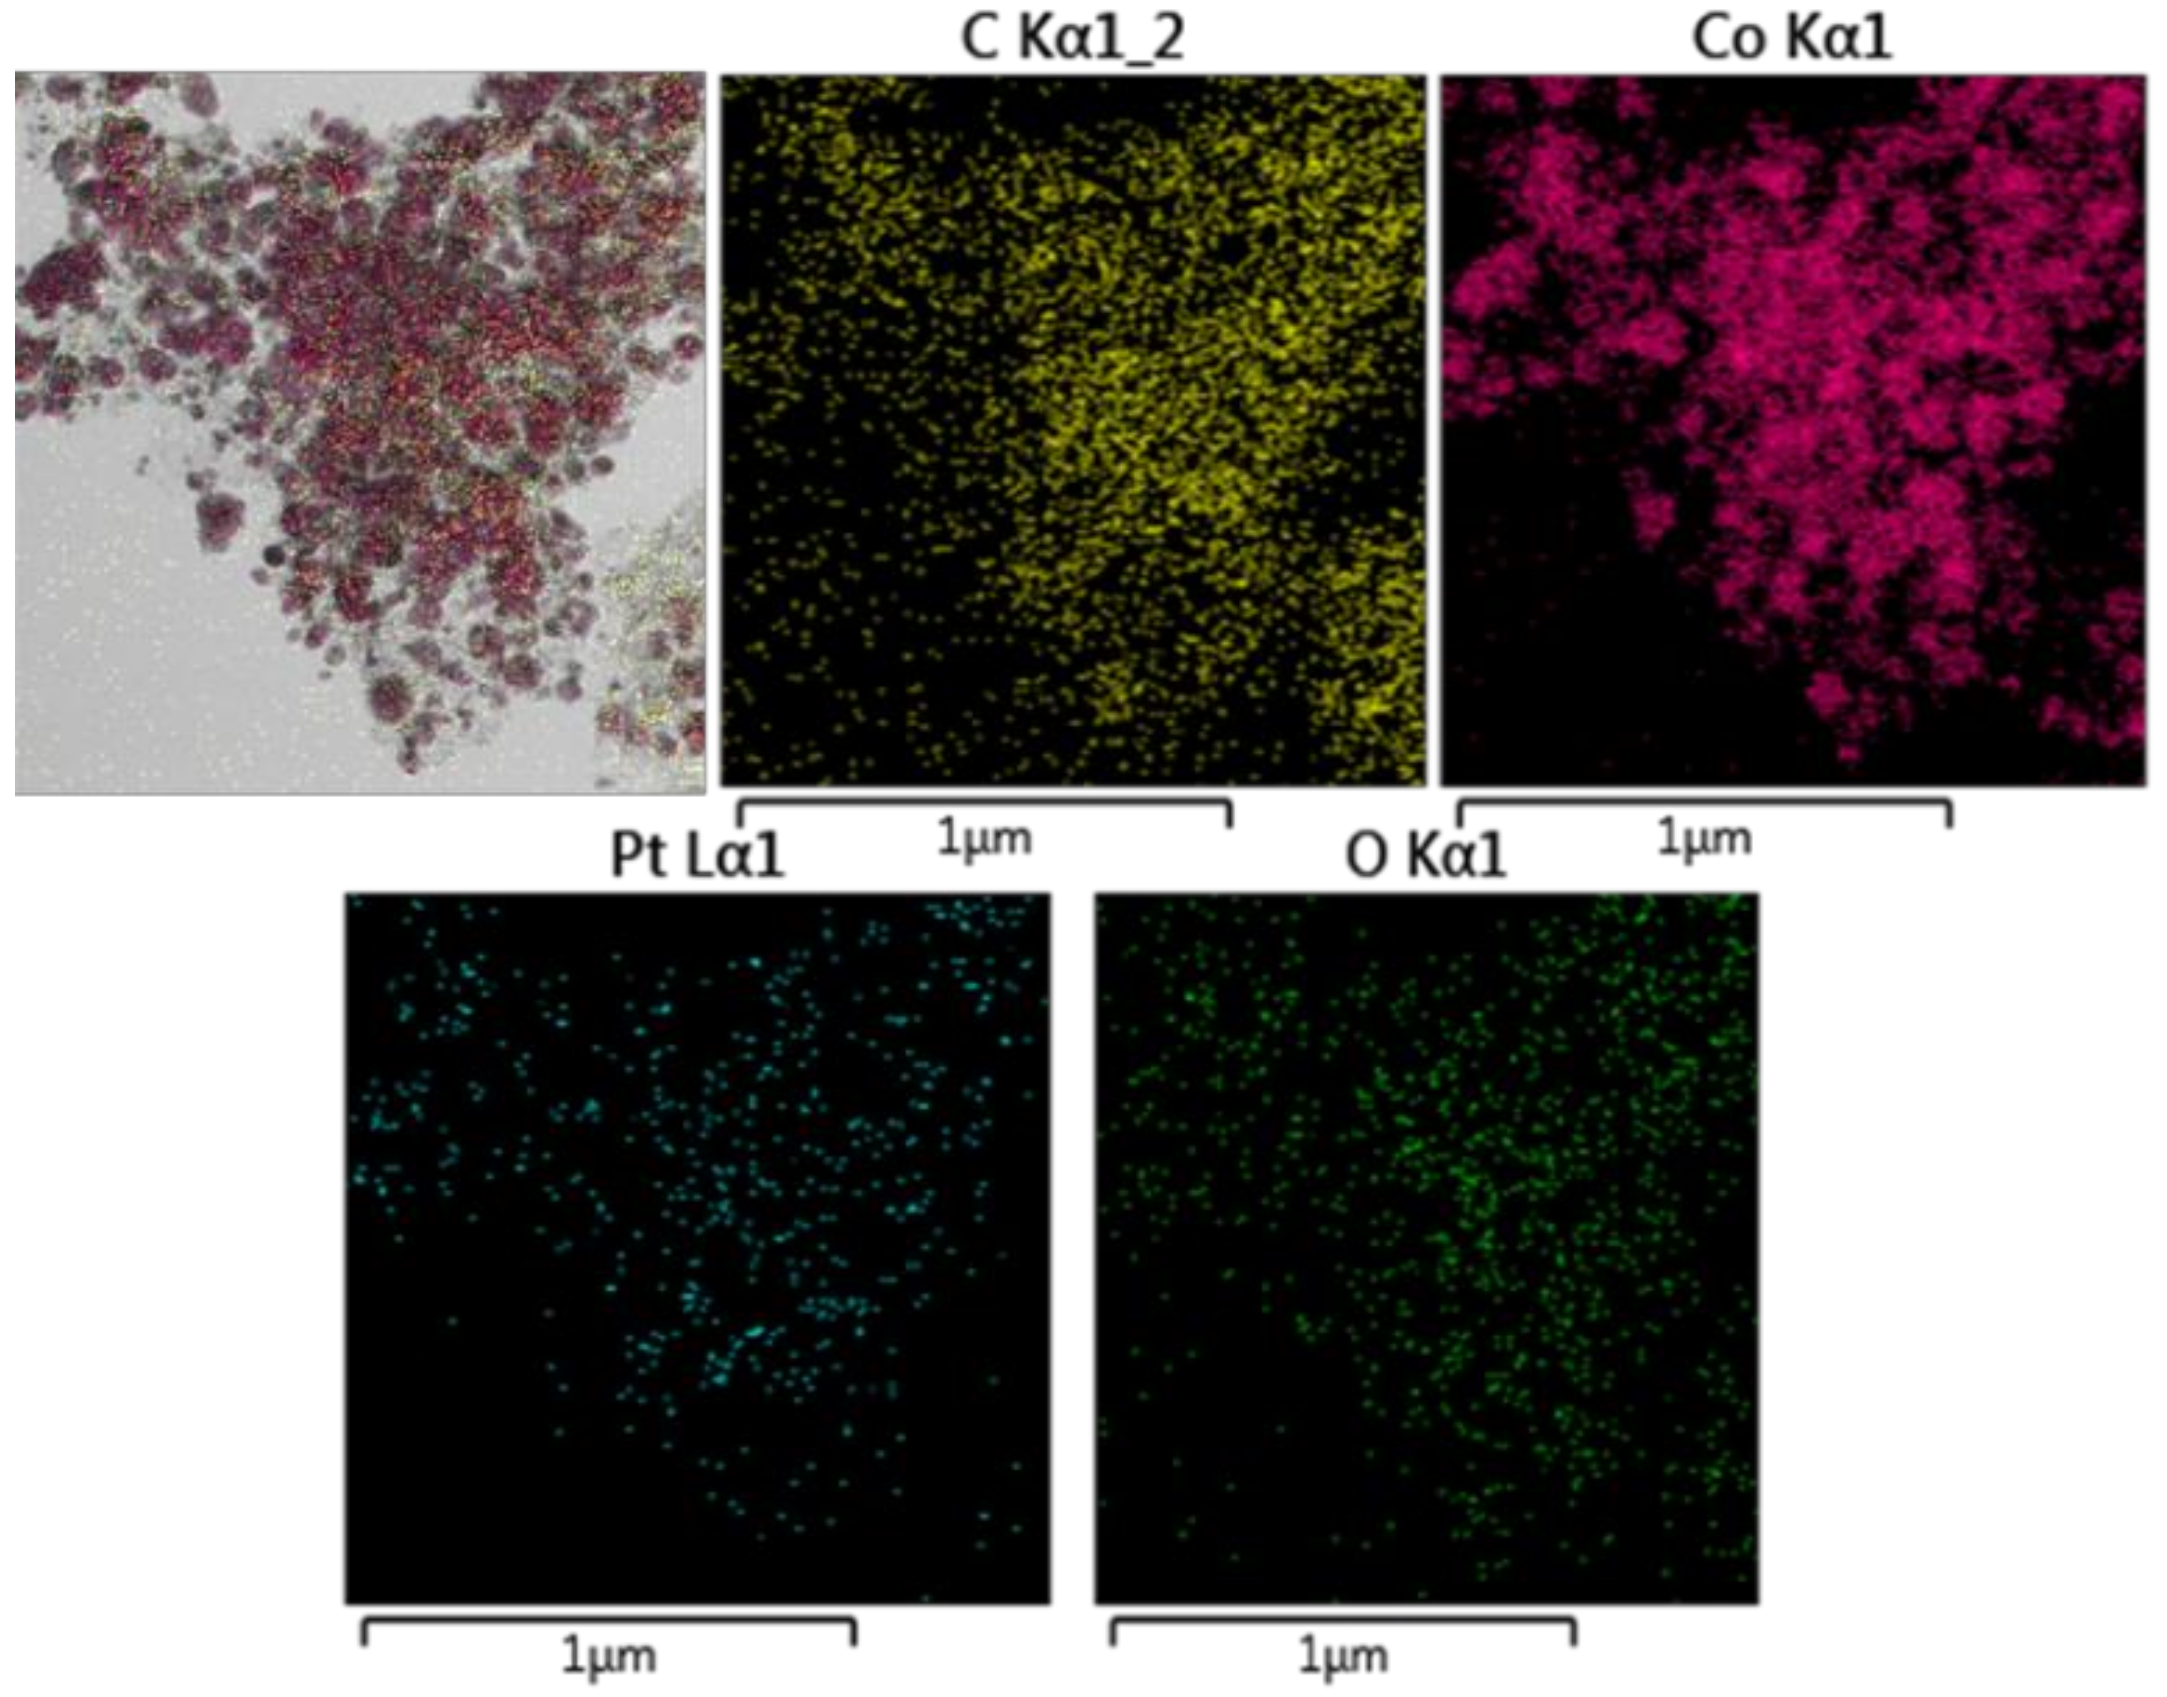
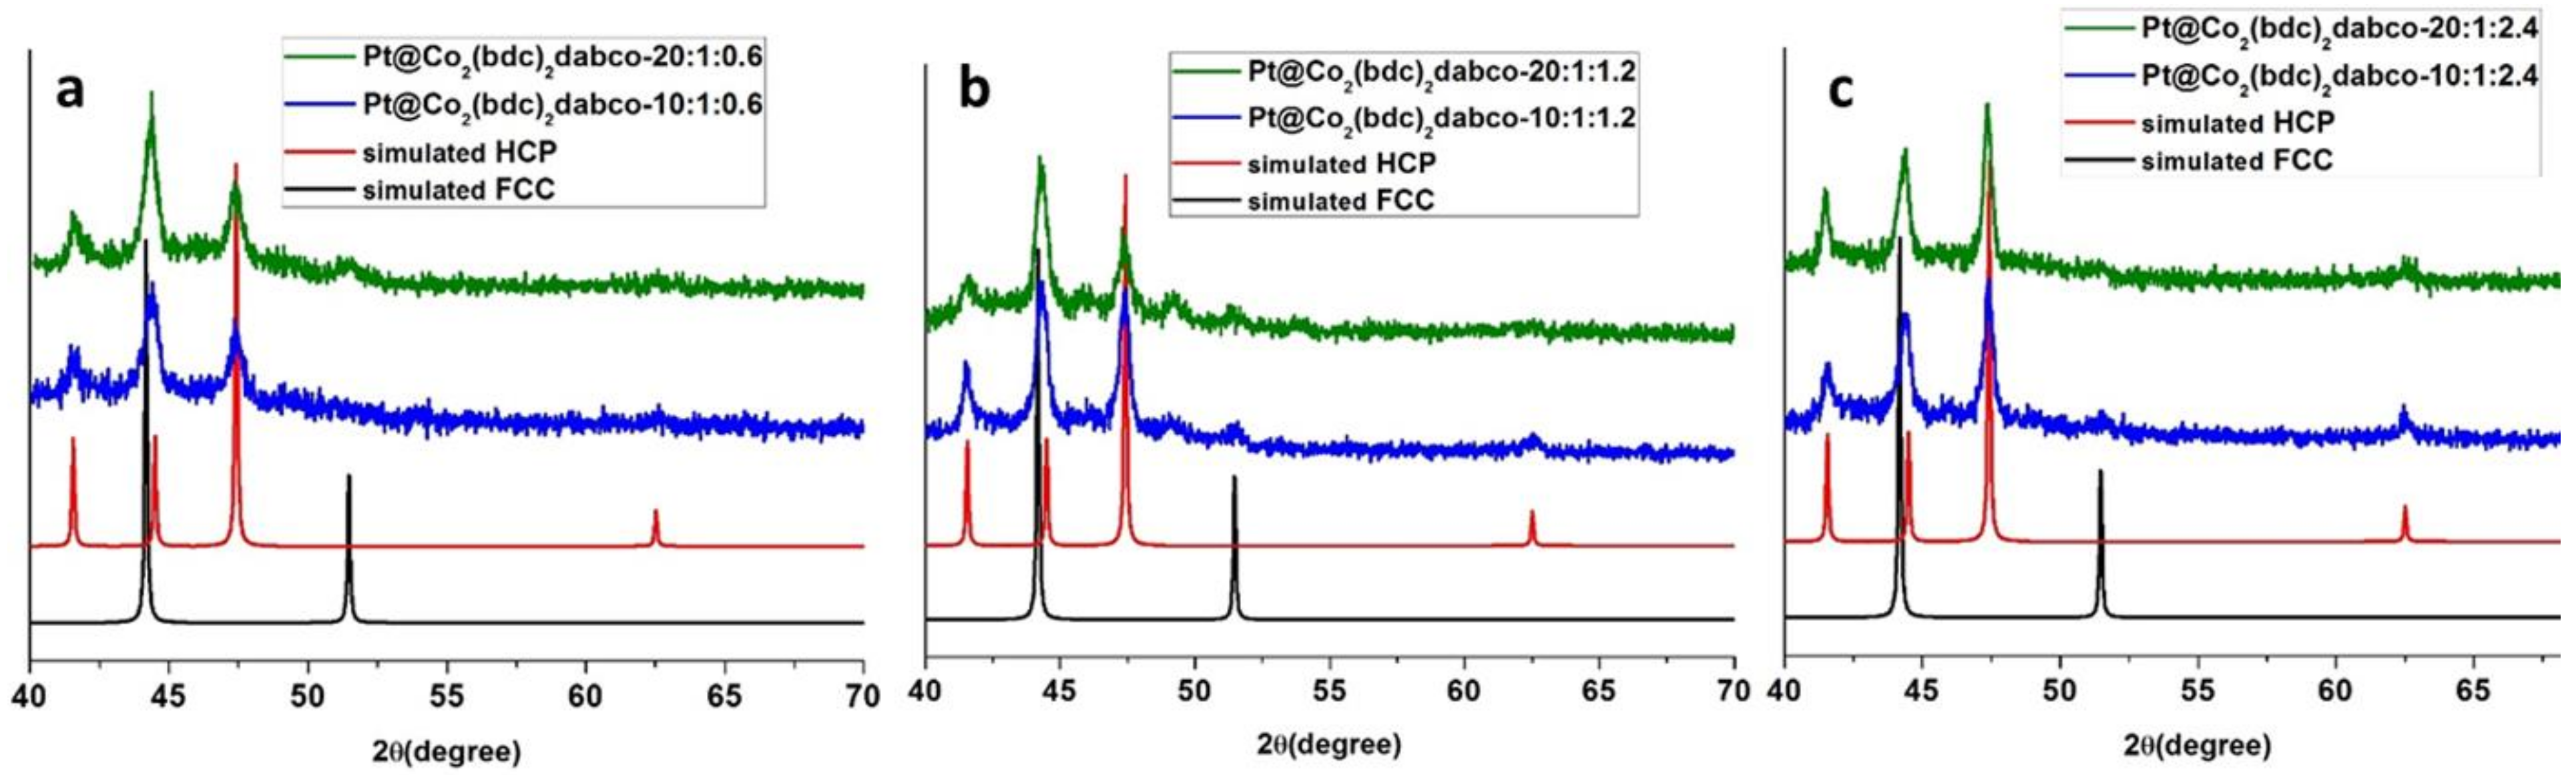
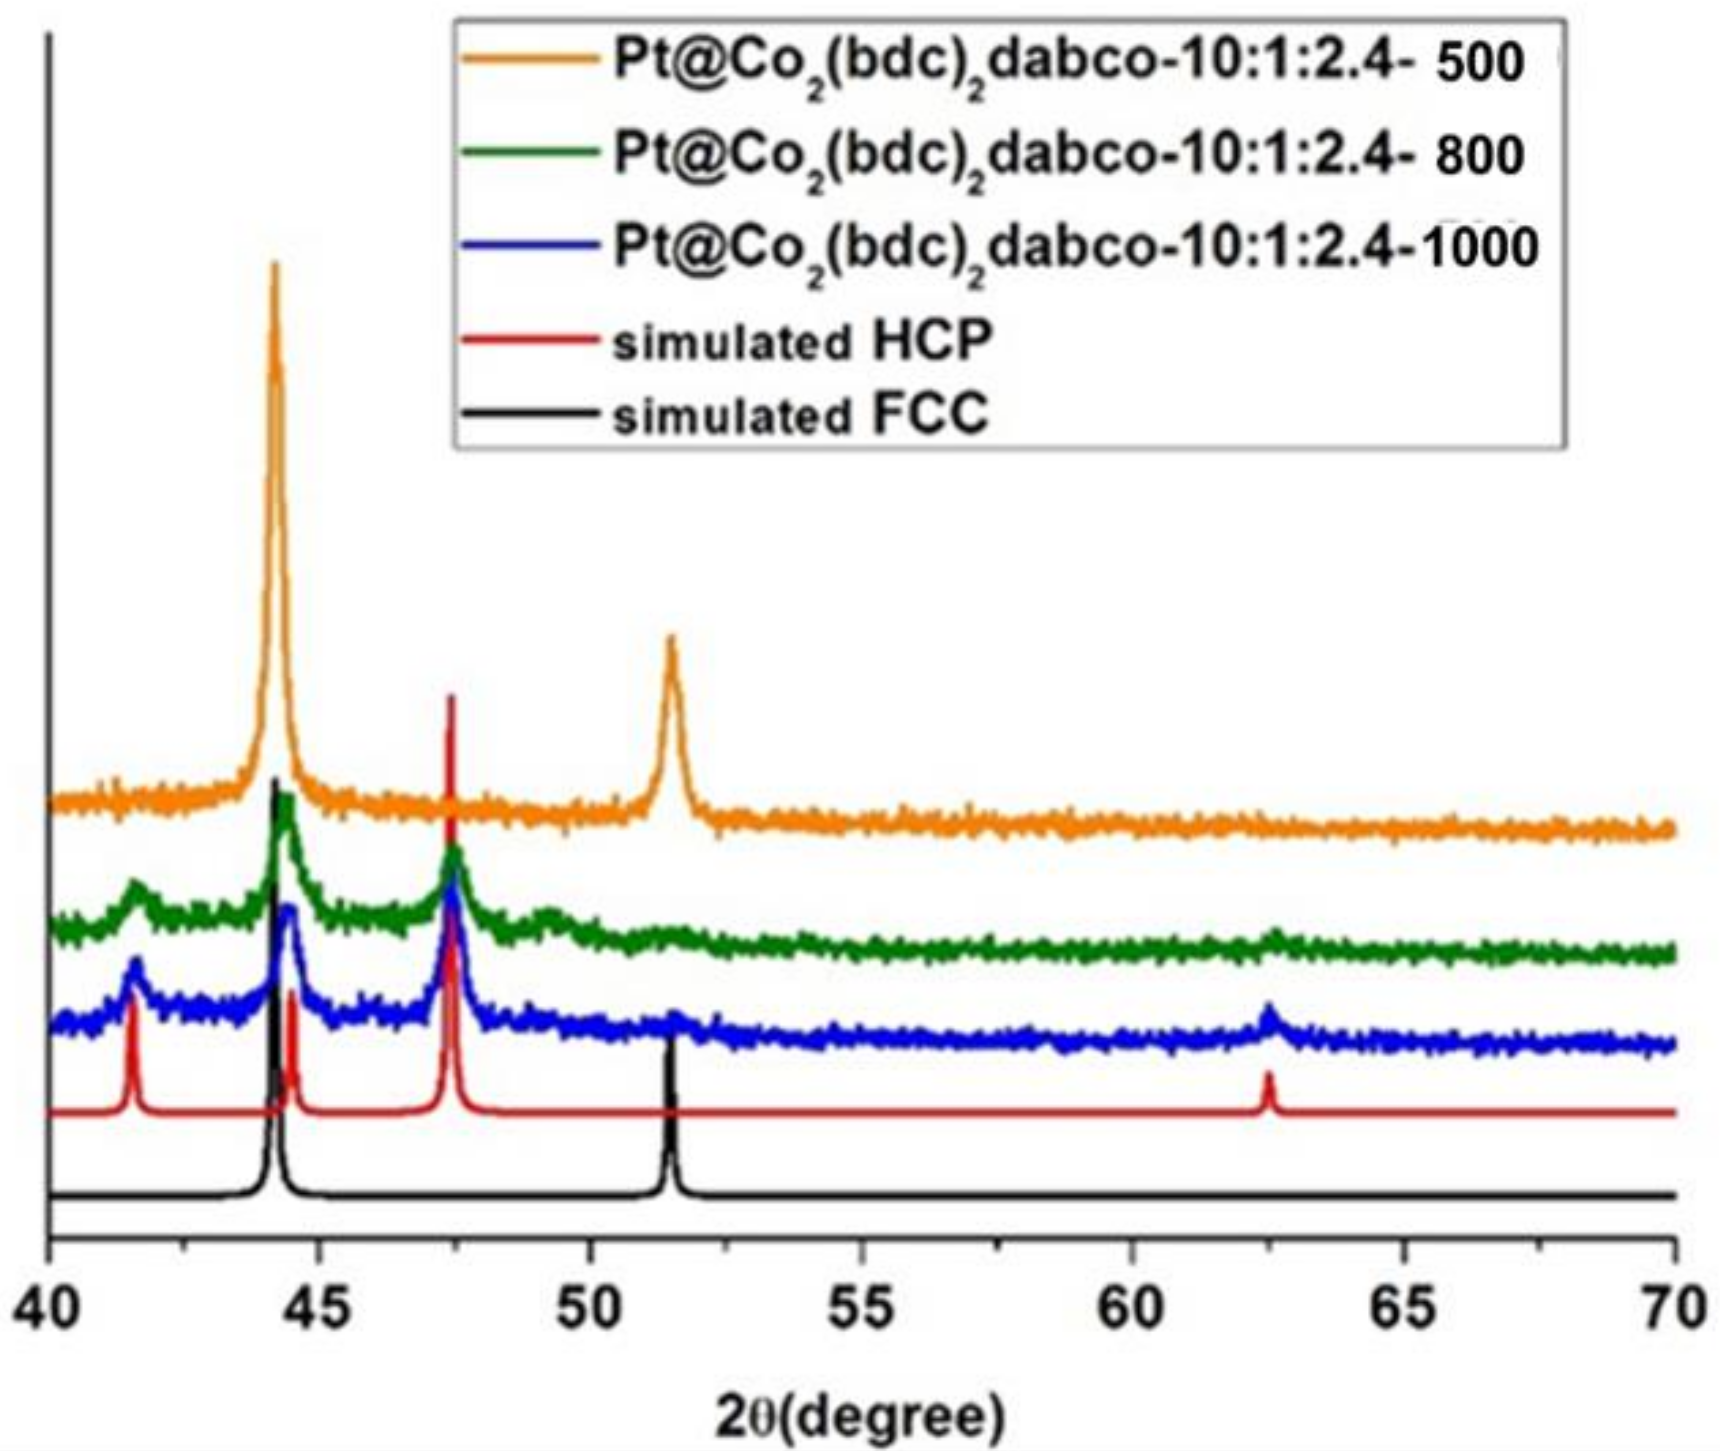
Catalyst Characterization

The powder X-ray diffraction analysis shows that the M2(bdc)2(dabco) (M = Co, Ni, Zn) data were in good agreement with the simulated data, at a scan rate of 2θ < 2 °/min, shown in Figure 1a. The PXRD data indicate that the guest molecules do not remain in pores of the product, and the good agreement of the PXRD data with the simulation indicates the crystallinity of M2(bdc)2(dabco). Figure 1b shows the Brunauer–Emmet–Teller (BET) surface areas of Co2(bdc)2(dabco), Ni2(bdc)2(dabco) and Zn2(bdc)2(dabco), which are approximately 2046, 2081, and 1998 m2/g. The M2(bcd)2(dabco) compounds were carbonized at 800 °C for four hours under Ar gas flow with rate of 150 cc/min. The PXRD data of the carbonized Pt doped Co2(bdc)2(dabco) (Pt@Co/C) and Co2(bdc)2(dabco) (Co/C) are shown in Figure 2.
The diffraction peak at 43.9° was assigned to the FCC metallic Co nanoparticles (according to PDF 00-001-1259) for Co/C, whereas in the case of Pt@Co/C, the phase framework changed completely to HCP (Figure 2). In contrast, there were no changes in the structures of the nickel and zinc frameworks, either with or without the Pt dopant (Figure S1 and Figure S2, respectively). Interestingly, Pt does not affect the nickel and zinc structures but does affect the structure of the cobalt framework. The carbonized MOF derived from Co nanoparticles has an FCC phase in the absence of Pt. The intensity of the FCC phase increased with a decrease in the Pt/Co ratio, whereas the HCP phase increased with an increasing Pt/Co ratio (Table 1). This result implies that the phase change depends on the phase of the Co nanoparticles, upon addition of the Pt dopant. The peaks at 43.9° and 46.9° correspond to the FCC (111) diffraction plane and the HCP (101) diffraction plane in Co/C, respectively. This result shows that the initially formed FCC has completely transformed into the HCP phase of Co in the presence of the Pt dopant [37]. However, literature reports indicate that the factors influencing the formation of supported Co/C include not only the carbonization conditions but also the properties of the material, such as the nature of the support, the Co particle size, and the dopant content. The phase composition of the catalyst also depends on the NaBH4. (Table 1).
In addition, we measured the BET surface areas of M/C and Pt@M/C (Figure 3). The surface areas of the M2(bdc)2(dabco) compounds significantly decreased upon carbonization to M/C. This is due to the formation of carbon containing metal nanoparticles. This result proved the formation of metal nanoparticles with active sites for application in catalysis. The surface areas of Co/C, Ni/C, and Zn/C are approximately 182, 119, and 382 m2/g, respectively (Figure 3a). Moreover, in the case of Pt@M/C, there was a small decrease in surface area compared to the corresponding M/C materials (Figure 3b). This result clearly indicates that the platinum particles are incorporated in the pores of the M/C materials. The surface areas of Pt doped Co/C, Ni/C, and Zn/C were estimated as approximately 148, 91, and 356 m2/g respectively. During the carbonization process, the original framework structure of the MOFs was destructed and micro- and mesopores were generated during formation of the metal nanoparticles and carbon consumption. Therefore, the surface area was drastically decreased upon carbonization of MOFs. In addition, Pt also occupied the pores of the composite resulting in slightly smaller surface area than the non-Pt doped composite. For the analysis of the chemical compositions of the materials we carried out elemental analysis on the M/C and Pt@M/C (Table S1). The Pt@Co/C (10:1:2.4) contains 32.59% C, and 0.25% H, whereas Co/C contains 34.59% C, and 0.85% H. Elemental analysis data for the other Ni and Zn-based catalysts are summarized in Table S1.
XPS is the most efficient technique to determine the chemical composition of the Co/C and Pt@Co/C composites (molar ratios of Co (10), Pt (1), and NaBH4 (2.4)). Figure 4a shows the XPS total survey scan spectrum of Co/C (10:1:2.4) (red line) and Pt@Co/C (10:1:2.4) (black line). The peaks at 284, 530, and 778 eV in the red line correspond to C 1s, O 1s, and Co 2p. The additional peaks at 75 eV in the black line (Figure 4b) correspond to Pt in the composite. Figure 4b shows the high resolution XPS spectra of Pt 4f. The two peaks at 71.5 and 75.2 eV correspond to Pt 4f7/2 and Pt 4f5/2 [38]. The peak at 71.5 eV represents the Pt–C bond, in the case of Pt doped Co/C, whereas the peak at 75.2 eV indicates the presence of metallic platinum [39]. This result suggests the presence of platinum on the surface of the composite. Figure 4c shows the Co 2p deconvolution spectra for the Co/C and Pt@Co/C (10:1:2.4) catalysts. In both cases, the deconvoluted spectra of Co 2p show the two characteristic peaks at 778.5 and 793.8 eV, which correspond to the Co 2p3/2 and Co 2p1/2. In addition, a characteristic satellite peak at 781.5 eV indicates the presence of Co nanoparticles [40]. Figure 4d shows the high resolution XPS of N 1s. In both cases, no nitrogen was observed. As a comparison study, both the nickel and zinc-based catalysts were analyzed by XPS, and the results are shown in Figure S3 and Figure S4. To understand the morphology of the carbonized cobalt-based catalyst, we performed TEM on both the platinum doped and undoped materials. Figure 5a,b show dark spherical spots which correspond to the cobalt oxide nanoparticles (green arrow), and a grey sheet (red arrow) identified as a carbon layer. The TEM images show that the cobalt nanoparticles are well dispersed on the carbon surface. The cobalt particles are randomly arranged all over the composite, and have sizes ranging from 5 to 40 nm. The average particles size of the cobalt oxide nanoparticles was calculated from the XRD data using the Scherrer equation [41] and were found to be approximately 20 nm. The small particles in Figure 5a,b are HCP phase cobalt, and the large particles are in the FCC phase [37]. In Figure 5c, the high-resolution transmission electron microscopy (HRTEM) image clearly indicates the presence of the carbon support (red arrow) covering the surface of the Co nanoparticles. After Pt doping, however, Figure 5d,e show dark spherical spots, which correspond to the cobalt oxide nanoparticles (green arrow), a grey sheet (red arrow), identified as a carbon layer, and very fine particles identified as the Pt nanoparticles (blue arrow), which has been confirmed by elemental mapping.
After Pt doping, Figure 5d,e show dark spherical spots, which correspond to the cobalt oxide nanoparticles (green arrow), a grey sheet (red arrow), identified as a carbon layer, and very fine particles identified as the Pt nanoparticles (blue arrow), which have been confirmed by elemental mapping. Moreover, Figure 5f shows that Pt (blue arrow) is present on the surface, while the carbon layer (red arrow) wraps the Co (green arrow) nanoparticles. The morphology of the cobalt particles appears hexagonal, in both cases, (Figure 5c,f), which is more clearly shown in the HRTEM image in Figure 5g, of a HCP-Co Wulff polyhedron [42,43]. Furthermore, the elemental mapping revealed that the composite is a mixture of C, O, Co, and Pt, as shown in Figure 6.

3. Discussion

3.1. Cobalt Phase Transition

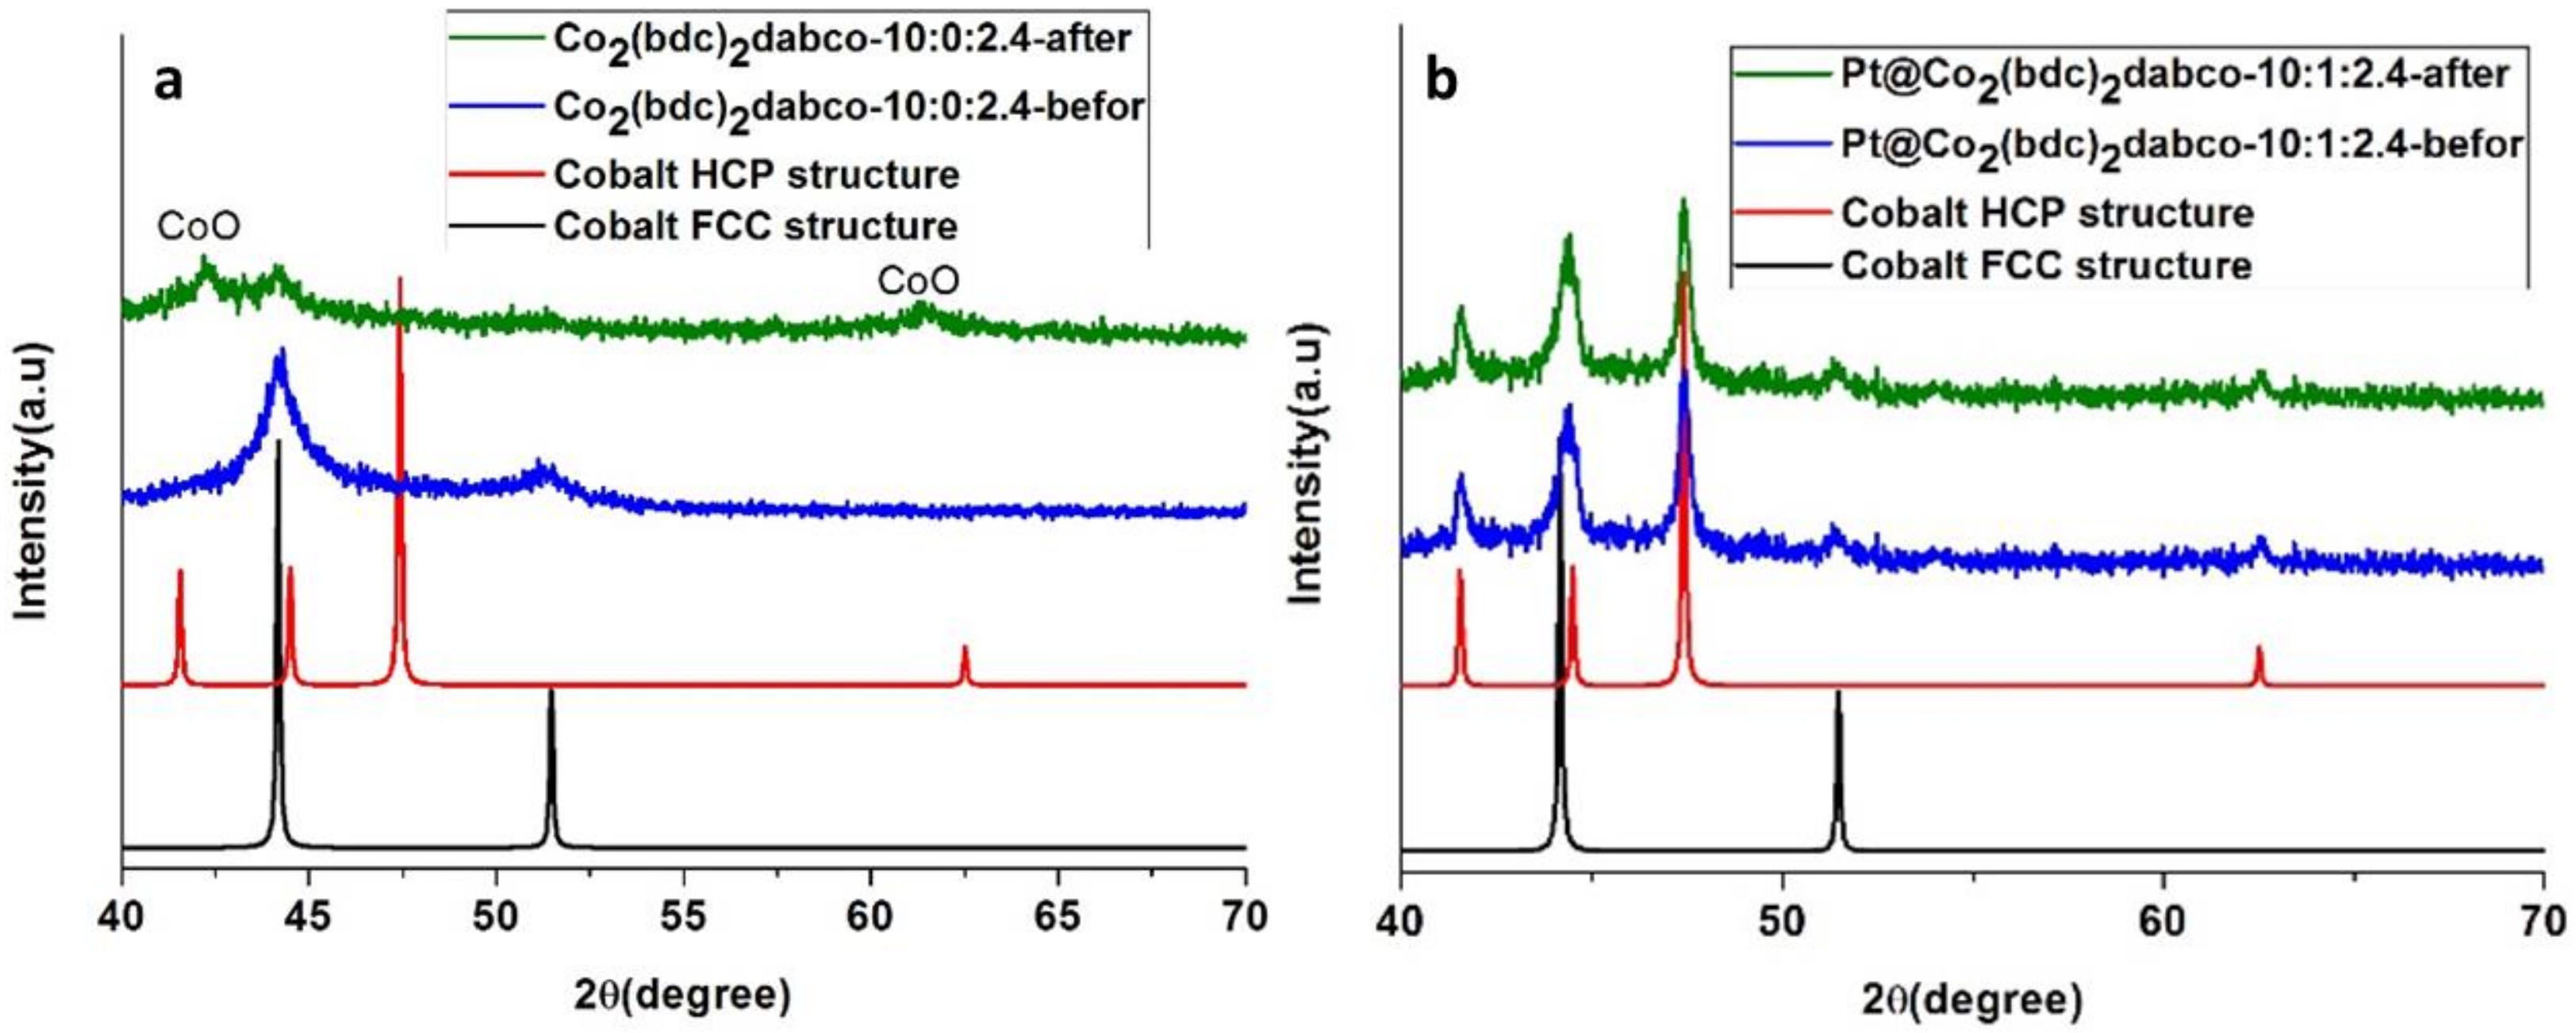
3.1.1. Effect of NaBH4

The effect of NaBH4 and the quantity of Pt dopant on the structural phase transition of cobalt was studied using PXRD (Figure 7). To investigate the role of NaBH4 in tailoring the crystal phase, we carried out experiments using different molar ratios of NaBH4 (0.6, 1.2, 2.4). Table 1 shows that as the amount of NaBH4 increases, the structure of cobalt shows increasing HCP character, which was observed in PXRD measurements (Figure 7c). Moreover, at higher concentrations of NaBH4, the HCP phase became predominant. As we can see from Figure 7a–c, with an increase of NaBH4, the HCP phase of the cobalt increases, as a sufficient quantity of NaBH4 reduces the platinum, which results in an increased ratio of the Co HCP phase.

3.1.2. Effect of temperature

To study the effect of the temperature on the phase of Pt@Co/C(10:1:2.4), several experiments were performed using different carbonizing temperatures (Table S3). The PXRD spectrum of the material produced at 500 °C shows a peak at θ = 44.3°, which corresponds to the (111) diffraction plane of the cobalt FCC phase.
This peak gradually diminished in intensity as the carbonization temperature increased from 500 °C to 1000 °C, as shown in Figure 8. This trend is due to the conversion of spinal Co3O4 to CoO [42,44]. At 1000 °C, all the diffraction peaks appeared a little broad, which may be due to the formation of carbon at higher temperatures. The diffraction pattern shows three characteristic peaks corresponding to the (002), (100), and (101) planes, which are attributed to the cobalt HCP phase. From Figure 8, the HCP phase is predominant at higher temperatures (1000 °C) [45]. However, a small proportion of the cobalt FCC phase is still present, which was confirmed by a characteristic cubic peak with a very low intensity at 52.3°, due to the (111) diffraction plane of FCC cobalt. This may be due to the presence of unreduced cobalt [46,47].
In addition, we carried out carbonization studies of Pt@Co/C(10:1:1.2) and Pt@Co/C (20:1:1.2) composites (Figure S5a,b). In Figure S5a, at 800 °C, there is small peak at 52.3°, which indicates the presence of a minor FCC phase. This is may be due to the use of less NaBH4.

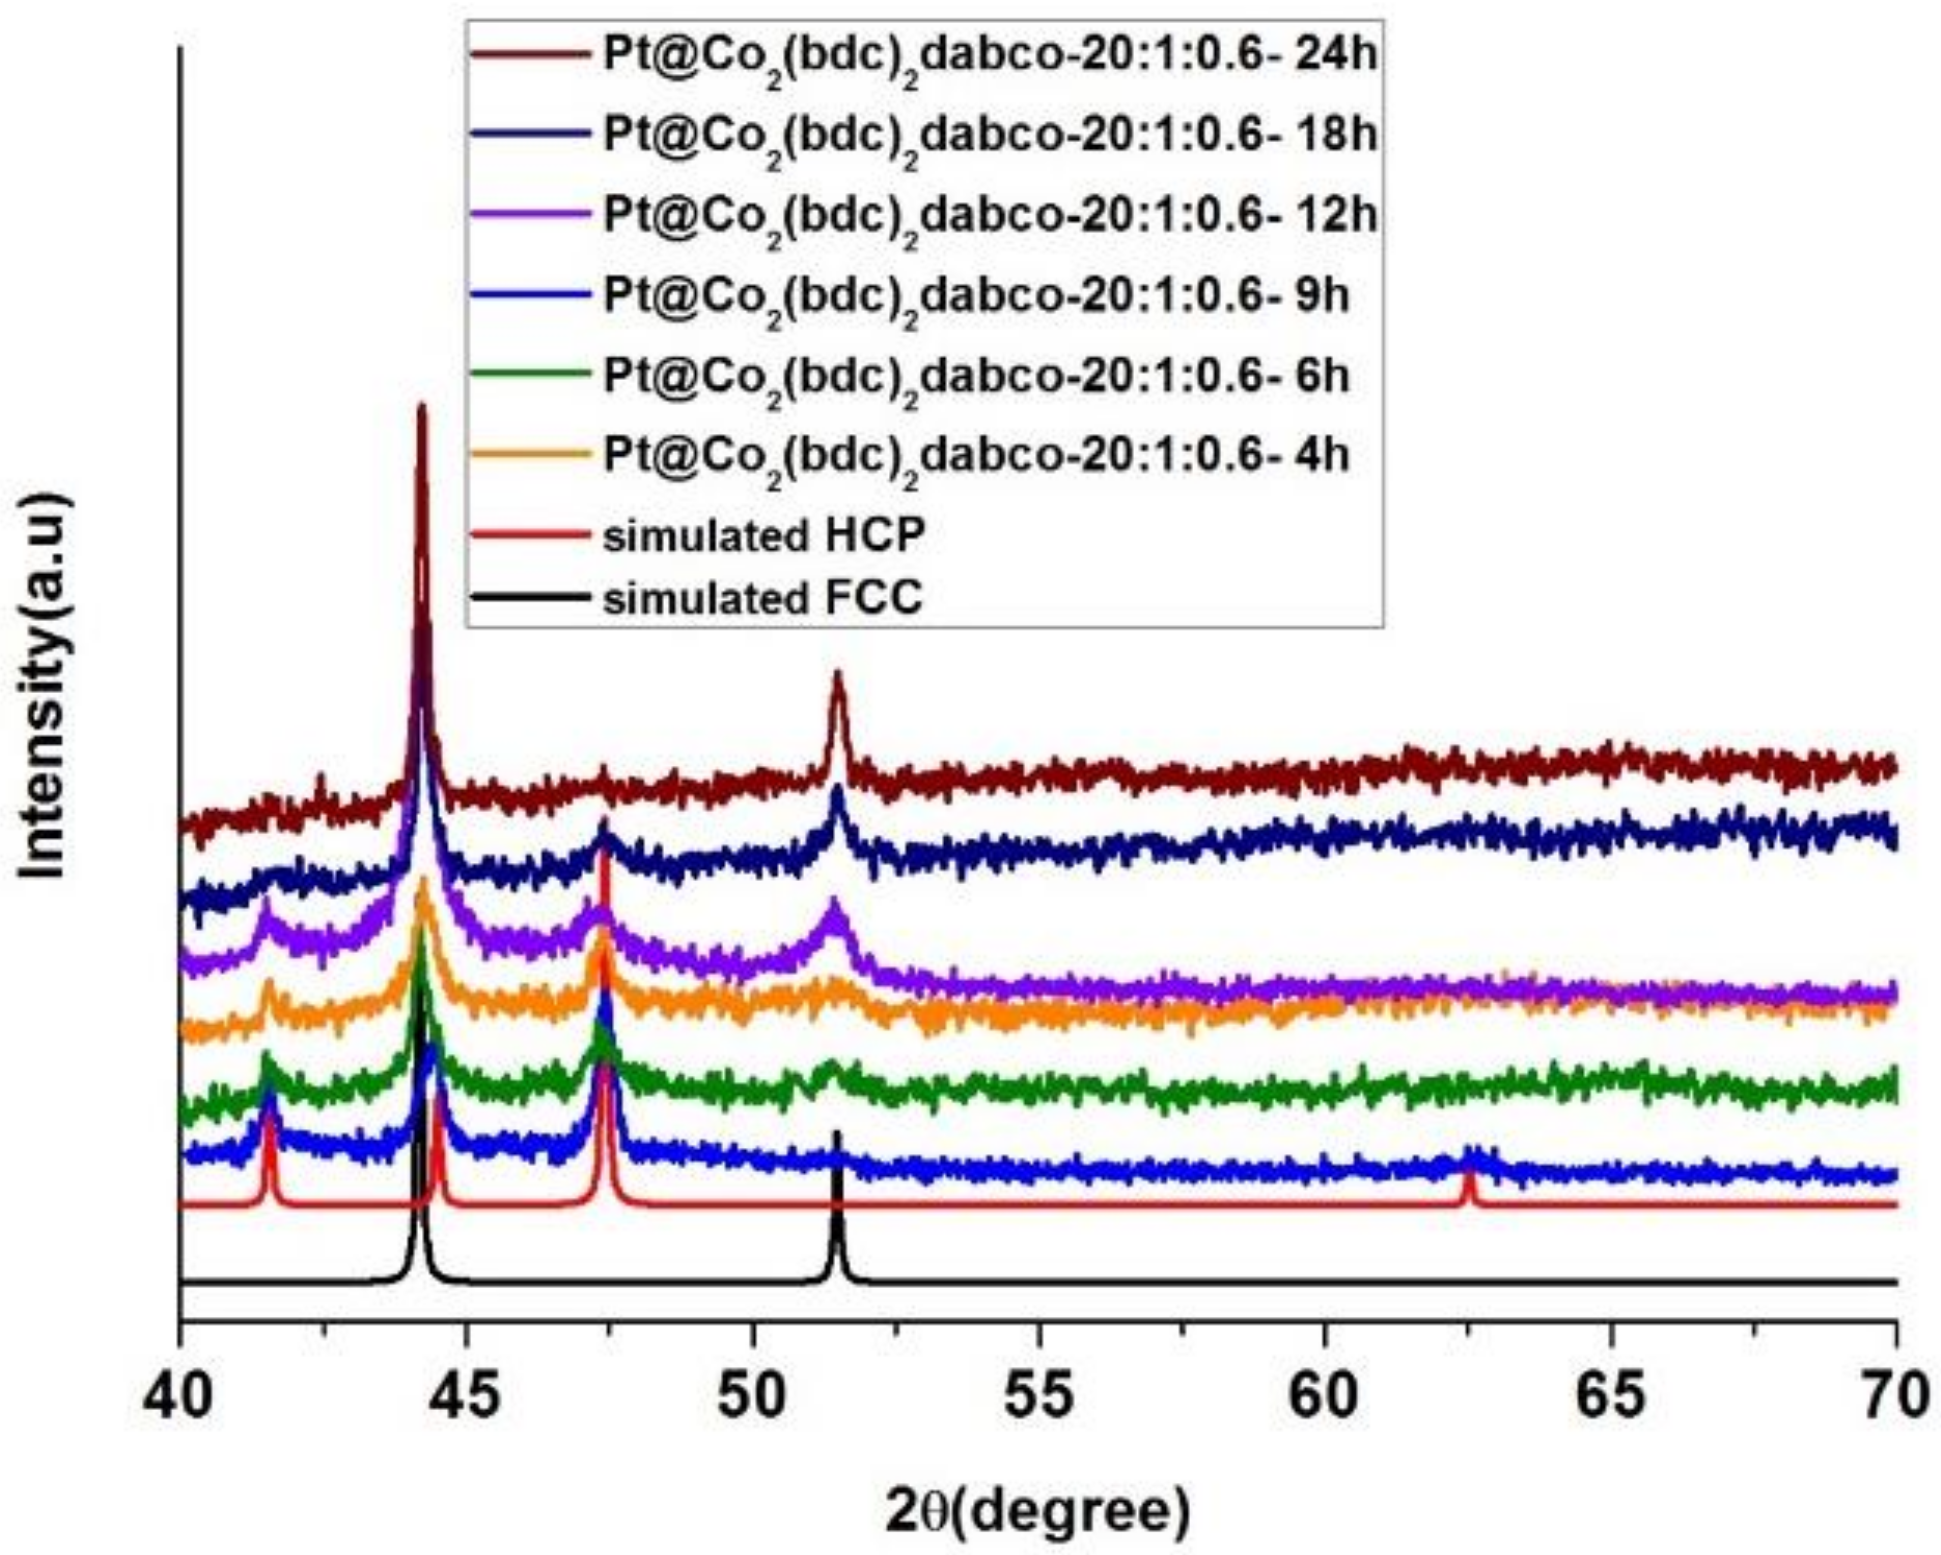
3.1.3. Effect of Carbonization Time

To investigate the effect of carbonization time on the structure of Pt@Co/C (10:1:2.4), we carried out the experiment using a range of carbonization times (4, 6, 9, 12, 18, and 24 h). Figure 9 shows the PXRD patterns of the samples obtained using different carbonization times, under Ar gas (150 cc/min) at a constant temperature of 800 °C. The results show a gradual increase in the proportion of the cobalt FCC phase with time. The detailed experimental conditions are summarized in Table S4. In summary, we found that the structural phase of the Pt@Co/C composite depends on several conditions. At higher temperatures, the HCP phase is dominant, whereas as at long carbonization times, the FCC phase is the predominant phase. Interestingly, the structure of the Pt@Co/C composite can be tuned using the carbonization conditions.

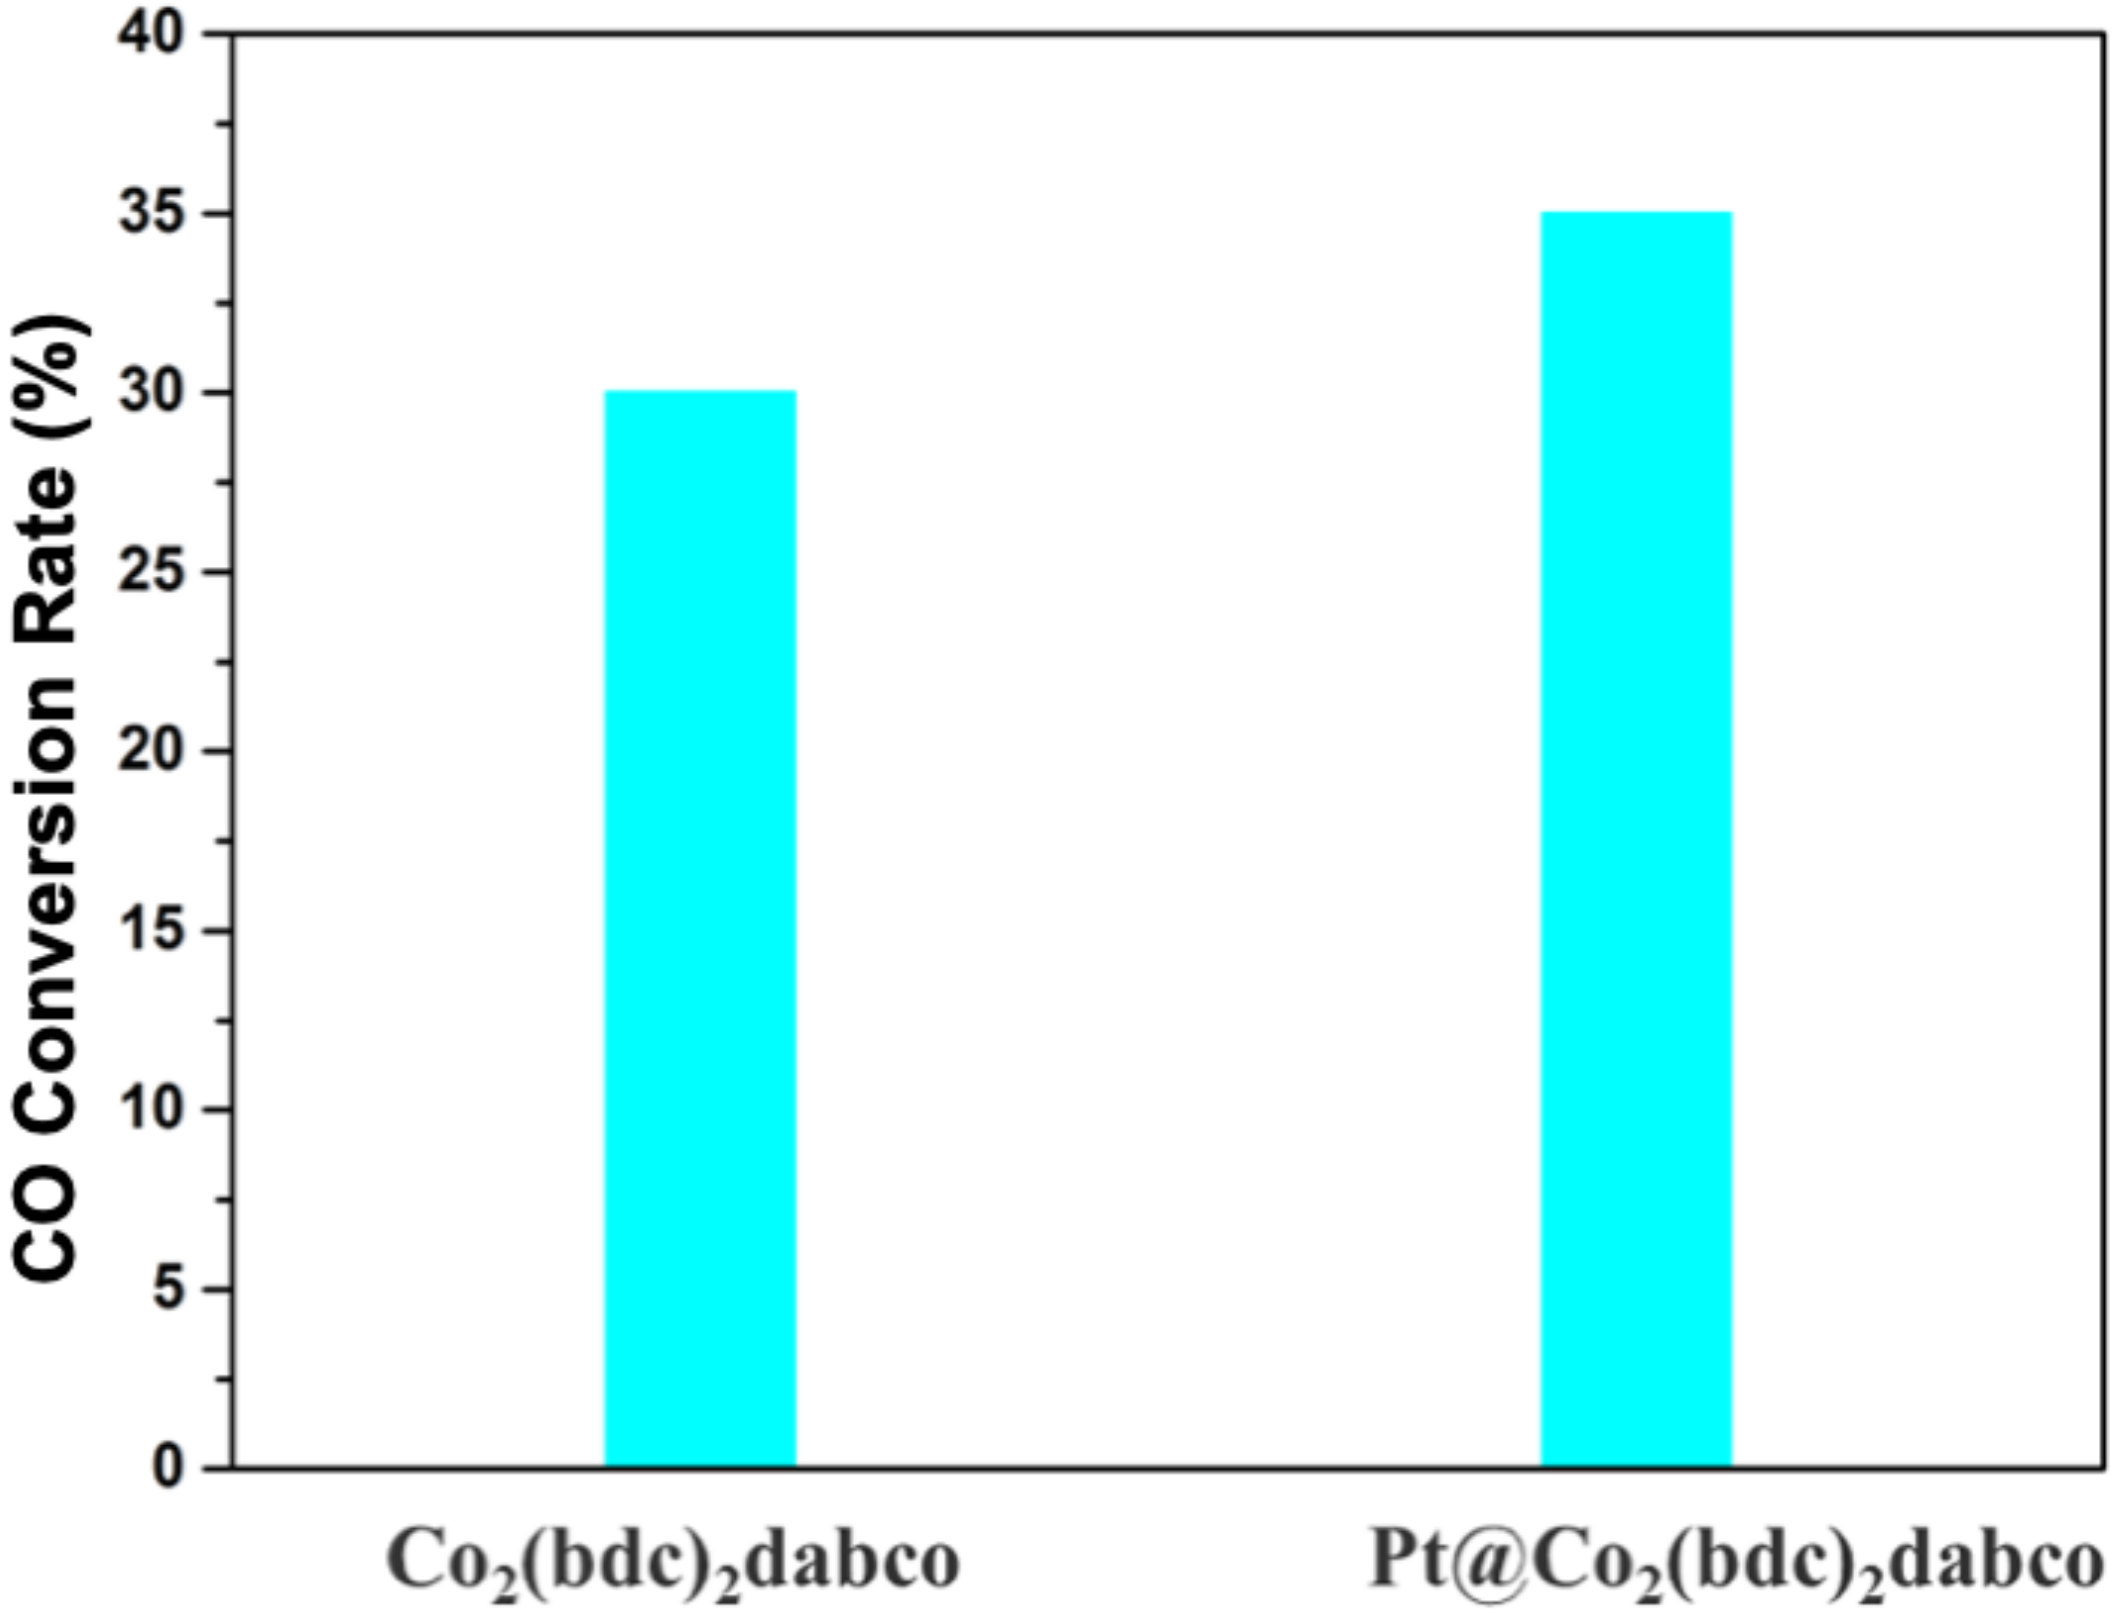
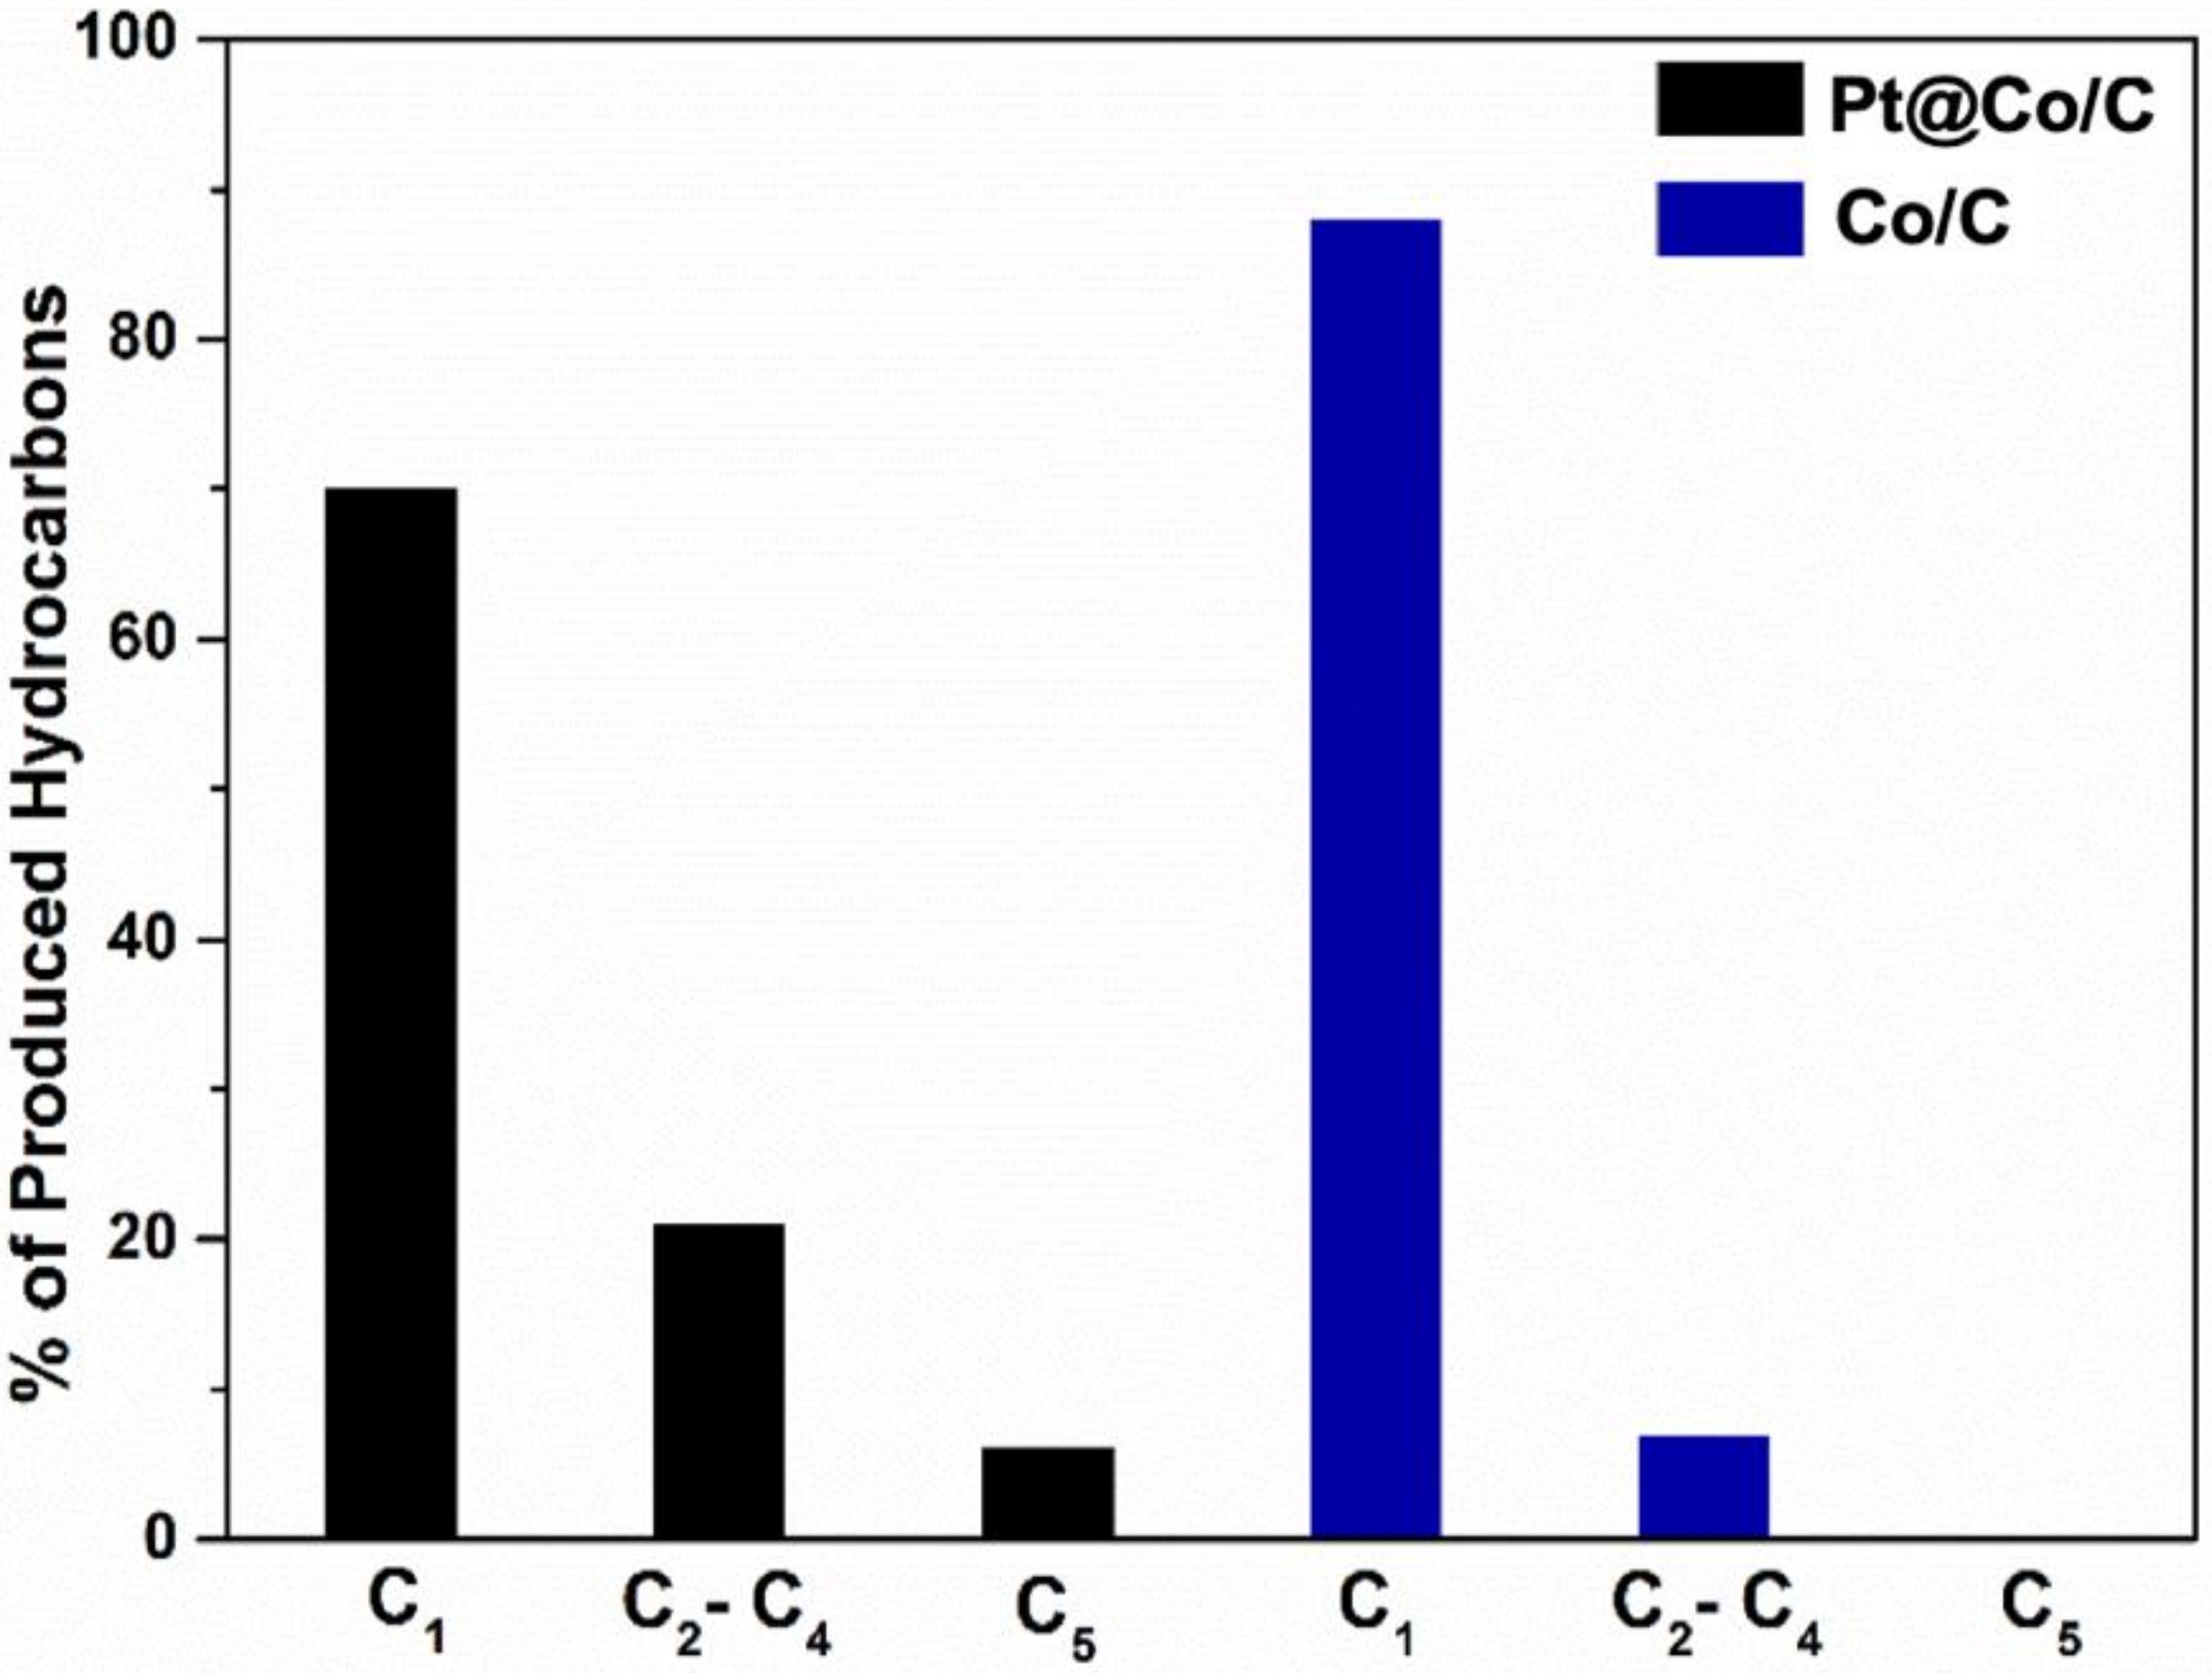
3.2. Fisher-Tropsch Reaction Using Cobalt-Based Catalysts

To determine the catalytic behavior of the M/C and Pt@M/C (M = Co, Ni, Zn) catalysts we applied them to the Fischer-Tropsch synthesis (FTS). It is well known that cobalt catalysts with HCP structures have superior catalytic activity than those with FCC structures. Therefore, we used the Pt@Co/C(10:1:2.4) HCP phase for the catalytic reaction. To perform the catalyzed FTS, we used a Parr autoclave. We maintained a pressure of approximately 10 bar of syngas (CO:H2 = 1:2) over 50 mg of catalyst and heated the system to 250 °C for 100 h. After removing the water, we measured the mass of the products by gas chromatography (GC). The reduction of the cobalt catalyst and the reduction of CO for FTS was carried out using an H2 atmosphere. Generally, the reduction proceeds via an exothermic process in which cobalt oxides are reduced to metallic cobalt after the catalysis [48]. To optimize the heat transfer, minimize the diffusion of hydrogen, and effectively remove the water from the system, the reduction temperature should be low. If the reduction temperature is high, it can cause sintering and loss of cobalt surface area. In this system, we propose that the platinum does not directly participate in the catalytic reaction, but it can act as a promoter which reduces the reduction temperature. Moreover, the presence of platinum in the nanosized cobalt crystals leads to improved reducibility of the cobalt oxide and it can increase the number of active sites resulting in the higher activity compared to un-promoted catalysts [49]. In addition, the platinum also supports cobalt for facile reduction for the faster hydrogen activation in the system. It can also help to increase the dispersion of the catalyst on the surface due to the higher rate of nucleation [50]. The reduction-oxidation-reduction cycles can effectively increase the catalytic performance of cobalt by 30% [51]. The selectivity and catalytic activity were calculated for 100 h at 250 °C. The rate of FTS catalysis depends on the rate of the formation of hydrocarbons and waxes, and on the rate of CO conversion (per hour). This implies that the FTS rate and the conversion of CO are proportional to the surface area of the reduced cobalt particles [45].
The selectivity and activity of the catalyst is very important in cobalt-based FTS. Due to the reductive environment of the catalytic environment, no CO2 was generated during the catalytic reaction. From the point of view of selectivity, the production of methane, C5+, and longer hydrocarbons is very desirable. We calculated the selectivity and activity of FT catalysis for each catalyst under the same experimental conditions. The cobalt-based catalysts show very high FTS activity and selectivity for C1–C4 hydrocarbons as the major product. The selectivity for C1–C4, C5+, and white wax (C20+) is lower in the absence of platinum. In the FTS catalytic system, the reverse water gas shift (RWGS) reaction also takes place. We measured the rate of CO conversion using the amount of water produced by the system. Since one water molecule is generated per molecule of CO, the conversion rate of CO can be determined by measuring the amount of water produced. However, the conversion rates to individual hydrocarbons remain unknown as this method determines the overall CO conversion rate. To remove the water from the system, it was stored at -24 °C for 2 days and then the mass of the gaseous products was measured by GC. The following expression represents the rate of the water gas reaction:
RWGS = RFCO2 = g CO2 produced /g cat/ h
The rate of FT catalysis for the conversion of CO is found to be 35% over the Pt@Co/C(10:1:2.4) catalyst, whereas the CO conversion rate over the Co/C catalyst is approximately 30% (Figure 10).
To the best of our knowledge, this is one of the highest CO conversion values, under a very low syngas pressure (1 MPa). It should be noted that the water gas reaction rate increases in the presence of platinum and the carbon support. The selectivity for the light weight hydrocarbons was reduced in the presence of the Pt@Co/C(10:1:2.4) catalyst (Figure 11). However, in the case of Co/C, the proportion of light weight hydrocarbons produced was comparatively high. FT synthesis reactions were also carried out using carbonized samples of Ni2(bdc)2(dabco), Pt@Ni2(bdc)2(dabco), Zn2(bdc)2(dabco), and Pt@Zn2(bdc)2(dabco). However, catalytic activity and CO conversion rates were very low compared to those of the cobalt-based catalysts, and in the cases of Nickel and Zinc based catalyst, not much catalytic activity was observed. Nickel nanoparticles will also catalyze the reverse reaction and show undesirably high methane selectivity at various reaction temperatures that may be due to high hydrogenation activity. This kind of activity is common in nickel-based catalyst reactions [52]. Therefore, cobalt is the most suitable catalyst in the FTS rather than nickel and zinc.

3.2.1. Study of the FTS Mechanism

The conversion of CO in the presence of Pt@Co/C(10:1:2.4) is higher than that over Co/C and consequently the ratio of H/CO on the surface decreases. As a result, CO molecules are adsorbed effectively, which results in reduced adsorption of H2, leading to the formation of longer hydrocarbon chains [53]. Figure 5b and Figure 6, showing the TEM and elemental mapping results, suggesting a lower density of metal defect sites on the Co/C catalyst surface compared to that of Pt@Co/C(10:1:2.4). This is due to the larger particle size in the case of Co/C than in the corresponding Pt@Co/C(10:1:2.4) catalyst. Due to the addition of Pt, the particle size of Co decreases and the resulting Pt@Co/C(10:1:2.4) catalyst has a higher cobalt site density. In addition, Pt@Co/C(10:1:2.4) has a Co-HCP phase, which is known to contain a higher number of Co defect sites compared with the Co-FCC phase. As a result, the mobility of cobalt increases, which coupled with a decreasing number of anchoring sites in the reaction leading to a higher cluster growth rate [45]. Due to the larger number of defect sites in Pt@Co/C(10:1:2.4), more interaction occurs between the metal surface and the support promoters, which inhibits the agglomeration of the particles during the catalytic reaction [53].

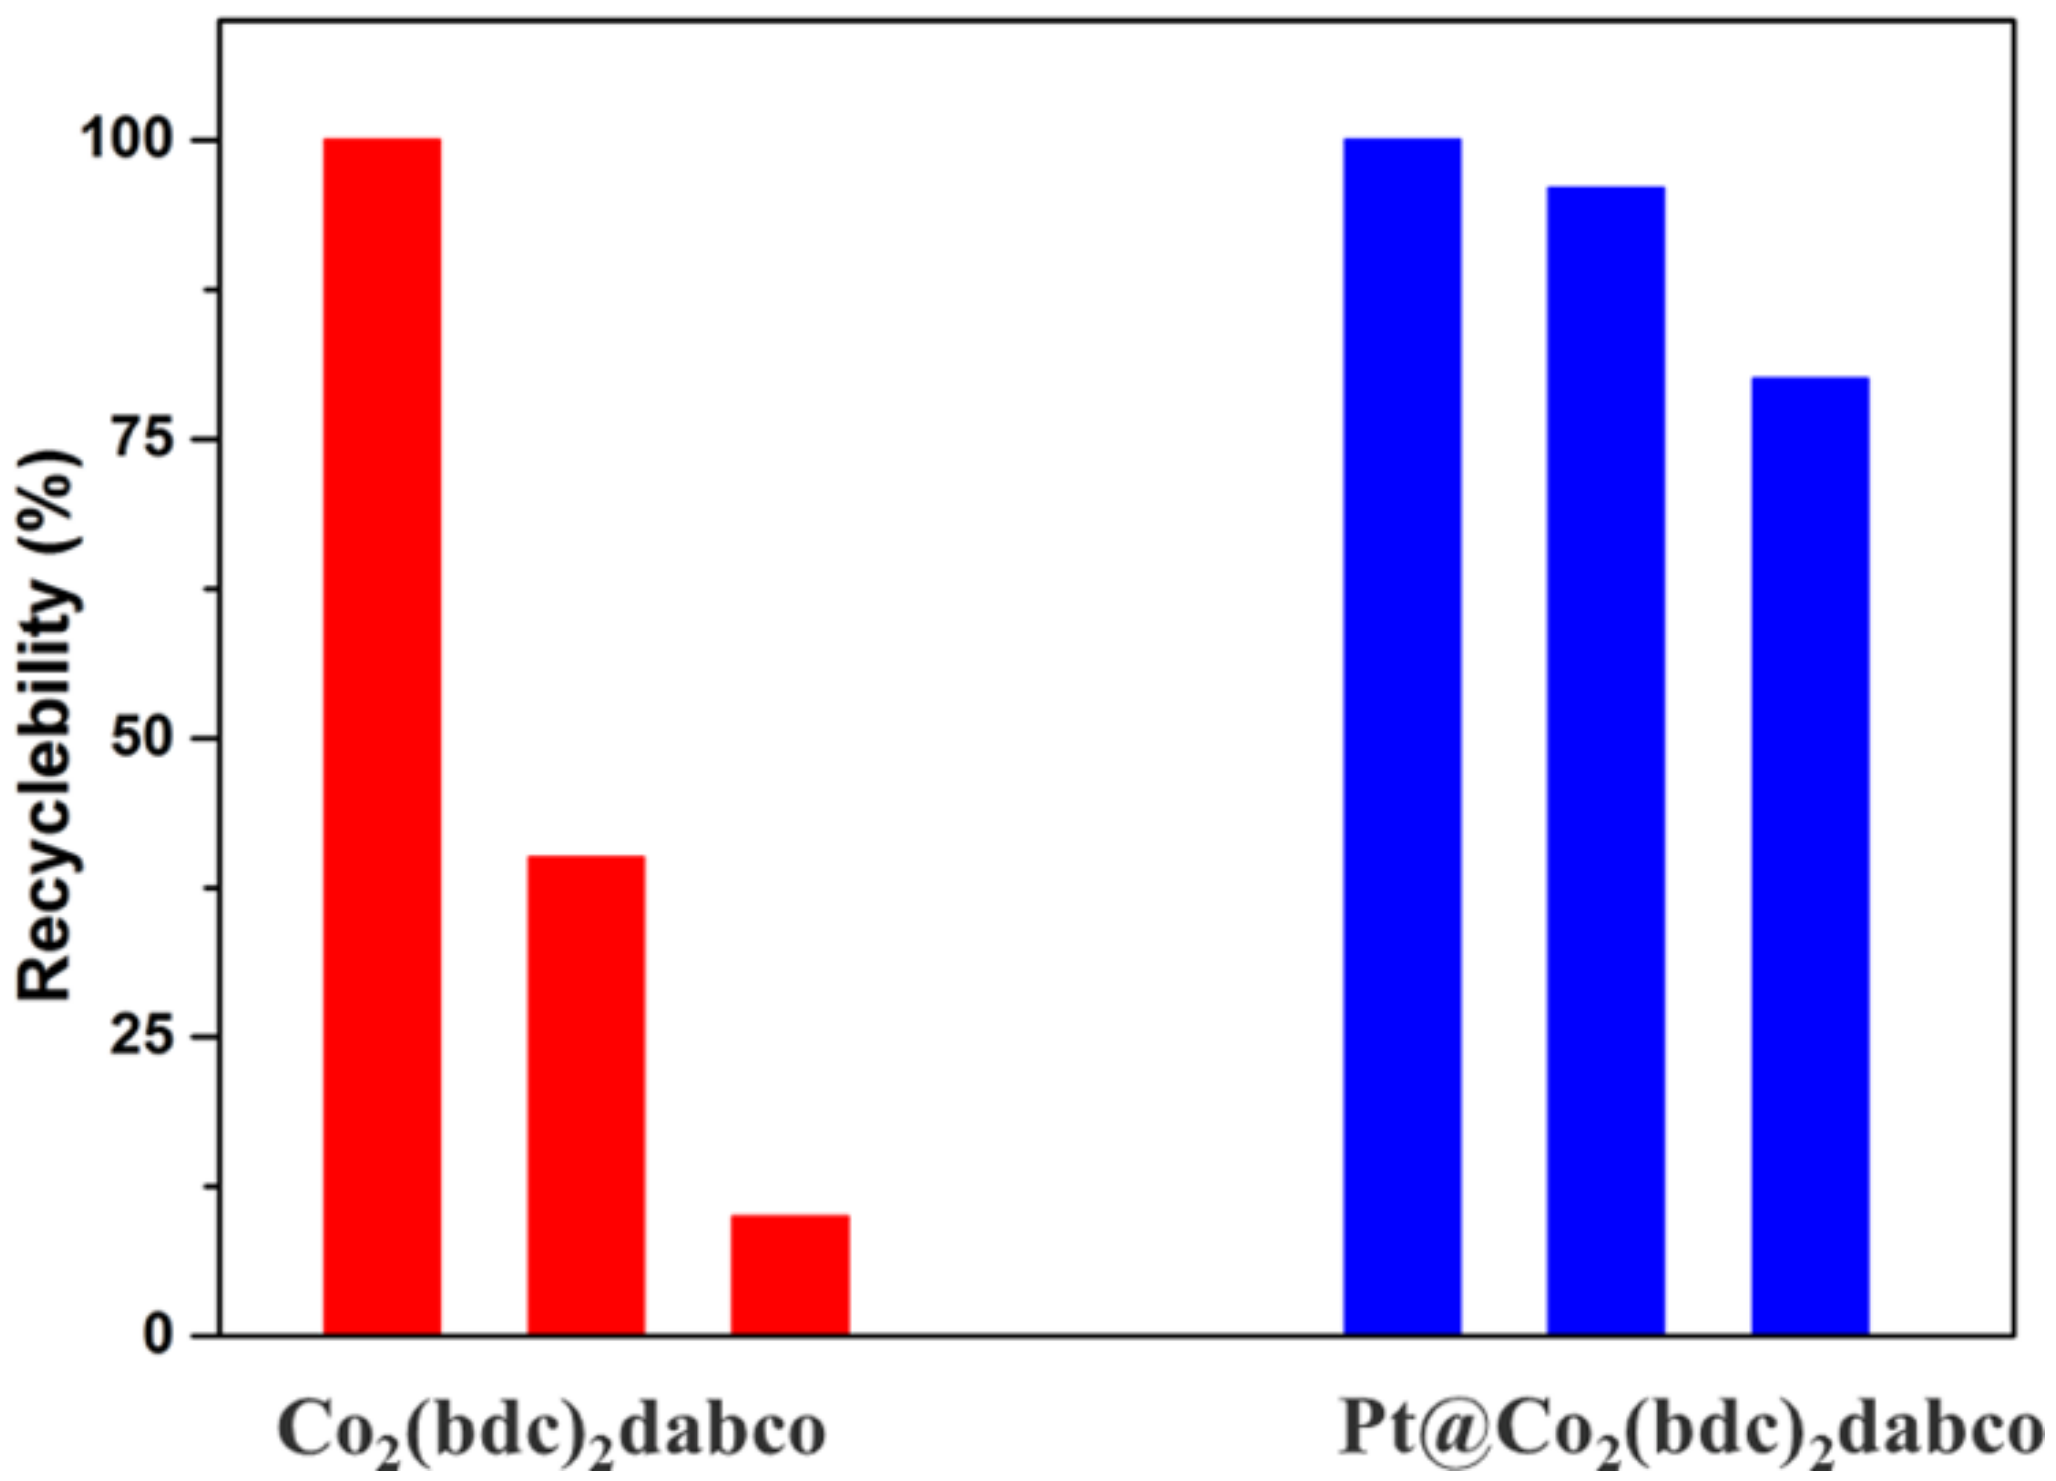
3.2.2. Catalyst Stability Test

Figure 12 shows the results of the PXRD analysis of the structural change in each sample after catalysis. In the case of Pt@Co/C(10:1:2.4) no structural change was observed, however, in the case of Co/C, cobalt was oxidized to CoO. This demonstrates the stability of the Pt@Co/C (10:1:2.4) catalyst, relative to the un-doped catalyst.
To analyze the difference in chemical state before and after, we measured the inductively coupled plasma atomic emission spectra (ICP-AES). It was found that the contents of cobalt and platinum did not change significantly (Table S5). Moreover, recycle experiments were conducted to determine the stability of the catalyst. After three cycles, catalytic efficiency decreased for Co/C (Figure 13) that occurs as the pores and the surface of the sample became blocked by the wax generated during the experiment using the high-pressure and temperatures. The blocking of the catalytic sites prohibits reaction of the syngas at the active metal surface of the cobalt catalyst. This is evident from the TEM images (Figure 14b,e). In addition, cobalt is no longer able to act as a catalyst for repeated cycles as it becomes oxidized (Figure 12a). In case of Pt@Co/C (10:1:2.4), however, due to the presence of platinum, wax formation is reduced. In addition, the carbon deposited around the catalyst metal surface and the reduced reaction temperature than that used with the un-doped catalyst due to the presence of platinum allowed better stability for Pt@Co/C.
In the case of Pt@Ni/C, a small new peak appeared near the main peak, as shown in Figure S6a. It was confirmed that the nickel-containing material was not reduced by platinum at low temperatures and the Ni/C material was not significantly changed by the catalytic process (Figure S6b). In addition, no changes were observed in Pt@Zn/C and Zn/C before and after catalysis (Figure S7a,b). To confirm the change during the catalytic reaction, Co/C and Pt@Co/C(10:1:2.4) samples were measured using TEM (Figure 14) and SEM (Figures S8 and S9). As a result, it was confirmed that cobalt was reduced by platinum at a low temperature. Based on the elemental distribution (Figure 14g), the platinum particles occured on the sample surface, and it can be confirmed from the black dots of the TEM. There was no significant change in the catalyst structure after the catalytic reaction, however, it was confirmed that the surface was coated with wax.

3.3. Comparison with the Literature

In the present study, the cobalt MOF derived FTS catalysts provided much higher total CO conversions than conventional cobalt-base catalysts. In the case of Co/C, the CO conversion was approximately 30%, while for Pt@Co/C(10:1:2.4), the conversion was even higher, at 35%, even under a very low syngas pressure (1 MPa). Santos et al. reported a CO conversion of approximately 14.6% using an Fe based catalyst [54]. Wezendonk et al. [55] used a Fe-based catalyst to achieve a CO conversion of up to 33.8%. Cobalt-based FTS catalysts reported by Isaeva et al. [56] and Qiu et al. [57] showed significantly lower CO conversions of approximately 23.8%, 10%, and 30% respectively. In addition, the experimental temperature (250 °C) used in this study is lower compared to those used with the other metal-based catalysts reported by Santos et al. A comparison of CO conversion rates and reaction temperatures has been summarized in Table S6.

4. Materials and Methods

4.1. Chemicals and Materials

All chemicals have been used as received without any further purification. Cobalt (II) chloride hexahydrate, nickel nitrate hexahydrate, and zinc nitrate hexahydrate were purchased from Sigma Aldrich. Platinum (II) bromide was purchased from Alfa Aesar. 1,4-diazabicyclo{2,2,2}octane (dabco), and sodium borohydride (NaBH4) were purchased from TCI. Acetonitrile, N,N-dimethylformamide (DMF) and other solvents were purchased from a local company, Samchun chemicals.

4.2. Instruments and Experimental Conditions

A Pyrotech tube furnace was used for carbonization experiments, using tube type one. The temperature step was 10 °C/min, and the argon gas flow rate was approximately 150 cc/min. After completion of carbonization, the sample was cooled under an argon gas flow.
The crystal structures of the samples before and after carbonization were determined using a powder X-ray diffractometer (Rigaku D/MAX-2200, horizontal type, Hajima, Japan). The sample was finely ground and placed flat on a glass plate. (Cu Kα radiation, at a wavelength of 1.54178 Å, 40 kV, 30 mA).
The surface areas of the samples were measured using a Micromeritics ASAP-2020 instrument. The weight of the samples was in the range of 50–70 mg and the measurements were conducted at −196 °C, using liquid nitrogen cooling.
X-ray photoelectron spectroscopy (K-alpha, Thermo Scientific, Waltham, MA, USA) was used to identify the elements in the carbonized samples.
TEM measurements were performed using a JEM-2100F field emission electron microscope (JEOL Ltd., Tokyo, Japan). SEM measurements were performed using a JSM-7500F field emission scanning electron microscope (JEOL Ltd, Tokyo, Japan).
To investigate the FTS catalytic reaction, a Parr 4842 high pressure reactor was used. The sample, weighing approximately 50 mg, was placed in the high-pressure reactor and a pressure of approximately 10 bar of syngas (CO:H2 = 1:2) was applied and maintained as the sample was heated to 250 °C for 100 hours. After the removal of water, the mass of the gaseous products was measured by GC using a GCMS-QP2010 Plus (Shimadzu Corp., Kyoto, Japan). The conversion rate and recyclability of the samples was measured using a YL6500 GC (YL Instruments, Gyeonggi-do, Korea).

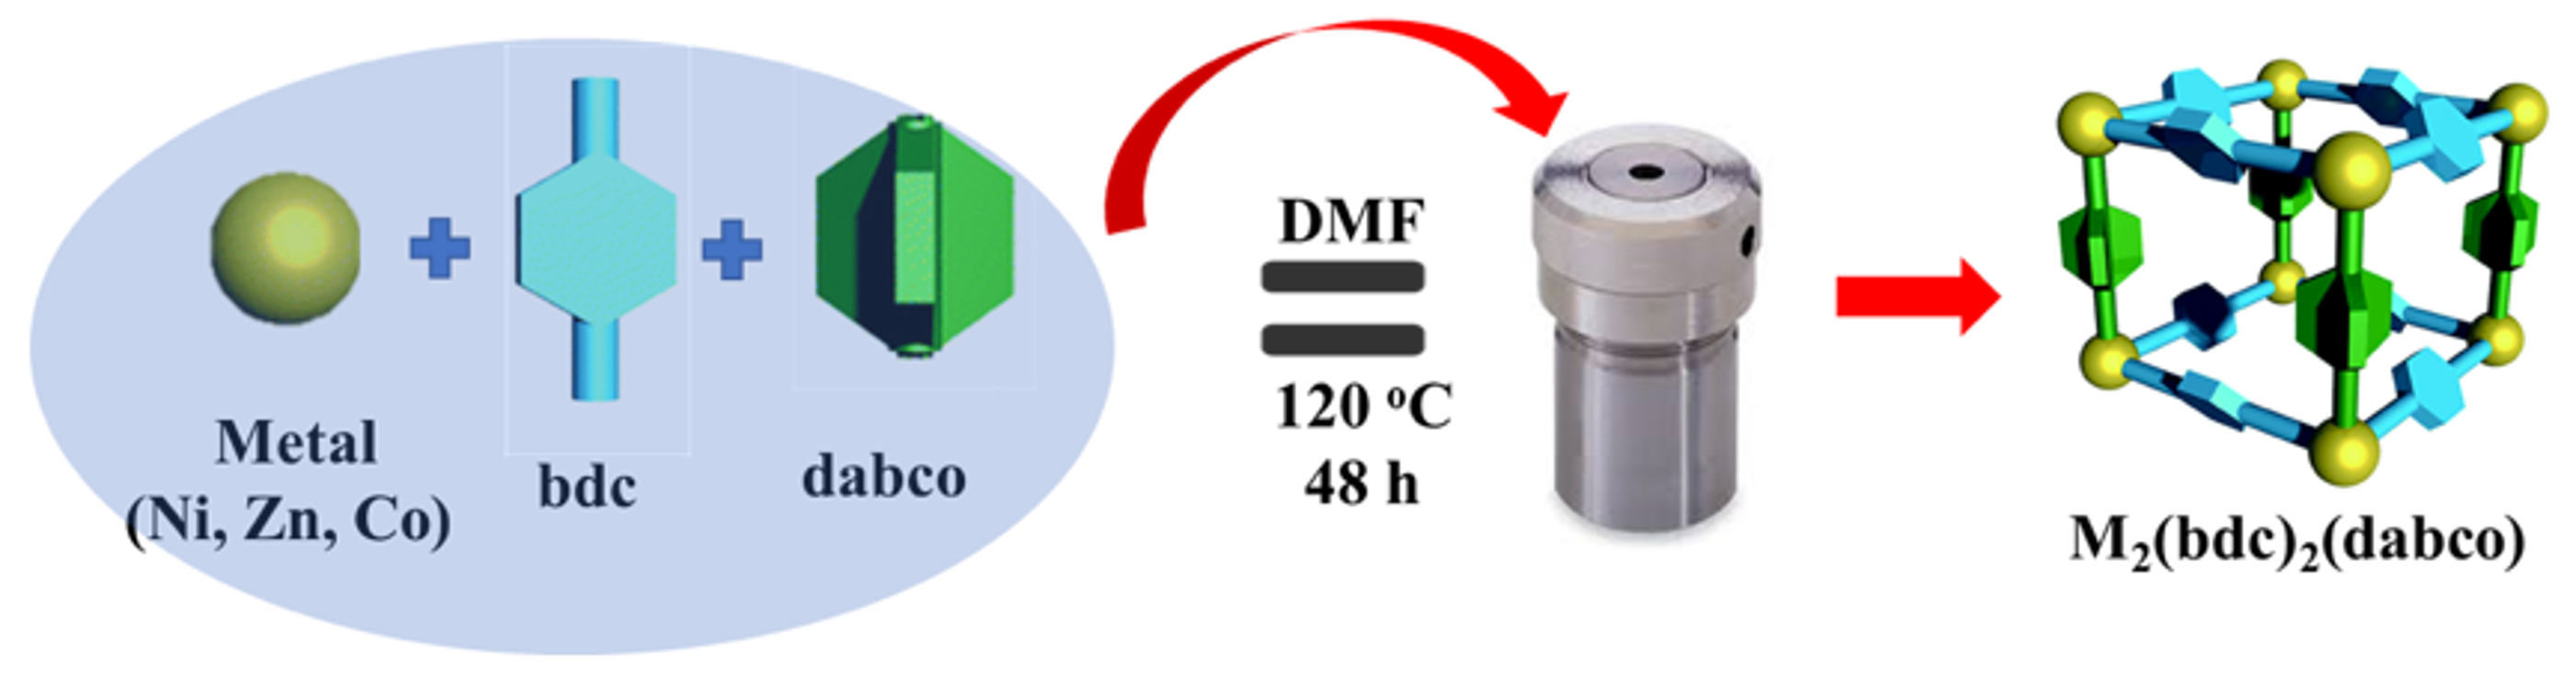
4.3. Synthesis of M2(bdc)2(dabco)

M2(bdc)2(dabco) (M = Co, Ni, Zn) were synthesized using a previously reported method with slight modifications [58]. Cobalt (II) chloride hexahydrate (1.18 g, 5.0 mmol), nickel nitrate hexahydrate (1.45 g, 5.0 mmol) and zinc nitrate hexahydrate (1.49 g, 5.0 mmol) were placed in 20 mL vials. 1,4-diazabicyclo{2,2,2}octane (0.28 g, 2.5 mmol) and terephthalic acid (0.83 g, 5.0 mmol) in DMF (20 mL) were added to each vial, followed by 5 min of sonication to produce clear solutions. 10 mL of clear solution was removed from each of the 20 mL vials and transferred to a 50 mL Teflon tube autoclave. (Scheme 1) Next, the autoclave was placed in a preheated hot air oven at 120 °C for 48 h to obtain the desired products. The precipitated products were washed thoroughly with DMF and acetonitrile (three times in 10 mL) and soaked in each solution for one day. The products were vacuum dried at 130 °C for a day with the guest inside.

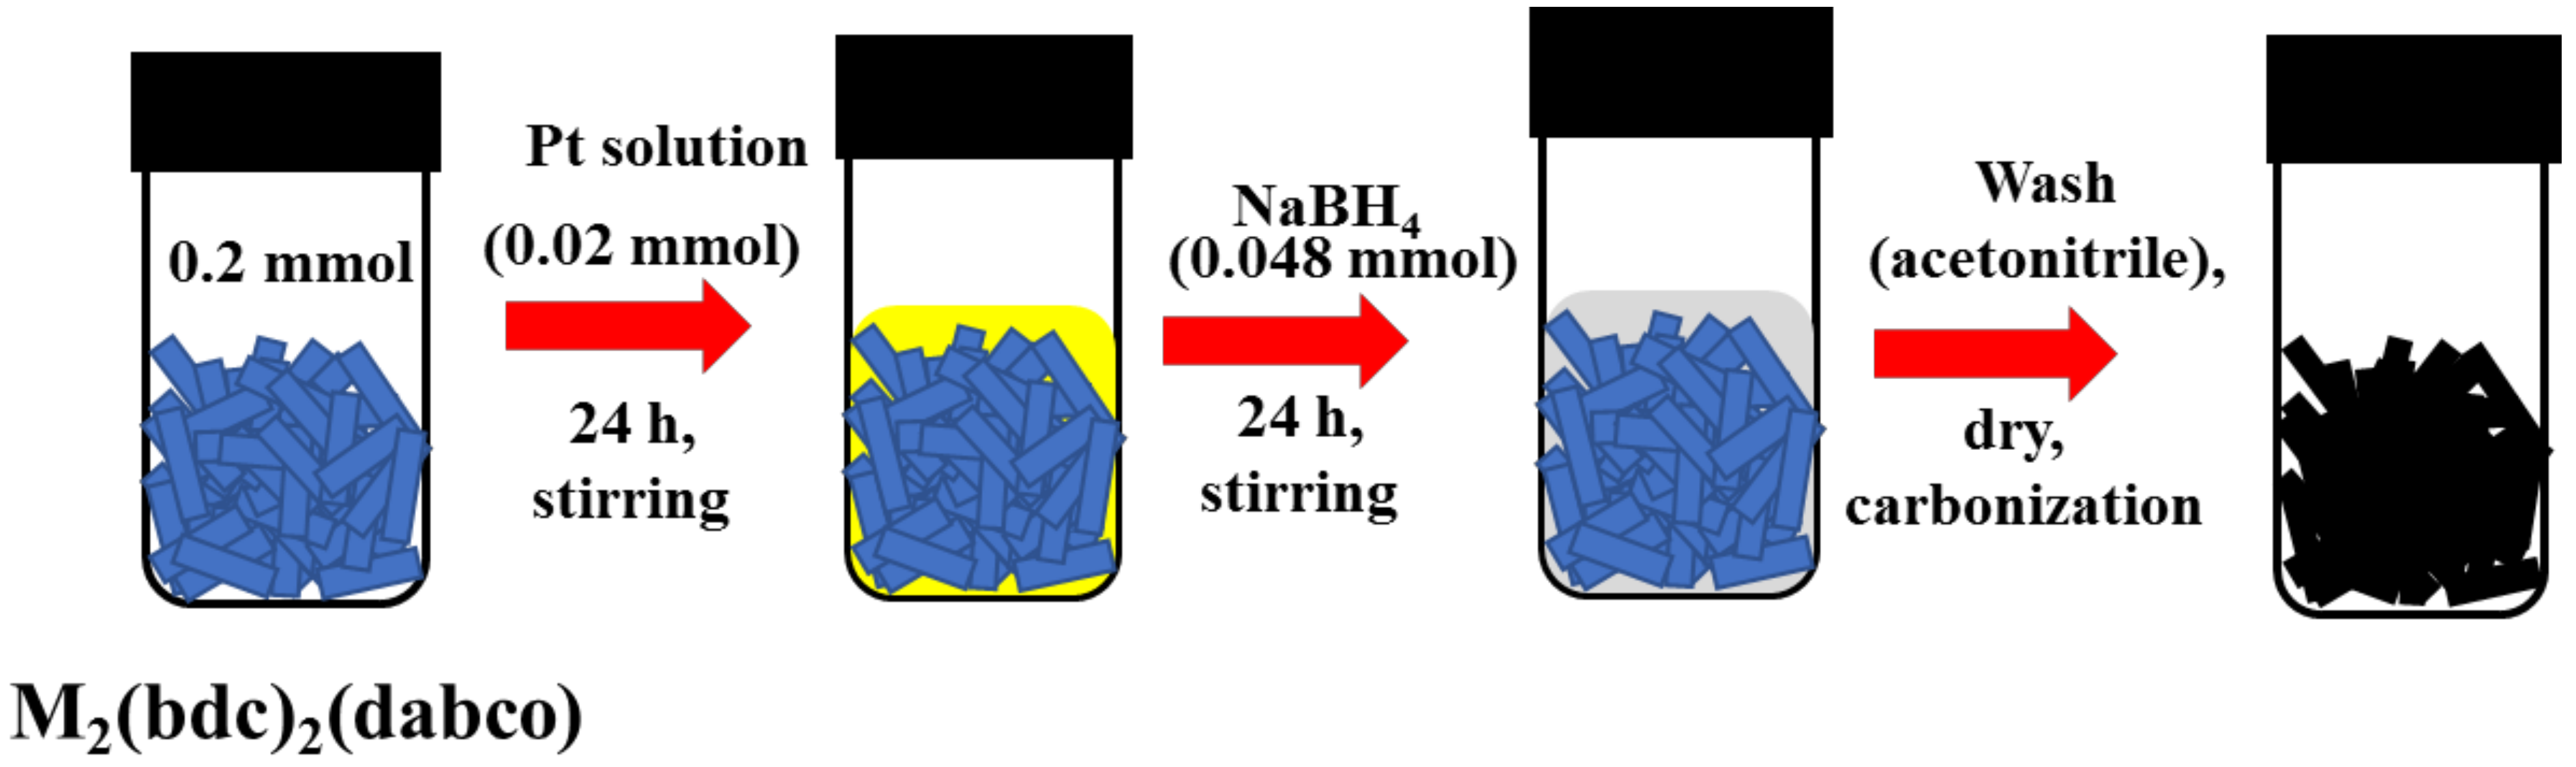
4.4. Synthesis of Pt@M2(bdc)2(dabco)

In general, Pt@M2(bdc)2(dabco) was synthesized by immersing a quantity (0.2 mmol, 0.4 mmol, or 1 mmol) of M2(bdc)2(dabco) in a solution of PtBr2 in acetonitrile (10 ml, 0.02 mmol) for 24 h, with gentle stirring. Next, we added a well-dispersed solution of NaBH4 in acetonitrile (1.2 mL, 2.4 mL, 4.8 mL) and continued stirring for 12 h. (Scheme 2) The products were washed with acetonitrile (3 times 10 mL) and dried under vacuum at 130 °C for one day.

4.5. Synthesis of Pt-doped M/C Catalysts

The Pt-doped M/C composites were synthesized by carbonization of Pt@M2(bdc)2(dabco) under a continuous flow of Ar (150 cc/min). Typically, M2(bdc)2(dabco) and Pt@M2(bdc)2(dabco) were loaded into a fixed bed reactor and heated to the chosen temperature (500 °C, 800 °C or 1000 °C) for a given time interval (4, 6, 9, 12, 18, or 24 h). The heating rate was approximately 10 °C per min. The catalysts were designated Pt@Co/C and had cobalt: Platinum weight ratios of 0.1, 0.05, and 0.2. We designated the catalysts with the corresponding molar ratio (Co:Pt:NaBH4), as e.g., Pt@Co/C(10:1:2.4), Pt@Co/C(10:1:1.2),and Pt@Co/C(20:1:1.2) shown in (Table 1).

5. Conclusions

In this study, we controlled the phase of the cobalt catalyst structure using various synthetic conditions. The experimental results indicated that the structure of cobalt could be tailored using the quantity of platinum dopant. The HCP structure is formed at high temperatures (up to 1000 °C), regardless of the sample composition. The transition from the FCC phase to the HCP phase is brought on by the reduction and carbonization of the Co-based MOF, leading to an increase in metallic Co active sites on the catalyst surface. We have shown the benefits of cobalt-based metal organic frameworks for highly effective FT catalysis. Additionally, we have demonstrated that Co/C could be a good candidate for the preparation of a porous, carbon-supported FT catalyst, which has very good catalytic activity, a high surface density of metal active sites, and good reproducibility, compared to other nickel and zinc-based systems. The addition of Pt into the parent MOF significantly increases the catalytic activity of Pt@Co/C(10:1:2.4). Moreover, this system shows a very good selectivity for hydrocarbons (C2+ and higher) and solid wax (C20+) as major products. The total conversion of CO by Pt@Co/C(10:1:2.4) was calculated as approximately 35%, whereas for Co/C the conversion was 30%. These values represent some of the best CO conversion rates reported to date, which is made more remarkable when the fact that we used a syngas pressure of only 1 MPa is considered. Due to the extremely high active cobalt sites, this system has potential for industrial application in the Fischer-Tropsch process.

Supplementary Materials

The following are available online at https://www.mdpi.com/2073-4344/9/2/156/s1, Figure S1. PXRD analysis of Pt@Ni/C and Ni/C after carbonization at 800 °C, for 4 h, under argon, Figure S2. PXRD analysis of Pt@Zn/C and Zn/C after carbonization at 800 °C, for 4 h, under argon, Figure S3. XPS analysis of Ni/C and Pt@Ni/C (a) XPS total survey scan, (b) XPS deconvolution of Pt 4f, (c) XPS deconvolution of Ni 2p and (d) XPS deconvolution of N 1s, Figure S4. XPS analysis of Zn@C and Pt@Zn/C (a) XPS total survey scan, (b) XPS deconvolution of Pt 4f, (c) XPS deconvolution of Zn 2p and (d) XPS deconvolution of N 1s, Figure S5. PXRD analysis of Pt@Co/C(10:1:1.2) and Pt@Co/C(20:1:2.4) at different carbonization temperatures, Figure S6. PXRD analysis of Pt@Ni/C and Ni2@C before and after FTS, Figure S7. PXRD analysis of Pt@Zn/C and Zn/C before and after FTS, Figure S8. SEM data of Co/C before and after the catalytic reaction, Figure S9. SEM data of Pt@Co/C (10:1:02.4) before and after the catalytic reaction, Table S1. Elemental analysis of Pt@M/C and M/C (M = Co, Ni, Zn), Table S2. XPS analysis of Pt@M/C and M/C (M = Co, Ni, Zn), Table S3. Different carbonization temperatures for Pt@Co/C(10:1:2.4), Table S4. Different carbonization times for Pt@Co/C(10:1:2.4) at a fixed temperature of 800 °C, Table S5. ICP-AES analysis of Pt@Co/C(10:1:2.4) and Co/C, Table S6: Comparison Table of the present study with the literature.

Author Contributions

A.P. and E.K. contributed equally to this work. E.K., Y.N.C., and M.Y. contributed conceptualization. E.K., J.L., Y.N.C., and A.P. contributed investigation and characterization. A.P. and S.V. wrote the manuscript. S.V. and M.Y. revised the manuscript. M.Y. supervised the project and revised the manuscript.

Funding

This work was supported by a National Research Foundation of Korea grant funded by the Ministry of Education (NRF-2016R1D1A1B03930948 to M.Y.) and by Ministry of Science and ICT (NRF-2017R1C1B5076834 to S.V.).

Acknowledgments

The XRD experiment at the PLS-II, 2D-SMC beamline was supported in part by MEST and POSTECH.

Conflicts of Interest

The authors declare no conflict of interest.

References

  1. Wei, J.; Ge, Q.; Yao, R.; Wen, Z.; Fang, C.; Guo, L.; Xu, H.; Sun, J. Directly converting CO2 into a gasoline fuel. Nat. Comm. 2017, 8, 15174–15178. [Google Scholar] [CrossRef] [PubMed]
  2. Fischer, F.; Tropsch, H. On the Direct Synthesis of Petroleum Hydrocarbons at Ordinary Pressure. (First Communication). Dtsch. Chem. Ges. 1926, 59, 830–831. [Google Scholar] [CrossRef]
  3. Yao, Y.; Hildebrandt, D.; Glasser, D.; Liu, X. Fischer-Tropsch Synthesis Using H2/CO/CO2 Syngas Mixtures over a Cobalt Catalyst. Ind. Eng. Chem. Res. 2010, 49, 11061–11066. [Google Scholar] [CrossRef]
  4. Bai, L.; Deng, S.; Dong, G.; Liren, C.; Hongwei, X.; Yongwang, L. Research Status and Industrial Prospects of Coal Indirect Liquefaction Technology. Chem. Ind. Eng. Prog. 2003, 22, 441–447. [Google Scholar]
  5. Fischer, F.; Tropsch, H. Uber die Herstellung synthetischer olgemische (Synthol) durch Aufbau aus Kohlenoxyd und Wasserstoff. Brennst. Chem. 1923, 4, 276–285. [Google Scholar]
  6. Beaumont, S.K. Recent developments in the application of nanomaterials to understanding molecular level processes in cobalt catalysed Fischer–Tropsch synthesis. Phys. Chem. Chem. Phys. 2014, 16, 5034–5043. [Google Scholar] [CrossRef] [PubMed] [Green Version]
  7. Kang, J.; Zhang, S.; Zhang, Q.; Wang, Y. Ruthenium nanoparticles supported on carbon nanotubes as efficient catalysts for selective conversion of synthesis gas to diesel fuel. Angew. Chem. Int. Ed. 2009, 48, 2565–2568. [Google Scholar] [CrossRef] [PubMed]
  8. Zhao, P.; He, Y.R.; Cao, D.B.; Wen, X.D.; Xiang, H.W.; Li, Y.W.; Wang, J.G.; Jiao, H.J. High coverage adsorption and co-adsorption of CO and H2 on Ru (0001) from DFT and thermodynamics. Phys. Chem. Chem. Phys. 2015, 17, 19446–19456. [Google Scholar]
  9. Xie, J.X.; Yang, J.A.; Dugulan, I.; Holmen, A.; Chen, D.; Jong, K.P.D.; Louwerse, M.J. Size and promoter effects in supported iron Fischer–Tropsch catalysts: Insights from experiment and theory. ACS Catal. 2016, 6, 3147–3157. [Google Scholar] [CrossRef]
  10. Galvis, H.M.T.; Bitter, J.H.; Davidian, T.; Ruitenbeek, M.; Dugulan, A.I.; Jong, K.P.D. Iron particle size effects for direct production of lower olefins from synthesis gas. J. Am. Chem. Soc. 2012, 134, 16207–16215. [Google Scholar] [CrossRef]
  11. Yang, C.; Zhao, H.B.; Hou, Y.L.; Ma, D. Fe5C2 nanoparticles: A facile bromide-induced synthesis and as an active phase for Fischer–Tropsch synthesis. J. Am. Chem. Soc. 2012, 134, 15814–15821. [Google Scholar] [CrossRef] [PubMed]
  12. Zhang, Q.; Deng, W.; Wang, Y. Recent advances in understanding the key catalyst factors for Fischer-Tropsch synthesis. J. Energy Chem. 2013, 22, 27–38. [Google Scholar] [CrossRef]
  13. Zhang, Q.; Kang, J.; Wang, Y. Development of novel catalysts for Fischer–Tropsch synthesis: Tuning the product selectivity. ChemCatChem 2010, 2, 1030–1058. [Google Scholar] [CrossRef]
  14. Shi, L.; Li, D.; Hou, B.; Wang, Y.; Sun, Y. The modification of SiO2 by various organic groups and its influence on the properties of cobalt-based catalysts for Fischer–Tropsch synthesis. Fuel Process Technol. 2010, 91, 394–398. [Google Scholar] [CrossRef]
  15. Zhang, Y.; Hanayama, K.; Tsubaki, N. The surface modification effects of silica support by organic solvents for Fischer–Tropsch synthesis catalysts. Catal. Commun. 2006, 7, 251–254. [Google Scholar] [CrossRef]
  16. Chen, W.; Lin, T.; Dai, Y.; An, Y.; Yu, F.; Zhong, L.; Li, S.; Sun, Y. Recent advances in the investigation of nanoeffects of Fischer-Tropsch catalysts. Catal. Today 2018, 311, 8–22. [Google Scholar] [CrossRef]
  17. Park, J.C.; Kwon, J.I.; Kang, S.W.; Chun, D.H.; Jung, H.; Lee, H.T.; Yang, J.I. Highly productive cobalt nanoparticles supported on mesocellular silica foam for the Fischer–Tropsch reaction. New J. Chem. 2016, 40, 9586–9592. [Google Scholar] [CrossRef]
  18. Chu, W.; Chernavskii, P.A.; Gengembre, L.; Pankina, G.A.; Fongarland, P.; Khodakov, A.Y. Cobalt species in promoted cobalt alumina-supported Fischer–Tropsch catalysts. J. Catal. 2007, 252, 215–230. [Google Scholar] [CrossRef]
  19. Pirola, C.; Scavini, M.; Galli, F.; Vitali, S.; Comazzi, A.; Manenti, F.; Ghigna, P. Fischer–Tropsch synthesis: EXAFS study of Ru and Pt bimetallic Co based catalysts. Fuel 2014, 132, 62–70. [Google Scholar] [CrossRef]
  20. Beaumont, S.K.; Alayoglu, S.; Specht, C.; Michalak, W.D.; Pushkarev, V.V.; Guo, J.; Kruse, N.; Somorjai, G.A. Combining in situ NEXAFS spectroscopy and CO2 methanation kinetics to study Pt and Co nanoparticle catalysts reveals key insights into the role of platinum in promoted cobalt catalysis. J. Am. Chem. Soc. 2014, 136, 9898–9901. [Google Scholar] [CrossRef]
  21. Kaye, S.S.; Dailly, A.; Yaghi, O.M.; Long, J.R. Impact of preparation and handling on the hydrogen storage properties of Zn4O (1, 4-benzenedicarboxylate)3(MOF-5). J. Am. Chem. Soc. 2007, 129, 14176–14177. [Google Scholar] [CrossRef] [PubMed]
  22. Jiang, D.; Mallat, T.; Krumeich, F.; Baiker, A. Copper-based metal-organic framework for the facile ring-opening of epoxides. J. Catal. 2008, 257, 390–395. [Google Scholar] [CrossRef]
  23. Ma, D.; Li, B.; Zhou, X.; Zhou, Q.; Liu, K.; Zeng, G.; Li, G.; Shi, Z.; Feng, S. A dual functional MOF as a luminescent sensor for quantitatively detecting the concentration of nitrobenzene and temperature. Chem. Commun. 2013, 49, 8964–8966. [Google Scholar]
  24. Bux, H.; Chmelik, C.; Krishna, R.; Caro, J. Ethene/ethane separation by the MOF membrane ZIF-8: Molecular correlation of permeation, adsorption, diffusion. J. Membr. Sci. 2011, 369, 284–289. [Google Scholar] [CrossRef]
  25. Alezi, D.; Belmabkhout, Y.; Suyetin, M.; Bhatt, P.M.; Weseliński, Ł.J.; Solovyeva, V.; Adil, K.; Spanopoulos, I.; Trikalitis, P.N.; Emwas, A.H.; et al. MOF crystal chemistry paving the way to gas storage needs: Aluminum-based soc-MOF for CH4, O2, and CO2 storage. J. Am. Chem. Soc. 2015, 137, 133081–133318. [Google Scholar] [CrossRef] [PubMed]
  26. Taghavi, S.; Asghari, A.; Tavasoli, A. Enhancement of performance and stability of Graphene nano sheets supported cobalt catalyst in Fischer–Tropsch synthesis using Graphene functionalization. Chem. Eng. Res. Des. 2017, 199, 198–208. [Google Scholar] [CrossRef]
  27. Wezendonk, T.A.; Sun, X.; Dugulan, A.I.; van Hoof, A.J.; Hensen, E.J.; Kapteijn, F.; Gascon, J. Controlled formation of iron carbides and their performance in Fischer-Tropsch synthesis. J. Catal. 2018, 362, 106–117. [Google Scholar] [CrossRef]
  28. Liu, G.; Chen, Q.; Oyunkhand, E.; Ding, S.; Yamane, N.; Yang, G.; Yoneyama, Y.; Tsubaki, N. Nitrogen-rich mesoporous carbon supported iron catalyst with superior activity for Fischer-Tropsch synthesis. Carbon 2018, 130, 304–314. [Google Scholar] [CrossRef]
  29. Bahome, M.C.; Jewell, L.L.; Hildebrandt, D.; Glasser, D.; Coville, N.J. Fischer–Tropsch synthesis over iron catalysts supported on carbon nanotubes. Appl. Catal. A-Gen 2005, 287, 60–67. [Google Scholar] [CrossRef]
  30. Das, R.; Pachfule, P.; Banerjee, R.; Poddar, P. Metal and metal oxide nanoparticle synthesis from metal organic frameworks (MOFs): Finding the border of metal and metal oxides. Nanoscale 2012, 4, 591–599. [Google Scholar] [CrossRef]
  31. Bai, C.H.; Yao, X.F.; Li, Y.W. Easy access to amides through aldehydic C2H bond functionalization catalyzed by heterogeneous Co-based catalysts. ACS Catal. 2015, 5, 884–891. [Google Scholar] [CrossRef]
  32. Long, J.L.; Zhou, Y.; Li, Y.W. Transfer hydrogenation of unsaturated bonds in the absence of base additives catalyzed by a cobalt-based heterogeneous catalyst. Chem. Commun. 2015, 51, 2331–2334. [Google Scholar] [CrossRef] [PubMed]
  33. Chen, Y.Z.; Wang, C.M.; Wu, Z.Y.; Xiong, Y.J.; Xu, Q.; Yu, S.H.; Jiang, H.L. From bimetallic metal-organic framework to porous carbon: High surface area and multicomponent active dopants for excellent electrocatalysis. Adv. Mater. 2015, 27, 5010–5016. [Google Scholar] [CrossRef] [PubMed]
  34. Enache, D.I.; Rebours, B.; Roy-Auberger, M.; Revel, R.J. In situ XRD study of the influence of thermal treatment on the characteristics and the catalytic properties of cobalt-based Fischer–Tropsch catalysts. J. Catal. 2002, 205, 346–353. [Google Scholar] [CrossRef]
  35. Sadeqzadeh, M.; Karaca, H.; Safonova, O.V.; Fongarland, P.; Chambrey, S.; Roussel, P.; Griboval-Constant, A.; Lacroix, M.; Curulla-Ferre, D.; Luck, F.; et al. Identification of the active species in the working alumina-supported cobalt catalyst under various conditions of Fischer–Tropsch synthesis. Catal. Today 2011, 164, 62–67. [Google Scholar] [CrossRef]
  36. Liu, J.X.; Su, H.Y.; Sun, D.P.; Zhang, B.Y.; Li, W.X. Crystallographic dependence of CO activation on cobalt catalysts: HCP versus FCC. J. Am. Chem. Soc. 2013, 135, 16284–16287. [Google Scholar] [CrossRef] [PubMed]
  37. Pei, Y.; Li, Z.; Li, Y. Highly active and selective Co-based Fischer–Tropsch catalysts derived from metal–organic frameworks. AIChE J. 2017, 63, 2935–2944. [Google Scholar] [CrossRef]
  38. Lee, Y.W.; Hwang, E.T.; Kwak, D.H.; Park, K.W. Preparation and characterization of PtIr alloy dendritic nanostructures with superior electrochemical activity and stability in oxygen reduction and ethanol oxidation reactions. Catal. Sci. Technol. 2016, 6, 569–576. [Google Scholar] [CrossRef]
  39. Zheng, J.N.; Lv, J.J.; Li, S.S.; Xue, M.W.; Wang, A.J.; Feng, J.J. One-pot synthesis of reduced graphene oxide supported hollow Ag@Pt core–shell nanospheres with enhanced electrocatalytic activity for ethylene glycol oxidation. J. Mater. Chem. A 2016, 2, 3445–3451. [Google Scholar] [CrossRef]
  40. Woo, H.; Kim, E.; Kim, J.H.; Yun, S.W.; Park, J.C.; Kim, Y.T.; Park, K.H. Shape and Composition Control of Monodisperse Hybrid Pt-CoO Nanocrystals by Controlling the Reaction Kinetics with Additives. Sci. Rep. 2017, 7, 3851. [Google Scholar] [CrossRef]
  41. Holzwarth, U.; Gibson, N. The Scherrer equation versus the ‘Debye-Scherrer equation’. Nat. Nanotechnol. 2011, 6, 534–540. [Google Scholar] [CrossRef] [PubMed]
  42. De La Pena O’Shea, V.A.; De La Piscina, P.R.; Homs, N.; Aromi, G.; Fierro, J.L.G. Development of hexagonal closed-packed cobalt nanoparticles stable at high temperature. Chem. Mater. 2009, 21, 5637–5643. [Google Scholar] [CrossRef]
  43. Kitakami, O.; Sato, H.; Shimada, Y.; Sato, F.; Tanaka, M. Size effect on the crystal phase of cobalt fine particles. Phys. Rev. B 1997, 56, 13849–13845. [Google Scholar] [CrossRef]
  44. Puntes, V.F.; Zanchet, D.; Erdonmez, C.K.; Alivisatos, A.P. Synthesis of hcp-Co nanodisks. J. Am. Chem. Soc. 2002, 124, 12874–12880. [Google Scholar] [CrossRef] [PubMed]
  45. Karimi, S.; Tavasoli, A.; Mortazavi, Y.; Karimi, A. Cobalt supported on Graphene–A promising novel Fischer–Tropsch synthesis catalyst. Appl. Catal. A-Gen. 2015, 499, 188–196. [Google Scholar] [CrossRef]
  46. Liu, S.; Zhu, J.; Mastai, Y.; Felner, I.; Gedanken, A. Preparation and characteristics of carbon nanotubes filled with cobalt. Chem. Mater. 2000, 12, 2205–2211. [Google Scholar] [CrossRef]
  47. Guerret-Piecourt, C.; Le Bouar, Y.; Lolseau, A.; Pascard, H. Relation between metal electronic structure and morphology of metal compounds inside carbon nanotubes. Nature 1994, 372, 761–765. [Google Scholar] [CrossRef]
  48. Van de Loosdrecht, J.; Botes, F.G.; Ciobica, I.M.; Ferreira, A.C.; Gibson, P.; Moodley, D.J.; Saib, A.M.; Visagie, J.L.; Weststrate, C.J.; Niemantsverdriet, J.W. Fischer-Tropsch synthesis: Catalysts and chemistry. In Comprehensive Inorganic Chemistry II: From Elements to Applications; Elsevier: Amsterdam, The Netherlands, 2013; Volume 7, pp. 525–557. [Google Scholar]
  49. Khodakov, A.Y.; Chu, W.; Fongarland, P. Advances in the development of novel cobalt Fischer−Tropsch catalysts for synthesis of long-chain hydrocarbons and clean fuels. Chem. Rev. 2007, 107, 1692–1744. [Google Scholar] [CrossRef]
  50. Diehl, F.; Khodakov, A.Y. Promotion of cobalt Fischer-Tropsch catalysts with noble metals: A review. Oil Gas Sci. Technol. 2009, 64, 11–24. [Google Scholar] [CrossRef]
  51. Oosterbeek, H. Bridging the pressure and material gap in heterogeneous catalysis: Cobalt Fischer–Tropsch catalysts from surface science to industrial application. Phys. Chem. Chem. Phys. 2007, 9, 3570–3576. [Google Scholar] [CrossRef]
  52. Jahangiri, H.; Bennett, J.; Mahjoubi, P.; Wilson, K.; Gu, S. A review of advanced catalyst development for Fischer–Tropsch synthesis of hydrocarbons from biomass derived syn-gas. Catal. Sci Technol. 2014, 4, 2210–2229. [Google Scholar] [CrossRef] [Green Version]
  53. Yang, J.; Ma, W.; Chen, D.; Holmen, A.; Davis, B.H. Fischer–Tropsch synthesis: A review of the effect of CO conversion on methane selectivity. Appl. Catal. A-Gen. 2014, 470, 250–260. [Google Scholar] [CrossRef]
  54. Santos, V.P.; Wezendonk, T.A.; Jaen, J.J.D.; Dugulan, A.I.; Nasalevich, M.A.; Islam, H.U.; Chojecki, A.; Sartipi, S.; Sun, X.; Hakeem, A.A.; et al. Metal organic framework-mediated synthesis of highly active and stable Fischer-Tropsch catalysts. Nat. Comm. 2015, 6, 6451–6455. [Google Scholar] [CrossRef]
  55. Wezendonk, T.A.; Santos, V.P.; Nasalevich, M.A.; Warringa, Q.S.; Dugulan, A.I.; Chojecki, A.; Koeken, A.C.; Ruitenbeek, M.; Meima, G.; Islam, H.U.; et al. Elucidating the nature of Fe species during pyrolysis of the Fe-BTC MOF into highly active and stable Fischer–Tropsch catalysts. ACS Catal. 2016, 6, 3236–3247. [Google Scholar] [CrossRef]
  56. Isaeva, V.I.; Eliseev, O.L.; Kazantsev, R.V.; Chernyshev, V.V.; Davydov, P.E.; Saifutdinov, B.R.; Lapidus, A.L.; Kustov, L.M. Fischer–Tropsch synthesis over MOF-supported cobalt catalysts (Co@MIL-53 (Al)). Dalton Trans. 2016, 45, 12006–12014. [Google Scholar] [CrossRef] [PubMed]
  57. Qiu, B.; Yang, C.; Guo, W.; Xu, Y.; Liang, Z.; Ma, D.; Zou, R. Highly dispersed Co-based Fischer–Tropsch synthesis catalysts from metal–organic frameworks. J. Mater. Chem. A 2017, 5, 8081–8086. [Google Scholar] [CrossRef]
  58. Cadman, L.K.; Bristow, J.K.; Stubbs, N.E.; Tiana, D.; Mahon, M.F.; Walsh, A.; Burrows, A.D. Compositional control of pore geometry in multivariate metal–organic frameworks: An experimental and computational study. Dalton Trans. 2016, 45, 4316–4326. [Google Scholar] [CrossRef]
Figure 1. (a) Powder X-ray diffraction (PXRD) analysis and (b) Brunauer–Emmet–Teller (BET) analysis of M2(bdc)2(dabco) before carbonization.
Catalysts 09 00156 g001
Figure 2. PXRD analysis, after carbonization, of Pt@Co/C(10:1:2.4) and Co/C carbinized at 800 °C for 4 h under Ar.
Catalysts 09 00156 g002
Figure 3. BET analysis of (a) M/C and (b) Pt@M/C composites.
Catalysts 09 00156 g003
Figure 4. XPS analysis of Co/C and Pt@Co/C (10:1:2.4) (a) XPS total survey scan, (b) XPS deconvolution of Pt 4f, (c) XPS deconvolution of Co 2p and (d) XPS deconvolution of N 1s.
Catalysts 09 00156 g004
Figure 5. (ac) The TEM and HRTEM images of Co/C and (df) Pt@Co/C (10:1:2.4). (g) High-resolution TEM image of a hexagonally shaped cobalt core carbon shell of Co/C.
Catalysts 09 00156 g005
Figure 6. STEM elemental mapping of the Pt@Co/C composite.
Catalysts 09 00156 g006
Figure 7. PXRD data showing the change in cobalt structure under various concentrations (a) 0.6, (b) 1.2, and (c) 2.4 molar ratio of NaBH4 conditions carbonized metal-organic frameworks (MOF).
Catalysts 09 00156 g007
Figure 8. PXRD analysis of Pt@Co/C(10.1.2) at different carbonization temperatures.
Catalysts 09 00156 g008
Figure 9. PXRD analysis of Pt@Co@C (20:1:0.6) at different carbonization times and a temperature of 800 °C.
Catalysts 09 00156 g009
Figure 10. CO conversion (%) over Co/C and Pt@Co/C(10:1:2.4) in Fischer-Tropsch synthesis (FTS).
Catalysts 09 00156 g010
Figure 11. Selectivity for the hydrocarbons produced in FTS.
Catalysts 09 00156 g011
Figure 12. PXRD analysis of (a) Co/C and (b) Pt@Co/C, before and after Fischer-Tropsch reaction.
Catalysts 09 00156 g012
Figure 13. Recyclability test of Co/C and Pt@Co/C (10:1:2.4) relative to catalytic efficiency.
Catalysts 09 00156 g013
Figure 14. TEM analysis of Co/C (ac) and of Pt@Co/C(10:1:2.4) (df) after the catalytic process, and (g) the STEM elemental distribution in Pt@Co/C(10:1:2.4).
Catalysts 09 00156 g014
Scheme 1. Typical synthesis of a M2(bdc)2(dabco) catalyst.
Catalysts 09 00156 sch001
Scheme 2. Synthesis of Pt@M/C composites.
Catalysts 09 00156 sch002
Table 1. Conversion of the cobalt structure from the FCC phase to the HCP phase at different composition ratios.
Co: Pt: NaBH410:1:0.610:1:1.210:1:2.420:1:0.620:1:1.220:1:2.4
FCC %69%49%12%72.4%65%14%
HCP %31%51%88%27.6%35%86%

