1. Introduction
A surface plasmon is a common oscillation that excites free electrons at the interface between metal and dielectric [
1,
2,
3]. Surface plasmon resonance, at a specific wavelength, is excited by an incident laser, resulting in a large enhancement in the local electromagnetic field. The field of electromagnetic field enhancement for surface-enhanced Raman spectroscopy and tip-enhanced Raman spectroscopy is a physical enhancement mechanism. Generally speaking, metal nanostructures, based on local surface plasmon (LSP) and propagating surface plasmon (PSP), have revealed many fantastic properties. As demonstrated in
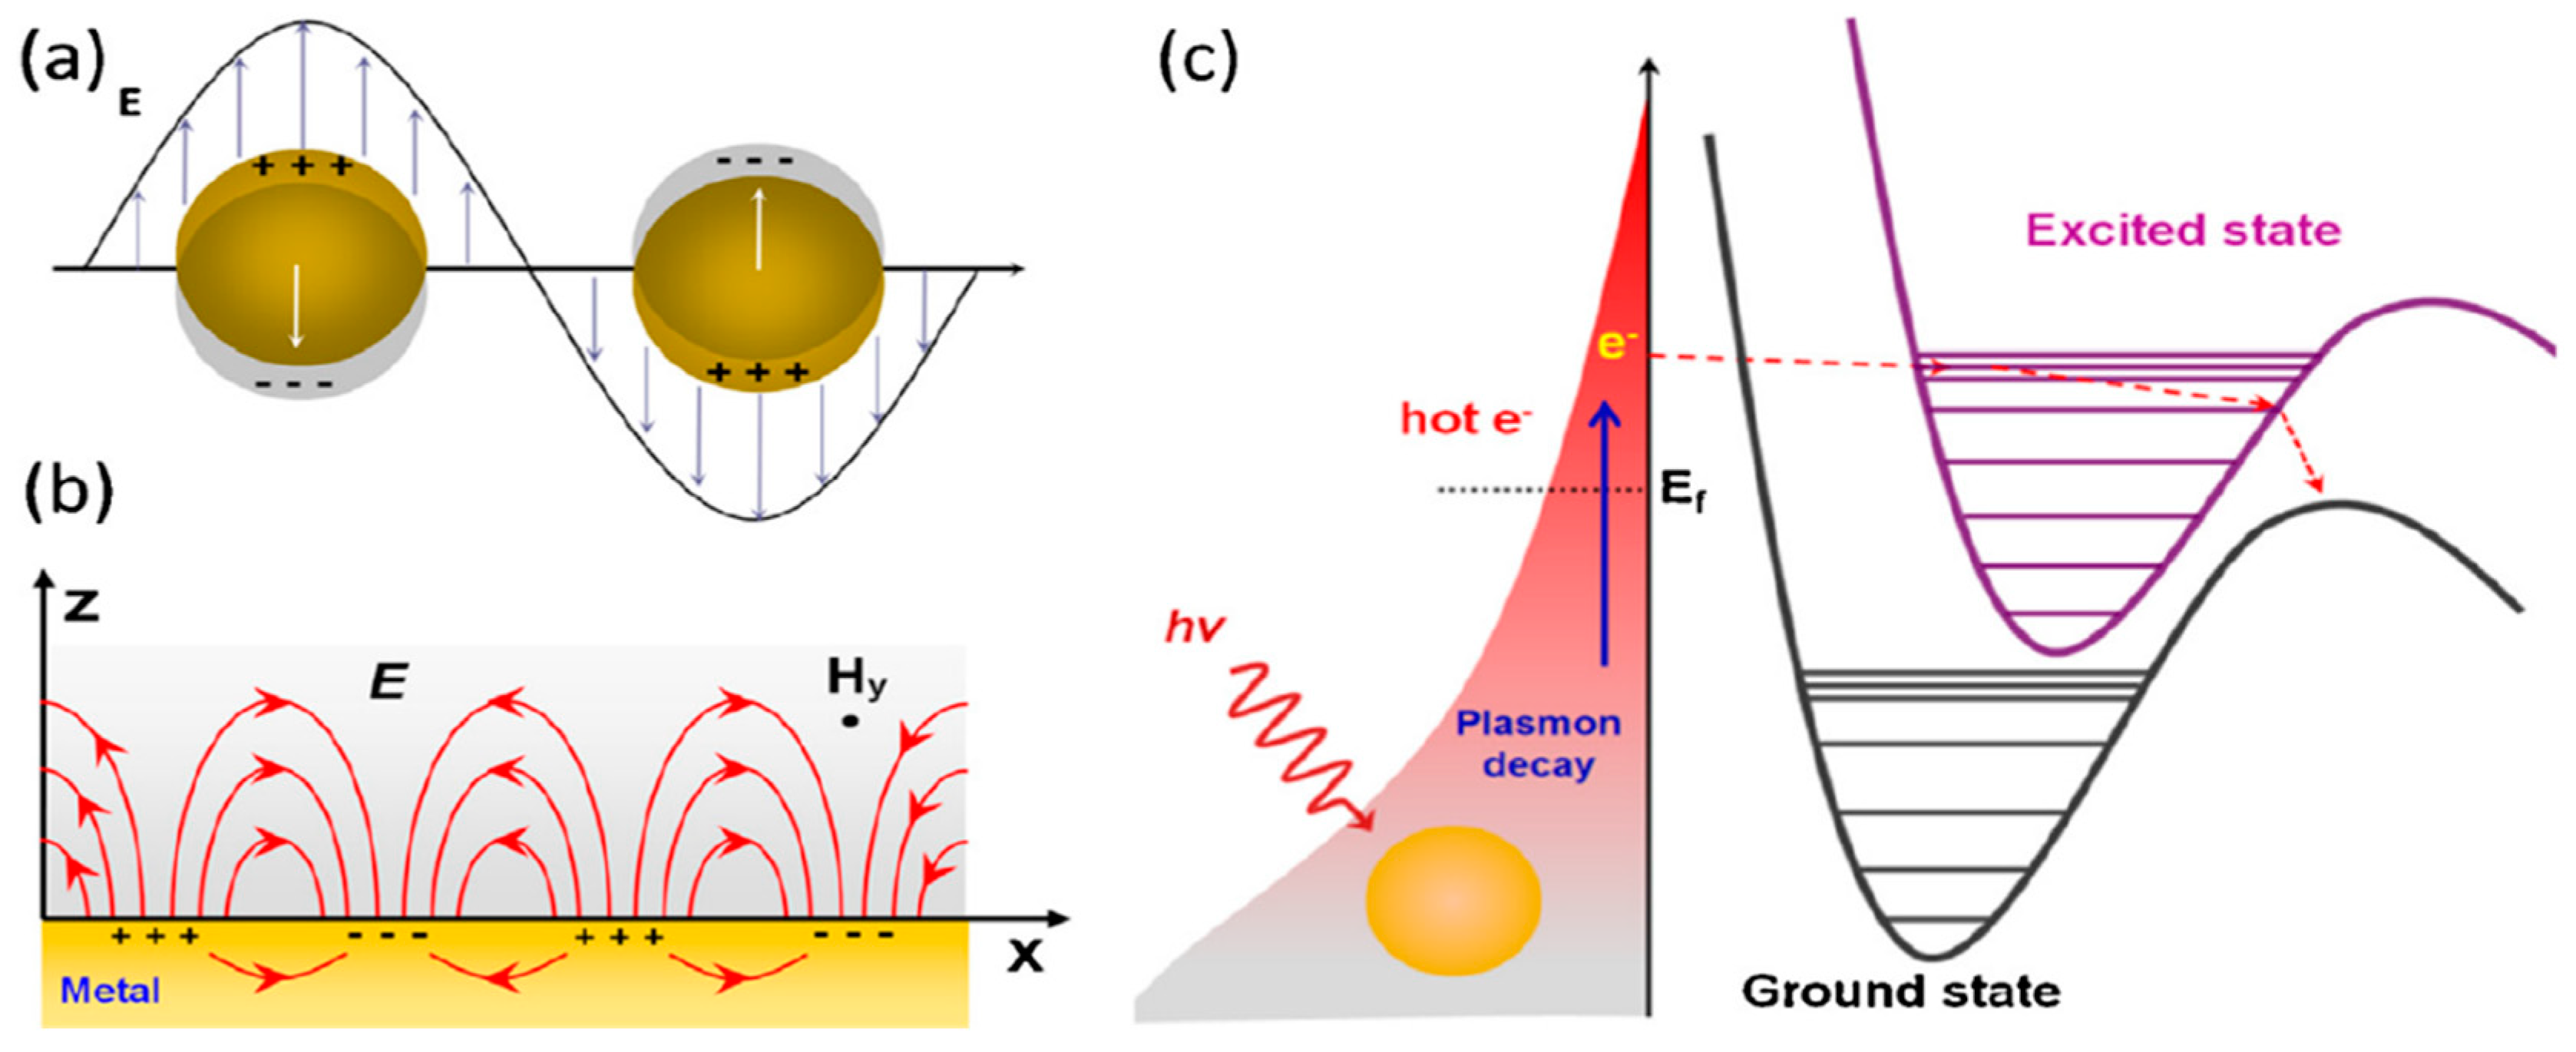
Figure 1a, the LSP is a density oscillation that limits the charge on the surface of the Au or Ag nanostructures. However, PSPs are the collective excitation conduction of electrons, which propagates along the interface between metal and dielectric medium through surface electromagnetic waves (
Figure 1b). This wave is limited to the vicinity of the interface.
Because of the addition of the catalyst, there is a decreased reaction barrier at the surface plasmon, causing surface catalysis to increase the rate of general chemical reactions. Detailed physical mechanism for plasmon-driven surface catalysis reactions can refer to recent review papers [
2,
3]. Low energy and high output have always been our goal for the catalytic reaction of plasma surfaces [
2].
The local surface plasmon, excited on the surface of Ag/Au nanoparticles, could be non-radioactively decayed into hot electrons (holes); these hot electrons have very high energy levels. These hot electrons can be dispersed into excited states of absorbing molecules and then initiate a chemical reaction by reducing the activation energy. As demonstrated in
Figure 1c, thermal electrons are first produced by non-radioactive decay of plasma on gold or silver surfaces. The hot electrons, at high energy levels, have enough energy to transfer to the excited state of molecule 1, with a short-lived negative ion being produced. Plasmonic catalysis has been demonstrated in a variety of chemical reactions, for instance, dissociation of H
2 [
4], and water splitting, in which the required activation energy is provided by plasma-induced thermo electrons.
Through our previous research, we understand the past advances of plasmon-driven surface catalytic reactions, in atmosphere, aqueous, and high-vacuum environments, monitored by surface-enhanced Raman spectroscopy (SERS) and tip-enhanced Raman spectroscopy (TERS). Next, we have introduced the high-vacuum TERS (HV-TERS) and TERS techniques, which are a perfect excuse for learning plasmonic catalysis. The catalytic process can be easily controlled by time- and intensity-dependent TERS spectroscopy; the catalytic rate can be controlled well by the distance of the gap, and the localized experimental temperature can be estimated by TERS spectra of Stokes and anti-Stokes. We also performed a surface catalysis reaction of time-dependent remote excitation; the catalytic reaction of DMAB generated by 4NBT through a plasma waveguide, at atomic level, had smooth surfaces. Then, absorption spectroscopy revealed plasmon‒exciton coupling on AgNPs‒TiO2 film hybridization, such as ultraviolet-visible (UV-vis) absorption, ultrafast transient absorption, SERS spectroscopy, and so on. Furthermore, we propose a uniform voltage-controlled plasmon co-driven oxidation and reduction reaction treatment method. On the one hand, the proposed mechanism could promote better understanding of co-driven chemical reactions of plasmon‒exciton coupling. On the other hand, it may accelerate the development of plasma excitons in different fields. Lastly, we noted that plasma-driven double reduction reactions had been successfully observed in experiments in electrochemical environments.
Plasmon-induced chemical reactions caused increasing interest in photocatalytic reactions. For instance, a molecule can be adsorbed on metal nanostructures. However, this mechanism is still controversial because it is difficult to directly observe the chemical reaction in the plasma field, which is located near the metal surface. Surface plasmons in nanoscale-assisted molecular synthesis is an attractive topic in the field of surface catalytic reactions [
5,
6,
7,
8]. DMAB has been the subject of plasma-assisted catalytic reaction studies, but they are all plasma-assisted synthesis reactions. Nevertheless, since the hot electrons required for dissociation (produced by plasma decay) are mainly quenched in the environmental SERS, it is desirable to find a new technique for the dissociation process. Therefore, it is hoped to find a novel technology to carry out the dissociation process.
Hydrogen dissociation is a key step in many hydrogenation reactions for industrial chemical production. Catalytic hydrogenation is one of the largest branches of heterogeneous catalysis and is very important for numerous industrial reactions, such as the hydrogenation of unsaturated hydrocarbons and hydride chlorination. Supported precious metals have been widely used as catalysts because their favorable electronic structure allows hydrogen molecules to easily adsorb onto the metallic surface and dissociate. Currently, plasma metal nanoparticles have become new photocatalysts for small molecule activation and related general chemical reactions. In previous work we demonstrated the use of Au nanoparticles for plasmon-enabled hydrogen dissociation despite their intrinsically inert
d-band configuration [
4].
In this review, we first introduced the resonance dissociation process with time-dependent measurements by using tip-enhanced Raman spectroscopy under high vacuum conditions. We demonstrate the process by which hot electrons dissociate Malachite Green (MG) and sensitively control the dissociation rate and probability by adjusting the thermal electron density. The hot electrons are generated by plasma decay in the nanogap of the HV-TERS setting (as demonstrated in
Figure 2). Second, we recommend selective bond cleavage of DMAB by using thermal electrons as plasma scissors, especially by changing the pH to control the dissociation products. Third, we report the first experimental evidence for photocatalytic decomposition of hydrogen at room temperature. Then, we show that chemically synthesized aluminum nanocrystals (Al NCs) are capable of photocatalyzing hydrogen dissociation under laser illumination without the use of transition metal dopants, deep UV photons, or extreme reaction conditions such as elevated temperature or pressure. In addition, we prove the plasma enhancement of photocatalytic water decomposition under visible light irradiation by combining strong plasma Au nanoparticles with strongly catalyzed TiO
2. Lastly, we describe real-world and real-time observations of plasmon-induced general chemical reactions of individual molecules.
2. Molecular Resonant Dissociation of Surface-Adsorbed Molecules by Plasmonic Nanoscissors
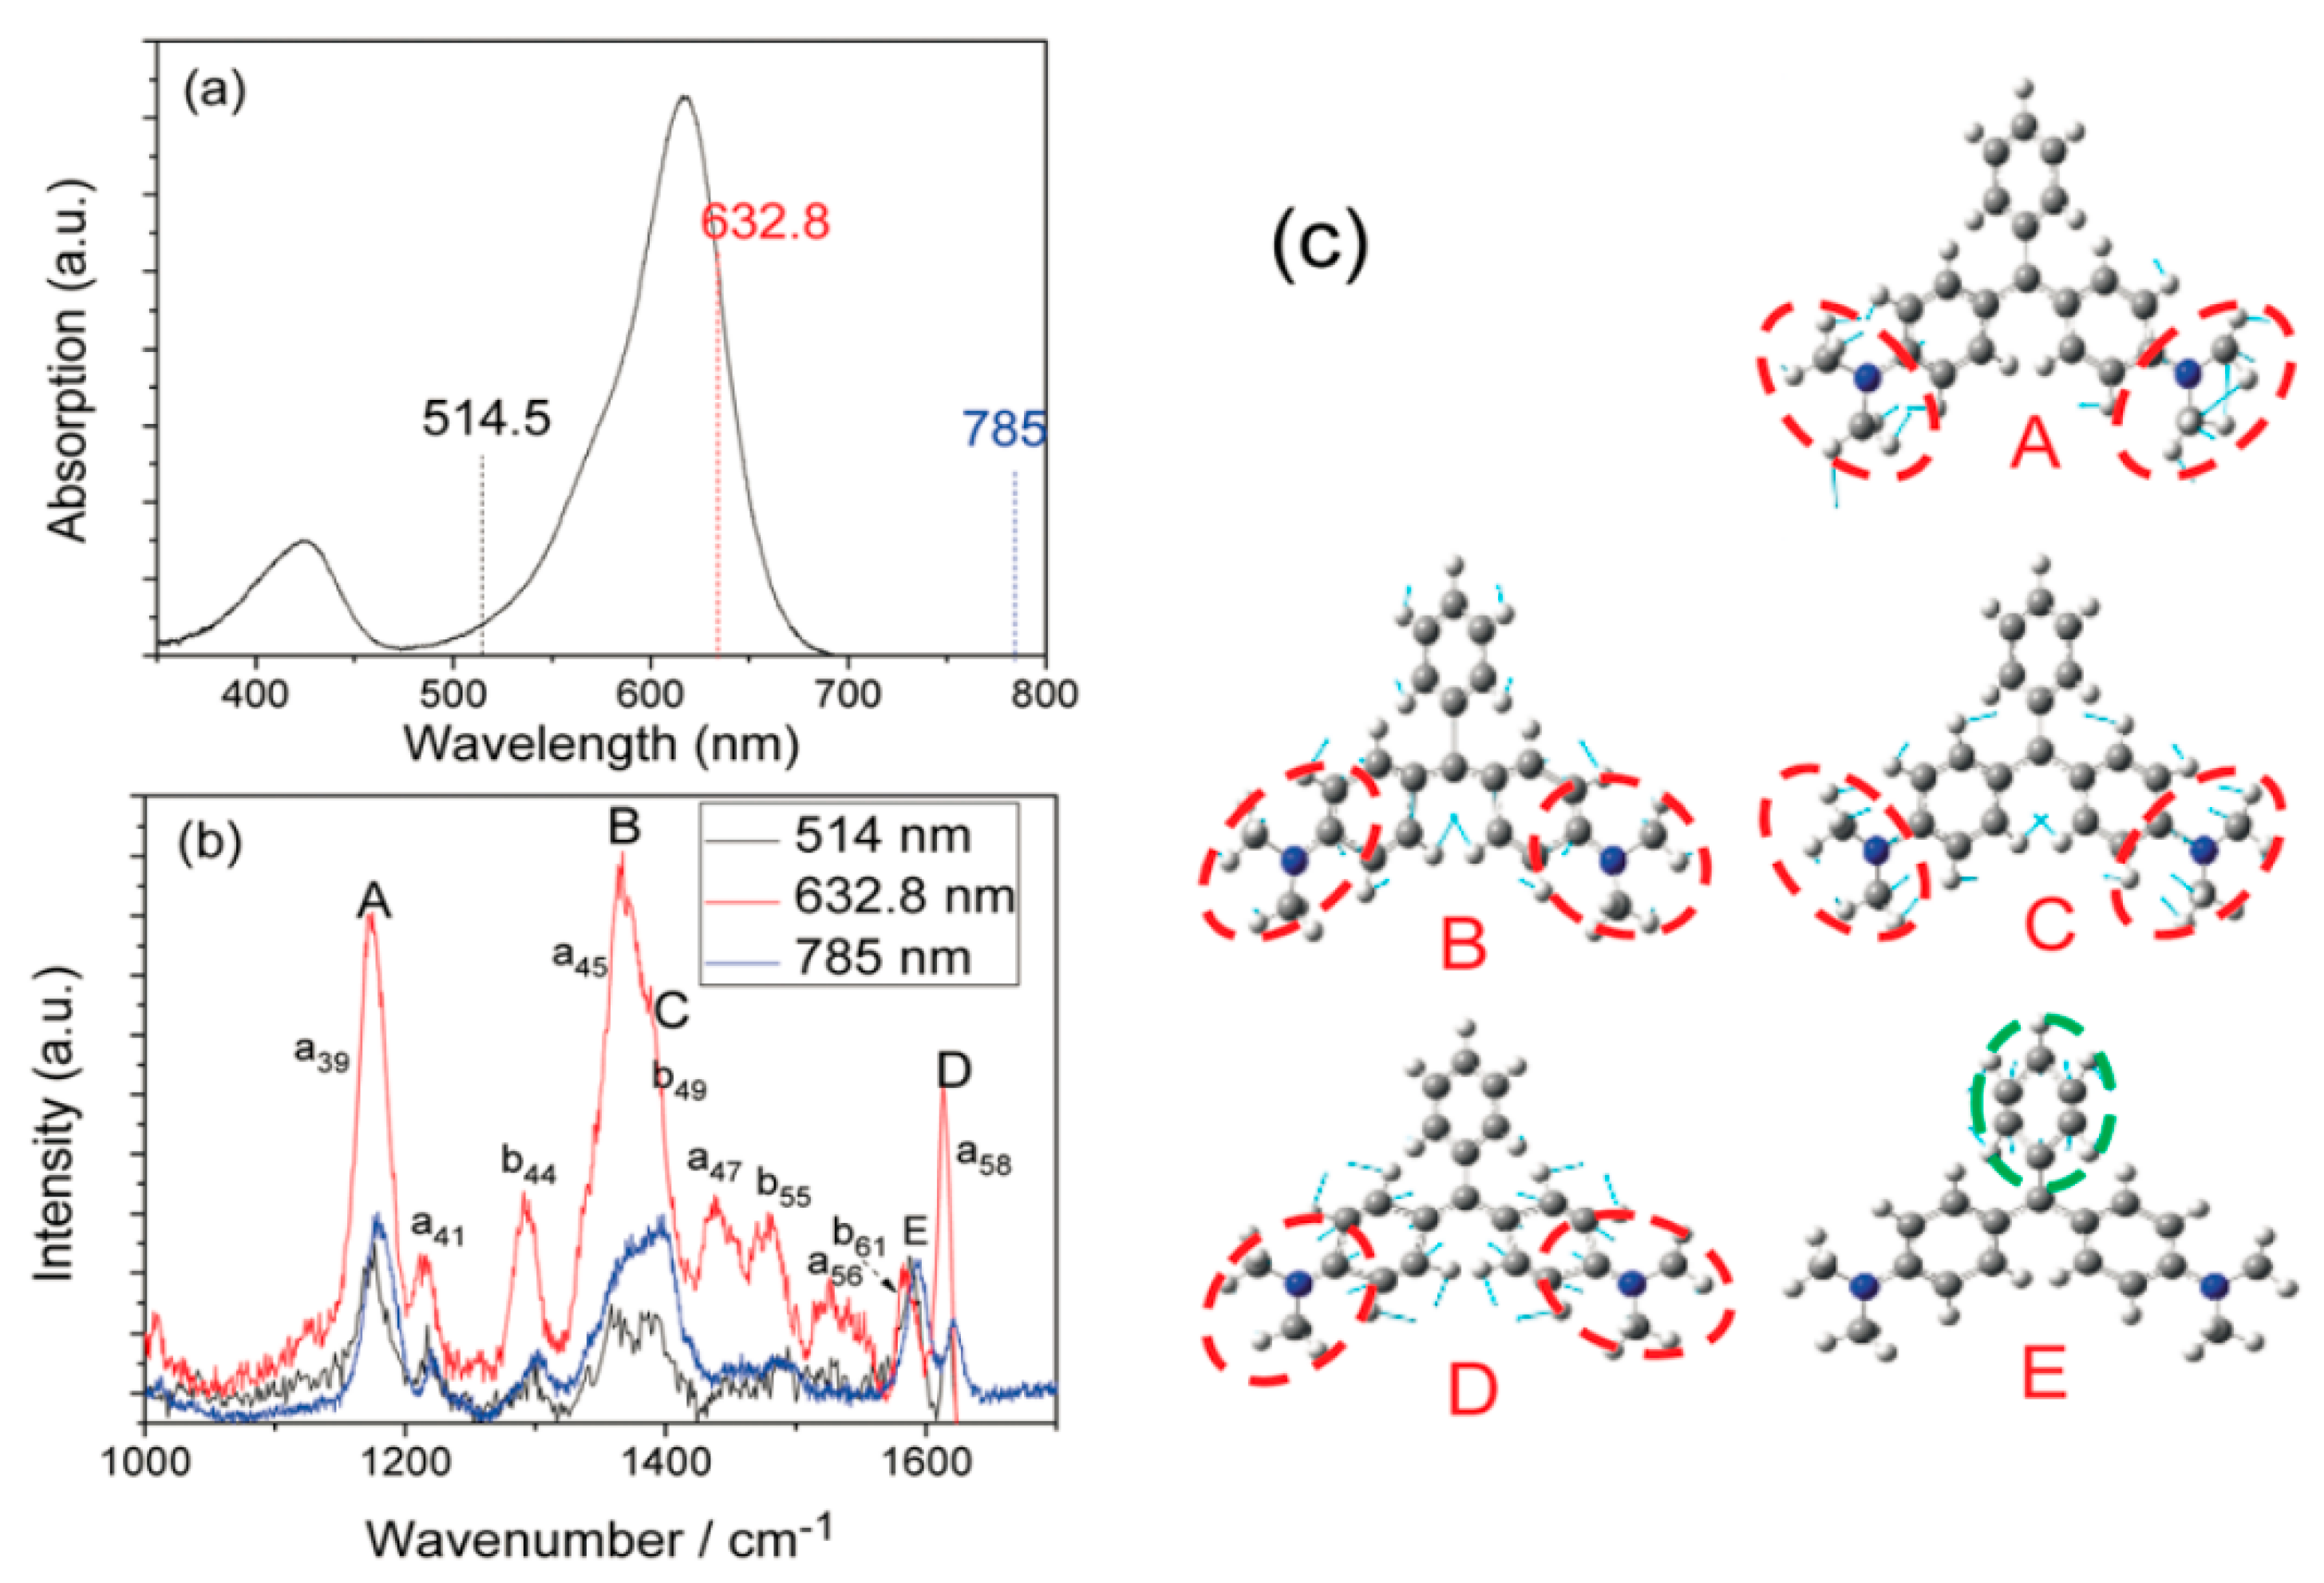
Developing a method that enables pattern-specific chemistry was a very significant goal for chemists and an active area of research in the field of molecular reaction dynamics. The proof of resonance dissociation of MG was dependent on several complementary theoretical and experimental studies. To begin with, authors measured the light absorption spectrum of Malachite Green. The implication of
Figure 3a is that there are strong absorption peaks, weak absorption peaks, and no absorption peaks at 632.8 nm, 514.5 nm, and 785 nm, respectively. In addition, the implication of
Figure 3b is that the SERS spectra of Malachite Green in Ag sol were marked at these three frequencies. The normal Raman excitation is at 785 nm, the Raman excitation wavelength is 514 nm, similar to the 785 nm excitation Raman; and the resonance Raman excitation at 632.8 nm, where the Raman peak A–D was resonant electron transition selectivity at 632.8 nm excitation, at which point peak E for comparison was considered to be the normalized peak. Thirdly, our theoretical calculations determine that the peak A–D associated with the vibration mode in Malachite Green is related to
fragments (see
Figure 3c). Malachite Green exhibits a C
2 symmetric mode with two vibration modes, a and b, respectively, and five selective enhanced vibration modes, which are recorded as
,
,
,
and
from low frequencies to high frequencies, respectively.
As demonstrated in
Figure 3b, Peak E was a vibration mode associated with benzenyl C-C stretching mode. Consequently, their analysis exhibited that the resonant excitation energy at 632.8 nm was concentrated on the A–D mode associated with the
fragments. These modes could be excited by selective resonance. It is to be noted that the peaks B and C were superimposed due to the width at half maximum in
Figure 3b, but obviously they were separated in the HV-TERS (see
Figure 4a). By comparing the tip-enhanced resonance Raman spectroscopy (TERRS) excitation at 632.8 nm and the SERS excitation at 785 nm, we clearly see that the A–D peak could be selectively excited.
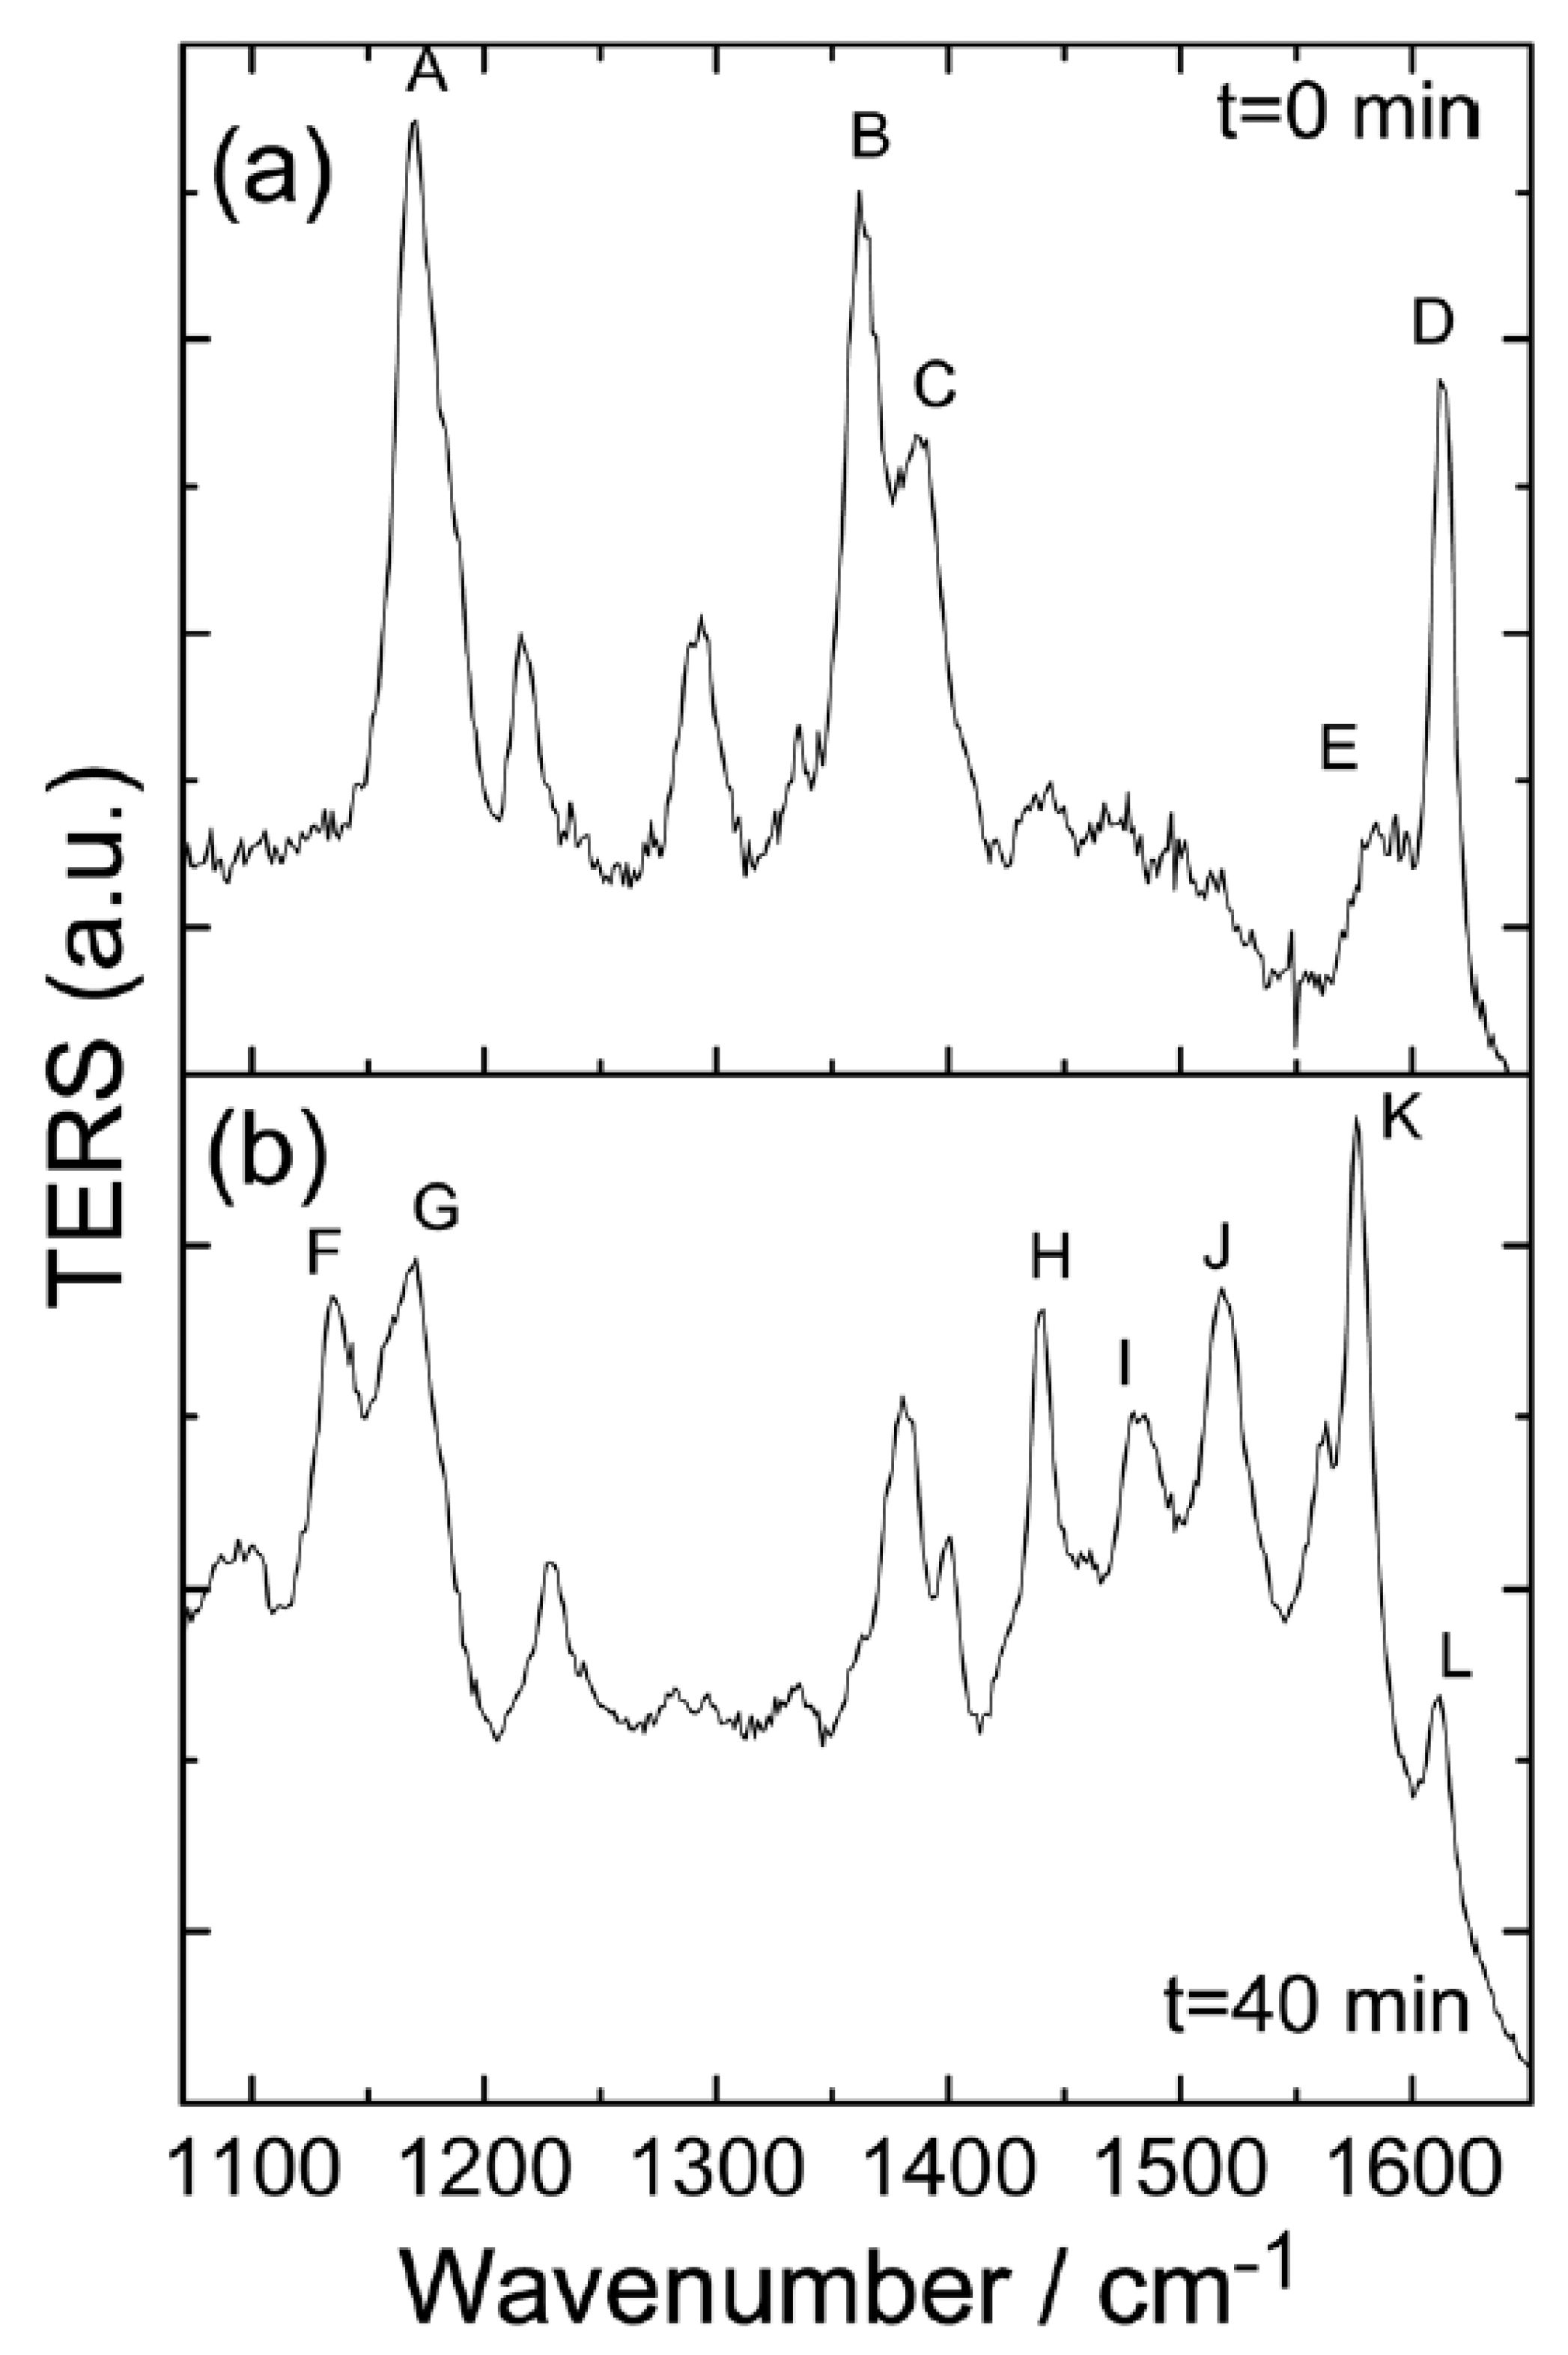
Then, authors used TERRS to verify the resonance decomposition process through time-dependent measurements under high vacuum conditions, and the wavelength of the incident light is 632.8 nm.
Figure 4 gives the time sequence TERRS of the MG, and the MG in a high vacuum was adsorbed on the Ag surface in the presence of 632.8 nm of incident light. In the beginning, the implication of
Figure 4a was that the Raman peaks of A–D, in the TERRS spectrum, were strongly enhanced by comparing the non-resonant SERS spectra excited at 785 nm, when the laser was irradiated on the sample at
t = 0 minutes; in contrast, the E peak at 1592 cm
−1 was considered to be a normalized Raman peak. This indicates that the resonant excitation energy during the electronic transition mainly excites four vibration modes selectively. The implication of
Figure 4d,e is that the simulated Raman spectra of the dissociated fragments from the MG, as well as their vibrational modes, are also assigned. The fragment of
exhibited
symmetry; these four vibration modes are labeled
,
,
and
, respectively. The large fragment in
Figure 4d exhibited
symmetry; however, when it was attached to a metal (as shown in
Figure 4f), it exhibited
symmetry and the two vibration modes are labeled a and b, respectively. The vibrational modes F–M (seen in
Figure 4c) can be seen in
Figure 4f. The temporal evolution of the TERRS spectrum (as demonstrated in
Figure 4) provides evidence of the dissociation chemical reactions that occur in the MG. The simulation of the Raman spectrum due to dissociation debris is clearly demonstrated. The implication of
Figure 4c is that the ultimate TERRS spectrum contains features from two dissociated fragments.
The implication of
Figure 5 is that the authors made a similar observation of Malachite Green adsorbed on the gold film; meanwhile, the authors concluded that the general chemical reaction on the silver film reacts faster than on the gold substrate. Generally speaking, the reaction rate and probability of a chemical reaction under high vacuum conditions can be controlled by a number of factors, such as bias voltage, laser intensity, tunnel current variation, and so on. The implication of
Figure 6a,b is that laser power reduction of 10% of total laser power produces a slower dissociation rate—after 40 min, as demonstrated in
Figure 6d, it was far from the stable configuration shown in
Figure 6c. Obviously, the implication of
Figure 6b is that, although a new Raman peak had appeared, the strongly enhanced Raman peaks A–C were still visible. Thus, the energy and tunneling current provided by the laser are insufficient to dissociate the molecules unless the laser illuminates the sample continuously to offer a continuous supply of large-density hot electrons.
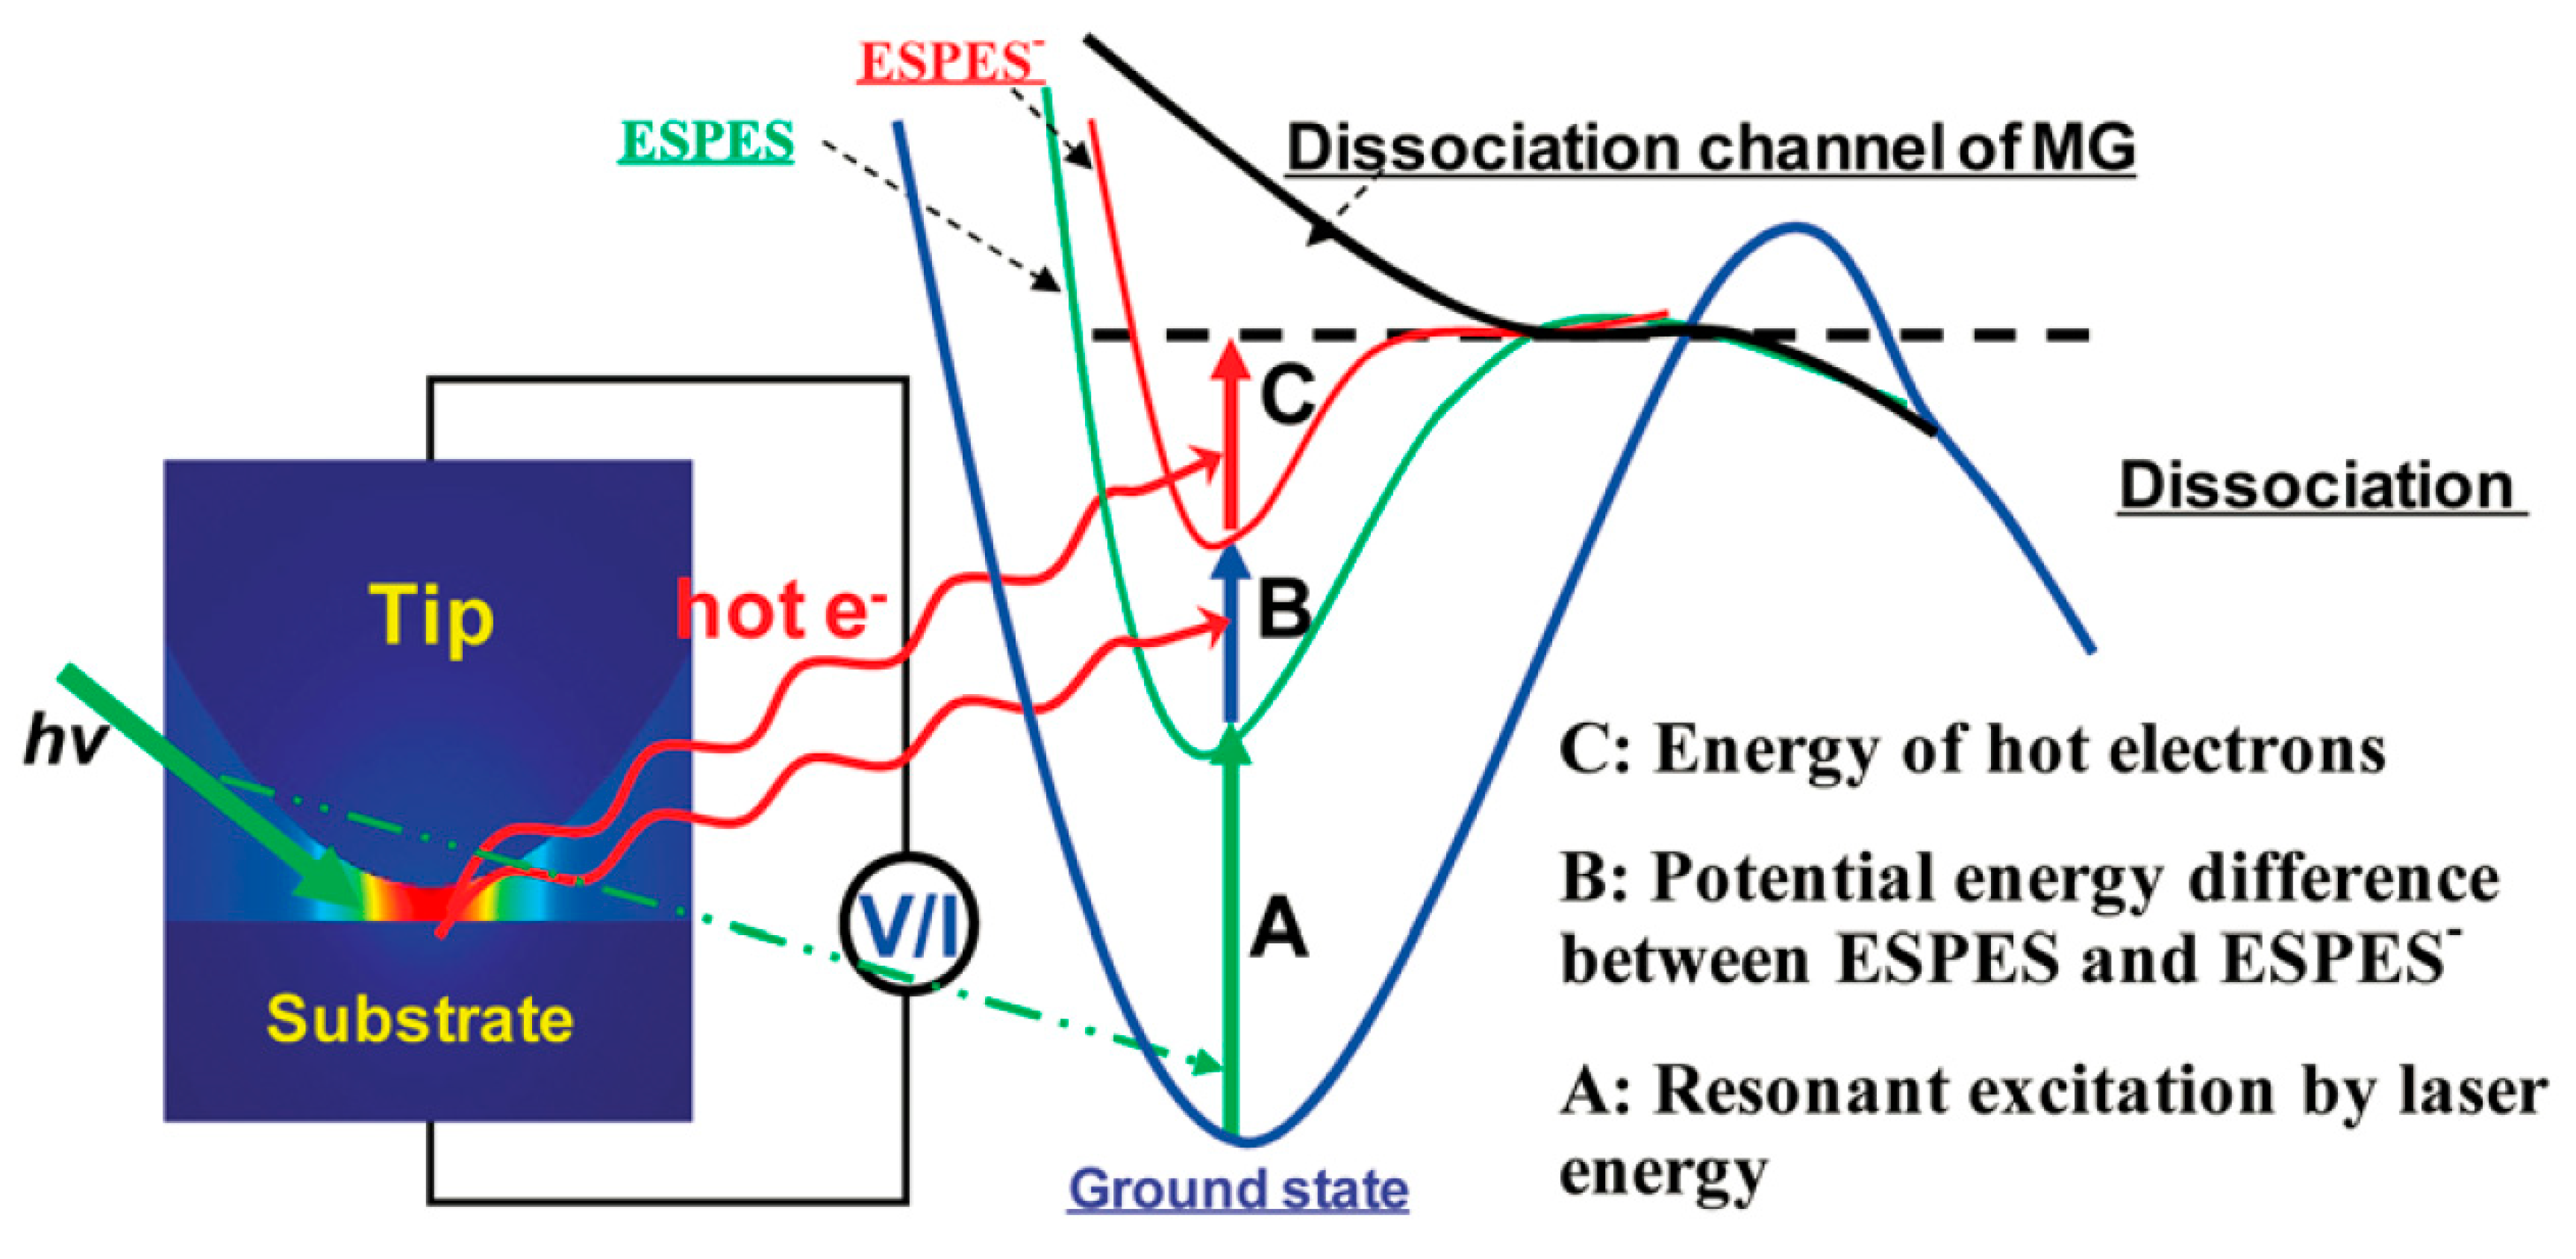
By irradiating the nanogap in the HV-TERS between the tip and the substrate by a laser, large-density plasma was first generated. As demonstrated in
Figure 7, the high kinetic energy of the hot electrons and the laser beam induced the dissociation process, and the hot electrons were generated by plasma decay. Compared with general Raman scattering, the resonance electron transition increases the lifetime of Raman scattering, and the resonant excitation of the laser causes the excitation energy to concentrate on the vibration mode associated with the Malachite Green
fragments. Therefore, we turn to selectively reducing the energy of these bonds, as demonstrated by process A in
Figure 7. The thermal electrons generated by plasma decay had two purposes; to begin with, when hot electrons strike metal-adsorbing molecules, due to the high energy of hot electrons, they induce changes in the molecular excited-state potential energy surface (ESPES) from a neutral to excited state of transient negative ion (ESPES⁻), as demonstrated by process B in
Figure 7. The redox state caused by the hot electrons is a transient negative state [
10]. In addition, during their interaction, the kinetic energy was transferred from thermionic to vibrational dissociation energy of the intramolecular, as demonstrated by Process C in
Figure 7.
Malachite Green can be applied as a vibration mode for various chemical reactions, which can effectively reduce the activation energy of the reaction and increase the reaction rate.
3. Plasmonic Scissors for Molecular Design
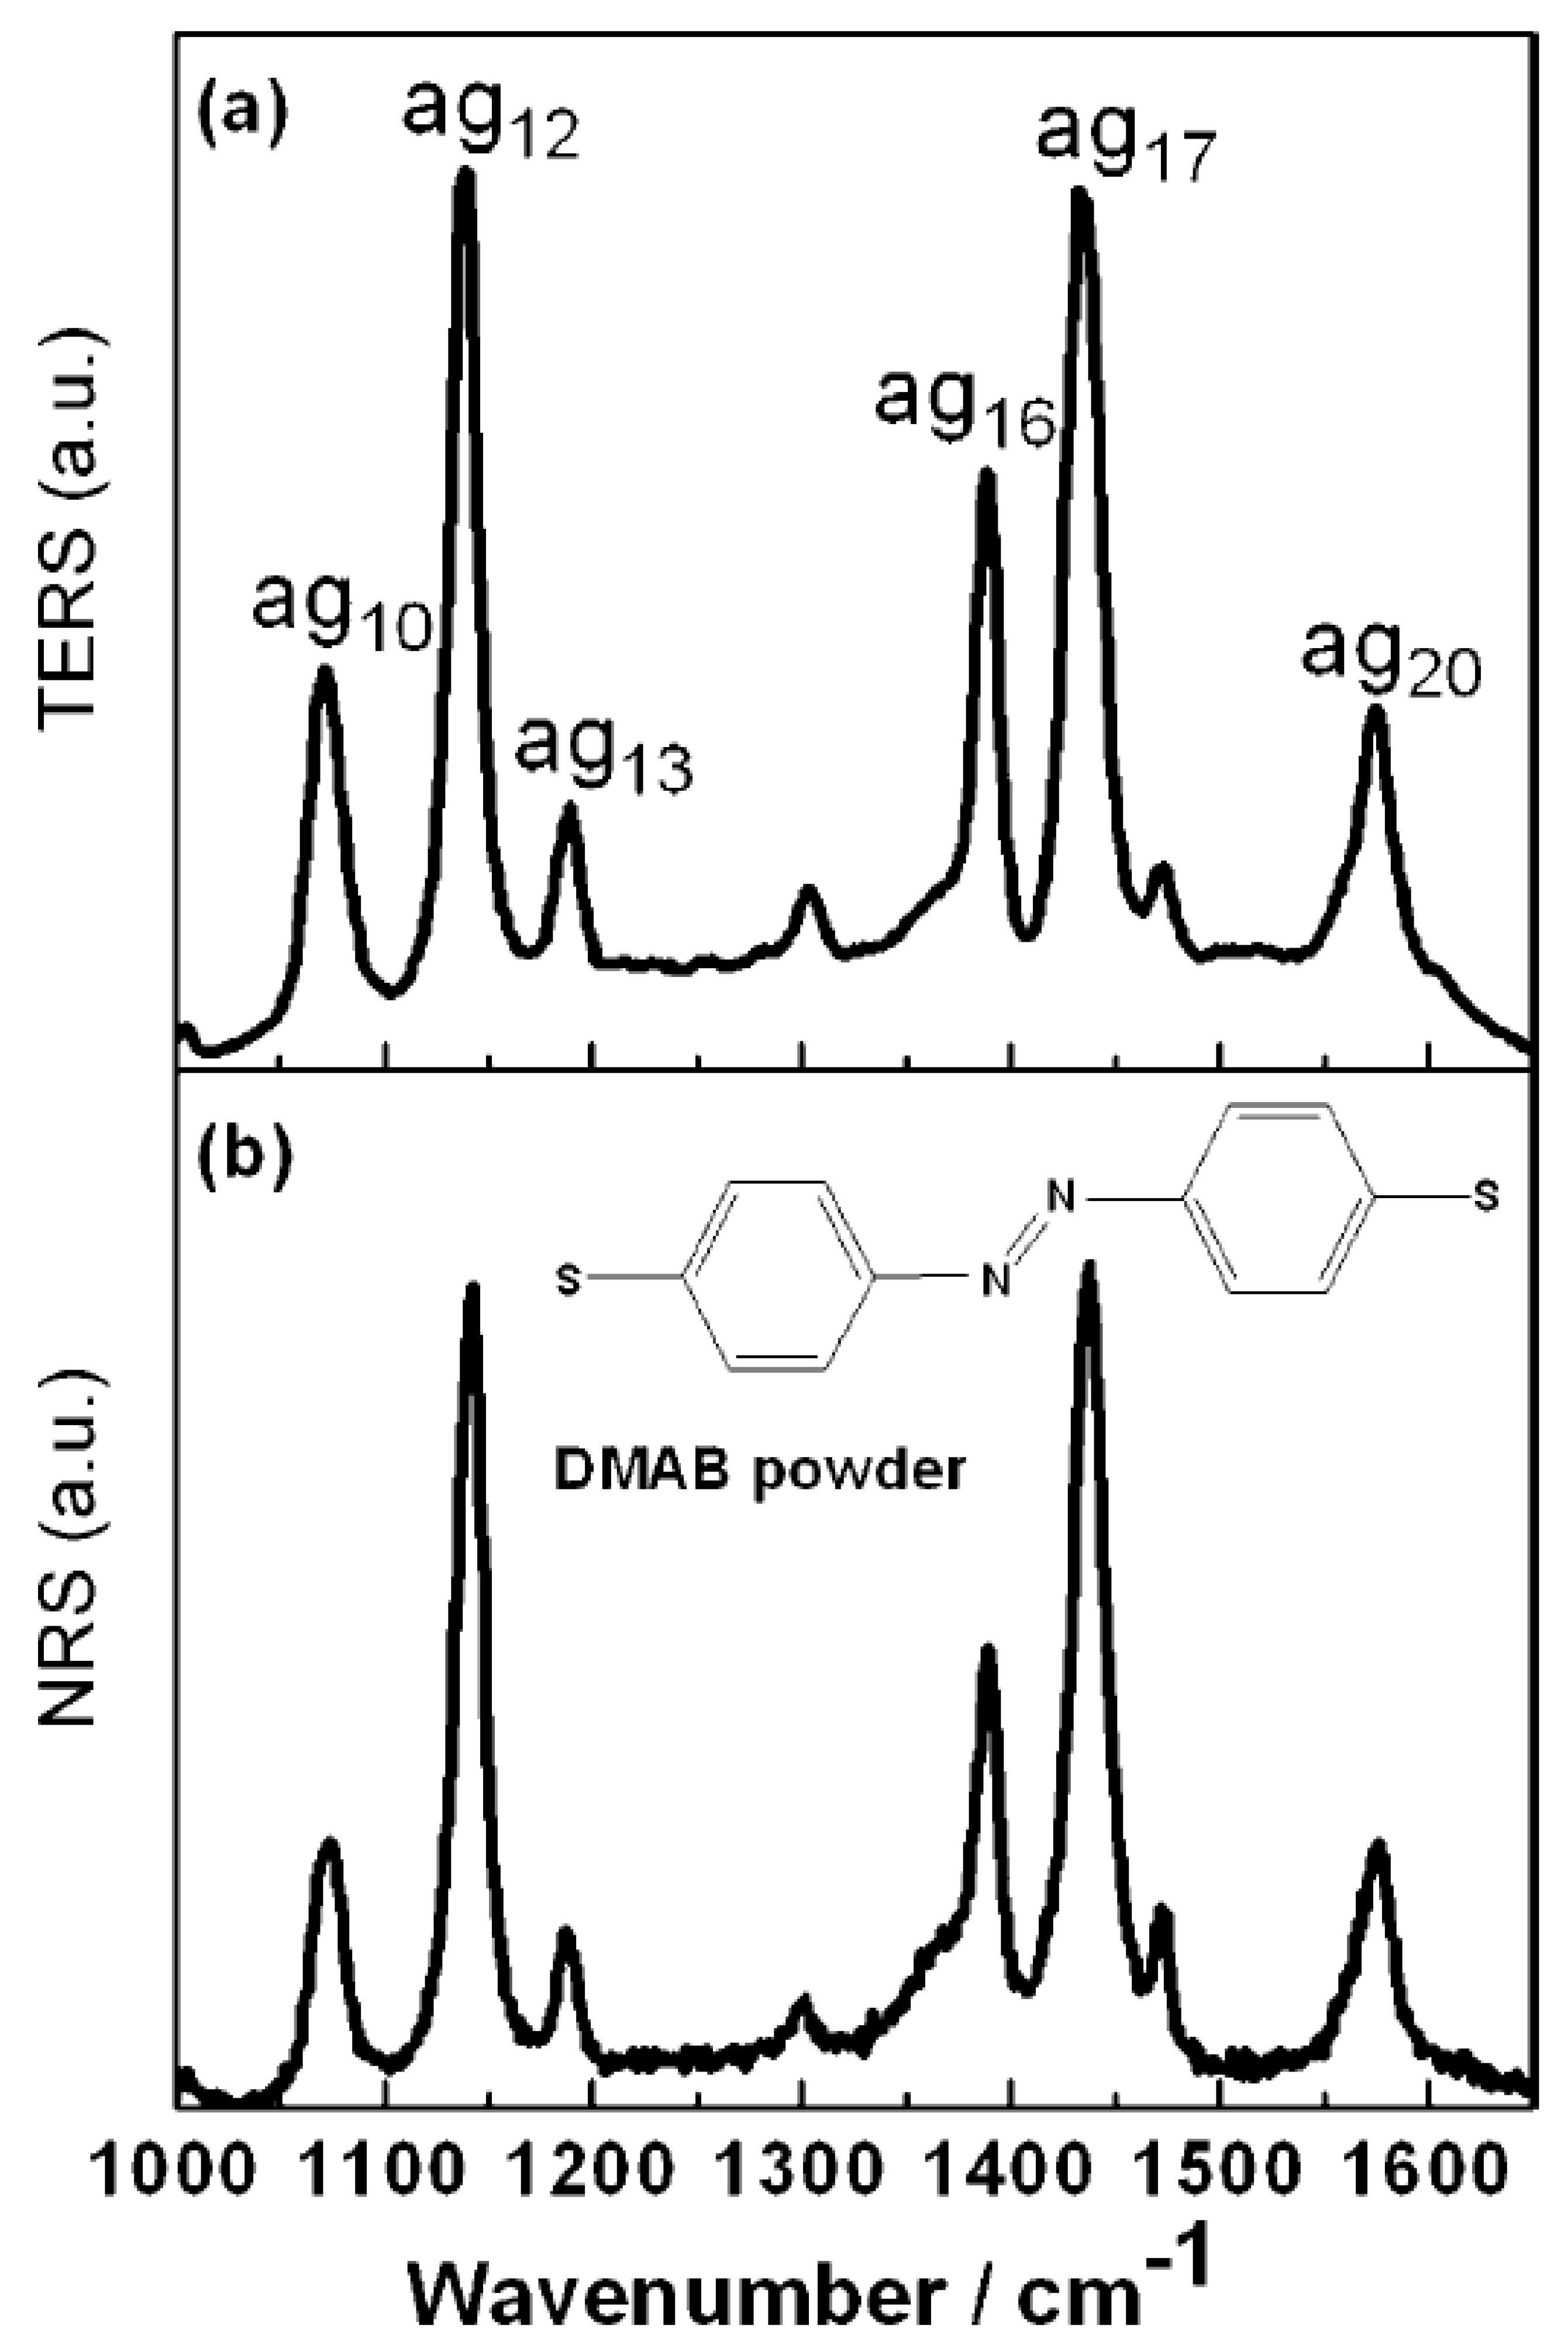
Previously, plasma-assisted synthesis of DMAB revealed by surface enhanced Raman scattering spectroscopy from PATP and 4NBT had been achieved. DMAB had become a research project for plasma-assisted catalytic reactions, but they were all plasma-assisted synthesis reactions. Generally speaking, it was theoretically possible to implement the decomposition process by SERS spectroscopy. The implication of
Figure 8a is that the TER spectrum was adsorbed on the silver film for DMAB. As shown in
Figure 8b, this was the same as the normal Raman spectrum of the DMAB powder [
5]. In particular, the
vibrational mode at 1433 cm
−1 of DMAB amounts to an N=N stretching mode. When DMAB is selectively decomposed by plasma scissors, this peak is reduced or even disappears in the TER spectrum. The author tried to observe the signal of decomposition by continuous emission, while its TER spectrum remains the same as was demonstrated in
Figure 8a. In previous studies, in the molecular synthesis of DMAB from PATP and 4NBT, dissociation fragments could be rapidly dimerized into DMAB by the N=N bonds. Obviously, dissociation could not be observed during the competition between dissociation and synthesis; therefore, new approaches were needed.
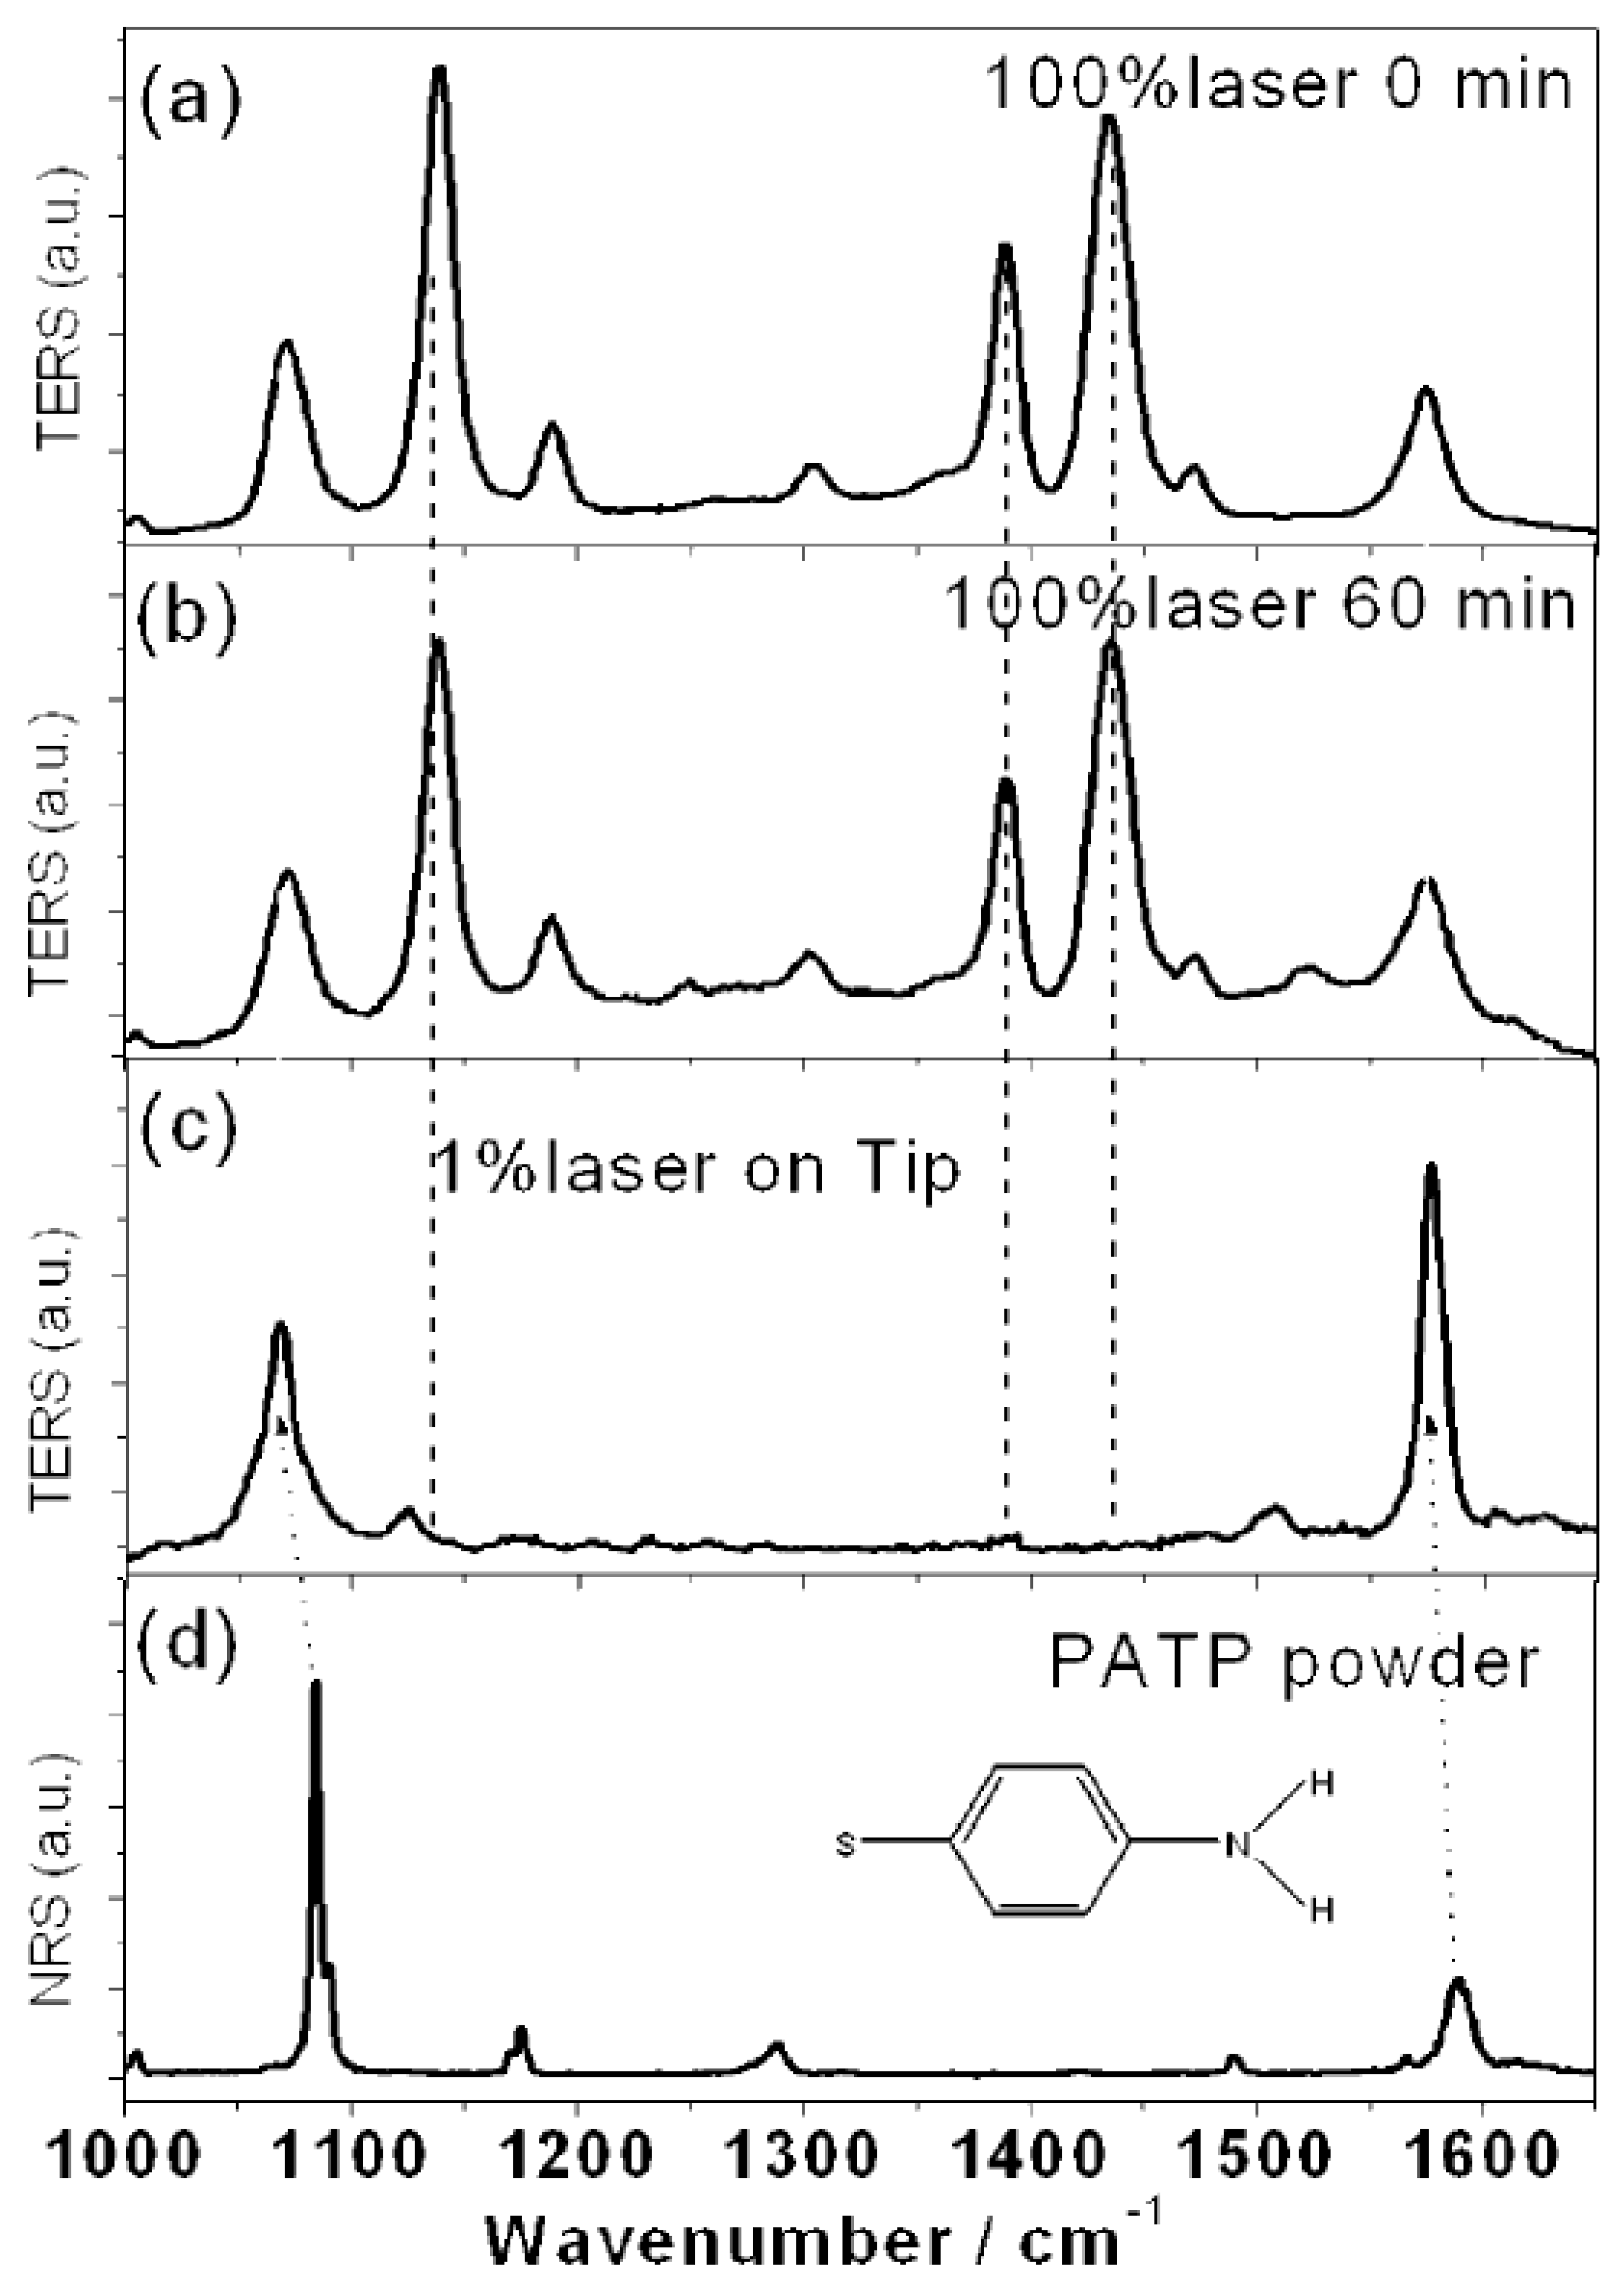
The authors manipulated the pH under HV-TERS conditions to control the reaction pathway in order to achieve dimerization of the free radical fragments that prevent dissociation. Under acidic conditions, DMAB was first excited by a 100% laser in the nanogap. Then, the TER spectrum was measured over a period of 0 to 60 min. If the N=N bond of DMAB is selectively destroyed in some systems, such as molecule, tip, substrate system and so on, the dissociated fragments will be set in the tip or substrate. The implication of
Figure 9a,b is that there was no significant change in the intense stimulation over 60 min. As demonstrated in
Figure 9c, a TER spectrum with weak plasma intensity was measured at the tip, and the results were completely different from
Figure 9a. Obviously, the implication of
Figure 9c is that the complete disappearance of the
mode of DMAB indicated that its N=N bond was selectively dissociated. Under acidic conditions, because of the adsorption of a large amount of hydrogen ions on the substrate, the radical fragments will be translated into PATP via the adsorbed hydrogen ions after the decomposition process. The implication of
Figure 9d is that the above results are verified by measuring the nuclear resonance spectra (NRS) of the PATP powder. Since
Figure 9c,d are similar, it is shown that PATP was translated into DMAB again in the nanogap of the tip and the substrate, so it could not be observed in the slit. This indicates that PATP could not be easily converted to DMAB at relatively low plasma intensities [
12].
At the same time, under alkaline conditions, the author also measured the TER spectrum of DMAB. These spectra in
Figure 10a–c were measured at 0 min, 10 min, and 60 min, respectively. After 10 min of irradiation with 100% laser, a weak vibration peak at 1336 cm
−1 is evident in
Figure 10b. Obviously, the implication of
Figure 10d is that the TER spectrum was measured at the tip with a laser intensity of 1%, and the result was completely different from that of
Figure 10a. As demonstrated in
Figure 10d, the vibration peak almost disappeared at 1433 cm
−1, while three Raman peaks were observed. This is similar to the NRS spectrum of the 4NBT powder (see
Figure 10e). Therefore, under alkaline conditions, due to the adsorption of a large amount of oxygen ions on the substrate, the dissociated radical fragments were converted into 4NBT by the adsorbed oxygen ions.
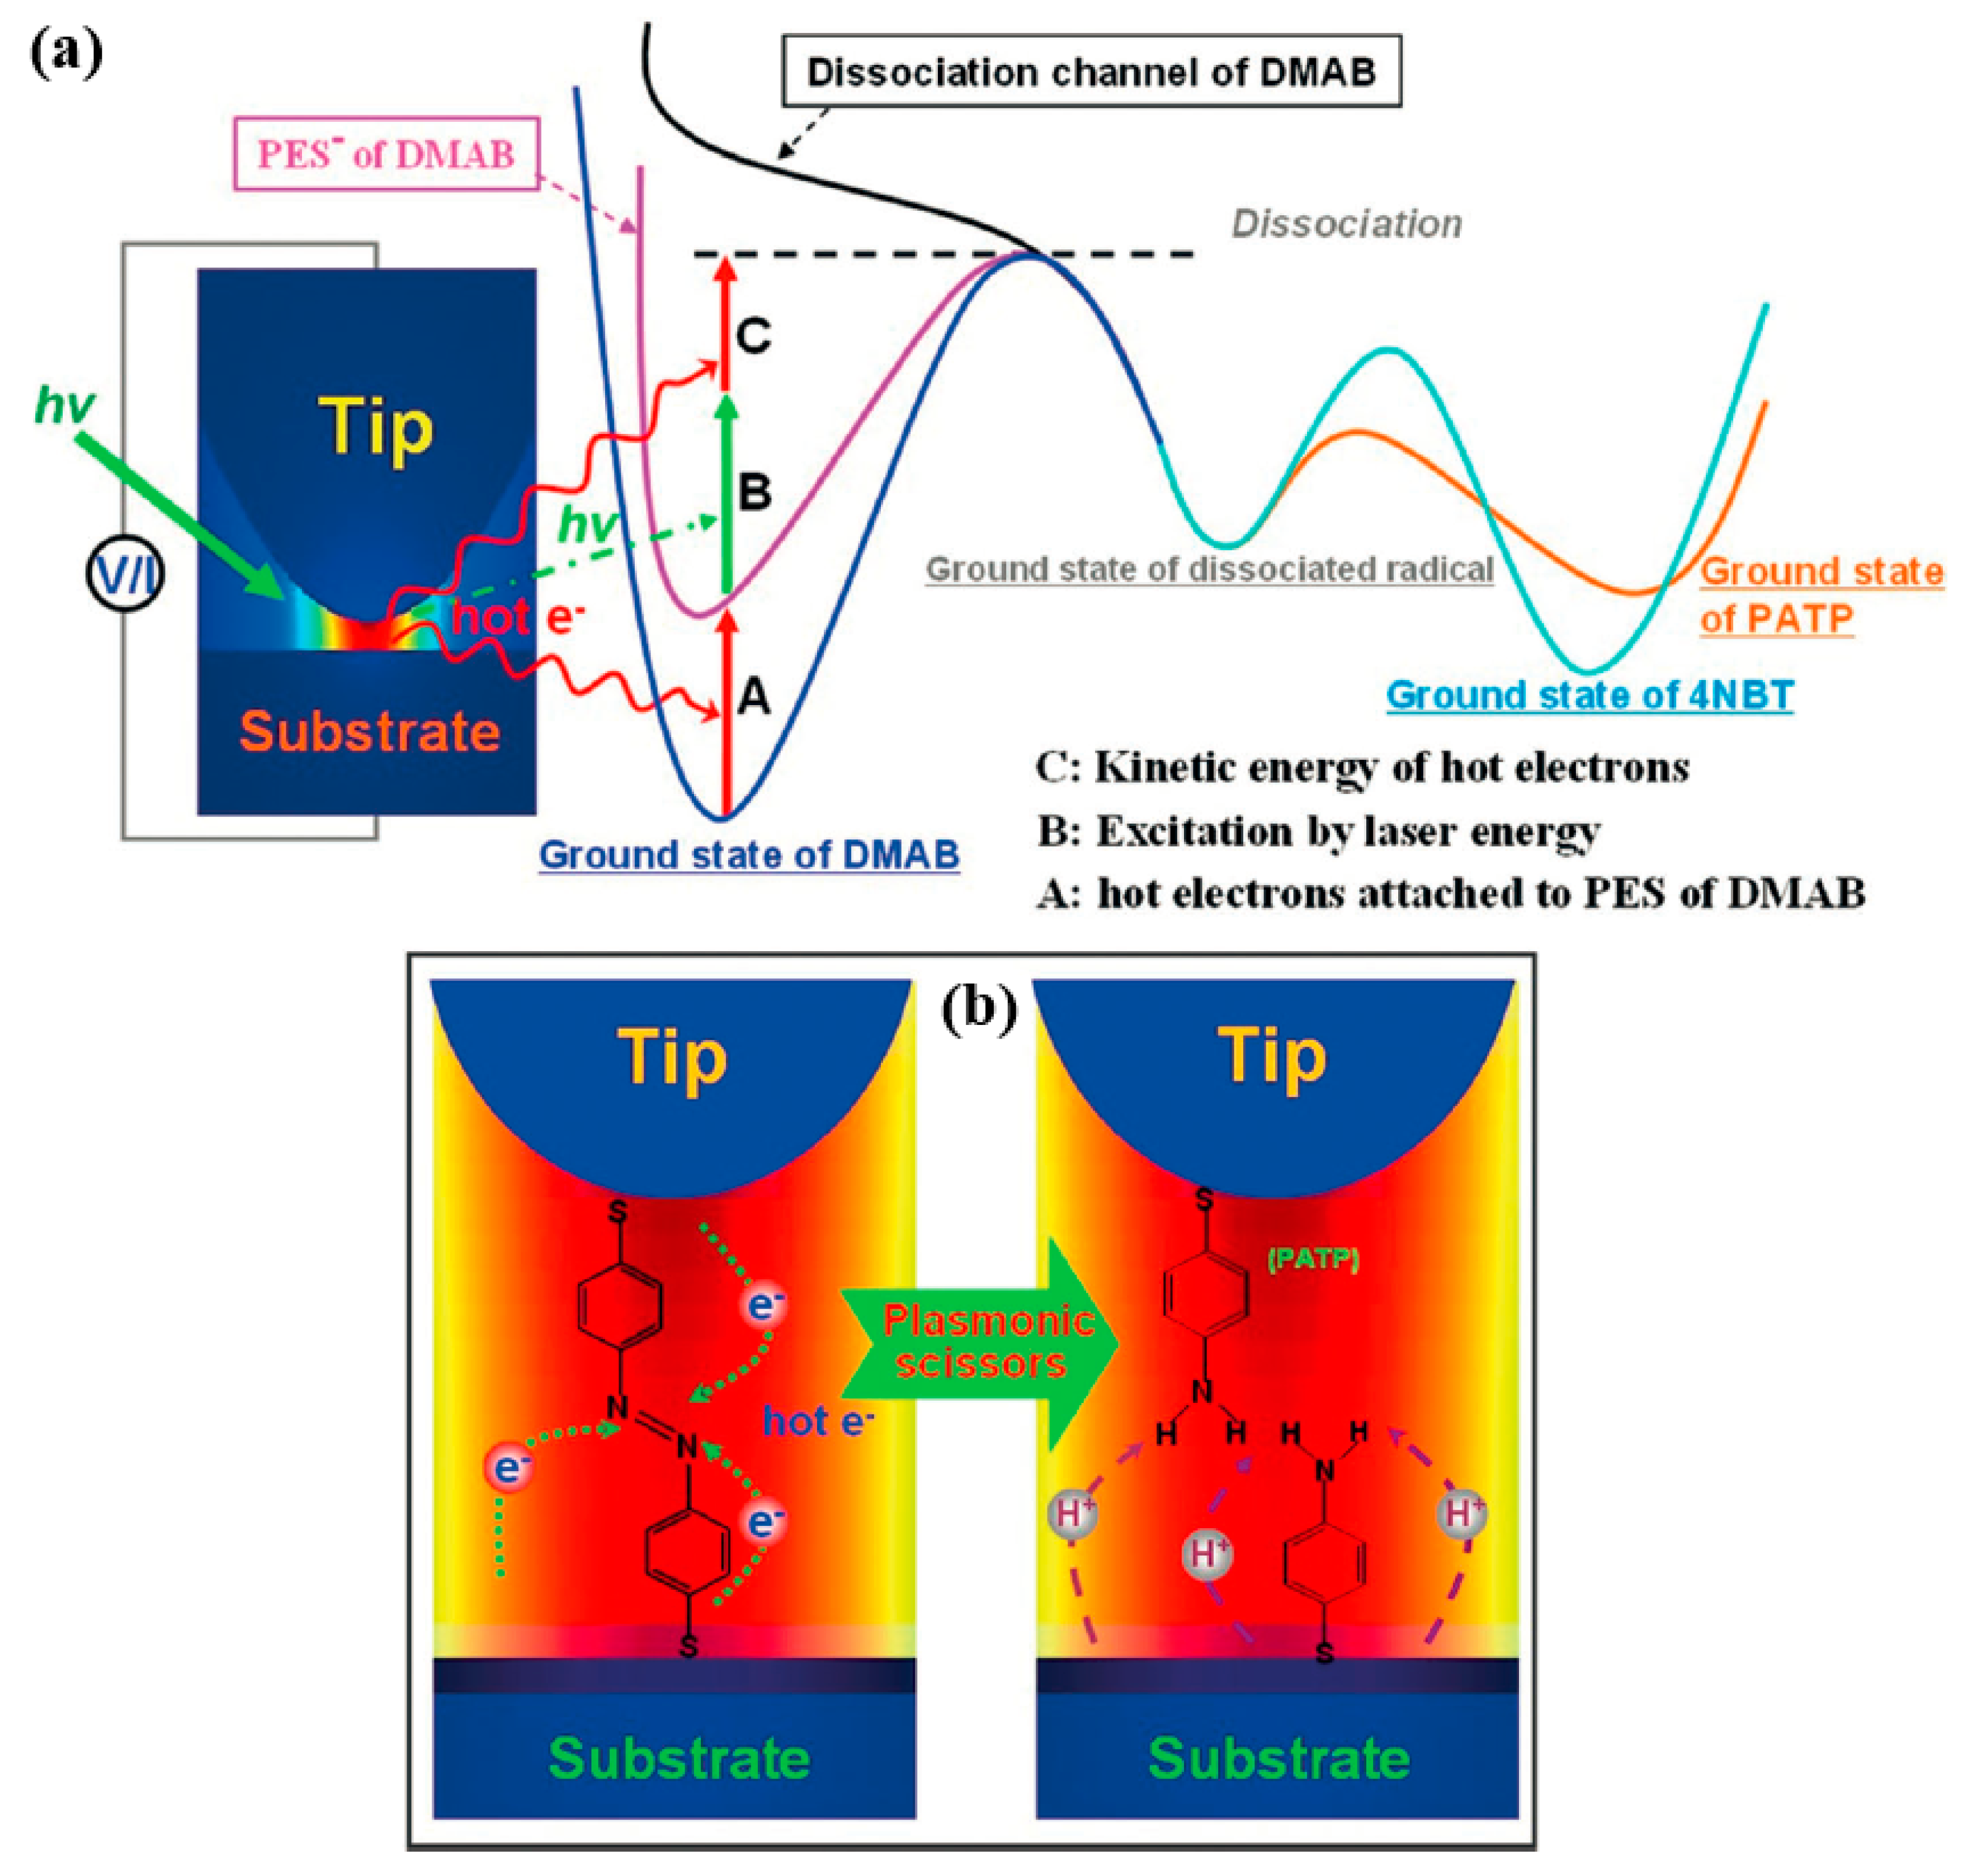
Figure 11 summarizes the physical source of the pH control product, the product of which was dissociated by plasma scissors in HV-TERS. To begin with, the hot electrons generated by the decay of the plasma are temporarily attached to the potential energy surface (PES) of the DMAB, which adds PES to the PES⁻ and reduced the reaction barrier. In addition, the laser could excite the reaction energy above or near the dissociation energy. Last but not least, the dissociated free radicals absorb the hydrogen ions on the substrate under acidic conditions and, conversely, absorb the oxygen ions on the substrate under alkaline conditions. With this reaction mechanism, PATP or 4NBT could be produced by changing the pH to control the respective reaction pathways.
To sum up, for overcoming potential obstacles and providing sufficient energy, the products PATP and 4NBT can be converted to DMAB. Furthermore, DMAB, PATP, and 4NBT could exist simultaneously during the reaction. Compared with 4NBT, PATP had a faster reaction rate during the reaction, required less energy, and had lower reaction barriers. Because 4NBT had a high potential barrier, its reaction rate was slower and more difficult. Therefore, we know that the kinetics of the reaction process could be achieved under alkaline conditions, but cannot be achieved under acidic conditions, as shown in
Figure 9 and
Figure 10.
As mentioned above, we selectively dissociated DMAB with the N=N bond while obtaining a stable signal from the dissociated product. These three conditions were necessary. To begin with, this produces strong continuous plasma scissors from strong surface plasmons; in addition, in order to produce a stable reactant, it was necessary to adsorb oxygen ions and hydrogen ions because these ions provided a lower potential barrier. Last but not least, to avoid triggering the backward synthesis process, weak plasma was required to collect the general Raman signal of the product.
We conclude that the N=N selective bond cleavage of DMAB is obtained by using hot electrons as plasma scissors. Obviously, we can explain some physical mechanisms, for instance, bond-selective dissociation, pH-controlled products, and so on. Therefore, the dissociation product could be controlled by the change of pH. Under acidic conditions, the hydrogen ions adsorbed by PATP were generated from radical fragments. In contrast, 4NBT was generated by oxygen ions adsorbed under alkaline conditions.
4. Real-Space and Real-Time Observation of a Plasmon-Induced Chemical Reaction of a Single Molecule
The plasmon-induced chemical reaction of the molecule adsorbed on the surface of metal nanostructures has attracted extensive attention to photocatalytic reactions. Since the plasma was located near the metal surface, it was difficult to directly observe the chemical reaction in the plasma field. Here, the authors used scanning tunneling microscope (STM) to observe the plasmon-induced chemical reactions for the single molecule level.
The LSPR of the metal nanostructure surface concentrates light near the metal surface, making it smaller than the diffraction limit [
14], while producing a local electric field that can be used for the near-field optics [
15,
16]. Moreover, LSPs helped to increase the conversion rate of solar energy in photovoltaics [
17,
18] and photocatalysts [
19,
20]. In particular, the plasmon-induced chemical reaction of the molecule adsorbed on the surface of metal nanostructures has attracted attention as a photocatalyst to form bonds or dissociate it. As demonstrated in
Figure 12a, there is an indirect thermal electron transfer mechanism [
21,
22]. In the metal nanostructures, electron‒hole pairs were produced by local surface plasma non-radiative decay [
22,
23,
24,
25], and the transferred hot electrons formed the transient negative ion state of a adsorbed molecule [
22]. In previous experimental studies, the plasmon-induced decomposition of hydrogen and oxygen molecules was observed. This was due to the decomposition reaction that is excited by vibration after the thermal electron transfer produces transient anions.
Figure 12b reveals the direct intramolecular excitation mechanism that was proposed based on a chemical reaction of the single molecule induced by plasma. In the electronic structure of the adsorbate, the LSP excites electrons from an occupied state to an unoccupied state. Individual molecules in a strong localized plasma field near a metal surface could be observed in real space and real time.
Obviously, the implication of
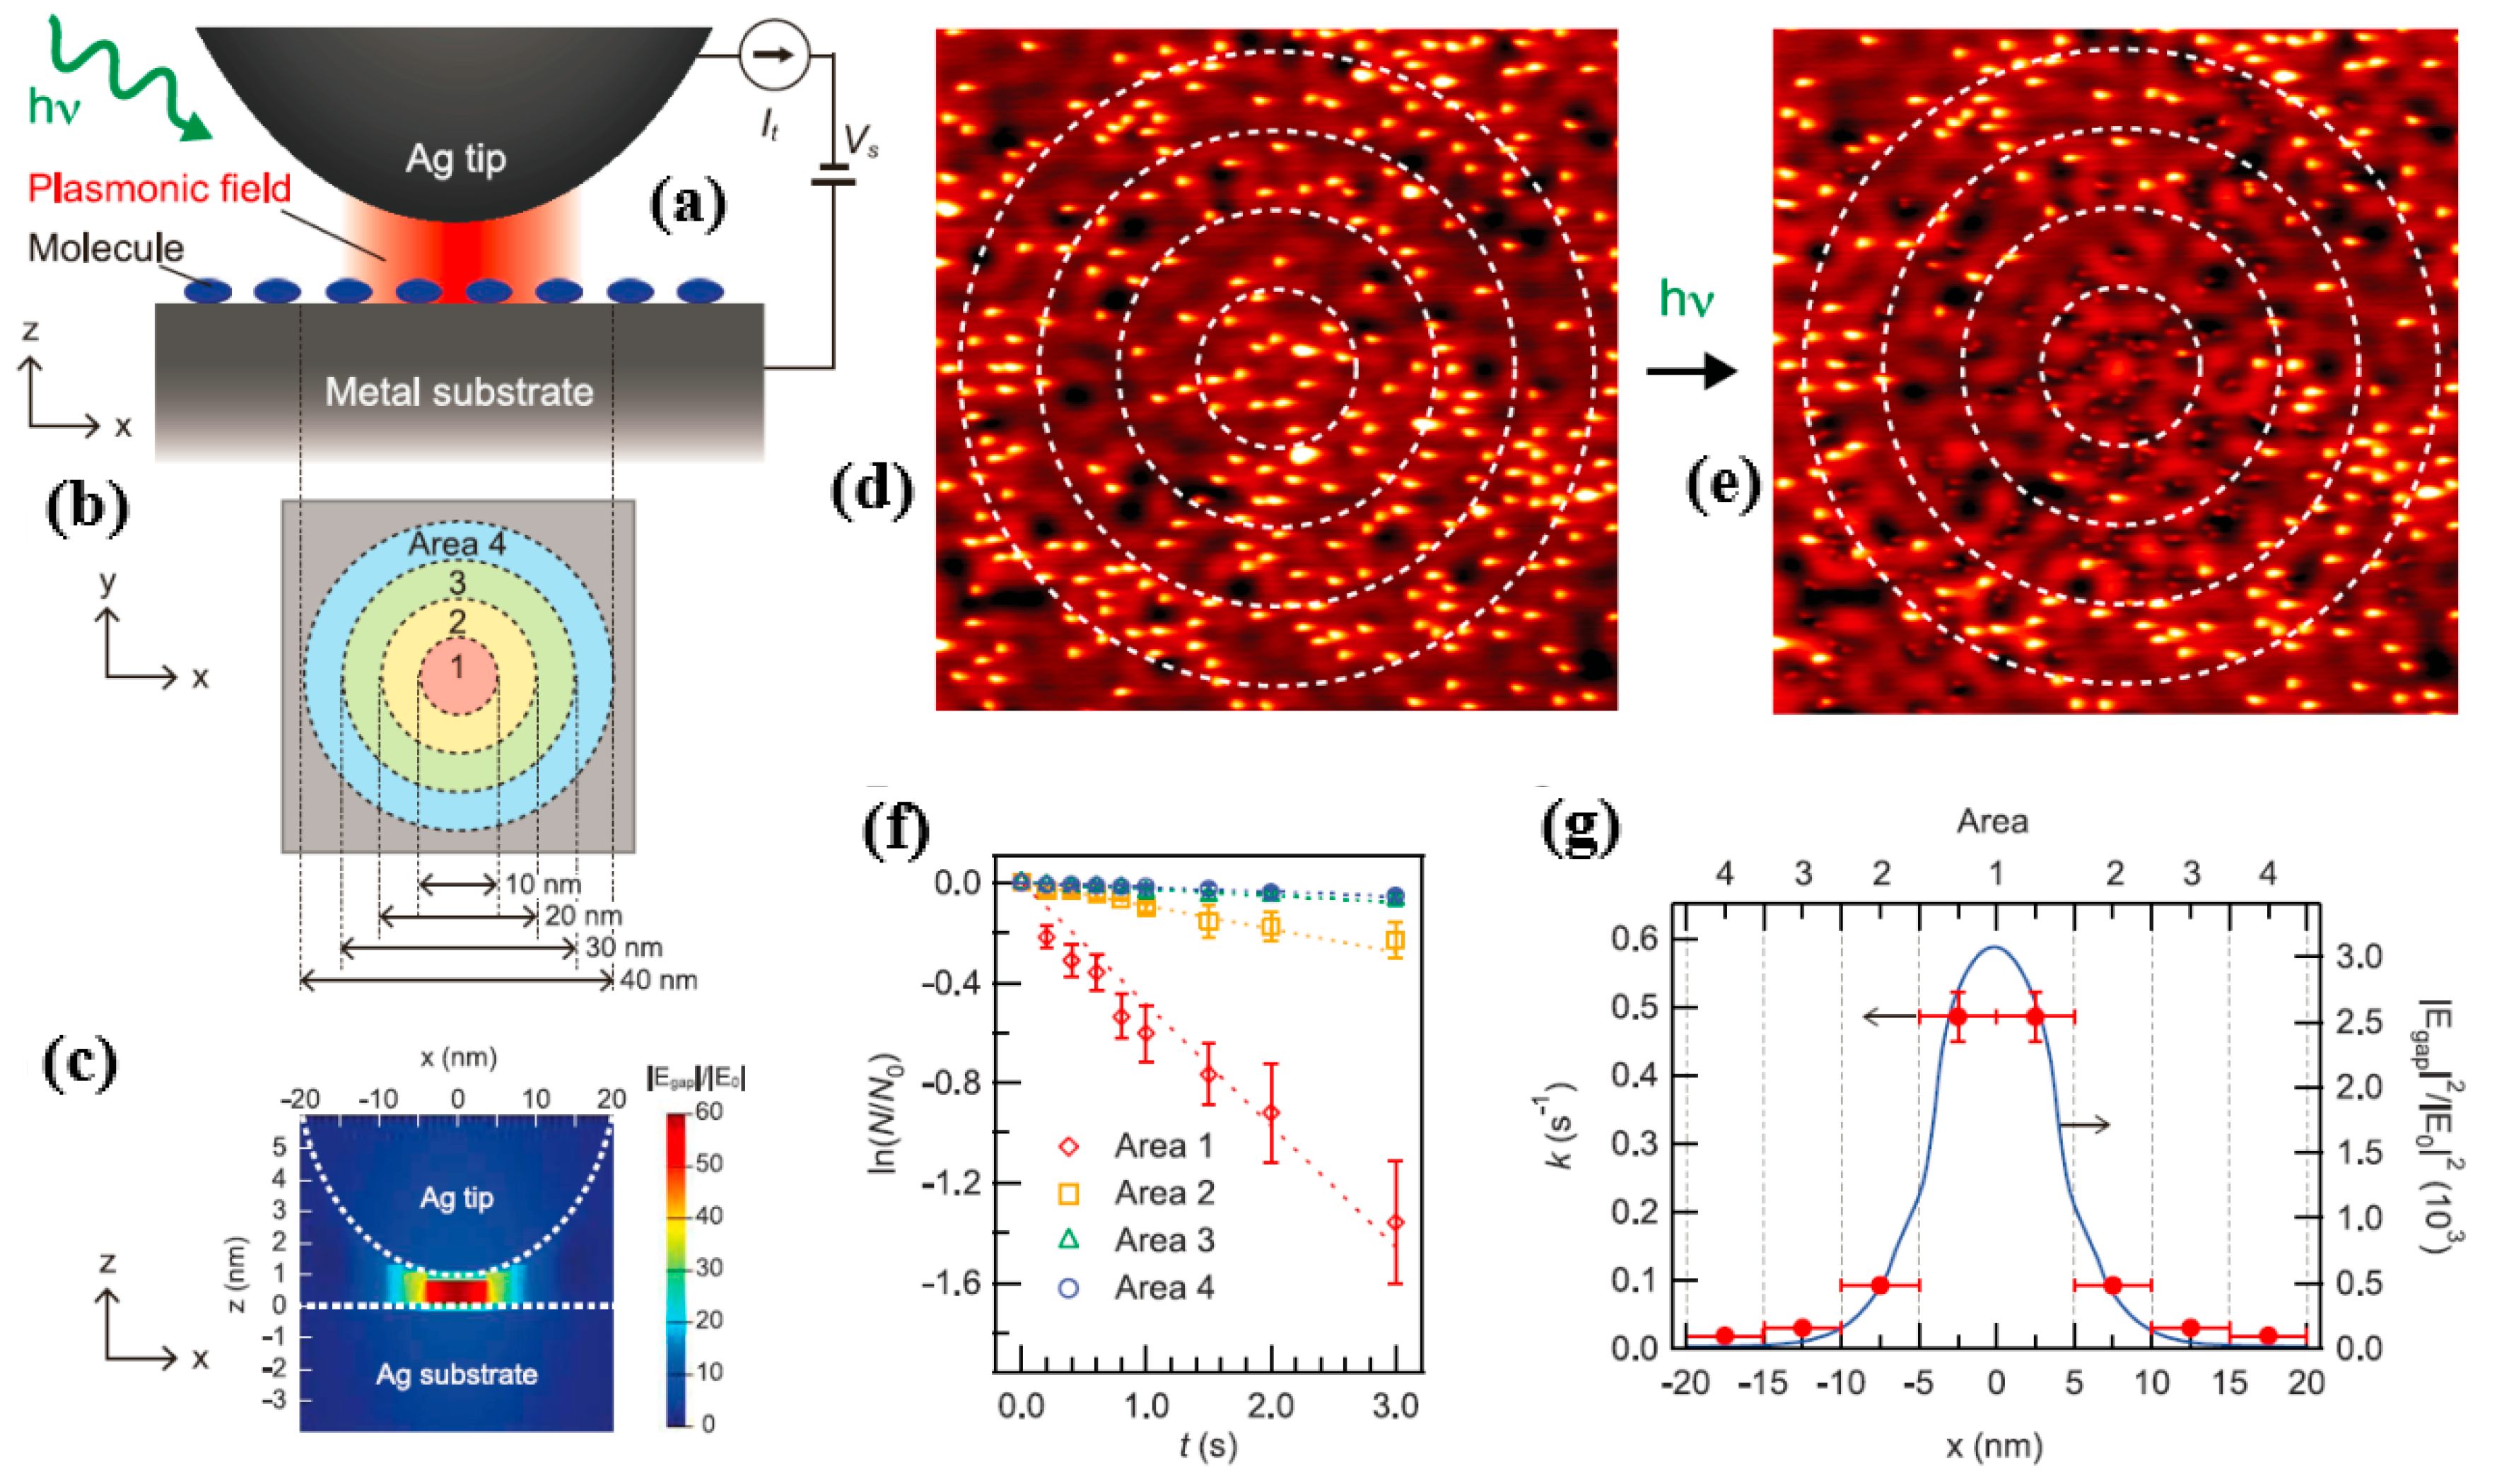
Figure 13a,b is that the experimental protocols for studying plasmon-induced chemical reactions and corresponding STM images are sound. Here, the authors chose
as a target molecule for plasmon-induced chemical reactions. In order to excite the local surface plasmon, the gold tip was placed on the bare metal surface and the radius of curvature of the tip was ~60, while the bias voltage
was set to 20 mV and the tunnel voltage
was set to 0.2 nA. It is worth noting that tunneling electrons did not excite vibrational modes associated with any type of reaction at a bias voltage of 20 mV (for example, desorption, dissociation, or rotation of a molecule [
26,
27]).
Figure 13c shows that a local surface plasma in the nanogap generated the strong electric field.
Figure 13d reveals the spatial distribution of the separated molecules, such as
, on Ag (111) before the LSP was excited with 532 nm of p-polarized light.
Figure 13e displays the distribution after the p-polarized light excited the LSP. The dissociation ratio is
, where
was the number of the
molecule after localized surface plasmon excitation with p-polarized light with a wavelength of 532 nm;
is the number of the pre-adsorbed molecule. This ratio is used for quantitative analysis of experimental studies.
Figure 13f shows the time-dependent dissociation ratio curve for p-polarized light excitation conditions at a wavelength of 532 nm, corresponding to the four regions in
Figure 13b. As shown, the ratio was linearly related to time, indicating that dissociation from
→
was the first-order reaction. The dissociation constant, whose value was
, could be determined by the oblique line in
Figure 13f.
Figure 13g reveals the magnitude of the dissociation constants in four different regions. As seen in
Figure 13g, the value reached a maximum in region 1 and decreased as the distance from the tip increased. Comparing
and
, the authors found that plasmon-induced decomposition had a very strong correlation with the electric field strength of photoexcited local surface plasmons.
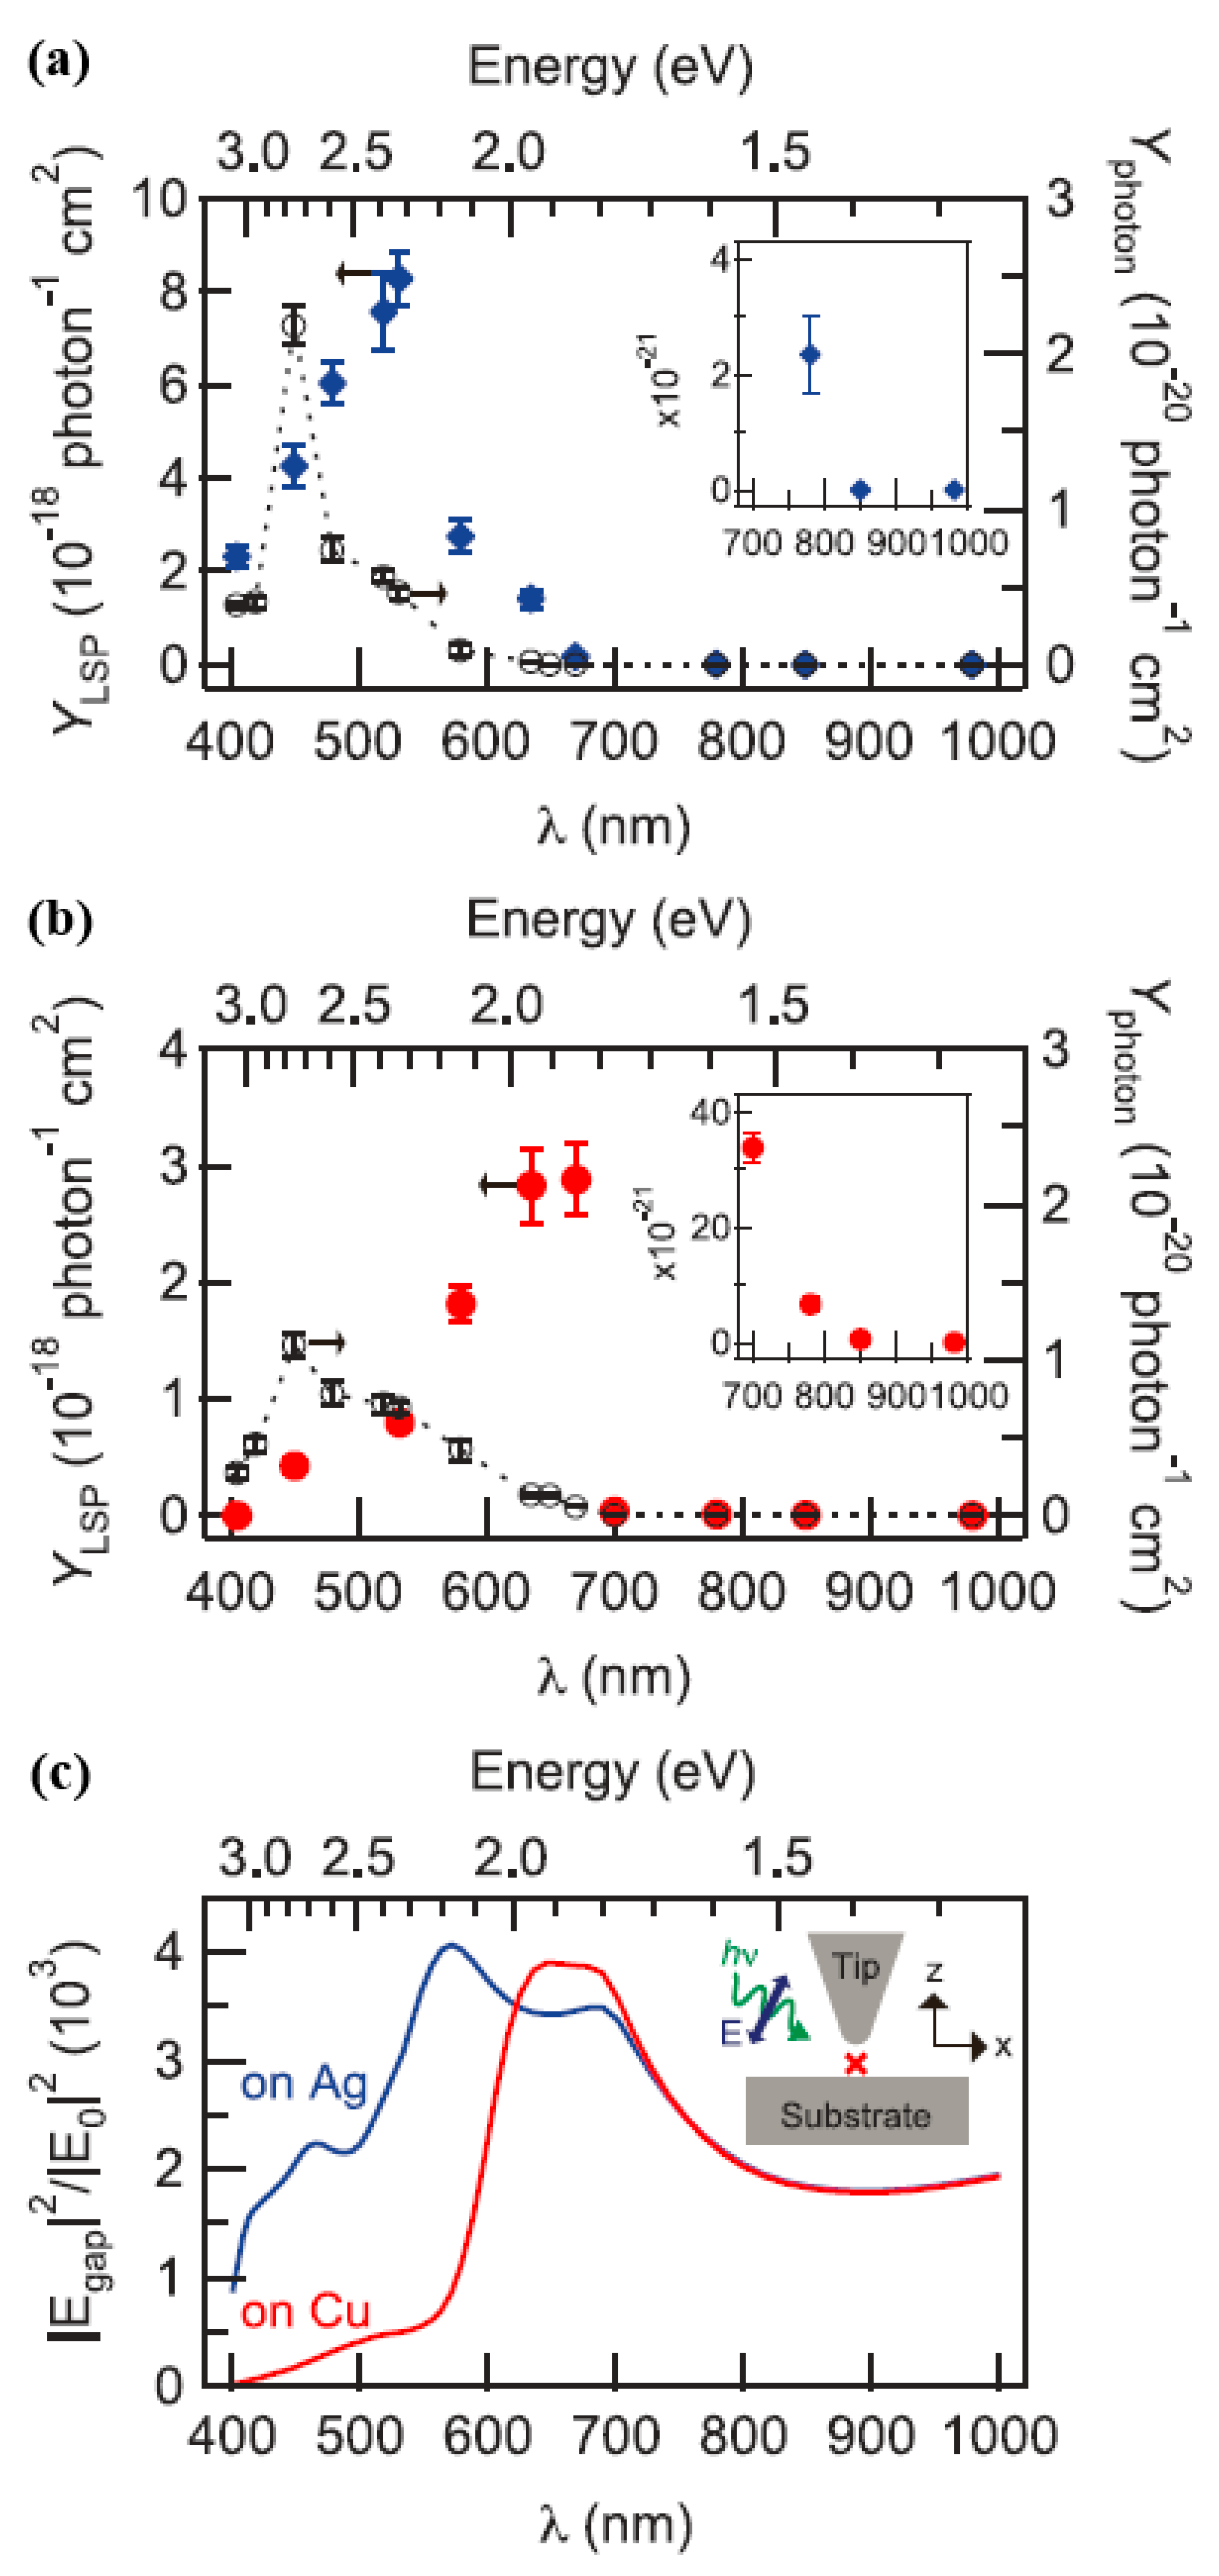
The dissociation rate constant divided by the number of incident photons per second could be used to calculate the productivity of plasma-induced dissociation,
. The wavelength at a maximum of a plasma-induced decomposition yield was about 532 nm with an energy value of about 2.33 eV. The threshold wavelength of
in region 1 was
, which was 780 nm, and the energy value was 1.59 eV, as displayed in
Figure 14a. The wavelength dependence of the plasmon-induced decomposition yield of the
molecules on the Cu(111) substrate is displayed in
Figure 14b. It can be seen from
Figure 14b that it had different plasma characteristics and electronic structures.
In the indirect thermal electron transfer mechanism (shown in
Figure 14a), the value of
was confirmed by the energy distribution of the hot electrons and the density of state (DOS) of the lowest unoccupied molecular orbital (LUMO). The energy distribution of holes and hot electrons generated by local surface plasma decay to metal electronic band structure was sensitive [
20,
21].
Figure 14c displays the calculated electric field strength of the gap between the metal substrate and the Ag tip under the condition of p-polarized light excitation, wherein the gap width was 1 nm.
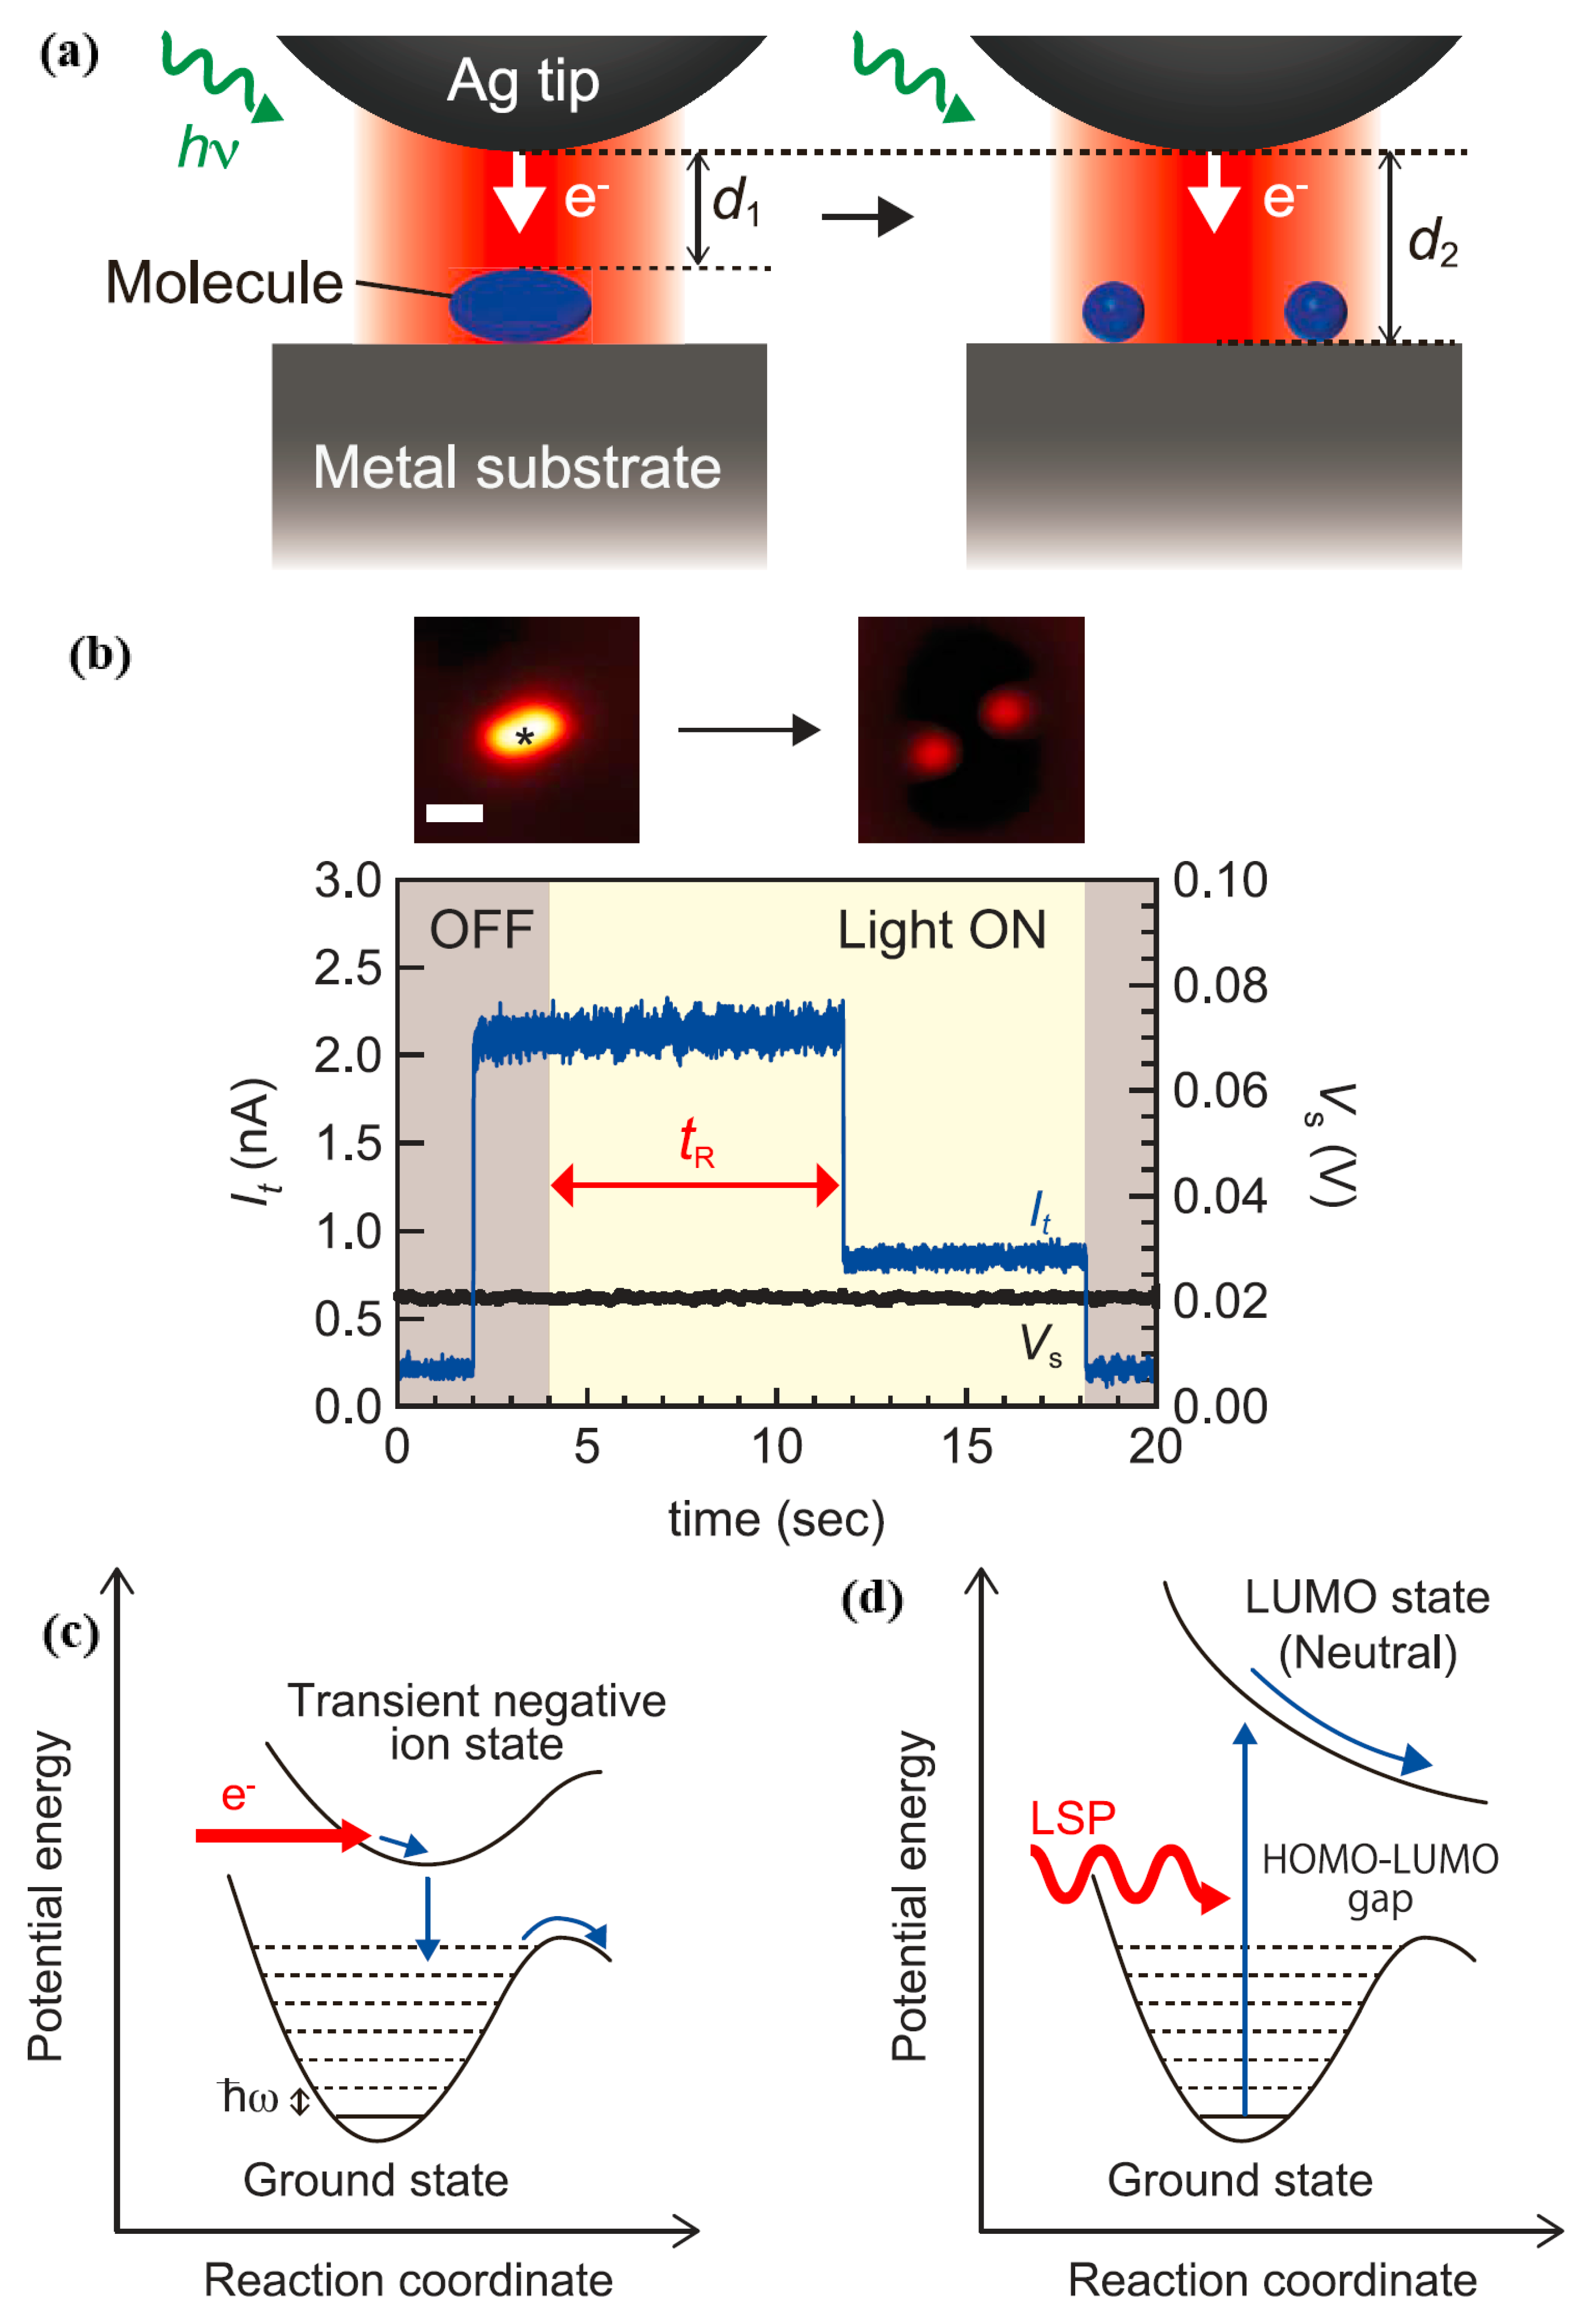
By using STM for real-time observation, the authors were able to measure the rate of plasmon-induced chemical reactions for single molecules while facilitating more in-depth studies of basic reaction pathways that were not available through spectroscopic analysis of
and traditional spectroscopy.
had a strong sensitivity to changes in gap distance, so the authors could collect real-time information by tracking
under illumination, as displayed in
Figure 15a. However,
Figure 15b reveals the current trace when a STM tip is located on the target molecule adsorbed on the Ag(111) under the irradiation conditions of p-polarized light having a wavelength of 532 nm. It is worth noting that the value of
drops suddenly, reflecting
changing from
to
; as shown in
Figure 15a, this might be due to molecular dissociation. The rate of dissociation was determined by the reciprocal of the time needed for plasma-induced dissociation. It is worth noting that at a voltage of 20 mV, the tunneling electrons did not induce a chemical reaction. Since the tunnel current under light irradiation conditions was relatively stable on the metal surface, the thermal expansion at the tip was negligible. The dissociation rate 1/
varies with the gap distance under p-polarized light with a wavelength of 532 nm. In the indirect thermo electron transfer mechanism, the reaction occurred through the inelastic electron tunneling process, as shown in
Figure 15a, it transferred from a transient negative state (TNI) state shaped by the hot electrons to the molecule [
20]. In addition, the authors could gain a deeper understanding of the reaction pathways triggered by the TNI state. The TNI state was formed by electron transfer from metal to molecule by the IET process, and having the STM [
22,
23]. As demonstrated in
Figure 15c, based on a non-dissociated potential energy surface, the energy of the state of the transient anion was dissipated to the excited state of the vibration, and the transient negative ion state was formed by electrons being transferred from a metal to a molecule. These reactions led to dissociation and rotation of
, and rotation occurred before the dissociation process. As displayed in
Figure 14, the authors could see from a
spectrum plasma-induced dissociation of
by a direct dissociation reaction path that occurred from the neutral excited state; this neutral excited state was produced through direct intramolecular excitation, as revealed in
Figure 15d. The LUMO of the
molecule was weakly hybridized with a metal substrate [
26,
28]. Since the weak hybridization inhibited the excited state relaxation [
29,
30], it could enter the energy surface of the dissociation potential from a neutral excited state, which predicts the photodissociation for
molecules in theory, in the gas phase, as shown in
Figure 15d [
31,
32]. The results indicate that a plasmon-induced chemical reaction of molecules accompanying electronic states was likely to be hybridized by direct intermolecular excitation mechanisms rather than indirect thermal electron transfer mechanisms. These findings allowed us to further understand the interaction between local surface plasmons and metal surface molecules, so that we could drive plasmon-induced photocatalysis more efficiently.


