Article

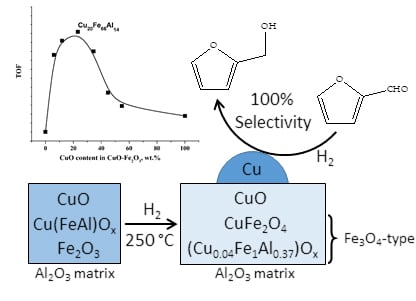
Highly Active CuFeAl-containing Catalysts for Selective Hydrogenation of Furfural to Furfuryl Alcohol

by
Svetlana A. Selishcheva
1,2,
Andrey A. Smirnov
1,2,*,
Alexander V. Fedorov
1,2,
Olga A. Bulavchenko
1,2,
Andrey A. Saraev
1,2,
Maksim Yu. Lebedev
1,2 and
Vadim A. Yakovlev
1,2
1
Scientific and Education Center of Energy Efficient Catalysis, Novosibirsk State University, Pirogova Str., 1, 630090 Novosibirsk, Russia
2
Department of Catalytic Processes of Fine and Bioorganic Synthesis, Federal Research Center Boreskov Institute of Catalysis, Pr. Akad. Lavrentieva, 5, 630090 Novosibirsk, Russia
*
Author to whom correspondence should be addressed.
Catalysts 2019, 9(10), 816; https://doi.org/10.3390/catal9100816
Submission received: 30 August 2019 / Revised: 26 September 2019 / Accepted: 27 September 2019 / Published: 28 September 2019

Abstract

:
CuFe-containing catalysts with different copper oxide content were prepared by fusion of metal salts. The obtained catalyst showed high activity in the hydrogenation of furfural to furfuryl alcohol (FA) in the batch reactor in the presence of isopropanol as a solvent at a temperature of 100 °C and a hydrogen pressure of 6.0 MPa. The yield of FA and furfural conversion are 97% and 98%, respectively. In the solvent-free reaction in the flow-type reactor; the most active catalyst Cu20Fe66Al14 leads to the 96% formation of FA with 100% conversion of furfural at liquid hourly space velocity (LHSV) = 1 h−1; 160 °C and a hydrogen pressure of 5.0 MPa during 30 h. According to the X-ray diffraction (XRD) method, the active component of the spent and fresh Cu20Fe66Al14 catalyst is the same and is represented by metallic copper and Fe3O4-type spinel. Using different methods, the formation of active sites was investigated.

Graphical Abstract

1. Introduction

The production of motor fuels components and valuable chemical compounds requires the development and improvement of catalytic processes that effectively transform non-edible plant-based raw materials into various products under modern challenges. One of the most promising starting materials is furfural, which can be considered as a platform for the production of a large number of compounds with different properties and a wide range of applications [1,2,3,4]. Furfural widely used as a solvent for dienes extraction in petrochemicals, for solid resins and furacilinum production, in the synthesis of amino cyclopentenones in water that could be applied as intermediates for antitumor products [5,6]. The technology for furfural production is quite developed and based on acid hydrolysis of hemicellulose (a component of the plant cell walls) [7].
Hydrogenation is the most significant process in the furfural conversion and can be used to obtain various valuable chemicals, for example, furfuryl alcohol (FA) (Figure 1), 2-methylfuran (2-MF), tetrahydrofurfuryl alcohol (THFA), etc.
Moreover, about 50% of the total volume of furfural goes to the production of FA, which has a wide range of application: Production of resins, flavors, components of motor fuels (levulinic acid), in the pharmaceutical industry (ranitidine), biochemistry, etc. The traditional catalyst for FA production from furfural is the CuCr catalyst leading to a 98 % yield of FA on the industrial scale [7]. Nevertheless, the main problem of such systems is the presence of chromium in their composition, which can contaminate the target products with chromium compounds and impede their further use in areas such as pharmaceuticals. Moreover, it has been shown that chromium-containing catalysts undergo deactivation due to shielding of active copper by chromium particles [8]. Catalysts based on noble metals (Pt and Pd) can replace the Cr-containing systems [9,10,11,12,13], but their use increases the cost of the process, furthermore FA selectivity is lower compared to chromium–copper systems.
Catalysts based on transition metals constitute the promising systems for the above process. A large number of works are devoted to the selective hydrogenation of furfural to FA in the presence of catalysts based on Ni, Cu, Fe, Mo, Zn, etc. [14,15,16,17,18]. The authors use various methods for the synthesis of catalysts, additives, process conditions, and solvents (in the case of a liquid phase process) [19,20,21]. In [22], the authors used a Ni/Al2O3-C catalyst that showed high activity (furfural conversion was 99%) and selectivity for FA (92%) at a hydrogen pressure of 4.0 MPa, 160 °C for 6 h in a batch reactor in ethanol. Nevertheless, in this work there is no data about using a catalyst in a flow-type reactor without a solvent that is important for industrial applications. Most systems also have different disadvantages: Rapid deactivation due to sintering followed by active component agglomeration; coke formation on the catalyst surface; low selectivity for the target product; and the need to use high temperature and pressure to achieve a high activity in the furfural conversion.
In the past few years, Cu-containing systems are considered as the most promising catalysts for the selective hydrogenation of furfural to FA. However, a monometallic copper catalyst does not have sufficient activity in the process [23], or it is necessary to use high temperature and pressure. Nevertheless, the authors [24] proposed a Cu/SiO2 catalyst prepared according to [25], that showed 98% selectivity for FA at 100% conversion of furfural at a hydrogen pressure of 0.1 MPa, 130 °C, weight hourly space velocity (WHSV) = 0.4 h−1. However, total conversion of furfural could be ensured by a low value of WHSV. Unfortunately, the authors declared a large number of carbon deposits on the catalyst after testing. In addition, the formation of 2-methylfuran as one of the products was also observed.
It is known that introduction of additives (for example, Ca, Co, Al, Mg, Mo, Fe, etc.) is one of the methods for increasing the activity of copper catalysts [14,19,20,26]. The introduction of such additives allows increasing the activity and selectivity of copper-containing catalysts in the target process by reducing the carbonization of the surface and the agglomeration of the particles of the active component. Villaverde et al. [15] have studied CuZnAl and CuMgAl inexpensive catalysts, which provide a high conversion of furfural. Such trimetallic systems, as shown by the authors using the method of X-ray phase analysis (XRD), contain small particles of Cu, which have higher activity in the target process than large ones, and 5 nm spinel particles (ZnAl2O4 or MgAl2O4), which provide the presence of additional adsorption sites for activation of the carbonyl group of the furfural. In both cases, separate crystalline phases of CuO, ZnO or MgO were not detected, which indicates a strong dispersion of cations in the spinel structure. The authors attribute the higher activity of the CuMgAl catalyst to the strong interaction of metallic copper particles and Mg2+ cations in a spinel-like matrix. Earlier, we have already tested oxide catalyst systems based on copper and iron for the oxidation of CO [27], in which they showed high activity. Therefore, based on the literature data and previously obtained results, it seemed advisable to investigate copper–iron catalysts in the reduced form in the hydrogenation of furfural, since spinel structures can increase the overall activity of the copper catalyst [28].
It is also important to note that at the present time the study of selective hydrogenation of furfural to FA usually held in the liquid phase in batch reactors in the presence of various solvents, but very little attention is paid to the process in a flow system without using a solvent, that is one of the necessary condition for studying the activity and stability of the developed catalysts.
In this work, CuFe-containing catalysts for selective hydrogenation of furfural to FA are considered. It was shown that the using of those systems makes it possible to carry out the process efficiently and obtain the target product with high yield both in a batch reactor and in a flow system without using a solvent.

2. Results and Discussion

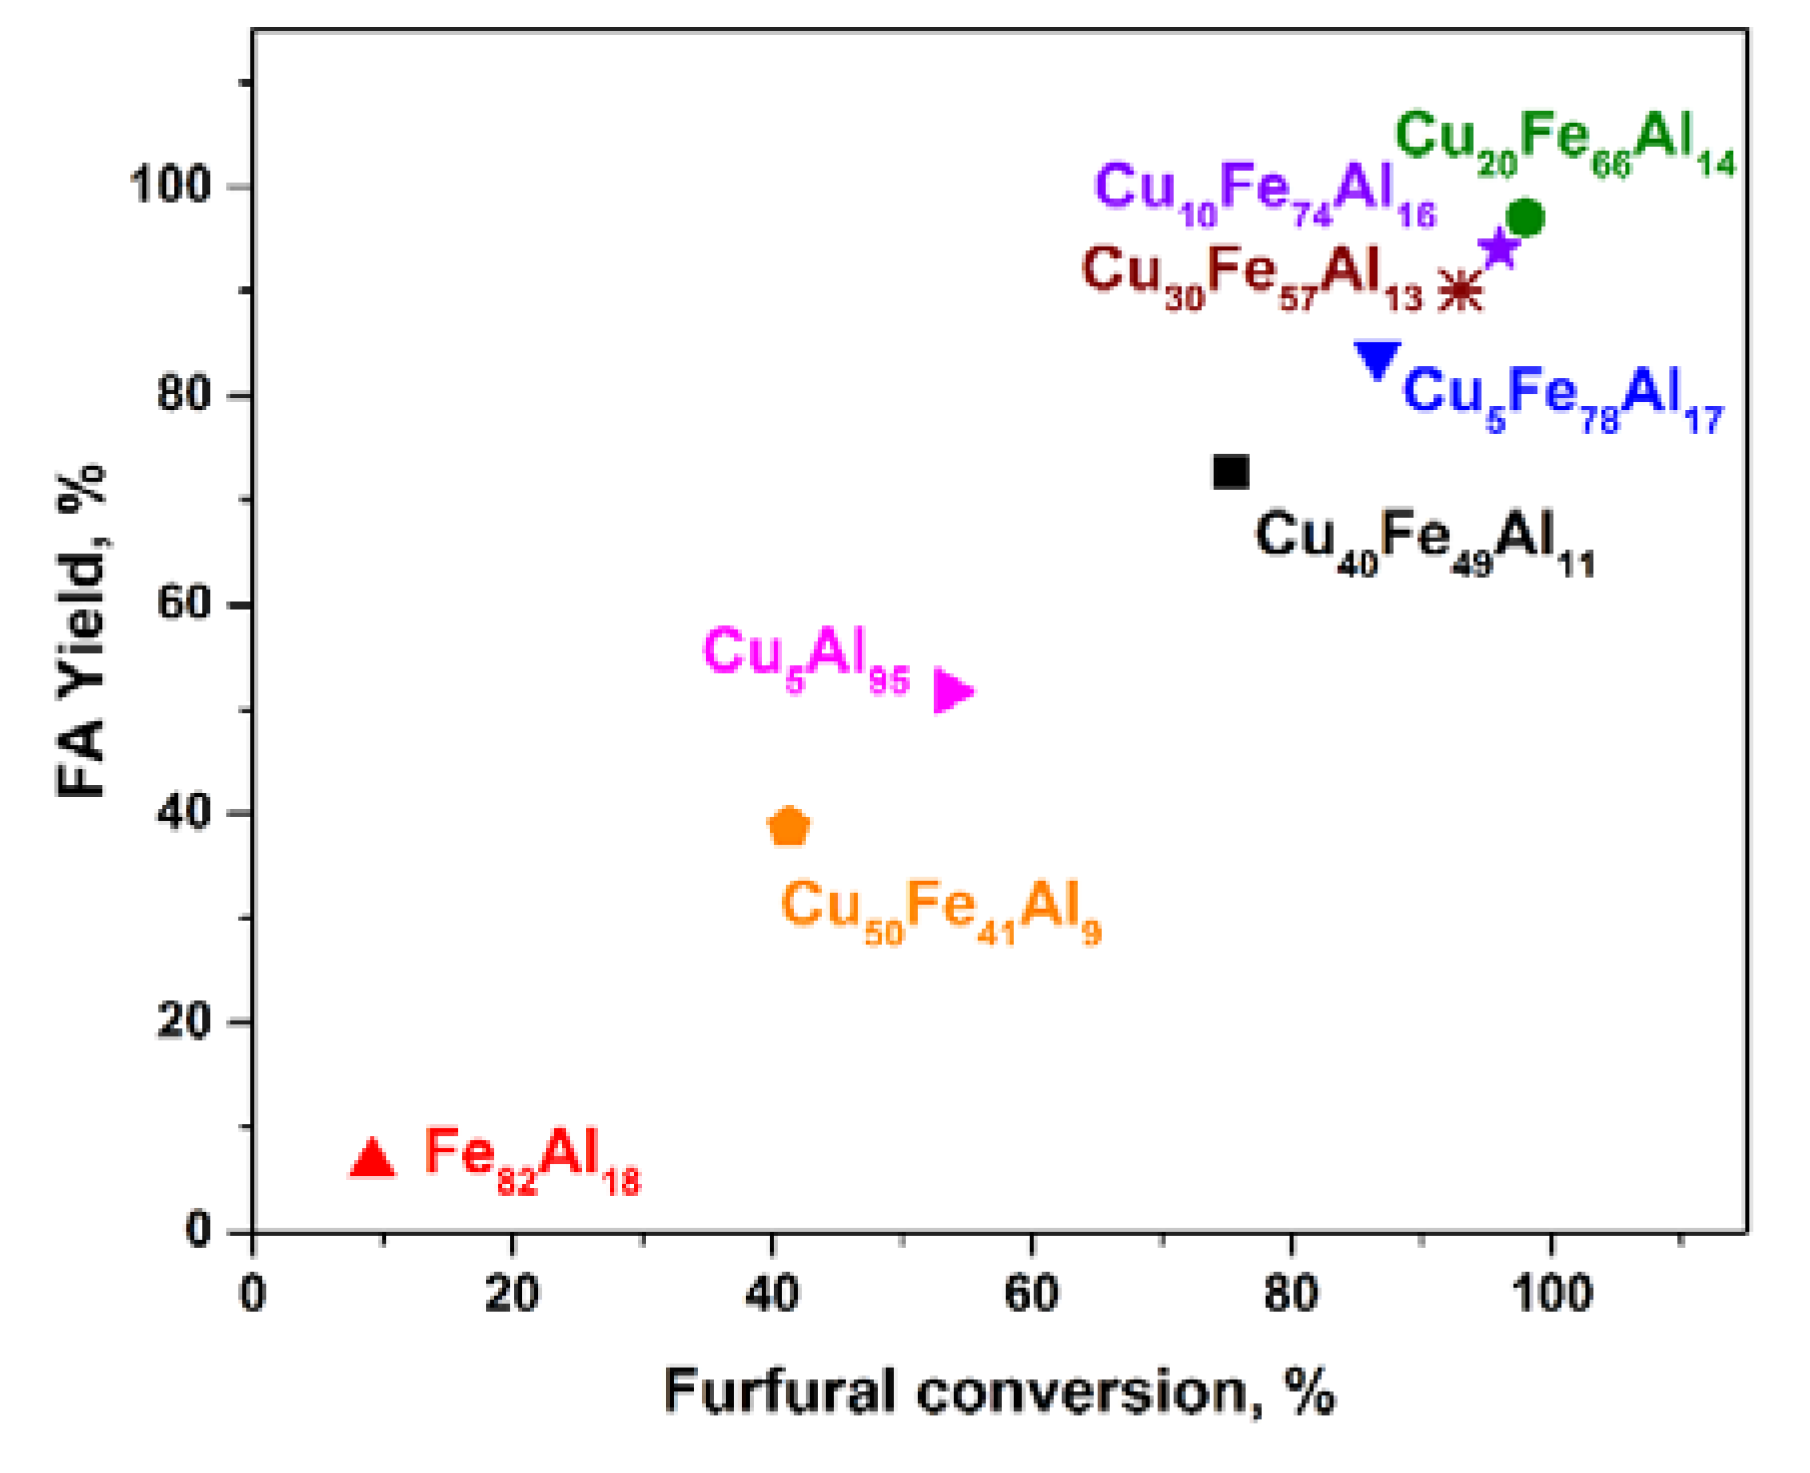
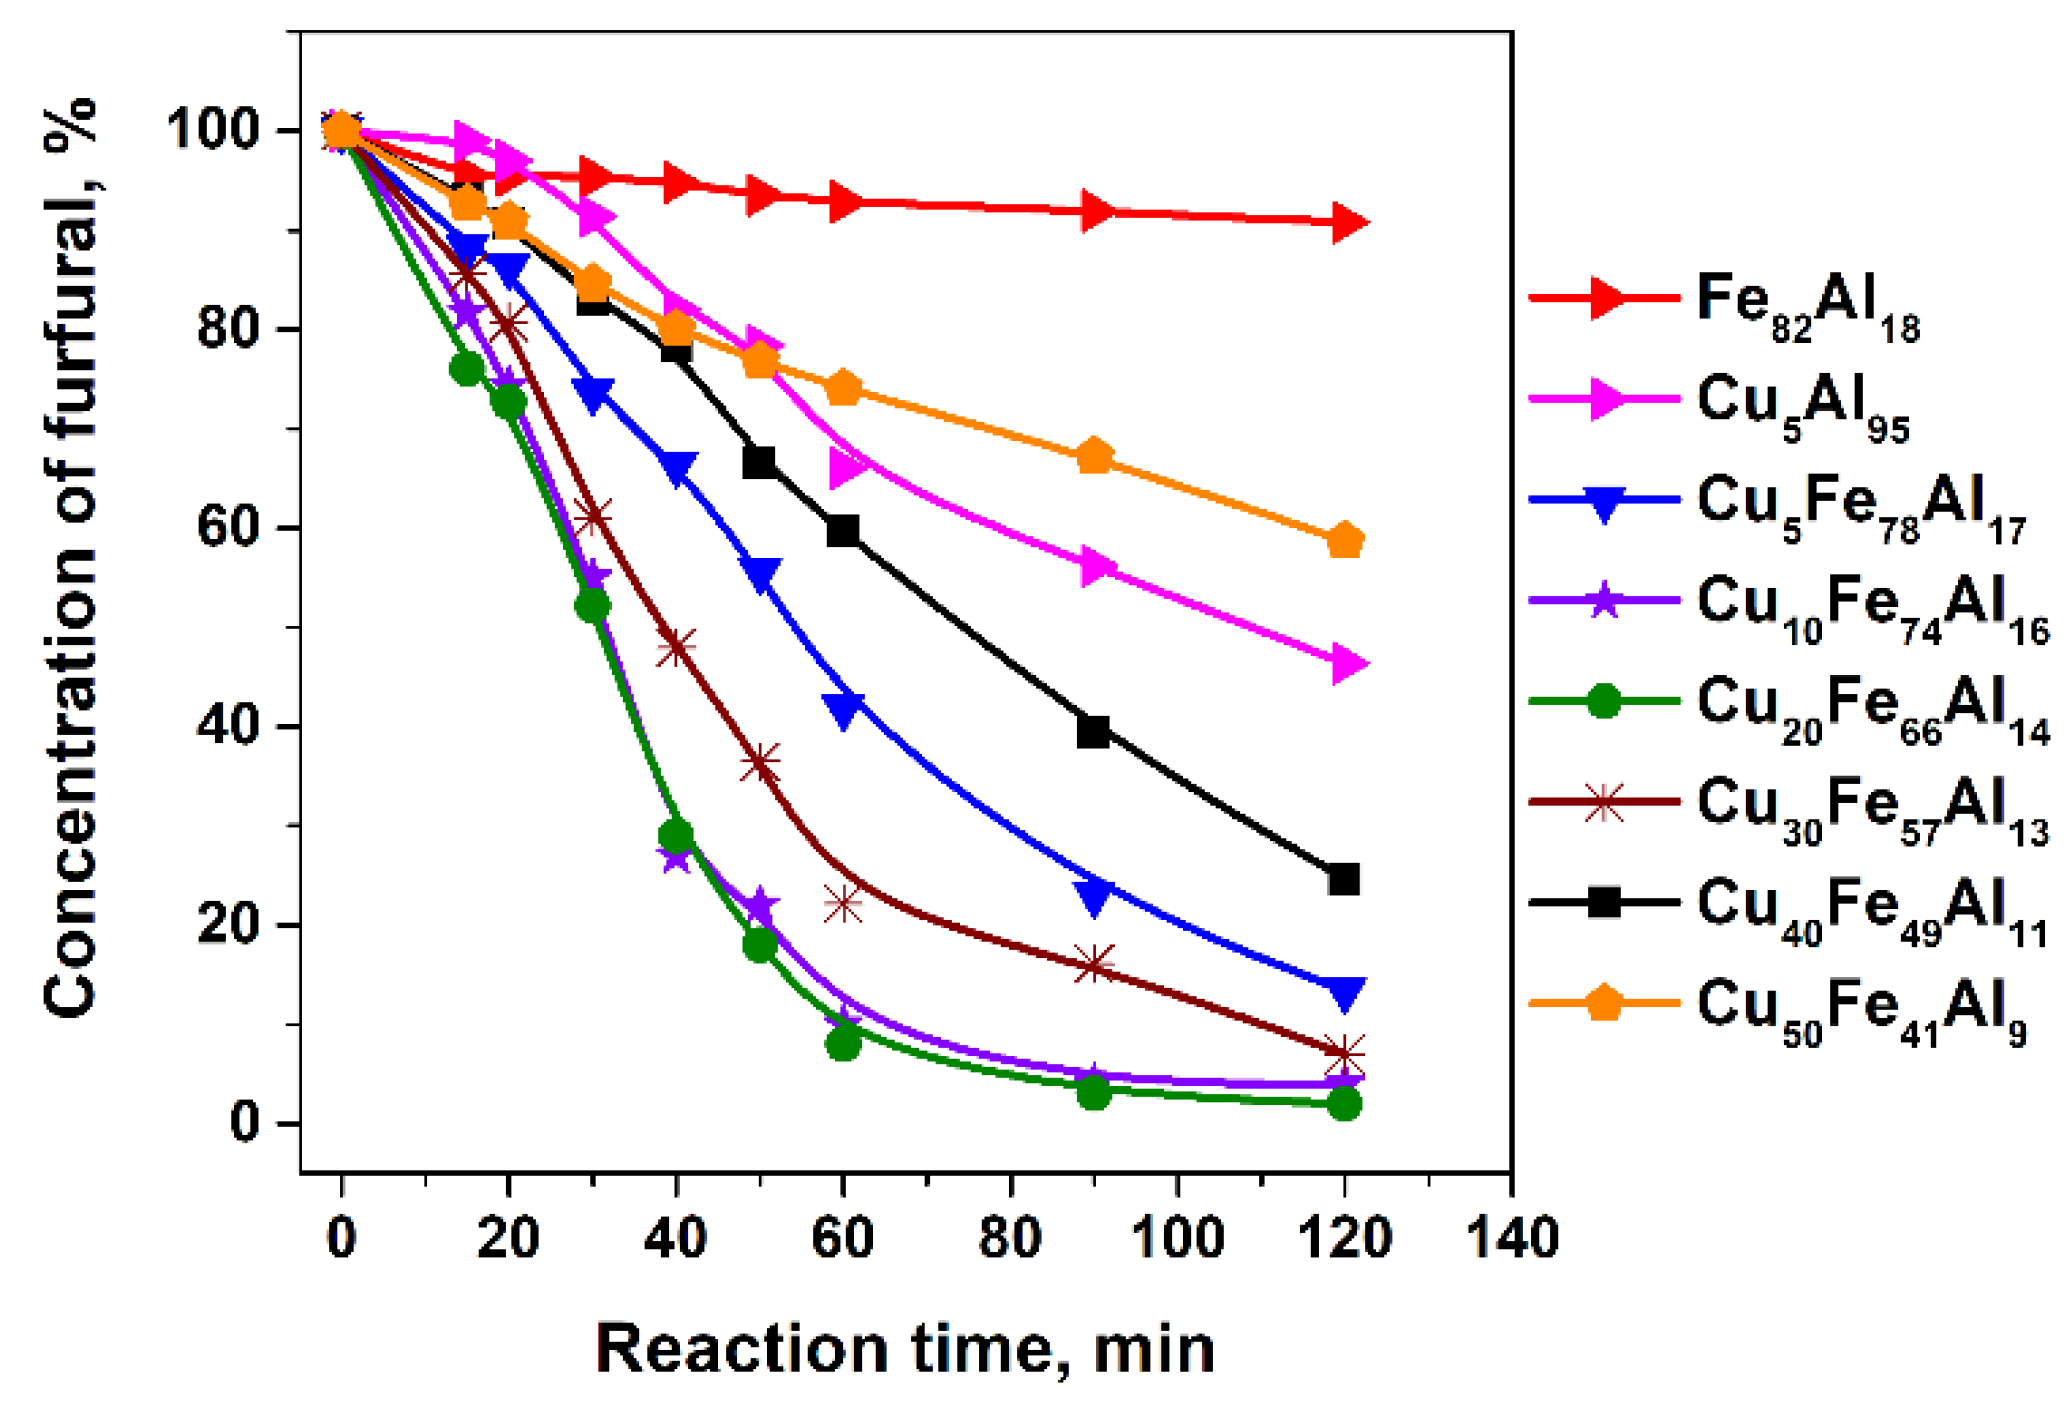
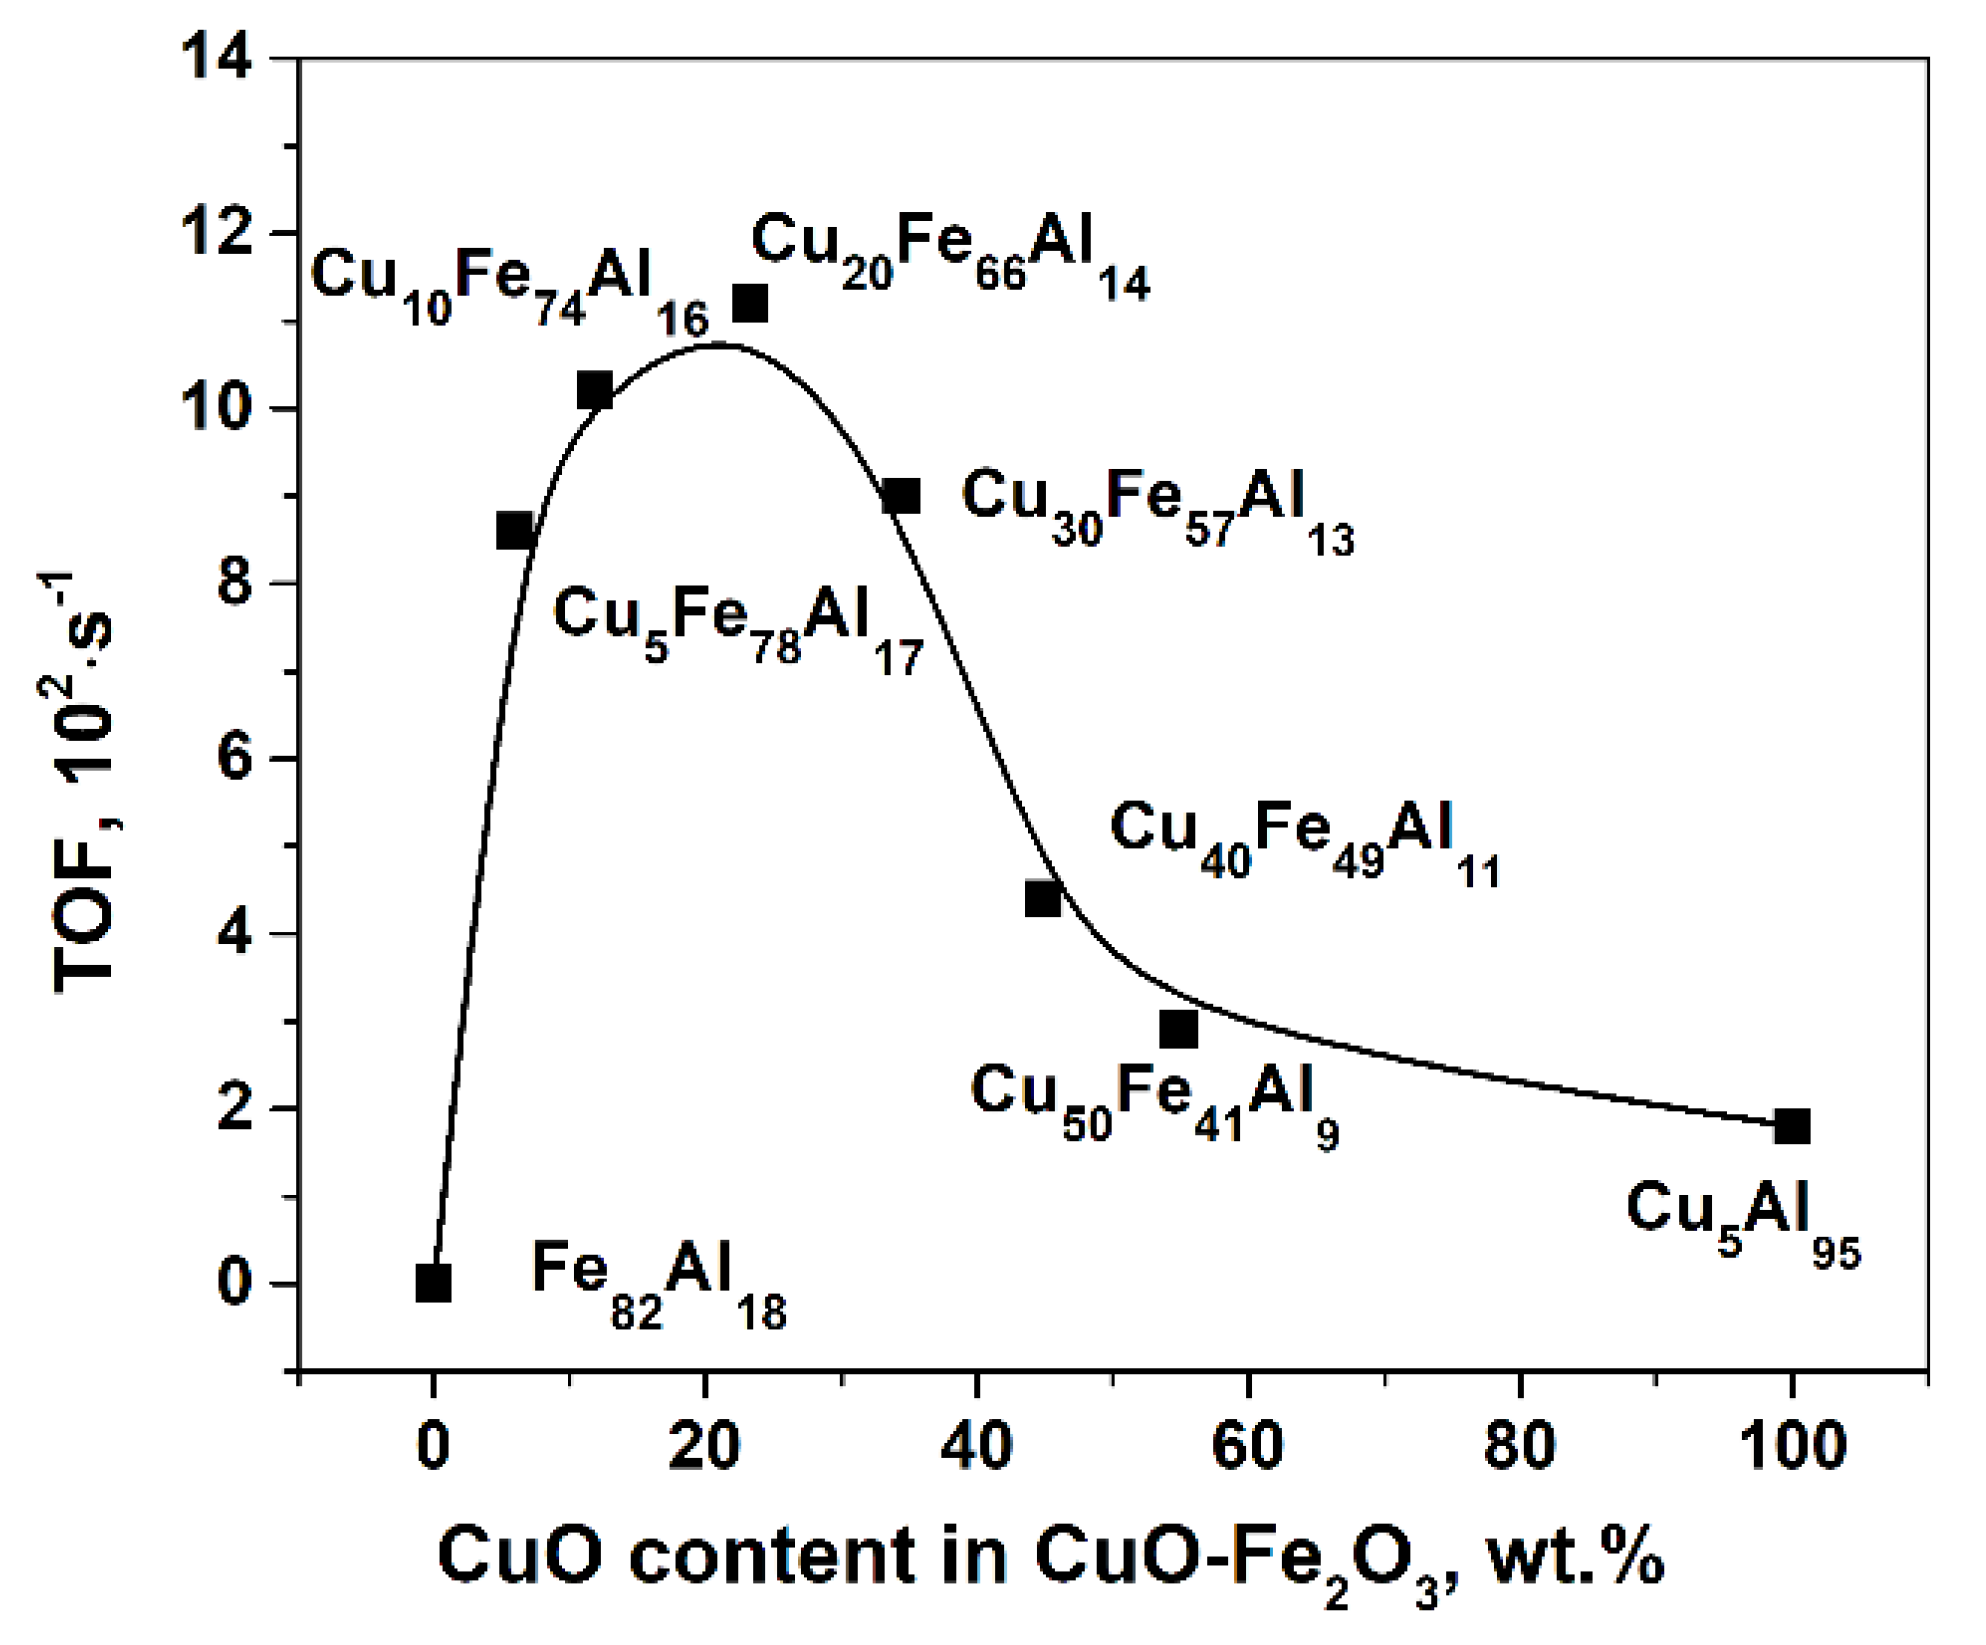
2.1. Catalytic Activity of CuFe-Containing Catalysts in a Batch Reactor

Eight samples of the catalysts with different copper contents were studied in the process of furfural hydrogenation to furfuryl alcohol (FA). The ratio of Fe/Al oxide forms was kept constant and was about 4.6. The introduction of alumina can increase the specific surface area of the catalyst and can also lead to the formation of additional spinel structure. For convenience, catalysts were named as Fe82Al18, Cu5Fe78Al17, Cu10Fe74Al16, Cu20Fe66Al14, Cu30Fe57Al13, Cu40Fe49Al11, Cu50Fe41Al19, and Cu5Al95, where subscripts indicate the content of metal in the oxide form in the sample and textural characteristics (Table 1).
The content of copper oxide in the CuFeAl samples ranged from 5 to 50 wt %; catalysts Fe82Al18 and Cu5Al95 were also prepared to determine the effect of iron and copper separately. The table also contains the surface by the BET method and CO uptake obtained by CO chemisorption for catalysts reduced at 250 °С. The reduction temperature was chosen according to literature data and our previous study [29]. The iron-free catalyst had the largest surface due to the high content of γ-Al2O3 with a high surface. The decrease in Al content led to a decrease in the BET area. The minimum surface area was 22 m2/ g and corresponds to the Cu50Fe41Al9 sample. It should be noted that CO did not adsorb on the Fe82Al18 catalyst. It could be concluded that adsorption takes place only on Cu particles. A stoichiometry of Cu:CO = 1:1 was assumed according to [30]. Since furfural in its structure has an aldehyde group C=O adsorbing on catalysts’ surface during the reaction, it was assumed in the calculation of turn over frequency (TOF) that the amount of adsorbed CO was equal to the number of active sites of the catalyst. According to CO chemisorption the average amount of active sites was approximately the same among CuFe-catalysts. The low value of surface and active sites led to the need to use a high ratio of catalyst/feedstock in reaction.
CuFe catalysts were tested in a batch reactor at 100 °С and hydrogen pressure at 6.0 MPa using 60 mL 7 vol.% furfural in isopropanol to determine the optimal content of Cu. In Figure 2 the dependence of FA yield on reaction time in the presence of CuFe-containing catalysts is shown.
As can be seen from the dependence, a sample without copper does not show activity in the conversion of furfural practically (the conversion is no more than 7%), while the introduction of copper into the iron containing catalyst allows increasing the conversion of the desired product to 97%. Moreover, the most active catalysts are ones with a copper oxide content from 10% to 30%. At more than 30% of introduced copper, the activity of the catalyst was reduced, apparently due to the formation of larger particles of the active component, which were less active in the target process. The experiment without a catalyst showed no activity in furfural conversion at the same reaction condition. The repeat test for Cu20Fe66Al14 was performed to reproduce the observed data. Deviations in the received data were insignificant. Weisz-Prater criterion and the Mears criterion were calculated and showed that there were no internal diffusion limitations or external diffusion limitations.
Figure 3 shows the dependence of the yield of FA on the conversion of furfural. A sample that did not contain copper oxide was practically inactive, and the catalyst without iron exhibited insufficient activity in the target process. The introduction of both iron oxide and copper oxide into the catalyst made it possible to increase the activity of the monometallic copper catalyst due to the synergistic effect. Interaction of oxides of copper, iron and aluminum with the formation of spinel structure occurred. The spinel structure contributed to the formation of metallic copper particles on its surface and can be considered as additional sites for furfural adsorption. The composition of these structures will be discussed in more detail in the section of catalysts characterization. The most active sample from this series is Cu20Fe66Al14, the conversion of furfural and yield of FA were 98% and 97%, respectively. The selectivity for all samples was close to 100%. In addition, the selectivity did not depend on the degree of furfural conversion during the reaction time. Deviations from 100% were caused by the formation of a by-product—furfuryl hydroxyl-isopropyl ether (FHIE) formed during the interaction of furfural with isopropyl alcohol (solvent). The formation of this product was observed in our previous works [18,29,31,32].
It was found that the experimental dependence of the concentration of furfural in the reaction mixture on the reaction time was well described by the first-order kinetic equation. Table 2 and Figure 4 present the turn over frequency (TOF) of the catalysts depending on the content of copper oxide in CuO-Fe2O3. This parameter was calculated using the formula presented in the experimental part, which includes the number of active sites of the catalyst, which was determined by CO chemisorption and the constant rate of furfural conversion. The errors in Table 2 were found by minimizing the sum of squared differences of the estimated and experimental values of the mole fraction of the compound for each experimental point. According to the data, activity of the Cu-containing samples decreased in the series Cu20Fe74Al16 > Cu10Fe66Al14 > Cu30Fe57Al13 > Cu5Fe78Al17 > Cu40Fe49Al11 > Cu50Fe41Al9 > Cu5Al95.
The highest activity was observed for samples with a CuO content of 10 to 20 wt %. The catalyst with mixed oxide of iron and aluminum did not have activity under the process condition. A copper catalyst with alumina also did not show high activity in comparison with samples containing 10–30 wt % CuO. Apparently, the high activity of copper–iron–aluminum catalysts was associated with the formation of metal phases or mixed oxides, which determine the activity of these samples in the hydrogenation of furfural. When the content of copper oxide was more than 20 wt % a decrease in the activity of samples was observed, probably due to the formation of larger particles of copper oxide blocking the active sites of metal or mixed oxide phases.
Villaverde et al. [15] have studied liquid-phase furfural hydrogenation over different Cu-based catalysts at 110 °C and 1.0 MPa, using iso-propanol as a solvent. The maximal TOF value among catalysts (Cu/SiO2, CuMgAl, CuZnAl, and Cu-Cr) was 0.049 s−1 for the CuMgAl sample. In the present work, we had CuFe catalysts with twofold higher activity in furfural hydrogenation.
It is known that one of the reasons for the deactivation of catalysts is the formation of carbon deposits on its surface. An elemental CHNS analysis was performed in order to determine the amount of carbon in the composition of spent copper–iron catalysts. The results of this analysis are presented in Table 2. It is shown that in general carbon formation was small and did not exceed 2%, while the highest carbon content ​​corresponded to more active catalytic systems (with a mass content of copper oxide of 10%–30%). Apparently, due to the low activity of the other catalysts, carbon formation occurred not so fast (0.5% for samples Cu50Fe41Al9 and Cu5Al95). However, along with the most active catalysts, approximately the same carbon content was observed in the case of the Fe82Al18 catalyst. Apparently, the iron–aluminum catalyst was more prone to carbonization.
A series of experiments on the hydrogenation of furfural to FA over the Cu20Fe66Al14 catalyst was performed in a batch reactor at the temperature in a range of 100–250 °C with a step of 30 °C to select the optimum temperature of the process (Figure 5).
It was shown that the temperature range of 100–130 °C was optimal for this process and led to 97%–99% FA selectivity and 100% furfural conversion (Figure 6). At further temperature increasing to 160 °C, a slight decrease in the formation of FA (yield of 95%) occurred, which was much more significant at a temperature of 190 °C (yield was less than 53%). With an increase in the reaction temperature (190–250 °С), the hydroxyl group of FA was hydrogenated forming 2-methylfuran (2-MF) in an amount up to 37%. At a temperature of 220 °C, a significant shift towards the formation of 2-MF occurred, and it became the main reaction product with a yield of up to 74%, while the yield of FA was only 6%. At this temperature, the further hydrogenation of the 2-MF furan ring with the formation of 2-methyltetrahydrofuran (2-MTHF) was observed followed by the breaking of the cycle with the oxygen removal with 1-pentanol formation (Figure 6). At a reaction temperature of 250 °C, the formation of 2-MF was reduced to 52% due to deeper hydrogenation and cracking reaction and the formation of 1-pentanol with a yield of up to 22%.
Elemental analysis of the catalysts after the reaction showed that the carbon content was approximately constant and did not exceed 1.2 wt %; we could affirm that the Cu20Fe66Al14 catalyst was insensitive to the temperature under the reaction conditions in a batch reactor relative to carbon deposits.
The catalyst Cu20Fe66Al14 was chosen for further studies in selective hydrogenation of furfural to FA in the solvent-free process based on the observed data, taking into account the conversion of furfural, the yield and selectivity for FA, as well as the specific surface area. In addition, this catalyst could be considered as a catalyst for obtaining 2-MF at a temperature of 200–250 °C and hydrogen pressure 6.0 MPa. It showed the high yield of 2-MF (74%) and stability to the deposition of carbon residues on its surface.
Studying the mechanism of furfural adsorption on active sites of Cu-based catalysts Resasko et al. [17] suggested that furfural adsorption occurs mainly through an unshared pair of oxygen electrons of the aldehyde group with formation of η1-aldehyde. In this state, the molecule of furfural is perpendicular to the catalyst surface and repulsive forces act on the aromatic ring due to overlapping of the 3D-orbital of Cu surface atoms with the aromatic furan ring. Thus, the reaction can proceed through the formation of surface alkoxide or hydroxyalkyl species.
The latter mechanism was more energetically preferable, which was explained by the stabilizing effect of the aromatic furan ring on the hydroxyalkyl intermediate (the attachment of the H atom to the O atom led to the formation of an unpaired electron on the C atom that could be delocalized by the furan ring). It should be noted that while there was a strong repulsion of the furan ring on the surface of Cu (111) the furan ring was closer to the surface due to the lower density of Cu atoms on this face on Cu (110).

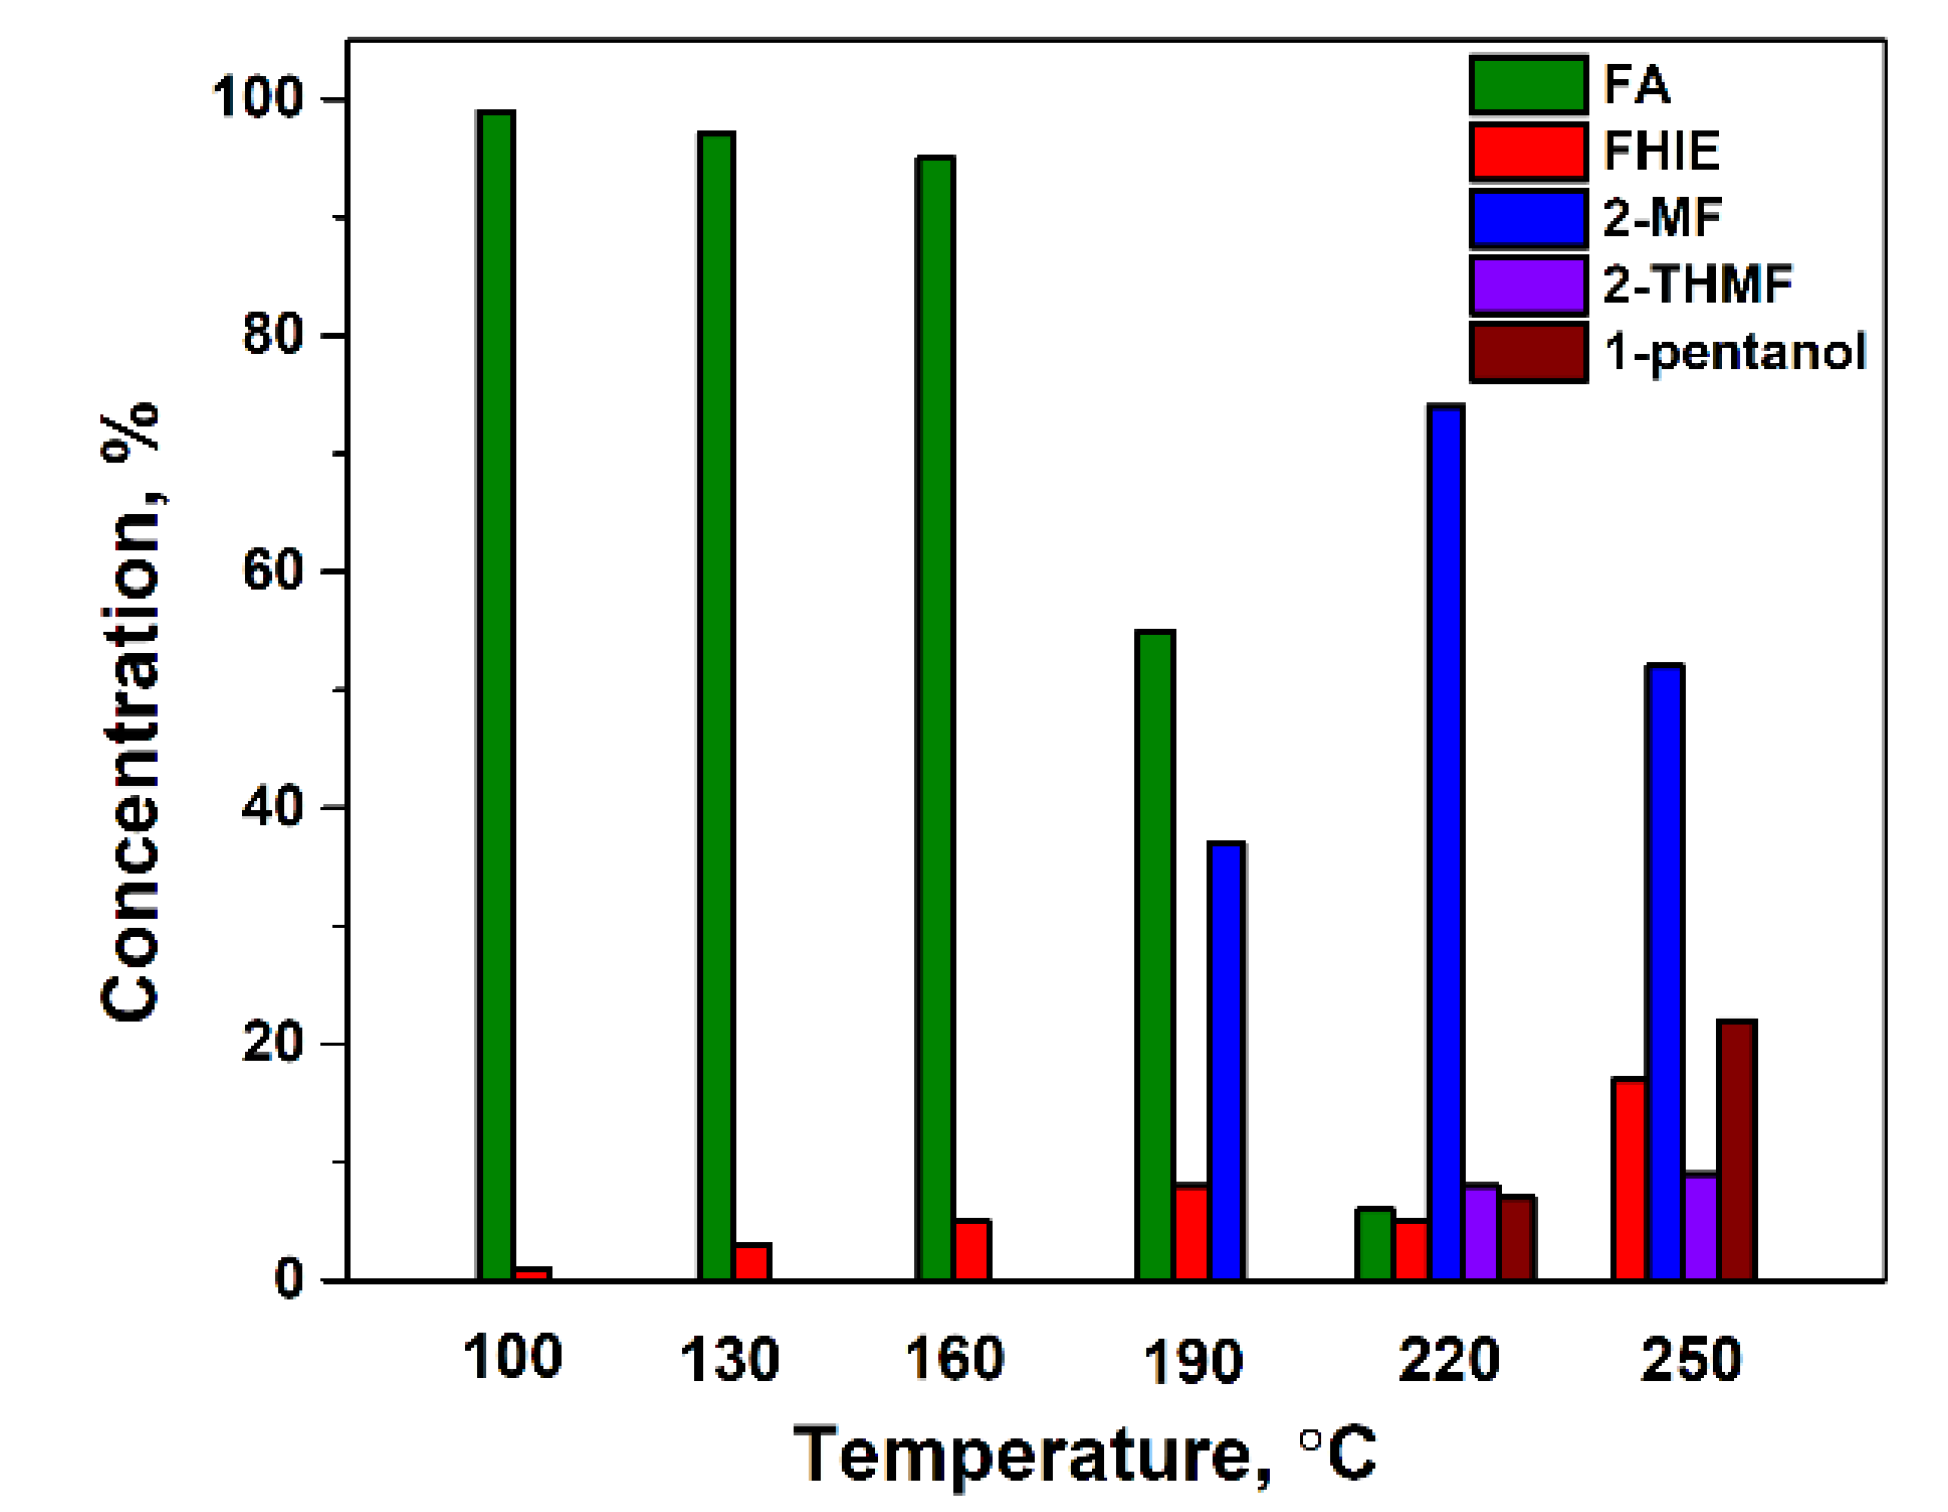
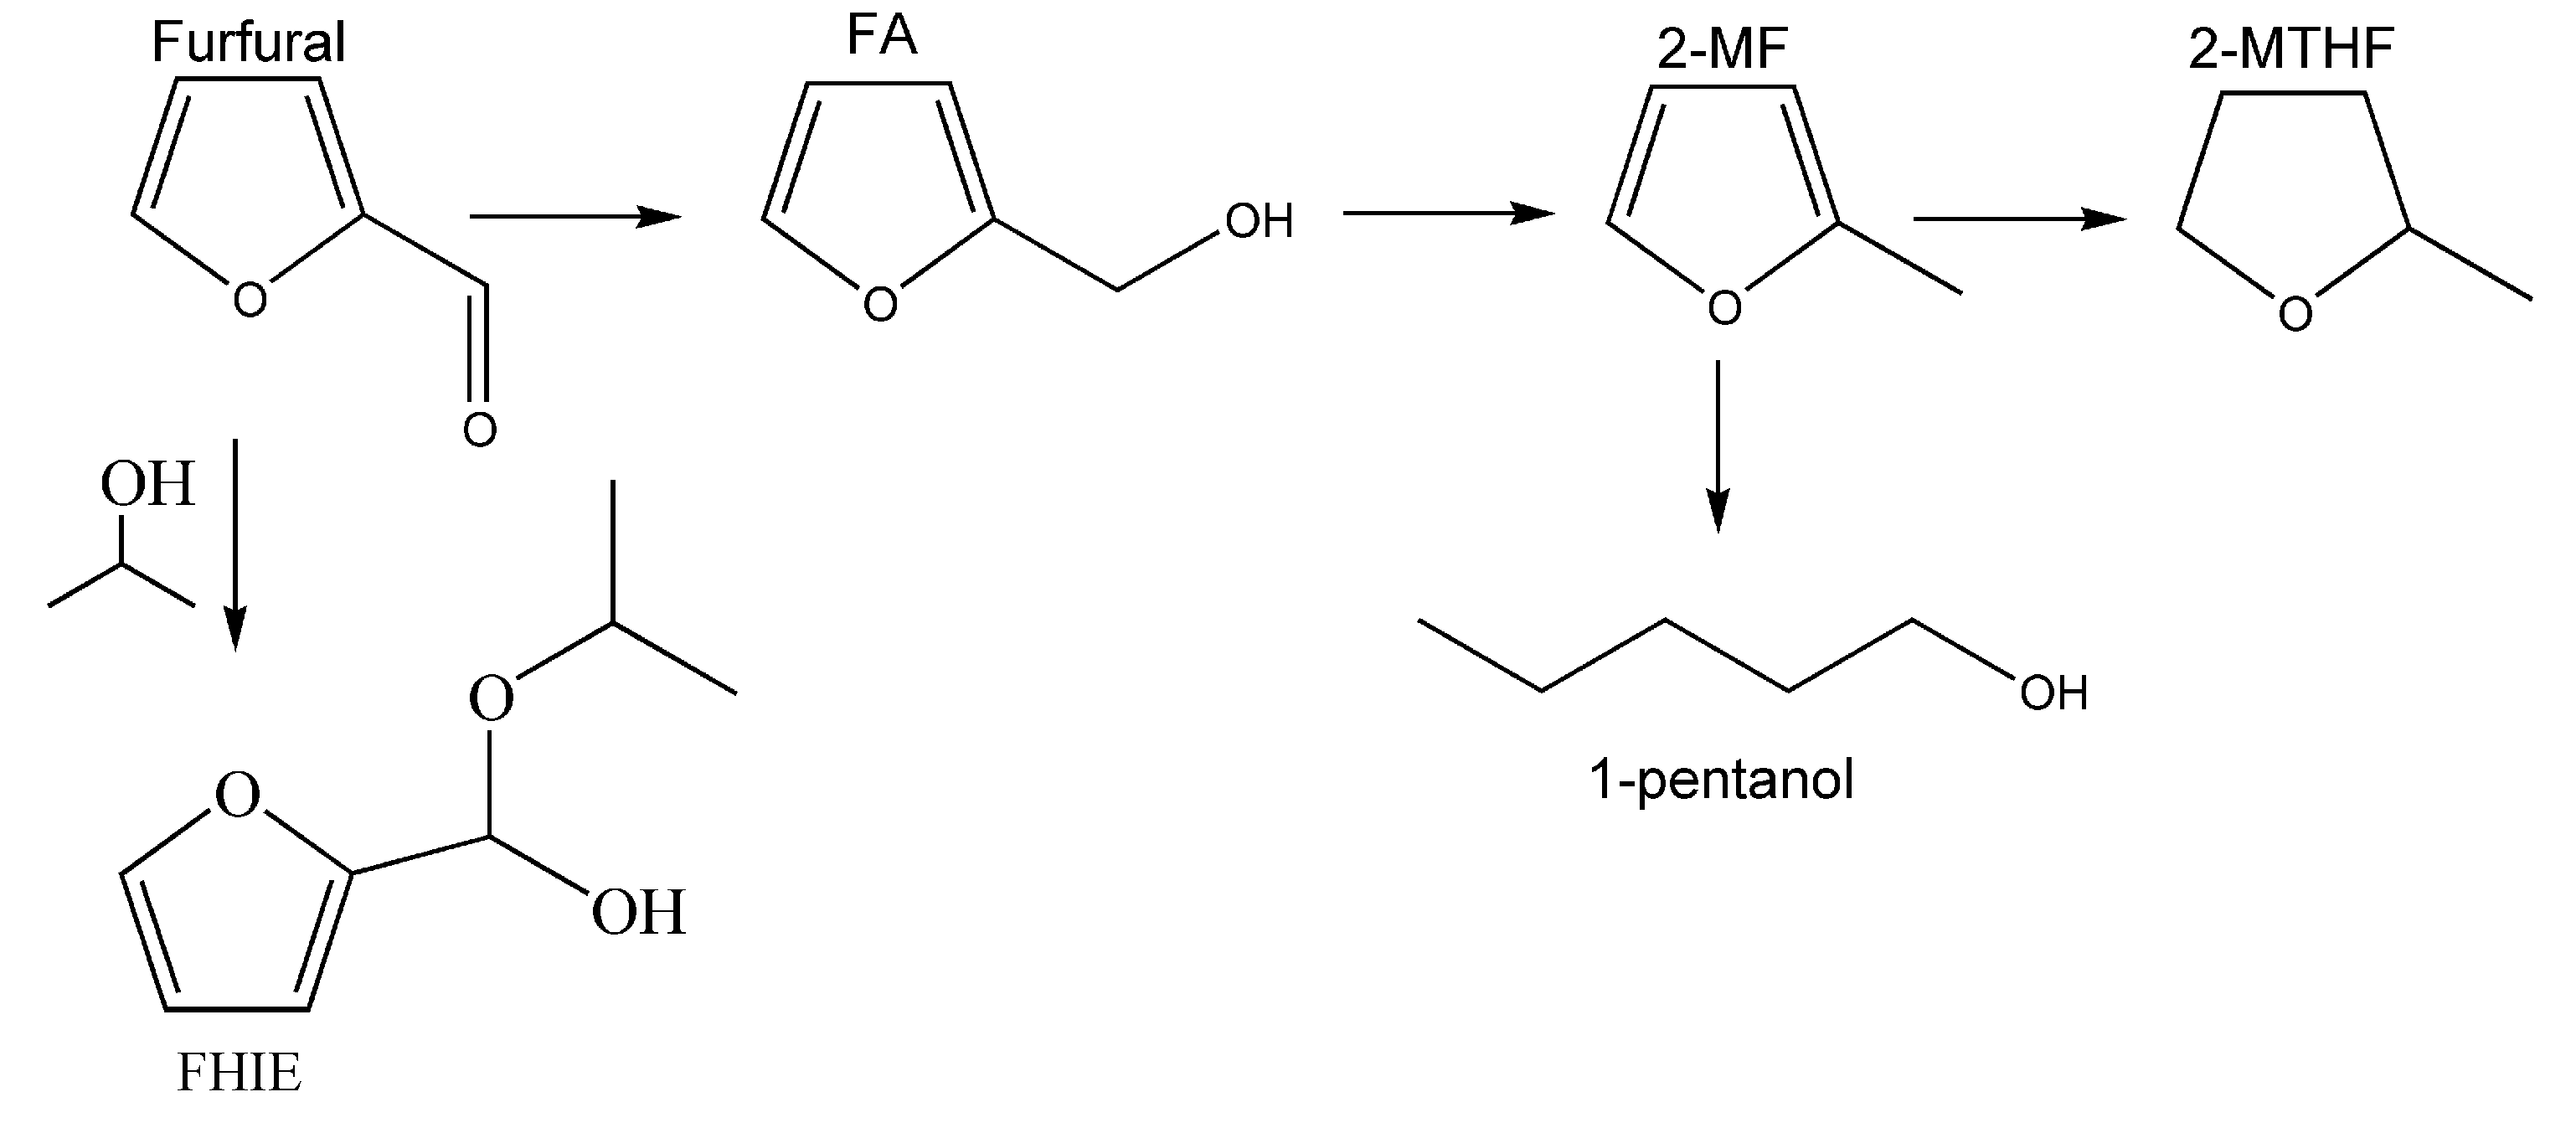
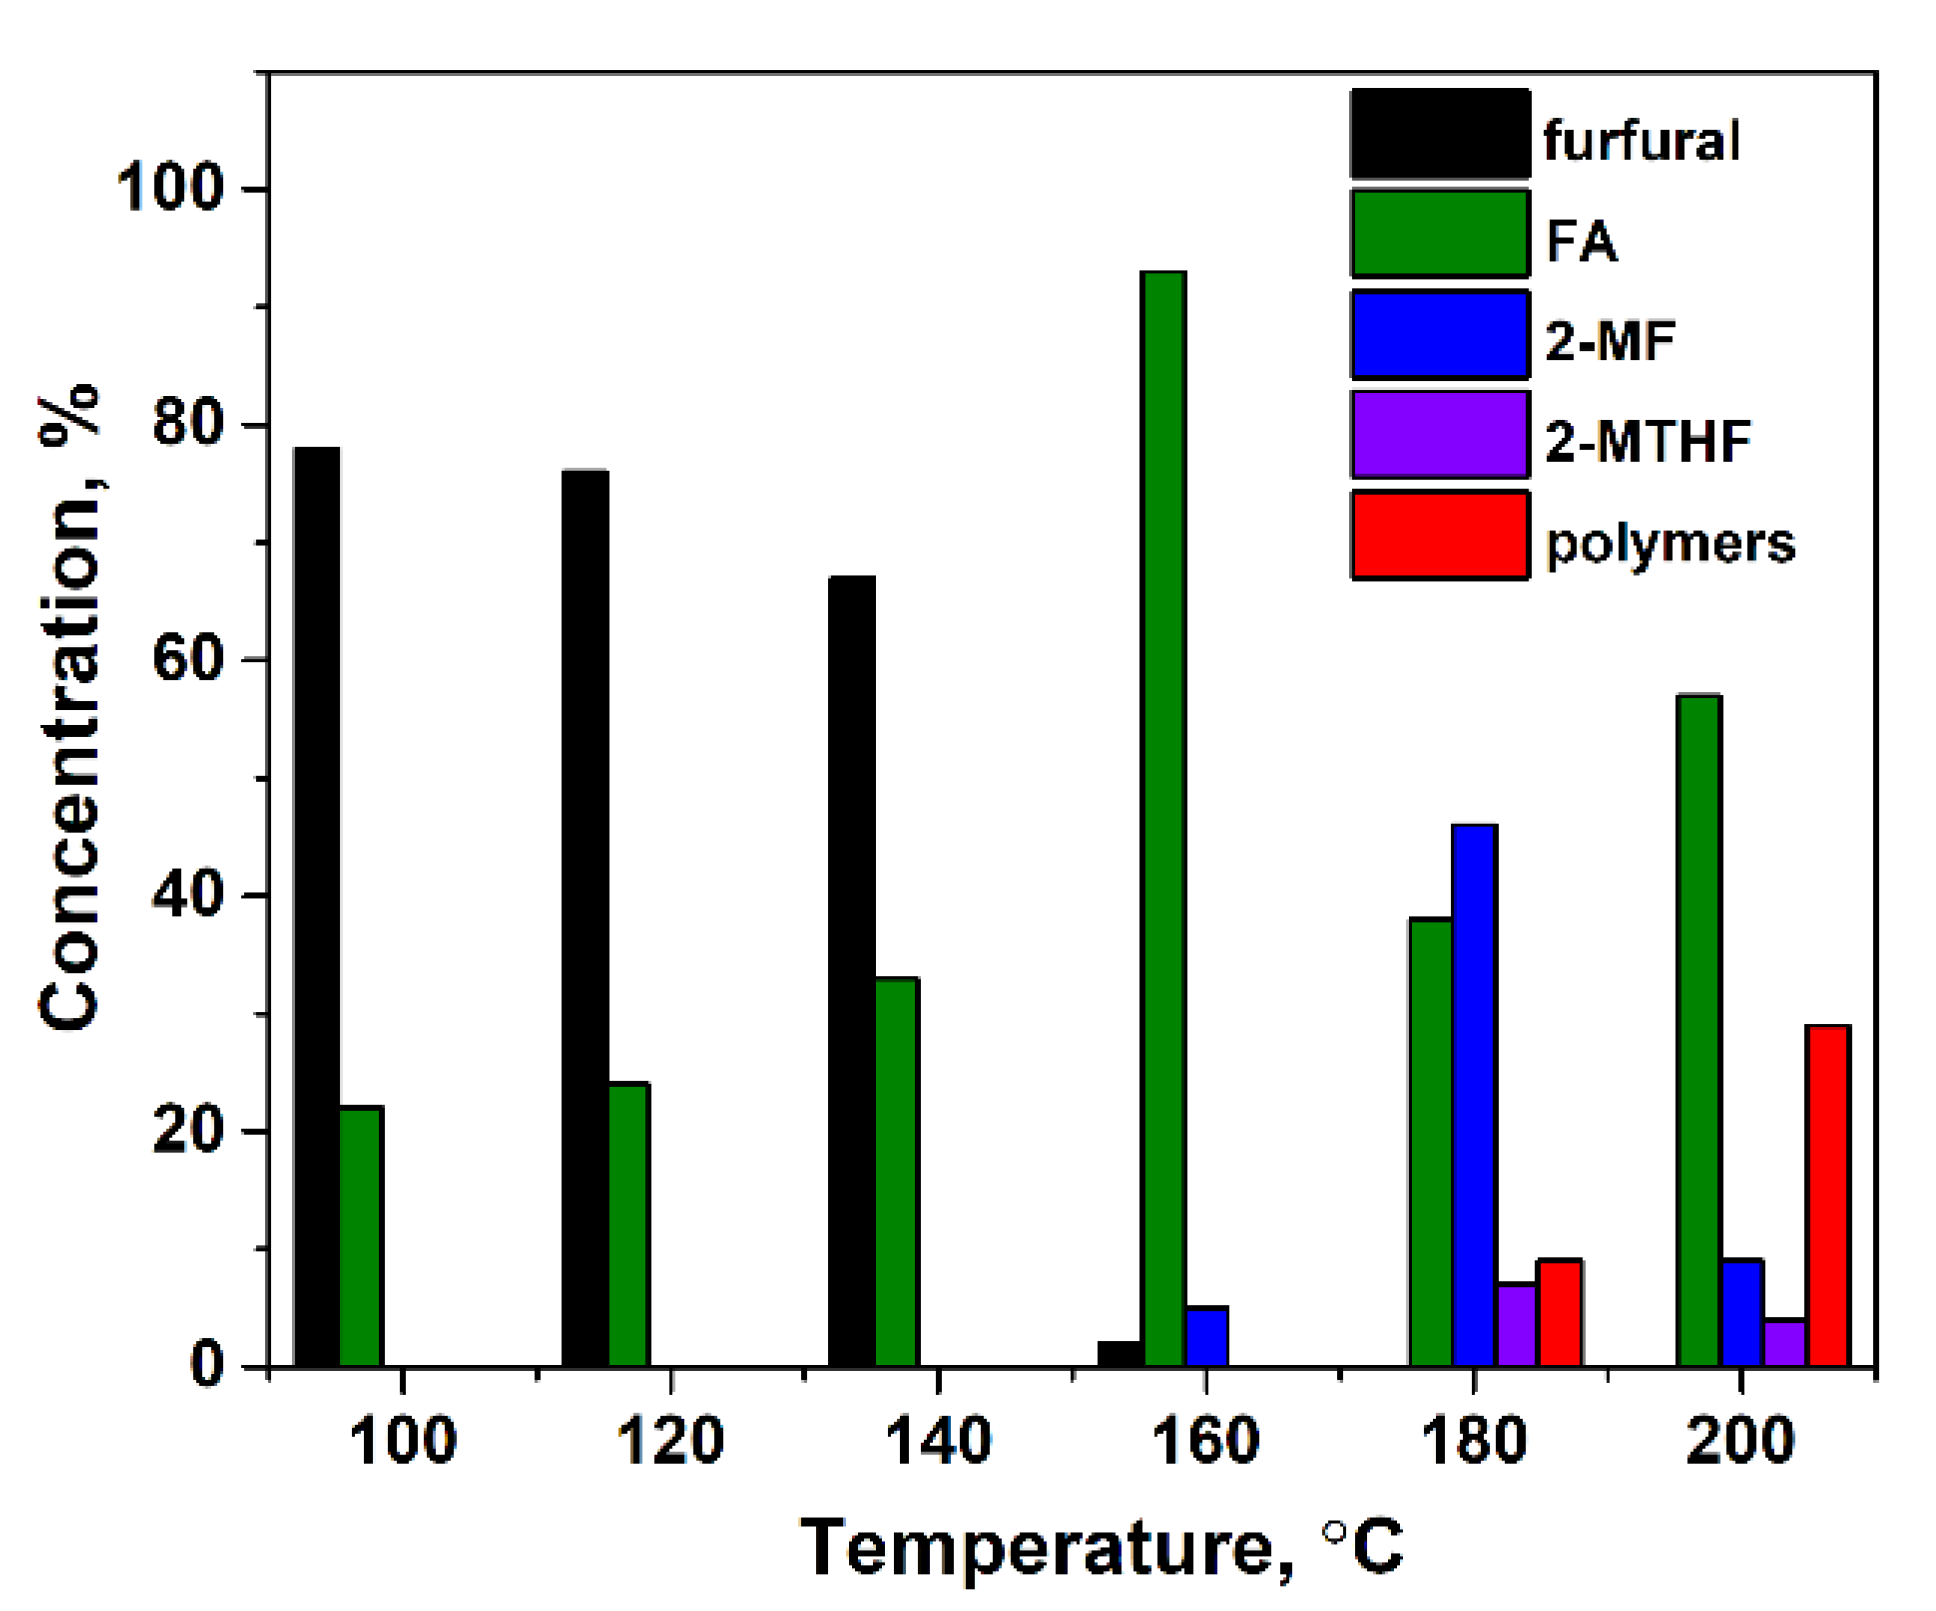
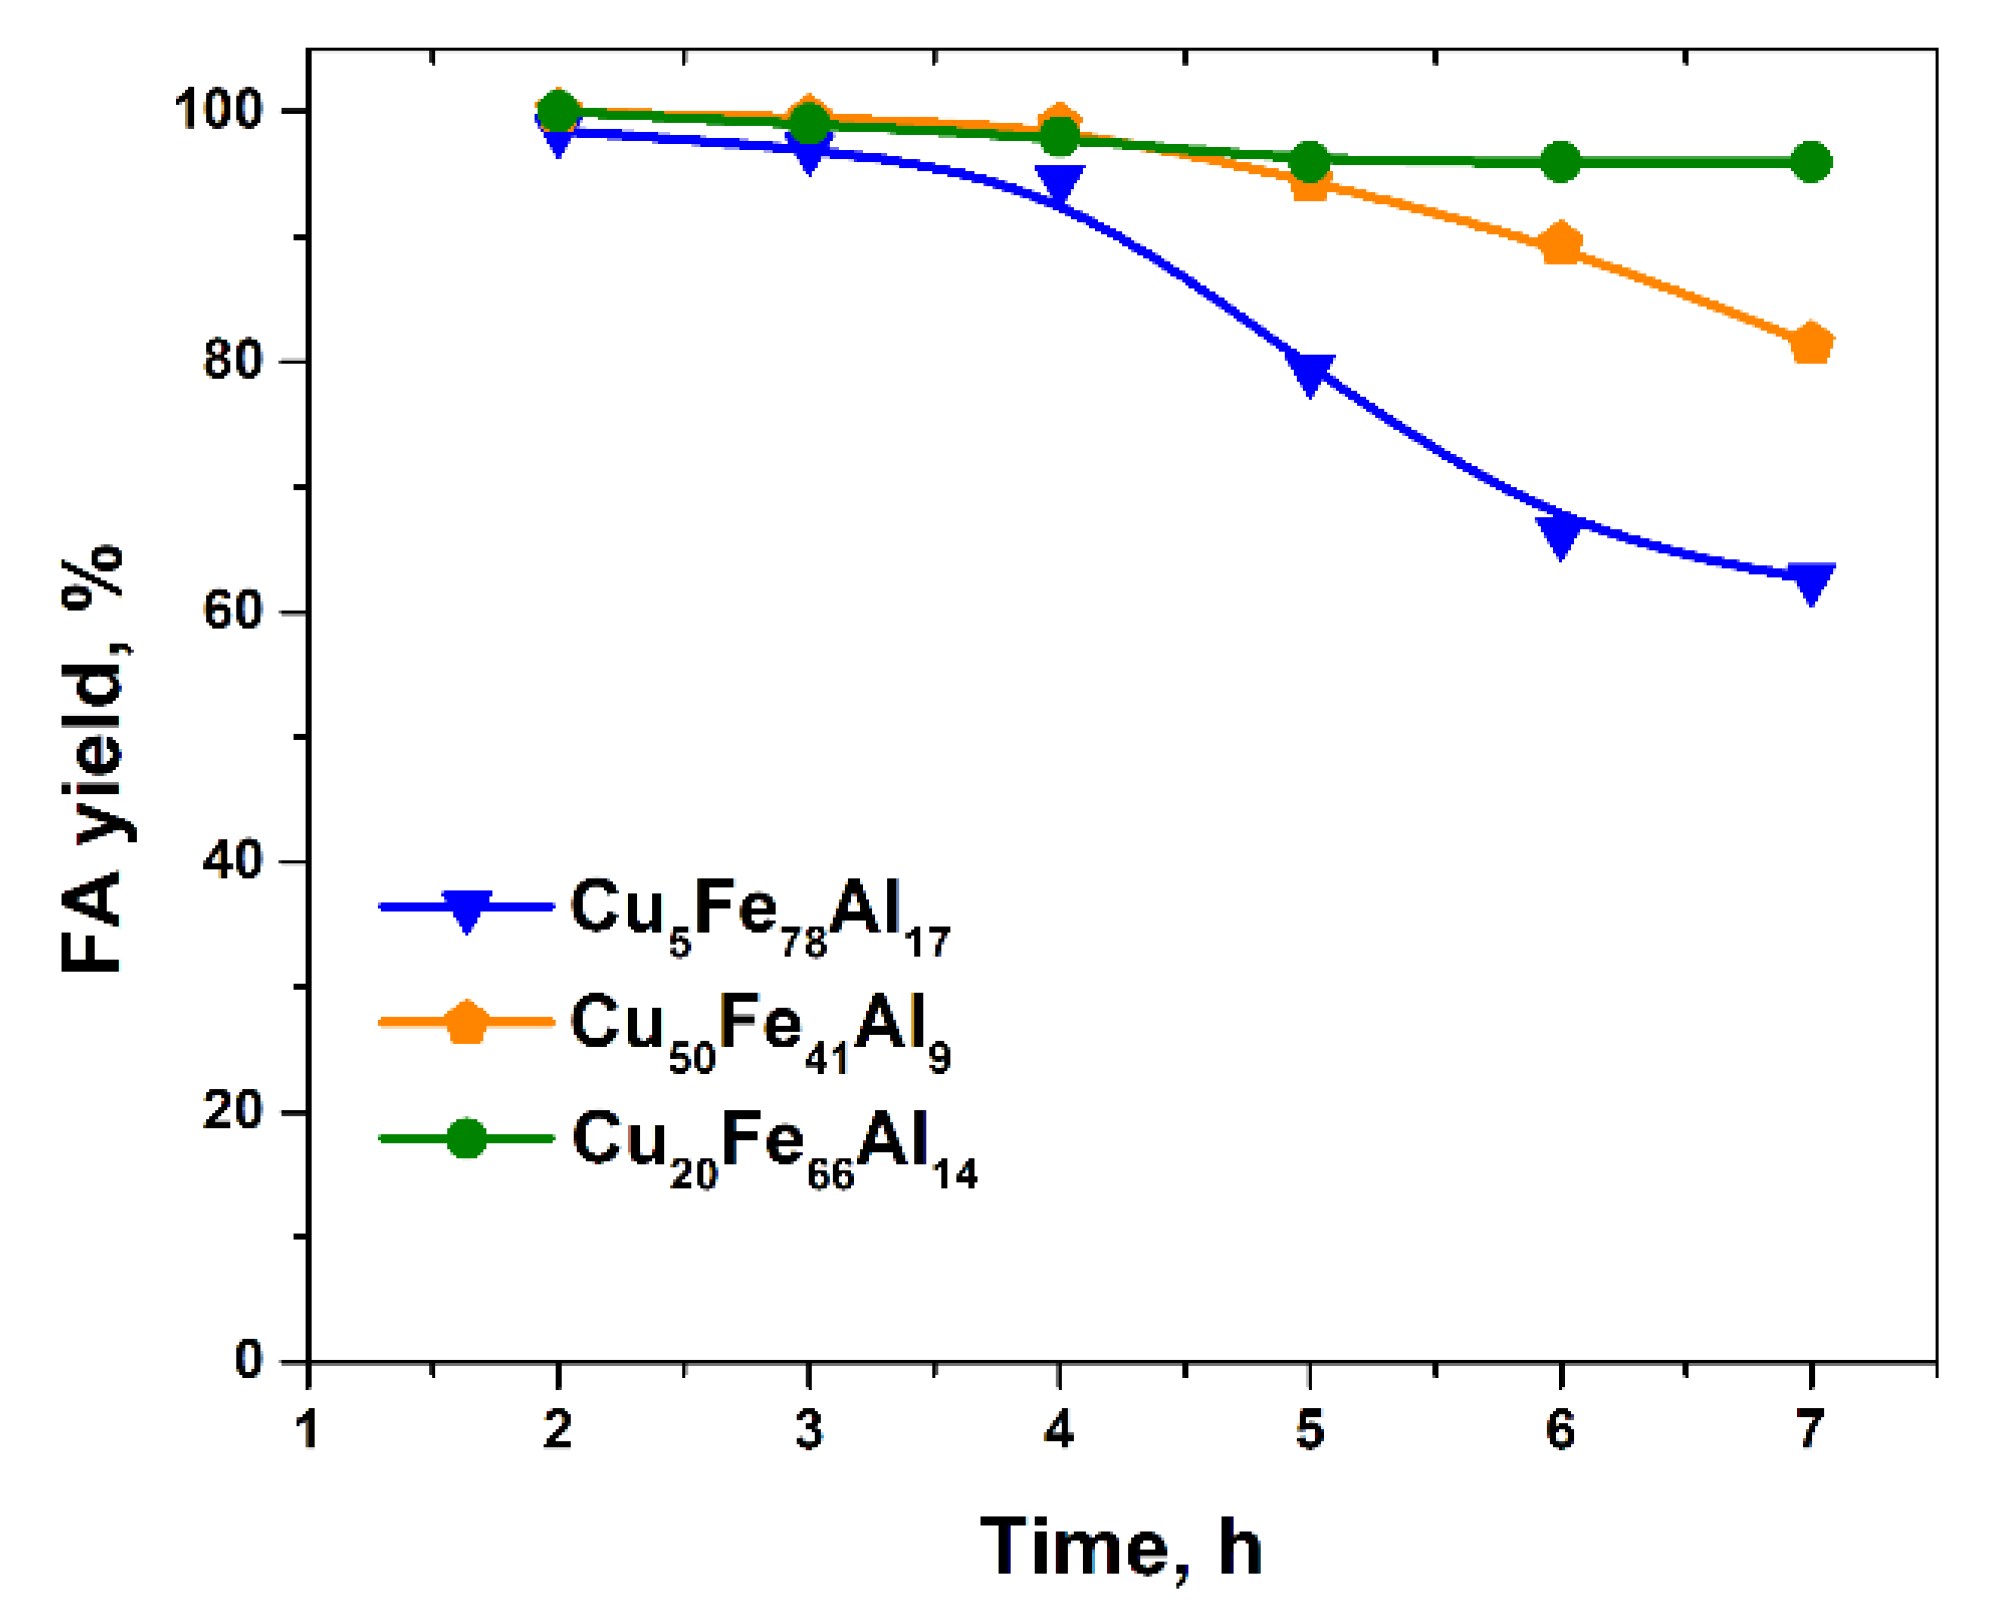
2.2. Catalytic Activity of Cu20Fe66Al14 Catalyst in a Fixed-Bed Reactor in Solvent-Free Furfural Hydrogenation

On the first step, we initially optimized the temperature regime. To study the influence of the temperature on the yield and selectivity of the target product in a fixed-bed reactor, a temperature 100–200 °C was used. It should be noted that the process of hydrogenation of furfural was carried out without any solvent.
It was shown that at a reaction temperature of 160 °C, almost a complete conversion of the feedstock (99%) occurred with the formation of FA up to 96% (Figure 7). As a secondary product, 2-MF up to 5% was identified. In the temperature range of 100–140 °С, the conversion of furfural was very low and did not exceed 30%; when the temperature was raised to 180 °С, the process shifted towards the formation of 2-MF since a relatively high temperature contributed to a more intense hydrogenation of hydroxyl group as was shown previously in a batch reactor. In addition, 2-MTHF (up to 8%) as a result of further hydrogenation of 2-MF and the self-condensation product of furfural (at a reaction temperature of 200 °C especially) with a yield of up to 30% were formed. Polymers are an undesirable product since ones reduce the activity of the catalyst by covering catalyst surface and blocking the access of the substrate to the active sites of the catalyst.
The CHNS analysis of the catalysts after the reaction showed that the carbon content increased with increasing temperature and reached 5.4 wt % at 200 °C, apparently, the formation of polymers formed from furfural molecules at this temperature covered the surface of the catalyst increasing the amount of carbon deposits. At the same time, at 160 °C the yield of FA reached 96% while the carbon content was less than 2 wt %.
Based on the data obtained, it was proposed to use a temperature of 160 °C for the maximum yield of FA. The data presented in Figure 8 demonstrate that the chosen Cu20Fe66Al14 catalyst was actually more active than catalysts with a lower or higher copper content, studies were carried out in the presence of three catalytic systems (Cu5Fe78Al17, Cu20Fe66Al14, and Cu50Fe41Al9) in a solvent-free reaction at 160 °C, hydrogen pressure 5.0 MPa, and hydrogen flow 300 mL/min, LHSV = 1 h−1. This was in agreement with results in a batch reactor and confirmed the right choice of the most active catalyst.
Thus with LHSV = 1 h−1 the Cu20Fe66Al14 catalyst leads to an FA yield of up to 96% at 100% furfural conversion for 30 h. Moreover, the value of carbon deposits on its surface did not exceed 1.7 wt %. Nevertheless, the high stability of the catalyst could be caused by low LHSV. It was shown that with a twofold increase in LHSV in the first 10 h of the process, the conversion reached 100% (Figure 9). The complete hydrogenation at the initial stage was provided due to the high amount of reduction sites on the catalyst surface. Then the process went to the stationary mode and conversion and, accordingly, the FA yield were reduced to 90% and remained at that level until the end of the lifetime test (75 h). It should be noted that other hydrogenated products or polymers were not found. Analysis of the spent catalyst by the method of the CHNS analysis showed that the carbon content did not exceed 3.1 wt %.
Thus, a copper–iron catalyst with a mass content of copper oxide of 20% was active and highly selective in the reaction of hydrogenation of furfural to FA, not only in a batch reactor but also in a fixed-bed reactor in the absence of a solvent. To study the composition of the active component, the catalysts were investigated by different methods such as X-ray diffraction (XRD), X-ray photoelectron spectroscopy (XPS), transmission electron microscopy (TEM), etc.

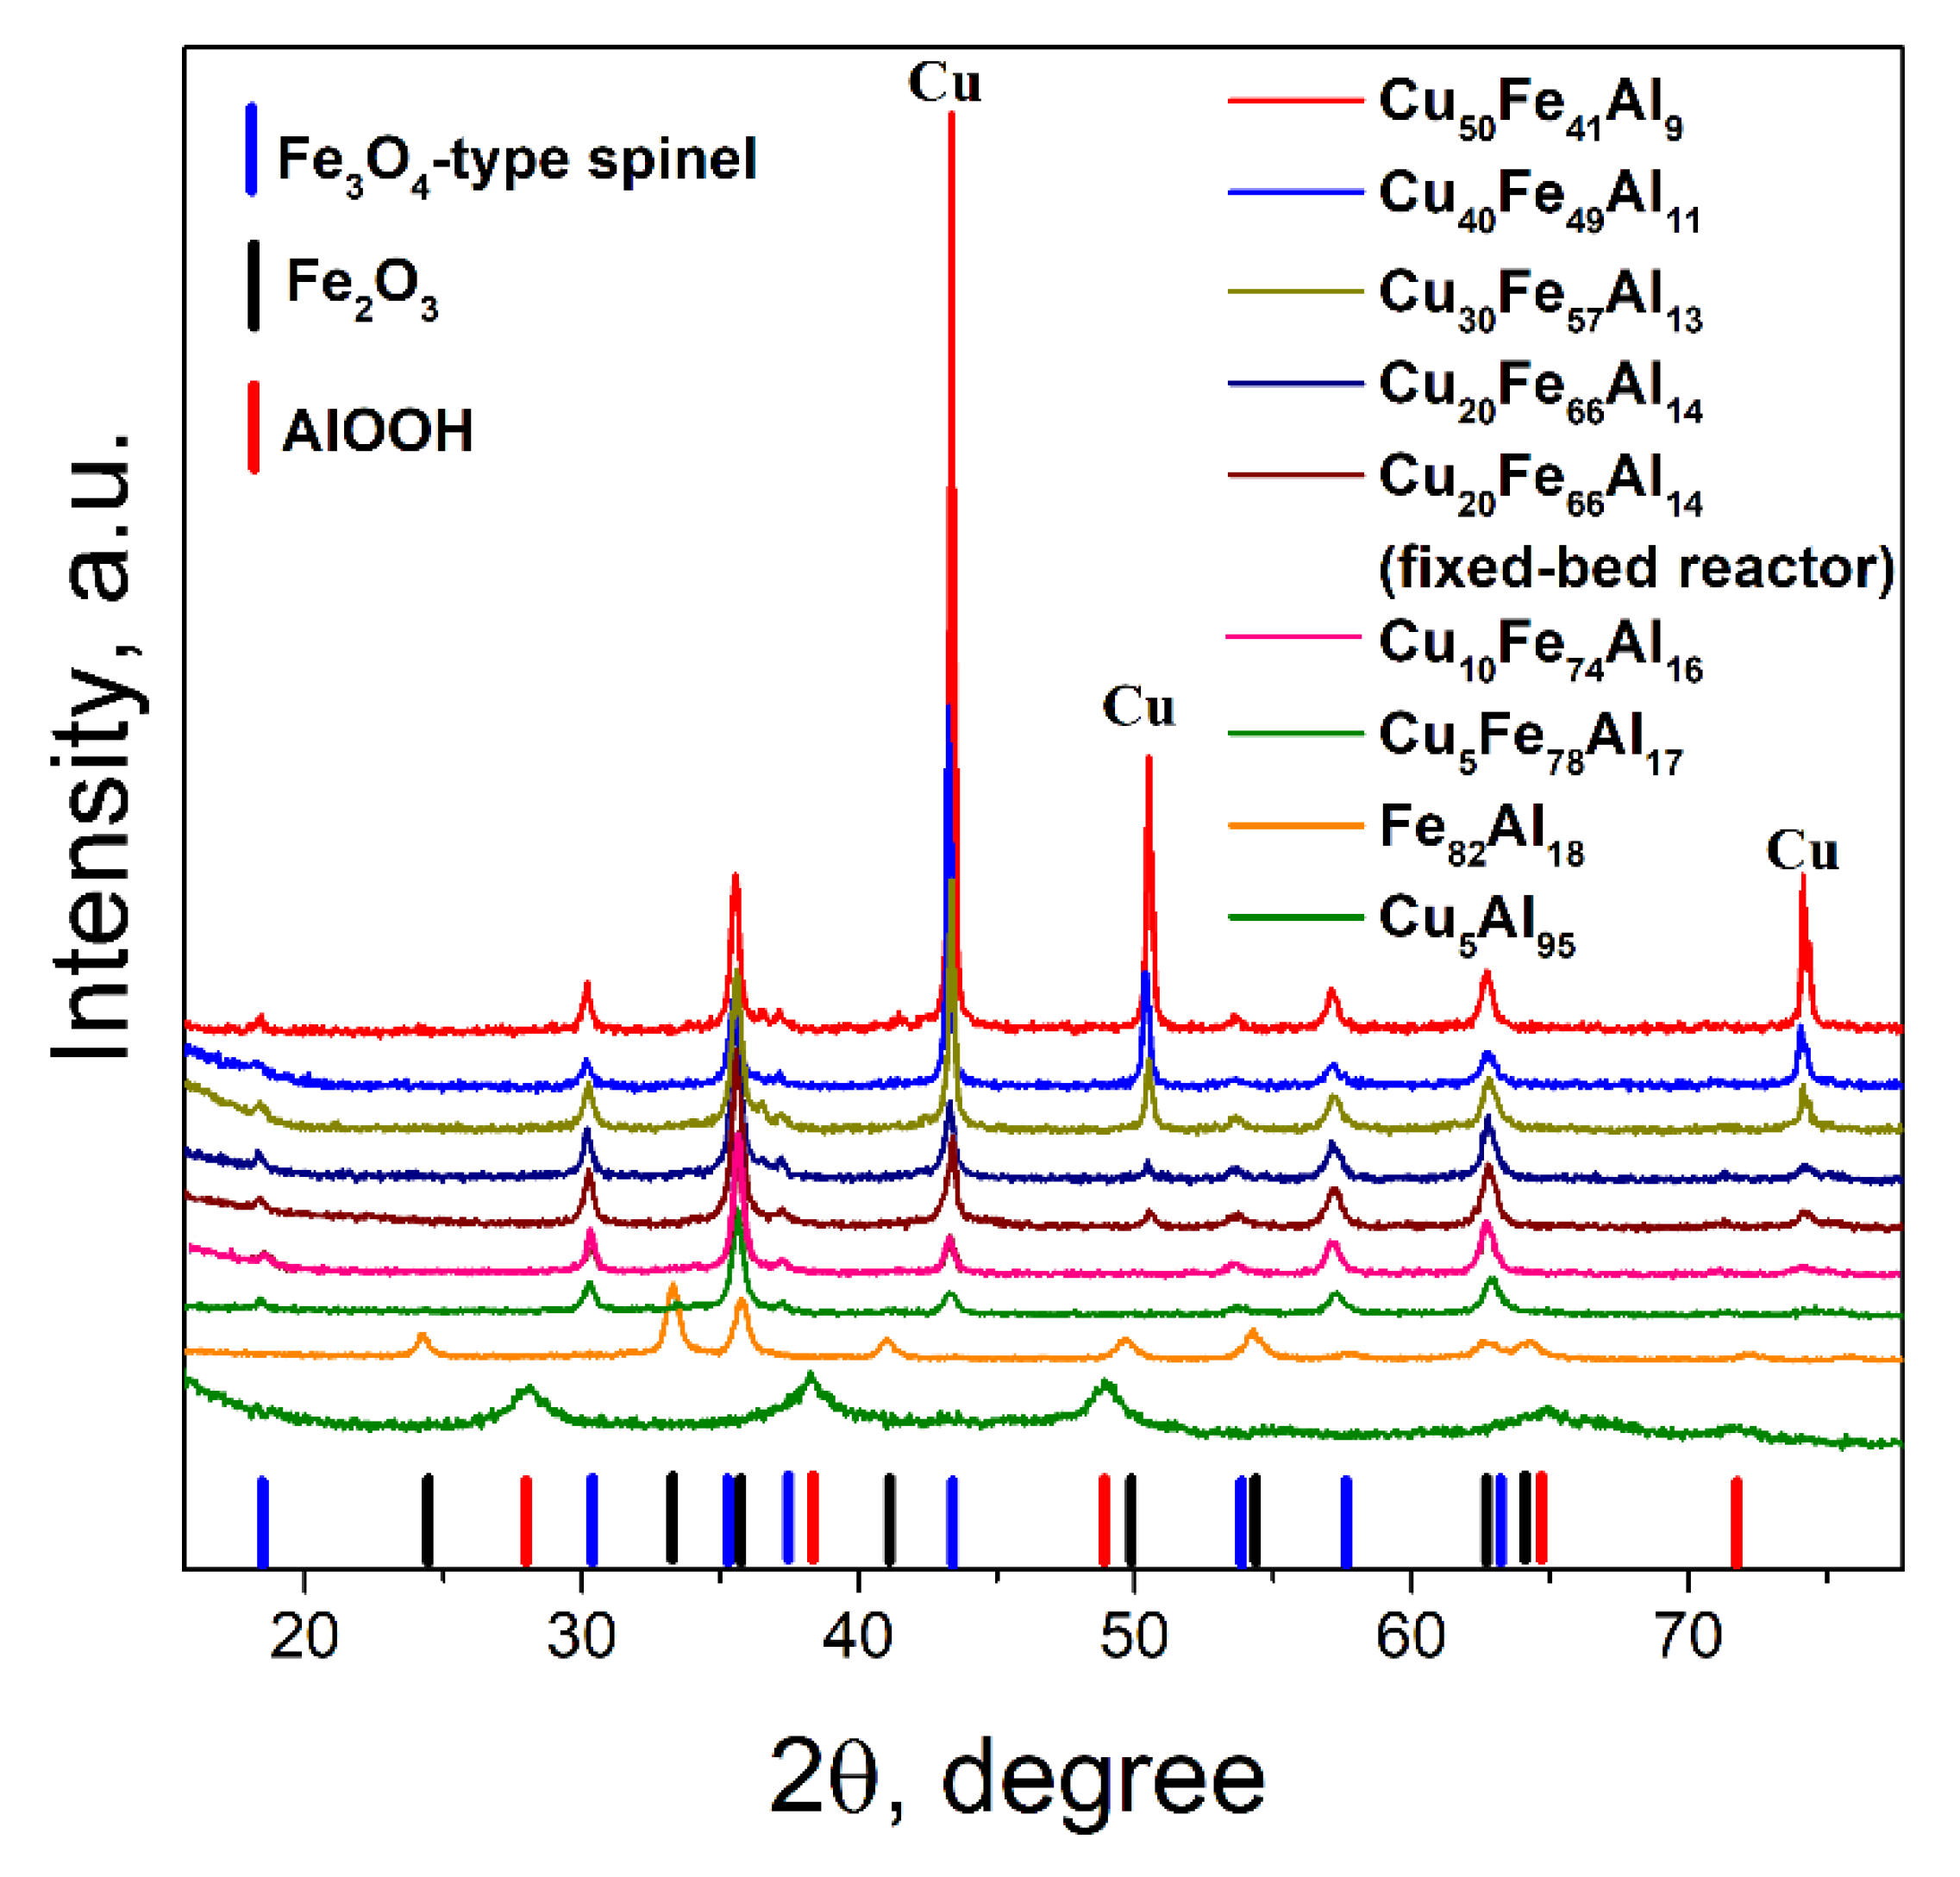
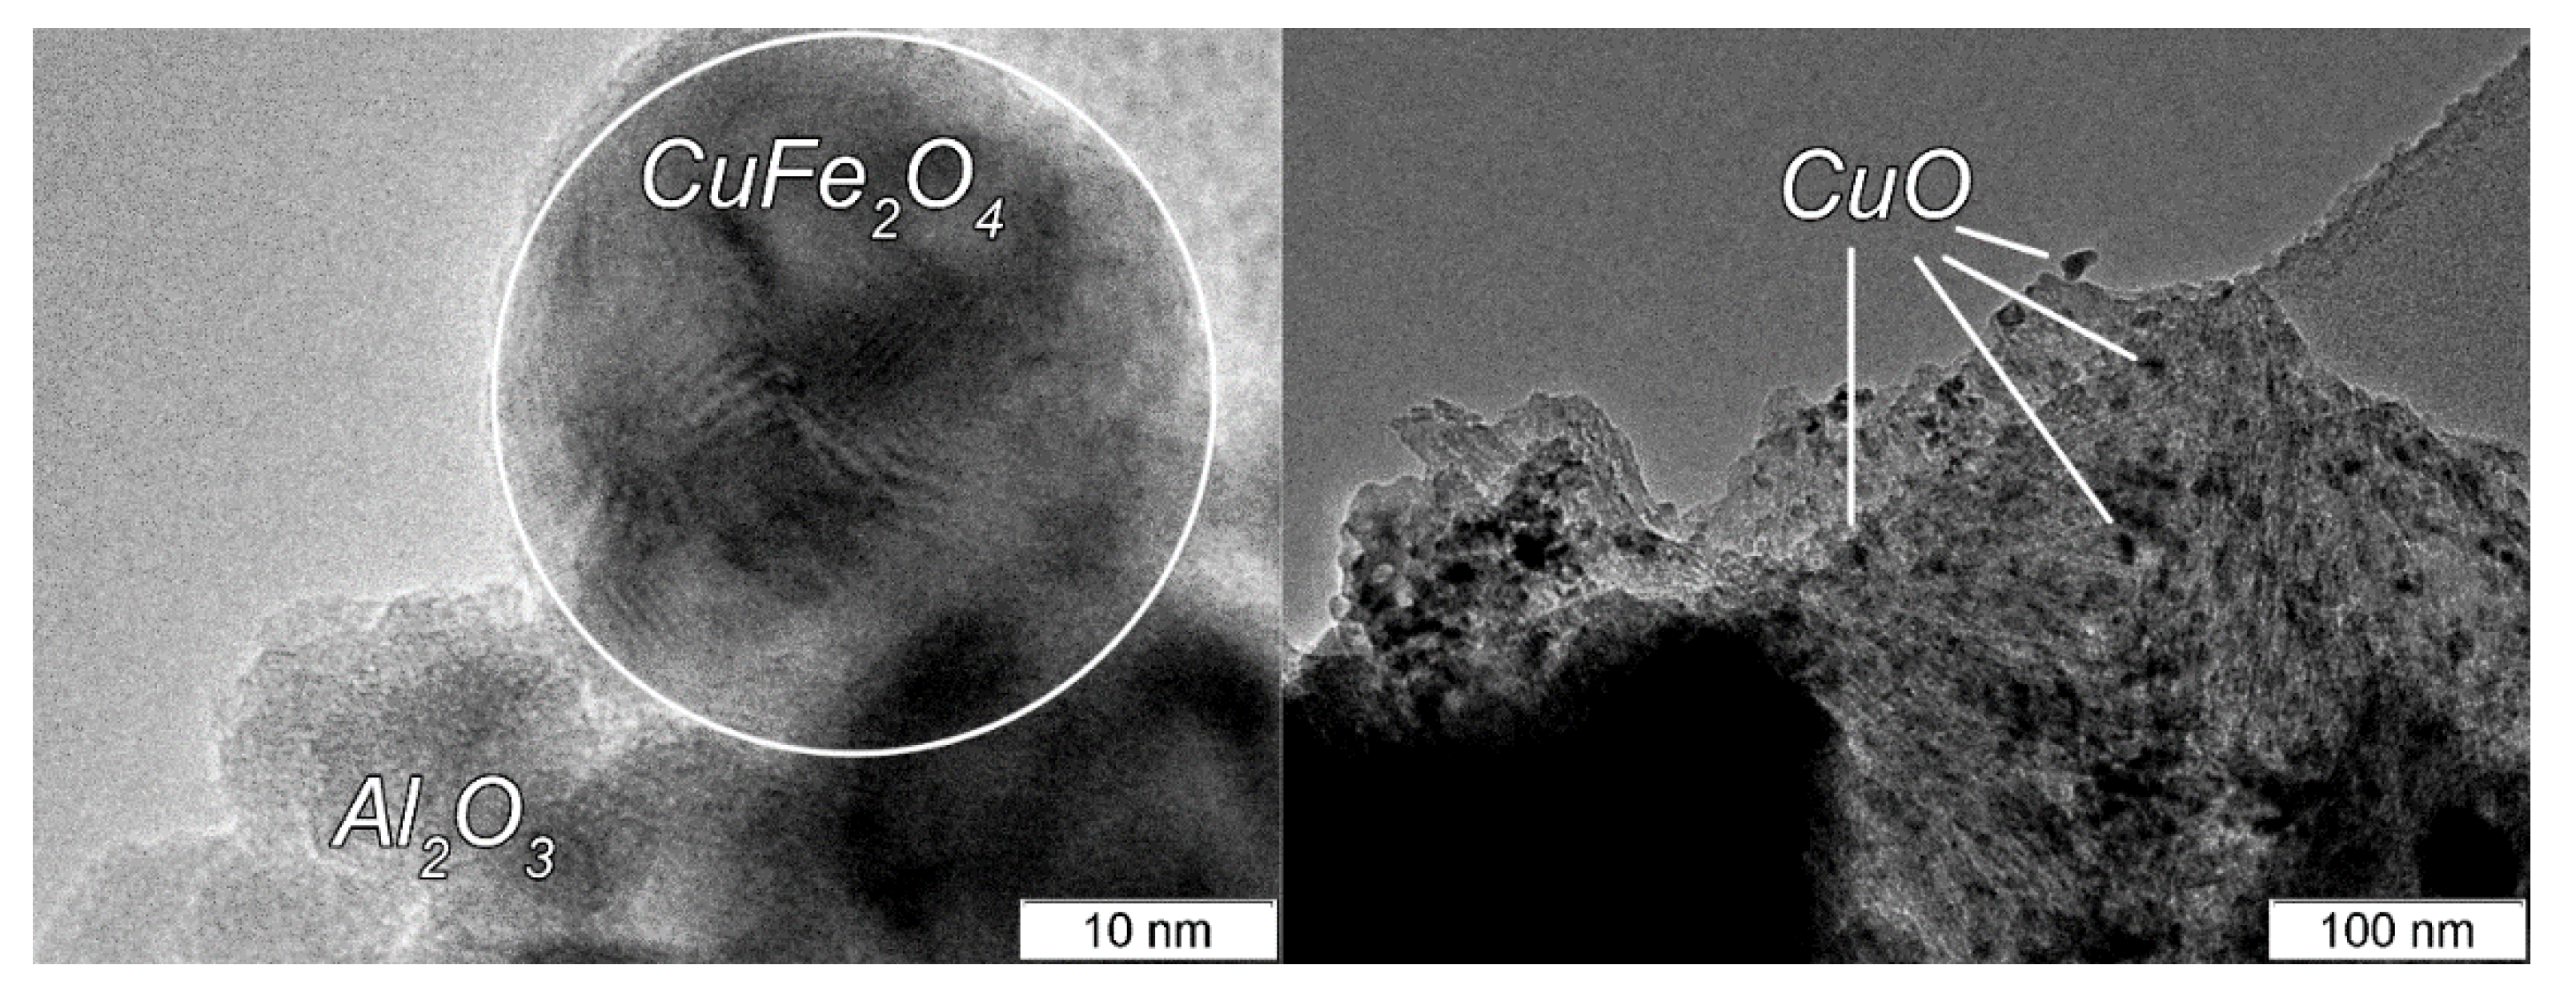
2.3. Catalysts Characterization

The XPS of the initial CuFe-containing catalysts made it possible to determine the composition of these catalysts in the surface layer (Table 3). Thus, the atomic ratio [Cu]/[Al] for all samples was approximately constant, and the content of the forms of iron with respect to aluminum decreased; apparently, with an increase in the amount of CuO introduced into the catalyst, some iron and copper compounds were formed, which contributed to a decrease in near-surface iron.
The Cu2p3/2 spectra were described by one asymmetric peak with a binding energy of Cu2p3/2 in the region of 932.7–933.7 eV and the corresponding shake-up satellites in the region of 941–944 eV (Figure 10). The shape of the spectrum and the presence and shake-up of satellites corresponded to copper oxide CuO. In the spectra of catalysts with a copper oxide content from 10 to 50 wt %, an additional peak was also observed in the region of 935.4 eV, which corresponds to copper aluminates. In the literature [33], Cu2p3/2 binding energies are given for metallic copper in the range 932.5–932.6 eV, for Cu2O the binding energy is in the same range as for the metallic state of copper; therefore, the Auger parameter must be calculated to determine the state of copper. The binding energy of Cu2p3/2 of copper in the Cu2+ state in the structure of CuO oxide was in a wider range of 933.8–934.1 eV. It should be noted that with an increase in the content of CuO there was a decrease in its amount on the catalyst surface (Table 3) due to the formation of CuAl(Fe)Ox.
The Fe2p spectra of the studied catalysts were represented by the Fe2p3/2–Fe2p1/2 doublet, the integral intensities of the components of which were 2:1. To determine the state of Fe, both the position of the Fe2p3/2 mainline and the shape of the Fe2p spectrum were used. The position and intensity of the “shake-up” line of satellites depend on the chemical state of iron. In the case of the studied catalysts, the spectra of Fe2p3/2 were peaks with binding energy in the region of 711.6–712.2 eV, and shake-up satellites were observed. According to published data, iron in the composition of FeO, Fe3O4, and Fe2O3 oxides is characterized by Fe2p3/2 binding energies in the ranges 709.5–710.2, 710.1–710.6, and 710.7–711.2 eV, respectively [34], while the “shake-up” satellites were 5.7, 8.5, and 8.8 eV away from the main peak Fe2p3/2. The great importance of the binding energy and the presence of “shake-up” satellites suggest that iron was in the Fe3+ state in these catalysts.
In the spectra of Al2p catalysts, a narrow symmetric peak was observed in the region of 74.5 eV, related to Al3+ in the composition of the Al2O3 support. However, the differences between Al3+ in the oxide and spinel structure according to XPS data were insignificant. Therefore, aluminum could also be included in the spinel Cu(FeAl)Ox structure.
To determine the phase composition of the studied spent catalysts, we used the XRD method, which showed that the sample Fe82Al18 contained the hematite Fe2O3 whereas Cu5Al95 was presented by aluminum metahydroxide AlOOH (Figure 11). In both cases, the samples contained the phases based on the component with high loading.
The phase composition of copper-iron catalysts with a copper oxide content of 5 and 10 wt % was represented by magnetite Fe3O4 (Table 4). No other phases were found in these samples either due to the presence of X-ray amorphous phases, which could not be determined by XRD. With a further increase in the content of copper oxide, the phase composition of the catalysts changes and represents reduced copper, as well as Fe3O4-type spinels (for example, copper ferrite CuFe2O4 of mixed spinel Cu(FeAl)Ox). It is worth noting that the smallest crystallite size of reduced copper was inherent in the sample with a copper oxide content of 20 wt %, with a further increase in the content of copper oxide, this parameter increased significantly (Table 4). Apparently, this fact determined the highest activity of this catalytic sample. Thus, we could conclude that the active component of this catalyst was highly dispersed copper, which was formed when the content of copper oxide was 20 wt % in the presence of the Fe3O4-type spinel structure.
It is worth noting that, according to the XRD data, a catalyst Cu20Fe66Al14 had the same composition both after experiments in an autoclave and in a fixed-bed reactor. Cu20Fe66Al14 consists of the metallic copper (about 8%) and 92% of spinels with the structure of Fe3O4. It could be concluded that the catalyst had high stability under the reaction conditions and did not change the composition of the active component even during prolonged testing in a fixed-bed reactor in solvent-free furfural hydrogenation.
Fresh sample reduced at 250 °C and the spent Cu20Fe66Al14 catalyst were additionally analyzed by the differentiating dissolution (DD) method using mineral acids (nitric and hydrofluoric acids) with different concentrations. The method was adjusted in real-time in the stoichiographic titration mode according to information on the concentration of elements during DD and kinetic curves of element dissolution. The chemical dissolution curves of the elements were transformed into stoichiograms (Figure 12). The averaged concentrations given below were calculated using several tens of design points. It was shown that the composition of the samples was represented by phases of variable composition, in which compounds with different degrees of the order were formed.
In the samples, the formation of a phase Cu0.04Fe1Al0.37 (F2) based on iron oxide with a small copper content, which dissolves under “harsh” conditions (6M HF) was observed. Presumably, on the surface of phase Cu0.04Fe1Al0.37 particles with a cationic composition Cu0.8Fe1 (F1) were found. The results of DD show that copper in the composition of the catalysts was in several forms: About 7–9% in the form of CuO or Cu and the copper in the composition of the binary and ternary compounds Cu-Fe and Cu-Fe-Al, respectively.
To study the active component formation the in situ XRD method was used. It allows tracking the changing in the phase composition in the most active catalyst in the hydrogenation of furfural to FA Cu20Fe66Al14 during reduction at different temperature (Figure 13).
Data obtained using this method showed that at room temperature the Cu20Fe66Al14 sample was a mixture of Fe2O3 (85%) and CuO (15%) oxides. In the temperature range of 30–175 °C, no changes in the diffraction pattern were observed. At a temperature of 200 °C, intense reflections of Cu0 appeared (12%). With a further increase in temperature to 250 °C, the CuO and Fe2O3 reflections disappeared and peaks corresponding to the structure of Fe3O4-type spinel appeared. When the reduction temperature reached 450 °C, metallic iron reflections began to appear (up to 16%), while a decrease in the intensity of Fe3O4 reflexes was observed (the content decreased from 83% to 68%). At a temperature of 600 °C, the phase composition was mainly represented by Cu0 and Fe0. Since no aluminum-containing phases were detected and a decrease in the lattice parameter of Fe3O4 was noted, it could be assumed that Al and Cu were embedded in the lattice of iron oxide with the formation of the mixed spinel Cu(FeAl)Ox.
The method of transmission electron microscopy allows confirming the above data regarding the phase composition with the formation of crystallites of a small size. Thus, an analysis of the reduced at 250 °C Cu20Fe66Al14 catalyst by the TEM method showed the presence of two types of particles. The first one was CuFe2O4 agglomerates with 10–30 nm located on the Al2O3 matrix. The second one was the oxide of Cu of 2–5 nm in size (Figure 14). It could be argued that CuO was obtained after oxidation of metallic Cu covering the surface of CuFe2O4.
Additional studies of the Cu20Fe66Al14 catalyst by the x-ray absorption near edge structure (XANES) method show that fresh catalyst is represented by CuO, Fe2O3, and CuFe2O4 phases. In Figure 15 the results of approximation of the XANES spectra in the form of a linear superposition of the XANES spectra of the Cu K-edge of catalyst and standard compounds (Cu0, Cu2O, CuO, and CuFe2O4) were presented. According to this analysis, copper was in the form of two phases: CuO and CuFe2O4 with a content of 70% and 30%, respectively. A significant part of copper was reduced to the metallic state (65%) and Cu1+ (25%), while 10% of copper remained in the CuO state when reduction at 250 °C. The spectra of CuFe2O4 in the reduced catalyst were not observed. It might be caused by the fact that CuFe2O4 could be the platform for the formation of the high active Cu0 particles. The observed data indicate that the particles Cu1+ and CuO were in the dispersed state due to these particles that were not detected by XRD while the presence of CuO was also confirmed by XPS.
Thus, the combination of physicochemical methods allowed us to make an assumption about the nature of the active sites of the catalyst and conclude that the active component of this catalyst was highly dispersed metallic copper (2–5 nm), which was formed when the content of copper oxide was higher than 20 wt % in the presence of Fe3O4-type spinel structure. Spinel could be formed during incorporation of CuO and Al2O3 in the structure of Fe3O4, leading to the formation of mixed spinel Cu(FeAl)Ox.

3. Materials and Methods

3.1. Catalyst Preparation

Cu-containing catalysts were prepared by fusion metal salts. Calculated weights of copper (II) nitrate (Cu(NO3)3·3H2O (“Reakhim”, Staraya Kupavna, Russia)); iron (III) nitrate (Fe(NO3)3·9H2O (“Soyuzkhimprom”, Novosibirsk, Russia)), and aluminum nitrate (Al(NO3)3·9H2O (“Reakhim”, Staraya Kupavna, Russia)) were mixed in a quartz cup and gradually heated to 310 °C. The obtaining melt of crystalline hydrates was evaporated at 310 °C until complete water removal. The dry residue was calcined at 450 °C for 1 h. Obtained catalysts composition is presented in Table 2. For convenience the catalysts were designated as follows: Fe82Al18, Cu5Fe78Al17, Cu10Fe74Al16, Cu20Fe66Al14, Cu30Fe57Al13, Cu40Fe49Al11, and Cu50Fe41Al10; subscript indicates metal oxide content (wt %) in the sample.

3.2. Catalytic Activity Tests

Furfural hydrogenation was carried out in a 300 mL batch reactor (Autoclave Engineers, Erie, PA, USA), which was equipped with a mechanical stirrer with a magnetic drive. Before the reaction, a catalyst (5 g, fraction ˂0.071 mm) was placed in the reactor and activated in situ under flow conditions in an H2 stream with a flow rate of 100 mL/min at a pressure of 0.1 MPa and at 250 °C for 1 h. After activation, the reactor was cooled to room temperature and a solution of furfural in isopropyl alcohol was added to the reactor (furfural:alcohol = 4.2:55.8 by volume; total volume 60 mL). The hydrogenation process was carried out at 100–250 °C and H2 pressure 6.0 MPa (the feed rate of hydrogen was 100 mL/min), the mixing was 1800 rpm. Samples were done at regular intervals through the sampler. The reaction time was 3.5 h. At the end of this time, the stirring was turned off, the reactor was cooled to room temperature. The start and end time of the reaction corresponded to the moment when the stirring was turned on and off.
Hydrogenation of furfural in a flow through mode was performed using a 10 cm3 reactor, in which a catalyst weighing 2.6 g (fraction size 0.25–0.50 mm) was placed and activated in a stream of hydrogen (300 mL/min) at 250 °C for 1 h. At the end of the reduction, the reactor was cooled, after which the reaction parameters were set: Reaction temperature (100–160 °C), hydrogen pressure 5.0 MPa, and furfural feed rate 3–6 mL/h using a liquid pump (“Kvarta”, Novosibirsk, Russia). Samples were done every hour through the sampler. The reaction time ranged from 6 to 72 h.

3.3. Products Analysis

Quantitative analysis of liquid furfural hydrogenation reaction products was carried out on an Agilent Technologies 7820A chromatograph (Santa Clara, CA, USA) equipped with a flame ionization detector using CM-Wax columns (polyethylene glycol phase, 30 m × 0.25 mm, phase thickness 0.25 μm) (“CXM”, Novosibirsk, Russia) and HP-5 (phase 5%-phenyl methylpolysiloxane, 30 m × 0.32 mm, phase thickness 0.25 µm) (Zebron, CA, USA). The temperature program of the columns: 4 min-constant temperature 50 °С, then heating at a rate of 8 °С/min up to 62 °С, 12 °С/min up to 146 °С, 20 °С/min up to 190 °С, and 10 °С/min to 230 °С, analysis time was 19.2 min. The sample was injected in an amount of 2.0 μL with a liquid syringe. The accuracy of the chromatographic analysis was 5%. The components of the reaction mixture were identified by retention times on the chromatogram, which were determined separately for each component during the calibration process, and the mole fractions of the reagent and the reaction products were calculated using the peak areas of the components of the reaction mixture.
The conversion value of furfural was determined as the ratio of the change in the concentration of the initial furfural to its initial concentration:
X F = C 0 , F C t , F C 0 , F · 100 % ,
where XF is the furfural conversion, and C0,F and Ct,F is the initial and current (at time t) furfural concentration.
The selectivity of the formation of FA was calculated as the ratio of the current FA concentration to the concentration of unreacted furfural:
S FA = C t , FA ( C 0 , F C t , F ) · 100 % ,
where SFA is the selectivity of furfuryl alcohol, and Ct,FA is the concentration of FA at time t.
The k0 was obtained by the approximation of experimental data on the change in furfural concentration by the next function:
C t , F = C 0 , F · e k 0 · t ,
where k0 is the effective rate constant for furfural hydrogenation, and t is the time.
Turn over frequencies (TOFs) was calculated:
TOF = k 0 · n F 0 N AS ,
where n F 0   is the initial amount of furfural in the reaction (mol), and N AS - is the number of active sites of the catalyst in the reaction according to CO chemisorption (mol).

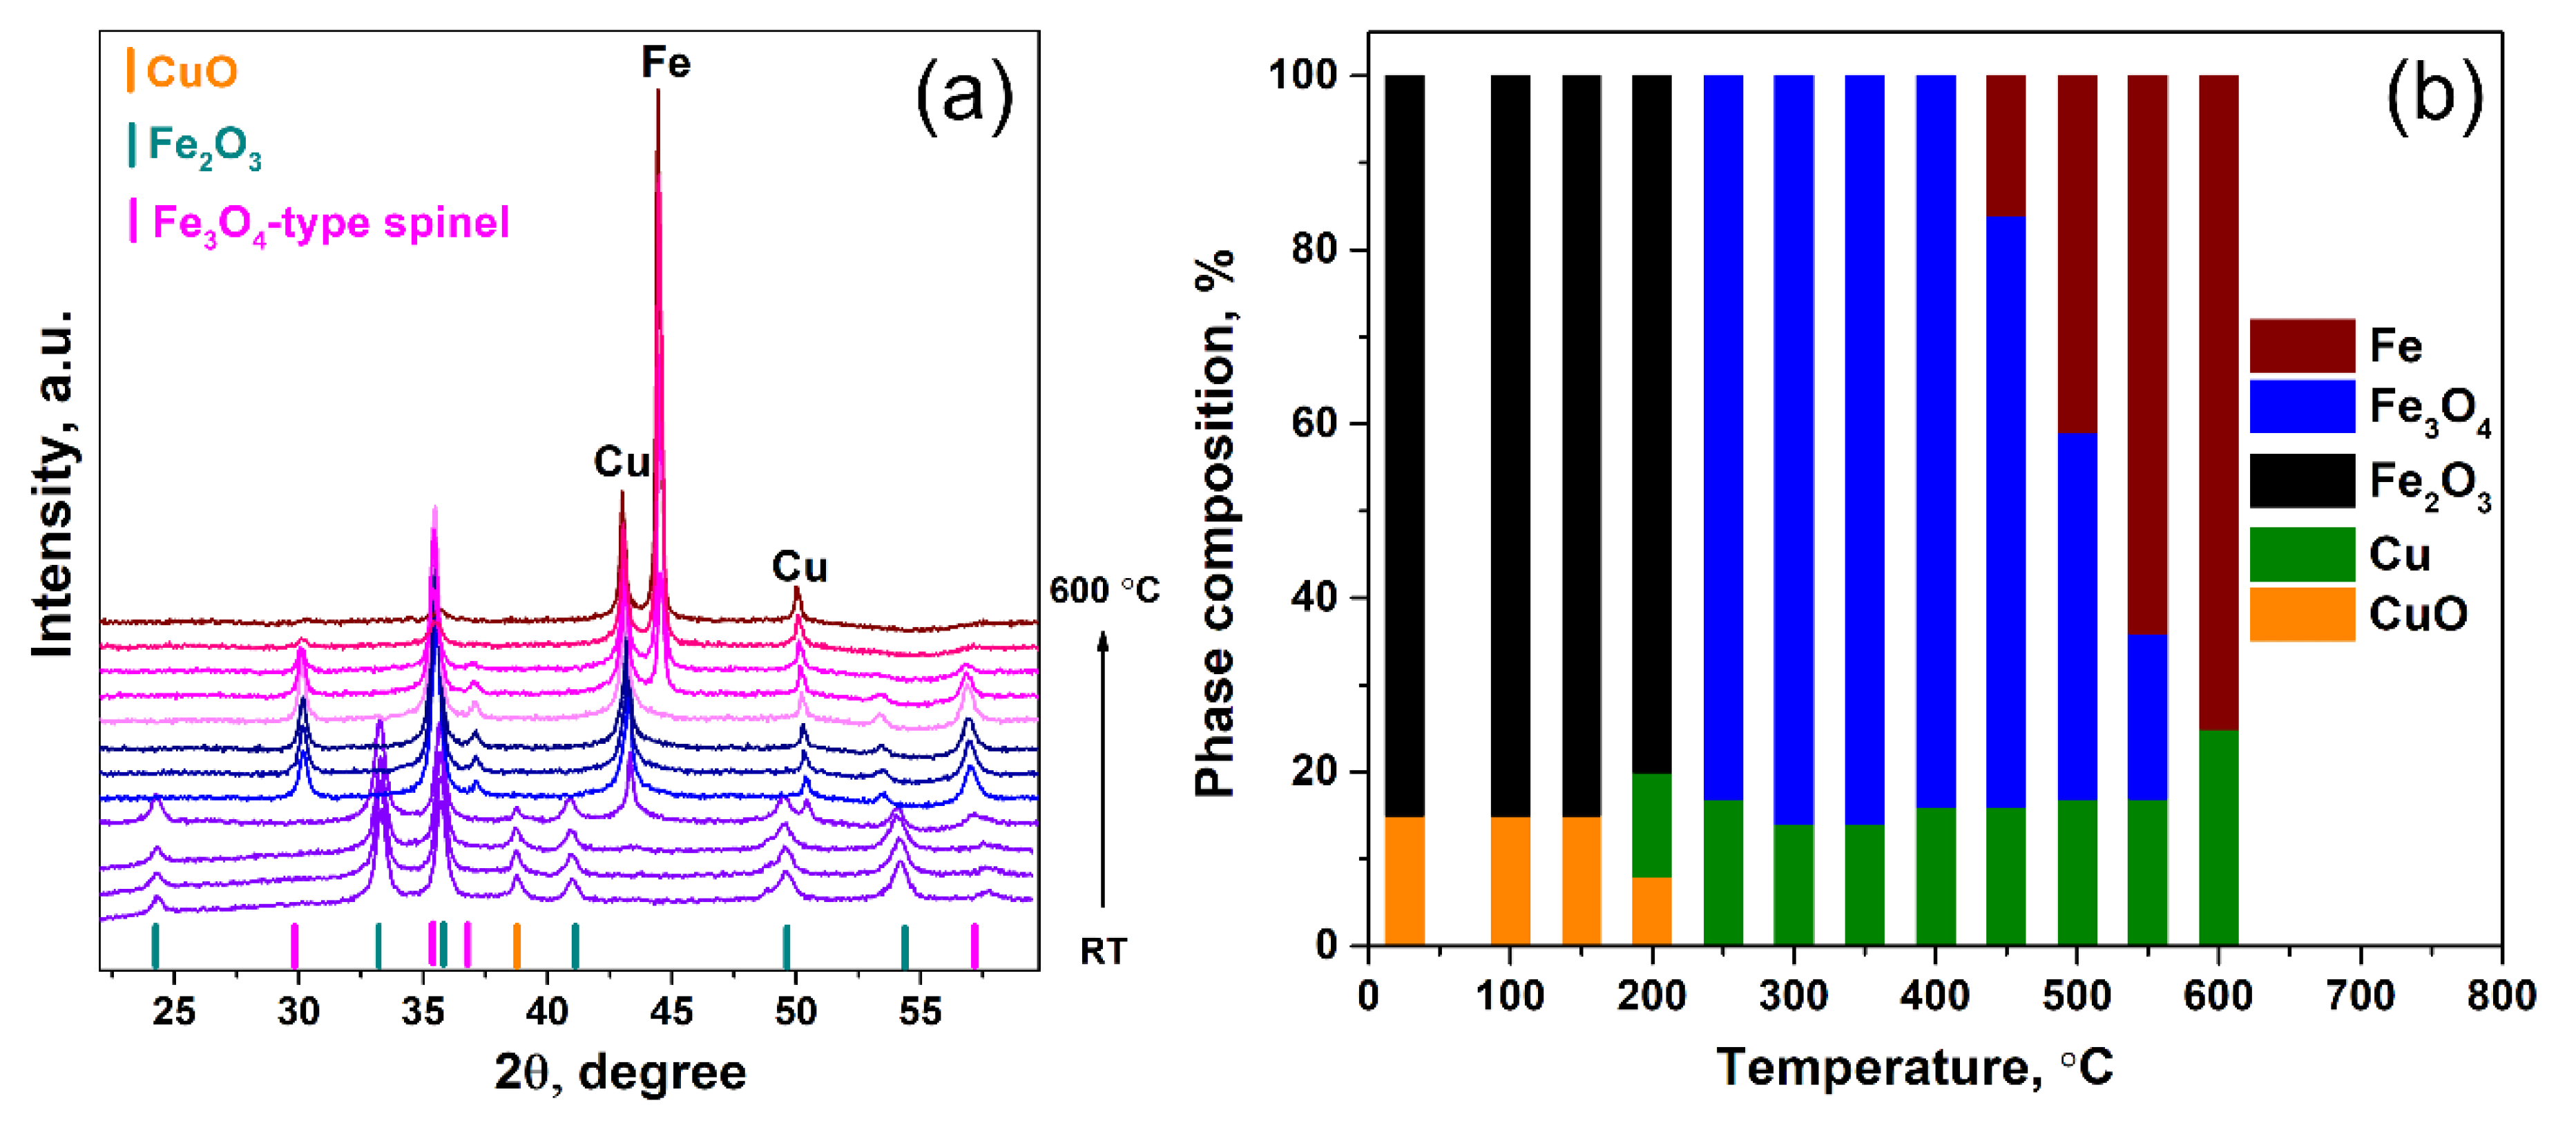
3.4. X-Ray Diffraction

The phase composition of Cu–Fe catalysts was investigated by X-ray diffraction analysis. Bruker D8 Advance X-ray diffractometer (Bruker, Karlsruhe, Germany) equipped with a Lynxeye linear detector was used. Monochromatic CuKα radiation (λ = 1.5418 Å) was applied for the analysis, an energy discriminator was used since the samples contained iron. XRD patterns were obtained in the 2θ range from 15° to 80° with a step of 0.05° and accumulation time of 3 s at each point. The average crystallite size was determined using the Scherrer equation from the integral width of the diffraction lines [35]:
  D h k l = λ β c o s Θ ,
where λ is the wavelength, Dhkl is the effective crystallite size, which depends on its shape and direction (hkl), and β is the integral width of the line.
In situ measurements were performed using a XRK-900 high-temperature reactor chamber (Anton Paar, Graz-Strassgang, Austria), recovery was carried out with 10% H2 in He at a flow rate of 100 mL/min, the heating rate was 12 °/min. The heating was carried out in steps to temperatures of 100, 150, 175, 200, 250, 300, 350, 400, 450, 500, 550, and 600 °C. Hydrogen was passed through the chamber when heated and cooled to room temperature. The average sizes (coherent-scattering domain—CSD) were calculated using the Scherrer formula (see above), the description of the diffraction profile was performed using the Origin Pro9 program.

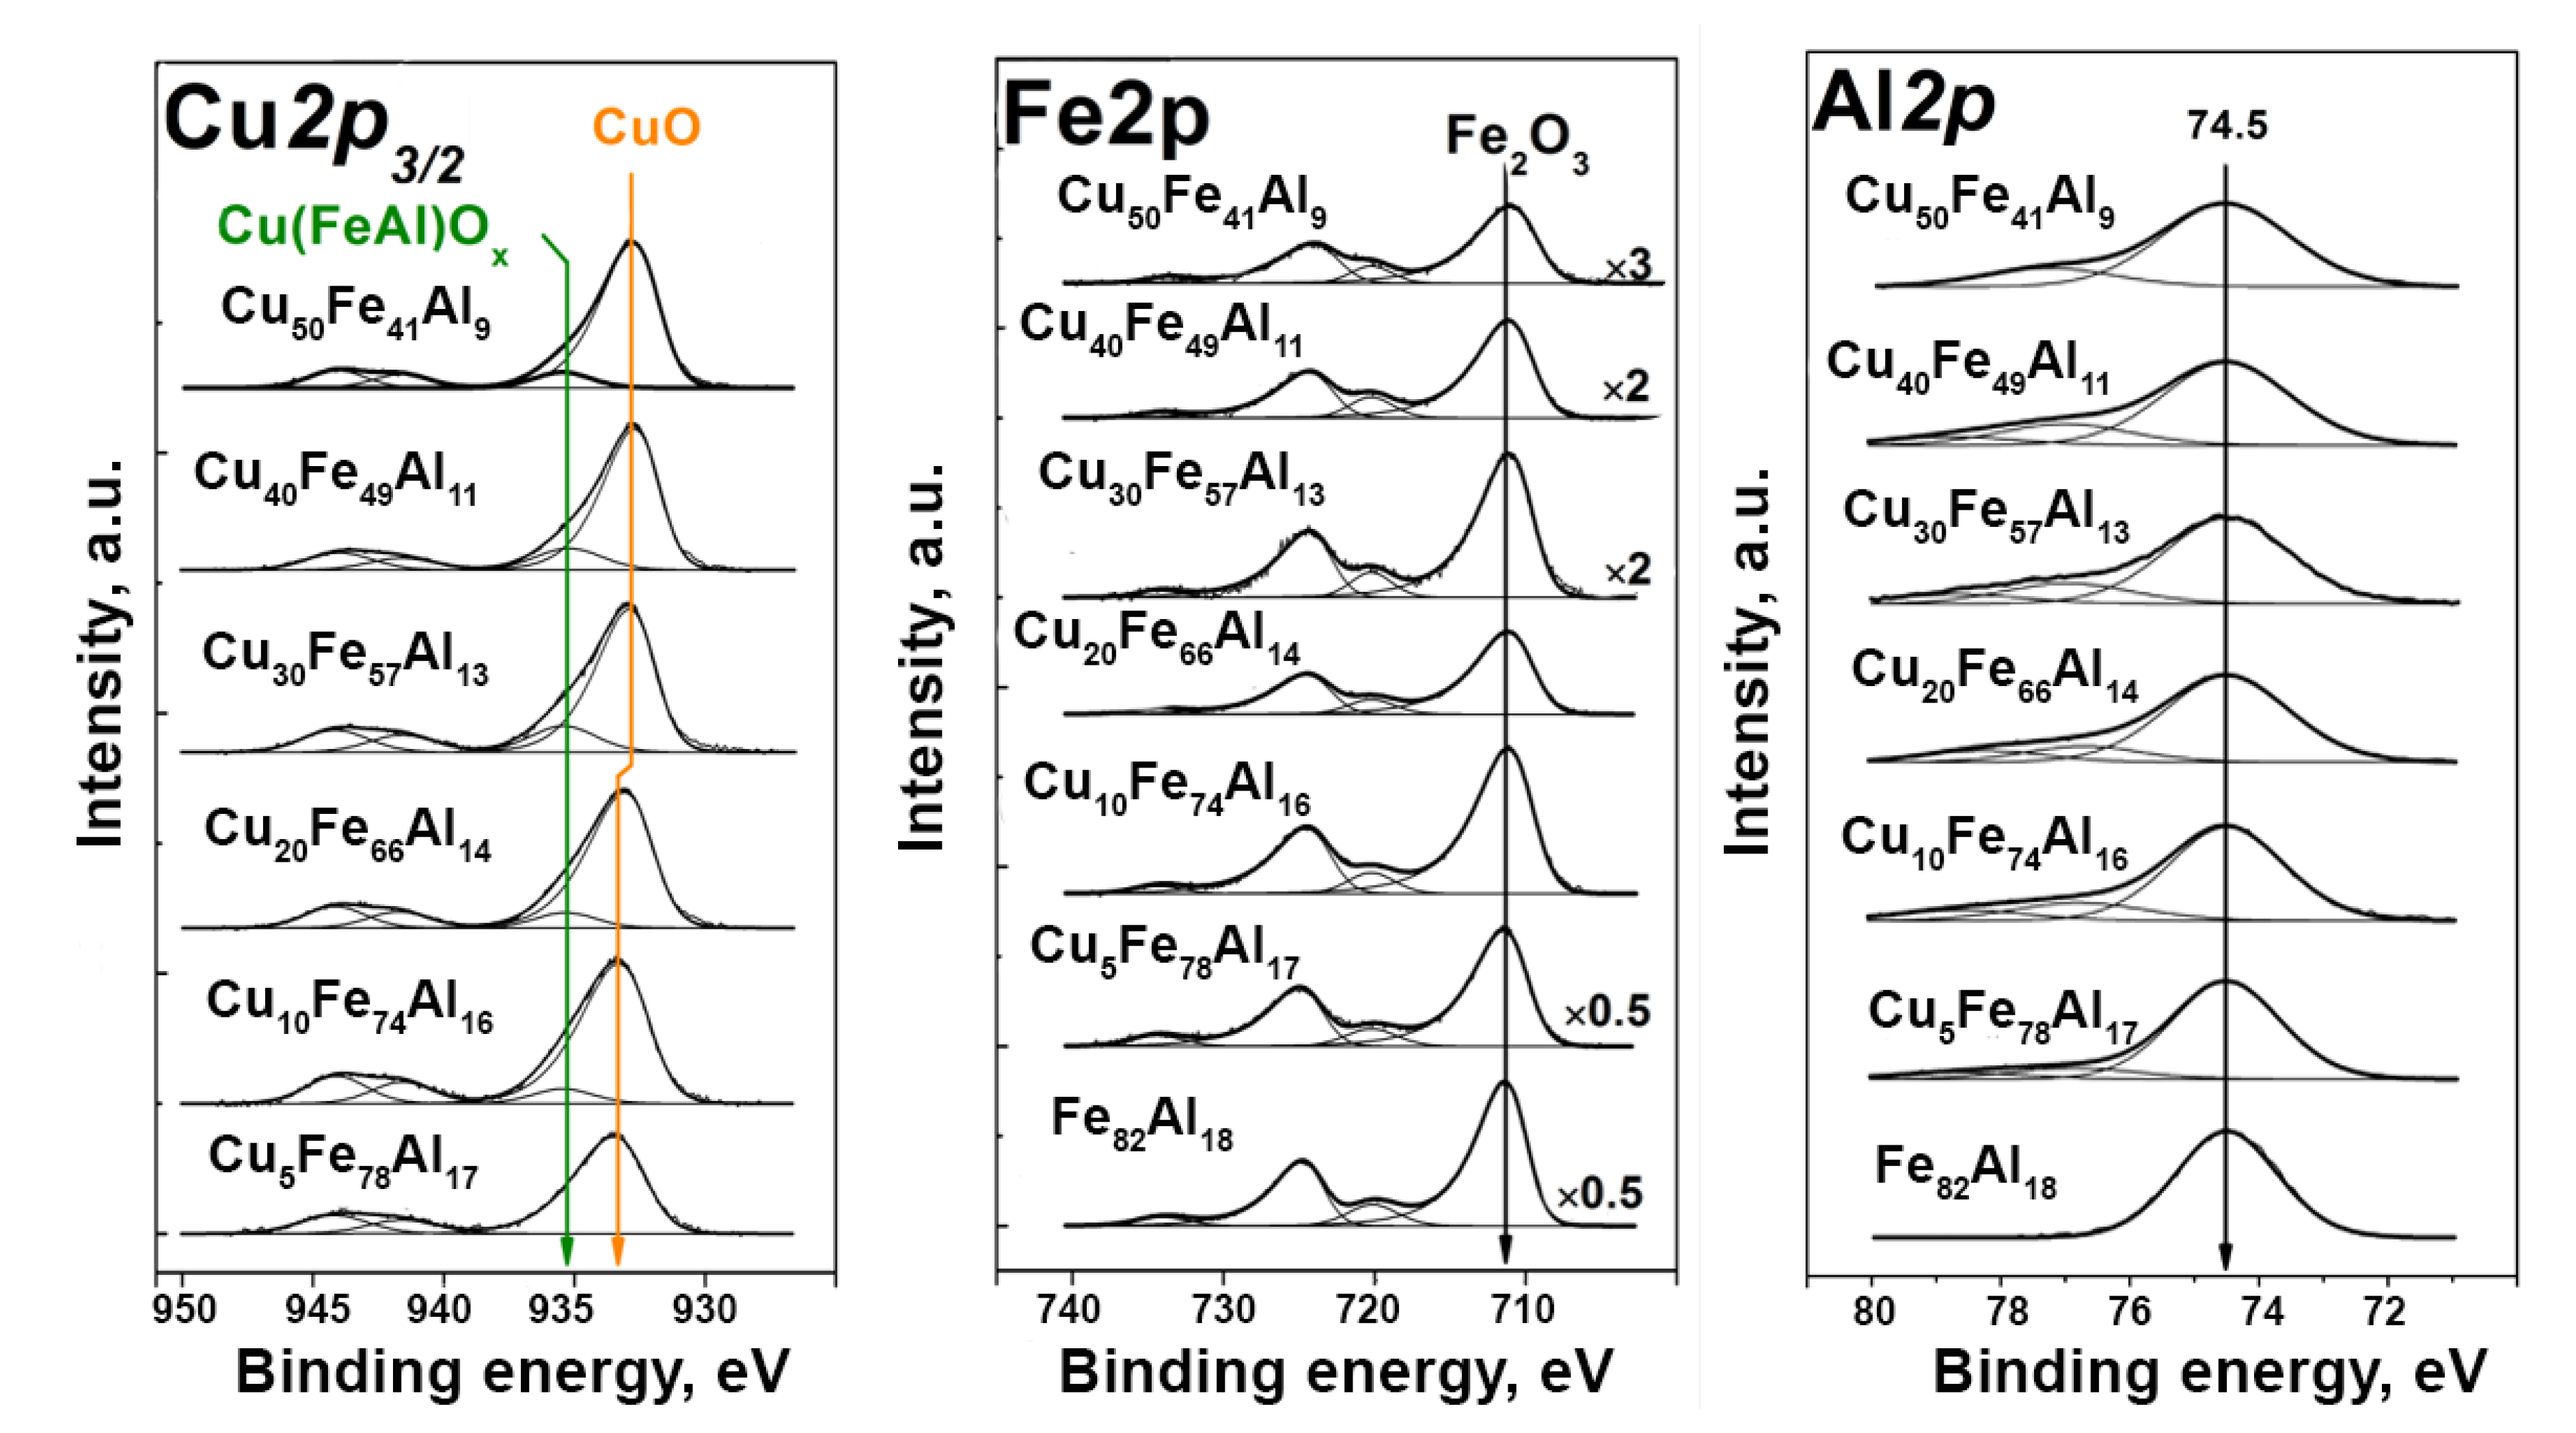
3.5. X-Ray Photoelectron Spectroscopy

Photoelectron spectrometer (SPECS Surface Nano Analysis GmbH, Berlin, Germany) was used to make the XPS measurements. The spectrometer was equipped with a PHOIBOS-150 hemispherical electron energy analyzer, a FOCUS-500 X-ray monochromator, and an XR-50 X-ray source with a double Al/Ag anode. A high-pressure cell makes it possible to heat samples under gaseous mixtures at pressures up to 0.5 MPa. The spectra were recorded using monochromatic Al Ka radiation (hv = 1486.74 eV) and a fixed analyzer pass energy of 20 eV under ultra-high vacuum conditions. Relative concentrations of elements were determined from the integral intensities of the core-level spectra using the cross sections according to Scofield [36]. For detailed analysis, the spectra were fitted into several peaks after background subtraction by the Shirley method [37]. The fitting procedure was performed using the CasaXPS software. The shape of lines was approximated by the convolution of Gaussian and Lorentzian functions. Before the analysis, all catalysts were additionally reduced under 0.1 MPa of H2 at 250 °C for 30 min in the high-pressure cell.

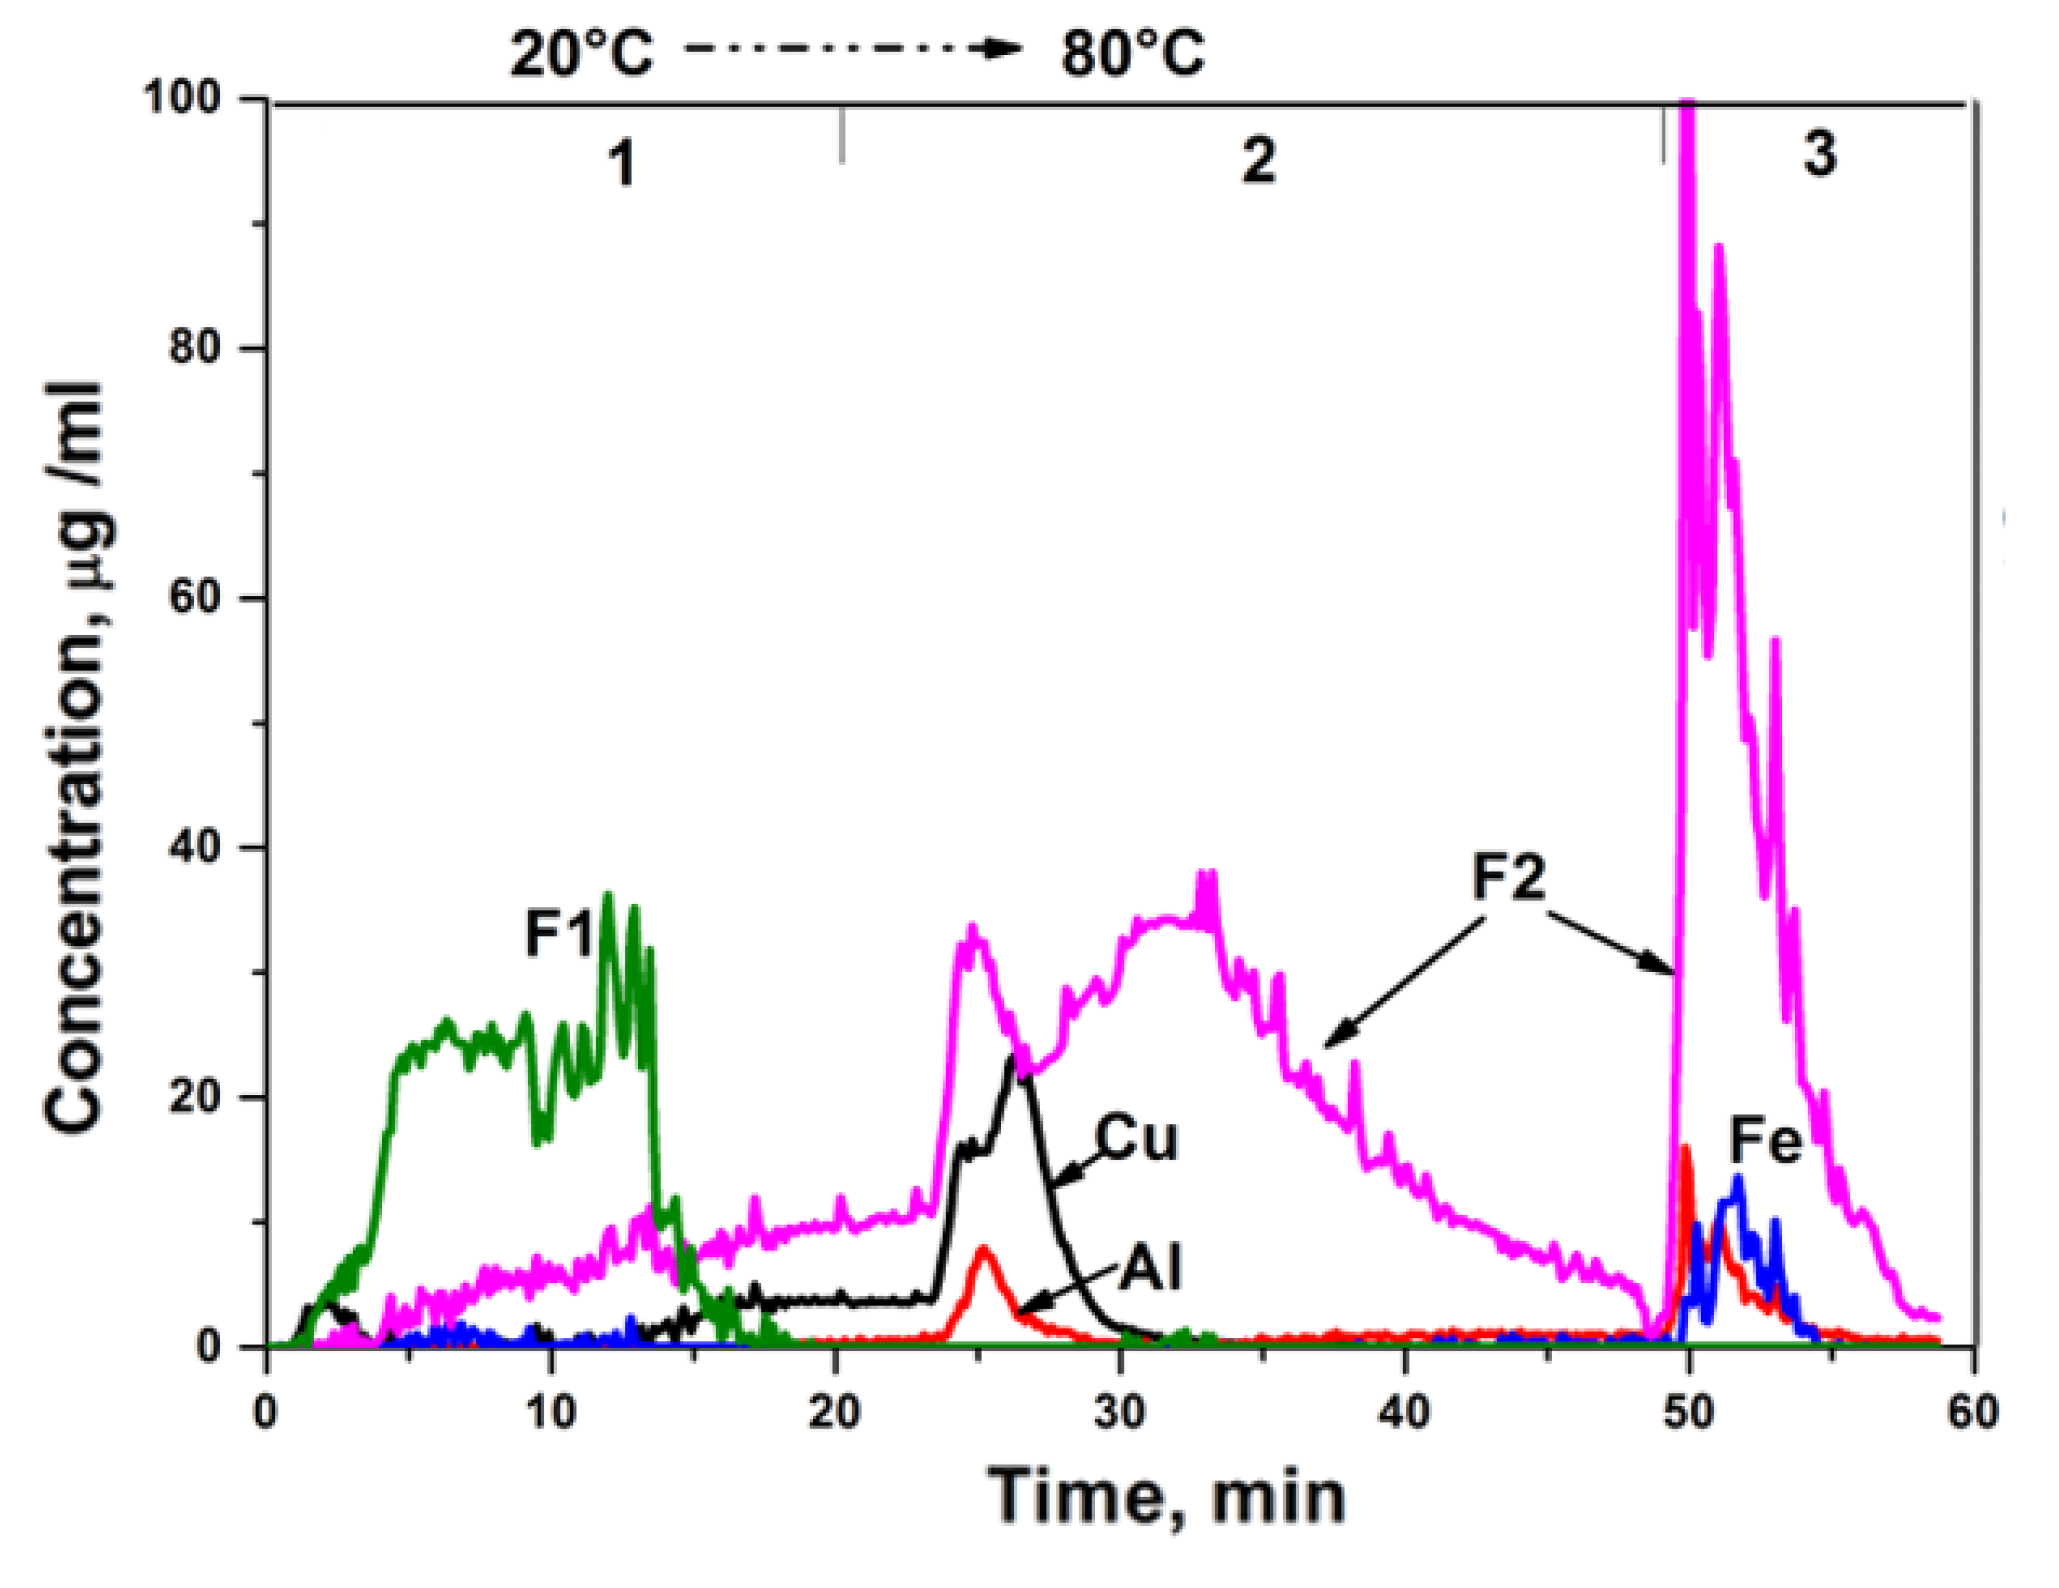
3.6. Differentiating Dissolution on an Inductively Coupled Plasma Atomic Emission Spectrometer
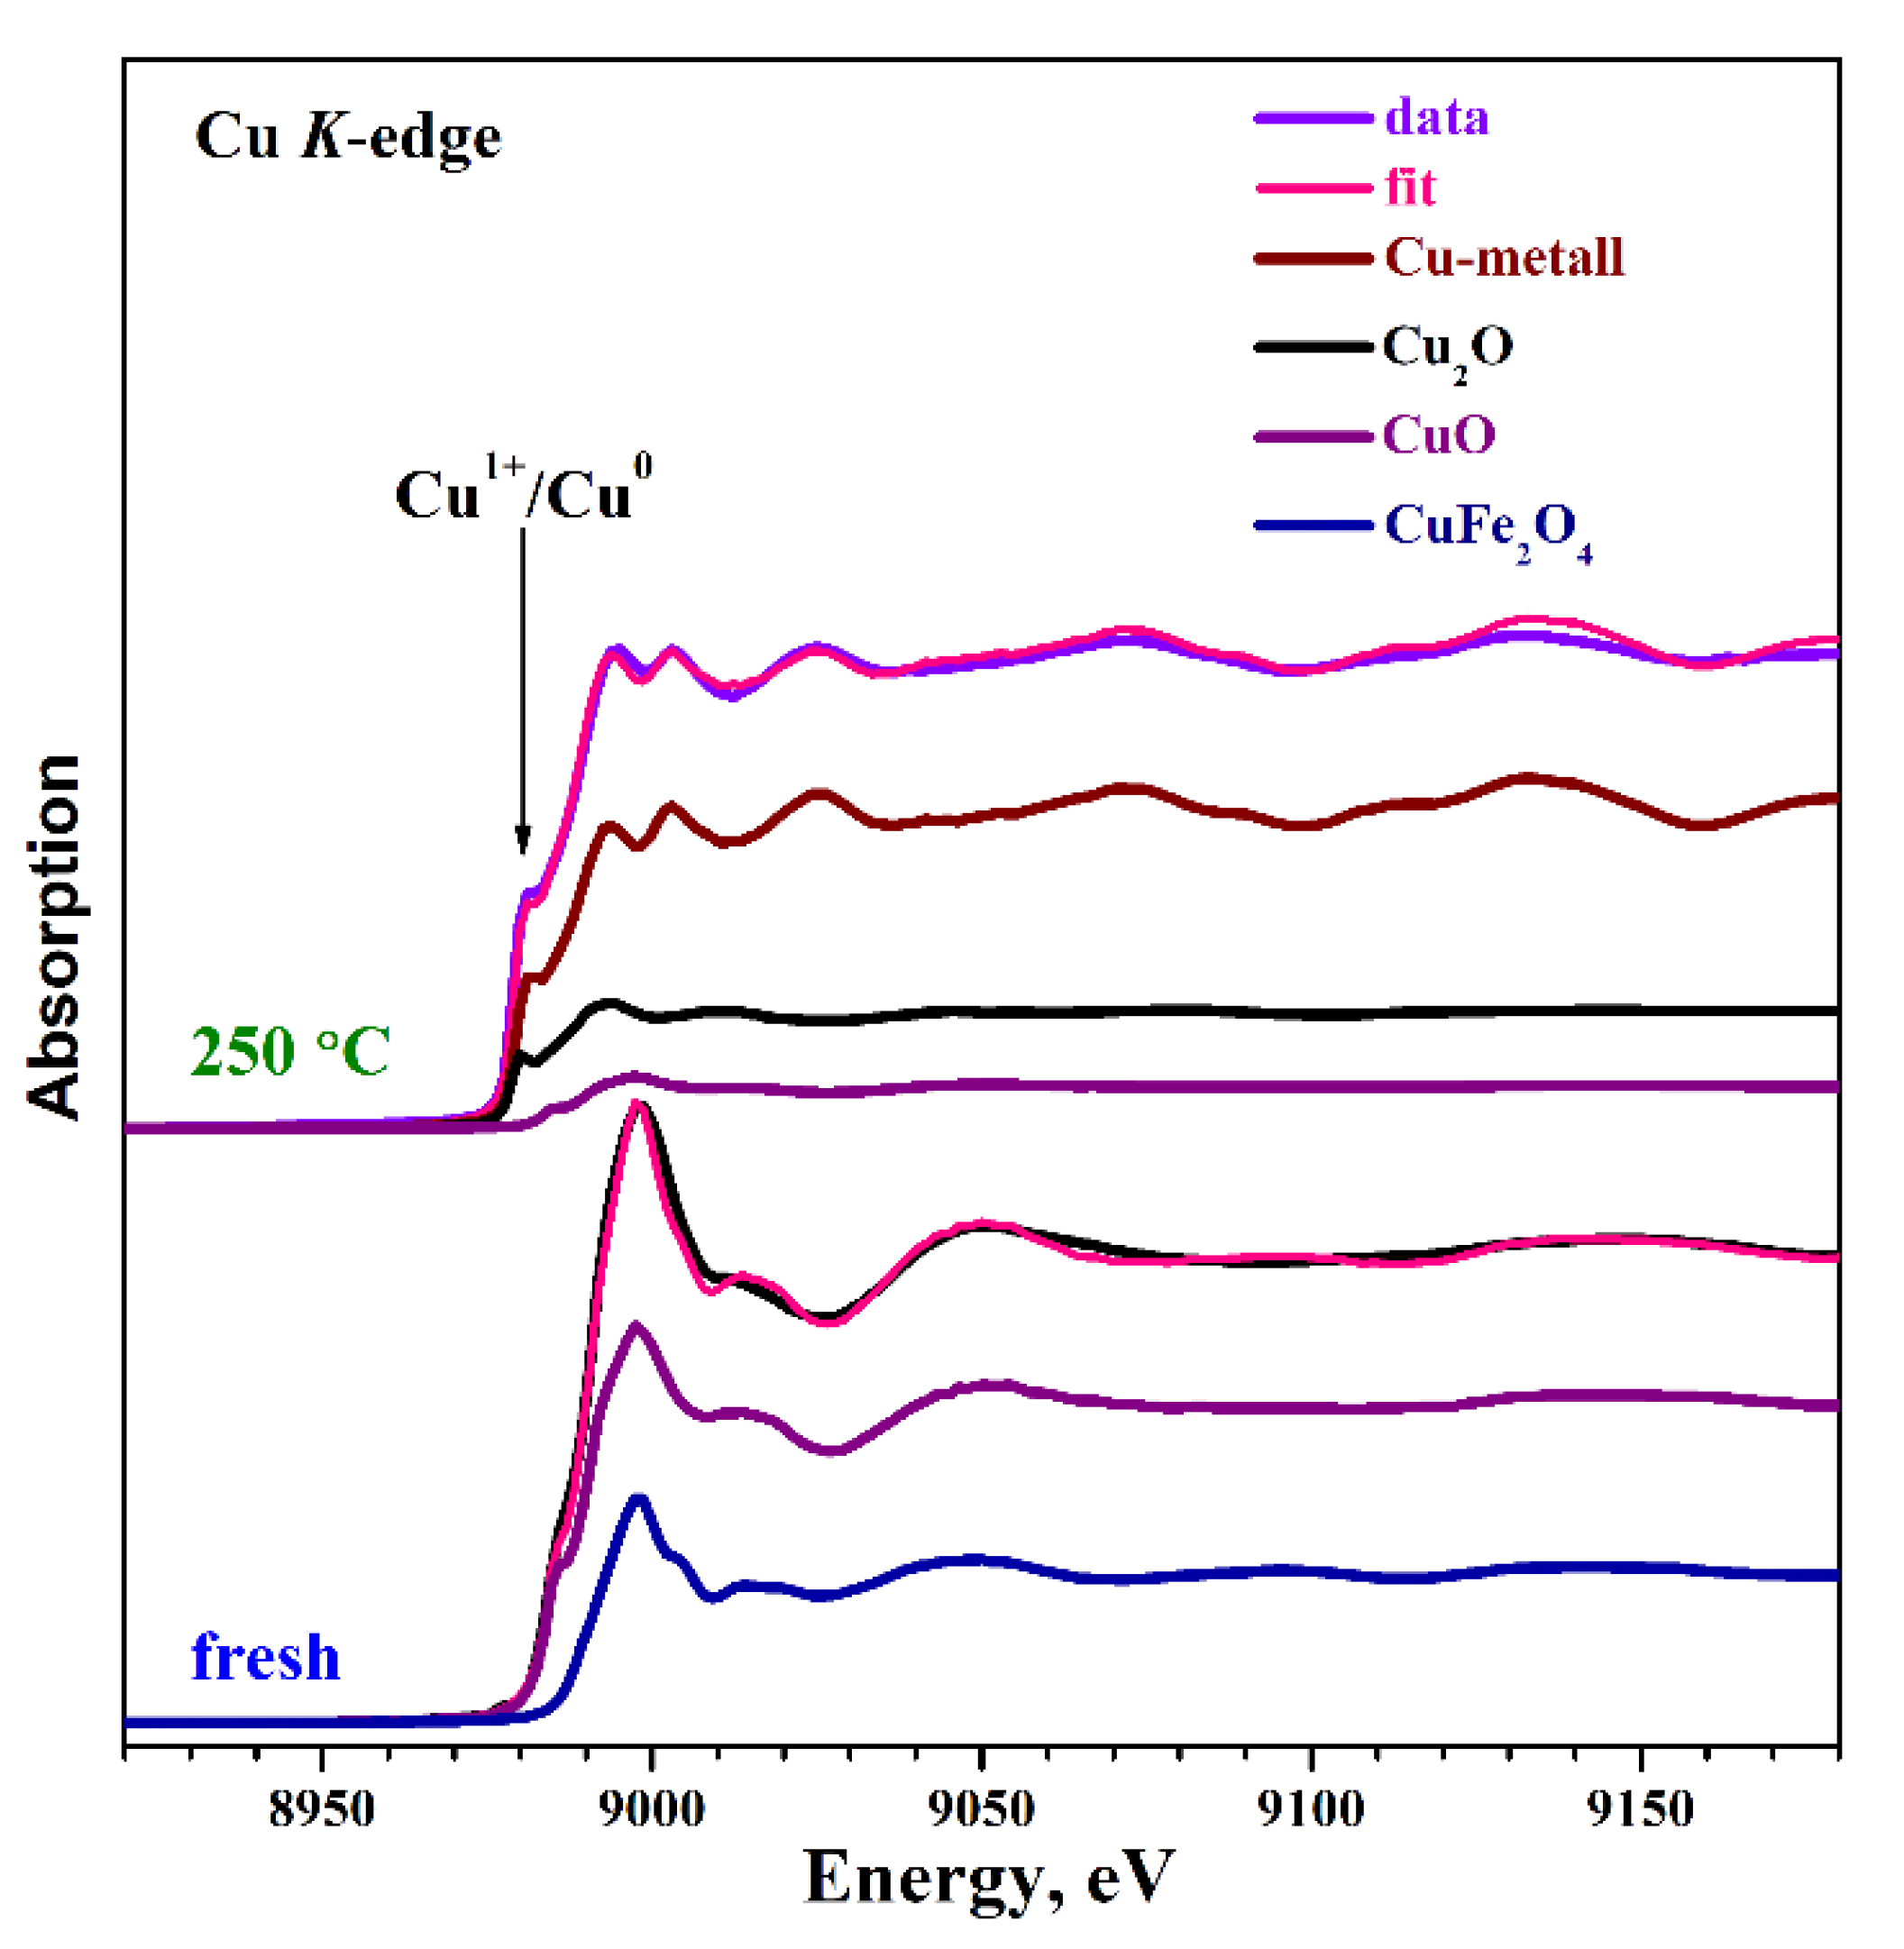
Samples were analyzed by differentiating dissolution on an inductively coupled plasma atomic emission spectrometer (ICP AES) (Baird, MA, USA) using a stoichiograph. A sample of mg was applied to a single-use sticky liner made of a polymer film with a sticky surface. On the surface of the liner, an adhered sample portion forms a monolayer of dispersed particles. An insert prepared in this way was placed in a flow stoichiograph microreactor. Flow dynamic mode started with an aqueous solution of HNO3 (pH = 2), gradually passed to 1.2 M HNO3 followed by 3.8 M HF. In a solution of hydrofluoric acid, the complete dissolution of the sample was observed. Dissolution was carried out with a gradual increase in temperature from 20 to 80 °C. The flow of the resulting sample solution was directed to the detector-analyzer (Baird, MA, USA) of ICP-AES. The elemental composition of the flow was determined every 5 s from the spectral lines of the elements (nm): Al—308.2, Cu—324.7, and Fe—238.2. These lines were selected taking into account the absence of their spectral overlap. Information on the concentration of elements along the course of dissolution and the kinetic curves of the dissolution of elements appearing on the monitor screen were observed and recorded, adjusting in real time their progress in the stoichiographic titration mode. After the experiment, the kinetic dissolution curves of the elements were transformed into stoichiograms. The average values of these sections of stoichiograms were calculated from several dozen calculated points. By the ICP-AES method, the error in determining the concentration of elements was ≤5%, and the error in determining stoichiometric coefficients in empirical formulas of phases and phase content was ≈10%.

3.7. In Situ XANES

In situ experiments on the study of the phase composition and structure of catalysts by X-ray absorption methods, XANES at the Cu K-edges of absorption were carried out at the Structural Materials Science Station of the Kurchatov synchrotron radiation source (Kurchatov Institute, Moscow, Russia) [38]. The electron beam energy in the storage ring was 2.5 GeV at current in the range from 50 to 120 mA. For monochromatization of synchrotron radiation, silicon monocrystals with (220) and (111) orientation in the form of a monoblock with a notch (“Butterfly”) mounted on a goniometric head were used, providing an energy resolution of ΔЕ / Е = 10−4 in the region of K-edges of absorption of Cu and Fe respectively. The station is equipped with a special in situ cell and a gas inlet system, which makes it possible to carry out in situ studies of catalysts at atmospheric pressure in the temperature range from 25 to 600 °C.

3.8. Elemental Analysis

A Vario El III elemental analyzer, CHNS version (Elementar, Langenselbold, Germany) was used to determine the carbon content in the catalysts after reaction.

3.9. CO Pulse Chemisorption Measurements

CO pulse chemisorption measurements using a Chemosorb analyzer (Modern Laboratory Equipment, Novosibirsk, Russia) was used to determine the number of active sites in catalysts. Catalysts were reduced in H2 at 250 °C before analysis. The samples were cooled to 25 °C into Ar atmosphere and CO was pulsed into the reactor until complete sample saturation was observed. The total CO uptake was used to calculate the number of active sites.

3.10. Transmission Electron Microscopy

The high-resolution transmission electron microscopy (HRTEM) on a JEM-2010 electron microscope (JEOL, Tokyo, Japan) was used to examine the structure and microstructure of powders at an accelerating voltage of 200 kV and point-to-point resolution of 0.14 nm.

3.11. Texture Characteristics

Reduced at 250 °С catalysts were examined by the low-temperature nitrogen porosimetry. An automated volumetric adsorption analyzer ASAP 2400 (Micromeritics Instrument Corp., Norcross, GA, USA) was used for the analysis. Before the nitrogen adsorption recording, the samples were outgassed at 150 °C and pressure 0.13 Pa for 4 h. The surface area ABET were calculated according to the experimental data.

4. Conclusions

The study of the process of furfural selective hydrogenation to furfuryl alcohol showed that copper–iron catalysts were highly active in this reaction in a batch reactor. The most active catalyst was a reduced at 250 °C sample with a CuO content of 20 wt %, Fe2O3 66 wt % and Al2O3 14 wt %, which at a temperature of 100 °C and a hydrogen pressure of 6.0 MPa allowed us to obtain FA with a yield of up to 97%.
The combination of various physicochemical methods for the analysis of copper–iron-containing catalysts shows that the high activity of the catalysts could be caused by the presence of dispersed Cu0 active sites, which were formed on the surface of the mixed Cu(FeAl)Ox spinel.
The study of the most active Cu20Fe66Al14 catalyst in solvent-free hydrogenation of furfural in the fixed-bed reactor shows that at 160 °С, hydrogen pressure 5.0 MPa, LHSV = 1 h−1, and molar ratio hydrogen/furfural = 20 the FA yield reached 96% at 99% furfural conversion for 30 h. At higher temperatures, the reaction proceeded toward the formation of 2-MF, while the formation of the self-condensation product of furfural also occurred, which contributed to carbon deposition formation on the catalyst surface. Increasing the LHSV twice reduced the conversion of furfural to 90% with 100% selectivity of FA nevertheless the high value of selectivity and conversion remained at a constant level for 75 h.
Based on data obtained, the Cu20Fe66Al14 catalyst could be considered as a promising alternative to the existing traditional chromium-containing ones for the production of FA from furfural. Moreover, this catalyst was environment-friendly, not polluting the target product by Cr compounds, and at the same time retained the necessary activity, stability, and selectivity in FA formation for 75 h.

Author Contributions

Conceptualization, V.A.Y.; Formal analysis, Andrey A. Smirnov; Investigation, S.A.S., O.A.B., Andrey A. Saraev and A.V.F.; Visualization, S.A.S.; Methodology and Software, M.Y.L.; Writing—original draft, S.A.S.; Writing—review & editing, Andrey A. Smirnov and V.A.Y

Funding

This research was funded by the Ministry of Science and Higher Education of the Russian Federation: project No. 14.575.21.0171, identification number of the project RFMEFI57517X0171, title “Development of methods for processing the products of non-food plant raw materials conversion into furanic high-octane additives for motor fuels and into other high-value chemical products”.

Acknowledgments

The authors express gratitude to D. Yu. Ermakov for making CO pulse chemosorption measurements, E.Yu. Gerasimov for TEM data and Pochtar’ A.A. for DD data.

Conflicts of Interest

The authors declare no conflict of interest.

References

  1. Espro, C.; Gumina, B.; Szumelda, T.; Paone, E.; Mauriello, F. Catalytic Transfer Hydrogenolysis as an Effective Tool for the Reductive Upgrading of Cellulose, Hemicellulose, Lignin, and Their Derived Molecules. Catalysts 2018, 8, 313. [Google Scholar] [CrossRef]
  2. Mariscal, R.; Maireles-Torres, P.; Ojeda, M.; Sádaba, I.; López Granados, M. Furfural: A renewable and versatile platform molecule for the synthesis of chemicals and fuels. Energy Environ. Sci. 2016, 9, 1144–1189. [Google Scholar] [CrossRef]
  3. Bonacci, S.; Nardi, M.; Costanzo, P.; De Nino, A.; Di Gioia, M.; Oliverio, M.; Procopio, A. Montmorillonite K10-Catalyzed Solvent-Free Conversion of Furfural into Cyclopentenones. Catalysts 2019, 9, 301. [Google Scholar] [CrossRef]
  4. Smirnov, A.; Selishcheva, S.; Yakovlev, V. Acetalization Catalysts for Synthesis of Valuable Oxygenated Fuel Additives from Glycerol. Catalysts 2018, 8, 595. [Google Scholar] [CrossRef]
  5. Nardi, M.; Costanzo, P.; De Nino, A.; Di Gioia, M.L.; Olivito, F.; Sindona, G.; Procopio, A. Water excellent solvent for the synthesis of bifunctionalized cyclopentenones from furfural. Green Chem. 2017, 19, 5403–5411. [Google Scholar] [CrossRef]
  6. Gomes, R.F.A.; Esteves, N.R.; Coelho, J.A.S.; Afonso, C.A.M. Copper(II) Triflate As a Reusable Catalyst for the Synthesis of trans-4,5-Diamino-cyclopent-2-enones in Water. J. Org. Chem. 2018, 83, 7509–7513. [Google Scholar] [CrossRef] [PubMed]
  7. Morozov, E. Furfural Production, 2nd ed.; Forest Industry: Moscow, Russia, 1988; pp. 32–56. [Google Scholar]
  8. Liu, D.; Zemlyanov, D.; Wu, T.; Lobo-Lapidus, R.J.; Dumesic, J.A.; Miller, J.T.; Marshall, C.L. Deactivation mechanistic studies of copper chromite catalyst for selective hydrogenation of 2-furfuraldehyde. J. Catal. 2013, 299, 336–345. [Google Scholar] [CrossRef]
  9. Musci, J.J.; Merlo, A.B.; Casella, M.L. Aqueous phase hydrogenation of furfural using carbon-supported Ru and RuSn catalysts. Catal. Today 2017, 296, 43–50. [Google Scholar] [CrossRef]
  10. Vorotnikov, V.; Mpourmpakis, G.; Vlachos, D.G. DFT study of furfural conversion to furan, furfuryl alcohol, and 2-methylfuran on Pd(111). ACS Catal. 2012, 2, 2496–2504. [Google Scholar] [CrossRef]
  11. Vaidya, P.D.; Mahajani, V.V. Kinetics of Liquid-Phase Hydrogenation of Furfuraldehyde to Furfuryl Alcohol over a Pt / C Catalyst. Ind. Eng. Chem. Resour. 2003, 42, 3881–3885. [Google Scholar] [CrossRef]
  12. Zhao, Y. Facile synthesis of Pd nanoparticles on SiO2 for hydrogenation of biomass-derived furfural. Environ. Chem. Lett. 2014, 12, 185–190. [Google Scholar] [CrossRef]
  13. Mironenko, R.M.; Belskaya, O.B.; Gulyaeva, T.I.; Nizovskii, A.I.; Kalinkin, A.V.; Bukhtiyarov, V.I.; Lavrenov, A.V.; Likholobov, V.A. Effect of the nature of carbon support on the formation of active sites in Pd/C and Ru/C catalysts for hydrogenation of furfural. Catal. Today 2015, 249, 145–152. [Google Scholar] [CrossRef]
  14. Wu, J.; Shen, Y.; Liu, C.; Wang, H.; Geng, C.; Zhang, Z. Vapor phase hydrogenation of furfural to furfuryl alcohol over environmentally friendly Cu-Ca/SiO2 catalyst. Catal. Commun. 2005, 6, 633–637. [Google Scholar] [CrossRef]
  15. Villaverde, M.M.; Bertero, N.M.; Garetto, T.F.; Marchi, A.J. Selective liquid-phase hydrogenation of furfural to furfuryl alcohol over Cu-based catalysts. Catal. Today 2013, 213, 87–92. [Google Scholar] [CrossRef]
  16. Khromova, S.A.; Bykova, M.V.; Bulavchenko, O.A.; Ermakov, D.Y.; Saraev, A.A.; Kaichev, V.V.; Venderbosch, R.H.; Yakovlev, V.A. Furfural Hydrogenation to Furfuryl Alcohol over Bimetallic Ni–Cu Sol–Gel Catalyst: A Model Reaction for Conversion of Oxygenates in Pyrolysis Liquids. Top. Catal. 2016, 59, 1413–1423. [Google Scholar] [CrossRef]
  17. Sitthisa, S.; Sooknoi, T.; Ma, Y.; Balbuena, P.B.; Resasco, D.E. Kinetics and mechanism of hydrogenation of furfural on Cu/SiO2 catalysts. J. Catal. 2011, 277, 1–13. [Google Scholar] [CrossRef]
  18. Smirnov, A.A.; Shilov, I.N.; Alekseeva, M.V.; Selishcheva, S.A.; Yakovlev, V.A. Study of the Composition Effect of Molybdenum-Modified Nickel–Copper Catalysts on Their Activity and Selectivity in the Hydrogenation of Furfural to Different Valuable Chemicals. Catal. Ind. 2018, 10, 228–236. [Google Scholar] [CrossRef]
  19. Villaverde, M.M.; Garetto, T.F.; Marchi, A.J. Liquid-phase transfer hydrogenation of furfural to furfuryl alcohol on Cu–Mg–Al catalysts. Catal. Commun. 2015, 58, 6–10. [Google Scholar] [CrossRef]
  20. Srivastava, S.; Mohanty, P.; Parikh, J.K.; Dalai, A.K.; Amritphale, S.S.; Khare, A.K. Cr-free Co–Cu/SBA-15 catalysts for hydrogenation of biomass-derived α-, β-unsaturated aldehyde to alcohol. Chin. J. Catal. 2015, 36, 933–942. [Google Scholar] [CrossRef]
  21. Wei, S.; Cui, H.; Wang, J.; Zhuo, S.; Yi, W.; Wang, L.; Li, Z. Preparation and activity evaluation of NiMoB/γ-Al2O3 catalyst by liquid-phase furfural hydrogenation. Particuology 2011, 9, 69–74. [Google Scholar] [CrossRef]
  22. Hu, F.; Wang, Y.; Xu, S.; Zhang, Z.; Chen, Y.; Fan, J.; Yuan, H.; Gao, L.; Xiao, G. Efficient and Selective Ni/Al2O3–C Catalyst Derived from Metal–Organic Frameworks for the Hydrogenation of Furfural to Furfuryl Alcohol. Catal. Lett. 2019, 149, 2158–2168. [Google Scholar] [CrossRef]
  23. Sitthisa, S.; Resasco, D.E. Hydrodeoxygenation of furfural over supported metal catalysts: A comparative study of Cu, Pd and Ni. Catal. Lett. 2011, 141, 784–791. [Google Scholar] [CrossRef]
  24. Du, H.; Ma, X.; Yan, P.; Jiang, M.; Zhao, Z.; Zhang, Z.C. Catalytic furfural hydrogenation to furfuryl alcohol over Cu/SiO2 catalysts: A comparative study of the preparation methods. Fuel Process. Technol. 2019, 193, 221–231. [Google Scholar] [CrossRef]
  25. Gong, J.; Yue, H.; Zhao, Y.; Zhao, S.; Zhao, L.; Lv, J.; Wang, S.; Ma, X. Synthesis of ethanol via syngas on Cu/SiO2 catalysts with balanced Cu0-Cu+ sites. J. Am. Chem. Soc. 2012, 134, 13922–13925. [Google Scholar] [CrossRef] [PubMed]
  26. Ghashghaee, M.; Shirvani, S.; Ghambarian, M. Kinetic models for hydroconversion of furfural over the ecofriendly Cu-MgO catalyst: An experimental and theoretical study. Appl. Catal. A Gen. 2017, 545, 134–147. [Google Scholar] [CrossRef]
  27. Fedorov, A.V.; Tsapina, A.M.; Bulavchenko, O.A.; Saraev, A.A.; Odegova, G.V.; Ermakov, D.Y.; Zubavichus, Y.V.; Yakovlev, V.A.; Kaichev, V.V. Structure and Chemistry of Cu–Fe–Al Nanocomposite Catalysts for CO Oxidation. Catal. Lett. 2018, 148, 3715–3722. [Google Scholar] [CrossRef]
  28. Bulavchenko, O.A.; Vinokurov, Z.S.; Saraev, A.A.; Tsapina, A.M.; Trigub, A.L.; Gerasimov, E.Y.; Gladky, A.Y.; Fedorov, A.V.; Yakovlev, V.A.; Kaichev, V.V. The Influence of Cu and Al Additives on Reduction of Iron(III) Oxide: In Situ XRD and XANES Study. Inorg. Chem. 2019, 58, 4842–4850. [Google Scholar] [CrossRef]
  29. Selishcheva, S.A.; Smirnov, A.A.; Fedorov, A.V.; Ermakov, D.Y.; Gulyaeva, Y.K.; Yakovlev, V.A. Production of Furfuryl Alcohol in the Presence of Copper-Containing Catalysts in the Selective Hydrogenation of Furfural. Katal. V Promyshlennosti 2019, 11, 216–223. [Google Scholar] [CrossRef]
  30. Ferullo, R.M.; Castellani, N.J. A quantum-chemical study of CO adsorption on small Cu particles supported on reduced SiO2. J. Mol. Catal. A Chem. 2005, 234, 121–127. [Google Scholar] [CrossRef]
  31. Shilov, I.; Smirnov, A.; Bulavchenko, O.; Yakovlev, V. Effect of Ni–Mo Carbide Catalyst Formation on Furfural Hydrogenation. Catalysts 2018, 8, 560. [Google Scholar] [CrossRef]
  32. Khromova, S.A.; Smirnov, A.A.; Bulavchenko, O.A.; Saraev, A.A.; Kaichev, V.V.; Reshetnikov, S.I.; Yakovlev, V.A. Anisole hydrodeoxygenation over Ni–Cu bimetallic catalysts: The effect of Ni/Cu ratio on selectivity. Appl. Catal. A Gen. 2014, 470, 261–270. [Google Scholar] [CrossRef]
  33. Strohmeier, B.R.; Levden, D.E.; Field, R.S.; Hercules, D.M. Surface spectroscopic characterization of Cu/Al2O3 catalysts. J. Catal. 1985, 94, 514–530. [Google Scholar] [CrossRef]
  34. Descostes, M.; Mercier, F.; Thromat, N.; Beaucaire, C.; Gautier-Soyer, M. Use of XPS in the determination of chemical environment and oxidation state of iron and sulfur samples: Constitution of a data basis in binding energies for Fe and S reference compounds and applications to the evidence of surface species of an oxidized pyrite in a carbonate medium. Appl. Surf. Sci. 2000, 165, 288–302. [Google Scholar]
  35. Rietveld, H.M. A profile refinement method for nuclear and magnetic structures. J. Appl. Crystallogr. 1969, 2, 65–71. [Google Scholar] [CrossRef]
  36. Scofield, J.H. Hartree-Slater subshell photoionization cross-sections at 1254 and 1487 eV. J. Electron Spectrosc. Relat. Phenom. 1976, 8, 129–137. [Google Scholar] [CrossRef]
  37. Shirley, D.A. High-resolution x-ray photoemission spectrum of the valence bands of gold. Phys. Rev. B 1972, 5, 4709–6024. [Google Scholar] [CrossRef]
  38. Chernyshov, A.A.; Veligzhanin, A.A.; Zubavichus, Y.V. Structural Materials Science end-station at the Kurchatov Synchrotron Radiation Source: Recent instrumentation upgrades and experimental results. Nucl. Instrum. Methods Phys. Res. Sect. A Accel. SpectrometersDetect. Assoc. Equip. 2009, 603, 95–98. [Google Scholar] [CrossRef]
Figure 1. Furfuryl alcohol (FA) preparation from furfural.
Catalysts 09 00816 g001
Figure 2. Dependence of furfural concentration on the reaction time for CuFe-containing catalysts reduced at 250 °C in the batch reactor. Reaction conditions: H2 pressure 6.0 MPa, 100 °С, catalyst 5g.
Catalysts 09 00816 g002
Figure 3. Dependence of FA yield on the furfural conversion for the CuFe-containing catalysts reduced at 250 °C. Reaction conditions: H2 pressure 6.0 MPa, 100 °C catalyst 5 g, reaction time 120 min.
Catalysts 09 00816 g003
Figure 4. The dependence of the activity of the catalysts on the content of CuO in CuO-Fe2O3.
Catalysts 09 00816 g004
Figure 5. Dependence of the reaction products yields on the temperature in the presence of the Cu20Fe66Al14 catalyst in a batch reactor. Reaction conditions: H2 pressure 6.0 MPa, reaction time 3 h, catalyst 5 g.
Catalysts 09 00816 g005
Figure 6. Scheme of furfural hydrogenation over the Cu20Fe66Al14 catalyst in a batch reactor. Reaction conditions: 100–250 °C, H2 pressure 6.0 MPa, furfural 4.2 ml, i-propanol 55.8 ml, reaction time 180 min, catalyst 5g.
Catalysts 09 00816 g006
Figure 7. The composition of the reaction mixture depending on the reaction temperature for the Cu20Fe66Al14 catalyst in a flow reactor. Reaction conditions: H2 pressure 5.0 MPa, LHSV = 1 h−1, molar ratio H2/furfural = 22.
Catalysts 09 00816 g007
Figure 8. Yield of FA in hydrogenation of furfural over Cu5Fe78Al17, Cu20Fe66Al14, and Cu50Fe41Al9 catalysts. Reaction conditions: T = 160 °C, H2 pressure 5.0 MPa, LHSV=1 h-1, molar ratio H2/furfural = 22.
Catalysts 09 00816 g008
Figure 9. Dependence of FA yield on the reaction time for the Cu20Fe66Al14 catalyst in a flow reactor. Reaction conditions: T = 160 °C, H2 pressure 5.0 MPa, LHSV = 2 h−1, molar ratio H2/furfural = 22.
Catalysts 09 00816 g009
Figure 10. Cu2p spectra of the CuFeAl-catalysts (the spectra were normalized to the integrated intensity of the corresponding Al2p spectra).
Catalysts 09 00816 g010
Figure 11. X-ray diffraction patterns of iron- and copper-iron-containing catalysts after the reaction. in a batch reactor and Cu20Fe66Al14 after reaction in a fixed-bed reactor.
Catalysts 09 00816 g011
Figure 12. Stoichiograms of differentiating dissolution of Cu20Fe66Al14 catalyst reduced at 250 °C (the numbers indicate the dissolution conditions: 1—pH 2 HNO3, 2—1.2 M HNO3, 3—3.8 M HF).
Catalysts 09 00816 g012
Figure 13. The diffraction patterns of in situ XRD (a) and phase composition (b) of the Cu20Fe66Al14 catalyst reduced by in situ method in the temperature range 100–600 °С.
Catalysts 09 00816 g013
Figure 14. TEM images of a Cu20Fe66Al14 catalyst reduced at a temperature of 250 °C.
Catalysts 09 00816 g014
Figure 15. Approximation of the XANES spectra of the Cu K-edge in the form of a linear superposition of the spectra of Cu0, Cu2O, CuO, and CuFe2O4.
Catalysts 09 00816 g015
Table 1. The composition of CuXFeYAlZ catalysts and textural characteristics.
SampleContent, wt %ABET, m2/gCO Uptake, μmol/g
CuOFe2O3Al2O3
Fe82Al18-82.018.0830
Cu5Fe78Al175.077.917.17423.5
Cu10Fe74Al1610.073.816.25830.7
Cu20Fe66Al1420.065.614.43130.7
Cu30Fe57Al1330.057.412.63732.7
Cu40Fe49Al1140.049.210.83532.7
Cu50Fe41Al950.041.09.02226.6
Cu5Al955.0-95.025655.2
Table 2. The constant rate of furfural conversion, turn over frequency (TOF) value of the catalysts, and carbon deposition content in spent catalysts. Reaction conditions: H2 pressure 6.0 MPa, 100 °C, furfural 4.2 ml, i-propyl alcohol 55.8 ml, catalyst 5g, reaction time 120 min.
Samplek0·105, s−1TOF, 102·s−1Carbon Content in Spent Catalysts, wt %
Fe82Al181.28 ± 0.0201.9 ± 0.1
Cu5Fe78Al1720 ± 18.6 ± 0.52.0 ± 0.1
Cu10Fe74Al1632 ± 310.2 ± 1.02.0 ± 0.1
Cu20Fe66Al1434 ± 211.2 ± 0.60.93 ± 0.04
Cu30Fe57Al1329 ± 49.0 ± 1.01.1 ± 0.1
Cu40Fe49Al1114 ± 14.4 ± 0.40.88 ± 0.05
Cu50Fe41Al97.6 ± 0.32.9 ± 0.10.5 ± 0.1
Cu5Al959.8 ± 0.91.8 ± 0.20.4 ± 0.1
Table 3. The atomic ratio of elements in the surface layer of CuFeAl-containing catalysts after reaction in a batch reactor.
Sample[Fe]/[Al][Cu]/[Al]% CuO in all form of Cu
Cu5Fe78Al170.700.21100
Cu10Fe74Al160.420.3193
Cu20Fe66Al140.250.2792
Cu30Fe57Al130.200.2987
Cu40Fe49Al110.150.2687
Cu50Fe41Al90.080.2692
Cu20Fe66Al14 (fixed-bed reactor) 0.190.2081
Table 4. The phase composition and the coherent-scattering domain (CSD) of CuFe-containing catalysts after the reaction.
SamplePhase Composition, %CSD, Å
Fe82Al18Fe2O3200
Cu5Fe78Al17Fe3O4200
Cu10Fe74Al16Fe3O4250
Cu20Fe66Al1493% Fe3O4
7% Cu
250
450
Cu30Fe57Al1377% Fe3O4
23% Cu
250
1000
Cu40Fe49Al1155% Fe3O4,
45% Cu
250
1500
Cu50Fe41Al945% Fe3O4
55% Cu
300
>1500
Cu5Al95AlOOH60
Cu20Fe66Al14 (fixed-bed reactor)92% Fe3O4
8% Cu
200
450

