Article

Isotope Labelling for Reaction Mechanism Analysis in DBD Plasma Processes

by
Paula Navascués
1,
Jose M. Obrero-Pérez
1,
José Cotrino
1,2,
Agustín R. González-Elipe
1 and
Ana Gómez-Ramírez
1,2,*
1
Laboratory of Nanotechnology on Surfaces, Instituto de Ciencia de los Materiales de Sevilla (CSIC-Universidad de Sevilla), Avda. Américo Vespucio 49, 41092 Sevilla, Spain
2
Departamento de Física Atómica, Molecular y Nuclear, Universidad de Sevilla, Avda. Reina Mercedes, 41012 Sevilla, Spain
*
Author to whom correspondence should be addressed.
Catalysts 2019, 9(1), 45; https://doi.org/10.3390/catal9010045
Submission received: 27 November 2018 / Revised: 26 December 2018 / Accepted: 28 December 2018 / Published: 4 January 2019
(This article belongs to the Special Issue Plasma Catalysis)

Abstract

:
Dielectric barrier discharge (DBD) plasmas and plasma catalysis are becoming an alternative procedure to activate various gas phase reactions. A low-temperature and normal operating pressure are the main advantages of these processes, but a limited energy efficiency and little selectivity control hinder their practical implementation. In this work, we propose the use of isotope labelling to retrieve information about the intermediate reactions that may intervene during the DBD processes contributing to a decrease in their energy efficiency. The results are shown for the wet reforming reaction of methane, using D2O instead of H2O as reactant, and for the ammonia synthesis, using NH3/D2/N2 mixtures. In the two cases, it was found that a significant amount of outlet gas molecules, either reactants or products, have deuterium in their structure (e.g., HD for hydrogen, CDxHy for methane, or NDxHy for ammonia). From the analysis of the evolution of the labelled molecules as a function of power, useful information has been obtained about the exchange events of H by D atoms (or vice versa) between the plasma intermediate species. An evaluation of the number of these events revealed a significant progression with the plasma power, a tendency that is recognized to be detrimental for the energy efficiency of reactant to product transformation. The labelling technique is proposed as a useful approach for the analysis of plasma reaction mechanisms.

Graphical Abstract

1. Introduction

Plasma and plasma catalysis with dielectric barrier discharge (DBD) reactors have been widely utilized for a large variety of chemical processes, including the reforming of hydrocarbons [1,2,3], the abatement of contaminants [4,5,6], or the synthesis of ammonia [7,8,9]. There are two major shortcomings when dealing with DBD plasma reactions. The first one refers to the energy efficiency, which, in general, is still much lower than that required for the current chemical or catalytic procedures. The second refers to the selectivity, which is still an unsolved challenge when trying to favor the formation of a particular product in detriment to others [10]. These limitations stem from the same nature of the plasma processes where kinetics control the reaction pathways and thermodynamics is a secondary player in determining the final reaction outputs. In addition, although much attention has been paid to the influence of electrical operating conditions (voltage, frequencies, etc.), there is still limited knowledge about the influence of other working parameters, such as the residence time of the reactants, internal structure of the reactors, and therefore the distribution of gases within the discharge, and so on. In recent works on the synthesis of ammonia [9,11] and on the reforming of hydrocarbons [3,12], we have demonstrated how the reaction performance is affected by these parameters. In particular, using deuterated water for the wet reforming reaction of methane, we were able to prove that not only direct reactions transforming the reactants (methane and water) intro products (hydrogen and carbon Monoxide) take place in the plasma, but also a panoply of intermediate processes that, consuming energy, do not lead to the formation of new product molecules [3]. To our knowledge, this is a first attempt in the literature to characterize DBD gas synthesis mechanisms, using a methodology that, while widely used in conventional or enzymatic catalysis for the same purpose [13,14,15,16,17], has only been incipiently used to study the plasma removal of pollutants [18,19,20].
In the present paper, we want to further explore the use of the isotope labelling technique to unravel the reaction mechanisms in the DBD plasma reactions. We studied two reactions, the synthesis of ammonia using hydrogen and nitrogen as reactants, and the wet reforming of methane to yield CO plus hydrogen. In the first case, we carried out experiments with a ternary mixture of ammonia/hydrogen/nitrogen, which, in the normal operating conditions of our reactor, represents the outlet mixture obtained during ammonia synthesis (i.e., including the ammonia formed and the unreacted hydrogen and nitrogen). We show that treating a mixture of N2/D2/NH3 (i.e., where H2 has been substituted by D2) does not significantly alter the ammonia content in the outlet as compared to the inlet gas mixture, but substantially modifies the distribution of D atoms between the ammonia and hydrogen molecules, in a proportion that depends on the plasma power. Using the same methodology, we revisited the wet reforming reaction studied in our previous work [3] using mixtures of CH4 plus D2O (instead of conventional H2O) as reactants, and where we studied the distribution of D in the outlet gas molecules as a function of the applied power. A careful analysis of the distribution of deuterium isotopes in the different outlet molecules provides useful information about both the occurrence of completely inefficient secondary processes (i.e., processes that do not contribute to the formation of the desired product compounds) and their relative importance, depending on electrical operational conditions. From this study, we propose a general methodology for the use of labelling techniques, which may help to unravel the DBD mechanisms intervening during the plasma synthesis reactions.

2. Results and Discussion

Before analyzing the isotopic exchange processes that took place for the selected reactions, we will first discuss the methodological basis utilized for the analysis of isotope labelling using mass spectrometry (MS) and infrared spectroscopy (IR).

2.1. Analysis of Plasmas Induced Isotope Exchange Reactions

For the ammonia reaction, we reported a maximum nitrogen conversion of 7% according to Reaction (1) [9], where the nitrogen and hydrogen acting as reactants give rise to ammonia, as follows:
Nitrogen + 3 Hydrogen → Ammonia,
For the reported conditions of the maximum nitrogen conversion in the literature [11], for each 100 molecules of nitrogen and 100 of hydrogen in the inlet mixture, seven nitrogen molecules would transform into the ammonia. The outlet gas mixture would consist of 14 molecules of ammonia (product of Reaction (1)), 93 molecules of unreacted nitrogen, and 79 molecules of unreacted hydrogen. We attributed this relatively low reaction yield, in comparison with that attained in conventional catalytic processes [21] (yet the 7% found is one of the highest reported for the DBD synthesis of ammonia [7,8,
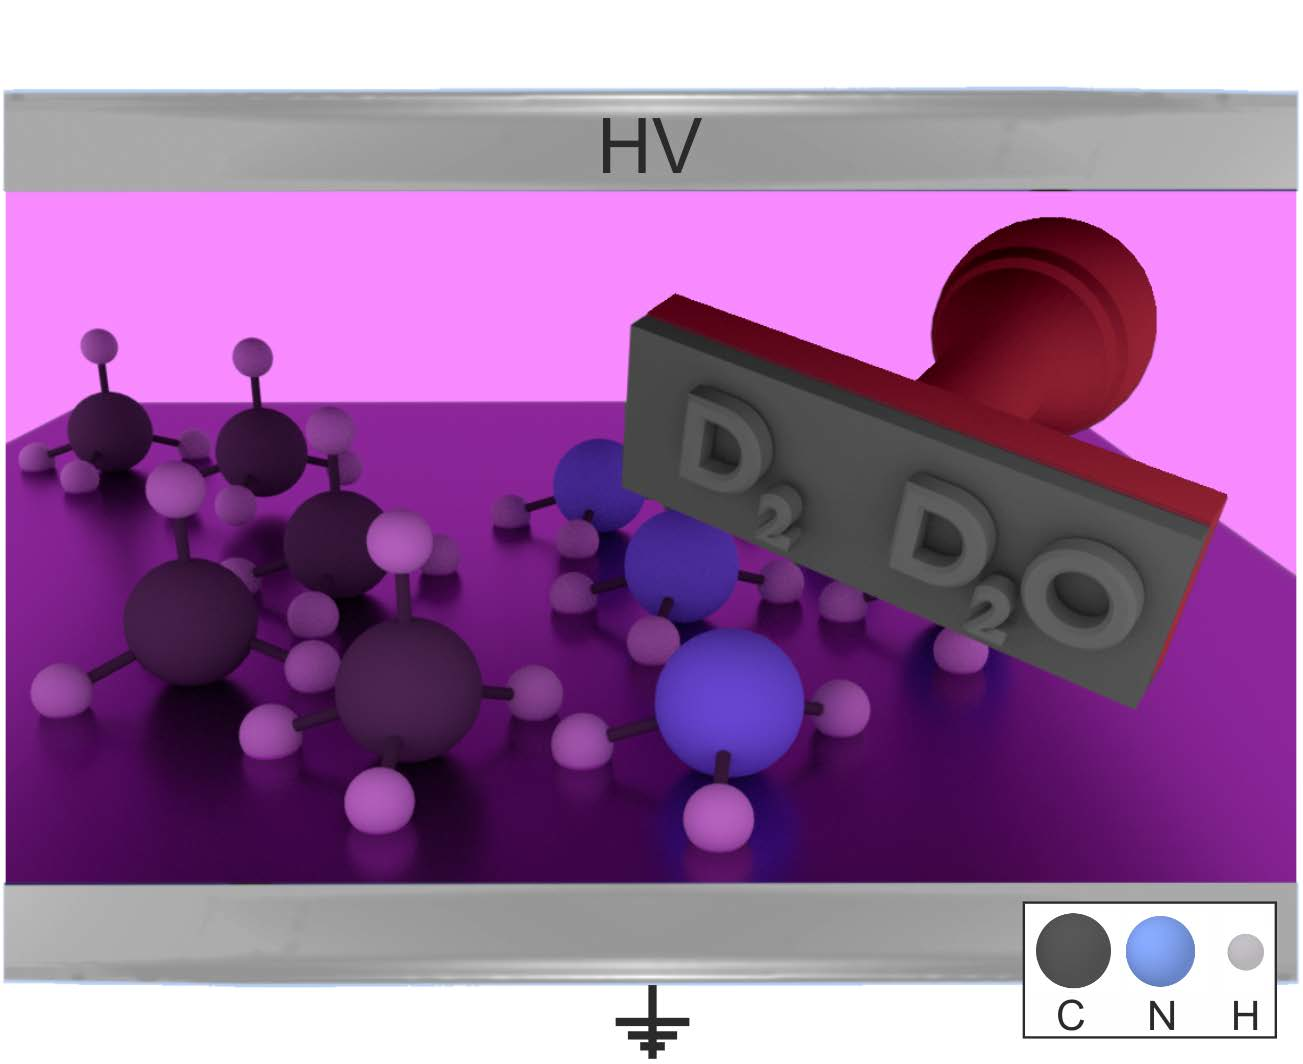
9]), to the existence of back reactions leading to the formation of nitrogen and hydrogen from the formed ammonia (i.e., the inverse of Reaction (1)) or other intermediate processes, which result inefficient in rendering ammonia molecules. The isotope reaction experiment carried out in the present work does not pretend to increase the reaction yield, but instead evaluates the occurrence of intermediate processes that are neutral with respect to the formation of new ammonia molecules. For this purpose, we used a ternary gas mixture of nitrogen, hydrogen, and ammonia, approaching the composition of the outlet gas mixture of Reaction (1) reported in the literature [11], and ensuring that the amount of ammonia in the inlet and outlet mixtures remains invariable (i.e., to meet conditions under which there is no net production of ammonia). This does not mean that there are not intermediate reaction processes in the plasma, but that the formation of one ammonia molecule according to Reaction (1) is compensated with the decomposition of another one (i.e., inverse to Reaction (1)). A negligible formation of ammonia was indeed proved in the experiment, because the final concentration of N2 detected by MS in the outlet gases remained constant after plasma activation (see below). As D2 substituted H2 in the inlet reaction mixture, the only source of H during the plasma activation of the ternary mixture was the NH3 inlet gas feeding the reactor.
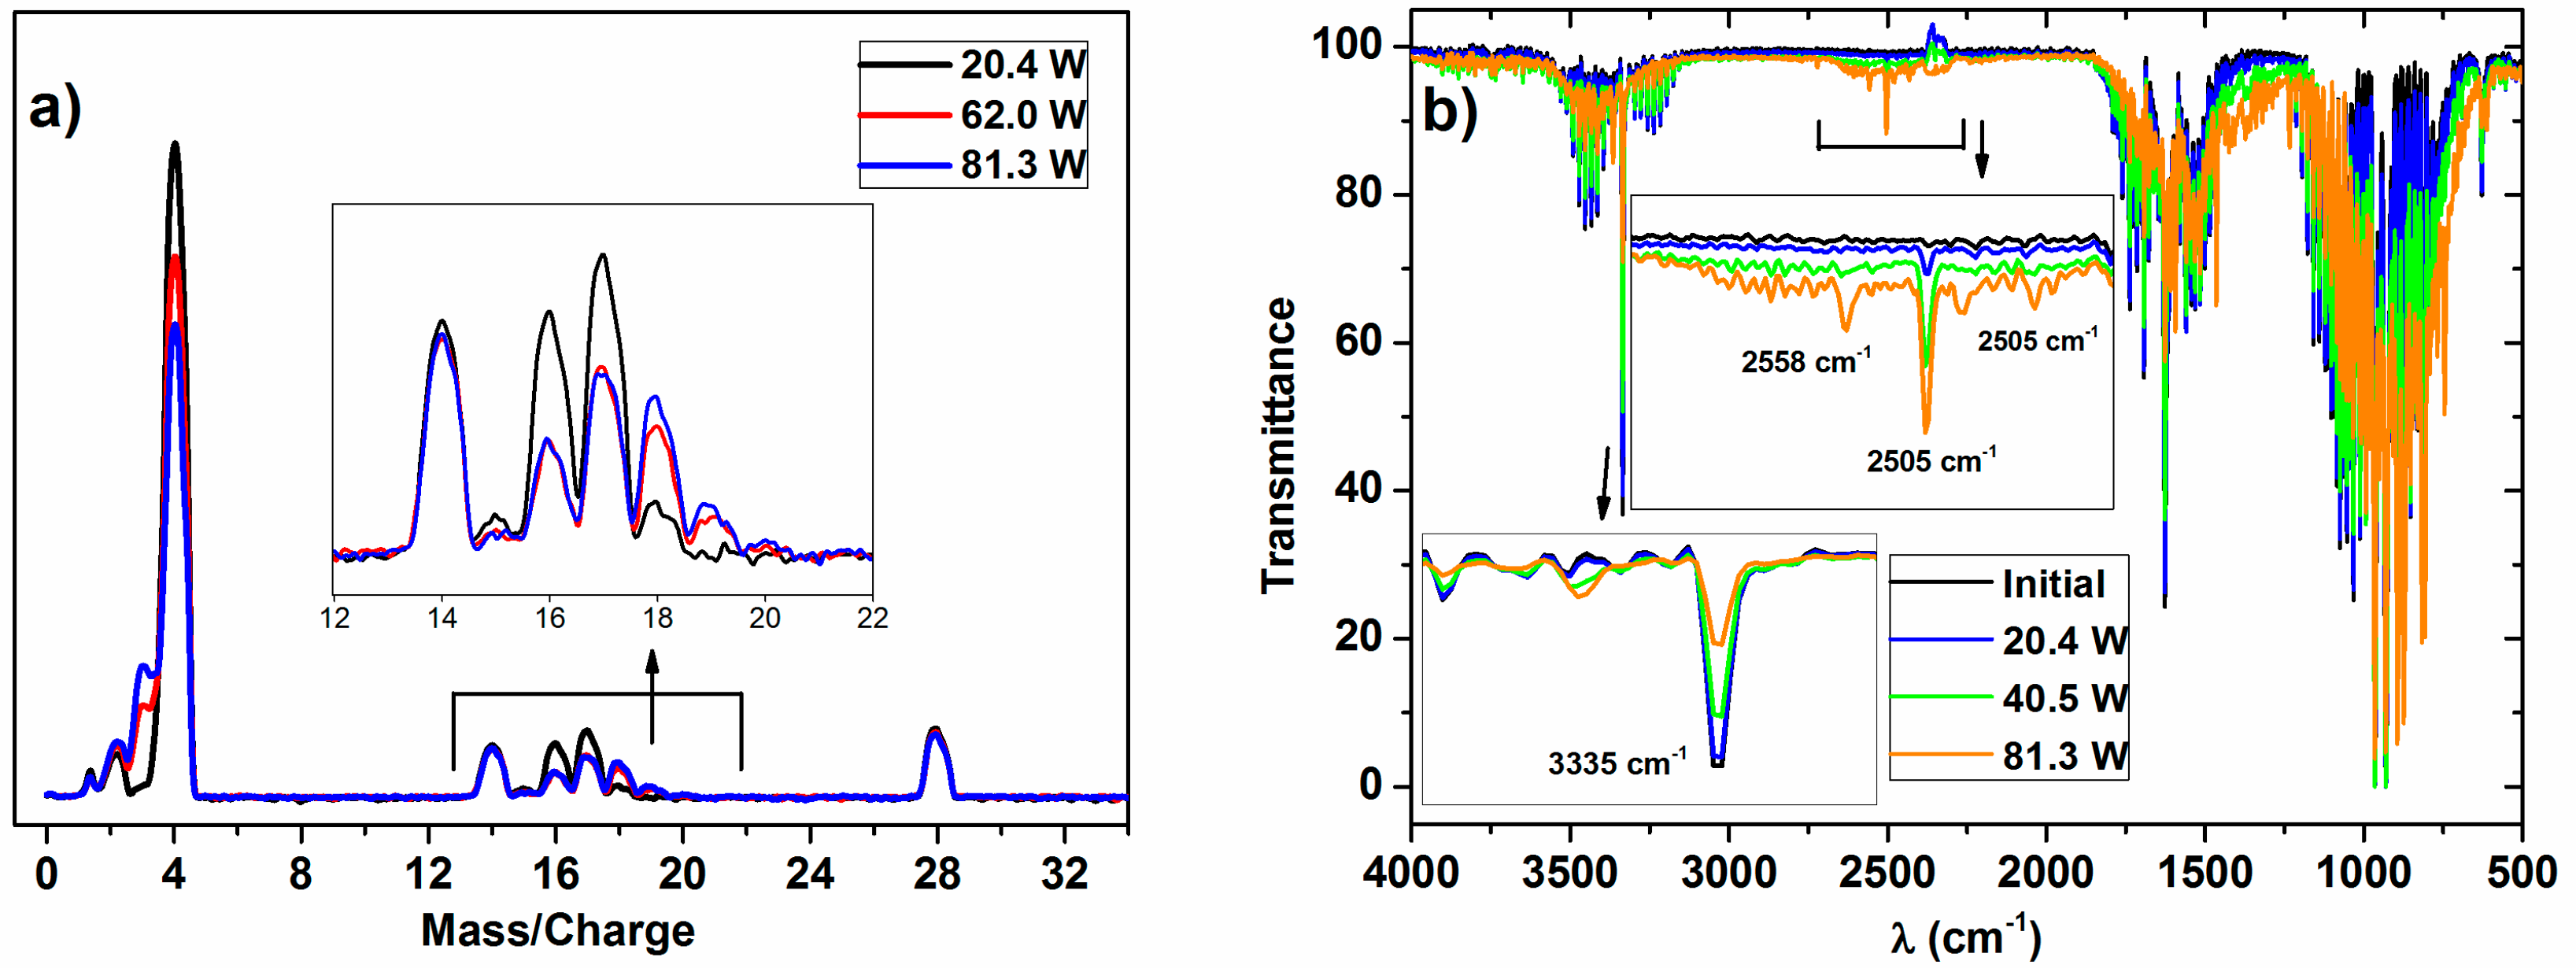
The typical MS and IR spectra of the outlet gases after the plasma activation of the NH3/D2/N2 mixture for three power values is shown in Figure 1.
These MS spectra clearly show changes in the relative height of the peaks for the range of m/z values 0–4 (i.e., hydrogen–deuterium zone) and 13–20 (water and ammonia zones), which must be attributed to a progressively higher isotope exchange of H by D atoms at increasing powers. In concrete, the mass spectra reveal a clear increase of peaks at m/z = 3, attributable to HD, and others at m/z = 18 and 19, which must be attributed to NDH2 and ND2H (the fragmented ions are reported in Table 1). A minor contribution at m/z = 20, due to ND3 molecules, could also be found in the spectra of the mixture activated with the maximum power. Meanwhile, a decrease in the intensity of the m/z = 17 peak indicates a parallel decrease in the NH3 concentration in the outlet gases. In this set of experiments, no significant intensity change could be detected for the m/z = 28 (and m/z = 14) peak because of N2, a behavior indicating that the concentration of nitrogen remains constant, and that, therefore, practically no new ammonia (i.e., including all of the labelled NDxHy molecules) is formed according to Reaction (1) during plasma activation.
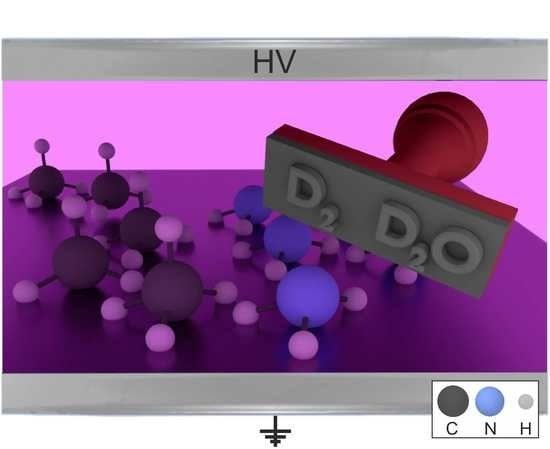
A first account of the isotope labelling experiments for the wet reforming reaction was reported by the authors of [3], for a process that complied with the following stoichiometry:
Methane + Water → Carbon Monoxide + 3 Hydrogen,
The outlet gases consisted of unreacted methane and water, carbon monoxide, and hydrogen. A conversion up to 50% of the initial methane flow was achieved under maximum operating power conditions (i.e., for 100 molecules of methane in the inlet mixture, there would be 50 molecules in of CO and 50 of methane in the outlet gas mixture). For the isotope labelling experiments, conventional water (i.e., H2O) was substituted by deuterated water (D2O). For this reaction, the MS reported in the literature [3] showed the appearance of m/z peaks, due to H2 + D2 + HD (as hydrogen), CH4 + CH3D + CH2D2 (as methane), and D2O + DHO + H2O (as water).
A quantitative evaluation of the percentages of the labelled molecules (i.e., incorporating D in their structure) in ammonia and hydrogen (Reaction (1)), and in hydrogen, methane, and water (Reaction (2)) are possible from the intensity of the MS peaks, taking into account the contributions to a particular peak of the molecular and molecular fragmented ions with this mass to charge (m/z) ratio. A summary of the different contributions to each particular m/z peak is reported in Table 1. The contributions of the doubly ionized species are disregarded in our analysis because of their very low probability. A quantitative evaluation of the percentage of labelled molecules can be made discounting the intensity of the residual masses always present in the MS analysis chamber (e.g., due to residual hydrogen, water, and hydrocarbons, an example of this can be seen in the Supporting Information, Figure S1) and also that of ionized molecular fragments with contributions that can be taken from fragmentation pattern libraries [22]. For example, to estimate the relative amount of NDH2 in the outlet mixture, we proceed by assuming that I (m/z = 18) = I (H2O+) + I (ND2+) + I (NDH2+), where I (H2O+) is the intensity due to the residual water and is determined when measuring the spectrum of the initial mixture before switching on the plasma (see Figure S1), and I (ND2+) is determined from the intensity of the ND2H+ (m/z = 19) and ND3+ (m/z = 20) peaks and their reported fragmentation patterns [21]. The results using this quantification procedure for the two investigated reactions will be presented in the next section.
For the investigated ammonia reaction, the evaluation of the isotope exchange was confirmed by the data retrieved from the IR spectra. A rough evaluation of the series of spectra in Figure 1b indicates that the intensity profile of the vibrational/rotational band systems in the regions 3600–3100 cm−1, 1800–1300 cm−1, and 1250–700 cm−1 is characteristic of NH3 (a typical spectrum of NH3 gas is reported in the supported information, in Figure S2), and varies and becomes progressively shifted to lower wave numbers as the plasma power increases. In addition, a series of new little bands appear in the region of 2740–2400 cm−1. This progressive shift and the appearance of new bands agree with the progressive formation of ND2H and NDH2 (and traces of ND3 at the highest power), substituting the NH3 molecules (note that the overall amount of ammonia remained invariable). This qualitative assessment of the spectral evolution and attribution of the bands coincides with the reported analysis of the IR spectra of NH3, NH2D, NHD2, and ND3 in the gas phase [23,24,25]. After a careful evaluation of these series of spectra, we could identify some specific bands that can be associated with NH3 (3335 cm−1), NH2D (2505 cm−1), NHD2 (2558 cm−1), and ND3 (2420 cm−1), which have been used to confirm the isotopic exchange deduced by the mass spectrometry analysis of the plasma activated mixture. However, as the extinction coefficient for each particular band is not easily accessible, the results will be semiquantitative and will be used just to confirm the tendencies deduced by MS.

2.2. Evaluation of Inefficient Reaction Events

The plasma induced reactions are triggered by the interaction of the plasma electrons with the gas molecules, giving rise to a series of activated intermediate species, radicals, and ions, which, through the intervention of a series of intermediate reactions, will eventually give rise to the product molecules of Reactions (1) and (2) detected in the outlet mixture. It is noteworthy that such intermediate reactions may involve not only “reactants”, but also “products” molecules if they are present in the reaction medium. In the course of the DBD plasma processes, energy is wasted whenever these intermediate reactions do not give rise to “products” molecules. The use of labelled reactants tries to monitor the occurrence of the intermediate processes that are ineffective in producing “product” molecules. Some examples illustrating this type of inefficient intermediate reactions are as follows:
Reaction (1)
NH3 + e → NH* + 2H* + e
NH* + D2 → NHD* + D*
NHD* + D2NHD2 + D*
where one NH3 molecule is being transformed into one NHD2 molecule (or another indistinguishable NH3 molecule when using H2 instead of D2) after three intermediate reactions, a set of processes that from the point of view of the reaction yield do not contribute to increasing the ammonia production (although it spends a considerable amount of the energy associated to plasma electrons). We must stress that in DBD process, particularly if they involve the use of catalysts, the intermediate reactions not involving electrons may take place either in the plasma phase or on the surface of the interelectrode pellets used to moderate the discharge (see reference [11], where we suggest this possibility for the synthesis of ammonia).
Reaction (2)
D2O+ e → DO* + D* + e
CH4 + D* → CH3D + H*
or alternatively
CH4 + e → CH3* + H* + e
CH3* + e → CH2* + H* + e
CH2* + D* → CH2D*
CH2D* + D* → CH2D2
or
CH3* + D* → CH3D
In this case, the energy of the electrons would be spent in dissociating the water or the methane used as reactants and, through a series of intermediate reactions, in creating intermediate species that react to form new CHxDy molecules without giving rise to hydrogen and CO as reaction products (Reaction (2)).
Some of the intermediate species quoted above in the examples of the intermediate reactions for Reactions (1) and (2) (e.g., H*, HO*, or NH*), have been effectively detected by optical emission spectroscopy during these reactions [9,11,26].
One of the purposes of the present study using labelled reactants is to develop a methodology to semi-quantitatively assess the occurrence of intermediate reactions. For this end, we will proceed in the following two steps: (i) determine the percentual distribution of the distinct labelled molecules of a given compound (e.g., the percentage of CH4, CDH3, and CD2H2) in the outlet gases for each experimental condition, (ii) approach the relative number of exchange processes that take place in each experiment. For step (i), we used the evaluation procedure based on the m/z peak intensities described in Section 2.1. For step (ii), we proceed as follows: we defined a relative number of reaction events (REs) for each compound as the sum of the percentage of a given isotopically marked molecule, multiplied by the number of exchanged isotope atoms, corrected by the flow ratio of this particular molecule in the outlet flow (note that in the case of the wet reforming Reaction (2), the total outlet flow increases with respect to the inlet). For example, the REs for methane (i.e., including all forms of isotopically labelled molecules) will be determined as follows:
REmethane = [%CDH3 + %CD2H2 × 2 + %CD3H × 3] × [partial flow of methane/total outlet flow],
where, for example, %CD3H3 is the percentage of this labelled molecule, referred to the total number of methane molecules. In this case, it is multiplied by three, because three H atoms in a parent CH4 reactant molecule have been substituted by D. A similar argument holds for the other isotopically exchanged molecules.
Similarly, specific RE numbers can be defined for a specific isotopic molecular form. For example, for CD3H we will have the following:
RECD3H = [%CD3Hx3] × [partial flow of CD3H/total outlet flow],
Similar definitions of REs can be applied to the other labelled molecules (e.g., CD2H2) detected for Reaction (2) and for the ammonia Reaction (1), although, in this case, the inlet and outlet flows are the same, as there is practically no net formation or decomposition of ammonia.
Similar relative numbers of the exchange reaction events can be determined for water (REwater) and hydrogen (REhydrogen), and for their specific labelled molecules. For a given reaction, the total number of exchange reaction events (TRE) can be then calculated as the sum of all REs. We will make the assumption that TRE is as an indication of the number inefficient intermediate reactions occurring during the plasma process and, therefore, of the amount of energy wasted in the overall DBD plasma process. This assumption is somehow arbitrary and clearly underestimates the actual number of inefficient intermediate processes taking place to yield a given labelled molecule. This is so, because the RE and TRE numbers defined as in Reactions (3) or (4) do not take into account all of the possible intermediate processes contributing to isotope exchange reactions, see, for example, the intermediate reactions shown as the examples in “Reaction (2)” above. Moreover, these definitions of RE and TRE do not take into account the intermediate reactions involving either H2 or H* atoms that are present in the system, and therefore do not give rise to isotopically exchanged molecules in the final isotopic molecular mixture.
In the following sections, we will determine the REs and TREs for Reactions (1) and (2) as a function of the power consumption, and discuss the evolution found in these parameters as a way to semi-quantitatively estimate the energy ratio wasted in the intermediate reactions, which are inefficient to render product molecules from the reactant molecules. These considerations rely on the assumption that elementary reaction rates are not significantly affected by the type of isotope bonded to the excited molecules. In reality, in conventional low pressure plasma, the rate of elementary reactions can be little affected by the type of isotope [27]. However, in atmospheric pressure, non-equilibrium plasmas excited with high AC voltages at relatively low frequency (i.e., conditions utilized in DBD discharges) energy are mainly used to induce very high electron temperatures and high vibrational temperatures [28], where the effect of the isotope mass will be negligible and therefore the above hypothesis is fully justified.

2.3. Ammonia Synthesis: Intermediate Exchange Reactions

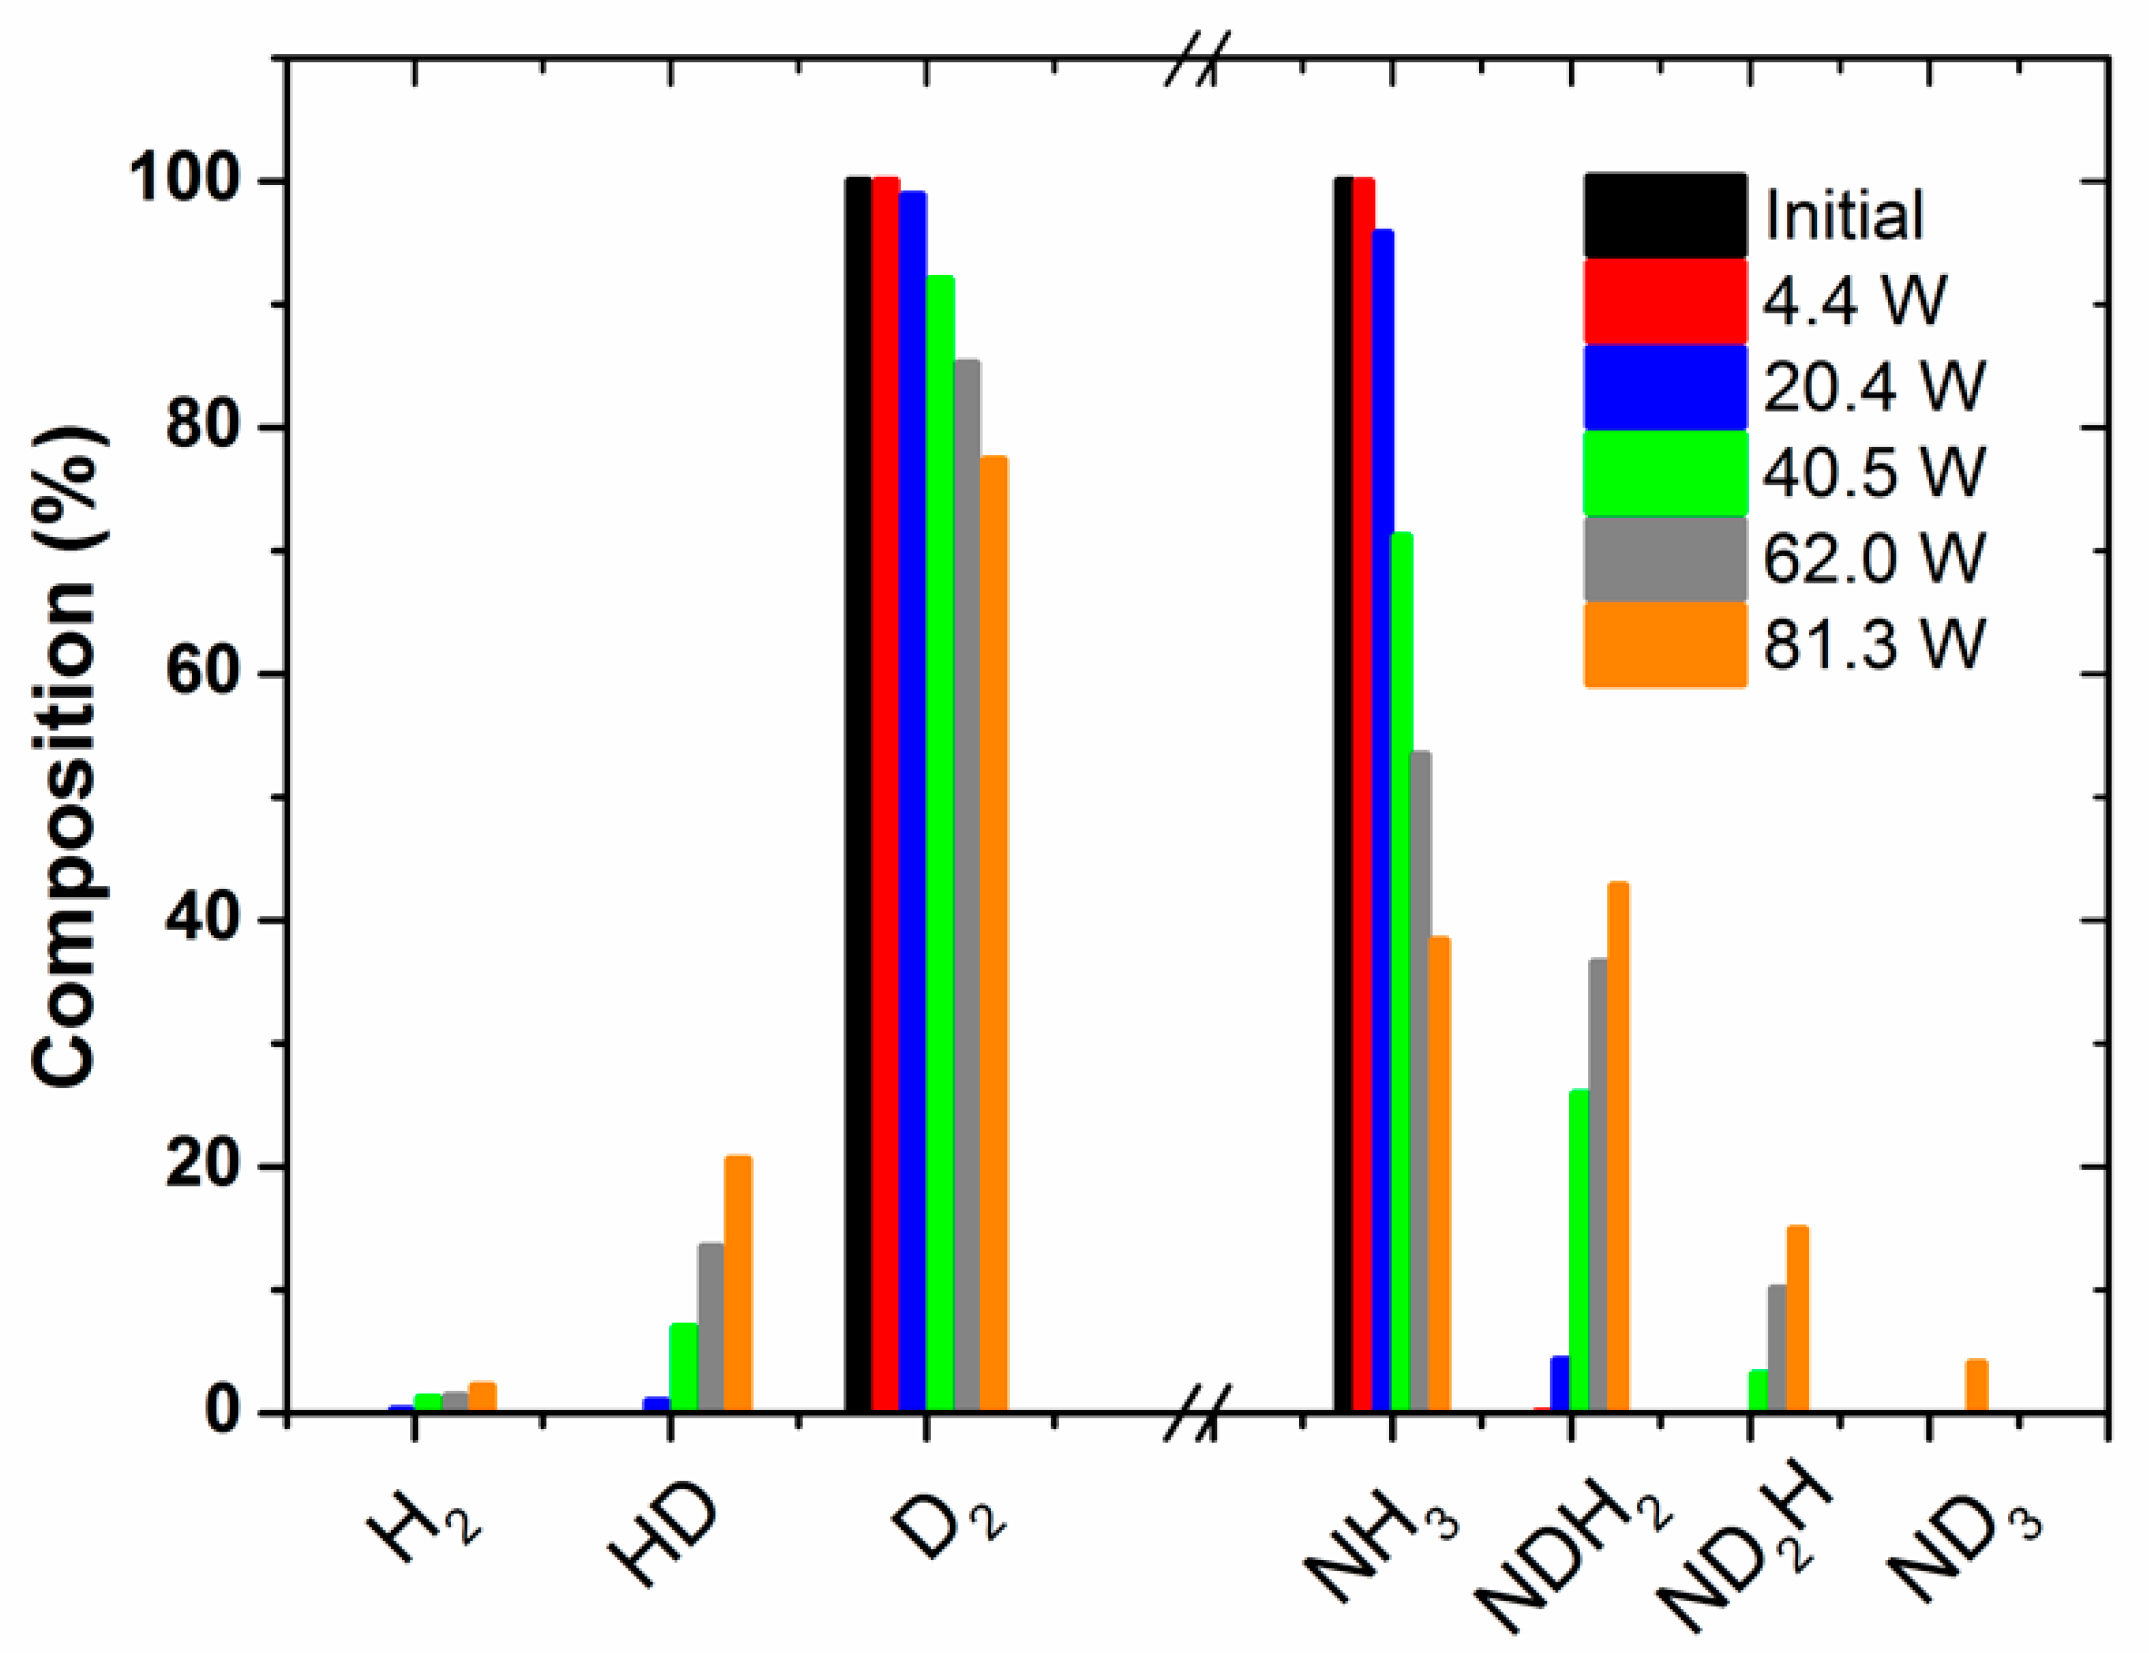
Figure 2 shows the percentages of the isotopic labelled species produced as a function of the applied power. These percentages have been estimated by the analysis of the MS spectra in Figure 1a, recorded at increasingly higher powers. This plot clearly shows that the percentage of NDH2 and ND2H molecules relatively increases with the power. Simultaneously, the percentages of HD and, to a lesser extent, H2 also increase with this parameter. A similar tendency was obtained by evaluating the evolution of the absorbance intensity of the specific IR bands attributed to the different ammonia species (see Figure S3 in the Supporting Information). This evaluation has only a semi-quantitative character, because the absorption coefficient of each band should be taken into account for quantification. As practically no change in the amount of ammonia (i.e., including all forms of labelled ammonia molecules) occurs during this series of experiments (as already mentioned, for the selected nitrogen/hydrogen/ammonia mixture, ammonia molecules are formed and decomposed at equivalent rates), we must assume that all of the energy applied to the reactor is used in inducing intermediate REs that are inefficient from the point of view of the ammonia synthesis.
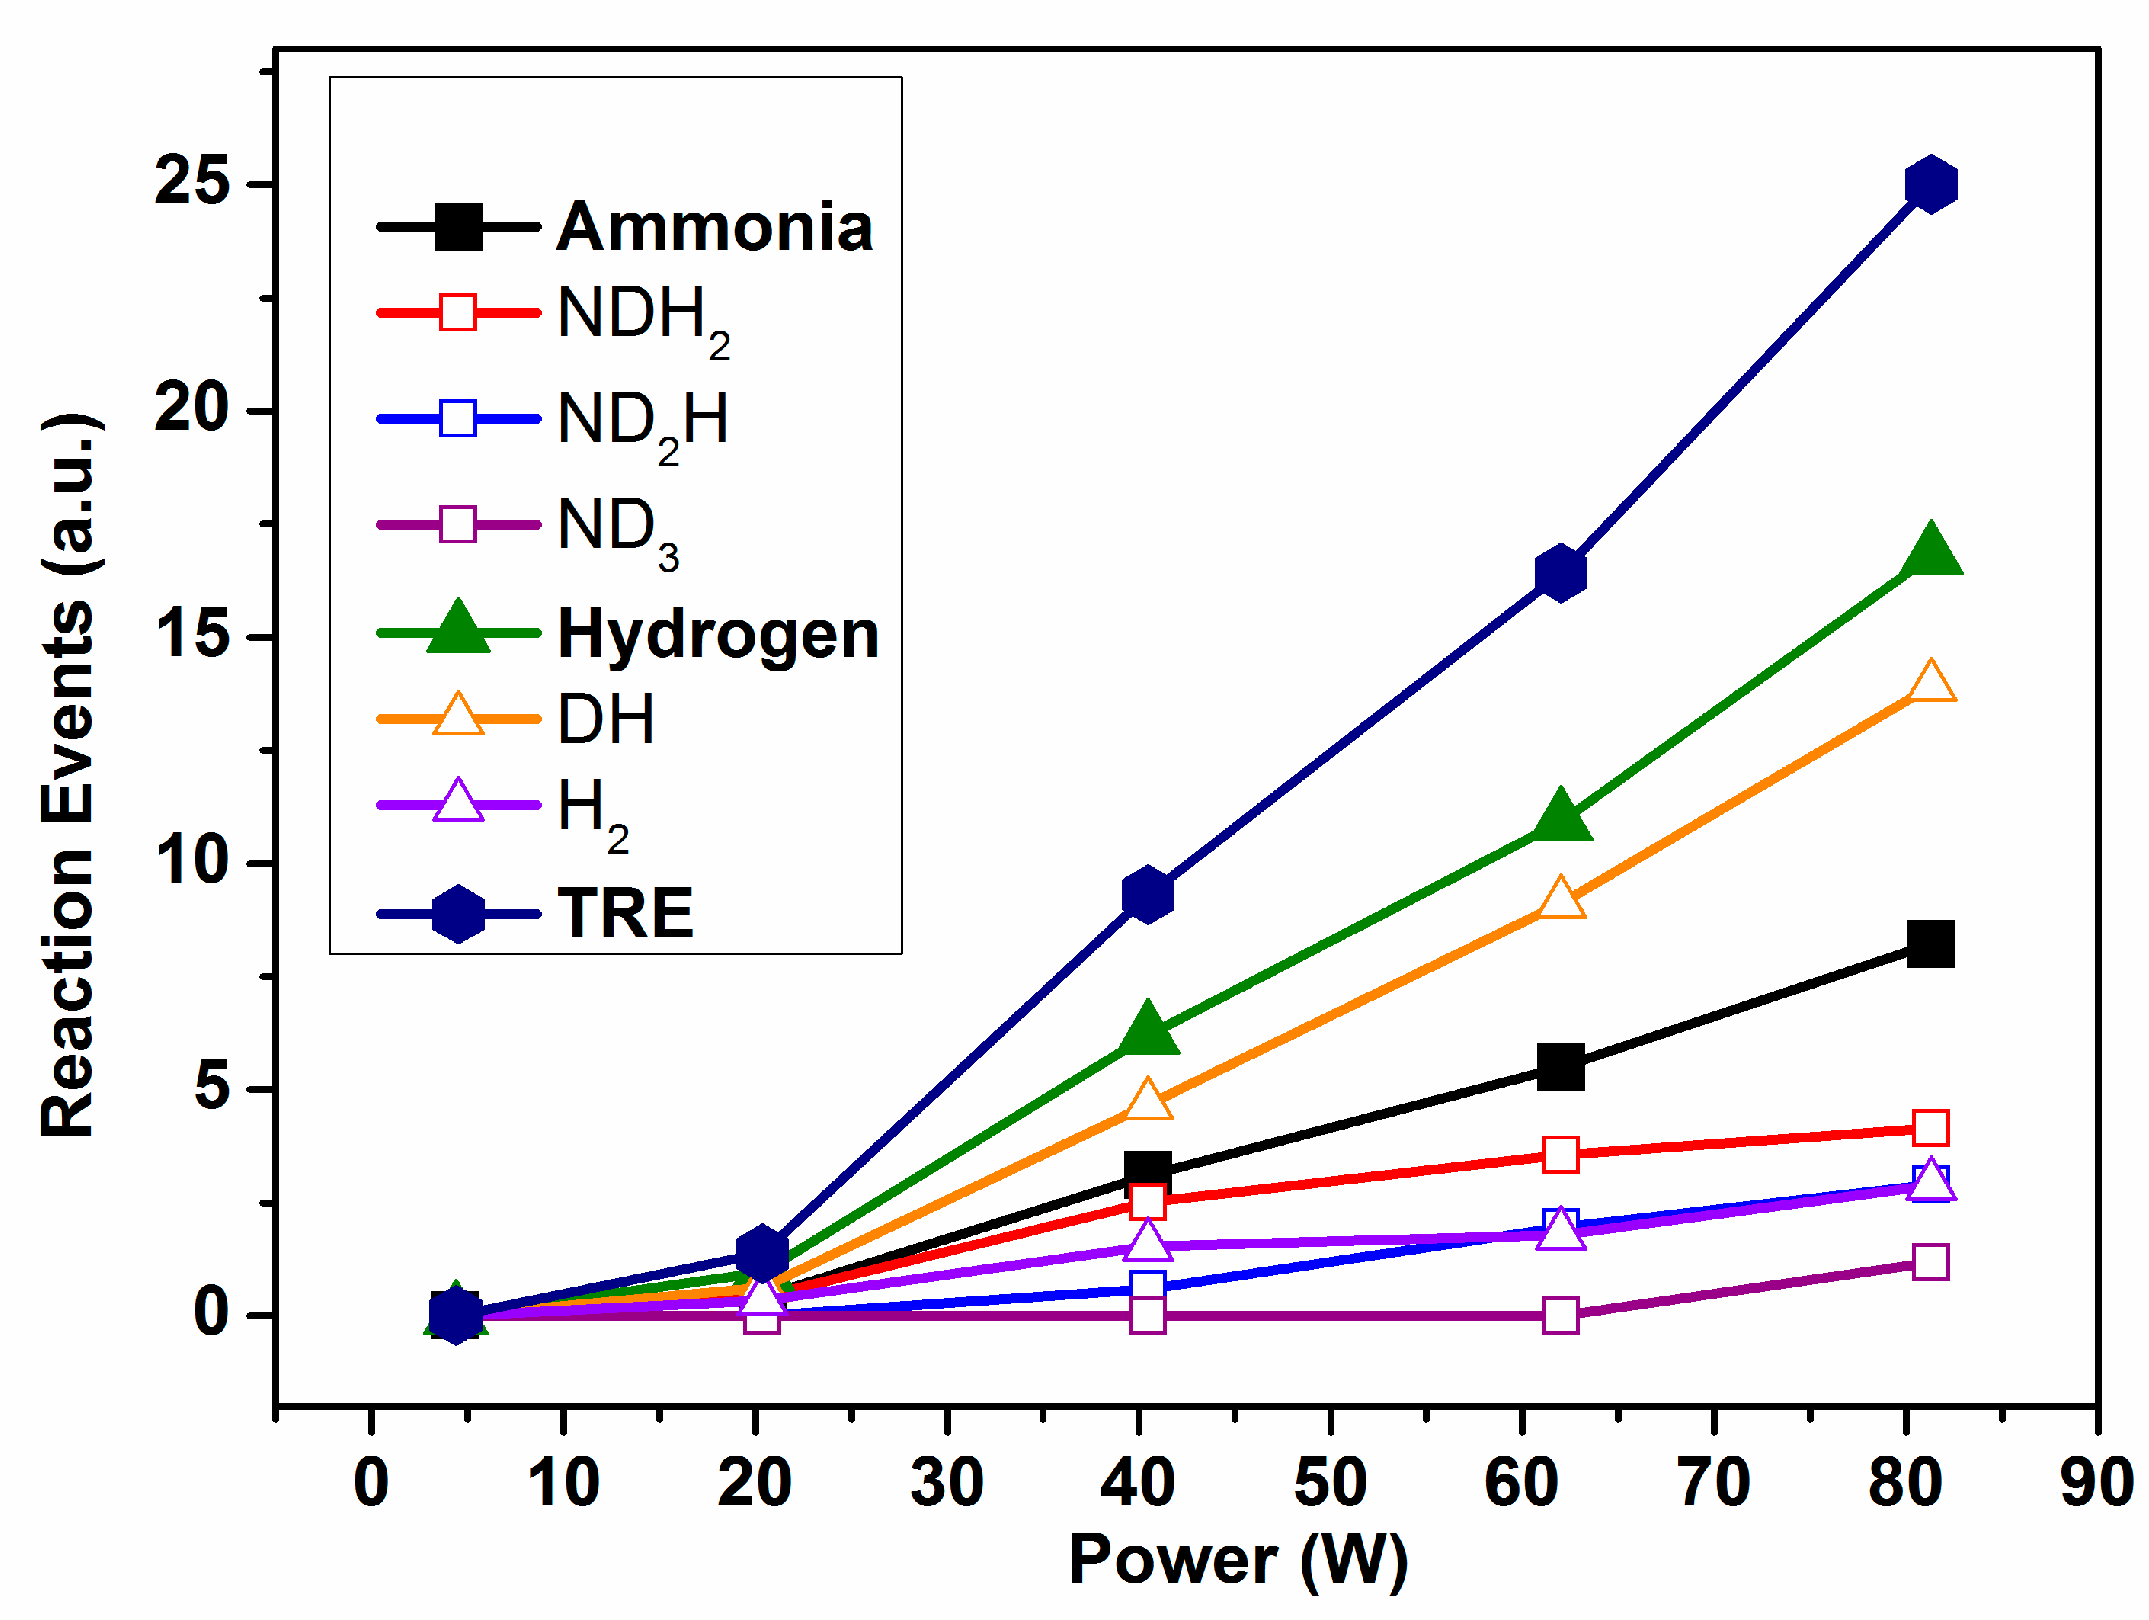
Figure 3 shows the evolution of the individual REs and TRE calculated for Reaction (1). It is apparent in these plots that, for a power higher than 20 W, the RE values for the ammonia and hydrogen species increase with power in a rather lineal way. The final result is that the TRE values present a continuously increasing tendency when the applied power increases. A translation of this evidence for a real process aiming at the synthesis of ammonia from a binary mixture N2/H2 (Reaction (1)) is that although increasing the power could contribute to an increase in the ammonia yield by promoting the direct reaction between nitrogen and hydrogen, this increase would likely be damped by the progressive waste of energy involved in promoting an increasingly higher number of intermediate reaction events, as evidenced in Figure 3. An obvious conclusion of this evidence is that in order to increase the ammonia production and decrease the energy consumption, it would be required to change other reaction parameters and/or to modify the design and operational mode of the reactor.

2.4. Wet Reforming of Methane: Intermediate Exchange Reactions and Reaction Efficiency

The percentages of the different molecules detected by MS were reported in the literature [3], together with the percentage of methane transformed into carbon monoxide and hydrogen in each case (percentages of converted methane through Reaction (2) were 11%, 21%, and 50% for the three applied plasma powers). 
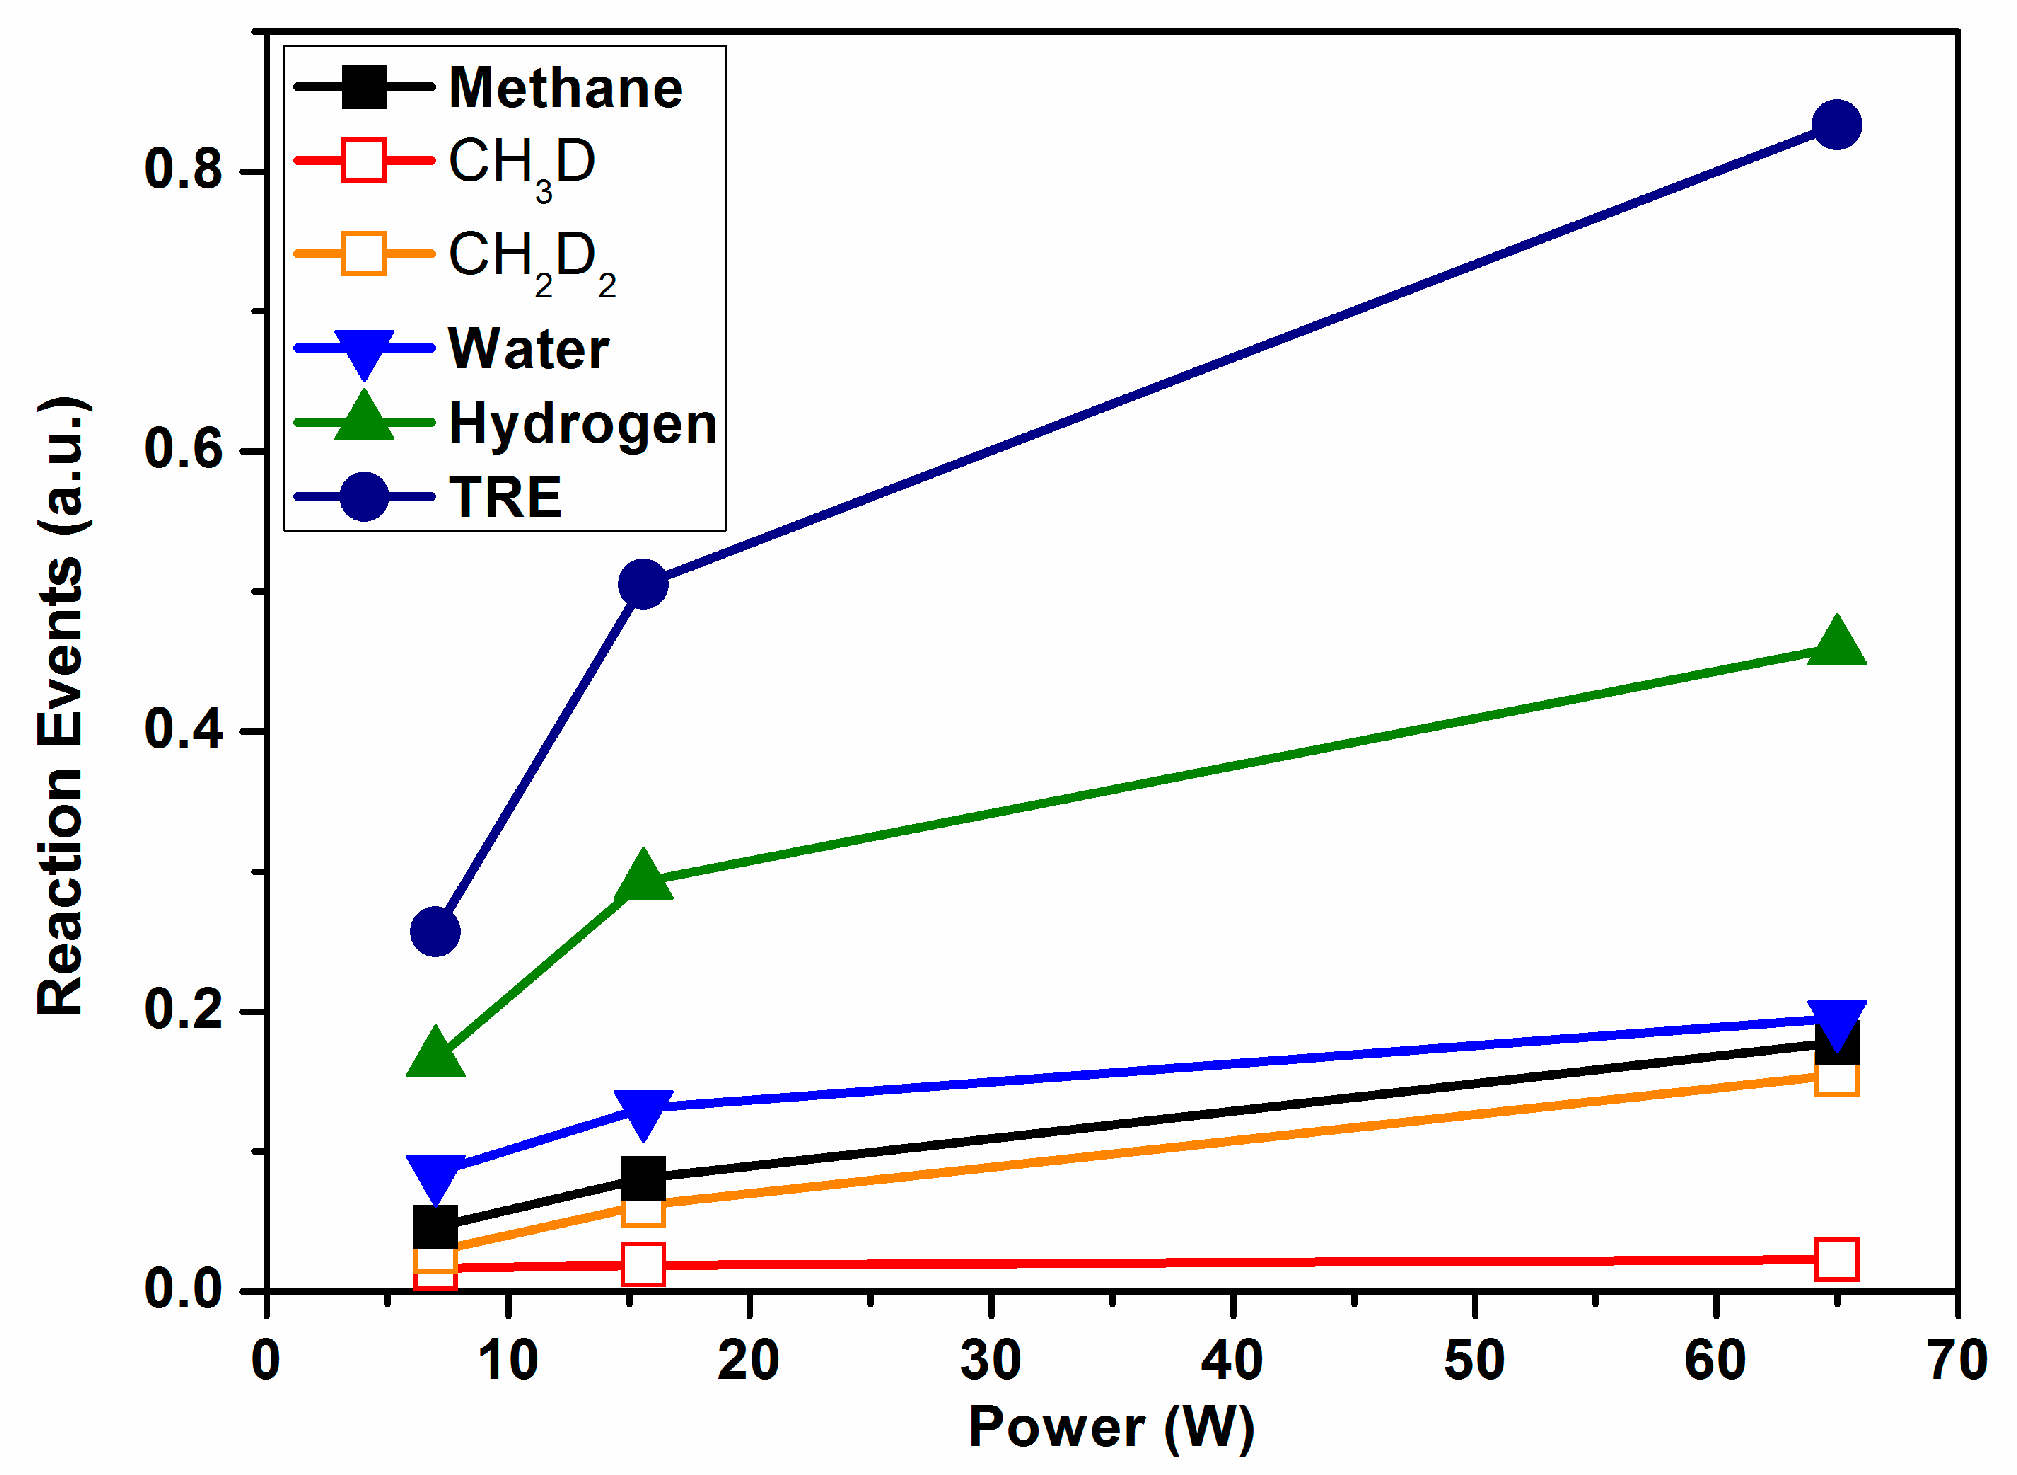
Figure 4 shows the REs for methane (summing their two labelled variants, also presented in this plot), water (sum of HDO and H2O), and hydrogen (sum of HD and D2), and the total value of TRE as a function of power consumption. The TRE depicts an increasing evolution with power that reveals a progressive increase in the number of inefficient events with this parameter. However, unlike the rather lineal evolution of the TRE reported for ammonia in Figure 3, the evolution of TRE in Figure 4 is characterized by a decreasing slope with power, indicating a certain saturation of the isotopic exchange probability. This tendency suggests that increasing the power may increase the reaction yield, as the number of REs does not progress lineally with it. In agreement with this, a reaction yield of 50% was found for the highest power applied in this experiment [3]. Another interesting feature deduced from Figure 4 is that, independently of the applied power, the number of events involved in the formation of CH2D2 is much higher than that rendering CH3D. Tentatively, we associated this difference to the known relatively higher stability of CH3* radicals [29] and its smaller tendency to saturate the carbon bonds more than other reactive species such as CH2* (in other words, the intermediate reaction CH3* + D* → CH3D would have a much lower cross section probability than CH2* + D* → CH2D*). This isotope labelling result agrees with the current mechanistic models of the wet reforming reaction [30].

3. Materials and Methods

Experiments have been carried out in a parallel plate DBD reactor made of stainless steel, which incorporates two electrodes of the same material, and 7.6 cm of diameter separated by a distance of 10 mm (i.e., gap between electrodes) in the case of the NH3/D2/N2 mixture, and 3 mm for the wet reforming of methane. The bottom electrode was grounded while the top electrode was supplied with a high AC voltage at frequencies in the range of the kHz. The space separating the electrodes was filled with pellets of PZT (lead zirconate titanate). A more detailed description of the reactor and the electrical supply can be found in our previous works [3,9,11]. A scheme of the experimental set-up is reported in the Supporting Information (Figure S4).
The gases entered the reactor through the center of the bottom electrode thanks to a small grid with a 1 cm diameter communicating the gas inlet tubes and the discharge zone. The reactants were dosed by mass flow controllers and for D2O with an automatic syringe. The D2 and D2O were supplied by Air Liquide (Alphagaz, Paris, France) and Sigma-Aldrich (St. Louis, MI, USA), respectively. The following mass flows were used for the experiments, as follows:
Ammonia reaction: NH3 3.7 cm3·min−1, N2 8.6 cm3·min−1, D2 25.8 cm3·min−1
Wet reforming of methane: CH4 4.8 cm3·min−1; D2O 9 cm3·min−1
The reactor was kept at 130 °C for the wet reforming reaction in order to avoid any condensation of liquid water. For the NH3/D2/N2 mixture, initially, at room temperature, the reactor walls naturally reached a temperature around 60 °C after two hours of operation (i.e., at the steady state, when an analysis of the outlet mixture was carried out). Under these operating conditions, and for a given experiment, we can neglect any significant influence of temperature changes on process efficiency, as the DBD processes reported were carried out at quite different values of this parameter [31].
The outlet gas mixture was analyzed with a mass spectrometer (Sensorlab, Prima Plus−Pfeiffer Vacuum, Asslar, Germany). Samples of the outlet gases were dosed into the mass spectrometer through a leak valve and a capillary tube to avoid any preferential enrichment of some species with respect to others (see Supporting Information, Figure S4). In the case that several molecules or fragments contribute to a given m/z peak, their particular contributions were estimated from the reported fragmentation patterns of the different molecular species [22].
In the case of the ammonia reaction, the mass spectrometry data were complemented by the infrared (IR) analysis of the outlet gases in an Agilent Cary 630 FTIR Spectrometer located in series with the outlet flow of the gases. The IR spectra were recorded in the region between 4000 and 500 cm−1, with a resolution of 1 cm−1.
In the case of the NH3/D2/N2 mixture, the reactor was operated with a squared AC signal at a frequency of 5 kHz, and a width of 80 µs in the positive side and 120 µs in the negative (see Figure S5 in the Supporting Information). The maximum to minimum voltage difference was varied between 3.5 and 7.9 kV, rendering powers values of 4.4, 20.4, 40.5, 62.0, and 81.3 W, as determined from the corresponding Lissajous plots.
For the wet reforming reaction, the system was operated in the conventional AC mode using frequencies of 0.4, 1, and 5 kHz, and voltages of 2.9, 2.5, and 2.6 kV in the sinusoidal mode. The power consumptions were 7.0, 15.6, and 65.0 W.
The determination of the power consumption of the discharge was carried out by analyzing the Lissajous curves recorded with an oscilloscope, according to a procedure previously described [3,9,10]. The experiments were carried out at increasing currents, keeping (i) the voltage for the wet reforming of methane and (ii) the frequency (and the others mentioned characteristics of the pulse) for the NH3/D2/N2 mixture approximately constant. The plot of the Lissajous curves obtained in the latter case for the different powers applied to the reactor is presented in Figure 5. Their shape is quite similar to that recorded when operating the reactor with a mixture N2 + H2, thus indicating that the two reaction mixtures behave similarly. Unlike the oval shape of the Lissajous curve obtained when operating the reactor in the conventional AC sinusoidal mode [12] used for the wet reforming reaction [3], the square shape of the Lissajous curves in Figure 5 is consistent with the fact that we are operating the reactor with a squared AC voltage in a packed bed reactor. Furthermore, the non-centered Lissajous figure is in agreement with the asymmetric squared signal.

4. Conclusions

In this work, we present a systematic description of the isotope labelling technique to study plasma reactions. We show that elementary reactions, otherwise not accessible by the analysis of products, can be brought into the scene using this labelling technique, which provides a semi-quantitative procedure to estimate its occurrence as a function of applied power. Using MS data as a basis for the analysis, we introduced the concept of an inefficient reaction event and proposed a way of assessing the value of this parameter for each reactant and labelled molecule. The obtained values are quite relevant regarding the energy efficiency of the DBD reactions, and reveal that a considerable part of the energy is wasted in inducing events that do not give rise to the desired reaction products. This is firstly proved for a ternary gas mixture of ammonia, deuterium, and nitrogen, with which all of the energy was consumed in isotope exchange reaction events without any net production of new ammonia molecules. A similar analysis for the wet reforming of methane using deuterated water as a reactant yields a similar result, although the progression towards the formation of carbon monoxide and hydrogen as final products was more favorable that in the case of the ammonia reaction. The differences in the slopes of the plots representing the calculated numbers of the reaction events as a function of the applied power can be taken as a hint to predict the possibility of modifying the reaction yield, applying more power to the reactor. For the ternary mixture, the found linear evolution of the number of the total reaction events with applied power precludes that the reaction yield could increase with the applied power. This is not the case for the methane reforming reaction, and the methane conversion may increase up to 50% at the maximum power.

Supplementary Materials

The following are available online at https://www.mdpi.com/2073-4344/9/1/45/s1, Figures S1–S5. Figure S1: MS spectra (zone m/z from 13 to 20) taken for the ternary mixture N2+D2+NH3 before (black line) and after (red line) switching on the plasma. The residual intensity at m/z = 18 is due to the residual water always present in the MS chambers. After application of plasma there is a change in the relative intensities of m/z peaks at 16, 17, 18 and 19, while the m/z peak at 14 remains constant. These changes are attributed to isotope exchange processes affecting to some of the initially detected NH3 molecules that become transformed into NH2D, NHD2 and ND3 (see the text); Figure S2: FTIR spectra recorded for binary N2+D2 (black line) and ternary N2+D2+NH3 (red line) mixtures before plasma ignition. This analysis disregards the presence of water in the reactor chamber, since the zone 1300–2000 cm−1 only presents bands for the ternary mixture, which correspond to NH3; Figure S3. Evolution of the intensity of the IR absorption bands attributed to different ammonia species during isotope labelling processes induced by DBD plasma; Figure S4: Scheme of the experimental set-up. A more detailed description of the reactor and the electrical supply can be found in our previous works. Outlet gas flow is represented with the point line; Figure S5: Squared AC curves for the different maximum to minimum voltage difference (3.5, 6.7, 8.7, 8.7 and 7.9 kV) and power (4.4, 20.4, 40.5, 62.0 and 81.3 W) in the case of the NH3/D2/N2 mixture. Squared signals are expected to provide a higher efficiency that sinusoidal ones due to their higher Vrms value.

Author Contributions

The experimental part was conducted by P.N. and J.M.O.-P.; the bibliographic support and definition of the methodology of analysis was provided by J.C.; and the concept definition, discussion of results, and proposal of methodology and manuscript writing was done by A.G.-R. and A.R.G.-E.

Acknowledgments

The authors thank the European Regional Development Funds program (EU-FEDER) and the MINECO-AEI (201560E055 and MAT2016-79866-R and network MAT2015-69035-REDC) for financial support.

Conflicts of Interest

The authors declare no conflict of interest.

References

  1. Tu, X.; Whitehead, J.C. Plasma-catalytic dry reforming of methane in an atmospheric dielectric barrier discharge: Understanding the synergistic effect at low temperature. Appl. Catal. B Environ. 2012, 125, 439–448. [Google Scholar] [CrossRef]
  2. Wang, W.; Snoeckx, R.; Zhang, X.; Cha, M.S.; Bogaerts, A. Modeling plasma-based CO2 and CH4 conversion in mixtures with N2, O2, and H2O: The bigger plasma chemistry picture. J. Phys. Chem. C 2018, 122, 8704–8723. [Google Scholar] [CrossRef]
  3. Montoro-Damas, A.M.; Gómez-Ramírez, A.; Gonzalez-Elipe, A.R.; Cotrino, J. Isotope labelling to study molecular fragmentation during the dielectric barrier discharge wet reforming of methane. J. Power Sources 2016, 325, 501–505. [Google Scholar] [CrossRef]
  4. Kim, H.-H. Nonthermal plasma processing for air-pollution control: A historical review, current issues, and future prospects. Plasma Process. Polym. 2004, 1, 91–110. [Google Scholar] [CrossRef]
  5. Gómez-Ramírez, A.; Montoro-Damas, A.M.; Rodríguez, M.A.; González-Elipe, A.R.; Cotrino, J. Improving the pollutant removal efficiency of packed-bed plasma reactors incorporating ferroelectric components. Chem. Eng. J. 2017, 314, 311–319. [Google Scholar]
  6. Dobslaw, D.; Schulz, A.; Helbich, S.; Dobslaw, C.; Engesser, K.-H. VOC removal and odor abatement by a low-cost plasma enhanced biotrickling filter process. J. Environ. Chem. Eng. 2017, 5, 5501–5511. [Google Scholar] [CrossRef]
  7. Peng, P.; Chen, P.; Schiappacasse, C.; Zhou, N.; Anderson, E.; Chen, D.; Liu, J.; Cheng, Y.; Hatzenbeller, R.; Addy, M.; et al. A review on the non-thermal plasma-assisted ammonia synthesis technologies. J. Clean. Prod. 2018, 177, 597–609. [Google Scholar] [CrossRef]
  8. Hong, J.; Aramesh, M.; Shimoni, O.; Seo, D.H.; Yick, S.; Greig, A.; Charles, C.; Prawer, S.; Murphy, A.B. Plasma catalytic synthesis of ammonia using functionalized-carbon coatings in an atmospheric-pressure non-equilibrium discharge. Plasma Chem. Plasma Process. 2016, 36, 917–940. [Google Scholar] [CrossRef]
  9. Gómez-Ramírez, A.; Montoro-Damas, A.M.; Cotrino, J.; Lambert, R.M.; González-Elipe, A.R. About the enhancement of chemical yield during the atmospheric plasma synthesis of ammonia in a ferroelectric packed bed reactor. Plasma Process. Polym. 2017, 14, 1600081. [Google Scholar] [CrossRef]
  10. Gómez-Ramírez, A.; Rico, V.J.; Cotrino, J.; González-Elipe, A.R.; Lambert, R.M. Low temperature production of formaldehyde from carbon dioxide and ethane by plasma-assisted catalysis in a ferroelectrically moderated dielectric barrier discharge reactor. ACS Catal. 2014, 4, 402–408. [Google Scholar] [CrossRef]
  11. Gómez-Ramírez, A.; Cotrino, J.; Lambert, R.M.; González-Elipe, A.R. Efficient synthesis of ammonia from N2 and H2 alone in a ferroelectric packed-bed DBD reactor. Plasma Sources Sci. Technol. 2015, 24, 065011. [Google Scholar] [CrossRef]
  12. Montoro-Damas, A.M.; Brey, J.J.; Rodríguez, M.A.; González-Elipe, A.R.; Cotrino, J. Plasma reforming of methane in a tunable ferroelectric packed-bed dielectric barrier discharge reactor. J. Power Sources 2015, 296, 268–275. [Google Scholar] [CrossRef]
  13. Wei, J.; Iglesia, E. Isotopic and kinetic assessment of the mechanism of methane reforming and decomposition reactions on supported iridium catalysts. Phys. Chem. Chem. Phys. 2004, 6, 3754. [Google Scholar] [CrossRef]
  14. Sprung, C.; Arstad, B.; Olsbye, U. Methane steam reforming over a Ni/NiAl2O4 model catalyst—Kinetics. ChemCatChem 2014, 6, 1969–1982. [Google Scholar] [CrossRef]
  15. Luo, J.Z.; Yu, Z.L.; Ng, C.F.; Au, C.T. CO2 /CH4 Reforming over Ni–La2 O3/5A: An investigation on carbon deposition and reaction steps. J. Catal. 2000, 194, 198–210. [Google Scholar] [CrossRef]
  16. Zhang, Z.; Verykios, X.E. Mechanistic aspects of carbon dioxide reforming of methane to synthesis gas over Ni catalysts. Catal. Lett. 1996, 38, 175–179. [Google Scholar] [CrossRef]
  17. Luk, L.Y.P.; Ruiz-Pernía, J.J.; Adesina, A.S.; Loveridge, E.J.; Tuñón, I.; Moliner, V.; Allemann, R.K. Chemical ligation and isotope labeling to locate dynamic effects during catalysis by dihydrofolate reductase. Angew. Chem. Int. Ed. 2015, 54, 9016–9020. [Google Scholar] [CrossRef]
  18. Daou, F.; Vincent, A.; Amouroux, J. Point and multipoint to plane barrier discharge process for removal of NOx from engine exhaust gases: Understanding of the reactional mechanism by isotopic labeling. Plasma Chem. Plasma Process. 2003, 23, 309–325. [Google Scholar] [CrossRef]
  19. Robert, S.; Francke, E.; Cavadias, S.; Gonnord, M.F.; Amouroux, J. Descomposition of acetaldehyde in air in a dielectric barrier discharge. High Temp. Mater. Process. Int. Q. High-Technol. Plasma Process. 2011, 15, 15–22. [Google Scholar] [CrossRef]
  20. Vincent, A.; Daou, F.; Santirso, E.; Moscosa, M.; Amouroux, J. Experimental and simulation study of NOx removal with a DBD wire-cylinder reactor. High Temp. Mater. Process. Int. Q. High-Technol. Plasma Process. 2003, 7, 267–275. [Google Scholar] [CrossRef]
  21. Ertl, G. Reactions at surfaces: From atoms to complexity (Nobel Lecture). Angew. Chem. Int. Ed. 2008, 47, 3524–3535. [Google Scholar] [CrossRef] [PubMed]
  22. S.E. Stein NIST Mass Spec Data Center. “Mass Spectra” in NIST Chemistry WebBook; NIST Standard Reference Database Number 69; Linstrom, P.J., Mallard, W.G., Eds.; National Institute of Standards and Technology: Gaithersburg, MD, USA, 2009.
  23. Snels, M.; Hollenstein, H.; Quack, M. The NH and ND stretching fundamentals of 14ND2H. J. Chem. Phys. 2003, 119, 7893–7902. [Google Scholar] [CrossRef]
  24. Shimanouchi, T. Tables of Molecular Vibrational Frequencies; NSRDS-NBS: Washington, DC, USA, 1972; Volume 1.
  25. Snels, M.; Fusina, L.; Hollenstein, H.; Quack, M. The v1 and v3 bands of ND3. Mol. Phys. 2000, 98, 837–854. [Google Scholar] [CrossRef]
  26. Wang, Y.-F.; Tsai, C.-H.; Chang, W.-Y.; Kuo, Y.-M. Methane steam reforming for producing hydrogen in an atmospheric-pressure microwave plasma reactor. Int. J. Hydrog. Energy 2010, 35, 135–140. [Google Scholar] [CrossRef]
  27. Ivanov, M.V.; Schinke, R. Recombination of ozone via the chaperon mechanism. J. Chem. Phys. 2006, 124, 104303. [Google Scholar] [CrossRef]
  28. Fridman, A. Plasma Chemistry; Cambridge University Press: Cambridge, UK, 2008. [Google Scholar]
  29. Sugai, H.; Kojima, H.; Ishida, A.; Toyoda, H. Spatial distribution of CH3 and CH2 radicals in a methane rf discharge. Appl. Phys. Lett. 1990, 56, 2616–2618. [Google Scholar] [CrossRef]
  30. Nozaki, T.; Fukui, W.; Okazaki, K. Reaction enhancement mechanism of the nonthermal discharge and catalyst hybrid reaction for methane reforming. Energy Fuels 2008, 22, 3600–3604. [Google Scholar] [CrossRef]
  31. Harling, A.M.; Kim, H.-H.; Futamura, S.; Whitehead, J.C. Temperature dependence of plasma−catalysis using a nonthermal, atmospheric pressure packed bed; the destruction of benzene and toluene. J. Phys. Chem. C 2007, 111, 5090–5095. [Google Scholar] [CrossRef]
Figure 1. (a) Comparison of selected mass spectra recorded for the NH3/D2/N2 mixture plasma treated at increasing powers in the dielectric barrier discharge (DBD) reactor; (b) infrared spectroscopy (IR) spectra of the outlet gases in the same experiments. The insets show an enlarge scale of the zones of bands attributed to differently labelled ammonia molecules (see text).
Catalysts 09 00045 g001
Figure 2. Percentage of isotopic labelled species detected for Reaction (1) as a function of plasma power.
Catalysts 09 00045 g002
Figure 3. Evolution of reaction events (REs) and total number of exchange reaction events (TRE) for Reaction (1) as a function of plasma power.
Catalysts 09 00045 g003
Figure 4. Evolution of REs and TRE for Reaction (2) as a function of plasma power.
Catalysts 09 00045 g004
Figure 5. Set of Lissajous curves recorded when activating the NH3/D2/N2 at increasing powers.
Catalysts 09 00045 g005
Table 1. Contribution of molecular (in bold) and fragmented ions to the different peaks (m/z) in the mass spectrometry (MS) for Reactions (1) and (2). Hydrogen is common for the two reactions.
m/z PeakSpecies
--Hydrogen
1H+
2D+, H2+
3HD+
4D2+
Ammonia 1Methane 2Water 2
12--C+--
13--CH+--
14N+CD+, CH2+--
15NH+CDH+, CH3+--
16NH2+, ND+CH4+, CD2+, CDH2+O+
17NH3+, NDH+CDH3+, CD2H+OH+
18ND2+, NDH2+CD3H+OH2+, OD+
19ND2H+CD4+3ODH+
20ND3+ OD2+
1 Reaction (1). 2 Reaction (2). 3 Negligible intensity.

