Article

Structural Evolution of Highly Active Multicomponent Catalysts for Selective Propylene Oxidation

by
Paul Sprenger
1,
Thomas L Sheppard
1,2,*,
Jussi-Petteri Suuronen
3,
Abhijeet Gaur
1,
Federico Benzi
1 and
Jan-Dierk Grunwaldt
1,2,*
1
Institute for Chemical Technology and Polymer Chemistry, Karlsruhe Institute of Technology, Engesserstraße 20, 76131 Karlsruhe, Germany
2
Institute of Catalysis Research and Technology, Karlsruhe Institute of Technology, Hermann-von-Helmholtz Platz 1, 76344 Eggenstein-Leopoldshafen, Germany
3
ESRF—The European Synchrotron, 71 Avenue des Martyrs, 38000 Grenoble, France
*
Authors to whom correspondence should be addressed.
Catalysts 2018, 8(9), 356; https://doi.org/10.3390/catal8090356
Submission received: 3 August 2018 / Revised: 23 August 2018 / Accepted: 24 August 2018 / Published: 27 August 2018
(This article belongs to the Section Catalytic Materials)

Abstract

:
Multicomponent Bi-Mo-Fe-Co oxide catalysts prepared via flame spray pyrolysis were tested for selective propylene oxidation, showing high conversion (>70%) and selectivity (>85%) for acrolein and acrylic acid at temperatures of 330 °C. During extended time-on-stream tests (5–7 days), the catalysts retained high activity while undergoing diverse structural changes. This was evident on: (a) the atomic scale, using powder X-ray diffraction, Raman spectroscopy, X-ray absorption spectroscopy, X-ray photoelectron spectroscopy, and transmission electron microscopy; and (b) the microscopic scale, using synchrotron X-ray nanotomography, including full-field holotomography, scanning X-ray fluorescence, and absorption contrast imaging. On the atomic scale, sintering, coke formation, growth, and transformation of active and spectator components were observed. On the microscopic scale, the catalyst life cycle was studied at various stages through noninvasive imaging of a ~50-µm grain with 100-nm resolution. Variation of catalyst synthesis parameters led to the formation of notably different structural compositions after reaction. Mobile bismuth species formed agglomerates of several hundred nanometres and segregated within the catalyst interior. This appeared to facilitate the formation of different active phases and induce selectivity for acrolein and acrylic acid. The combined multiscale approach here is generally applicable for deconvolution of complex catalyst systems. This is an important step to bridge model two-component catalysts with more relevant but complex multicomponent catalysts.

Graphical Abstract

1. Introduction

The selective oxidation of propylene to acrolein and acrylic acid are important reactions in the chemical industry. Acrolein is a precursor for the synthesis of amino acids and an intermediate for the two-step oxidation towards acrylic acid, an important polymer building block [1,2]. Catalysts used for this process are typically multicomponent systems based on bismuth molybdate phases [3,4,5,6]. Recent studies have shown that such bismuth molybdates are accessible through a variety of novel synthesis methods [7,8,9,10,11,12], the choice of which can exert a strong influence on catalyst activity and performance [13]. In this context, flame spray pyrolysis (FSP) has proven to be an attractive method for the synthesis of metal oxide catalysts [14,15,16]. During FSP, liquid metal precursor solutions are sprayed into a flame and exposed to temperatures up to 3000 K for a short residence time (ms-regime), resulting in the formation of small nanocrystalline metal oxide particles [15,17]. With this one-step method, Schuh et al. could directly access pure bismuth molybdates including the metastable β-Bi2Mo2O9 high-temperature phase without further calcination [11], resulting in catalysts with comparatively large surface areas (up to 45 m2 g–1), excellent propylene conversion, and acrolein selectivity. Apart from pure bismuth molybdates, multicomponent catalysts such as Bi-Mo-Co-Fe oxides generally show higher catalytic activity and are favoured for industrial applications [6]. Such catalysts consist of multiple phases which are proposed to interact in a cooperative manner [18,19]. While CoMoO4 acts as a host structure, FeMoO4/Fe2Mo3O12 redox pairs are said to facilitate the incorporation of gas phase oxygen and the subsequent transfer of lattice oxygen to bismuth molybdate phases, which oxidise propylene selectively [20,21,22]. As the working catalyst appears to depend on the good mixing of phases, FSP may offer a highly potent method for the synthesis of multicomponent bismuth-molybdate-based systems. However, such catalysts exhibit a great deal of structural complexity, with a multiphasic mixture of closely interacting species. This is particularly challenging if more detailed insights into the structure and performance are to be derived. Standardised catalyst testing must therefore be coupled with detailed characterisation of the catalyst structure through spectroscopic and microscopic analysis.
In the case of complex nanostructured Bi-Mo-Fe-Co oxide catalysts prepared by FSP, a comprehensive multimodal and multiscale approach to characterisation is required [5]. Operando methodologies [23], along with advanced spectroscopic [24] and microscopic [25] analysis, offer a wide range of possibilities for understanding catalyst complexity. For example, techniques such as Raman spectroscopy and powder X-ray diffraction (XRD) can identify bulk amorphous and crystalline phases in a complementary manner. In particular, the tuneable, monochromatic, and high-brilliance X-rays produced by synchrotron light sources make X-ray absorption spectroscopy (XAS) a powerful tool for probing local atomic and electronic structures, including metal oxidation states and coordination geometry [26,27,28]. X-ray photoelectron spectroscopy (XPS) and scanning or transmission electron microscopy (SEM/TEM) are three examples for discriminating between surface and bulk elemental composition, in the latter case with atomic-scale resolution. However, for accurate characterisation of minority or dilute phases, the classical approach with integral and complementary characterization methods fails. Hence, a spatially resolved approach is critical, especially if the catalyst composition is heterogeneous with cooperating phases, as outlined in the review by Moro-Oka and Ueda, for example [6]. Spatially resolved analysis can be achieved on the laboratory scale, for instance, by Raman spectroscopic mapping. In addition, at synchrotron light sources, the various interactions of X-rays with matter, such as absorption, fluorescence, or diffraction, can be exploited to produce images with different contrast modes. These techniques, collectively known as X-ray microscopy, are rapidly finding a foothold in catalysis research [25,29,30,31]. The high penetration of X-rays allows measurement of large samples, such as entire catalyst grains, combined with large fields of view and spatial resolution on the nm to µm scale. Furthermore, by applying computed tomography (CT) and three-dimensional (3D) image reconstruction, it is possible to retrieve chemical and structural data from the interior of catalyst bodies in a noninvasive manner [32,33,34]. Extending spatial resolution to 3D is a powerful advantage for the study of heterogeneous catalysts, which often contain delicate or fine structural features that are intimately linked to the catalyst function, as notably demonstrated for fluid catalytic cracking catalysts [35,36,37,38,39]. In principle, details such as sintering or growth of metal oxide phases, active metal distribution, and catalyst stability towards sintering and deactivation during short- and medium-term usage may all be feasibly studied using X-ray microscopy and were of interest in the current work.
This study reports the synthesis, testing, and characterisation of highly active multicomponent Bi-Mo-Fe-Co oxide catalysts for selective propylene oxidation to acrolein and acrylic acid. Flame spray pyrolysis with two different chemical precursor ratios led to highly intermixed nanocrystalline catalysts, which were characterised and tested for propylene oxidation in a fixed bed reactor. Catalyst performance was found to change in the early stages on-stream before stabilising, an observation which was apparently coupled to significant changes in catalyst structural composition. To better monitor these changes and gain insight into the structure of the catalyst, a comprehensive array of characterisation tools was applied before and after catalytic testing, including XRD, Raman spectroscopy, XAS, XPS, and TEM with energy dispersive X-ray analysis (TEM–EDX). Furthermore, synchrotron X-ray nanotomography was applied at different stages of the catalyst life cycle, allowing noninvasive imaging of an entire catalyst grain with full-field holotomography and elemental mapping of selected volumes by nanofocus X-ray fluorescence tomography (XRF–CT) and absorption contrast tomography (also known as scanning transmission X-ray microscopy (STXM–CT)). Comparing a fresh catalyst particle, a particle treated short term directly at the synchrotron radiation source, and a particle treated long term in the fixed-bed reactor setup, allowed the catalyst evolution to be addressed hierarchically from the atomic to the µm scale. We therefore offer first insights into a highly active and selective catalyst system prepared by flame spray pyrolysis, furthermore demonstrating how the deconvolution of catalyst structural complexity can be achieved using a variety of complementary spectroscopic and microscopic techniques, which are applicable to other complex mixed metal oxide systems.

2. Results and Discussion

2.1. Properties of Flame-Made Multicomponent Catalysts

FSP using precursor solutions in xylene was used to prepare four-component Bi-Mo-Co-Fe oxide catalysts. Two different catalysts were synthesized, and the Bi/Mo/Co/Fe ratios are listed in Table 1. The fresh catalysts are denoted as FSP-1F and FSP-2F and those used in the catalytic tests as FSP-1R and FSP-2R, respectively.
Elemental analysis showed that the precursor ratios applied for synthesis matched the metal content ratio found in FSP-1F and FSP-2F (Supplementary Materials (SM), Figure S1). The precursor metals were therefore completely incorporated into the catalysts, demonstrating the precise control of the resulting elemental composition with the FSP technique. Flame-made FSP-1F and FSP-2F exhibited comparatively large initial surface areas of 52 and 75 m2∙g–1, respectively. For comparison, Bi-Mo-Co-Fe oxides prepared by classical coprecipitation typically show specific surface areas of maximum 7 m2 g–1 [6]. The large surface areas were a result of the small nanoparticles obtained via FSP and were not caused by pore structures. The small crystallite size and homogeneous distribution was further confirmed by TEM (5–30 nm, cf. Section 2.3), as well as broad Raman bands and broad XRD reflections of low intensity, as shown in Figure 1. Raman signals at 937 and 945 cm–1 as well as a band at 700 cm–1 indicate the presence of both octahedral α-CoMoO4 and tetrahedral β-CoMoO4 [40]. Additionally, FSP-1F showed broad bands at 665, 819, and 995 cm–1, indicating the presence of MoO3 [41]. The same phases were identified by XRD as well as a mixed phase of Co0.7Fe0.3MoO4. FSP as a single-step method therefore gave direct access to metal oxide nanoparticles with a large surface area and homogeneous elemental distribution compared to the standard coprecipitation route. Since the catalysts were synthesised at high temperatures (typically up to 2400–3000 K) and in order to maintain and study their unique structural properties [15,17], only a mild calcination step at 320 °C was performed prior to catalytic tests. Due to the high number of constituents, only the combination of complementary characterisation techniques allows a holistic view of the complex catalyst material. The results of all methods used in this paper are summarised in Table 2.

2.2. Catalytic Activity and On-Stream Behaviour

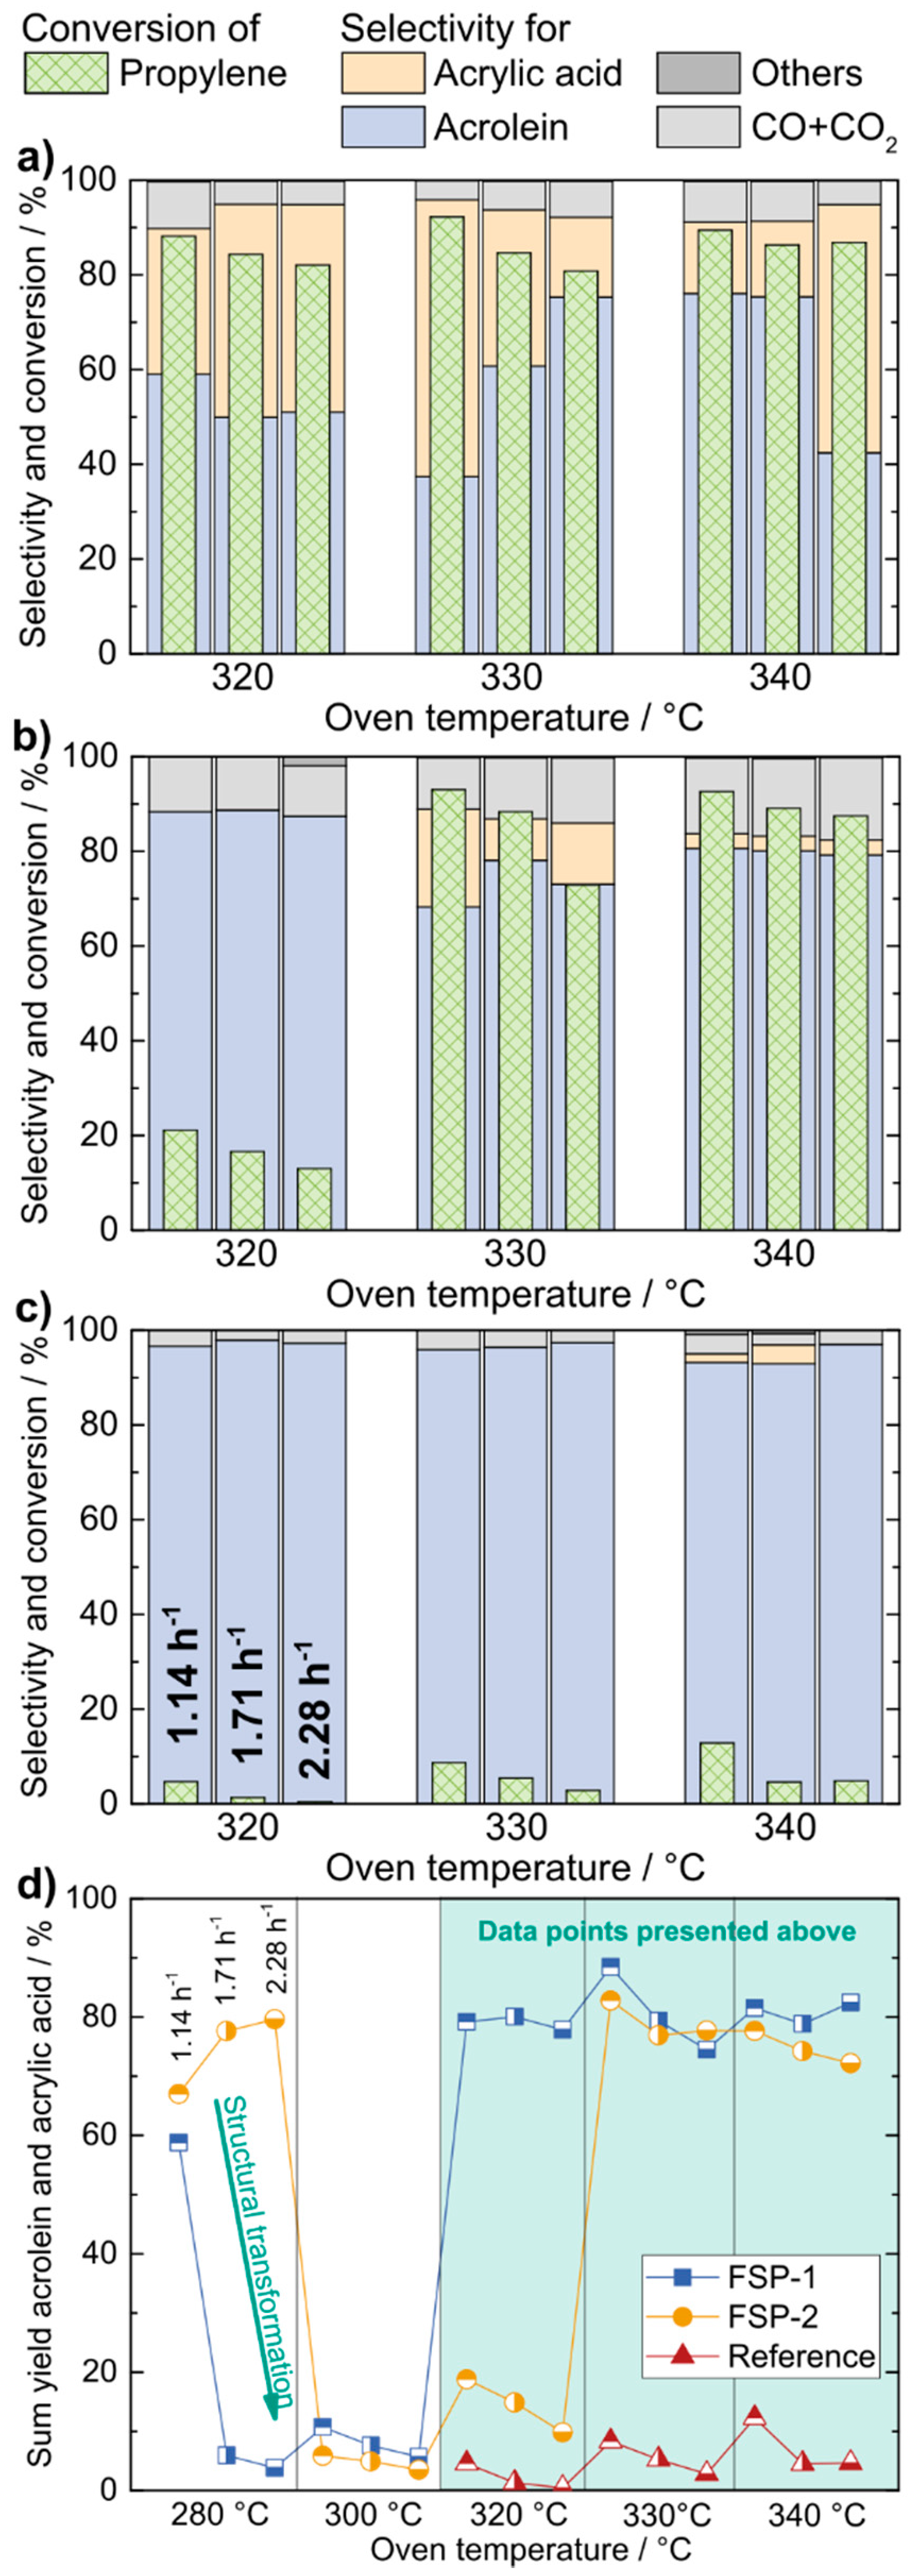
Two selected Bi-Mo-Co-Fe oxide catalysts, FSP-1 and FSP-2, were tested for their catalytic activity in a fixed-bed reactor. Remarkably, the FSP catalysts were superior compared to a reference catalyst prepared by coprecipitation, showing propylene conversion over 80% already at moderate oven temperatures of 320 °C (FSP-1F, Figure 2a) and 330 °C (FSP-2F, Figure 2b). For comparison, the reference catalyst gave a propylene conversion of maximum 13% (340 °C, weight hourly space velocity (WHSV) = 1.14 h–1) under the same conditions (Figure 2c). However, due to the poor conversion achieved by the reference catalyst, quantitative comparison of selectivity was not appropriate at the moderate oven temperatures tested. Between the flame-spray catalysts, FSP-1 showed high selectivity to both acrolein and acrylic acid (76% and 15%, respectively), while FSP-2 selectively oxidised propylene to acrolein (81% vs. 3%) at a comparable conversion point (90% and 93% at 340 °C, WHSV = 1.14 h–1). The different selectivity may originate from an increased Mo content and thus the presence of MoO3, which was only observed in FSP-1F. Both catalysts generally exhibited lower acrylic acid selectivity at higher temperatures. Apart from the combustion or total oxidation products CO and CO2, hydrocarbons such as acetic acid or propane were identified as minor by-products. Previously, acrylic acid formation was observed for molybdenum oxide when mixed with other phases [42]. In general, the formation of main and by-products over multicomponent catalysts is based on a complex reaction network [43,44].
Throughout the catalytic testing cycle, both FSP-1 and FSP-2 showed initial product formation already at 280 °C, which temporarily vanished upon further increase of the feed gas flow (Figure 2d) since this caused a temperature peak of the catalyst bed to >400 °C (SM, Figure S2). Thus, the FSP-made Bi-Mo-Co-Fe oxide nanoparticles apparently underwent structural transformations on-stream in the early reaction stages due to their extreme activity. This is a typical behaviour for selective oxidation catalysts [4,5], resulting in poor conversion of propylene until a temperature of 320–330 °C was reached. After the initial structural transformation, both propylene conversion and exothermic behaviour of the catalysts were stable for the duration of testing (5–7 days). The data presented in Figure 2a,b was recorded after these structural changes, whereby the FSP catalysts formed on-stream showed superior propylene conversion and product selectivity compared to the reference catalyst prepared by coprecipitation. The catalytic performance of the reference catalyst was poor since the applied oven temperature was rather low and dilution with SiC prevented hot-spot formation within the catalyst bed [5]. However, this was not the case for flame-made catalysts, which therefore exhibit highly potent material properties as selective oxidation catalysts at moderate temperatures. To properly understand the apparent structural evolution and its effect on catalyst performance, a broad range of characterisation methods were applied to the fresh and spent catalysts.

2.3. Structural Characteristics after Long-Term Time-on-Stream Tests

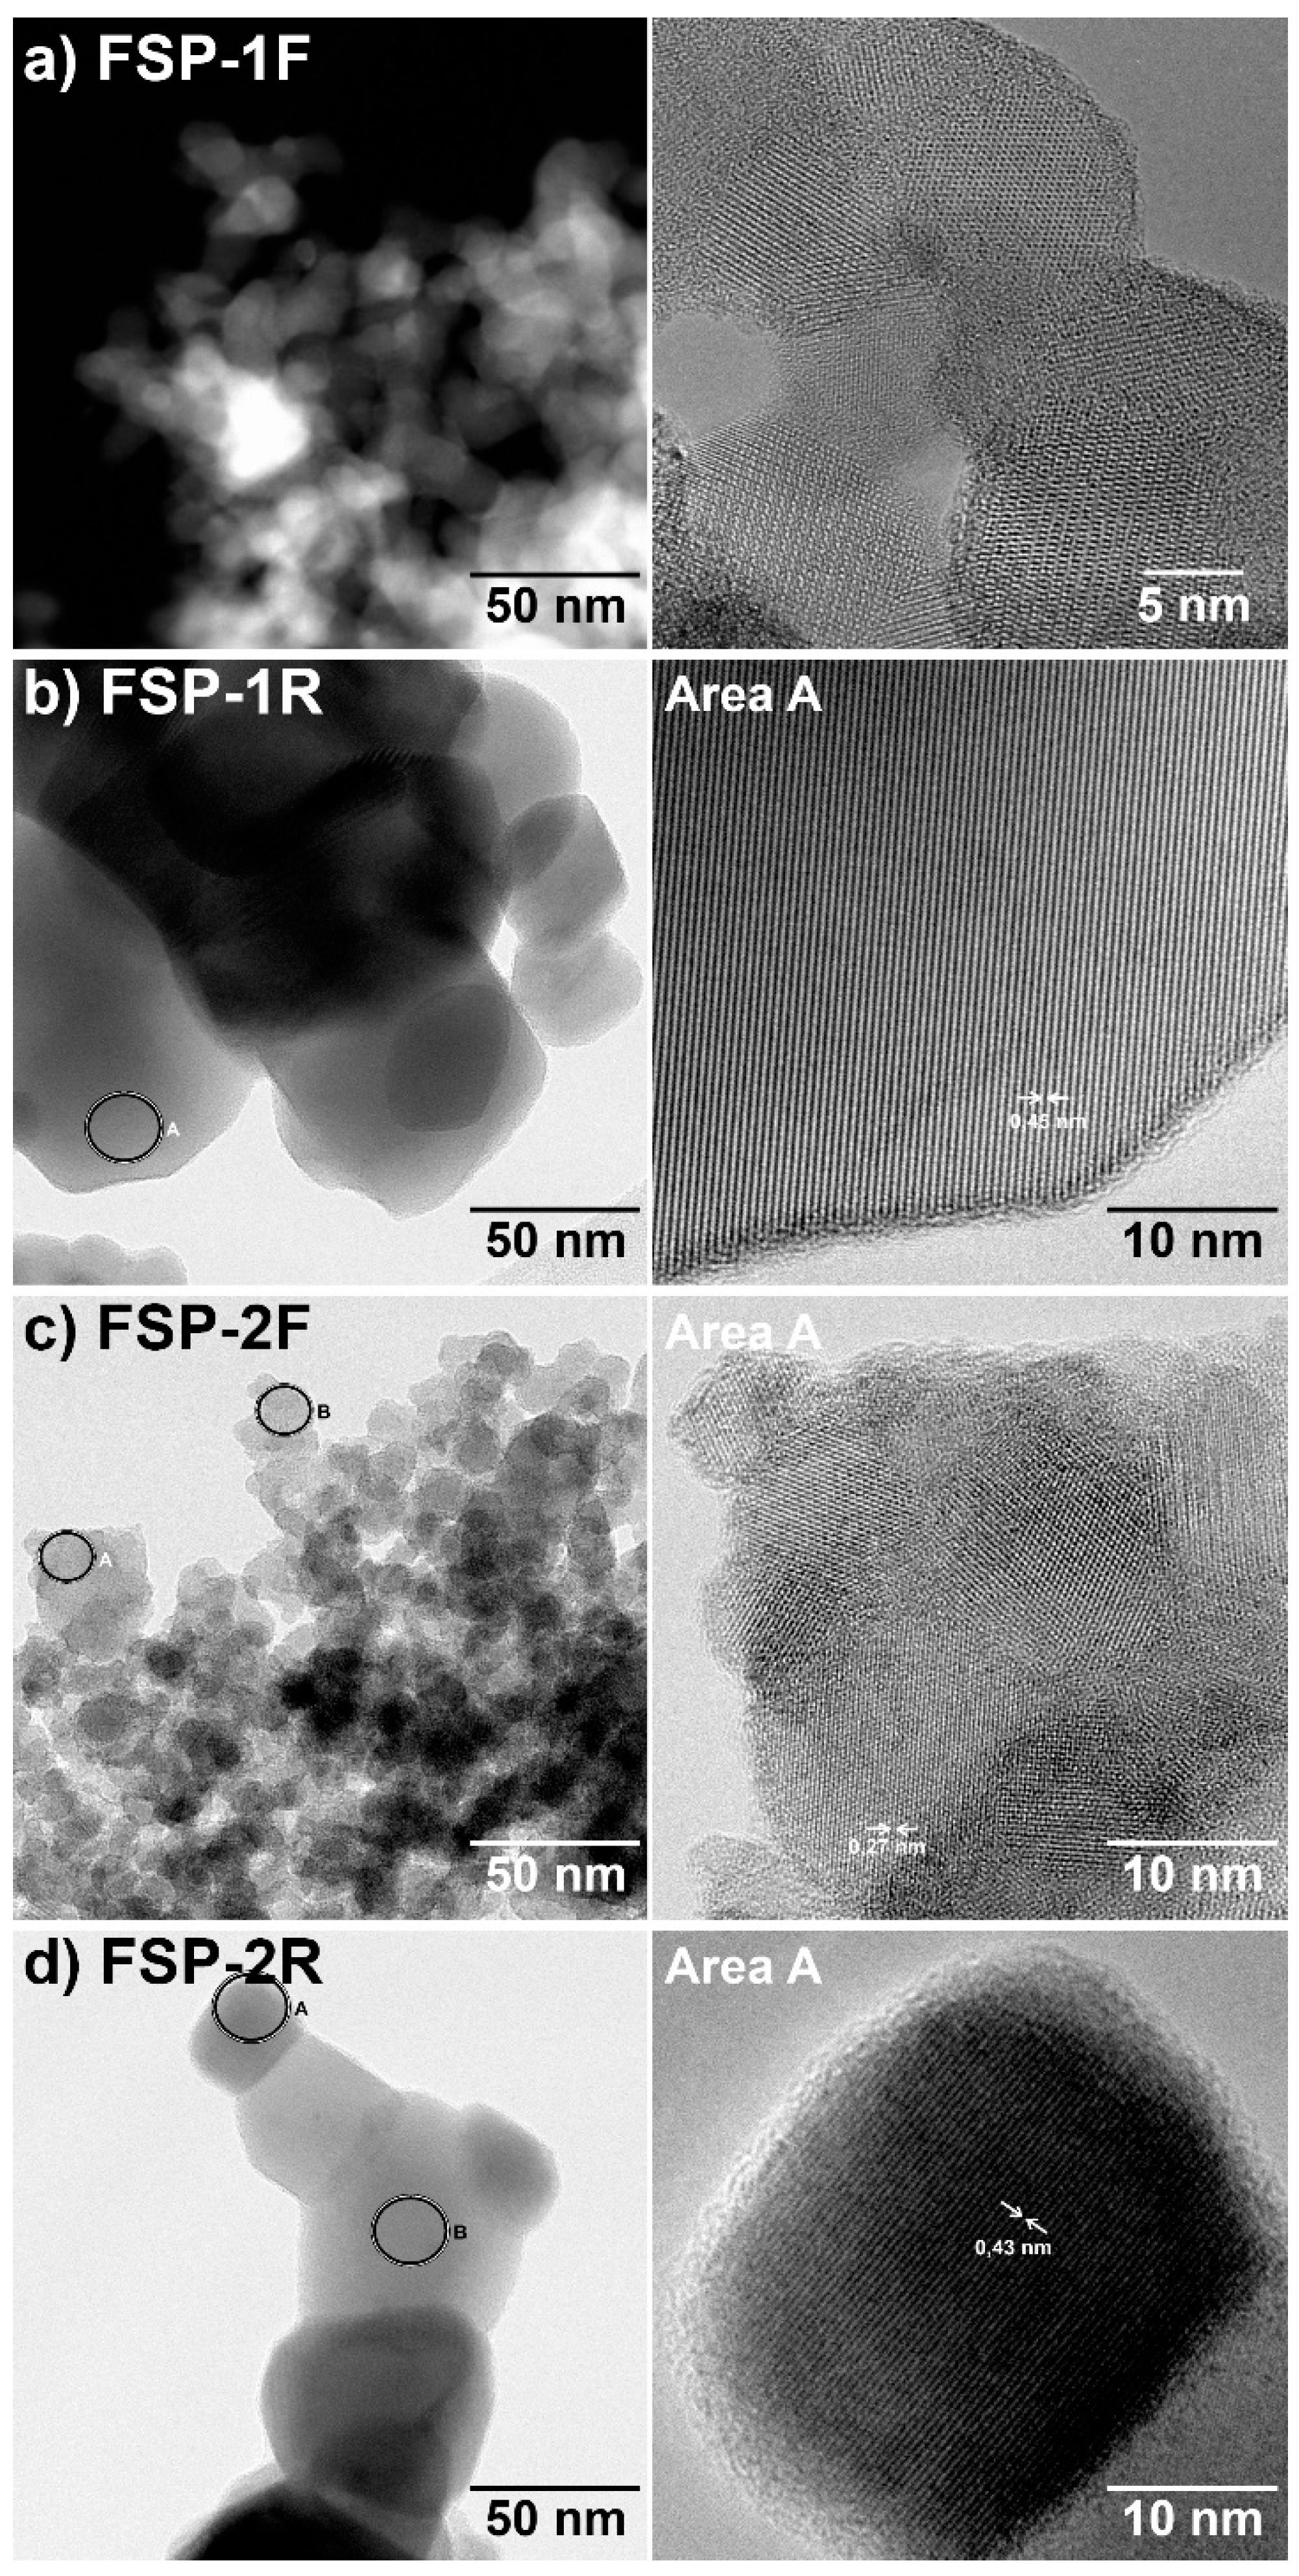
The following characterisation describes the tested catalysts in their fresh state (FSP-1F and FSP-2F) and after use for catalytic tests (FSP-1R and FSP-2R). The results are also summarised in Table 2. After testing, the specific surface area for both FSP-1R and FSP-2R decreased dramatically from 52 and 75 to 8 m2 g–1 (comparable to coprecipitated catalysts), indicating a strong sintering or aggregation of the metal oxide phases. The catalysts were analysed using scanning transmission electron microscopy (STEM) with high-angle annular dark-field (HAADF) and bright-field (BF) acquisition modes. For the spent catalysts, the particle size, as observed by TEM, increased by one order of magnitude to around 50–200 nm, which explains the lower specific surface area (Figure 3). Furthermore, TEM–EDX showed that the elemental distribution was heterogeneous and distinct particles of, e.g., α-Bi2Mo3O12 and Co0.7Fe0.3MoO4 phases, were found for FSP-1R and FSP-2R (SM, Table S4). Notably bismuth appeared to segregate between or within the crystallites, since regions rich in bismuth and regions containing no bismuth were found for both samples. However, large Mo- and O-containing particles were only present in FSP-1R, which is in line with the presence of MoO3 found via Raman spectroscopy and XRD (cf. Section 2.1). High–resolution transmission electron microscopy (HRTEM) showed the formation of a highly crystalline material with a larger crystallite size for both samples.
No changes in bulk metal composition were observed by inductively coupled plasma optical emission spectrometry (ICP-OES) after catalytic testing of FSP-1R and FSP-2R (SM, Figure S1). Furthermore, the elemental surface composition of both catalysts was determined by XPS. The corresponding XPS regions and the derived relative surface concentrations are listed in the Supplementary Materials (Table S1). The results of the Lorentzian/Gaussian curve deconvolution of the signals at their corresponding binding energies are given in Table S2, indicating the presence of Mo6+ (Mo 3d5/2 = 232.8 eV), Bi3+ (Bi 4f7/2 = 158.5 eV), Fe3+ (Fe 2p3/2 = 710.9 eV), and Co2+ (Co 2p3/2 = 780.4 eV) for FSP-1F. Furthermore, an Fe2+ contribution at Fe 2p3/2 = 709.4 eV was found for FSP-1R. Compared to the bulk composition, the surface bismuth fraction was rather low (7.2% compared to 3.0%) and further decreased (1.5%) after catalytic testing. Thus, the Mo/Bi ratio determined on the surface was 14.4 and 27.0 before and after catalytic tests, respectively, whereas it was 8.2 in the bulk according to ICP-OES. In contrast, especially the iron content was much higher on the surface (18.6%) compared to the bulk composition (8.8%) and further increased for the spent catalyst (23.2%). This further suggests the mobility particularly of Bi and Fe species within the catalyst grains following reaction. This may be related to the formation of a termination layer-like species, as observed previously for Mo-based mixed metal oxide catalysts [12,45]. In addition, the catalyst surface contained substantial amounts of carbonaceous deposition after the reaction, probably resulting from propylene decomposition. However, this did not cause any appreciable change in activity during testing. Notably, minor amounts of sodium were found on the surface, which may have been an impurity in one of the synthesis precursors.
The catalysts after catalytic testing were further characterised by Raman spectroscopy and XRD in order to decode the complex phase composition. As shown in Figure 1a, FSP-1R and FSP-2R both showed narrower Raman bands and more distinct XRD reflections compared to the fresh catalyst, representing an increase in crystallinity with larger and more defined phases during reaction. The Raman spectrum of FSP-1R showed bands corresponding to MoO3 (666, 819, and 995 cm–1) and β-CoMoO4 (937 and 945 cm–1). However, in contrast to FSP-1F, no broad bands at 937 and 700 cm–1 were present, indicating the absence of α-CoMoO4 [40]. Following catalytic testing, the catalysts clearly retained a very complex mixture of phases. As the presented Raman spectra were actually averaged from area scans, it was possible to process the data in a spatially resolved manner. In order to provide localised information on the phase composition, a direct classical least squares (DCLS) component analysis of such areas was performed. As shown in Figure 4, the Raman maps revealed that a phase separation of FSP-1R and FSP-2R occurred on a macroscopic scale. In addition to the phases identified by Raman spectroscopy, α-Bi2Mo3O12 and Bi3FeMo2O12 were identified by XRD for FSP-1R (Figure 1b). FSP-2R showed Raman bands corresponding to β-CoMoO4 but none that can be traced back to α-CoMoO4, similar to FSP-1R. Furthermore, a band at 920 cm−1 could be assigned to β-FeMoO4 [40,46], which is further supported by XRD results (Figure 1). To conclude, the samples mainly contained β-CoMoO4 and iron-containing isostructural phases. However, the main difference between the two catalysts is that FSP-1R showed a more complex phase composition and the presence of α-Bi2Mo3O12, Bi3FeMo2O12, and MoO3 than FSP-2R. These results indicate both the increasing heterogeneity of the samples during catalytic testing and the increased mobility of Bi within the particle, resulting in the different expression of phases on a microscopic and macroscopic level. This may furthermore influence the different catalytic behaviour observed. An estimate of phase fractions based on the DCLS component analysis of the Raman spectra supported the band assignment described for all samples (SM, Table S3). However, no Raman bands corresponding to pure bismuth molybdates were identified [47]. Thus, such phases may be highly dispersed or incorporated in other isostructural phases.

2.4. Tracking Individual Metals: X-Ray Absorption Spectroscopy

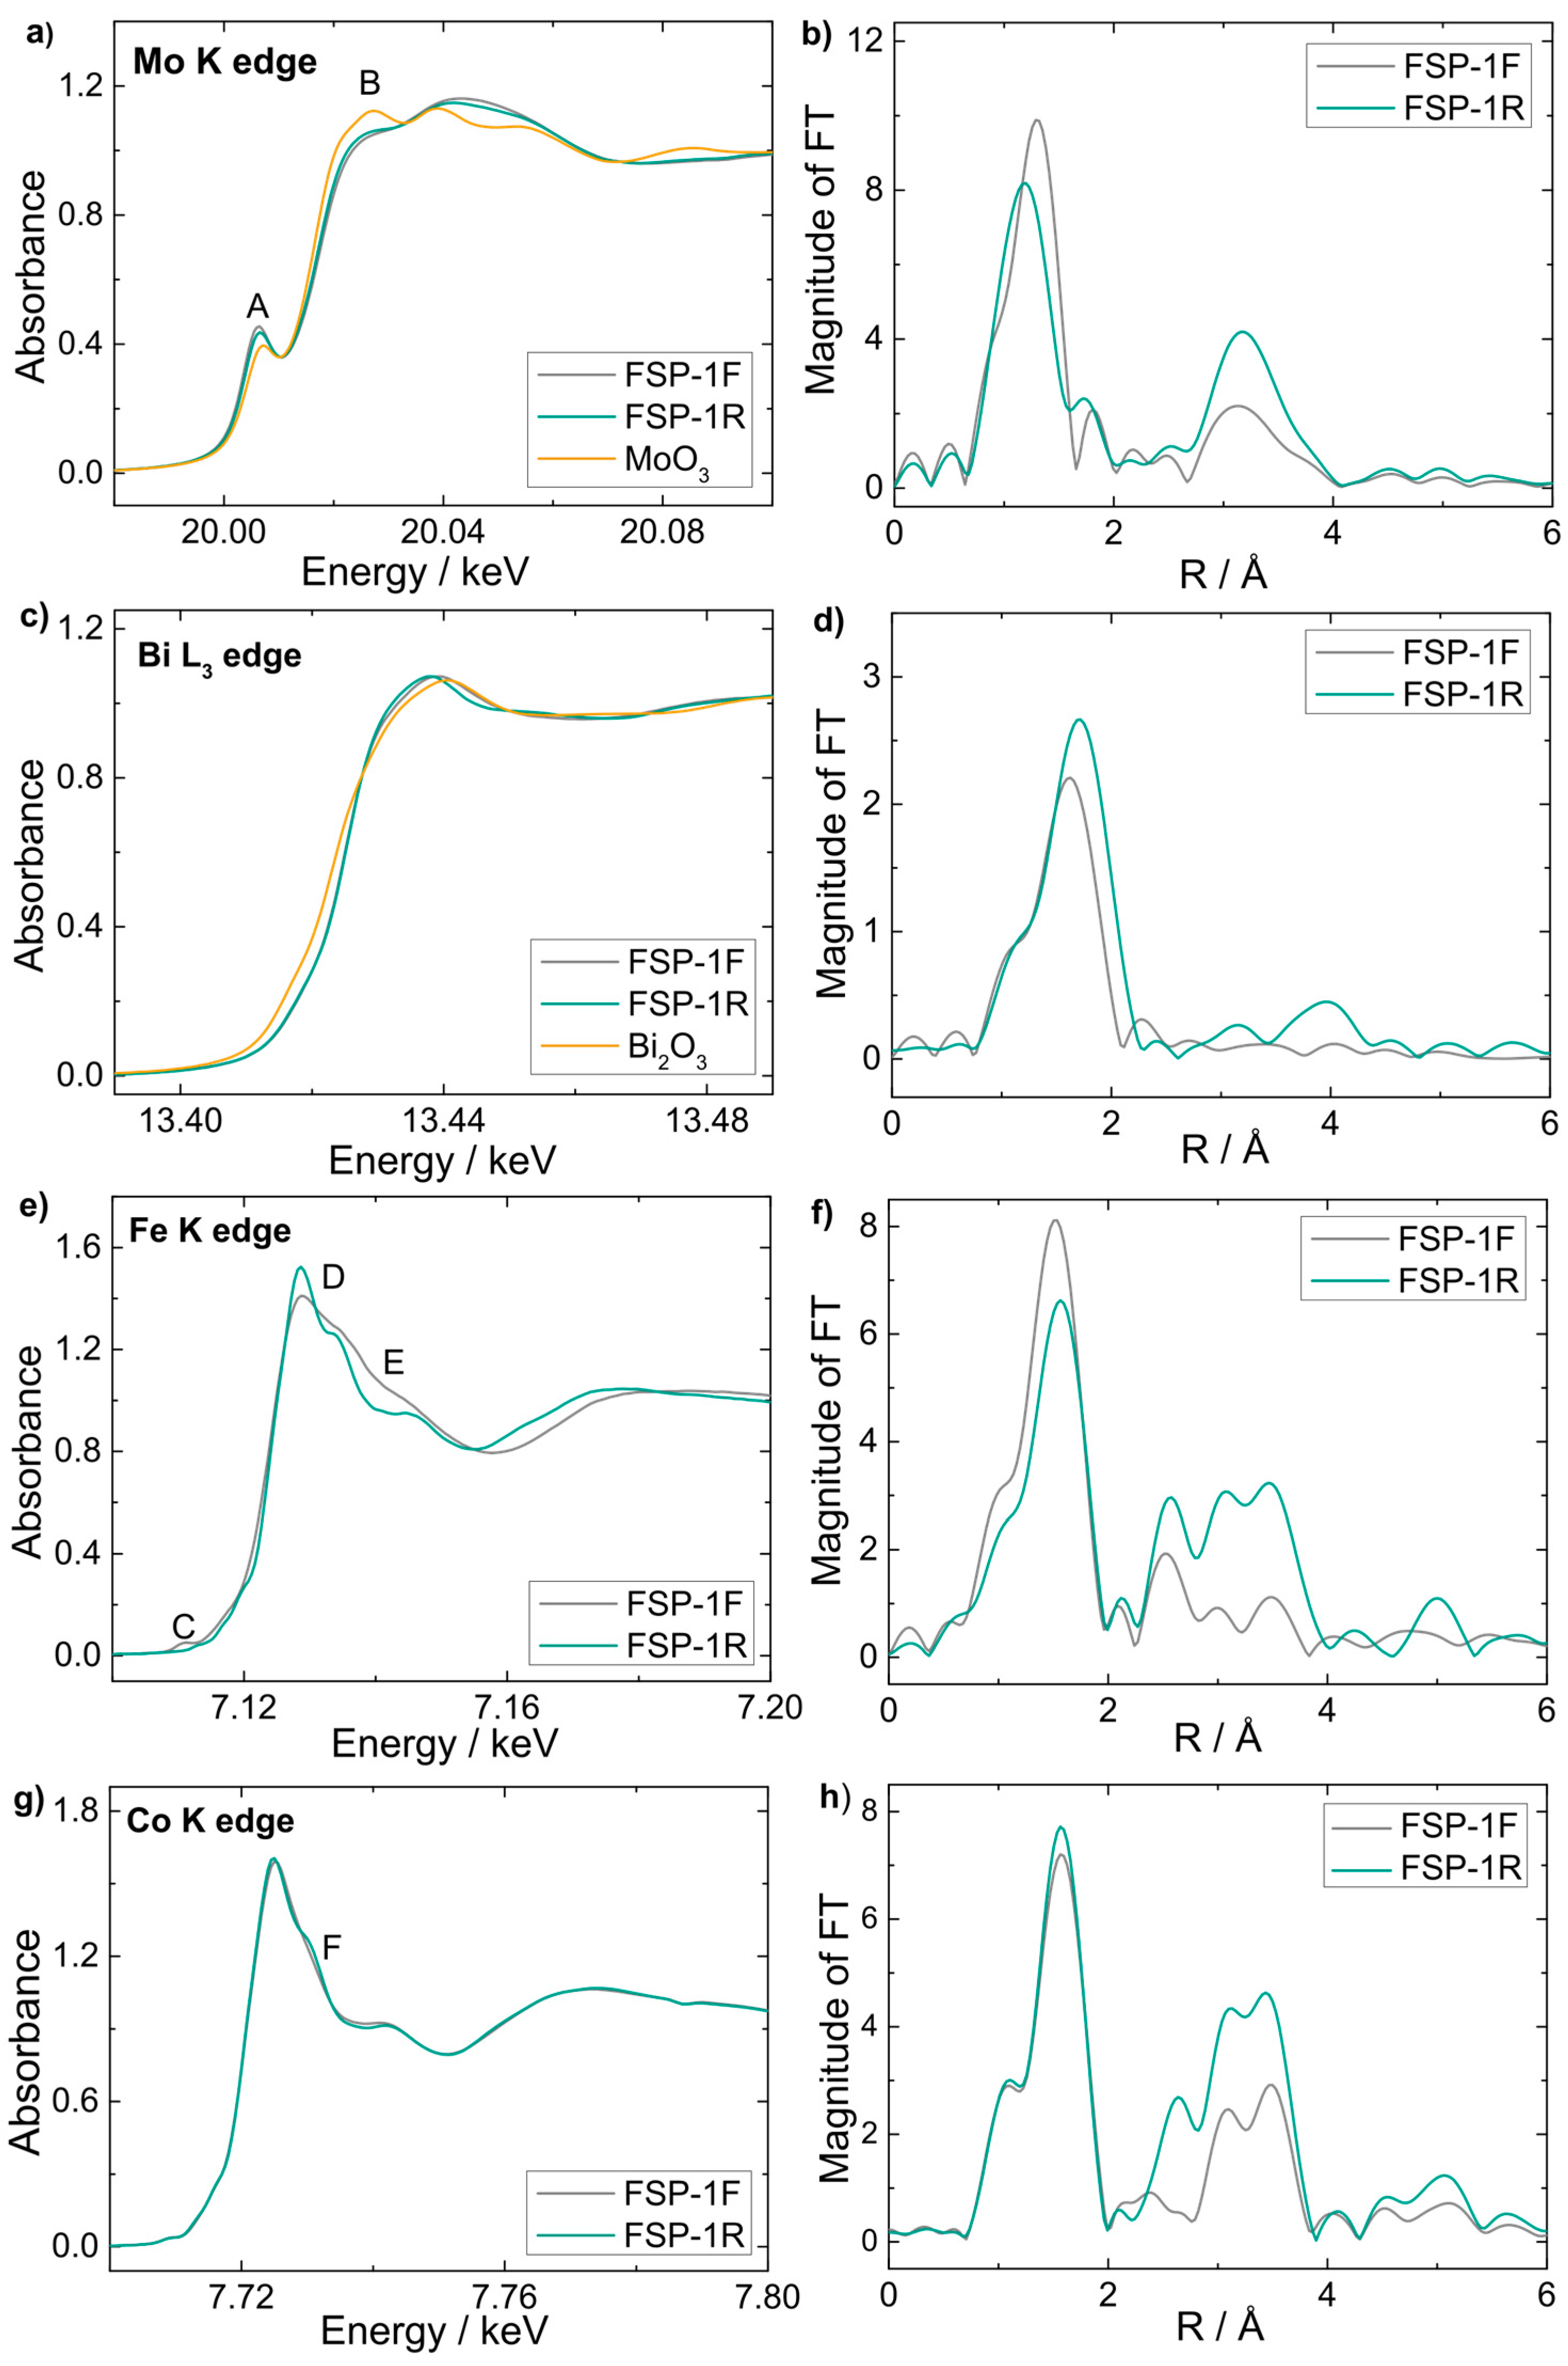
To further elucidate the transformation of the fresh (FSP-1F) to the spent (FSP-1R) catalyst, XAS at the Bi L3, Mo K, Co K, and Fe K edges was used to study both the crystalline and amorphous phases of the bulk material. X-ray absorption near edge structures (XANES) and the corresponding Fourier transformations of the extended X-ray absorption fine structures (EXAFS) are plotted in Figure 5. At the Mo K-edge, the pre-edge feature A is indicative of tetrahedral geometry and feature B of Mo species with octahedral/distorted geometry [48], indicating a shift towards Mo with octahedral coordination after reaction (Figure 5a). This is further supported by the EXAFS spectra (Figure 5b) and corresponding EXAFS fitting (SM, Section 5). The contribution of Mo coordinated to four oxygen atoms (1.65–1.77 Å) decreased, while the coordination number (CN) of the axial (fifth) oxygen atom at 2.29 Å increased to 3 for FSP-1R. While scheelite-structured bismuth molybdates (α-Bi2Mo3O12, β-Bi2Mo2O9) or β-phases (β-CoMoO4) contain tetrahedrally coordinated Mo6+, aurivillius-structured bismuth molybdates (γ-Bi2MoO6), α-phases (α-CoMoO4), and MoO3 represent octahedrally coordinated Mo6+ [41,49,50]. Thus, the increase in octahedral coordination may be driven by the increased crystallinity of MoO3 as observed by Raman spectroscopy and XRD. Furthermore, an increase in CN of Mo-Mo at 3.31 Å and Mo-Co at 3.81 Å indicated a more crystalline structure or a more linear Mo-O-Mo (Co) arrangement for FSP-1R.
For the Bi L3 edge data (Figure 5c,d), changes in the EXAFS region were observed. EXAFS fitting of FSP-1F showed Bi coordinated to three oxygen atoms with an average bond length of 2.15 Å, indicating oxygen vacancies or oxygen at different distances in the first shell around Bi. Furthermore, interactions in higher shells were not observed and Bi phase was highly disordered. However, for FSP-1R, two types of Bi-O bonds were observed: at 2.2 Å with CN of 3 and at 2.66 Å with CN of 2. Contributions of the second shell were also observed, e.g., due to Bi-Bi (3.4–3.7 Å), Bi-Mo (ca. 4 Å), and Bi-Fe (ca. 4.4 Å). The appearance of additional backscatterers and longer Bi-O bonds suggests formation of stable Bi phases during reaction. Additionally, an Fe-Bi contribution was visible, indicating formation of a Bi3FeMo2O12 phase observed via XRD.
The Fe K-edge XANES spectra (Figure 5e) are characterised by features C (7.112 keV), D (7.1265 keV), and E (7.1337 keV) [51]. Feature C was diminished after reaction, corresponding to a transition from tetrahedral to octahedral Fe2+ coordination, while D and E became more pronounced, indicating an increase in the higher coordination shells and a transition towards single molybdate phase, respectively. EXAFS fitting (Figure 5f) showed a decrease in CN of the Fe-O shell from 4.9 to 4.5, and an increased Fe-O bond length from 1.99 to 2.04 Å. This may support a transition towards partial octahedral coordination as the CN is still low. Furthermore, FSP-1R showed increased contributions of Fe and Mo in the R ranges of 3.0–4.2 Å as indicated by a lower σ2 factor and higher CN of Fe and Mo paths. In summary, the oxygen coordination around iron became more octahedral while higher shells became more ordered.
The Co K-edge XANES spectra of FSP-1F (Figure 5g) revealed a very weak feature F at ca. 7 eV above the main peak, indicating high proportions of β-CoMoO4 phase [50]. Feature F became slightly more pronounced after the reaction, indicating a minor shift towards α-CoMoO4, although this effect was very small. In addition, the corresponding FT spectra (Figure 5h) emphasised an increased coordination in higher metal shells for FSP-1R. EXAFS fitting further revealed that only Co-Mo coordination contributed to higher shells and no other metal. Co was therefore exclusively present as CoMoO4 phase, which became highly ordered and crystalline during reaction. Note that Raman spectroscopy and XRD also showed the presence of crystalline β-CoMoO4 after reaction.
In summary, XAS revealed that Mo, Bi, and Fe species changed significantly during the reaction. In contrast, CoMoO4 was already dominant in the fresh catalyst and became especially more crystalline in FSP-1R. Mo and Fe showed an increase in both octahedral coordination and crystallinity after catalytic testing. However, Bi species underwent the most remarkable structural changes, showing highly amorphous character in FSP-1F and becoming engaged in various Mo- and Fe-based phases after catalytic tests. Correlation between these observations and the results of other characterisation methods are highlighted in Table 2.

2.5. Spatially Resolved 3D Imaging of the Structural Evolution of the Catalyst

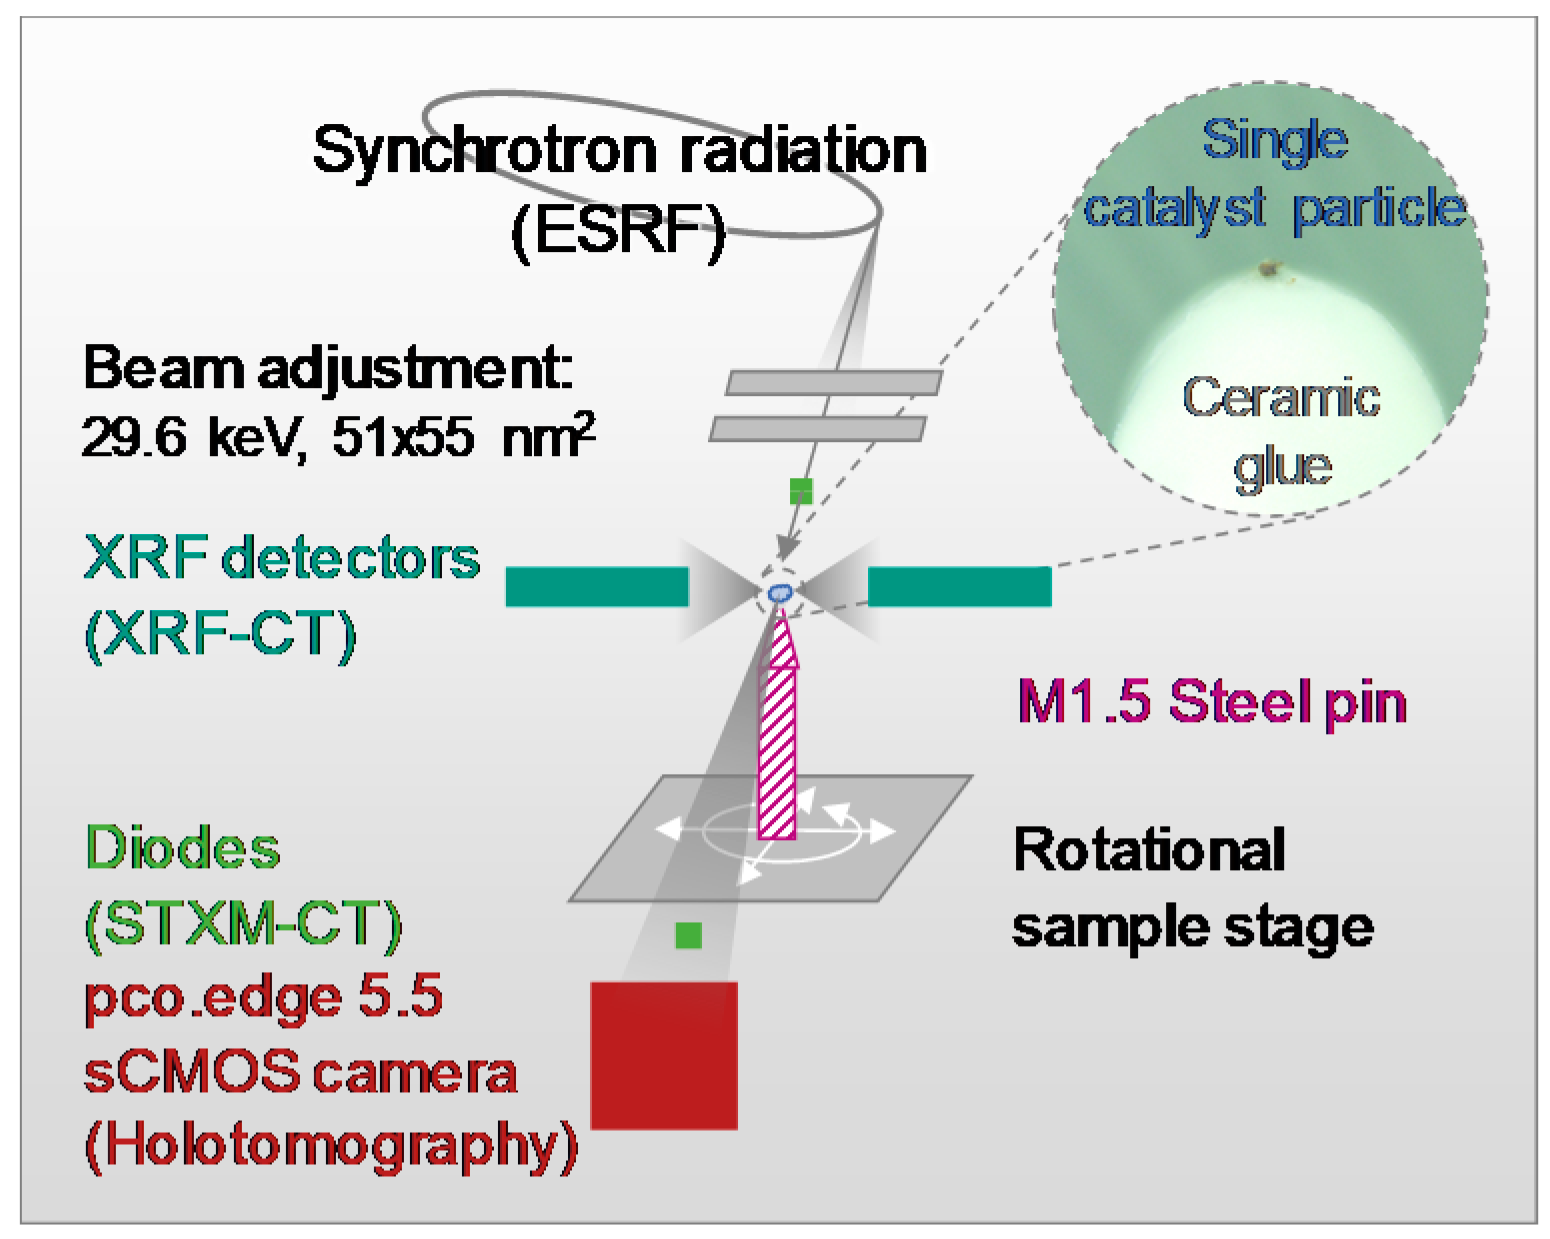
The previous analyses indicate complex structural changes occurring on several length scales from nm to µm during catalytic testing. This makes the four-component FSP catalysts an excellent candidate for tomographic imaging. Two catalyst particles from the same batch were compared using holotomography, XRF–CT, and STXM–CT: a freshly calcined particle following synthesis (FSP-1F) and a particle following the catalytic tests described in Section 3.3 (FSP-1R). Further details on each tomography method and movies of the 3D renderings can be found in the Supplementary Materials (SM, Section 6, Section 7 and Section 8). The arrangement of the tomography setup is illustrated in Figure 6.
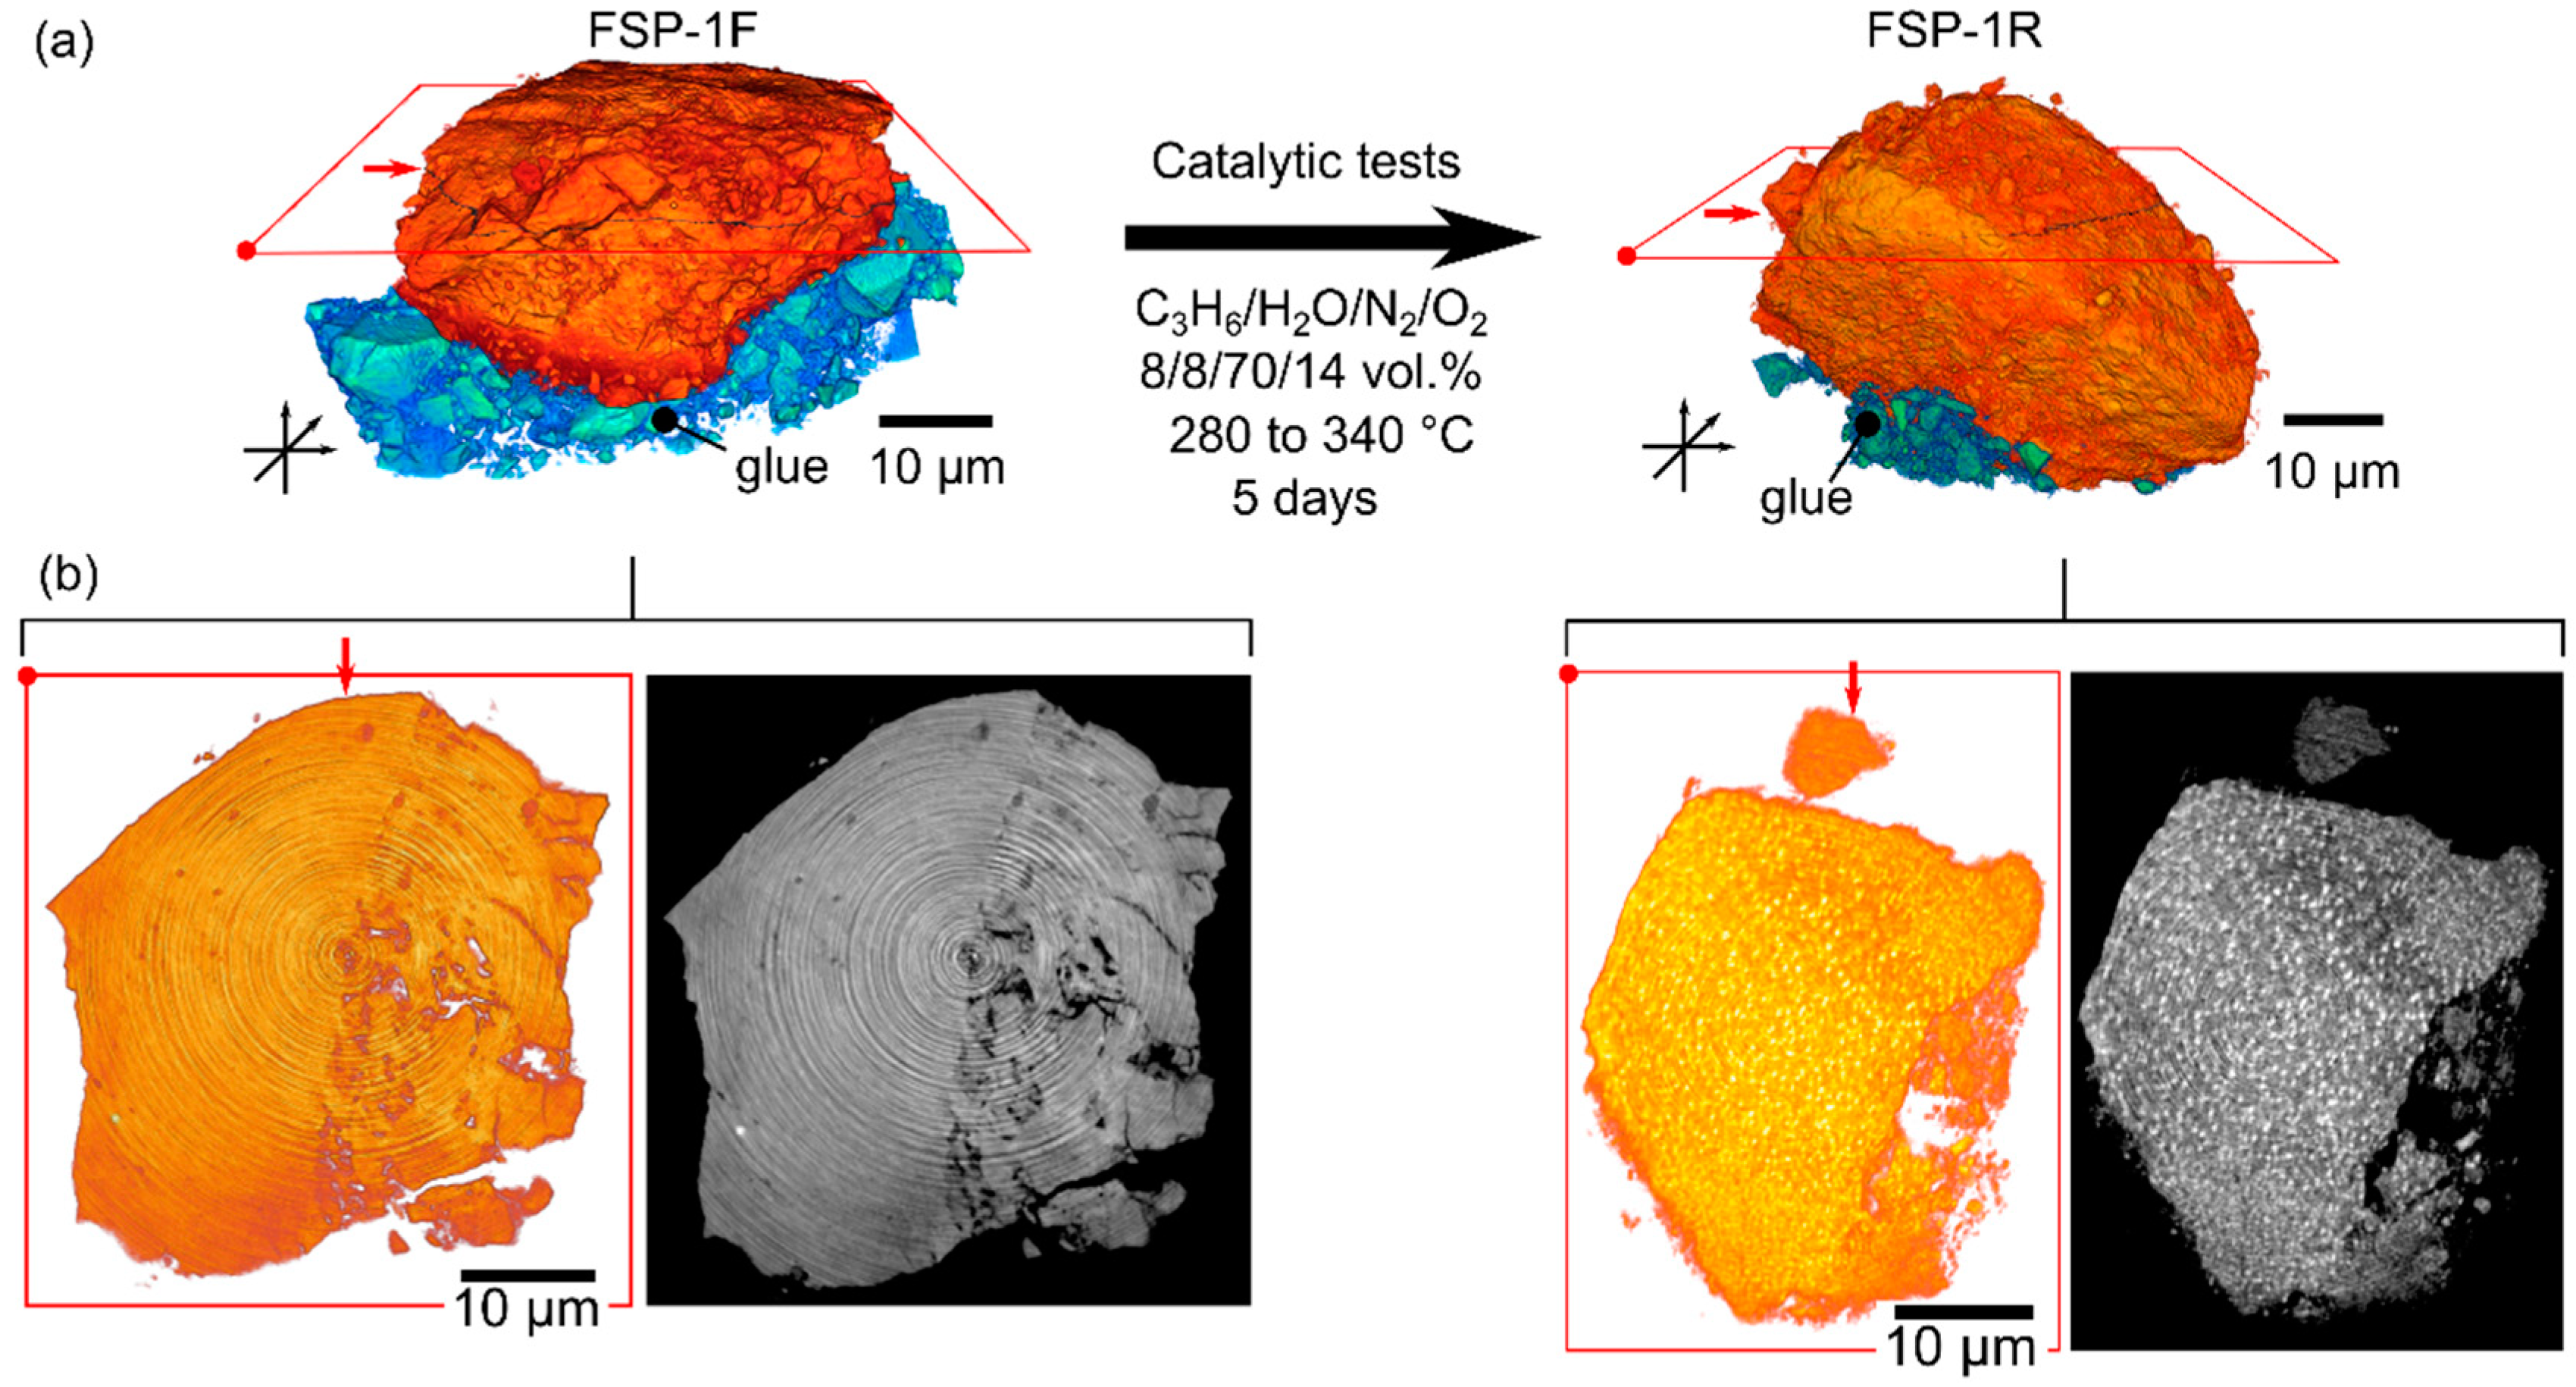
As shown in Figure 7, holotomography produced 3D models of complete catalyst grains with an effective spatial resolution of ca. 100 nm (estimated at four times the voxel size). The near absence of apparent pores or interstitial voids within the fresh and used catalyst grains indicates close to 100% of such features were below the spatial resolution limit, which is not surprising for FSP-synthesised catalysts [15]. The FSP-1R particle appeared mechanically intact despite extended catalytic tests on stream, given the highly similar appearance to the fresh particle and the absence of cracks or erosion (Figure 7a, right side). This was also confirmed by examination of a single identical catalyst particle before and after treatment directly at the synchrotron radiation source (see following section). Significantly, analysis of individual interior slices of FSP-1R by holotomography clearly showed the evolution of a more heterogeneous material composition following long-term catalytic tests (Figure 7b). This is evident by the spotted texture of the particle interior and a thin band of lower density material around the particle exterior, neither of which were observed for FSP-1F. These effects are easily visible when comparing the volume rendering movies of the two samples (SM, Section 8).
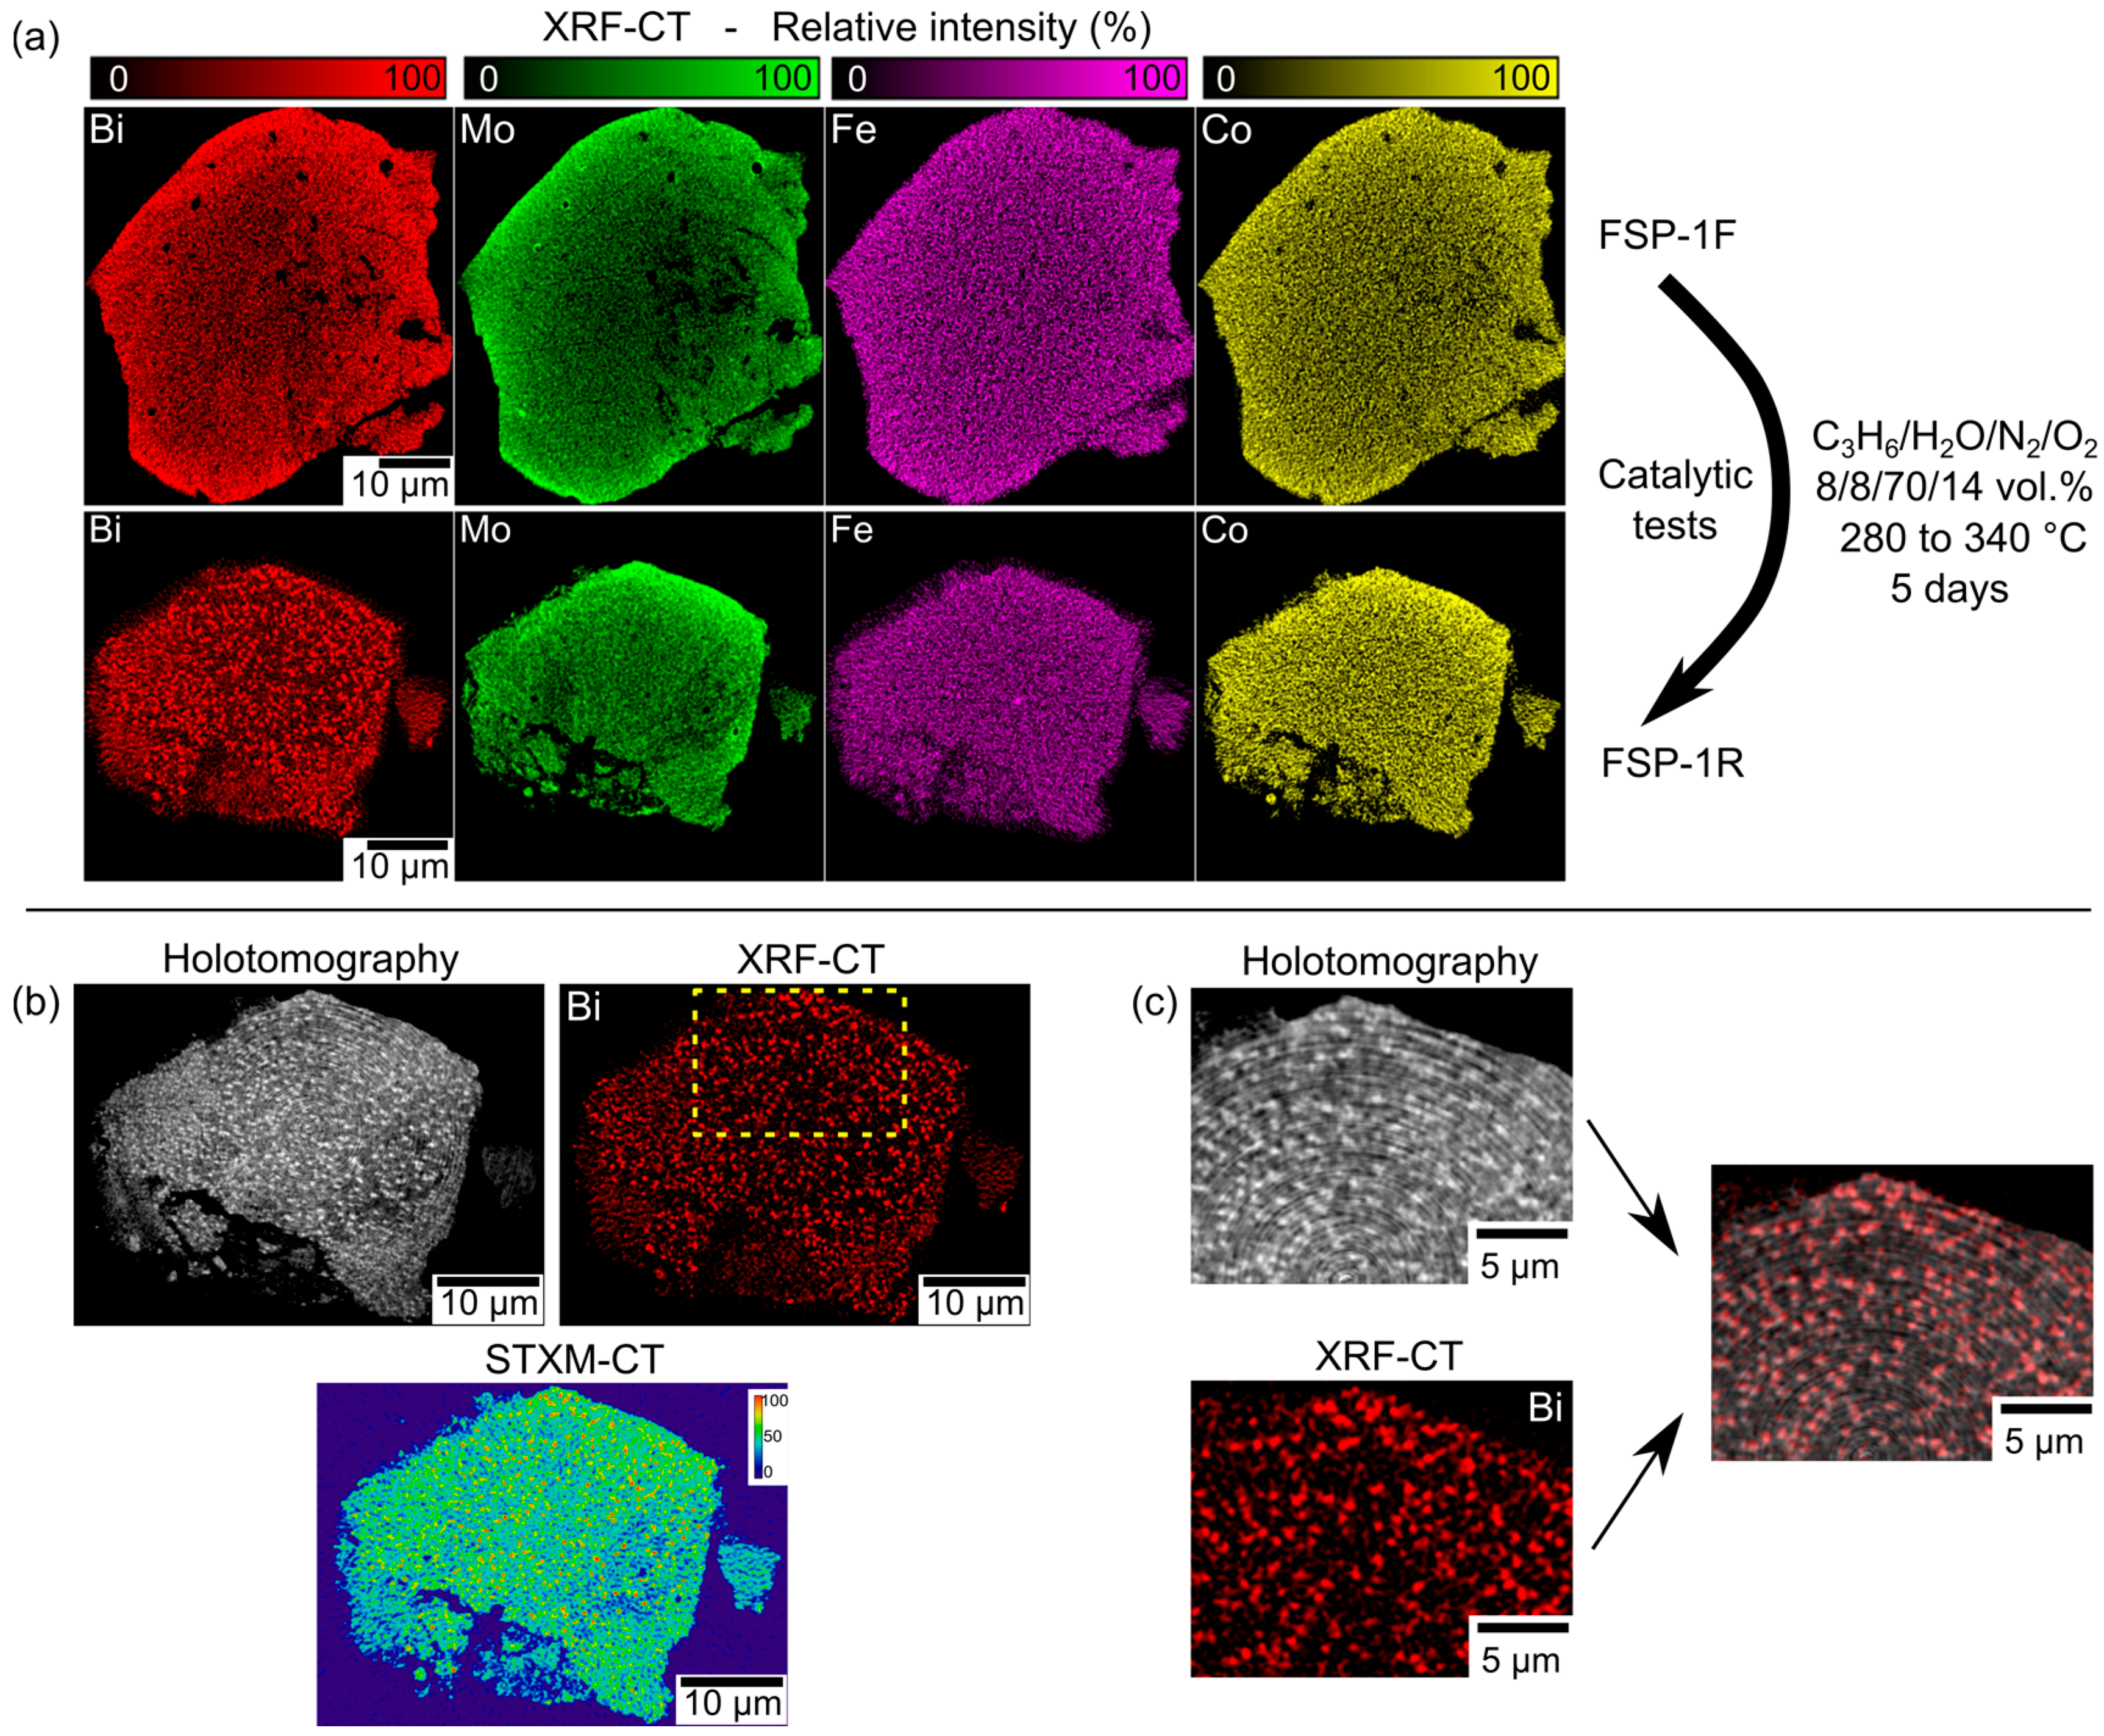
Since holotomography at a fixed energy in this case could not distinguish between different elements, a spectroscopic investigation was performed by simultaneous XRF–CT and STXM–CT with a nanofocused beam (Figure 8). Based on a spatial resolution of ca. 100 nm, the XRF–CT maps confirm the relatively homogeneous elemental and phase composition in the fresh catalyst FSP-1F (Figure 8a), in agreement with the <30-nm crystallite size observed previously during TEM. After catalytic testing, the interior of FSP-1R was also confirmed to be distinctly more heterogeneous by both XRF–CT and STXM–CT, as seen previously in the holotomography images (Figure 8b). Notably, the spotted regions indicative of high sample density observed by both holotomography and STXM–CT showed a highly visible similarity despite being recorded separately. This apparent increase in sample heterogeneity likely resulted from sintering or aggregation of the metal oxide components. To identify the precise source of this effect, it is necessary to consider the local concentration of phases containing each individual element, which were deconvoluted and plotted using XRF–CT. This revealed bismuth species as being solely responsible for aggregate formation on the order of several hundred nanometres within the catalyst particle after reaction, since the holotomography images and XRF–CT signals of bismuth could be directly overlaid with high precision (Figure 8c). No correlation to any other metal species was found when comparing the XRF–CT data of molybdenum, iron, and cobalt with the other tomography results. Iron and cobalt therefore remained well dispersed throughout the sample during reaction, while molybdenum was already uniformly present as the majority component of the catalysts. Note that quantitative analysis of metal distribution using XRF–CT data was not possible here due to the presence of self-absorption effects, visible as a radial intensity gradient, which could not be corrected due to the complex sample composition (see SM, Section 6). However, the aggregation of bismuth was a real effect since it was observed also by holotomography and STXM–CT, which do not suffer from the self-absorption phenomenon.
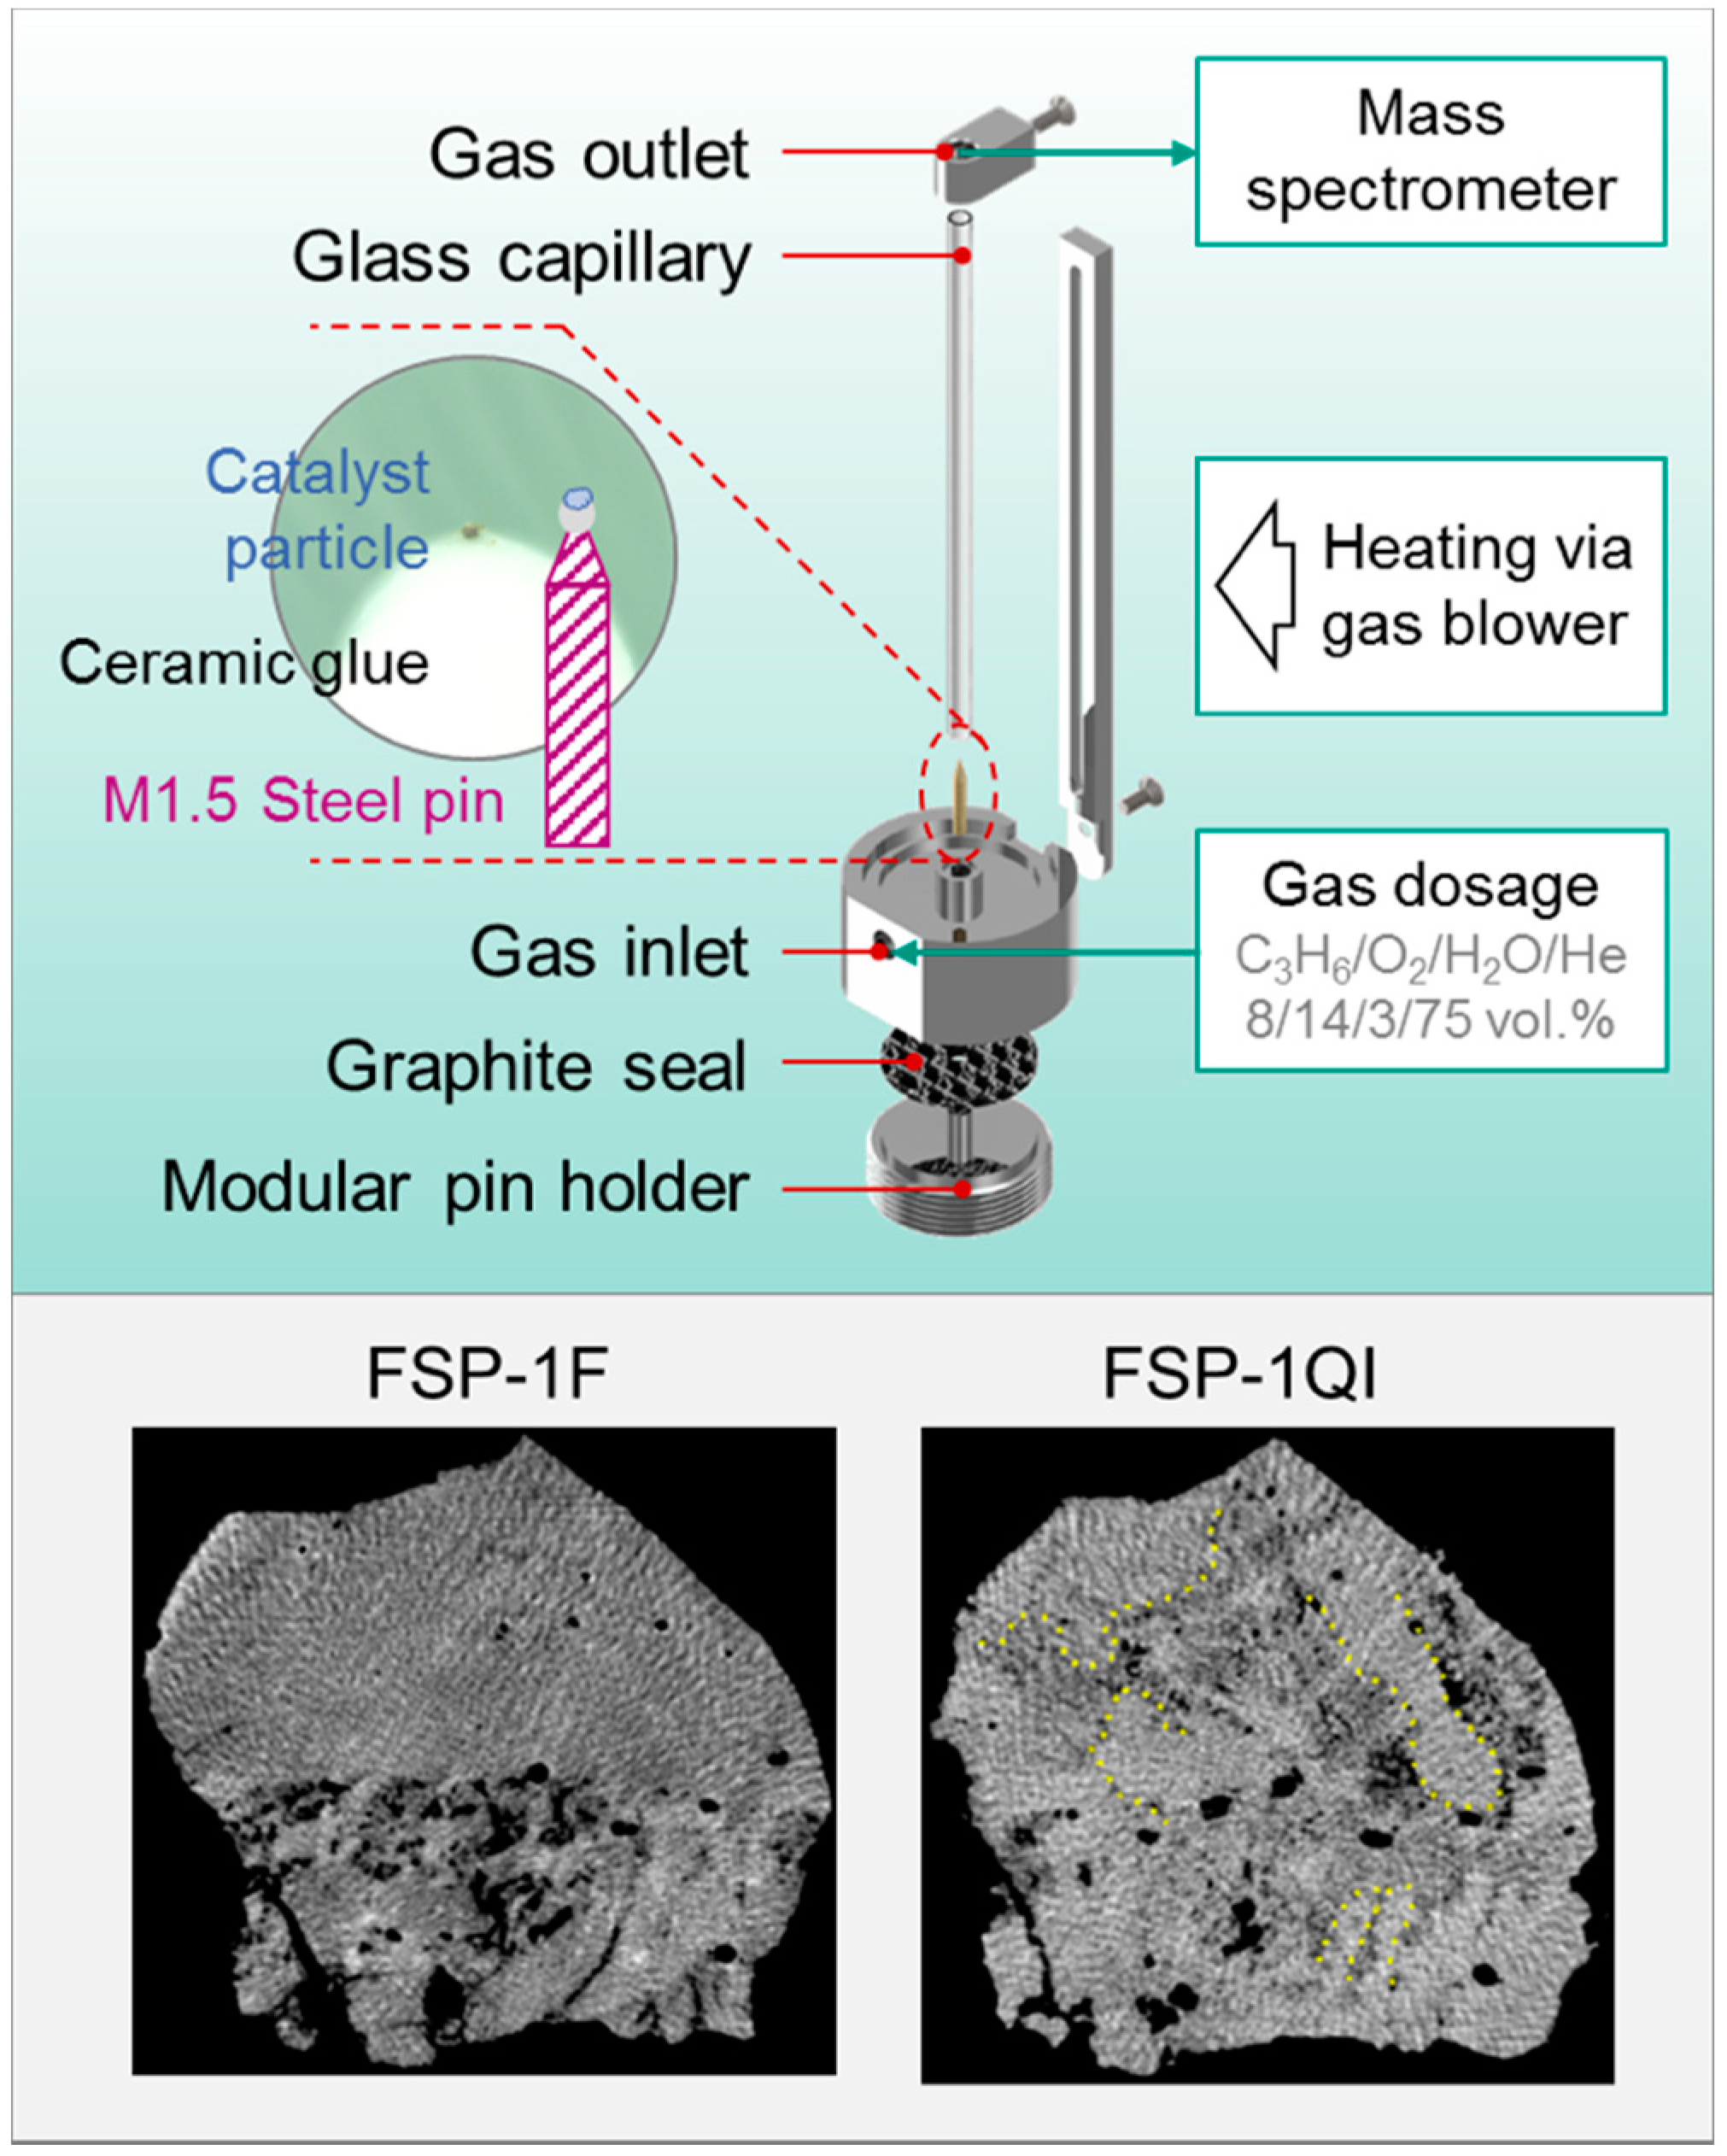
The above approach compared two different catalyst particles from the same synthesis batch. To examine the structural evolution more accurately, it is necessary to measure the exact same particle before and after treatment. The sample holder containing FSP-1F was thus removed from the beamline and placed in a specially designed reaction cell (Figure 9). After exposure to reaction atmosphere at 400 °C for 6 h, the treated sample (FSP-1QI) was returned to the beamline and a congruent sample volume measured in a quasi in situ approach. Some increase in heterogeneity was observed in the treated particle. However, this effect was not as strong as for FSP-1R, probably due to less time on stream (6 h compared to 5 days). The appearance of ordered shapes which were not present in the fresh particle (highlighted in Figure 9) indicate increased order and stable phase formation within the particle interior. Unfortunately, it was not possible to conclusively identify the chemical composition of the ordered structures using XRF–CT due to the presence of self-absorption artefacts and apparent similarity between FSP-1F and FSP-1QI fluorescence tomograms. No apparent change in bismuth species was observed following quasi in situ treatment, suggesting that while an increase in heterogeneity was observed after 6 h, strong bismuth aggregation occurs only over longer treatment times. The variation in particle shape was probably due to slight displacement between scans. Locating congruent fields of view is typically a challenge for nanofocused scanning methods, but this can be overcome by imaging the complete particle using holotomography, which allows for relatively simple volume alignment.

2.6. Addressing Catalyst Complexity in a Multimodal, Multiscale Approach

The multicomponent Bi-Mo-Fe-Co oxide catalysts in this study were highly active for propylene oxidation over sustained testing periods, possessing a diverse and complex structure which underwent significant changes during time on stream. In order to deconvolute the structure and relate the changes observed to catalyst activity and selectivity, a comprehensive characterisation approach was required. This included a combination of spectroscopy, diffraction, and microscopy, distinguishing between surface and bulk composition, and obtaining spatially resolved data in 2D and 3D. Correlation between the data obtained is summarised in Table 2.
Raman spectroscopy, XRD, XAS, and XPS typically contain bulk or average information on surface composition or global structure. In contrast, X-ray nanotomography offered noninvasive imaging over an extended field of view (e.g., 50 µm) generally not feasible by TEM, with excellent spatial resolution (~100 nm) compared to imaging techniques such as Raman spectroscopy mapping. The apparent aggregation of bismuth observed by nanotomography is in strong agreement with previous analyses. Segregation of Bi species from the particle surface was clearly visible by XPS, XAS indicated increased ordering and formation of stable Bi phases, while TEM–EDX showed separate bismuth-containing and bismuth-free regions with an estimated size range of 50–100 nm. However, where these methods are highly indicative, tomography provides direct visualisation and confirmation of this effect. It should be noted than the field of view during XRF–CT was several orders of magnitude larger than that of TEM–EDX. Bismuth segregation within different particles may therefore lead to bismuth-rich aggregates visible to nanotomography but not to TEM–EDX due to the limited sample area probed. On the other hand, XRF–CT in this case did not have sufficient spatial resolution to define small aggregates on the length scale visible to TEM. This compromise between spatial resolution and field of view highlights the complementary nature of X-ray and electron microscopy in observing chemical structure across multiple length scales. Furthermore, while the X-ray imaging toolset has great variety, the compromise between field of view, spatial resolution, and measurement time should be carefully considered [29,30,31]. Likewise, progressing from quasi in situ to full in situ or operando imaging is of great interest in catalysis but is experimentally challenging [32,33,52,53]. However, the quasi in situ approach is technically simple, potentially attractive, and may be expanded to monitor structural behaviour of other catalyst systems. The versatility of X-ray tomography is certain to increase with the advent of fourth-generation synchrotron light sources, offering improved flux, more coherent X-rays, and reduced scanning times. In summary, it is necessary to combine the strengths of many techniques for a detailed structural analysis, particularly on complex materials such as multicomponent oxide catalysts.

3. Materials and Methods

3.1. Catalyst Preparation

Catalysts were synthesised in a single step via FSP following a recently established procedure. The catalyst precursors Mo(VI) 2-ethylhexanoate (Mo 2-eha, 15 wt.%, STREM Chemicals, Kehl, Germany), Bi(III) 2-ethylhexanoate (Bi 2-eha, Alfa Aesar, Karlsruhe, Germany), Co(II) 2-ethylhexanoate (Co 2-eha, 65%, Merck KGaA, Darmstadt, Germany), and Fe(III) acetylacetonate (Fe(acac)3, Fluka Chemika, Waltham, MA, USA) were dissolved in xylene (VWR Chemicals, Darmstadt, Germany) using the amounts listed in Table 1 to give a solution with a total precursor concentration of 0.25 M. The precursor solution was loaded into a 50-mL syringe and placed in a syringe pump (World Precision Instruments, Sarasota, FL, USA), then pumped at 5 mL min–1 through the FSP injection nozzle as described elsewhere [2,14]. The fluid jet was dispersed by 5 L min–1 oxygen (N48, Air Liquide, Paris, France) at 3 bar to form a spray, while the flame was formed via a mixture of 1.6 L min–1 oxygen and 0.75 L min–1 methane (N25, Air Liquide, Paris, France). Gases were delivered by mass flow controllers (Bronkhorst, Ruurlo, Netherlands). The spray was ignited by the supporting flame and the products collected on a water-cooled glass fibre filter (Ø = 240 mm, Whatman GF6, GE Healthcare, Chicago, IL, USA) using a vacuum pump (R5, Busch GmbH, Maulburg, Germany). The catalyst was collected, sieved through a 600-µm mesh, and calcined at 320 °C for 5 h to remove traces of organic precursors.

3.2. Catalyst Characterization

Catalysts were characterised by inductively coupled plasma optical emission spectrometry (ICP-OES, Santa Clara, CA, USA), N2-physisorption (BET), XPS, XRD, Raman spectroscopy, TEM–EDX, and XAS before and after the catalytic test procedure detailed in Section 3.3. Bi, Mo, Fe, and Co metal loadings were determined by ICP-OES using an Agilent 720/725-ES spectrometer (Santa Clara, CA, USA). The surface area was measured by N2-physisorption at −196 °C using a BELSORP-mini II (BEL Europe GmbH, Krefeld, Germany) and calculated via the Brunauer–Emmett–Teller (BET) method. The surface composition was analysed by XPS using an ESCALAB 250xi (ThermoFisher Scientific, Waltham, MA, USA) equipped with an Al Kα source (λ = 0.834 nm) and a beam spot size of 900 µm. Crystalline structure was analysed by powder XRD using a Bruker D8 Advance diffractometer (Billerica, MA, USA) equipped with a Cu Kα source (λ = 0.154 nm) and a Ni filter. XRD patterns were recorded in the 2θ range of 8°–80°, with a 0.0165° step size and a 2-s dwell time per step. The XRD patterns were assigned to known crystalline phases using the Inorganic Crystal Structure Database (ICSD, Karlsruhe, Germany) and Joint Committee of Powder Diffraction Standards (JCPDS, PA, USA) databases. Raman spectroscopy was performed on a Renishaw in Via Reflex Spectrometer (Watton-under-Edge, UK) equipped with a He-Ne laser operating at 633 nm with 17 mW. The measurements were performed as area scans covering at least 156 × 234 µm2 with an effective spatial resolution of 1.3 µm in the range of 80–1300 cm−1, with 5% laser intensity, 60-s acquisition time, and the laser shape adjusted to a line. TEM imaging was performed with a 2010F field emission TEM (Jeol, Akishima, Tokyo, Japan) at 200 kV. The samples were first dispersed in isopropanol/water with an ultrasonic finger for 3 min. An EDX Thermo System Six was used for EDX mapping. TEM images of sample FSP-1F were measured with a Titan 80-300 (ThermoFisher Scientific, Waltham, MA, USA) at 300 kV, with the sample mounted on an Au grid with carbon film.
The catalysts were further characterised by XAS at the Fe K (7.1 keV), Co K (7.7 keV), Bi L3 (13.4 keV), and Mo K (20.0 keV) edges in transmission mode to determine the chemical structure of each component metal. XAS experiments were performed at the ROCK beamline stationed at the 2.75 GeV synchrotron source SOLEIL [54]. The beamline was equipped with two equivalent Quick-EXAFS monochromators with Si(111) and Si(220) crystals working at energies of 4–43 keV [54]. This setup provides edge-jumping capability to the beamline based on alternate use of the monochromators. XAS data analysis was performed using the Athena and Artemis interfaces of the IFEFFIT program [55]. The energy was calibrated to the first inflection point of a metal foil and then spectra were background corrected and normalised. More details are given in the Supplementary Materials.

3.3. Catalytic Tests

Catalytic performance for the selective oxidation of propylene was assessed in terms of conversion, yield, and selectivity towards acrolein, acrylic acid, and by-products, especially CO and CO2. The catalyst was pressed and sieved to give a sieve fraction of 300–450 µm, 800 mg of which were diluted with 800 mg SiC (sieve fraction 450–600 µm) to avoid thermal runaway, and was placed in a quartz tubular reactor with a 6-mm inner diameter resulting in ca. 40-mm bed length. The catalyst was treated as follows: (i) temperature ramp from RT to 180 °C (5 K min–1) in synthetic air (80/20 vol.% N2/O2, 100 mL min–1) followed by (ii) sequential ramp steps from 180 to 280, 300, 320, and 340 °C (2 K min–1) under reaction conditions (70/14/8/8 vol.% = N2/O2/C3H6/H2O). At each step, the total flow was set to 100, 150, and 200 mL min-1 in order to probe different weight hourly space velocities (WHSV). Reaction products were analysed by on-line gas chromatography (GC) using an Agilent 7890B positioned at the reactor outlet.

3.4. X-ray Nanotomography

X-ray nanotomography studies were performed at beamline ID16B of the European Synchrotron Radiation Facility (ESRF, Grenoble, France) operated at a fixed energy of 29.6 keV [56]. Samples were fixed on stainless-steel tomography pins using thermal resistant glue (Resbond 940HT, Cotronics, Brooklyn, NY, USA), then aligned in the centre of rotation axis using an optical microscope integrated into the beamline and the X-ray imaging camera. Full-field holotomography data was recorded using a pco.edge 5.5-s CMOS camera (2560 × 2160 pixels, 6.50-µm pixel size) coupled to an LSO: Tb scintillator with 10× magnifying optics. The sample was imaged at four distances from the detector (710, 720, 724, and 725 mm), and the detector remained at a fixed distance of 754 mm from the beam focus. This gave an effective pixel size of 25 nm at the longest sample-to-detector distance. Three thousand projections were collected with a 1-s exposure time at each position, with references collected after each 500 projections. A total of four subtomograms (collected in 1 h each) were taken into account for holotomographic phase retrieval with a Paganin-like approach, resulting in one set of phase projections of an entire catalyst particle (~50 to 60 µm). The entire dataset was collected in 4 h. XRF–CT and STXM–CT data were recorded simultaneously in scanning mode with a nanofocus beam size of 51 × 55 nm2. A translate-rotate measurement scheme was used across a horizontal range of 55 µm (70 µm for sample FSP-1R) with a 100-nm step size to generate one slice. The sample was then translated vertically in 500-nm steps and the measurement repeated to collect 8–10 slices. Two three-element Si drift fluorescence detectors were placed perpendicular to the beam path on either side of the sample, and XRF–CT data was recorded with an integration time of 100 ms per point. STXM–CT data was collected with photodiodes placed up- and downstream of the sample. The following fluorescence lines were defined as regions of interest (ROI): Mo Kα (17.48 keV), Bi Lα (10.84 keV), Co Kα (6.93 keV), and Fe Kα (6.41 keV). Sinograms for the elements of interest were obtained by fitting the measured spectra with the main fluorescence lines (Mo, Co, and Fe K-lines and Bi L-lines), in addition to some minor peaks due to impurities in the sample and known background peaks from beamline components. One tomogram of a sample cross section with a 4–5-µm height was collected after 8–10 h. STXM–CT data was collected by measuring the incident and transmitted beam intensity using X-ray photodiodes placed up- and downstream of the sample. Tomography data was reconstructed by the filtered back projection (FBP) method using PyHST2 code (v.2016, ESRF, Grenoble, France) for holotomography data and custom Matlab scripts for XRF–CT and STXM–CT. Data was visualised using the Avizo 9.3 (ThermoFisher Scientific, Waltham, MA, USA, 2017) software package (SM, Section 7).
Different stages of the catalyst lifetime were studied. In this case, tomographic images were obtained for a single particle (~50 µm diameter) of freshly prepared catalyst (FSP-1F). The same particle of FSP-1 was then treated under reaction conditions (70/14/8/8 vol.% = N2/O2/C3H6/H2O, 400 °C for 6 h) at ESRF in a quasi in situ approach, and a congruent sample volume was measured (FSP-1QI). Finally, a second particle was measured from the same catalyst batch following previous treatment in the fixed-bed reactor setup (Section 3.3) for a period of 5 days on stream (FSP-1R).

4. Conclusions

Flame spray pyrolysis offers an attractive route for the preparation of multicomponent catalyst systems such as Bi-Mo-Fe-Co oxides. Two selected catalysts were highly active for propylene oxidation at moderate oven temperatures (320–340 °C), exhibiting homogeneous elemental distribution, small crystallite size, and large surface areas. Whereas catalysts with slight molybdenum excess showed high selectivity towards both acrolein and acrylic acid, a stoichiometric catalyst was more selective for acrolein. Although the catalyst bed was diluted during testing, temperature spikes were observed due to high initial activity, leading to structural evolution on stream. This included nanoparticle sintering or agglomeration, increased heterogeneity and crystallinity, variable phase expression, as well as carbon deposition. In order to process flame-made multicomponent systems with high initial stability, further tuning of the synthesis parameters is required in the future. During on-stream structural evolution, bismuth in particular underwent drastic changes regarding metal dispersion and phase formation on the nm to the single-particle scale, as observed by numerous spectroscopic and microscopic characterisation methods. The complementary multimodal and multiscale approach herein was integral to the partial unravelling of the complex catalyst structure. Further studies should exploit spatially resolved operando spectroscopy for further identification of stable phases, active species, and spectator sites. The method presented here uses commonly available techniques and is widely applicable to other complex catalyst systems. Synchrotron X-ray tomography is highlighted as an emerging technique in catalysis for hierarchical structural analysis, particularly when complemented with bulk spectroscopies, 2D-imaging, and in situ measurements.

Supplementary Materials

The following materials are available online at https://www.mdpi.com/2073-4344/8/9/356/s1, Figure S1: Metal fraction of FSP-1 and FSP-2 catalysts before (-F) and after catalytic usage (-R) as determined by ICP-OES. Figure S2: Catalytic cycle for FSP-2, showing the temperatures of the oven and the catalyst bed as well as the WHSV. Figure S3: Additional STEM-HAADF images of FSP-1F as well as BF-TEM images of FSP-1R, FSP-2F, and FSP-2R. Figure S4: Experimental curve and result of the EXAFS fit of the catalyst in k space and R space. Figure S5: Snapshots from the supplementary movies. Table S1: Surface metal fraction as determined by XPS for FSP-1F and FSP-1R. Table S2: Results of Gaussian/Lorentzian curve deconvolution of recorded XPS signals. Table S3: DCLS-component-analysis-based fraction estimate of reference phases for the Raman spectra obtained via area scan. Table S4: TEM–EDX and HRTEM results for FSP-1R, FSP-2F, and FSP-2R. Table S5: Results of EXAFS fitting in R space. Video S1: 3D rendering of FSP-1F. Video S2: 3D rendering of FSP-1QI. Video S3: 3D rendering of FSP-1R.

Author Contributions

J.-D.G. conceptualized the study and provided primary supervision of the project together with T.L.S. P.S. and J.D.G. designed the experimental methodology. P.S. prepared, tested and characterized the catalysts and participated in all experimental work. T.L.S., J.-P.S., F.B., and A.G. participated in synchrotron experiments. T.L.S., J.-P.S., and A.G. performed primary data analysis for tomography and/or spectroscopy measurements. P.S., T.L.S., and J.-D.G. interpreted the experimental data. P.S. and T.L.S. wrote the original manuscript and all authors reviewed and edited the final version before submission.

Funding

X-ray microscopy studies were funded by the BMBF project “MicTomoCat” (05K16VK1). X-ray spectroscopy studies were performed at ROCK beamline (SOLEIL), which was funded by a public grant overseen by the French National Research Agency (ANR) as part of the “Investissements d’Avenir” program (ANR-10-EQPX-45). The Raman spectrometer used in this work was funded by a DFG grant (INST 121384/73-1).

Acknowledgments

We gratefully acknowledge ESRF for providing beamtime at ID16B. We thank Matthias Stehle (ITCP, KIT) for contributing to the experiments; Kalin Valev, Alexander Jaks, and the mechanical workshop at ITCP (KIT) for design and construction of the tomography sample holder. We thank Stéphanie Belin and Valérie Briois for their support during experiments at ROCK beamline (SOLEIL). We thank Angela Beilmann (ITCP, KIT) for BET analysis and Hermann Köhler (IKFT, KIT) for ICP-OES analysis. Evonik Industries AG are acknowledged for TEM–EDX and XPS measurements, along with Wu Wang (INT, KIT) and the Karlsruhe Nano Micro Facility (KNMF). Finally, we thank Wolfgang Kleist (ITCP/IKFT, KIT) for scientific input. We acknowledge support by Deutsche Forschungsgemeinschaft and the open access publishing agreement of Karlsruhe Institute of Technology.

Conflicts of Interest

The authors declare no conflict of interest.

References

  1. Arntz, D.; Fischer, A.; Höpp, M.; Jacobi, S.; Sauer, J.; Ohara, T.; Sato, T.; Shimizu, N.; Schwind, H. Acrolein and methacrolein. In Ullmann’s Encyclopedia of Industrial Chemistry; Weinheim; Wiley-VCH Verlag GmbH & Co. KGaA: Weinheim, Germany, 2007; Volume 1, pp. 329–346. [Google Scholar]
  2. Høj, M.; Linde, K.; Hansen, T.K.; Brorson, M.; Jensen, A.D.; Grunwaldt, J.-D. Flame spray synthesis of CoMo/Al2O3 hydrotreating catalysts. Appl. Catal. A 2011, 397, 201–208. [Google Scholar] [CrossRef]
  3. Callahan, J.L.; Grasselli, R.K.; Milberger, E.C.; Strecker, H.A. Oxidation and ammoxidation of propylene over bismuth molybdate catalysts. Ind. Eng. Chem. Prod. Res. Dev. 1970, 9, 134–142. [Google Scholar] [CrossRef]
  4. Grasselli, R.K.; Tenhover, M.A. Ammoxidation. In Handbook of Heterogeneous Catalysis, 2nd ed.; Ertl, G., Knözinger, H., Schüth, F., Weitkamp, J., Eds.; Wiley-VCH Verlag GmbH & Co. KGaA: Weinheim, Germany, 2008; Volume 1, pp. 3489–3517. [Google Scholar]
  5. Sprenger, P.; Kleist, W.; Grunwaldt, J.-D. Recent advances in selective propylene oxidation over bismuth molybdate based catalysts: Synthetic, spectroscopic and theoretical approaches. ACS Catal. 2017, 7, 5628–5642. [Google Scholar] [CrossRef]
  6. Moro-Oka, Y.; Ueda, W. Multicomponent bismuth molybdate catalyst. Adv. Catal. 1994, 40, 233–273. [Google Scholar]
  7. Schuh, K.; Kleist, W.; Høj, M.; Trouillet, V.; Beato, P.; Jensen, A.; Grunwaldt, J.-D. Bismuth molybdate catalysts prepared by mild hydrothermal synthesis: Influence of pH on the selective oxidation of propylene. Catalysts 2015, 5, 1554–1573. [Google Scholar] [CrossRef] [Green Version]
  8. Schuh, K.; Kleist, W.; Høj, M.; Trouillet, V.; Beato, P.; Jensen, A.D.; Patzke, G.R.; Grunwaldt, J.-D. Selective oxidation of propylene to acrolein by hydrothermally synthesized bismuth molybdates. Appl. Catal. A 2014, 482, 145–156. [Google Scholar] [CrossRef]
  9. Nell, A.; Getsoian, A.B.; Werner, S.; Kiwi-Minsker, L.; Bell, A.T. Preparation and characterization of high-surface-area Bi(1−x)/3V1−xMoxO4 catalysts. Langmuir 2014, 30, 873–880. [Google Scholar] [CrossRef] [PubMed]
  10. Farin, B.; Monteverde Videla, A.H.A.; Specchia, S.; Gaigneaux, E.M. Bismuth molybdates prepared by solution combustion synthesis for the partial oxidation of propene. Catal. Today 2015, 257, 11–17. [Google Scholar] [CrossRef]
  11. Schuh, K.; Kleist, W.; Høj, M.; Trouillet, V.; Jensen, A.D.; Grunwaldt, J.-D. One-step synthesis of bismuth molybdate catalysts via flame spray pyrolysis for the selective oxidation of propylene to acrolein. Chem. Commun. 2014, 50, 15404–15406. [Google Scholar] [CrossRef] [PubMed]
  12. Tonelli, M.; Aouine, M.; Massin, L.; Belliere Baca, V.; Millet, J.M.M. Selective oxidation of propene to acrolein on femoteo catalysts: Determination of active phase and enhancement of catalytic activity and stability. Catal. Sci. Technol. 2017, 7, 4629–4639. [Google Scholar] [CrossRef]
  13. Sprenger, P.; Stehle, M.; Gaur, A.; Gänzler, A.M.; Gashnikova, D.; Kleist, W.; Grunwaldt, J.-D. Reactivity of bismuth molybdates for selective oxidation of propylene probed by correlative operando spectroscopies. ACS Catal. 2018, 8, 6462–6475. [Google Scholar] [CrossRef]
  14. Mädler, L.; Kammler, H.K.; Mueller, R.; Pratsinis, S.E. Controlled synthesis of nanostructured particles by fame spray pyrolysis. J. Aerosol Sci. 2002, 33, 369–389. [Google Scholar] [CrossRef]
  15. Teoh, W.Y.; Amal, R.; Mädler, L. Flame spray pyrolysis: An enabling technology for nanoparticles design and fabrication. Nanoscale 2010, 2, 1324–1347. [Google Scholar] [CrossRef] [PubMed]
  16. Koirala, R.; Pratsinis, S.E.; Baiker, A. Synthesis of catalytic materials in flames: Opportunities and challenges. Chem. Soc. Rev. 2016, 45, 3053–3068. [Google Scholar] [CrossRef] [PubMed]
  17. Gröhn, A.J.; Pratsinis, S.E.; Wegner, K. Fluid-particle dynamics during combustion spray aerosol synthesis of ZrO2. Chem. Eng. J. 2012, 191, 491–502. [Google Scholar] [CrossRef]
  18. Grasselli, R.K. Site isolation and phase cooperation: Two important concepts in selective oxidation catalysis: A retrospective. Catal. Today 2014, 238, 10–27. [Google Scholar] [CrossRef]
  19. Ponceblanc, H.; Millet, J.M.M.; Coudurier, G.; Védrine, J.C. Synergy effect of multicomponent Co, Fe, and Bi molybdates in propene partial oxidation. In Catalytic Selective Oxidation; American Chemical Society: Washington, DC, USA, 1993; Volume 523, pp. 262–272. [Google Scholar]
  20. Grasselli, R.K. Advances and future trends in oxidation and ammoxidation catalysis. Catal. Today 1999, 49, 141–153. [Google Scholar] [CrossRef]
  21. Moro-Oka, Y.; Ueda, W.; Lee, K.-H. The role of bulk oxide ion in the catalytic oxidation reaction over metal oxide catalyst. J. Mol. Catal. A Chem. 2003, 199, 139–148. [Google Scholar] [CrossRef]
  22. Zhai, Z.; Getsoian, A.B.; Bell, A.T. The kinetics of selective oxidation of propene on bismuth vanadium molybdenum oxide catalysts. J. Catal. 2013, 308, 25–36. [Google Scholar] [CrossRef]
  23. Bañares, M.A. Operando methodology: Combination of in situ spectroscopy and simultaneous activity measurements under catalytic reaction conditions. Catal. Today 2005, 100, 71–77. [Google Scholar] [CrossRef]
  24. Buurmans, I.L.; Weckhuysen, B.M. Heterogeneities of individual catalyst particles in space and time as monitored by spectroscopy. Nat. Chem. 2012, 4, 873–886. [Google Scholar] [CrossRef] [PubMed]
  25. Grunwaldt, J.-D.; Wagner, J.B.; Dunin-Borkowski, R.E. Imaging catalysts at work: A hierarchical approach from the macro- to the meso- and nano-scale. ChemCatChem 2013, 5, 62–80. [Google Scholar] [CrossRef]
  26. Gross, E.; Somorjai, G.A. Molecular catalysis science: Nanoparticle synthesis and instrument development for studies under reaction conditions. J. Catal. 2015, 328, 91–101. [Google Scholar] [CrossRef] [Green Version]
  27. Frenkel, A.I.; Rodriguez, J.A.; Chen, J.G. Synchrotron techniques for in situ catalytic studies: Capabilities, challenges, and opportunities. ACS Catal. 2012, 2, 2269–2280. [Google Scholar] [CrossRef]
  28. Borfecchia, E.; Mino, L.; Groppo, E.; Bordiga, S.; Bugaev, A.L.; Budnyk, A.; Lomachenko, K.A.; Guda, A.A.; Soldatov, M.A.; Soldatov, A.V.; et al. Spectroscopic methods in catalysis and their application in well-defined nanocatalysts. Stud. Surf. Sci. Catal. 2017, 177, 221–284. [Google Scholar]
  29. Beale, A.M.; Jacques, S.D.; Weckhuysen, B.M. Chemical imaging of catalytic solids with synchrotron radiation. Chem. Soc. Rev. 2010, 39, 4656–4672. [Google Scholar] [CrossRef] [PubMed] [Green Version]
  30. Weckhuysen, B.M. Chemical imaging of spatial heterogeneities in catalytic solids at different length and time scales. Angew. Chem. Int. Ed. 2009, 48, 4910–4943. [Google Scholar] [CrossRef] [PubMed]
  31. Grunwaldt, J.-D.; Schroer, C.G. Hard and soft X-ray microscopy and tomography in catalysis: Bridging the different time and length scales. Chem. Soc. Rev. 2010, 39, 4741–4753. [Google Scholar] [CrossRef] [PubMed]
  32. Sheppard, T.L.; Price, S.W.T.; Benzi, F.; Baier, S.; Klumpp, M.; Dittmeyer, R.; Schwieger, W.; Grunwaldt, J.D. In situ multimodal 3D chemical imaging of a hierarchically structured core@shell catalyst. J. Am. Chem. Soc. 2017, 139, 7855–7863. [Google Scholar] [CrossRef] [PubMed]
  33. Price, S.W.; Martin, D.J.; Parsons, A.D.; Slawinski, W.A.; Vamvakeros, A.; Keylock, S.J.; Beale, A.M.; Mosselmans, J.F. Chemical imaging of Fischer-Tropsch catalysts under operating conditions. Sci. Adv. 2017, 3, e1602838. [Google Scholar] [CrossRef] [PubMed]
  34. Hofmann, G.; Rochet, A.; Ogel, E.; Casapu, M.; Ritter, S.; Ogurreck, M.; Grunwaldt, J.-D. Aging of a Pt/Al2O3 exhaust gas catalyst monitored by quasi in situ X-ray micro computed tomography. RSC Adv. 2015, 5, 6893–6905. [Google Scholar] [CrossRef]
  35. Bare, S.R.; Charochak, M.E.; Kelly, S.D.; Lai, B.; Wang, J.; Chen-Wiegart, Y.-C.K. Characterization of a fluidized catalytic cracking catalyst on ensemble and individual particle level by X-ray micro- and nanotomography, micro-X-ray fluorescence, and micro-X-ray diffraction. ChemCatChem 2014, 6, 1427–1437. [Google Scholar] [CrossRef]
  36. Da Silva, J.C.; Mader, K.; Holler, M.; Haberthur, D.; Diaz, A.; Guizar-Sicairos, M.; Cheng, W.C.; Shu, Y.; Raabe, J.; Menzel, A.; et al. Assessment of the 3D pore structure and individual components of preshaped catalyst bodies by X-ray imaging. ChemCatChem 2015, 7, 413–416. [Google Scholar] [CrossRef] [PubMed]
  37. Ihli, J.; Jacob, R.R.; Holler, M.; Guizar-Sicairos, M.; Diaz, A.; da Silva, J.C.; Ferreira Sanchez, D.; Krumeich, F.; Grolimund, D.; Taddei, M.; et al. A three-dimensional view of structural changes caused by deactivation of fluid catalytic cracking catalysts. Nat. Commun. 2017, 8, 809. [Google Scholar] [CrossRef] [PubMed] [Green Version]
  38. Meirer, F.; Kalirai, S.; Morris, D.; Soparawalla, S.; Liu, Y.; Mesu, G.; Andrews, J.C.; Weckhuysen, B.M. Life and death of a single catalytic cracking particle. Sci. Adv. 2015, 1, e1400199. [Google Scholar] [CrossRef] [PubMed]
  39. Liu, Y.; Meirer, F.; Krest, C.M.; Webb, S.; Weckhuysen, B.M. Relating structure and composition with accessibility of a single catalyst particle using correlative 3-dimensional micro-spectroscopy. Nat. Commun. 2016, 7, 12634. [Google Scholar] [CrossRef] [PubMed] [Green Version]
  40. Saleem, S.S. Infrared and Raman spectroscopic studies of the polymorphic forms of nickel, cobalt and ferric molybdates. Infrared Phys. 1987, 27, 309–315. [Google Scholar] [CrossRef]
  41. Seguin, L.; Figlarz, M.; Cavagnat, R.; Lassègues, J.-C. Infrared and Raman spectra of MoO3 molybdenum trioxides and MoO3 xH2O molybdenum trioxide hydrates. Spectrochim. Acta Part A 1995, 51, 1323–1344. [Google Scholar] [CrossRef]
  42. Tichý, J. Oxidation of acrolein to acrylic acid over vanadium-molybdenum oxide catalysts. Appl. Catal. A 1997, 157, 363–385. [Google Scholar] [CrossRef]
  43. Bui, L.; Bhan, A. Mechanisms for C–C bond cleavage and formation during acrolein production on a mixed metal oxide catalyst. Appl. Catal. A 2017, 546, 87–95. [Google Scholar] [CrossRef]
  44. Panov, G.I.; Starokon, E.V.; Parfenov, M.V.; Wei, B.; Sobolev, V.I.; Pirutko, L.V. Quasi-catalytic identification of intermediates in the oxidation of propene to acrolein over a multicomponent Bi–Mo catalyst. ACS Catal. 2018, 8, 1173–1177. [Google Scholar] [CrossRef]
  45. Zhang, W.; Trunschke, A.; Schlögl, R.; Su, D. Real-space observation of surface termination of a complex metal oxide catalyst. Angew. Chem. Int. Ed. 2010, 49, 6084–6089. [Google Scholar] [CrossRef] [PubMed]
  46. Engeldinger, J.; Radnik, J.; Kreyenschulte, C.; Devred, F.; Gaigneaux, E.M.; Fischer, A.; Zanthoff, H.-W.; Bentrup, U. Probing the structural changes and redox behavior of mixed molybdate catalysts under ammoxidation conditions: An operando Raman spectroscopy study. ChemCatChem 2016, 8, 976–983. [Google Scholar] [CrossRef]
  47. Hardcastle, F.D.; Wachs, I.E. Molecular structure of molybdenum oxide in bismuth molybdates by Raman spectroscopy. J. Phys. Chem. 1991, 95, 10763–10772. [Google Scholar] [CrossRef]
  48. Antonio, M.R.; Teller, R.G.; Sandstrom, D.R.; Mehicic, M.; Brazdil, J.F. Structural characterization of bismuth molybdates by X-ray absorption spectroscopy and powder neutron diffraction profile analysis. J. Phys. Chem. 1988, 92, 2939–2944. [Google Scholar] [CrossRef]
  49. Li, H.; Li, K.; Wang, H. Hydrothermal synthesis and photocatalytic properties of bismuth molybdate materials. Mater. Chem. Phys. 2009, 116, 134–142. [Google Scholar] [CrossRef]
  50. Rodriguez, J.A.; Chaturvedi, S.; Hanson, J.C.; Albornoz, A.; Brito, J.L. Electronic properties and phase transformations in CoMoO4 and NiMoO4: XANES and time-resolved synchrotron XRD studies. J. Phys. Chem. B 1998, 102, 1347–1355. [Google Scholar] [CrossRef]
  51. Beale, A.M.; Jacques, S.D.M.; Sacaliuc-Parvalescu, E.; O’Brien, M.G.; Barnes, P.; Weckhuysen, B.M. An iron molybdate catalyst for methanol to formaldehyde conversion prepared by a hydrothermal method and its characterization. Appl. Catal. A 2009, 363, 143–152. [Google Scholar] [CrossRef]
  52. Price, S.W.; Ignatyev, K.; Geraki, K.; Basham, M.; Filik, J.; Vo, N.T.; Witte, P.T.; Beale, A.M.; Mosselmans, J.F. Chemical imaging of single catalyst particles with scanning μ-XANES-CT and μ-XRF-CT. Phys. Chem. Chem. Phys. 2015, 17, 521–529. [Google Scholar] [CrossRef] [PubMed] [Green Version]
  53. Jacques, S.D.; Di Michiel, M.; Beale, A.M.; Sochi, T.; O’Brien, M.G.; Espinosa-Alonso, L.; Weckhuysen, B.M.; Barnes, P. Dynamic X-ray diffraction computed tomography reveals real-time insight into catalyst active phase evolution. Angew. Chem. Int. Ed. 2011, 50, 10148–10152. [Google Scholar] [CrossRef] [PubMed]
  54. Briois, V.; Fontaine, C.L.; Belin, S.; Barthe, L.; Th, M.; Pinty, V.; Carcy, A.; Girardot, R.; Fonda, E. Rock: The new Quick-EXAFS beamline at SOLEIL. J. Phys. Conf. Ser. 2016, 712, 012149. [Google Scholar] [CrossRef]
  55. Ravel, B.; Newville, M. Athena, artemis, hephaestus: Data analysis for X-ray absorption spectroscopy using IFEFFIT. J. Synchrotron Radiat. 2005, 12, 537–541. [Google Scholar] [CrossRef] [PubMed]
  56. Martinez-Criado, G.; Villanova, J.; Tucoulou, R.; Salomon, D.; Suuronen, J.P.; Laboure, S.; Guilloud, C.; Valls, V.; Barrett, R.; Gagliardini, E.; et al. ID16B: A hard X-ray nanoprobe beamline at the ESRF for nano-analysis. J. Synchrotron Radiat. 2016, 23, 344–352. [Google Scholar] [CrossRef] [PubMed]
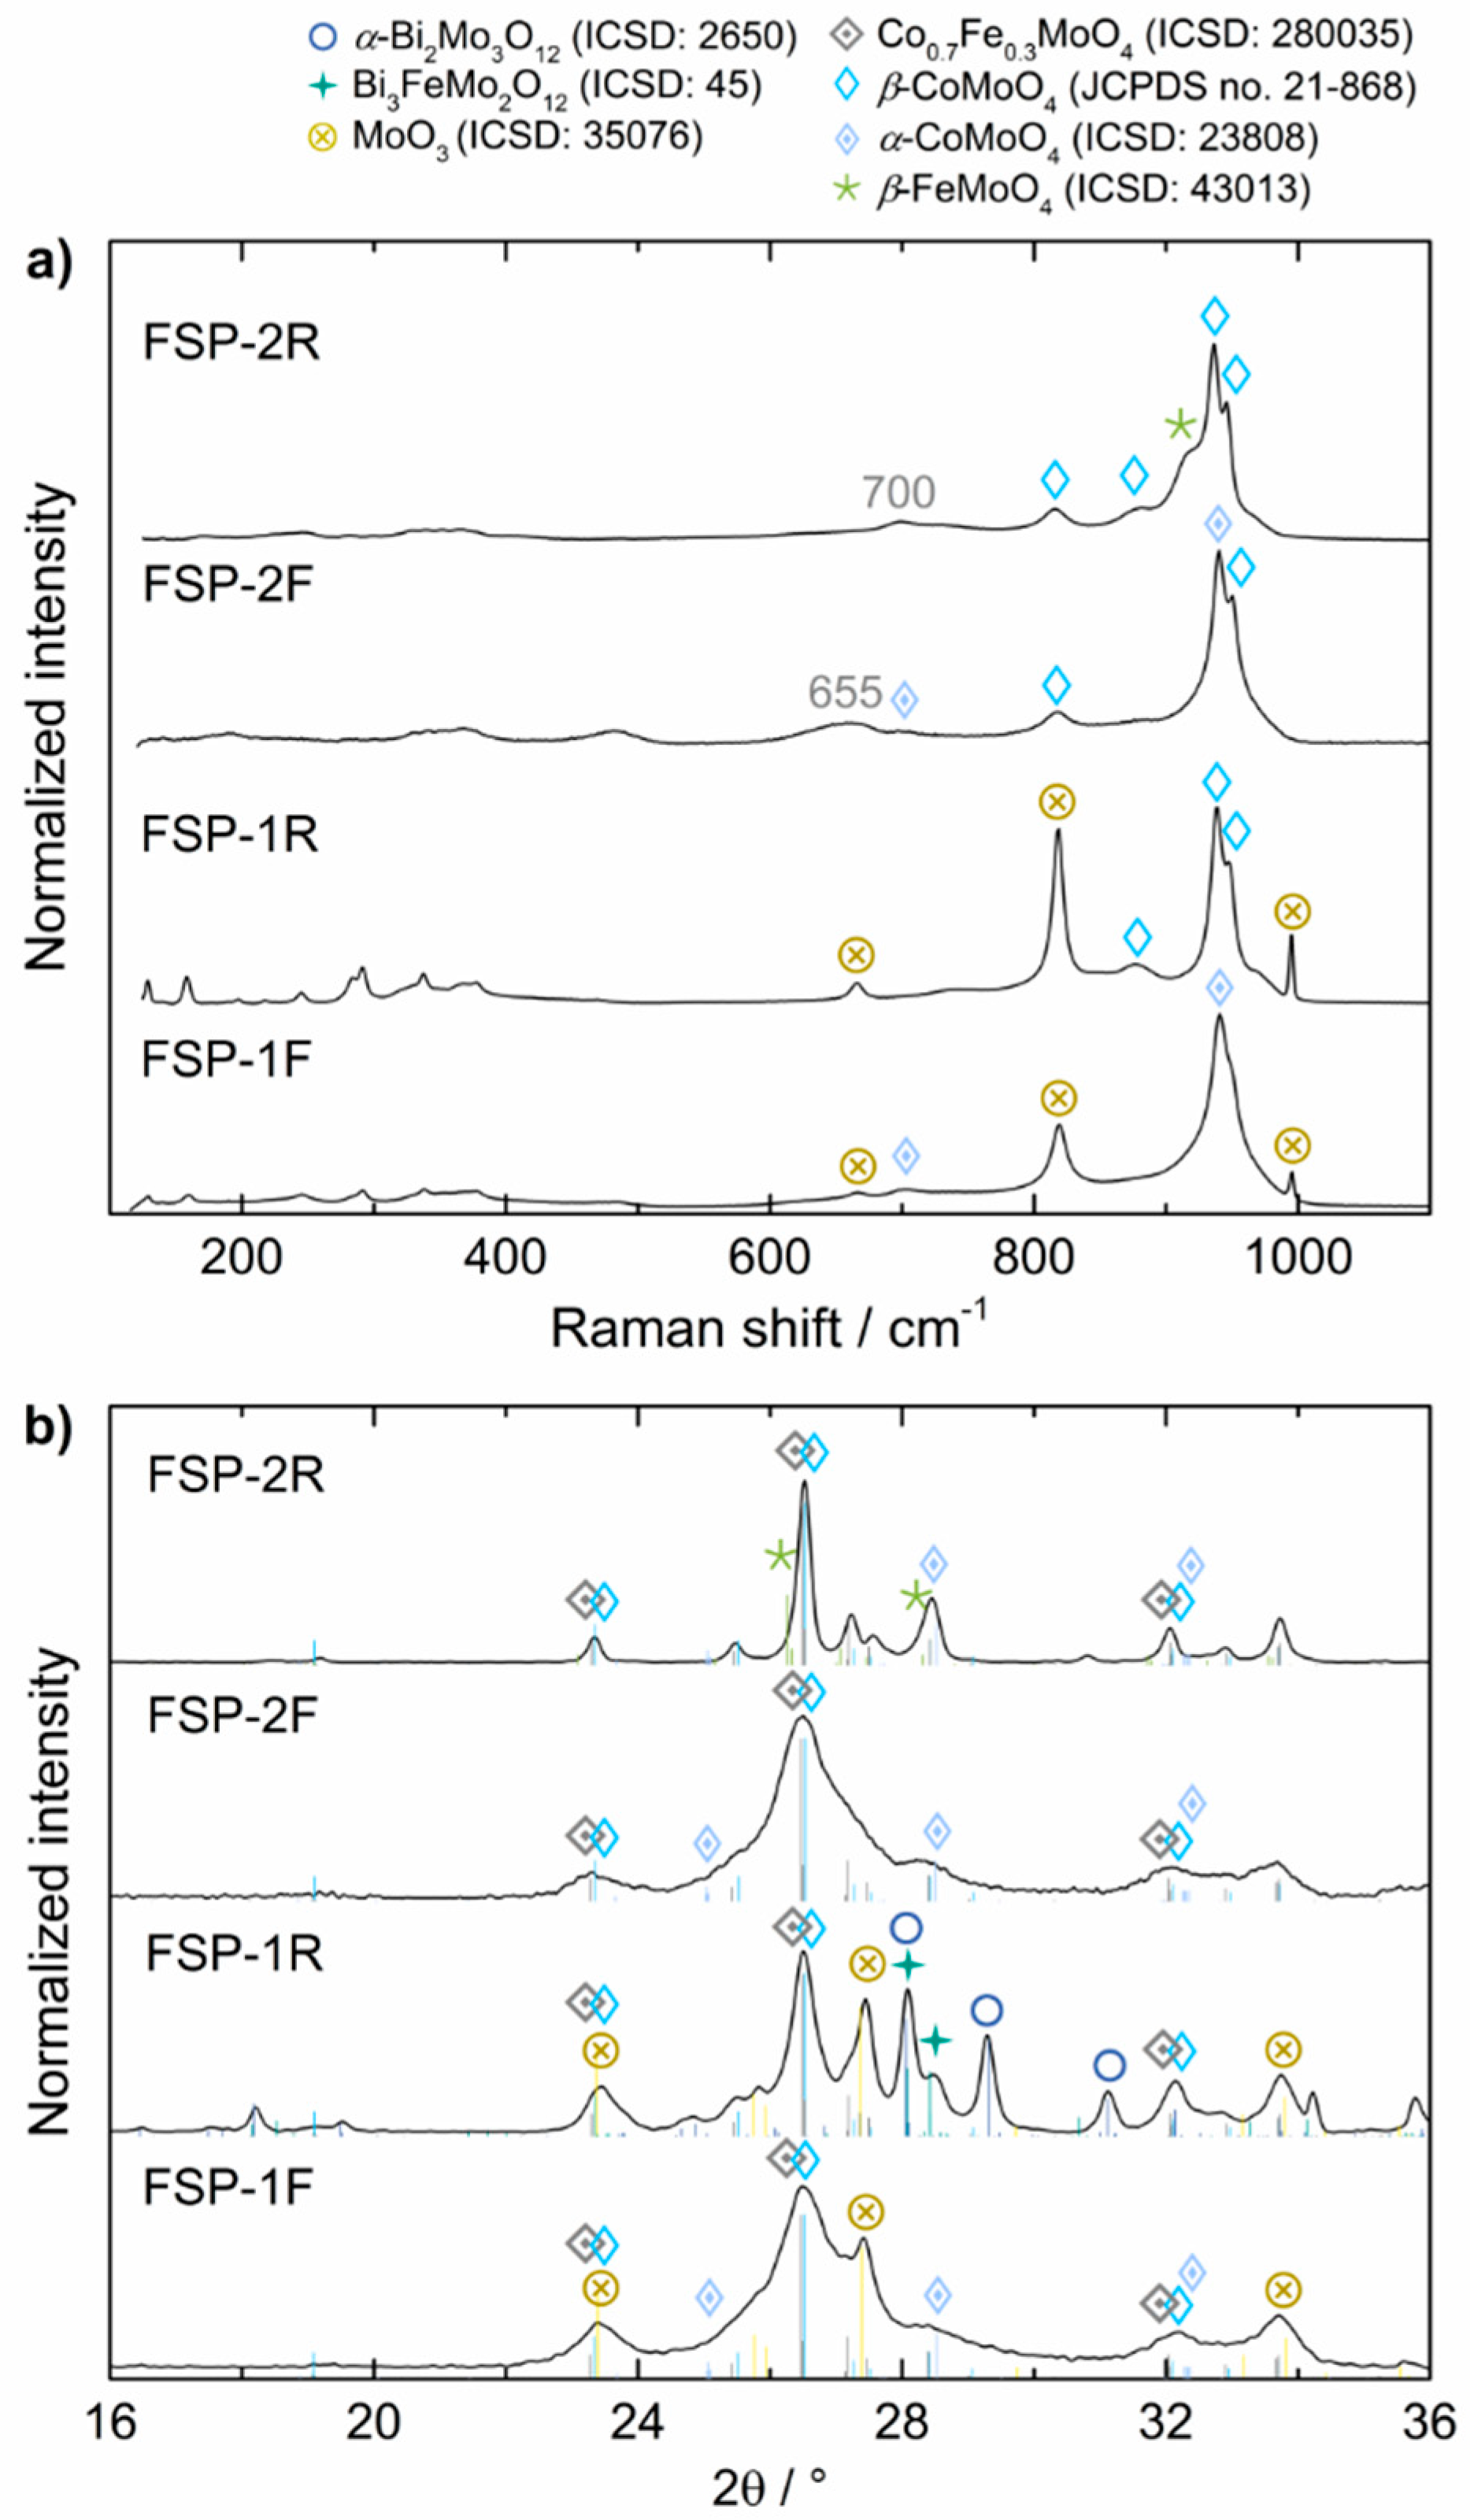
Figure 1. Raman spectra (a) and XRD patterns (b) of FSP-1 and FSP-2 before (-F) and after (-R) catalytic usage. Assignment of XRD patterns according to ICSD and JCPDS databases. Assignment of Raman bands according to earlier reports in literature (see Section 2.1 and Section 2.3).
Catalysts 08 00356 g001
Figure 2. Acrolein and acrylic acid selectivity as well as propylene conversion for FSP-1 (a), FSP-2 (b), and a Bi-Mo-Co-Fe oxide reference catalyst (c) at different WHSVs of 1.14–2.28 h–1 and oven temperatures of 320–340 °C. The progression of sum yield of acrolein and acrylic acid throughout the course of testing is displayed in (d). All catalysts were diluted with SiC (1:1).
Catalysts 08 00356 g002
Figure 3. STEM-HAADF and HRTEM (a) as well as BF-TEM and HRTEM (bd) images of flame-made catalysts. EDX results of the circled areas and additional images are given in Table S4. (Images of (a) were taken with a FEI Titan 80–300, (bd) with a Jeol 2010F field emission TEM).
Catalysts 08 00356 g003
Figure 4. Raman spectroscopic area maps of FSP-1F (a), FSP-1R (b), FSP-2F (c), and FSP-2R (d) showing the distribution of phases based on their main contribution to the spectra taken at each point; determined by DCLS component analysis with references of α-Bi2Mo3O12 (blue), α/β-CoMoO4 (cyan), FeMoO4 (green), Fe2Mo3O12 (pink), and MoO3 (yellow).
Catalysts 08 00356 g004
Figure 5. XANES spectra and Fourier transformation of the EXAFS region at Mo K (a,b), Bi L3 (c,d), Fe K (e,f), and Co K (g,h) edges before (FSP-1F) and after catalytic usage (FSP-1R) in a lab-scale reactor and ca. 5 days on stream.
Catalysts 08 00356 g005
Figure 6. Tomography setup at ID16B (ESRF), showing detector positions and sample arrangement for a ca. 50-µm catalyst particle glued to a steel pin (microscopic image).
Catalysts 08 00356 g006
Figure 7. (a) Holotomography renderings of complete particle of fresh catalyst FSP-1F and a separate particle of spent catalyst FSP-1R; (b) orthographic slices (colourised and greyscale) of the 3D holotomography renderings at the position indicated by the red arrow. 3D spatial resolution of ca. 100 nm.
Catalysts 08 00356 g007
Figure 8. (a) XRF–CT renderings of a complete particle of fresh catalyst FSP-1F and a separate particle of spent catalyst FSP-1R; (b) comparison of similar heterogeneous features observed in FSP-1R by holotomography, XRF–CT, and STXM–CT; (c) zoom in and overlay on the marked yellow area indicated in (b) with 50% transparency, showing a very good match of the Bi distribution to the heterogeneous features in FSP-1R.
Catalysts 08 00356 g008
Figure 9. Quasi in situ cell designed for treating a single catalyst particle under reaction conditions. After taking tomograms of FSP-1F, the particle was treated on-site for 6 h at 400 °C and measured again (FSP-1QI). A STXM–CT slice of the same area shows an increase in heterogeneity after quasi in situ treatment (highlight traces in yellow).
Catalysts 08 00356 g009
Table 1. Amounts and ratios of flame spray pyrolysis precursors used.
Sample NotationMolar Ratio/%Bi 2-eha *
/g
Mo 2-eha *
/g
Co 2-eha *
/g
Fe(acac)3 *
/g
BiMoCoFe
FSP-17.259.224.88.81.149.473.290.77
FSP-24.250.033.312.50.677.994.431.10
* eha = ethylhexanoate, acac = acetylacetonate.
Table 2. List of complementary characterisation techniques employed to study complex metal oxide catalysts on various length scales, as shown for FSP-1F and FSP-1R-2.
Data Type Characterisation MethodFSP-1FFSP-1R
Integral propertiesStructure (TEM, N2-physisorption)Nanoparticles (5–30 nm), SBET = 52 m2 g–1Nanoparticles (50–200 nm), SBET = 8 m2 g–1
Bulk elemental (ICP-OES)Observed values match expected values;
Bi: 6.9; Mo: 58.2; Co: 26.5; Fe: 8.4 mol%
No change observed;
Bi: 7.0; Mo: 58.0; Co: 26.5; Fe: 8.5 mol%
Surface elemental (XPS)Surface enriched in Co and Fe, compared to bulk;
Bi: 3.0; Mo: 42.6; Co: 35.9; Fe: 18.6 mol%
Surface enriched in Co and Fe, surface Mo/Bi ratio further increased;
Bi: 1.5; Mo: 40.9; Co: 34.3; Fe: 23.2 mol%
Crystalline phases (XRD)Nanocrystalline/amorphous material;
Co0.7Fe0.3MoO4, α-CoMoO4, β-CoMoO4, MoO3
Increased crystallinity and formation of phases;
α-Bi2Mo3O12, Co0.7Fe0.3MoO4, β-CoMoO4, Bi3FeMo2O12, MoO3
Amorphous and crystalline phases (Raman spectroscopy)Nanocrystalline/amorphous material;
α-CoMoO4, MoO3
Increased crystallinity, only main phases visible;
β-CoMoO4, MoO3
Local probe: Oxidation state, phase type, metal coordination (XANES)Mo6+: tetrahedral coord. (as in α-Bi2Mo3O12, β-Bi2Mo2O9, β-CoMoO4)
Bi3+
Fe2+: tetrahedral coord. (FeMoO4)
Co2+: tetrahedral coord. (β-CoMoO4)
Mo6+: more octahedral coord., inc. crystallinity (γ-Bi2MoO6, α-CoMoO4, MoO3)
Bi3+
Fe2+(3+): inc. octahedral coord. (FeMoO4, Fe2Mo3O12)
Co2+: Slightly inc. octahedral coord. (α/β-CoMoO4)
Catalytic activityHigh conversion (reference catalyst in brackets), e.g., XPropylene = 88% (5%) at 320 °C and weight hourly space velocity (WHSV) = 1.14 h–1, good selectivity at similar conversion, e.g., for FSP-2 SAcrolein = 87% (93%), SAcrylic acid = 0% (2%) at XPropylene = 13% (13%); stable conversion over 5 days
Structural fittingLocal probe: Lattice neighbours and phases (EXAFS)Mo: paths of Mo-O, Mo-Mo, Mo-Fe, and Mo-Co
Bi: only Bi-O coord. in first shell, highly amorphous
Fe: paths of Fe-O, Fe-Fe, and Fe-Mo, tetrahedral coord.
Co: paths of β-CoMoO4
Mo: inc. crystallinity and long-range order
Bi: inc. long-range order, incl. Bi-Fe and/or Bi-Co (Bi3FeMo2O12)
Fe: incl. order and Fe-O coord.
Co: inc. order, incl. crystallinity, exclusive Co-Mo character (β-CoMoO4 and weak α-CoMoO4)
Spatially resolved imaging2D-Elemental distribution (TEM–EDX)Homogeneous distribution, similar to bulk compositionHeterogeneous distribution on nm scale mainly due to Bi segregation; elemental ratios found correspond to α-Bi2Mo3O12, Co0.7Fe0.3MoO4, and MoO3 phases
2D-Phase distribution (Raman mapping)Homogeneous distribution of α-CoMoO4 and minor amounts of MoO3Heterogeneous phase distribution on µm scale; main (α/β CoMoO4, MoO3) and minor phases (α-Bi2Mo3O12, FeMoO4, Fe2Mo3O12)
3D-Structure and elemental distribution (Nanotomography)Homogeneous distribution of metals within catalyst particle, uniform phase contrastHeterogeneity of metals and phase contrast; aggregation of Bi within whole catalyst volume on nm to µm scale