Article

Plasma-Catalytic Mineralization of Toluene Adsorbed on CeO2

1
LPP, Ecole Polytechnique, UPMC, CNRS, Université Paris-Sud 11, 91128 Palaiseau CEDEX, France
2
IMT Lille Douai, University Lille, SAGE, 59000 Lille, France
*
Authors to whom correspondence should be addressed.
Catalysts 2018, 8(8), 303; https://doi.org/10.3390/catal8080303
Submission received: 6 July 2018 / Revised: 23 July 2018 / Accepted: 24 July 2018 / Published: 27 July 2018
(This article belongs to the Special Issue Plasma Catalysis)

Abstract

:
In the context of coupling nonthermal plasmas with catalytic materials, CeO2 is used as adsorbent for toluene and combined with plasma for toluene oxidation. Two configurations are addressed for the regeneration of toluene saturated CeO2: (i) in plasma-catalysis (IPC); and (ii) post plasma-catalysis (PPC). As an advanced oxidation technique, the performances of toluene mineralization by the plasma-catalytic systems are evaluated and compared through the formation of CO2. First, the adsorption of 100 ppm of toluene onto CeO2 is characterized in detail. Total, reversible and irreversible adsorbed fractions are quantified. Specific attention is paid to the influence of relative humidity (RH): (i) on the adsorption of toluene on CeO2; and (ii) on the formation of ozone in IPC and PPC reactors. Then, the mineralization yield and the mineralization efficiency of adsorbed toluene are defined and investigated as a function of the specific input energy (SIE). Under these conditions, IPC and PPC reactors are compared. Interestingly, the highest mineralization yield and efficiency are achieved using the in-situ configuration operated with the lowest SIE, that is, lean conditions of ozone. Based on these results, the specific impact of RH on the IPC treatment of toluene adsorbed on CeO2 is addressed. Taking into account the impact of RH on toluene adsorption and ozone production, it is evidenced that the mineralization of toluene adsorbed on CeO2 is directly controlled by the amount of ozone produced by the discharge and decomposed on the surface of the coupling material. Results highlight the key role of ozone in the mineralization process and the possible detrimental effect of moisture.

1. Introduction

Volatile organic compounds (VOCs), from both natural sources and human activities such as transport, organic solvents and solvent-containing products, production processes and combustion processes [1], have environmental and health impacts [2,3]. Toluene is widespread in the environment owing to its use in a wide variety of household and commercial products [4]. In indoor environments, toluene levels are higher than outdoor; this confinement effect is clearly enhanced by specific sources such as tobacco smoke [5]. Therefore, the abatement of VOCs has motivated research toward an efficient and economical approach. Nonthermal plasma (NTP) technology, as an alternative to conventional VOC abatement techniques, received increasing interest during recent decades [6,7,8,9,10,11,12,13,14,15]. However, the application of NTP for VOC abatement has three main drawback: first, the incomplete oxidation of primary pollutants with unwanted side-product emissions; second, the low mineralization rate of organic pollutants; and third, the low energy efficiency [16]. In order to overcome these weaknesses, an alternative relies on the combination of plasma with catalysts. Plasma-catalytic systems can be divided into two categories depending on the location of the coupling material with respect to the dielectric barrier discharge (DBD) reactor. If the catalyst is directly placed inside the discharge zone, it is referred to as in plasma catalysis (IPC) [17,18]. If the catalyst is placed downstream the DBD reactor, it is referred to as post plasma catalysis (PPC) [18,19].
In the PPC configuration, the main role of the plasma is to generate reactive chemical species, mainly ozone, to convert the pollutants residing on the surface of the coupling catalyst. The role of the catalyst is to enhance the process selectivity and efficiency as well as to remove undesired by-products released by the plasma, such as NOx or O3. In the IPC configuration, coupling materials are directly inserted in the discharge zone. In 2003, Ogata et al. [20] confirmed: (i) the positive impact of porous and high specific surface materials; and (ii) the possible activation of catalytic surfaces under plasma exposure. The activation of various catalytic surfaces, among them metal loaded catalysts, was also confirmed by Hammer et al. [21], Kirkpatrick et al. [22] and Ayrault et al. [23]. Various papers pointing out the synergetic effects between plasma and catalysts in the IPC configuration were published and tried to raise and validate hypotheses to explain this positive interaction. In their review on the removal of VOCs by single-stage and two-stage plasma catalytic systems, Chen et al. [18] rigorously attempted to distinguish the influence of the catalyst on the plasma processes from the plasma influence on the catalytic processes in the IPC configuration.
Besides the catalyst position, air relative humidity plays a key role into the VOC oxidation process. Even in the absence of a catalyst, humidity strongly affects the plasma characteristics and among them the ozone production. Some studies indicated [24,25,26] that a moderate relative humidity present in the gas mixture has a favorable effect on the toluene decomposition in the plasma without catalysts. However, in plasma-catalytic system, a negative effect both in in-situ and post-situ plasma configurations was reported for different catalysts [26,27,28]. Indeed, the adsorption of water molecules on the catalyst surface could hinder the sorptive and reactive sites [25] leading to a reduced catalyst activity. It has also been reported that the various behaviors of the VOCs on TiO2 surface are directly related to their adsorption modes and parameters and to the VOC–water interactions in adsorbed phase [29]. More generally, it is required to investigate the performances of any air treatment process under humid conditions: first to address realistic conditions, second to be able to assess the effective role of moisture on the process performance which can be twofold. Although water can be dissociated to produce HO• radicals beneficial for VOC oxidation, high humidity levels are detrimental to O3 by decreasing O concentration on the catalyst surface [30].
In a previous study [31], adsorption and oxidation of toluene on CeO2 was reported under plasma exposure using two different configurations and only surface monitoring diagnostics: IPC was studied using Sorbent-TRACK device [32]; PPC was studied using Diffuse Reflectance Infrared Fourier Transform Spectroscopy—DRIFTS [33]. The formations and the temporal evolutions of organic reaction intermediates onto CeO2 surface were discussed. Unlike the former study was centered on surface processes, this paper focuses on the performances of CeO2 coupled to NTP in the oxidation of toluene through gas phase characterization. As a VOC oxidation process, the main performance parameter of plasma-catalysis is the formation of CO2, that is, the mineralization. In that regard, specific attention has been paid to the monitoring of CO2 formation. The key process parameters such as specific input energy of the plasma, level of relative humidity in the air flow and configurations of the reactor (IPC and PPC) are evaluated in order to determine how they influence the mineralization performances of the plasma-catalytic system. Obtained results aim (i) at determining the optimal conditions for toluene mineralization and (ii) at understanding the limiting steps and the performances of such an air treatment process.

2. Results and Discussion

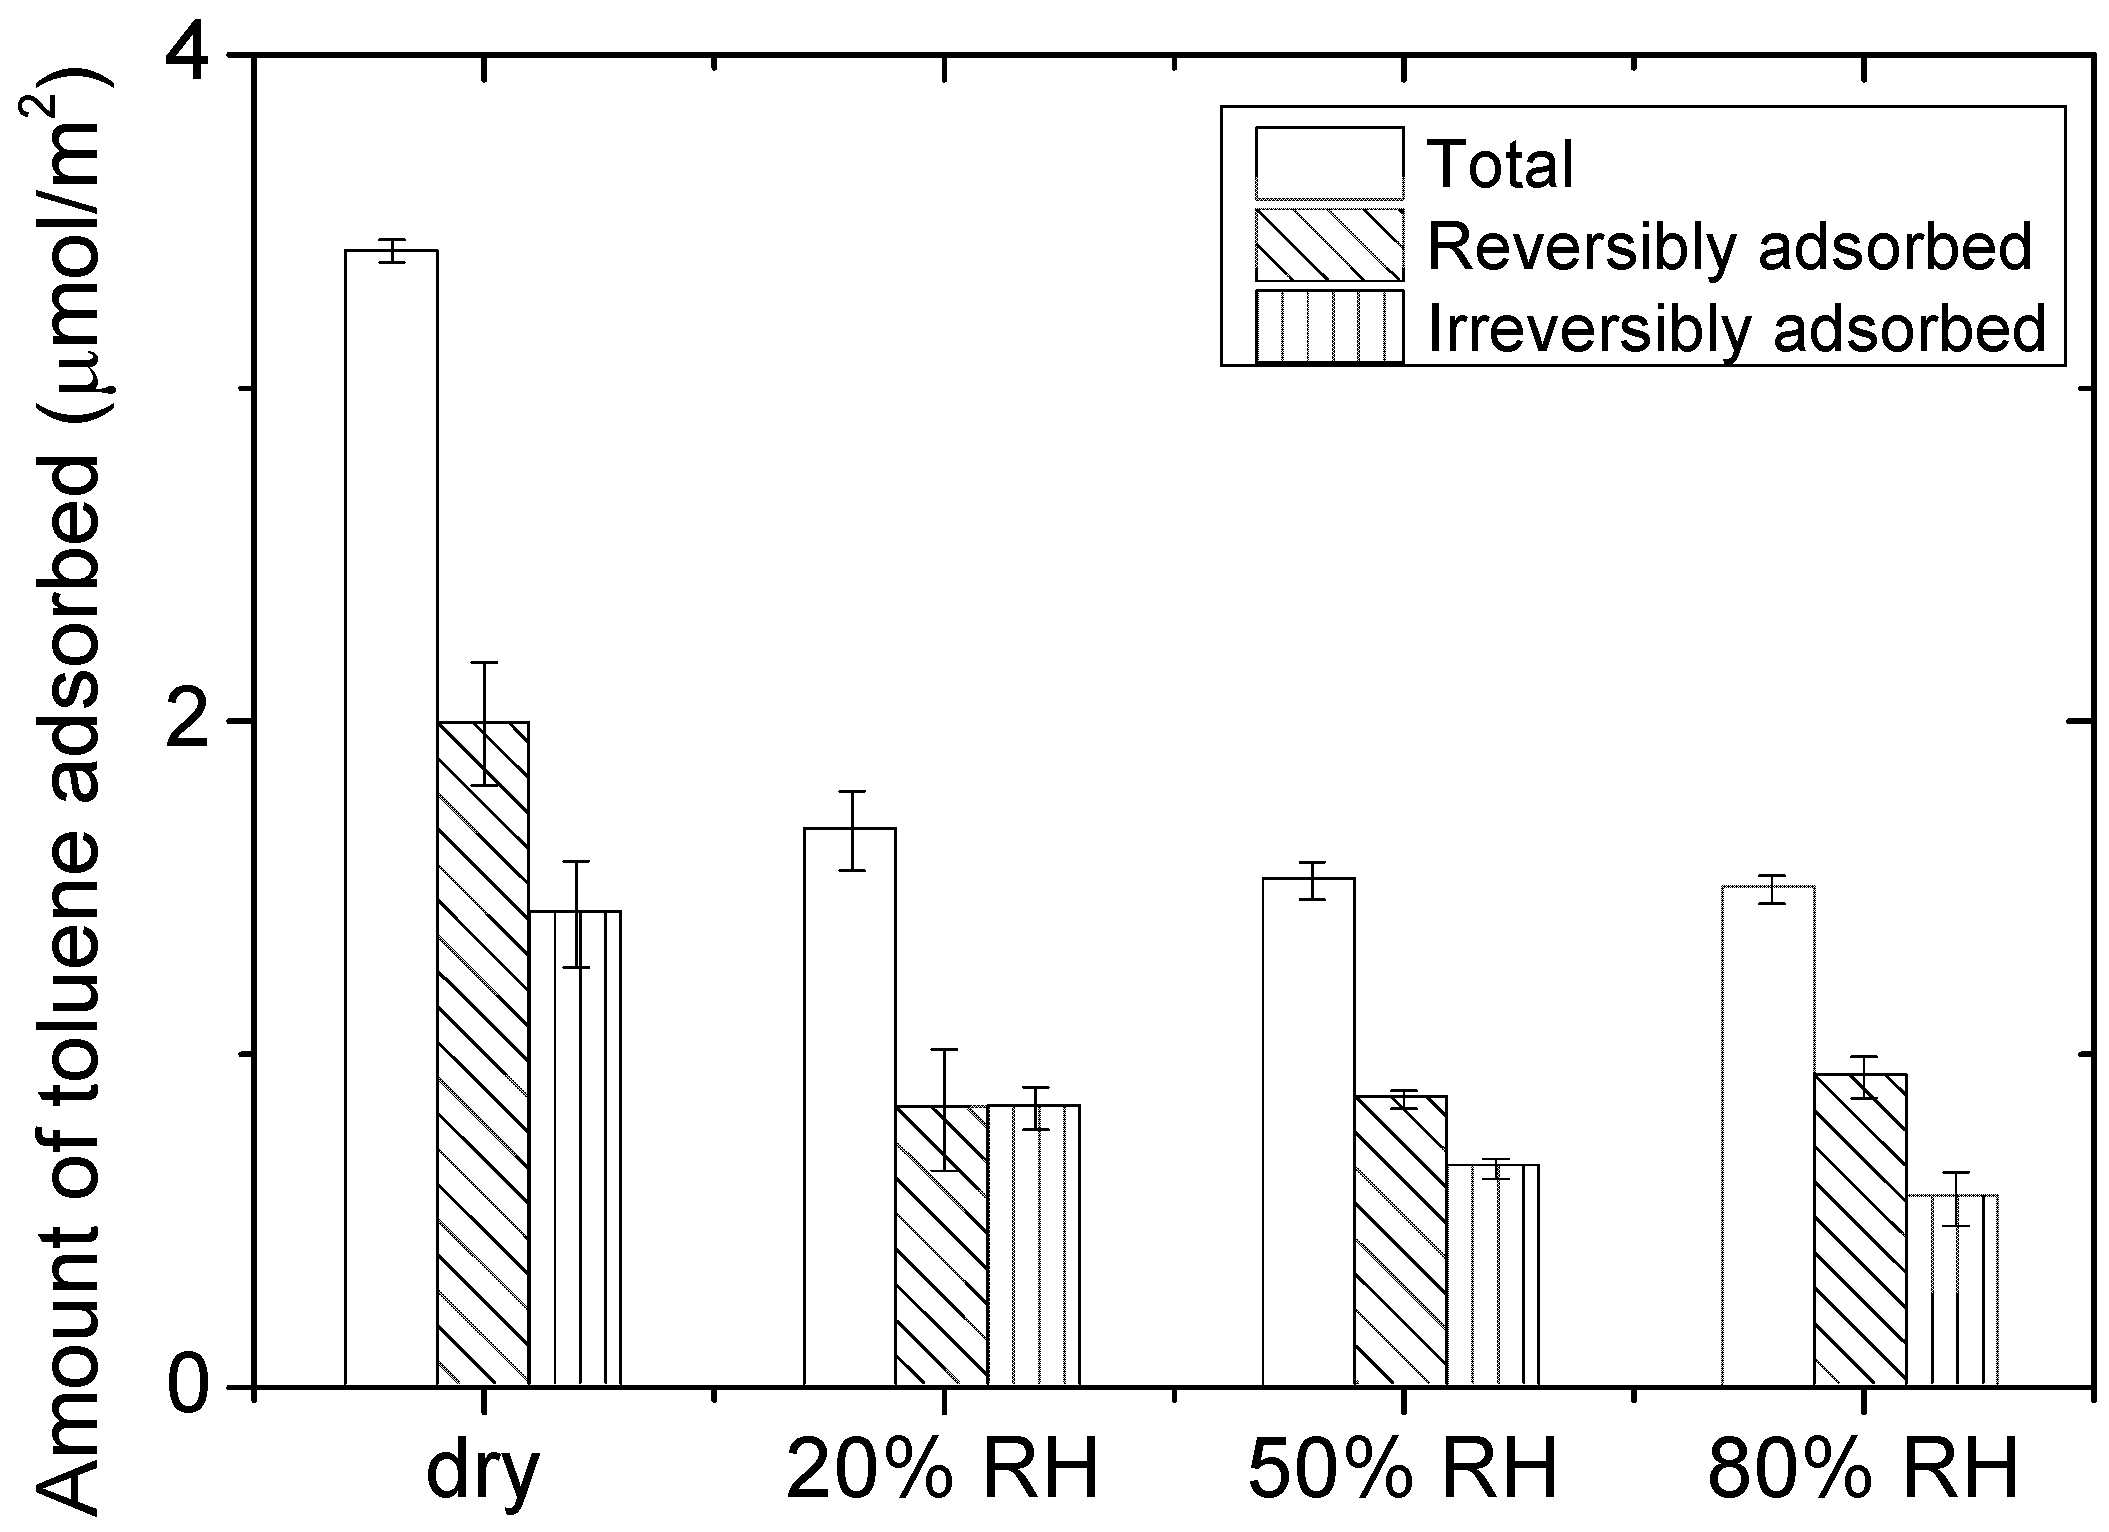
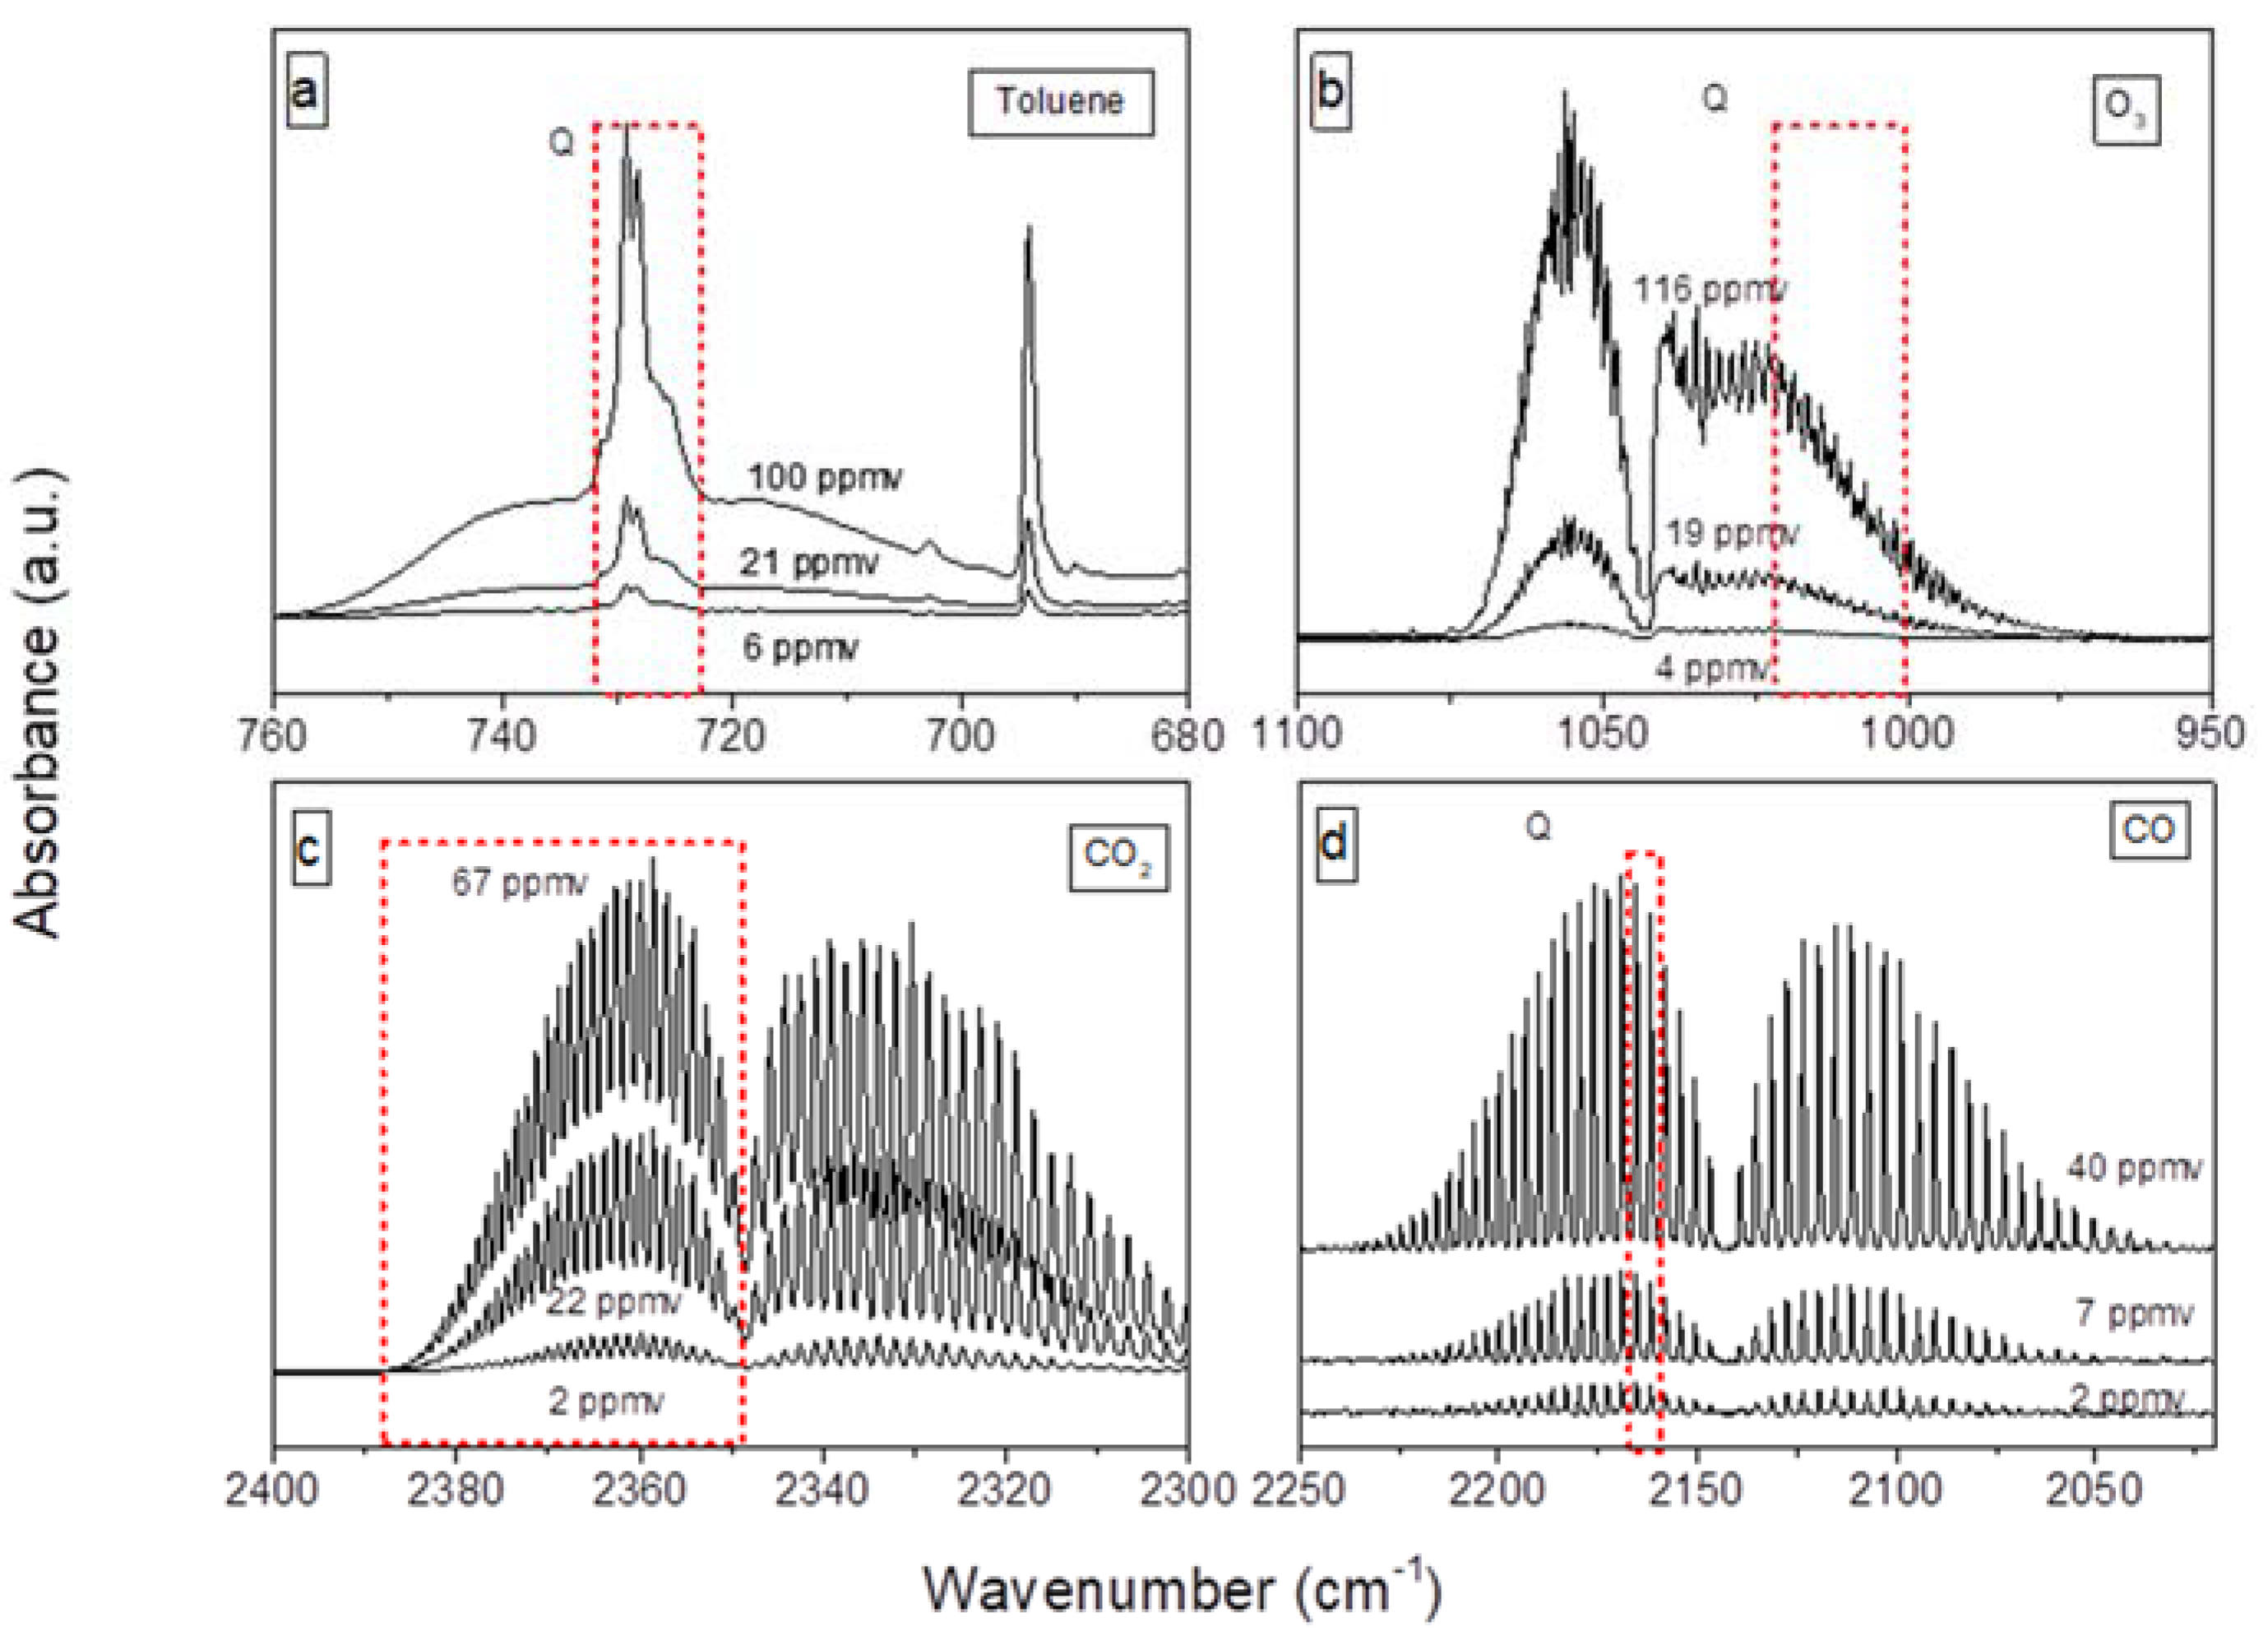
2.1. Characterization of the Adsorption of 100 ppm of Toluene on CeO2

The adsorption capacity of CeO2 regarding 100 ppm of toluene is determined using the experimental method reported in previous study [34] and described in the first three steps of the experimental protocol reported in Section 3.5. Figure 1 displays the quantification of the (i) total, (ii) reversible and (iii) irreversible fractions of toluene adsorbed on CeO2 surface and expressed in µmol/m2 for different RH levels (0–80%). Every experiment is repeated at least three times and the corresponding standard errors are calculated by dividing standard deviations by the square root of the number of experiments. Under 0% RH, a total of 3.4 μmol/m2 of toluene are adsorbed on CeO2 right after toluene breakthrough. The flushing step under dry air leads to the desorption of 2.0 μmol/m2 of toluene which accounts for the reversibly adsorbed fraction. The amount of irreversibly adsorbed toluene on CeO2 is given by the subtraction of these two values, that is, 1.4 ± 0.2 μmol/m2. F. Batault. [35] reported the irreversible fraction of toluene as 0.77 ± 0.29 μmol/m2 onto P25-Degussa TiO2 for the same concentration range of toluene. Bouzaza et al. [36] reported that the total adsorbed amount of toluene on TiO2 is 3.9 μmol/m2. Similarly, Takeuchi et al. [37] reported values ranging from 2 to 3 μmol/m2 for toluene adsorption on zeolites. In spite of the contrasted chemical natures of these materials, values obtained for the adsorption of ca. 100 ppm of toluene range within the same order of magnitude onto metal oxides.
In the presence of moisture, the total amount of toluene adsorbed acutely drops from 3.4 μmol/m2 under dry condition to 1.7 μmol/m2 under 20% RH. Between 20, 50 and 80% RH, the total amount of toluene adsorbed remains unchanged while the amount of irreversibly adsorbed toluene slightly decreases with increasing RH. Goss et al. [38] have shown that mineral surfaces, that is, metal oxide surfaces, exhibit monolayer coverage by water molecules as the relative humidity reaches 20–30%. Below 20%, as the surface coverage of the material by water molecule is lower than 1, the VOCs can either directly adsorb on the metal oxide surface or interact with the incomplete water layer. Nevertheless, even with a RH lower than 20%, the adsorption of water molecules is favored because of (i) the high affinity of water for metal oxide polar surfaces [38] and (ii) the high partial pressure of water, ca. 6300 ppm for 20% RH under room temperature, compared to that of the considered VOC (100 ppm). This explains the significant decrease in the tota amount of toluene adsorbed from dry conditions to 20% RH. As RH increases over 20–30%, VOCs necessarily interact with water layers present on the surface of the metal oxide. Adsorption at the interface between the adsorbent and the water layer is thermodynamically unfavorable for non-polar compounds such as toluene [39,40].

2.2. Comparison of PPC and IPC Performances under Dry Air Conditions

2.2.1. Performance Criteria

The performances of the PPC and IPC configurations are compared regarding their respective abilities to regenerate CeO2 surface saturated with toluene. The main criterion relies in the mineralization yield, that is, the formation yield of CO2 proceeding from toluene oxidation. The mineralization yield, denoted by ρ (t) in the following, represents the evolution of the quantity of CO2 produced per Joule of injected energy (nmol CO2/J) as a function of time t Equation (1).
ρ ( t ) = q C O 2 ( t ) p i n j  
In Equation (1), q C O 2 ( t ) represents the quantity of CO2 produced as a function of time t and expressed in nmol. P i n j represents the discharge injected power (J/s). The integration of ρ (t) on the time interval [0, t] enables the calculation of the mineralization efficiency η as reported in Equation (2).
η = 0 t ρ t

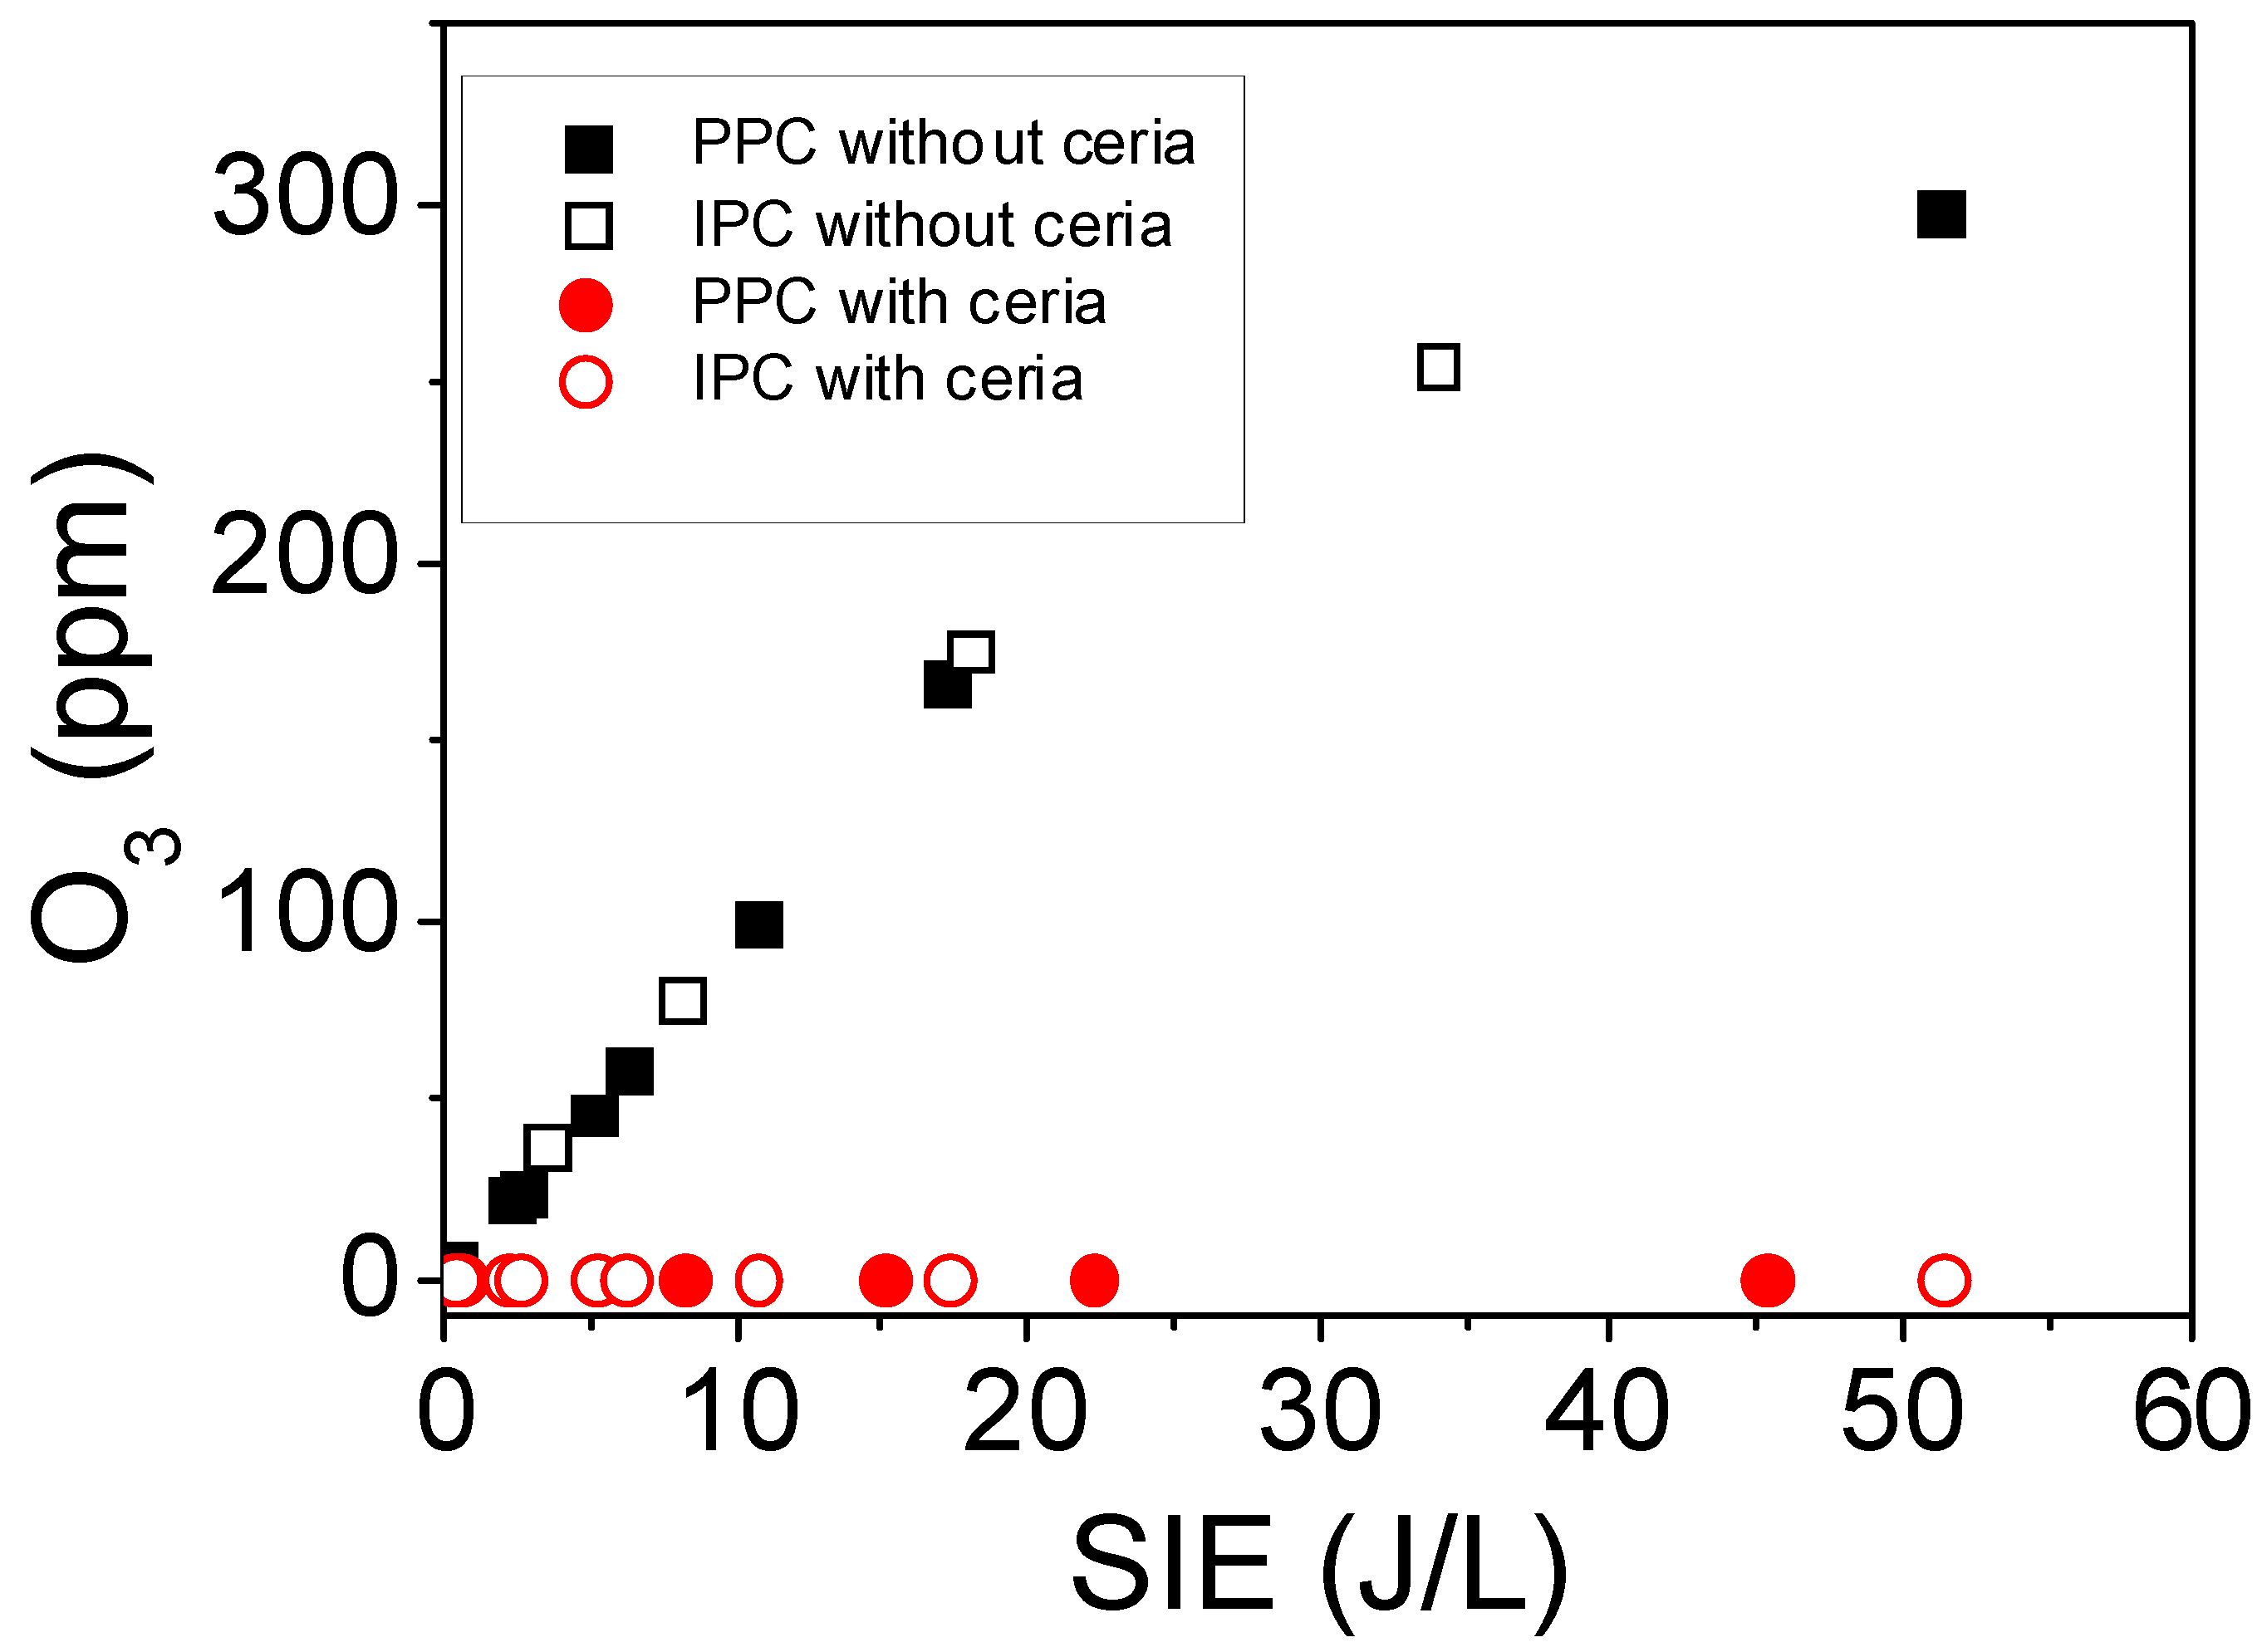
2.2.2. Formation of Ozone Using PPC and IPC Configurations

First, the ability of each reactor configuration to generate ozone has been addressed. Figure 2 reports ozone concentration as a function of the specific input energy for both PPC and IPC reactors, under dry and humid conditions, with and without ceria. On the one hand, no difference in ozone production by the PPC and IPC configuration reactor is noticeable in the absence of ceria. Both reactors provide the same increasing ozone generation with respect to specific input energy (SIE) up to 55 J/L. This behavior evidences the ability of both experimental devices to generate the same flow of ozone for the same specific input energy. On the other hand, when ceria is coupled to IPC and PPC reactors, no ozone is detected at the reactor outlets regardless of IPC or PPC configuration. Under both configurations, CeO2 provides a complete conversion of the ozone molecules produced whether the material is placed inside or downstream the discharge. Moreover, CeO2 has higher oxygen storage/transport capacity combined with the ability to shift easily between reduced and oxidized states (i.e., Ce3+–Ce4+) which results in an oxygen vacancies. The ozone decomposition to reactive oxygen species on CeO2 has been proposed by Mao et al. [41] in the following reaction:
CeO2[O2−] + O3 → O2 + O* + CeO2[O2−]
The mechanism of toluene decomposition could be initiated by the reaction of toluene with O* and form CO2 and H2O.

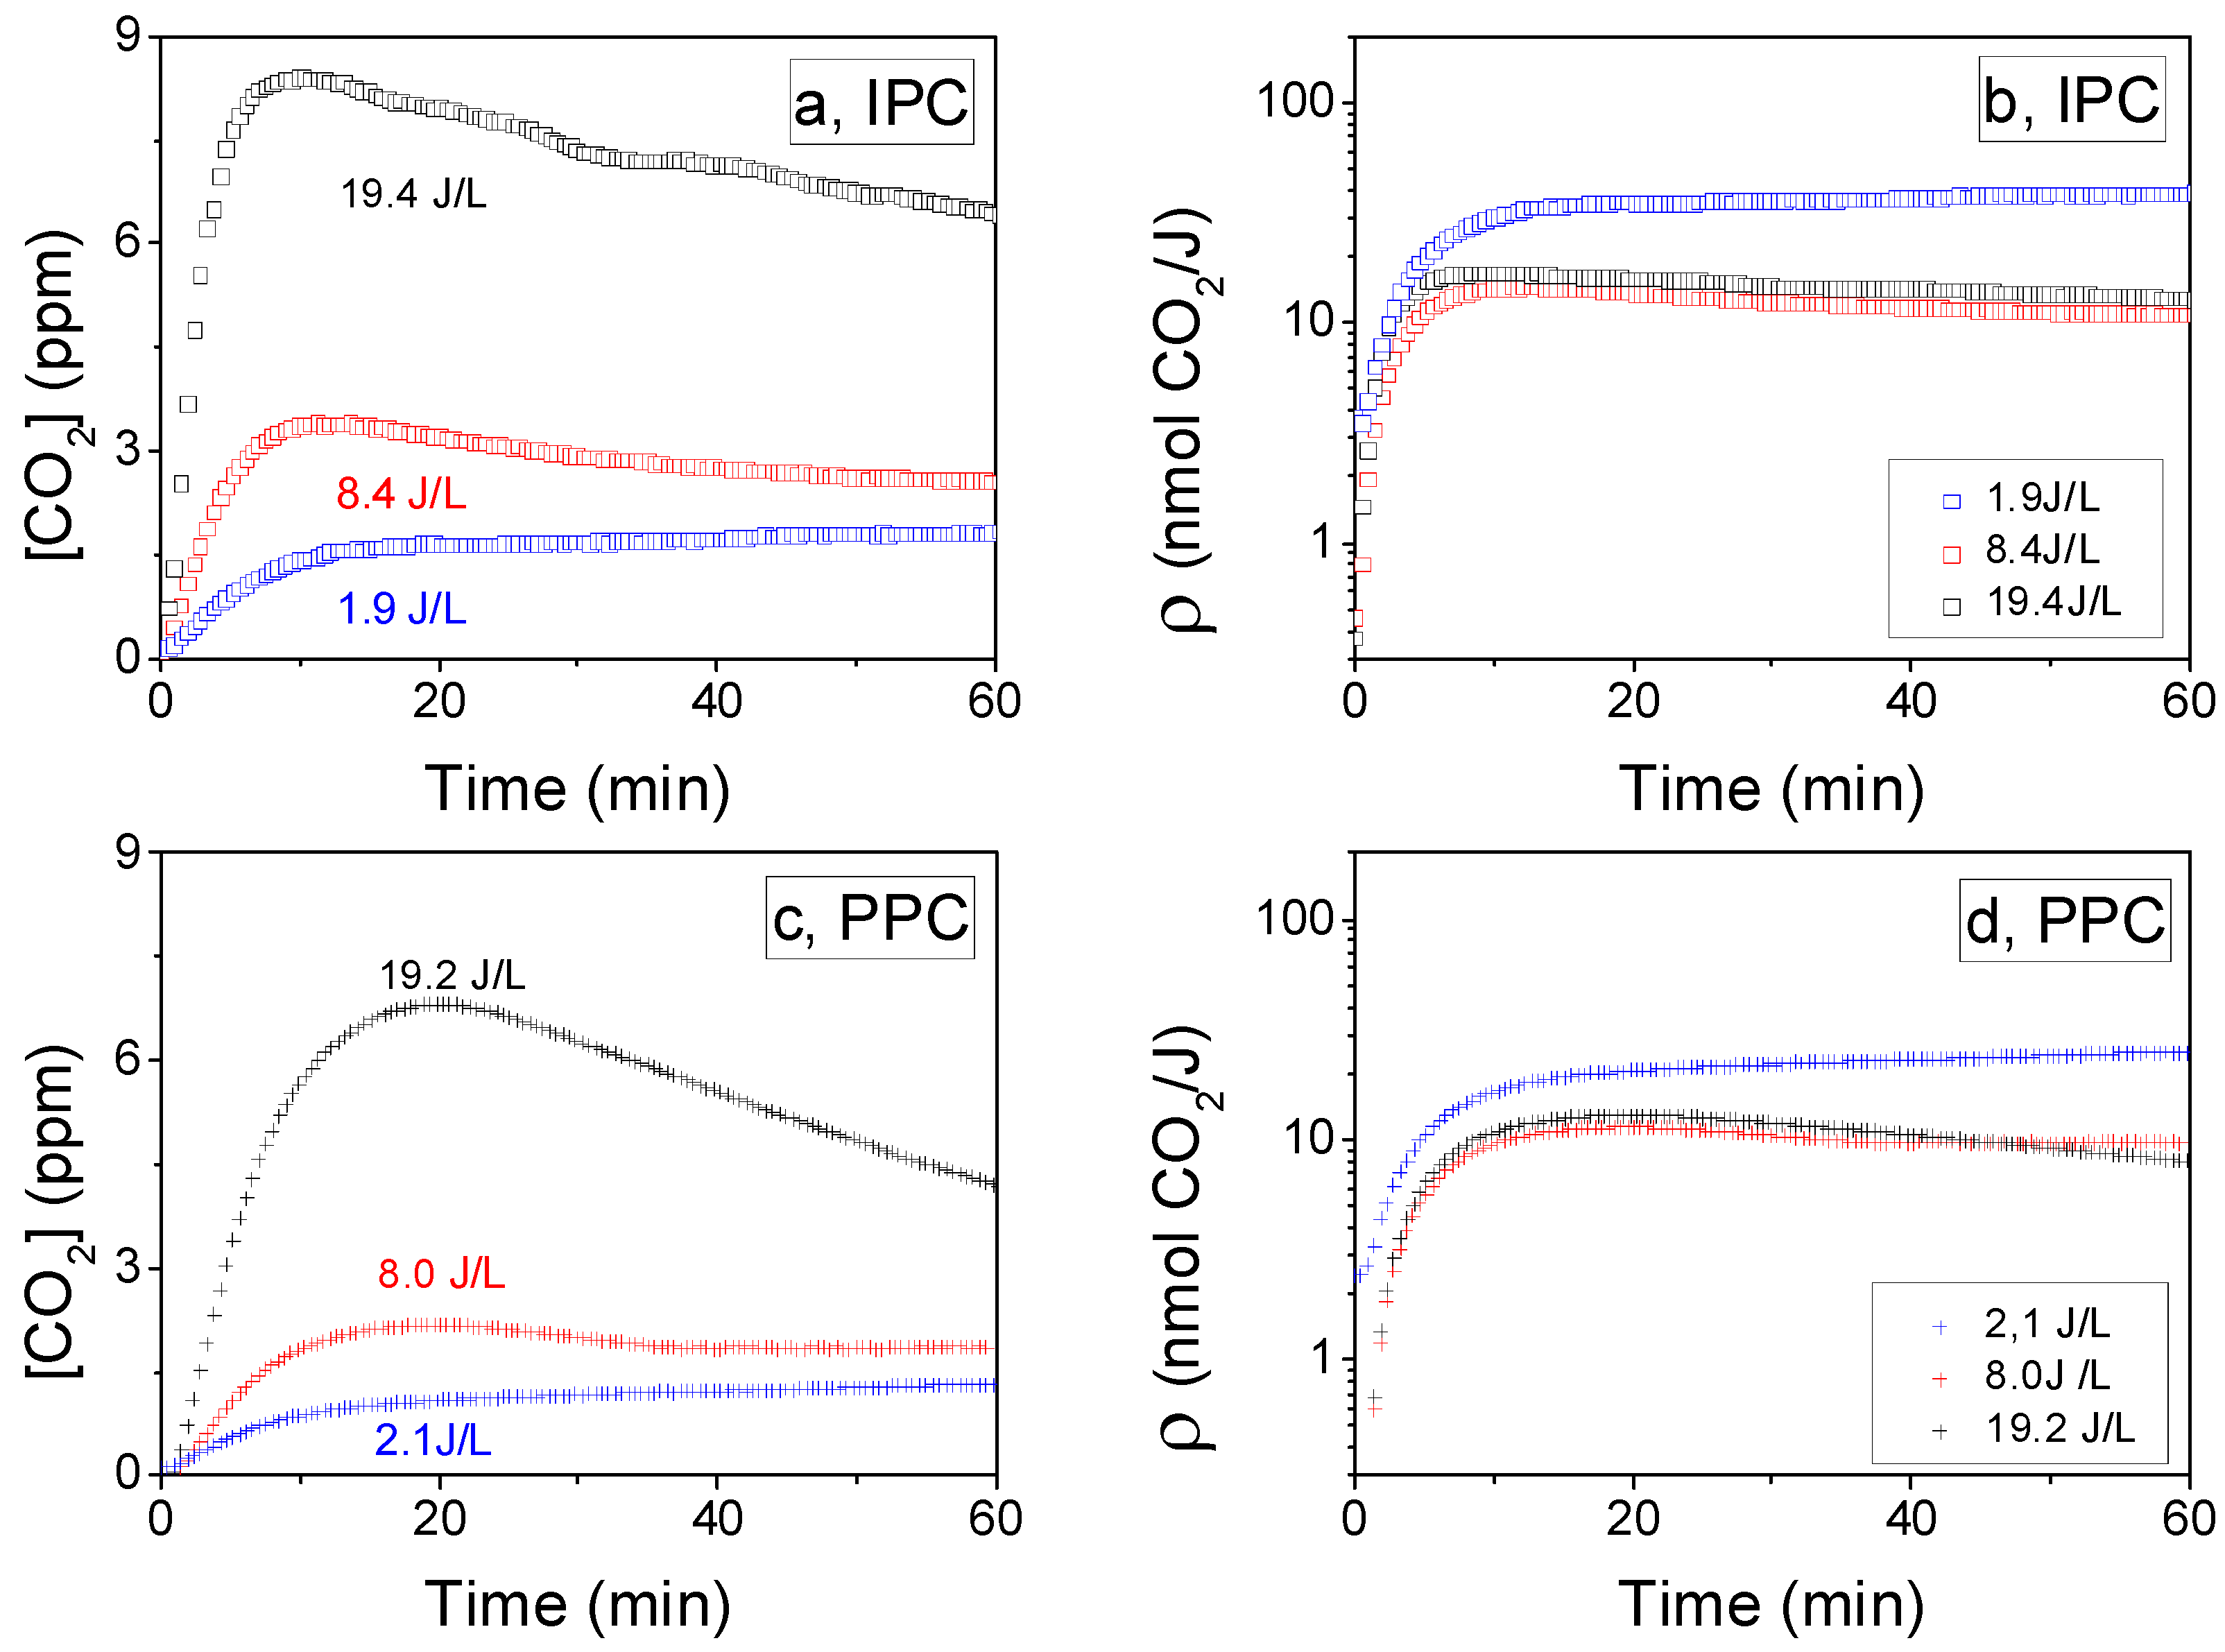
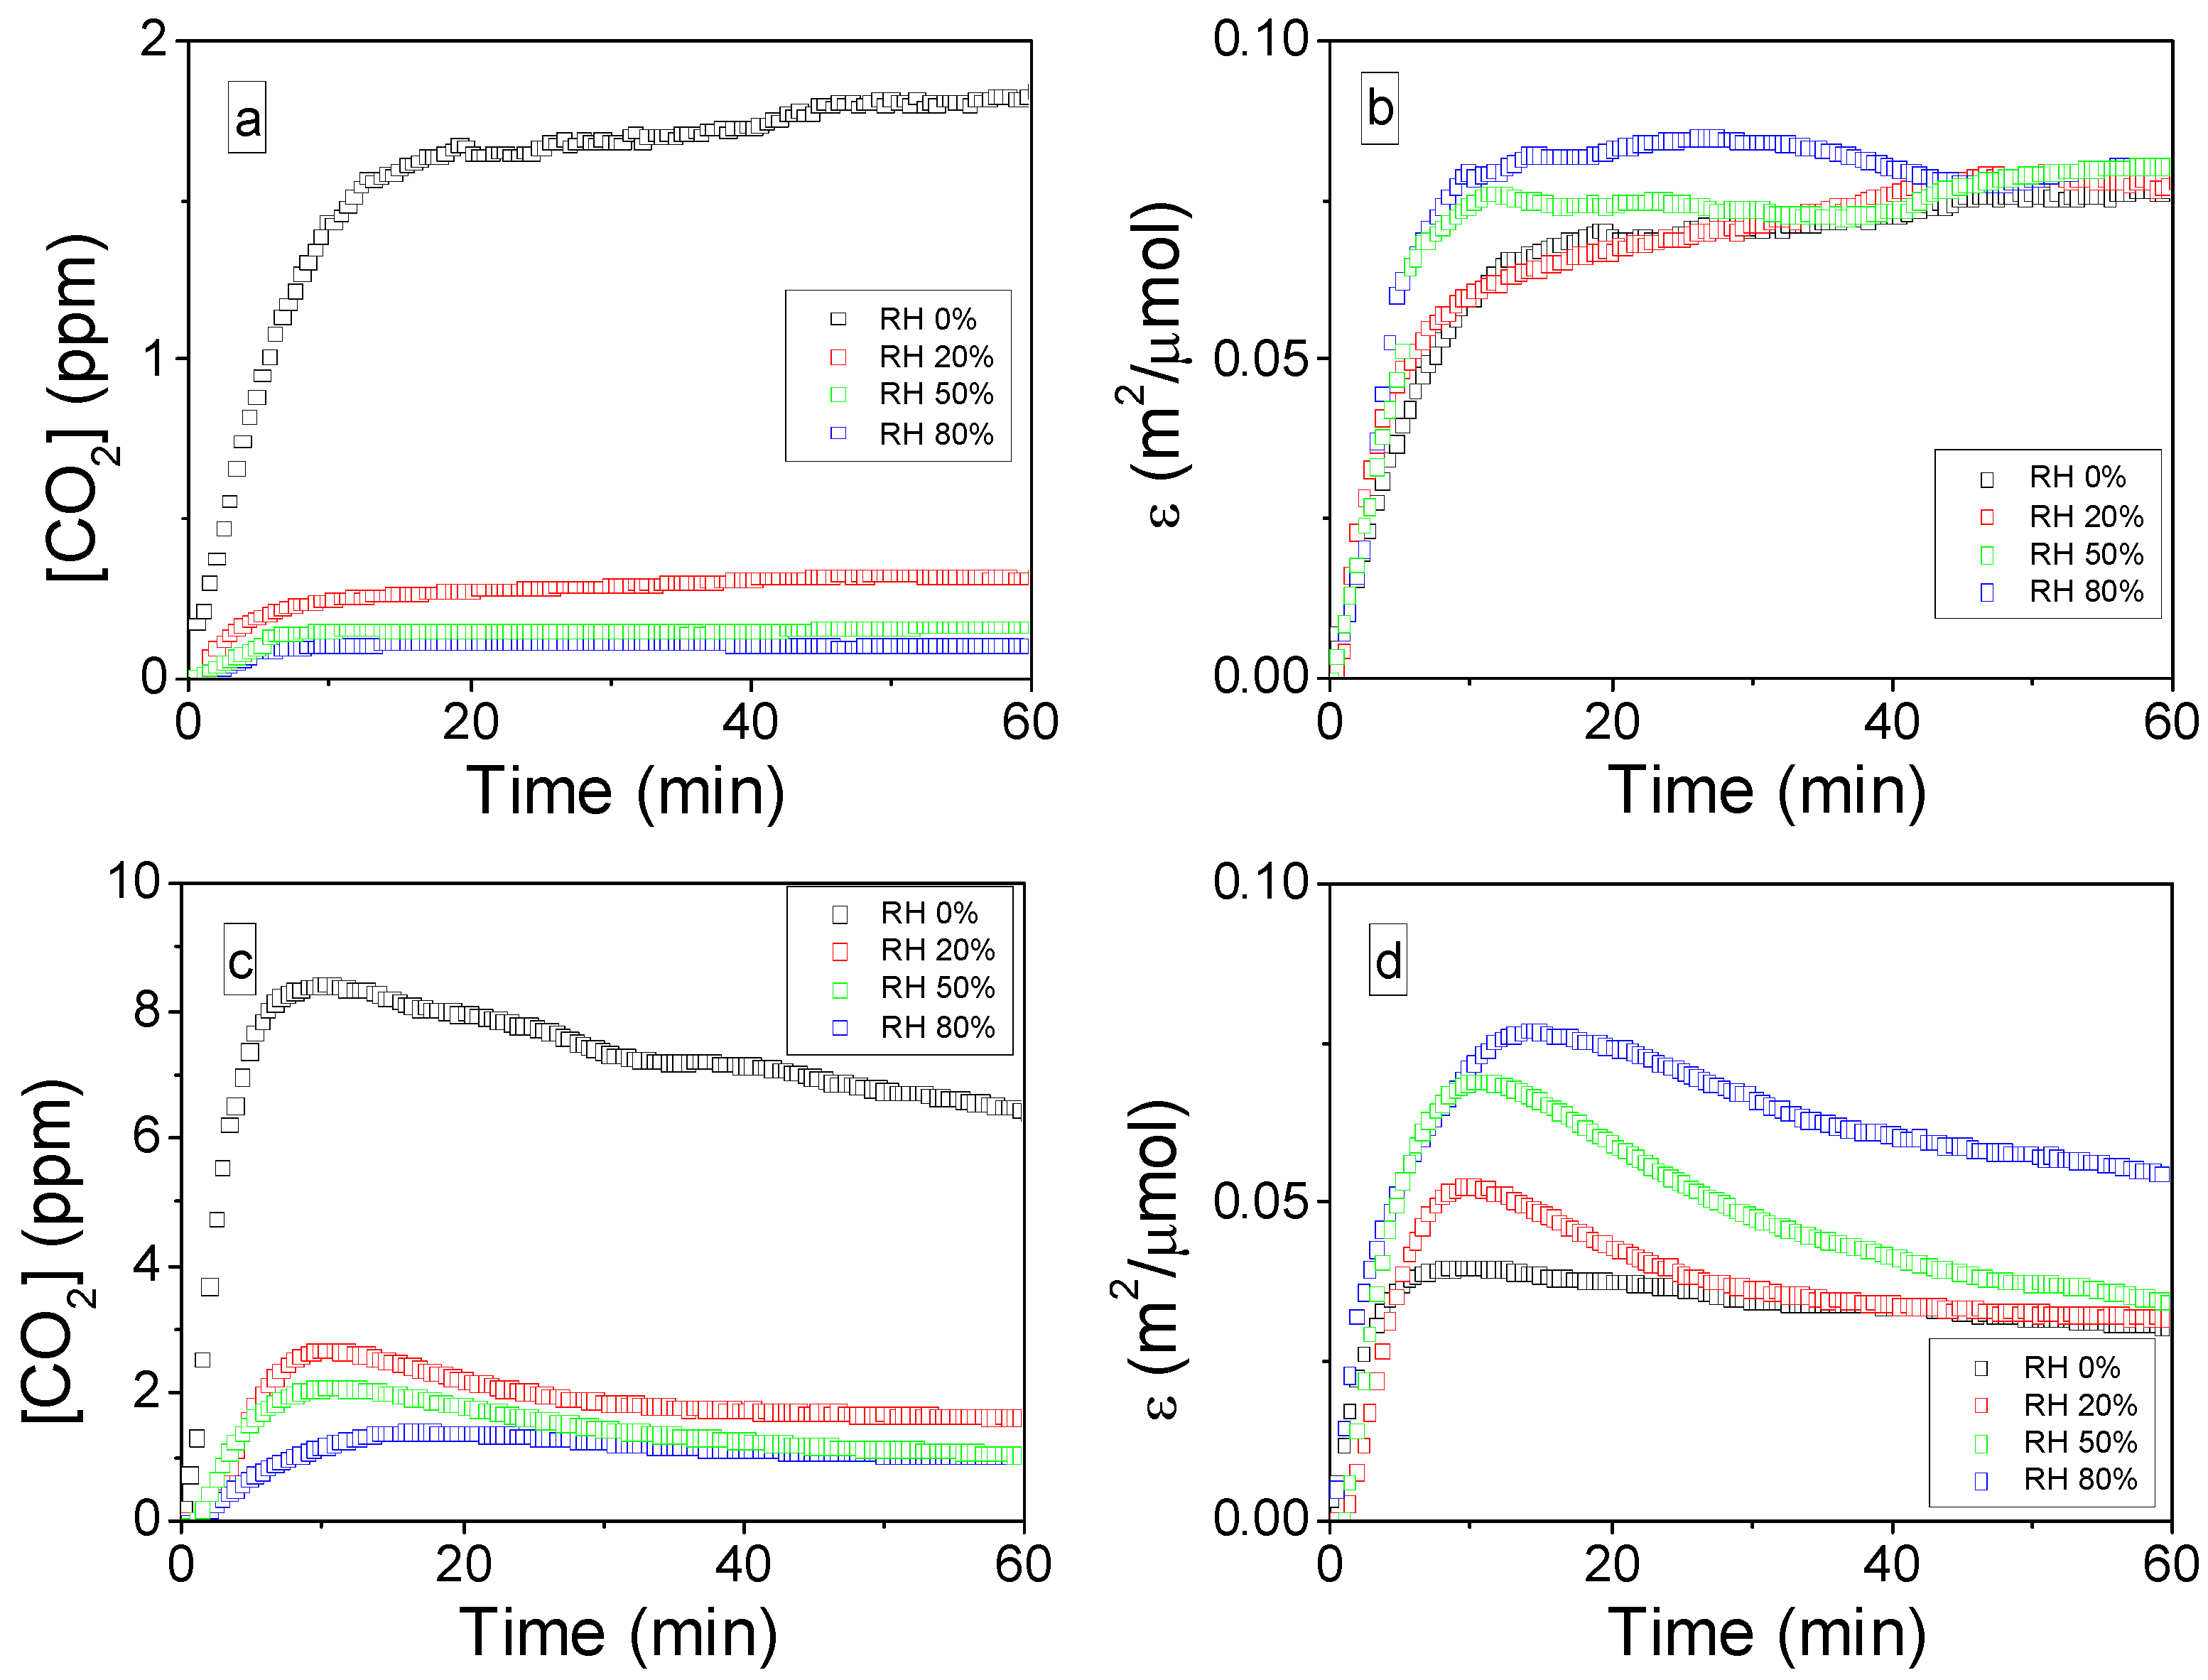
2.2.3. Influence of the SIE on CO2 Formation Yield: ρ (t)

Once the adsorption equilibrium of toluene is reached on CeO2 and the reversible fraction has been removed by flushing, plasma is ignited either in the IPC or PPC configuration. The ignition time of the discharge corresponds to t = 0 on Figure 3a–d. The temporal evolutions of CO2 concentration (ppm) monitored at the reactor outputs for the PPC and IPC configurations respectively are reported in Figure 3a,c. It has to be noted that CO2 is considered the single mineral by-product of toluene mineralization, since CO is formed in an extent that remains lower than 1% of CO2 concentration in all experiments.
At low input energy, that is, 1.9 J/L for IPC (Figure 3a) and 2.1 J/L for PPC (Figure 3c), CO2 production is constant along the whole plasma phase. As the input energy increases, a peak of CO2 is first observed, but CO2 production gradually decreases with of treatment time. The same phenomenon is noticeable whether CeO2 is located inside (IPC) or downstream the discharge (PPC). The observed decrease in CO2 production with the treatment time could be contributed by (i) the depletion of toluene or (ii) the poisoning of the CeO2 surface. The by-products (benzyl alcohol, phenol, benzoate-like species) resulting for incomplete oxidation of toluene and reported on ceria surface in our previous study [31] using in-situ infrared spectroscopies, may induce a surface poisoning effect. Similar observations have been reported in the literature [42,43] related to toluene oxidation and support the second hypothesis.
Interestingly, it is observed on Figure 3b,d that the efficiency of toluene conversion into CO2, characterized by ρ (t), is higher by a factor of ca. 3 for a lower SIE for both IPC (Figure 3b) and PPC (Figure 3d) configurations. At low SIE, it can be suggested that the number of toluene molecules involved in the oxidation process per time unit is lower, but the advancement of the oxidation is enhanced. As a result, in spite of the fact that the removal of toluene from the sorbent surface is decreased by a lower SIE, the formation of adsorbed side-products is limited. Thus, on the time scale of the reported experiments the depletion of toluene is not reached and no poisoning of the surface is induced. As a consequence, CO2 production appears as a constant process and CO2 yield is optimal. On the contrary it can be suggested that an increase in SIE chiefly initiates the oxidation of a larger number of adsorbed toluene molecules, but it appears to be detrimental to the advancement of the oxidation process and the mineralization.

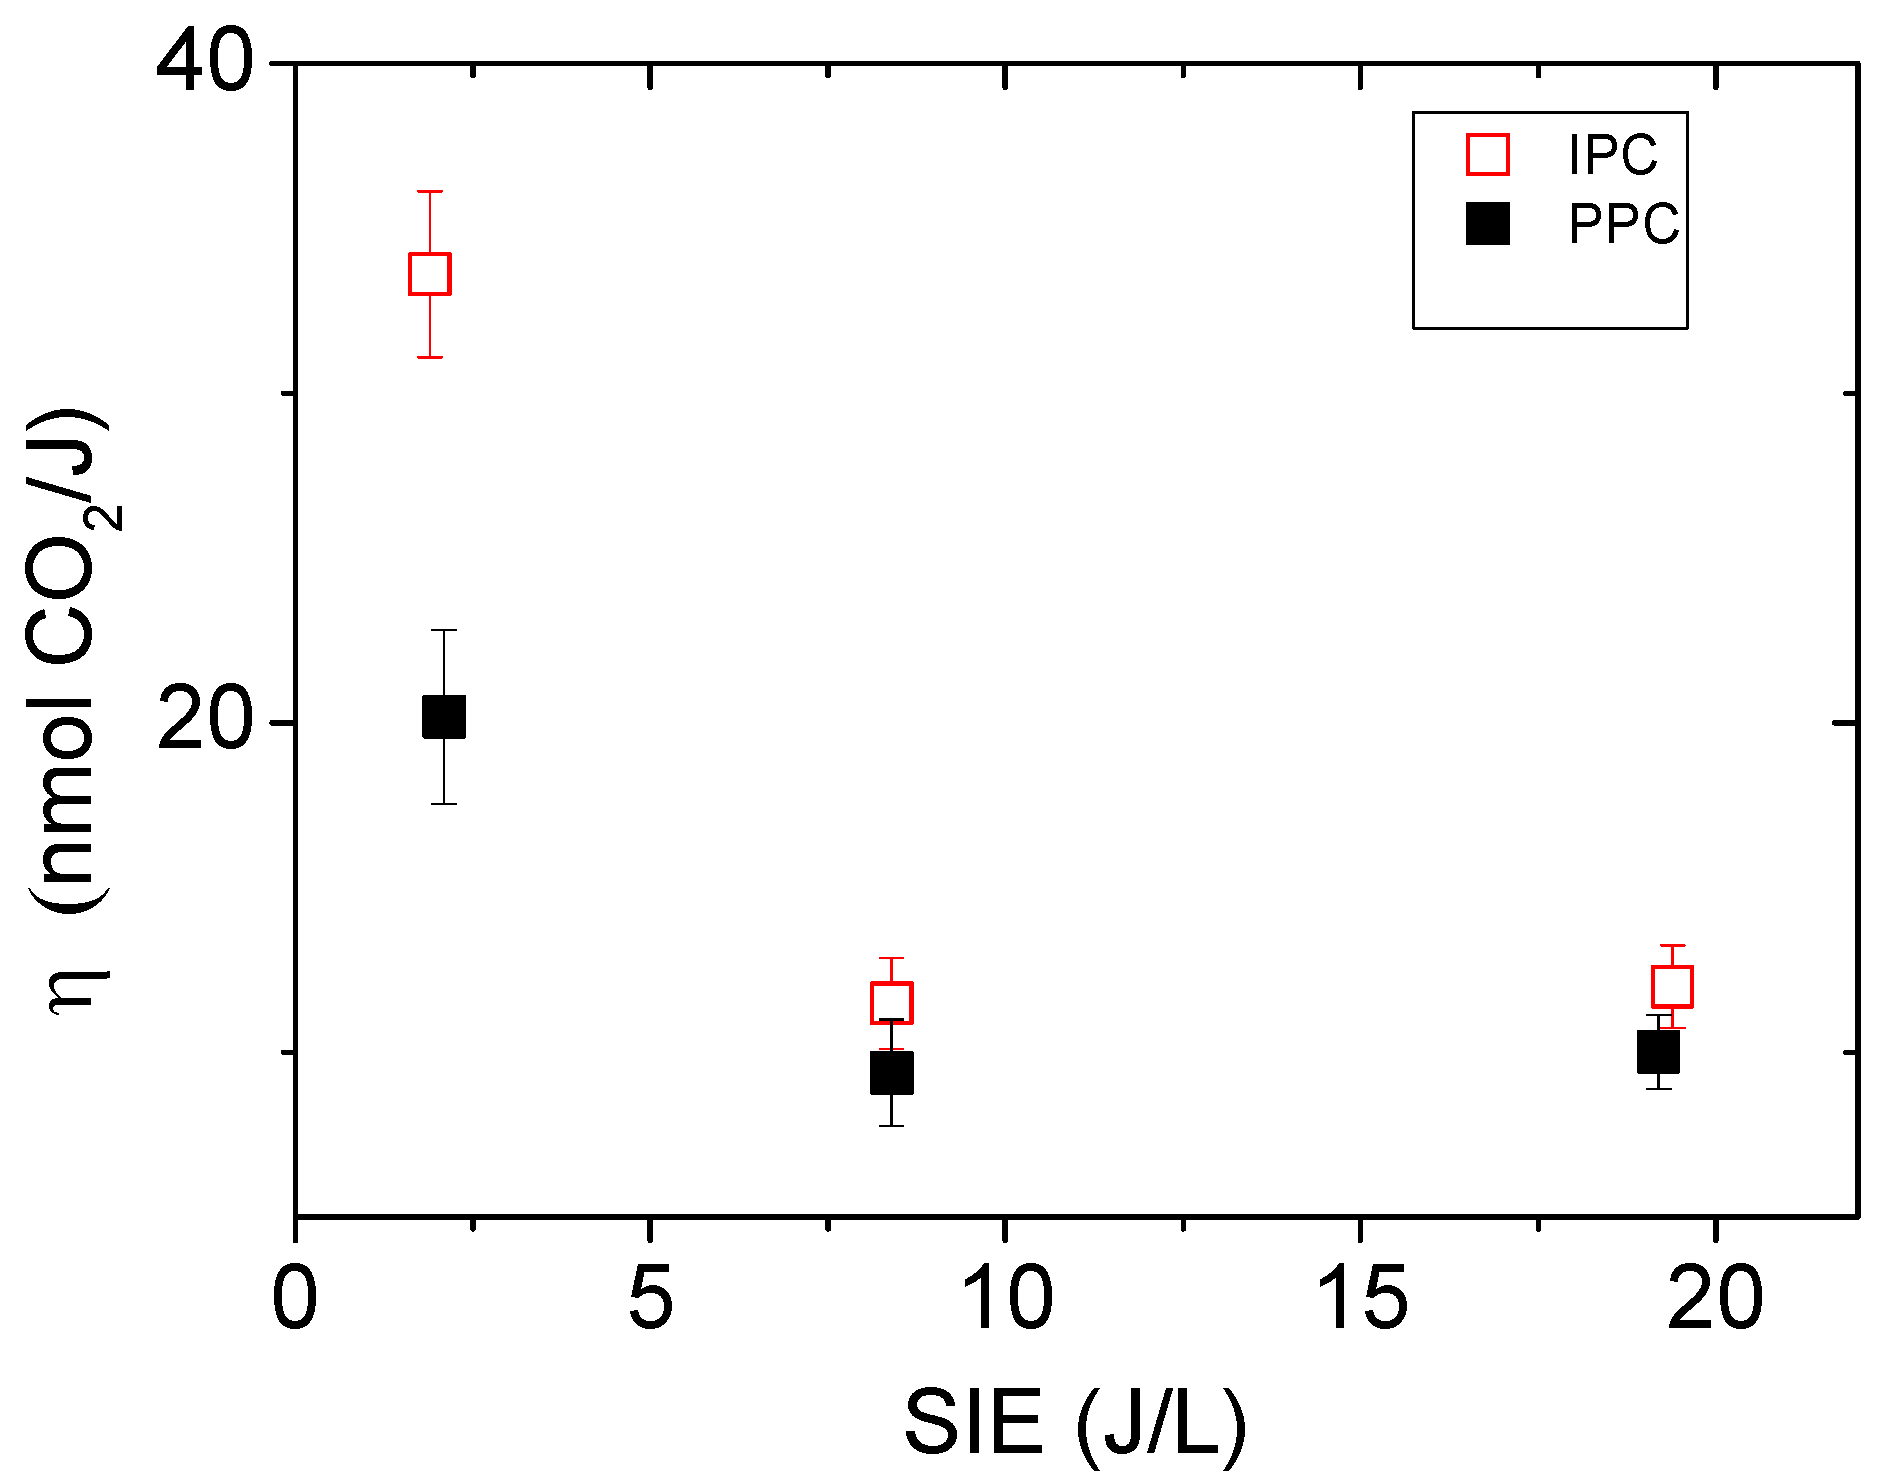
2.2.4. Influence of the SIE on the Mineralization Efficiency: η

The mineralization efficiency (η) of adsorbed toluene has been calculated over 60 min plasma treatments for both IPC and PPC configurations using different SIE as reported in Figure 4. Two mains observations can be retrieved from Figure 4: (i) the mineralization efficiency of adsorbed toluene into CO2 is significantly promoted by a decrease in SIE below 2 J/L; under this condition, η is enhanced by 65% in IPC compared to PPC; and (ii) above 8 J/L, no difference is observed between IPC and PPC.
As observed in Figure 2, all ozone molecules produced in IPC or PPC configuration are decomposed on the surface of CeO2. Each of them leads to the formation of one O2 molecule and one active oxygen atoms. Assuming that these oxygen atoms are involved in the mineralization of adsorbed toluene, the Reaction is considered.
C6H5CH3 + 18 O → 7 CO2 + 4 H2O
Based on Reaction the theoretical stoichiometric ratio of ozone to toluene is 18:1. Both IPC and PPC reactors have the same capacities to generate ozone. The amounts of ozone produced during 60 min plasma using IPC or PPC are reported in Table 1 for different SIE. They vary from 24 µmol of ozone, for a SIE of 2 J/L, to 204 µmol, for a SIE of 19 J/L. Considering that the minimum amount of toluene adsorbed onto CeO2 surface present in the IPC or PPC reactor is 7.1 µmol, the ratios of ozone to toluene are calculated for different SIE and reported in Table 1.
Based on Table 1, the specific input energy of 8 J/L appears as the minimum SIE to reach the stoichiometric conditions of toluene oxidation within 60 min. Indeed, with a SIE of 2J/L, the ratio of ozone to toluene is only 3:1 which signifies an import lack of ozone. With a specific input energy of 19 J/L the amount of ozone available within 60 min highly exceeds the stoichiometry of Reaction (II). Irrespectively of the IPC or PPC configuration, the SIE directly controls the amount of ozone provided to the catalytic surface. As the amount of ozone exceeds the stoichiometry required for toluene mineralization (SIE > 8 J/L) no difference is noticed between IPC and PPC regarding their mineralization efficiency (Figure 4). The higher mineralization efficiency of the IPC configuration is observed as ozone is provided in sub-stoichiometric conditions. Remarkably, Figure 3 and Figure 4 and Table 1 evidence that the in-situ configuration (IPC) offers the highest mineralization yield and efficiency under lean conditions of ozone. These findings are supported by the works of Harling et al. [44], using Ag/TiO2 and Ag/Al2O3, and Van Durme et al. [45], using TiO2, who similarly report an increase in the energy efficiency of toluene degradation for lower SIE as the coupling material is used in-situ (IPC). The main hypothesis proposed to explain the higher efficiency of IPC configuration relies on the presence of additional short lived species.

2.3. Influence Relative Humidity on the Performances of IPC

IPC is evidenced as the optimal configuration because it provides the highest mineralization yield for the lowest SIE, thus this section aims at investigating more in details this configuration and especially the most impacting process parameter: the relative humidity (RH).

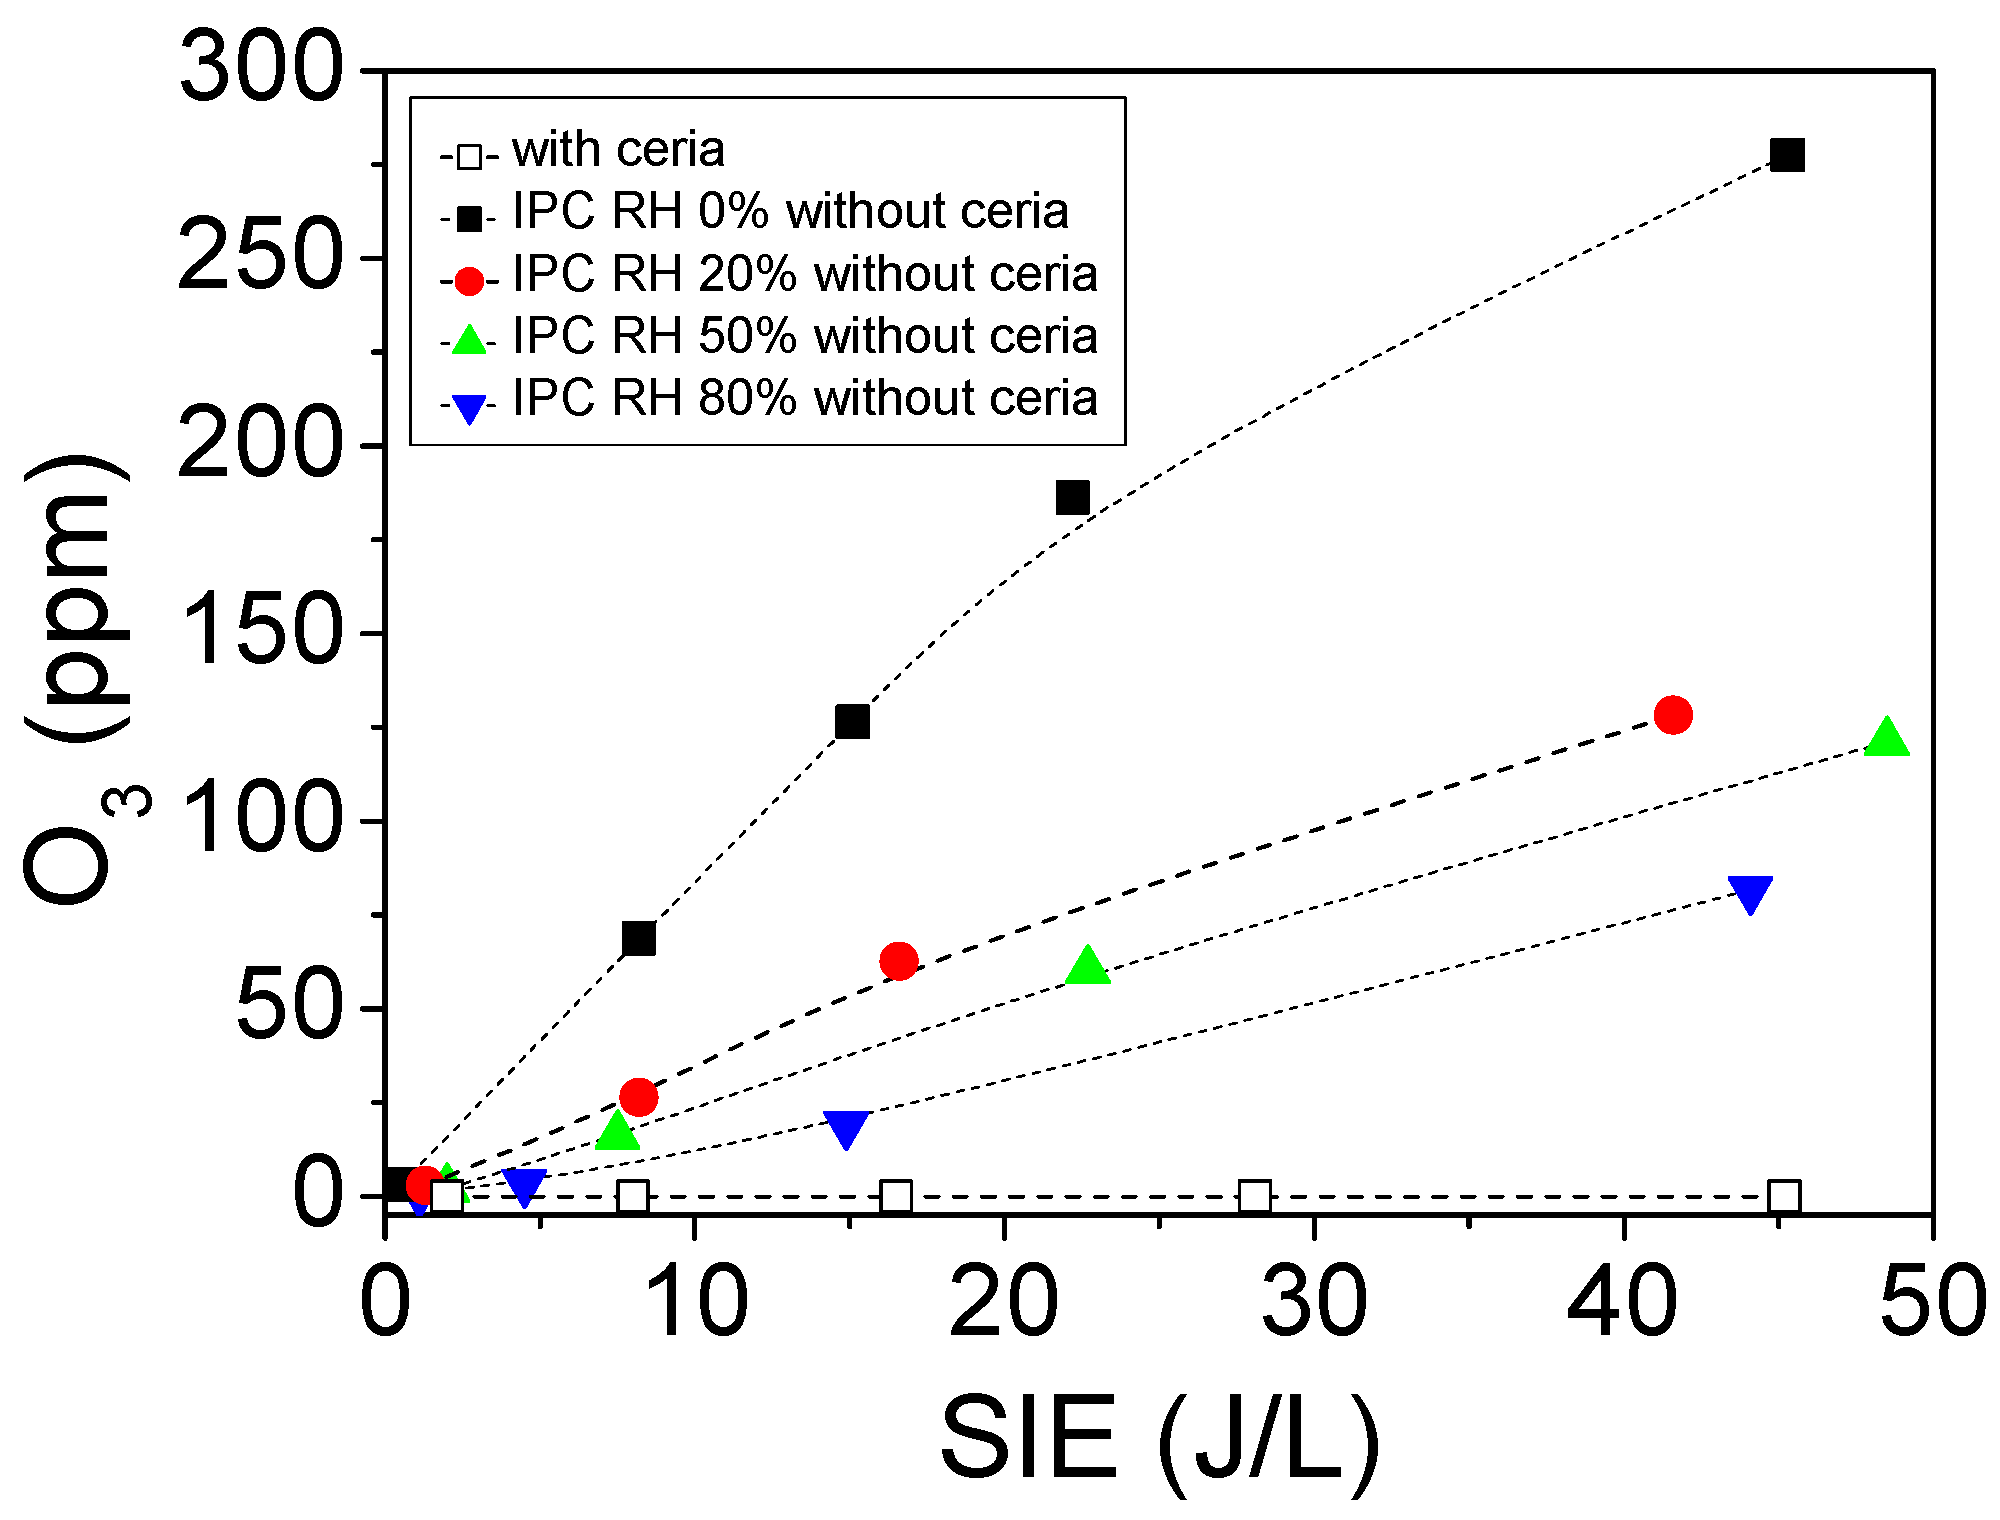
2.3.1. Influence of Relative Humidity on O3 Formation

The evolution of ozone concentration as a function of the specific input energy in IPC reactor is reported in Figure 5. The data series of Figure 5 differ through (i) the relative humidity levels used and (ii) the absence or presence of CeO2 in the reactor. In the absence of ceria, the concentration of ozone produced by the discharge decreases as the relative humidity increases; while in the presence of ceria, no ozone is detected at reactor outlet.
Depending on the relative humidity condition, the major oxidants produced on the surface of the coupling material are different. On the one hand, under dry conditions, and using CeO2/γ-Al2O3 catalyst, Wu et al. [46] reported that atomic oxygen (O*) is massively generated from the surface decomposition of O3 on the catalyst. On the other hand, under wet conditions and using cerium-based mixed oxides in the ozonation of oxalic acid, Orge et al. [47] concluded that the oxidizing species are predominantly HO radicals formed by the interaction between ozone and Ce (III) centers on the water-covered catalyst surface. Consequently, moving from dry to wet conditions turns the key oxidizing species from atomic oxygen to hydroxyl radicals.

2.3.2. Influence of Relative Humidity on the Mineralization of Adsorbed Toluene

Investigating the influence of relative humidity on the mineralization of adsorbed toluene requires first to recall the impact of RH on toluene adsorption. The adsorption of toluene on CeO2 has been quantified varying RH from 0 to 80%. Based on Figure 1, the irreversibly adsorbed fractions of toluene are reported in Table 2 for different relative humidity levels. As discussed in Section 2.1, the increase of RH induces a significant lessening of the irreversible fraction of toluene adsorbed on the surface of CeO2.
Considering that the concentration of ozone produced by the discharge varies with RH (Figure 5) and that the amount of toluene adsorbed on CeO2 depends on RH as well (Table 2), the parameter ε (t) is proposed to enable accurate comparisons of toluene mineralization from one RH level to another. This parameter is defined by Equation (3) as the ratio of CO2 concentration (ppm), monitored at the outlet of the IPC reactor, to the amount of toluene adsorbed (µmol/m2) and the concentration of ozone (ppm) at the corresponding RH. As a consequence, in the following, ε (t) is referred to as the normalized mineralization.
ε ( t ) = [ CO 2 ] [ adsorbed   Toluene ] × [ O 3 ]  
Figure 6a,c report the temporal evolution of CO2 concentration at the IPC reactor outlet during 60 min plasma treatments of irreversibly adsorbed toluene on CeO2. Experiments have been performed with RH levels of 0, 20, 50 and 80%. Figure 6a,c differ by their specific input energies, respectively 2 J/L and 19 J/L. Under both SIE conditions, the CO2 concentration dramatically falls down as RH increase. The most significant drop being observed as RH is increased from 0 to 20%. This behavior could be related to the modification of the major oxidizing species or the decrease in toluene adsorption. In order to propose more accurate discussions, Figure 6b,d report the temporal evolutions of the normalized mineralization ε (t) taking into account the initial amount of toluene adsorbed and the quantity of ozone produced. Interestingly, under both SIE conditions, after a short transient regime, values of ε (t) tend to converge towards similar values, irrespectively of (i) the RH level, (ii) the initial amount of toluene adsorbed and (iii) the concentration of O3 produced by the discharge. Under 2J/L, ε tends to 0.07 m2/µmol while it tends to 0.04 m2/µmol under 19 J/L. The convergence is noticeably faster under 2 J/L compared to 19 J/L. This difference could be related to higher concentrations of O3 produced using 19 J/L. However, it has to be noted that the normalized mineralization (ε) is always higher using the lowest SIE, irrespectively of the RH level, confirming our former observations on the more effective use of low SIE by IPC.
These observations reveal that the mineralization is directly proportional to the amount of toluene adsorbed on the surface of CeO2. It means that on the investigated range of surface concentration of toluene, the concentrations of the oxidizing species produced by the discharge are not the limiting factor of the process. Besides, Figure 6b,d evidence that the mineralization is also directly proportional to the concentration of ozone produced by the discharge. In the presence of moisture, the main oxidizing species turns from oxygen atoms to hydroxyl radicals. However, oxygen atoms produced from O3 decomposition appear as the most effective oxidizing agents to lead to toluene mineralization. The convergence of ε parameter irrespectively of the RH levels indicates that the role of water molecules consists of preventing toluene adsorption and ozone formation, while the generation of hydroxyl radical does not impact the process.

3. Materials and Methods

3.1. Gas Flow Preparation

Certified gas cylinders are supplied by Air Liquid. In all experiments, the inlet concentration of toluene is 100 ppm. This concentration insures that the adsorption equilibrium of toluene onto CeO2 catalyst is achieved within a time span of typically 90 min. The regulation of gas flows is insured using Brooks mass flow controllers. The mass flow controller attributed to the main dilution line can go up to 2000 mL/min ± 1%, that is., it is less accurate below an imposed flow of 20 mL/min; while the one used for VOC cylinder regulation has a maximum of 10 mL/min and can be used accurately down to 0.1 mL/min. As shown in Figure 7, experiments are performed with a constant total gas flow of 500 mL/min. A 494.3 mL/min air flow is sent through gas line (1) connected with the water bubbler. Relative humidity (RH) can be adjusted from 0% to 80% using water bubbler containing de-ionized water by adjusting the bubbler temperature from 274 K to 294 K with a Huber® cryostat. For dry conditions, the cryostat containing water is by-passed. A 5.7 mL/min air flow is sent through gas line (2) connected to the toluene bubbler. The toluene concentration at the toluene bubbler outlet is 8960 ppm. Once both lines are mixed together the concentration of toluene is 100 ± 2 ppm at the reactor inlet.

3.2. Materials

70 mg of CeO2 powder (CAS 1306-38-3, Sigma-Aldrich, Lyon, France are used as coupling material. The specific surface of the material is determined as 84 ± 5 m2/g. The CeO2 powder is first pressed, and then split up into smaller pieces. These pieces have been first passed through a 12 mesh screen and then trapped by a 16 mesh screen that allows producing CeO2 agglomerates with particle sizes ranging from 1.2 mm to 1.6 mm. Such particle size in experimental reactor could minimize the gas by-passes and pressure-drops. Complementary specific surface measurements evidenced that the abovementioned agglomeration of CeO2 particles do not impact the specific surface of the material.

3.3. FTIR Monitoring

The detection and the quantification of the gas phase species are performed using a high-resolution Nicolet 6700 Fourier Transform Infrared spectrometer (FTIR) equipped with a 10 m long optical-path White cell and a cooled mercury cadmium telluride (MCT) detector. The cell is heated at 50 °C to ensure thermal regulation and to prevent adsorption onto the walls. Two spectra per minute are collected with 16 scans per spectrum by Omnic software and a spectral resolution of 0.5 cm−1. Figure 8 shows the gas phase spectra acquired during calibration of the main detected species. CO quantification is carried out using the average of two rotational absorption peaks (2159.2–2157.2 cm−1, 2166.9–2164.2 cm−1) associated to the C–O stretch vibration. The regions 2388–2348 cm–1 and 1021.6–1000.4 cm−1 are respectively selected for CO2 and O3 quantification. The presence of toluene is detected in the region (732.0–724.0 cm−1), corresponding to molecule-specific aromatic C–H out of plane vibrations [48] where the water signal is minimal. The detection limits of the analytical instrument have been determined as two times the signal/noise ratio in the regions of interest; they are reported in Table 3.

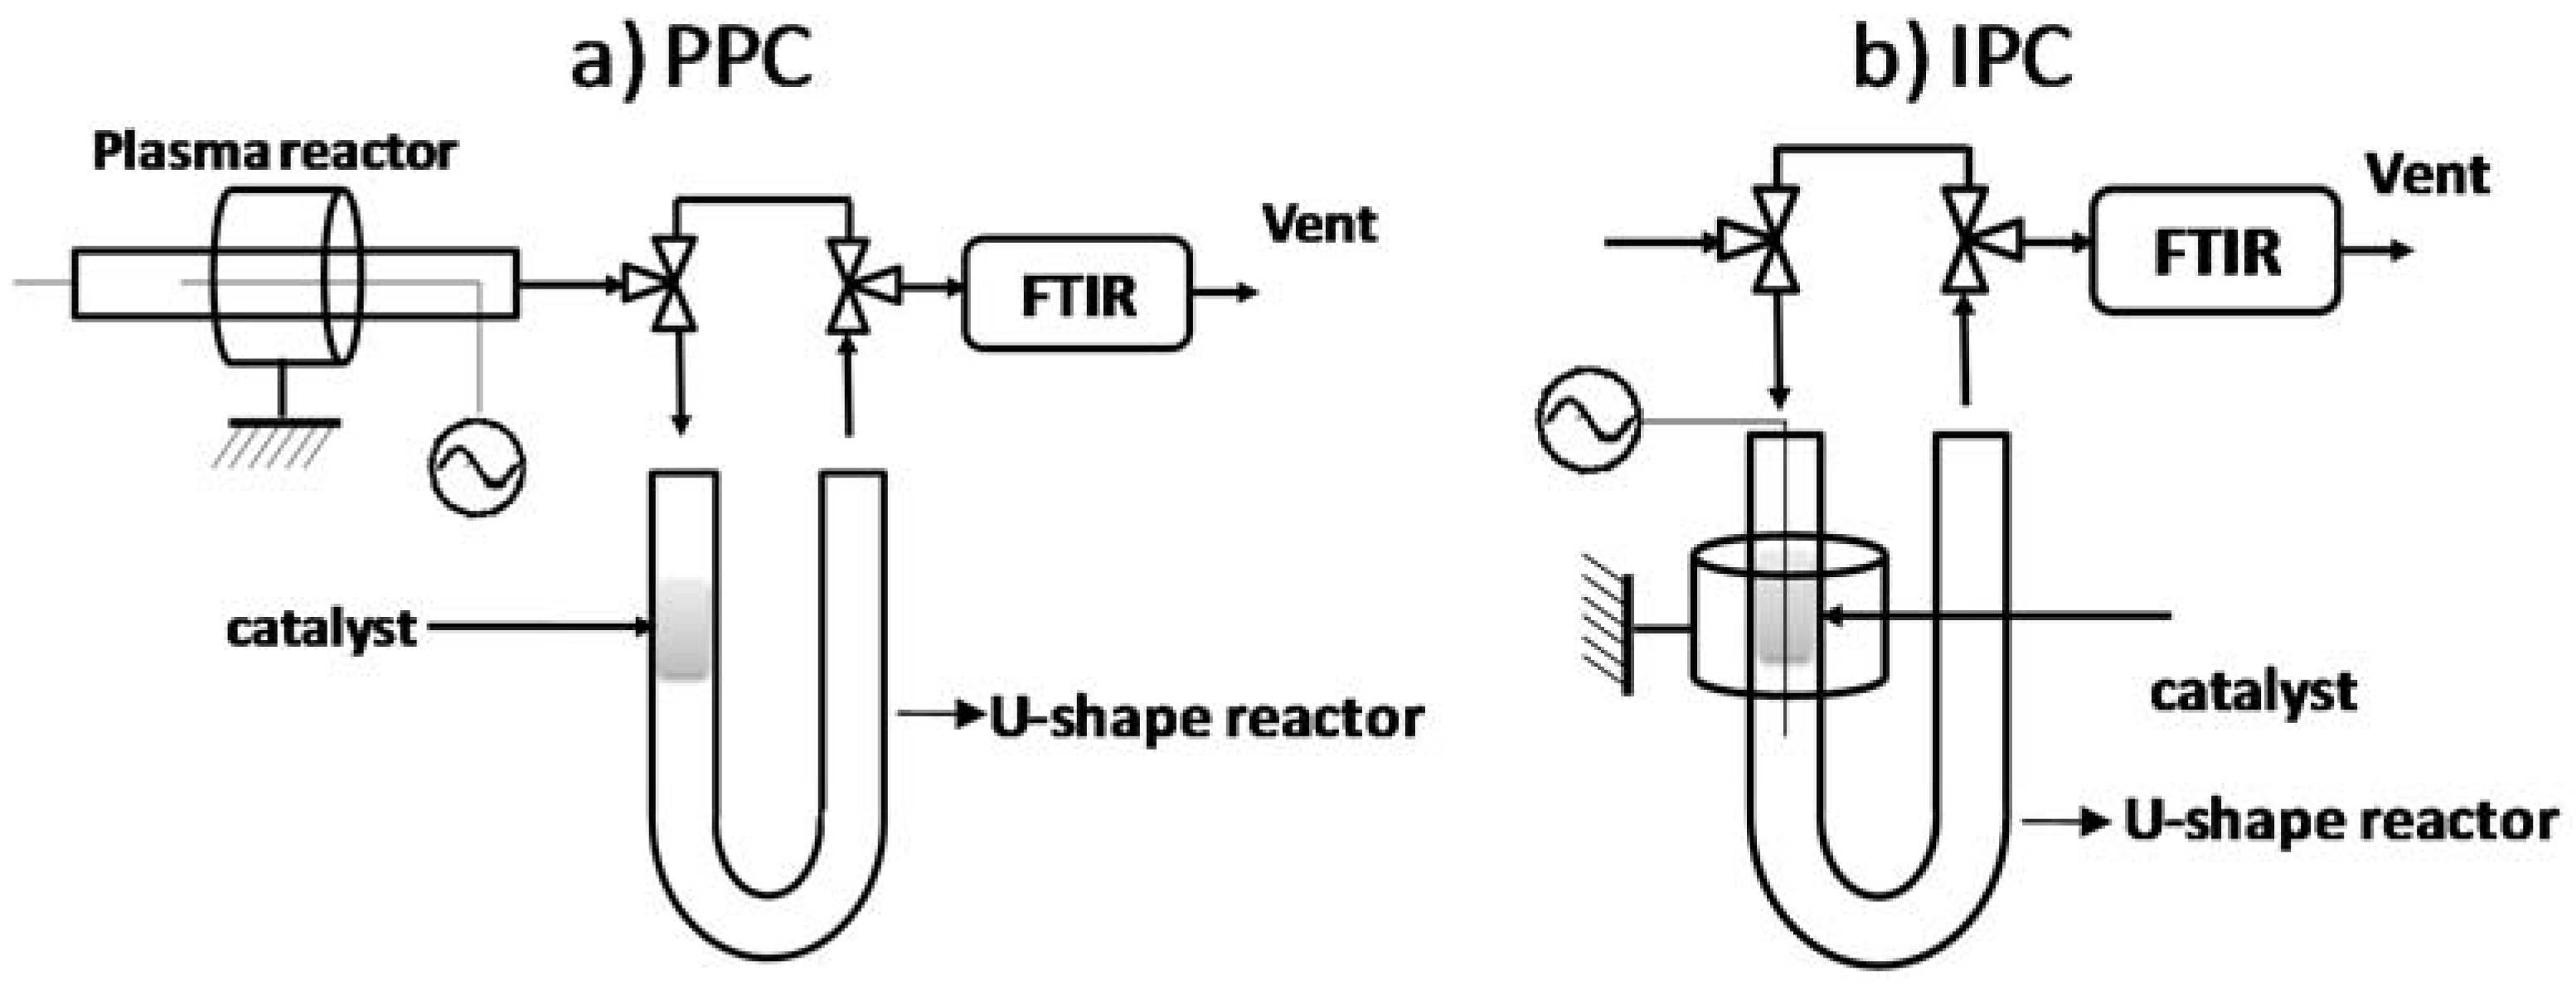
3.4. Post vs in Plasma–Catalytic Reactors

The two following sections describe the plasma-catalytic reactors under both configurations: post-situ and in-situ. For the post-situ configuration, the system consists of two distinct reactors whereas for in-situ configuration, the catalyst is placed inside the dielectric barrier discharge (DBD) reactor. Injected power is calculated using the Lissajous figure method, also known as “Manley method”; calculations are described in reference [31]. Specific input energy (SIE), expressed in J/L, is defined as the ratio of the injected power to the gas flow rate.

3.4.1. Post Plasma Reactor–PPC

In the post-situ configuration, the material is placed in a U-shape Pyrex tube (Figure 9a) in the form of CeO2 agglomerates as described above. The DBD reactor is placed upstream the U-shape reactor. It consists of a Pyrex glass (dielectric) tube of 1.7 mm inner diameter, 3.3 mm outside diameter and 235 cm length. The inner electrode consists of a tungsten (W) wire of 0.2 mm diameter placed in the middle of the tube. The outer electrode is a copper sheet of 16 mm wrapped around the dielectric Pyrex tube. The U-shaped reactor containing the catalyst is a Pyrex tube with an external diameter of 8 mm and wall thickness of 2.2 mm. The Pyrex tube is conceived with glass tips in the middle to stabilize the material, yet avoiding any pressure drop in the gas flow.

3.4.2. In Plasma Reactor—IPC

In the in-situ configuration, the catalyst is directly placed inside the DBD, more precisely, in the discharge zone. The catalyst is placed in the same U-shaped reactor used for the post-plasma configuration. The inner electrode consists of a tungsten (W) wire of 0.2 mm thickness placed in main axis of the Pyrex tube. The counter electrode is a hollow brass cylinder, 16 mm high, screwed along the catalyst bed area of the U-shape reactor. The height of the catalyst bed is ca. 8 mm which is inferior to the counter electrode height. In order to compare the results obtained in IPC and PPC configuration, the charge used for both reactors is the same.

3.5. Typical Experimental Protocole

The experimental procedure is composed of five steps irrespectively of PPC or IPC configurations:
  • Pretreatment of CeO2 sample under dry air at 400 °C to remove water and other adsorbed species and ensure repeatability of experiments.
  • Adsorption of 100 ppm toluene on CeO2 until breakthrough: the air flow with different RH levels (0–80%) containing toluene breaks through the CeO2 bed and is gradually adsorbed on the catalyst surface until equilibration of the sorption sites.
  • Flushing of CeO2 under synthetic dry air flow to remove the reversibly adsorbed fraction of toluene. Flushing the sorbent bed under air desorbs the molecules with the weakest heats of adsorption, that is, physisorbed species, leaving only the irreversibly adsorbed toluene molecules on CeO2 surface.
  • Surface exposure under air flow with different RH levels (0–80%) by switching on the nonthermal plasma for 60 minutes for IPC or PPC. Once the plasma is turned off, the system is purged with synthetic air flow until ozone concentration returns to zero.
  • Temperature programmed oxidation (TPO) under synthetic air flow with different RH levels (0–80%) at 400 °C is performed in order to remove the remaining adsorbed species and regenerate the CeO2 surface.

4. Conclusions

The oxidation of toluene adsorbed on CeO2 has been studied using two configurations: (i) in plasma-catalysis (IPC) and (ii) post plasma-catalysis (PPC), respectively. The mineralization yield ρ (t) and the mineralization efficiency η were used to compare the performance of IPC and PPC configurations with different injected powers and relative humidity levels. Under dry air condition, CO2 production appears as a constant process and CO2 yield ρ (t) was optimal with a lower SIE (2J/L) for both IPC and PPC configuration. Moreover, η was enhanced by 65% in IPC compared to PPC with a lower SIE but no difference was observed for a SIE above 8J/L.
Both ozone concentrations without ceria and amount of irreversibly adsorbed toluene on ceria decreased with the increasing of the relative humidity levels. The parameter ε (t) was proposed to enable accurate comparisons of toluene mineralization considering these two variable values. Interestingly, under both SIE conditions, after a short transient regime, values of ε (t) tended to converge towards similar values, irrespectively of: (i) the RH level; (ii) the initial amount of toluene adsorbed; and (iii) the concentration of O3 produced by the discharge. Results highlight the key role of ozone in the mineralization process and the possible detrimental effect of moisture.

Author Contributions

Z.J., A.R. and F.T. conceived and designed the experiments; Z.J., X.W. and E.F. performed the experiments; A.R., F.T. and Z.J. contributed to the data interpretation, the discussions and the writing of the paper.

Acknowledgments

Authors acknowledge the China Scholarship Council (CSC) for the PhD grant attributed to Xianjie Wang, Labex Plas@Par and Ecole Polytechnique. This work has been done within the French DGA project of 2012 60 013 00470 7501, and the LABEX PLAS@PAR project by the Agence Nationale de la Recherche under thereference ANR-11-IDEX-0004-02. IMT Lille Douai participates in the Labex CaPPA project funded by the ANR through the PIA under contract ANR-11-LABX-0005-01, and in the CLIMIBIO project, funded by the “Hauts-de-France” Regional Council and the European Regional Development Fund (ERDF).

Conflicts of Interest

The authors declare no conflict of interest.

References

  1. Theloke, J.; Friedrich, R. Compilation of a database on the composition of anthropogenic VOC emissions for atmospheric modeling in Europe. Atmos. Environ. 2007, 41, 4148–4160. [Google Scholar] [CrossRef]
  2. Coates, J.D.; Chakraborty, R.; Lack, J.G.; O’Connor, S.M.; Cole, K.A.; Bender, K.S.; Achenbach, L.A. Anaerobic benzene oxidation coupled to nitrate reduction in pure culture by two strains of Dechloromonas. Nature 2001, 411, 1039–1043. [Google Scholar] [CrossRef] [PubMed]
  3. Benignus, V.A. Health effects of toluene: A review. Neurotoxicology 1981, 2, 567–588. [Google Scholar] [PubMed]
  4. Fishbein, L. An overview of environmental and toxicological aspects of aromatic hydrocarbons II. Toluene. Sci. Total Environ. 1985, 42, 267–288. [Google Scholar] [CrossRef]
  5. Lebret, E.; Van de Wiel, H.J.; Bos, H.P.; Noij, D.; Boleij, J.S.M. Volatile organic compounds in Dutch homes. Environ. Int. 1986, 12, 323–332. [Google Scholar] [CrossRef]
  6. Feng, X.; Liu, H.; He, C.; Shen, Z.; Wang, T. Synergistic effects and mechanism of a non-thermal plasma catalysis system in volatile organic compound removal: A review. Catal. Sci. Technol. 2018, 8, 936–954. [Google Scholar] [CrossRef]
  7. Zhu, X.; Zhang, S.; Yang, Y.; Zheng, C.; Zhou, J.; Gao, X.; Tu, X. Enhanced performance for plasma-catalytic oxidation of ethyl acetate over La1−xCexCoO3+δ catalysts. Appl. Catal. B Environ. 2017, 213, 97–105. [Google Scholar] [CrossRef]
  8. Wang, W.; Kim, H.-H.; Van Laer, K.; Bogaerts, A. Streamer propagation in a packed bed plasma reactor for plasma catalysis applications. Chem. Eng. J. 2018, 334, 2467–2479. [Google Scholar] [CrossRef]
  9. Veerapandian, S.; Leys, C.; De Geyter, N.; Morent, R. Abatement of VOCs Using Packed Bed Non-Thermal Plasma Reactors: A Review. Catalysts 2017, 7, 113. [Google Scholar] [CrossRef]
  10. Ye, Z.; Giraudon, J.-M.; De Geyter, N.; Morent, R.; Lamonier, J.-F. The Design of MnOx Based Catalyst in Post-Plasma Catalysis Configuration for Toluene Abatement. Catalysts 2018, 8. [Google Scholar] [CrossRef]
  11. Xu, X.; Wang, P.; Xu, W.; Wu, J.; Chen, L.; Fu, M.; Ye, D. Plasma-catalysis of metal loaded SBA-15 for toluene removal: Comparison of continuously introduced and adsorption-discharge plasma system. Chem. Eng. J. 2016, 283, 276–284. [Google Scholar] [CrossRef]
  12. Thevenet, F.; Sivachandiran, L.; Guaitella, O.; Barakat, C.; Rousseau, A. Plasma-catalyst coupling for volatile organic compound removal and indoor air treatment: A review. J. Phys. D Appl. Phys. 2014, 47. [Google Scholar] [CrossRef]
  13. Jia, Z.; Ben Amar, M.; Yang, D.; Brinza, O.; Kanaev, A.; Duten, X.; Vega-González, A. Plasma catalysis application of gold nanoparticles for acetaldehyde decomposition. Chem. Eng. J. 2018, 347, 913–922. [Google Scholar] [CrossRef]
  14. Jia, Z.; Vega-Gonzalez, A.; Amar, M.B.; Hassouni, K.; Tieng, S.; Touchard, S.; Kanaev, A.; Duten, X. Acetaldehyde removal using a diphasic process coupling a silver-based nano-structured catalyst and a plasma at atmospheric pressure. Catal. Today 2013, 208, 82–89. [Google Scholar] [CrossRef]
  15. Jia, Z.; Barakat, C.; Dong, B.; Rousseau, A. VOCs Destruction by Plasma Catalyst Coupling Using AL-KO PURE Air Purifier on Industrial Scale. J. Mater. Sci. Chem. Eng. 2015, 3, 19–26. [Google Scholar] [CrossRef]
  16. Vandenbroucke, A.M.; Morent, R.; De Geyter, N.; Leys, C. Non-thermal plasmas for non-catalytic and catalytic VOC abatement. J. Hazard. Mater. 2011, 195, 30–54. [Google Scholar] [CrossRef] [PubMed]
  17. Christensen, P.A.; Mashhadani, Z.T.A.W.; Md Ali, A.H.B.; Carroll, M.A.; Martin, P.A. The Production of Methane, Acetone, “Cold” CO and Oxygenated Species from IsoPropyl Alcohol in a Non-Thermal Plasma: An In-Situ FTIR Study. J. Phys. Chem. A 2018, 122, 4273–4284. [Google Scholar] [CrossRef] [PubMed]
  18. Chen, H.L.; Lee, H.M.; Chen, S.H.; Chang, M.B.; Yu, S.J.; Li, S.N. Removal of Volatile Organic Compounds by Single-Stage and Two-Stage Plasma Catalysis Systems: A Review of the Performance Enhancement Mechanisms, Current Status, and Suitable Applications. Environ. Sci. Technol. 2009, 43, 2216–2227. [Google Scholar] [CrossRef] [PubMed]
  19. Norsic, C.; Tatibouët, J.-M.; Batiot-Dupeyrat, C.; Fourré, E. Methanol oxidation in dry and humid air by dielectric barrier discharge plasma combined with MnO2-CuO based catalysts. Chem. Eng. J. 2018, 347, 944–952. [Google Scholar] [CrossRef]
  20. Ogata, A.; Einaga, H.; Kabashima, H.; Futamura, S.; Kushiyama, S.; Kim, H.-H. Effective Combination of Nonthermal Plasma and Catalysts for Decomposition of Benzene in Air. Appl. Catal. B Environ. 2003, 46, 87–95. [Google Scholar] [CrossRef]
  21. Hammer, T.; Kappes, T.; Baldauf, M. Plasma catalytic hybrid processes: Gas discharge initiation and plasma activation of catalytic processes. Catal. Today 2004, 89, 5–14. [Google Scholar] [CrossRef]
  22. Kirkpatrick, M.J.; Finney, W.C.; Locke, B.R. Plasma-Catalyst Interactions in the Treatment of Volatile Organic Compounds and NOx with Pulsed Corona Discharge and Reticulated Vitreous Carbon Pt/Rh-Coated Electrodes. Catal. Today 2004, 89, 117–126. [Google Scholar] [CrossRef]
  23. Ayrault, C.; Barrault, J.; Blin-Simiand, N.; Jorand, F.; Pasquiers, S.; Rousseau, A.; Tatibouët, J.M. Oxidation of 2-heptanone in air by a DBD-type plasma generated within a honeycomb monolith supported Pt-based catalyst. Catal. Today 2004, 89, 75–81. [Google Scholar] [CrossRef]
  24. Du, C.M.; Yan, J.H.; Cheron, B. Decomposition of toluene in a gliding arc discharge plasma reactor. Plasma Sources Sci. Technol. 2007, 16, 791–797. [Google Scholar] [CrossRef]
  25. Guo, Y.; Ye, D.; Tian, Y.; Chen, K. Humidity Effect on Toluene Decomposition in a Wire-plate Dielectric Barrier Discharge Reactor. Plasma Chem. Plasma Process. 2006, 26, 237–249. [Google Scholar] [CrossRef]
  26. Van Durme, J.; Dewulf, J.; Demeestere, K.; Leys, C.; Van Langenhove, H. Post-plasma catalytic technology for the removal of toluene from indoor air: Effect of humidity. Appl. Catal. B Environ. 2009, 87, 78–83. [Google Scholar] [CrossRef]
  27. Thevenet, F.; Guaitella, O.; Puzenat, E.; Guillard, C.; Rousseau, A. Influence of water vapour on plasma/photocatalytic oxidation efficiency of acetylene. Appl. Catal. B Environ. 2008, 84, 813–820. [Google Scholar] [CrossRef]
  28. Chang, T.; Shen, Z.; Huang, Y.; Lu, J.; Ren, D.; Sun, J.; Cao, J.; Liu, H. Post-plasma-catalytic removal of toluene using MnO2–Co3O4 catalysts and their synergistic mechanism. Chem. Eng. J. 2018, 348, 15–25. [Google Scholar] [CrossRef]
  29. Batault, F.; Thevenet, F.; Hequet, V.; Rillard, C.; Le Coq, L.; Locoge, N. Acetaldehyde and acetic acid adsorption on TiO2 under dry and humid conditions. Chem. Eng. J. 2015, 264, 197–210. [Google Scholar] [CrossRef]
  30. Huang, H.; Ye, D. Combination of photocatalysis downstream the non-thermal plasma reactor for oxidation of gas-phase toluene. J. Hazard. Mater. 2009, 171, 535–541. [Google Scholar] [CrossRef] [PubMed]
  31. Jia, Z.; Wang, X.; Thevenet, F.; Rousseau, A. Dynamic probing of plasma-catalytic surface processes: Oxidation of toluene on CeO2. Plasma Process. Polym. 2017, 14. [Google Scholar] [CrossRef]
  32. Jia, Z.; Rousseau, A. Sorbent track: Quantitative monitoring of adsorbed VOCs under in-situ plasma exposure. Sci. Rep. 2016, 6. [Google Scholar] [CrossRef] [PubMed] [Green Version]
  33. Stere, C.E.; Anderson, J.A.; Chansai, S.; Delgado, J.J.; Goguet, A.; Graham, W.G.; Hardacre, C.; Taylor, S.F.R.; Tu, X.; Wang, Z.; et al. Non-Thermal Plasma Activation of Gold-Based Catalysts for Low-Temperature Water–Gas Shift Catalysis. Angew. Chem. Int. Ed. Engl. 2017, 56, 5579–5583. [Google Scholar] [CrossRef] [PubMed]
  34. Barakat, C.; Gravejat, P.; Guaitella, O.; Thevenet, F.; Rousseau, A. Oxidation of isopropanol and acetone adsorbed on TiO2 under plasma generated ozone flow: Gas phase and adsorbed species monitoring. Appl. Catal. B Environ. 2014, 147, 302–313. [Google Scholar] [CrossRef]
  35. Batault, F. Effect of Adsorption and Operating Parameters on Volatile Organic Compounds Mixture Photocatalytic Treatment in Indoor Air Conditions. Ph.D. Thesis, University of Lille, Lille, France, 2014. [Google Scholar]
  36. Bouzaza, A.; Laplanche, A. Photocatalytic degradation of toluene in the gas phase: Comparative study of some TiO2 supports. J. Photochem. Photobiol. A Chem. 2002, 150, 207–212. [Google Scholar] [CrossRef]
  37. Takeuchi, M.; Hidaka, M.; Anpo, M. Efficient removal of toluene and benzene in gas phase by the TiO2/Y-zeolite hybrid photocatalyst. J. Hazard. Mater. 2012, 237–238, 133–139. [Google Scholar] [CrossRef] [PubMed]
  38. Goss, K.-U. The Air/Surface Adsorption Equilibrium of Organic Compounds Under Ambient Conditions. Crit. Rev. Environ. Sci. Technol. 2004, 34, 339–389. [Google Scholar] [CrossRef]
  39. Fowkes, F.M. Attractive Forces at Interfaces. Ind. Eng. Chem. Res. 1964, 56, 40–52. [Google Scholar] [CrossRef]
  40. Goss, K.-U.; Eisenreich, S.J. Adsorption of VOCs from the Gas Phase to Different Minerals and a Mineral Mixture. Environ. Sci. Technol. 1996, 30, 2135–2142. [Google Scholar] [CrossRef]
  41. Mao, L.; Chen, Z.; Wu, X.; Tang, X.; Yao, S.; Zhang, X.; Jiang, B.; Han, J.; Wu, Z.; Lu, H.; et al. Plasma-catalyst hybrid reactor with CeO2/Γ-Al2O3 for benzene decomposition with synergetic effect and nano particle by-product reduction. J. Hazard. Mater. 2018, 347, 150–159. [Google Scholar] [CrossRef] [PubMed]
  42. Blount, M.C.; Falconer, J.L. Steady-state surface species during toluene photocatalysis. Appl. Catal. B Environ. 2002, 39, 39–50. [Google Scholar] [CrossRef]
  43. Augugliaro, V.; Coluccia, S.; Loddo, V.; Marchese, L.; Martra, G.; Palmisano, L.; Schiavello, M. Photocatalytic oxidation of gaseous toluene on anatase TiO2 catalyst: Mechanistic aspects and FT-IR investigation. Appl. Catal. B Environ. 1999, 20, 15–27. [Google Scholar] [CrossRef]
  44. Harling, A.M.; Demidyuk, V.; Fischer, S.J.; Whitehead, J.C. Plasma-catalysis destruction of aromatics for environmental clean-up: Effect of temperature and configuration. Appl. Catal. B Environ. 2008, 82, 180–189. [Google Scholar] [CrossRef]
  45. Van Durme, J.; Dewulf, J.; Sysmans, W.; Leys, C.; Van Langenhove, H. Efficient toluene abatement in indoor air by a plasma catalytic hybrid system. Appl. Catal. B Environ. 2007, 74, 161–169. [Google Scholar] [CrossRef]
  46. Wu, J.; Huang, Y.; Xia, Q.; Li, Z. Decomposition of Toluene in a Plasma Catalysis System with NiO, MnO2, CeO2, Fe2O3, and CuO Catalysts. Plasma Chem. Plasma Process. 2013, 33, 1073–1082. [Google Scholar] [CrossRef]
  47. Orge, C.A.; Órfão, J.J.M.; Pereira, M.F.R.; Duarte de Farias, A.M.; Fraga, M.A. Ceria and cerium-based mixed oxides as ozonation catalysts. Chem. Eng. J. 2012, 200–202, 499–505. [Google Scholar] [CrossRef]
  48. Diehl, J.W.; Finkbeiner, J.W.; DiSanzo, F.P. Determination of benzene, toluene, ethylbenzene, and xylenes in gasolines by gas chromatography/deuterium isotope dilution Fourier transform infrared spectroscopy. Anal. Chem. 1993, 65, 2493–2496. [Google Scholar] [CrossRef]
Figure 1. Total, reversible and irreversible adsorbed amounts of toluene on CeO2 for relative humidity ranging from dry to 80% RH (flow: 0.5 L/min, 70 mg CeO2, 100 ppm of toluene, P = 101.3 kPa, and T = 298 K).
Catalysts 08 00303 g001
Figure 2. Evolution of ozone concentration as a function of the specific input energy (SIE) in post plasma-catalysis (PPC) and in plasma-catalysis (IPC) configurations, with and without ceria, under dry condition (dry air flow: 0.5 L/min, P = 101.3 kPa, and T = 298 K).
Catalysts 08 00303 g002
Figure 3. Evolution of CO2 concentration as a function of time at the output of IPC reactor (a) and PPC reactor (c) for different specific input energies (SIE); evolution of CO2 formation yield as a function of time for IPC reactor (b) and PPC reactor (d) for different specific input energies (SIE) (dry air flow: 0.5 L/min, 60 min plasma treatment, 70 mg ceria, 1.4 ± 0.2 μmol/m2 toluene initially adsorbed, P = 101.3 kPa, and T = 298 K).
Catalysts 08 00303 g003
Figure 4. Evolution of the mineralization efficiency η as a function of the specific input energy (SIE) for the IPC and PPC reactors (dry air flow: 0.5 L/min, 60 min plasma treatment, 70 mg ceria, 1.4 ± 0.2 μmol/m2 toluene initially adsorbed, P = 101.3 kPa, and T = 298 K).
Catalysts 08 00303 g004
Figure 5. Evolution of ozone produced as a function of the specific input energy (SIE) in the IPC configuration, with and without ceria, and with different relative humidity levels (flow: 0.5 L/min, injected power from 0 to 50 J/L, P = 101.3 kPa, and T = 298 K).
Catalysts 08 00303 g005
Figure 6. Temporal evolutions of CO2 concentration at the IPC reactor outlet during à 60-min plasma exposure of toluene adsorbed on CeO2 under different RH levels with SIE of 2 J/L (a) and 19 J/L (c); and temporal evolutions of the normalized mineralization of toluene ε(t) under different RH levels with SIE of 2 J/L (d) and 19 J/L (b) (flow: 0.5 L/min, 70 mg ceria, P = 101.3 kPa, and T = 298 K).
Catalysts 08 00303 g006
Figure 7. General scheme of the experimental set-up.
Catalysts 08 00303 g007
Figure 8. Fourier transfer infrared (FTIR) gas phase spectra acquired during toluene (a), O3 (b), CO2 (c) and CO (d) calibrations. The framed regions (Q) indicated the portions of the spectra are used to quantify the corresponding species.
Catalysts 08 00303 g008
Figure 9. Scheme of the plasma-catalytic reactors in the PPC (a) and IPC (b) configurations.
Catalysts 08 00303 g009
Table 1. Quantities of ozone produced during a 60min-plasma for different SIE under IPC or PPC, and corresponding ozone/toluene ratios (dry air: 0.5 L/min, 70 mg ceria, a minimum of 7.1 μmol of toluene initially adsorbed, P = 101.3 kPa, and T = 298 K).
SIE (J/L)Ozone Produced During 60 min (μmol)Ratio of Ozone to Toluene
2243:1
812017:1
1920429:1
Table 2. Quantities of irreversibly adsorbed toluene on CeO2 expressed in µmol/m2 for different relative humidity levels (%) (flow: 0.5 L/min, 70 mg ceria, P = 101.3 kPa, [Tol.] = 100 ppm and T = 298 K).
RH (%)Amount of Irreversibly Adsorbed Toluene (µmol/m2)
01.40
200.80
500.66
800.56
Table 3. FTIR detection limits of the main detected species.
CompoundDetection Limit (ppbv)
Toluene130
CO220
CO10
O315
H2O2800

