Abstract
In this paper, the Hummer’s method was used to prepare the compound catalyst of reduced graphene and TiO2 (RGO-P25), and the sand core plate was used as the carrier to provide the theoretical basis for the application of animal environmental purification by exploring the degradation of ammonia in RGO-P25. Characterization results show that the band gap of P25 is reduced from 3.14 eV to 2.96 eV after the combination of RGO, and the recombination rate of the photogenerated electrons and holes also decreased significantly, both resulting in the improvement of ammonia degradation by composite catalysts. Experimental results show that the carrier (sand core plate) and RGO-P25 are effectively stabilized with Si–O–Ti, but the blank core plate carrier could not degrade the ammonia, and its adsorption is not obvious, only 5% ± 1%, under 300 W ultraviolet lamp irradiation, the degradation rates of P25, RGO and RGO-P25 for ammonia at initial concentrations of 119–124 ppm were 72.25%, 81.66% and 93.64%, respectively. P25 dispersed through RGO can effectively adsorb ammonia on the surface to provide a reaction environment and thereby improve its photocatalytic efficiency, thus, endowing the RGO-P25 composites with higher photocatalytic degradation performance than RGO or P25 individually.
1. Introduction
With the rapid development of China’s aquaculture industry, the scale of livestock and poultry farming has been continuously increasing, thereby resulting in a significant increase in poultry breeding waste and emissions. The environmental pollution from livestock and poultry farming has thus become a major health threat [1,2]. Approximately 58.21% of agricultural non-point source pollution is contributed by livestock and poultry farming [3]. Environmental pollution from livestock and poultry farming mainly involves malodourous gas pollution and faecal sewage pollution, and causes spread of disease. It has severely affected human health, and the health condition, hygiene, epidemic prevention, and meat quality of livestock and poultry, and human health [4]. The smell of livestock and poultry housescomes from the discharged gas, dung manure, faecal transport, and fertilization, including main ammonia, hydrogen sulphide, indole, mercaptan, volatile fatty acids, and hundreds of other toxic and hazardous substances [5,6]. Among these gases, ammonia and hydrogen sulphide are the main components of the odour and are also among the odorous pollutants regulated by the state [7,8].
In recent years, several countries have implemented legislation and governance, and done other work on malodourous gas regulation in livestock and poultry farming. China has also begun its prevention and control over odour pollution in livestock and poultry farms [9]. At present, the removal methods of odour gas containing sulphur and nitrogen are mainly physical ventilation, excrement and adsorption. However, these methods have limitations. They fail to fundamentally eliminate the odour gas. Therefore, a simple and efficient odorous gas degradation technology needs to be developed.
Semiconductor photocatalytic oxidation technology has several advantages such as low cost, the ability to oxidize decomposition, eliminate odour, and kill bacteria. It is also energy-efficient, environmentally friendly, and generates no secondary pollution. Hence, semiconductor photocatalytic oxidation has become a popular field in air purification research [10]. Among a large number of semiconductor materials, nano-titanium dioxide (nano-TiO2) is advantageous due to its high catalytic activity, resistance to chemical and optical corrosion, strong redox capacity, non-toxicity, and low cost. Nano-TiO2 has thus become the most widely used semiconductor material. It is mainly used in environmental control [11], batteries [12], energy storage [13], and dye solar cells [14]; the photocatalytic products have also been extensively used and developed [15,16,17,18]. However, TiO2 has a wide band gap, which can only be excited by ultraviolet light, and its quantum yield is low. These drawbacks significantly limit the photocatalytic efficiency of TiO2. Myung Hun Woo and his colleagues described the memory based on MoS2 that shows excellent retention time and a stable cycling endurance of more than 103 cycles at low operating voltage [19]. P. Atkin et al. [20] devoted themselves to 2D WS2/carbon dot hybrids, which is widely used in photocatalysis. Also, 2D transition metal oxide (TMOs) has a wide range of applications [21]. However, the most important problem is the excessive absorption of light, and TiO2 as a photocatalyst that requires good light absorption. Therefore, the study of the TMOs/TiO2 complex may make up for the shortcomings of both.
It has been found that graphene has good light transmittance, high electron mobility, and huge specific surface area making it an ideal carrier in recent years. Hicham Atout et al. [22] prepared RGO-P25 by a hydrothermal method to degrade methylene blue and Bhavana Gupta et al. [23] prepared RGO-TiO2 by a facile gamma radiolytic methodology and photocatalytic hydrogen production. Most researchers have used Hummer’s method or an improved Hummer’s method to produce RGO [24,25]. The study of the photocatalytic properties of RGO/TiO2 is also a hot topic [26,27,28].
Some scholars have introduced the photocatalytic technology of TiO2 into the field of livestock farming to purify the malodourous gas. Guarino et al. [29], Costa et al. [30], and Sang Moon Lee et al. [31] used TiO2 photocatalytic techniques to treat ammonia in pig farming houses, and the concentration of ammonia in the house significantly decreased. Hongmin Wu et al. [32] prepared with a high active surface and {001}TiO2 under UV light on ammonia degradation and pointed out that the main product was N2 and the major by-products were N2O, NO2− and NO3−. However, reports on the use of graphene-TiO2 composite material (RGO-P25) for odour decomposition are limited. Therefore, RGO-P25 composites were prepared in this study, and the degradation conditions of the composite photocatalytic materials were optimized by using simulated emission (mainly ammonia) in livestock and poultry houses. This investigation can provide theoretical bases for the application of this technology in animal husbandry.
2. Results and Discussion
2.1. Morphologic Characterization of Sand Core Plate
Figure 1 shows the elemental composition and morphologies of the sand core plate. To determine the elements and structures contained in the blank catalyst-carrier material (sand core plate), EDS characterization was performed. Figure 1a–c,e shows that the sand core plate mainly consists of three elements: silicon, oxygen and sodium. The content of silicon was 49.56 wt %, and that of oxygen was 41.29 wt %. The content of sodium is relatively low, only 2.79 wt %. The scanning electron microscopy (SEM) image in Figure 1d demonstrates that the fritted disc is mainly composed of particulate matters that form a porous structure, which can effectively increase the load and bonding force between the load material and the load base and in turn prevent the loss of RGO-P25 in suspension, thereby improving its utilization in the photocatalytic process [33].
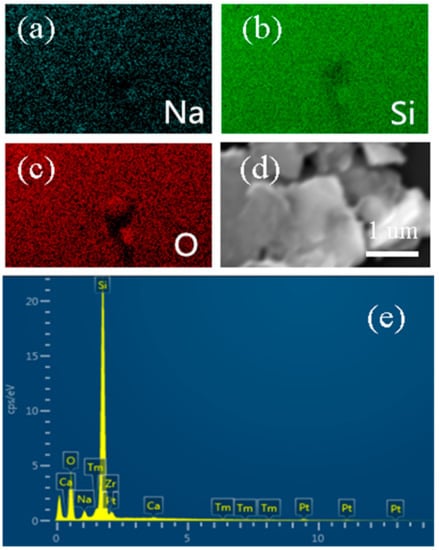
Figure 1.
(a–c) the corresponding elemental mapping images of Na, O, Si from the selected of the sand core plate and (d,e) the (Energy Dispersive X-Ray Spectroscopy) EDS and SEM images of the sand core plate.
2.2. Structural Characterization
The X-ray diffraction (XRD) patterns of as-prepared graphene oxide (GO), reduced graphene oxide (RGO), P25 and compound material (RGO-P25) samples are shown in Figure 2. The XRD peak positions for GO at 2θ were 10.6°, the Bragg equation has been calculated by the 0.4052 nm, which is larger than the graphite 0.333 nm, indicating that the graphite has been oxidized, for RGO at 2θ were 26.4°, a new diffraction peak appears, which indicates that GO has been restored, for both P25 and RGO-P25 at 2θ were 25.3°, 37.8°, 49.1°, 53.9°, 55.1°, 62.7°, 70.3° and 75.1°, corresponding to planes (101), (004), (200), (105), (211), (204), (220), (215), which matches well with anatase TiO2 (JCPDS card No. 21-1272), as well as 2θ were 27.4°, 36.1°, 41.2°, corresponding to planes (110), (101), (111) which suits well with rutile TiO2 (JCPDS card No. 21-1276).
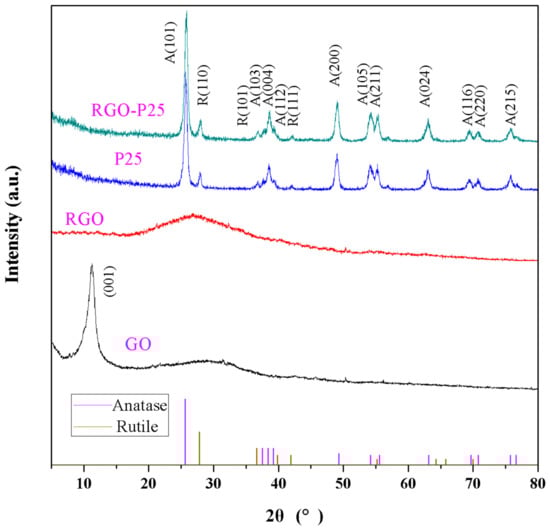
Figure 2.
The XRD patterns of the different catalysts.
Figure 3 shows EDS of P25(a) and RGO-P25(b). Figure 3a shows that P25 contains only two elements, namely, titanium and oxygen, with a titanium content of 59.24 wt % and oxygen content of 40.76 wt %, indicating that the P25 used in this experiment has low impurity. The main element in the carrier of the sand core is Si element (Figure 1), which also indicates that the catalyst and the carrier may be bound by the Ti-O-Si bond, which greatly reduces the loss of the catalyst. However, the synthetic material RGO-P25 contains three elements: carbon (44.73 wt %), oxygen (35.19 wt %), and titanium (20.07 wt %) in Figure 3b. The carbon element in the figure may be a carbon element in the graphene material, but it may also be an impurity.
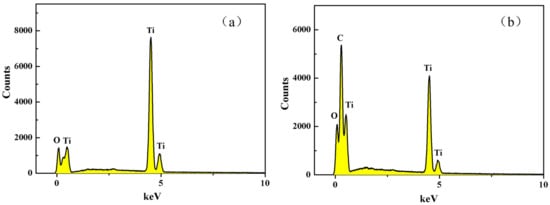
Figure 3.
EDS images of P25 (a) and RGO-P25 (b).
The morphology of P25 and RGO-P25 were characterized by scanning electron microscopy (SEM) in Figure 4. Figure 4a shows that P25 crystals display nanoparticles of uniform size, but the reunion is very serious, resulting in low photocatalytic time utilization, which leads to a slow reaction. Figure 4b shows that RGO-P25 is a typical layered three-dimensional structure that is made up of several RGO lamellar structures, and some P25 nanoscale clusters are distributed on the edges of numerous layers, and that RGO has largely dispersed P25. It also illustrates the combination of RGO and P25, which further illustrates that the C element in Figure 3b is mainly from the graphene material.
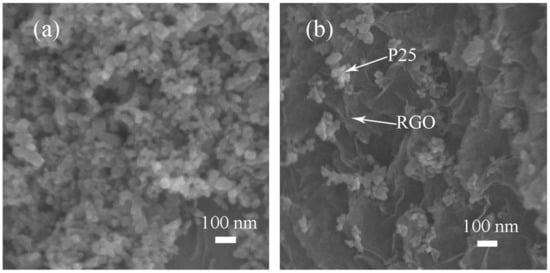
Figure 4.
SEM images of P25 (a) and RGO-P25 (b).
2.3. UV-Vis Diffuse Reflection Spectra Analysis
The UV-vis absorption spectroscopy (a) and the band gap (b) of both P25 and RGO-P25 samples are shown in Figure 5. The RGO-P25 has a strong absorption from 342 to 800 nm, which indicates stronger light absorption property than that of P25 (Figure 5a). Band gap information can be seen in Figure 5b exhibiting that the value of the band gap of RGO-P25 is 2.96 eV, which is lower than P25 (3.14 eV), but higher than that of nickel oxide nanoparticles [34] and hematite nanoparticles [35].
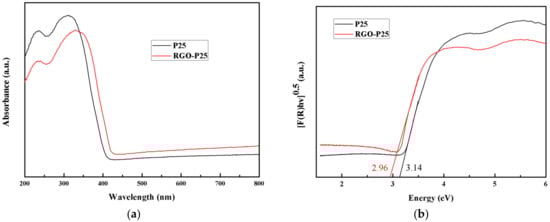
Figure 5.
UV-vis diffuse reflection spectra spectroscopy (a) and the band gap (b) of P25 and RGO-P25.
2.4. Fourier Transform Infrared Analysis
Figure 6 displays the FT-IR spectra of GO, RGO and RGO-P25. The absorption peaks at 3420 cm−1 and 1634 cm−1, which could be ascribed to the adsorbed water molecules on the particles [36,37]. The absorption peaks at 1720 cm−1 and 1045 cm−1 are attributed to the absorption of carboxylic acid C=O and the C–OH stretching vibration, separately [38]. The band observed at 1380 cm−1 is the stretching vibration of the carboxyl C–O [39]. For the RGO-P25, the strong band around 500 cm−1 should contribute to the Ti–O–Ti stretching vibration [40].
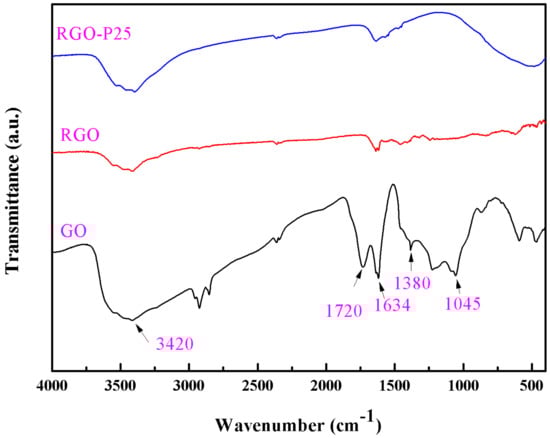
Figure 6.
The FT-IR spectra of GO, RGO and RGO-P25 samples.
2.5. Photoluminescence Analysis
Figure 7 shows the fluorescence emission spectrum of P25 and RGO-P25. The fluorescence intensity in the fluorescence emission spectrum of a semiconductor photocatalyst can be used to characterize the recombination rate of photogenerated electrons and photogenerated holes; the lower the fluorescence intensity of photogenerated electrons is, the more effective the separation of photogenerated holes [41]. The fluorescence intensity of the composite RGO-P25 is significantly lower than that of P25, which indicates that the existence of RGO decreases the photoelectron and hole loading rate of P25, thereby enhancing its photocatalytic performance.
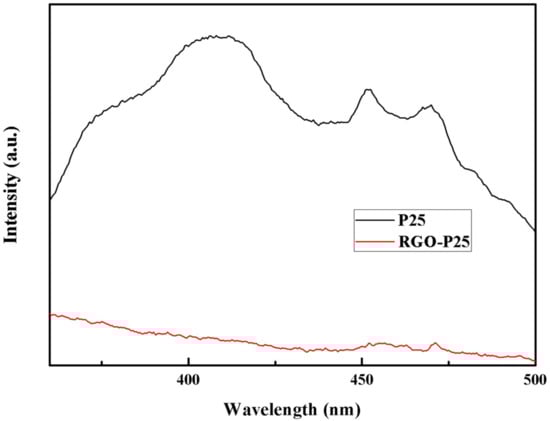
Figure 7.
Photoluminescence emission spectra of P25 and RGO-P25 samples.
2.6. BET Surface Area Analysis
Figure 8 demonstrates that the P25 and RGO-P25 showed a typical IV type N2 adsorption-desorption isother. The specific surface area of P25 is 53.6 m2/g less than RGO-P25 is 73.3 m2/g.
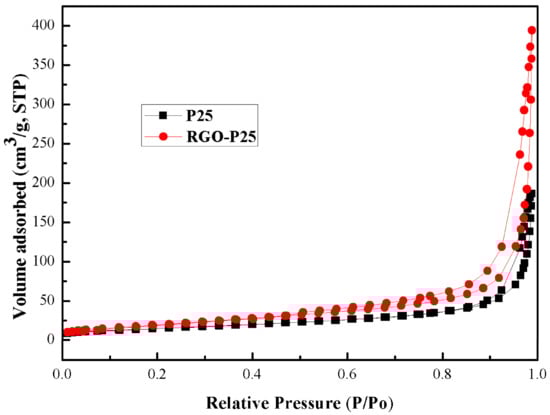
Figure 8.
The BET spectra of P25 and RGO-P25 samples.
2.7. Photocatalytic Activity
2.7.1. Analysis of Photocatalytic Effect of the Blank Sample
The control experiment was conducted on the blank sand core plate that was not loaded with a photocatalyst, i.e., the absorptive photocatalytic efficiency of the blank sand core plate on NH3 gas was measured in the presence or absence of light (Figure 9) within 100 min; under the conditions of both no light and light, the degradation efficiency of the blank sand core plate carrier on ammonia is 5% ± 1%, and the efficiency is not obviously improved, which means that the carrier of the sand core plate itself hardly occurs photolysis. At the same time, the absorbability of the core plate on the ammonia gas is not strong. The degradation rate of light is slightly lower than that of no light. It is possible that the temperature produced by light affects the stability of the gas.
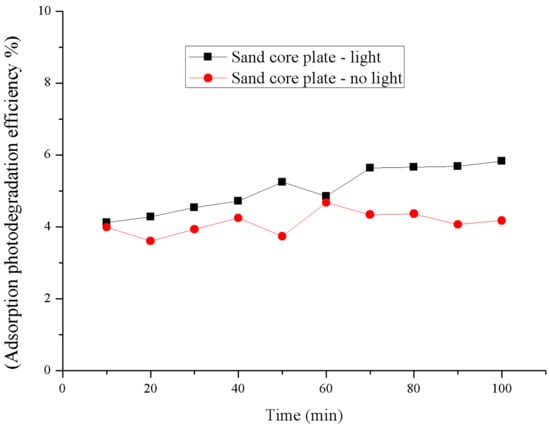
Figure 9.
The comparison degradation of the blank sand core plate carrier.
2.7.2. Photocatalytic Degradation Effect of RGO-P25 on Ammonia
Figure 10 shows that the degradation efficiency of RGO-P25 was as high as 97.39% within 50 min of the reaction. With the prolongation of reaction time, the degradation efficiency slightly decreased, and the degradation effect remained stable from 70 min to 100 min later, maintaining efficiency at around 94%. The blank sand core plate used in this experiment did not impart a photocatalytic degradation effect on ammonia (Figure 8). These findings indicate that most of the ammonia gas was decomposed by the RGO-P25 catalyst, and the catalytic performance was stable. Combining the adsorptive capability of activated carbon and the photocatalytic activity of P25, RGO-P25 shows superior photocatalytic ability. On the one hand, P25 prolongs the service life of sand core plates and improves the efficiency of ammonia degradation. On the other hand, the lamellar fold structure of RGO can maximize the amount of ammonia adsorbed on the surface of the composite material, providing an effective degradation environment for photocatalytic reaction. In addition, certain characteristics of RGO such as high loading and large specific surface area have expanded the reaction contact area, thereby improving the photocatalytic performance of RGO-P25. Due to the instability of the gas distribution, the degradation efficiency of the composite material is unstable during the reaction. During the early stages of the reaction, the adsorption capacity of the sand core plate reaches equilibrium, thereby causing a decrease in degradation efficiency. The photocatalytic effect tends to be stable in the later stages, mainly due to the Si-O-Ti bond formed between the silicon element and the interface of P25 phase, maintaining the stability of the catalytic activity of titanium dioxide P25 [42].
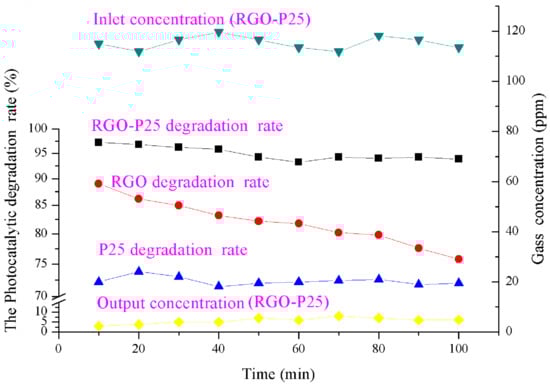
Figure 10.
The degradation effect of ammonia by RGO-P25, RGO and P25.
The comparison of degradation effects of RGO-P25, RGO, and P25 is shown in the middle of the Figure 10. RGO had a strong adsorption capacity to ammonia gas in the early stage of the reaction, and the maximum adsorption rate reached 88.71%. As reaction time increased, because adsorption tends to be saturated, a gradual decrease in adsorption efficiency was observed. P25 showed relatively stable photocatalytic efficiency during the entire reaction, which was maintained at about 72%. The degradation ability of the RGO-P25 composites gradually decreased with reaction time, which finally stabilized at 94% after 40 min. Comparison of these catalytic effects indicated that the degradation effect of RGO-P25 was significantly better than that of P25 and RGO (p < 0.05). Wang et al. [43] have found that the addition of RGO can enhance the enrichment ability of P25 to the substrate molecules, whereas increasing the transfer rate of photoelectrons on the P25 surface, thereby suppressing the recombination of electron-hole pairs. RGO-P25 composites increase the adsorption of the P25 surface by carbon doping and play a dual role in adsorption and photocatalysis. At the same time, the composites (RGO-P25) effectively suppress the recombination of electron-hole pairs and prolong the life of hydroxyl radicals. The catalytic activity is thus improved, and the degradation effect is superior to that of RGO. On the other hand, P25 can effectively stabilize the degradation effect by the regeneration of photocatalyst, which renders the RGO-P25 composites to have a stronger photocatalytic ability to remove NH3 even after continuous use. Therefore, RGO-P25 composites have the advantages of high efficiency and stable degradation.
2.7.3. Distinguish between Adsorption and Degaration of Ammonia
Figure 11 shows the degradation of ammonia by RGO-P25 in light and dark conditions. We have found that under dark conditions the effect of RGO-P25 on ammonia is far less dominant than that under light conditions, and the effect of RGO-P25 on ammonia is weakened with the time of reaction. This is due to the gradual saturation of RGO-P25.
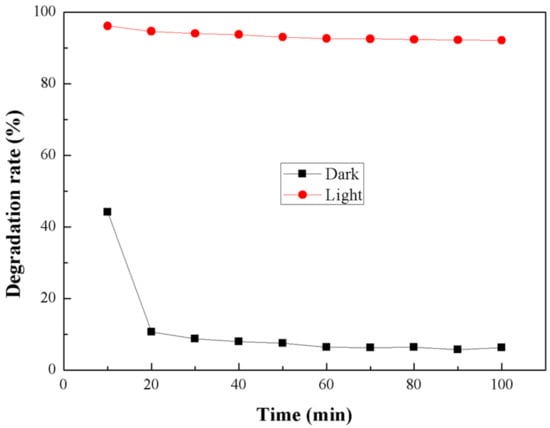
Figure 11.
Degradation of ammonia under dark and light.
3. Materials and Methods
3.1. Materials
Graphite (AR, DengKe Co. Ltd., Tianjin, China), sodium nitrate, potassium permanganate, concentrated sulfuric acid, hydrazine hydrate (GR, Kelong Co. Ltd., Chengdu, China), hydrogen peroxide solution, ammonia, hydrochloric acid (AR, Chuandong Co. Ltd., Chongqing, China), ascorbic acid (AR, Shanghai Macklin Biochemical Co. Ltd., Shanghai, China), P25 (Degussa, Essen, Germany).
3.2. Experimental Devices
A continuous photocatalytic reactor (tubular photocatalytic reactor) was used in the experiment. The experimental setup is shown in Figure 12. The photocatalytic experimental setup consists of a gas-generating device, an air pump, a cryogenic recirculation condenser, an air flow meter, a gas valve, and a photocatalytic reaction tube (placed in a reaction tank). The loaded photocatalytic material was placed in the reaction chamber, and the end was connected to the exhaust absorption bottle.
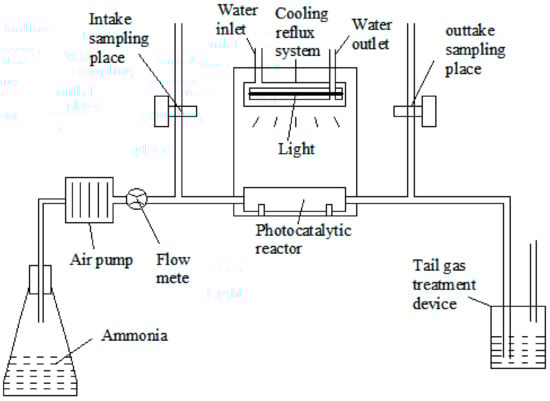
Figure 12.
The flow chart of photocatalytic reaction.
3.3. Experimental Methods
3.3.1. Preparation of RGO-25 Materials
The specific experimental process of preparing graphene oxide (GO) is as follows: in a 250 mL flask, we added 1 g graphite, 0.6 g sodium nitrate, and 40 mL concentrated sulfuric acid, then mixed it for 10 min and stirred for half an hour. Then, while the flask was in an ice bath, we slowly added 5 g of potassium permanganate under agitation and continued stirring at room temperature for 12 h. Then, we added 40 mL deionized water drop by drop in drastic agitation, stirred for 12 h at 70 and then stirred for 12 h at 35 °C. After that, 15 mL hydrogen peroxide (30 wt %) was added to the suspension, and the colour changed from dark brown to yellow. The obtained products were washed with water and 5 wt % HCl respectively for several times and then centrifuged with deionized water until the pH value of the product was neutral. Finally, the aforementioned graphene oxide was stripped under the action of ultrasonic, and the graphene oxide colloid was obtained.
Graphene oxide (GO) was prepared by Hummer’s method. Approximately 8 mL of GO gel solution (10 mg/mL) was added to 12 mL of water, and sonicated for 15 min to obtain the GO solution. Around 200 mg of P25 was weighed and added into GO solution. The solution was mixed thoroughly, mixed with 0.24 g ascorbic acid and 0.25 mL hydrazine hydrate, and then sealed for sonication for 30 min. After sonication, the solution was left to stand at room temperature for 8 h, washed and centrifuged with deionized water and anhydrous ethanol, respectively, and then dried at room temperature to obtain RGO-P25.
P25 and RGO-P25 composite materials were placed into a clean beaker, ultrapure water was added. Then, we sonicated and fully dispersed the powder in the water, swiftly placed the load body into the beaker and the load body rapidly absorbed the solution containing nano material, put the load body in an oven at 70 degrees for the purpose of heat preservation for 30 min and took the load body out of the oven when the water dried out. After repeating the above steps for two times, the load body was placed in an oven at 200 degrees Celsius for heat preservation for 1 h, and then stored at room temperature.
3.3.2. Photocatalytic Test
Ammonia gas was pumped through an air flow meter (air pump pressure: 8 kp). The flow rate was adjusted to the value required by the experiment, and the photocatalytic reaction took place in a tubular reactor. The temperature inside the reactor was kept constant by using a low temperature circulating condenser. Sampling ports were set at the inlet and outlet of the photocatalytic reactor. During the experiment, the gas chromatograph was used to determine the concentration of ammonia before and after the reaction. After each experiment, the pipe was blown with nitrogen to prepare for the next experiment. Ammonia gas detection device (REA, Huari Scientific Instruments Co., Ltd., San Francisco, CA, USA, 0.1 ppm).
3.3.3. Control Test on Catalyst Carrier (Fritted Disc)
The blank fritted disc (φ = 48.26 mm) was placed in the reactor, and the reactor was sealed. The relative humidity of the reactor was 75%, and the temperature was 15 °C. The concentration of ammonia was 119–124 ppm, and the air flow rate was 100 L/h. Exit concentration was monitored every 10 min. The A 300 W ultraviolet lamp (λ = 365 nm) was used as light source for the photocatalytic reactions. Each test was repeated three times.
3.3.4. Photocatalytic Degradation of Ammonia by RGO-P25
The fritted disc loaded with RGO-P25 was placed in the reactor. The gas at an initial concentration of 119–124 ppm ammonia was introduced at a flow rate of 100 L/h, relative humidity of 75%, and temperature of 15 °C. The concentration of the outlet gas was measured at 10 min intervals. A 300 W ultraviolet lamp (λ = 365 nm) was used as light source for the photocatalytic reactions. Each test was repeated three times.
3.3.5. Comparison of the Photocatalytic Decomposition Effects of RGO-P25, P25, and RGO
The fritted disc loaded with RGO-P25/P25/GO was placed in the reactor. Ammonia gas was introduced at a concentration of 119–124 ppm, a flow rate of 100 L/h, relative humidity of 75%, and temperature of 15 °C. The concentration of the gas at the outlet was measured at 10 min intervals. A 300 W ultraviolet lamp (λ = 365 nm) was used as light source for the photocatalytic reactions. Each test was repeated three times.
3.3.6. Data Analysis
The data were plotted with Origin (9.0, Origin Lab, Northampton, MA, USA, 2012).
3.4. Catalyst Characterization
The model XRD D8-Advance diffraction (Bruker, Bremen, Germany) test catalyst crystal characteristics, operation parameters for X ray tube = Cu, scan range from 5 to 80, the scanning speed of = 2.0000 (°/min).The UV visible diffuse reflectance characteristic of the instrument were measured by ultraviolet visible spectrophotometer TU-1911 (Thermo Fisher, Shanghai, China) with the integrating sphere and the Shanghai Precision Science Instrument Co., Ltd. (Shanghai, China) the reference substance was BaSO4, the spectrum scanning range from 200 to 800 nm. The Tensor 27 (Bruker, Germany) Fourier infrared spectrometer were used in the wavelength range from 4000 to 400 cm−1. The scanning electron microscope of S4800 (Hitachi, Japan) equipped with EDS were used to observe the microstructure of the catalyst and analysis elemental, and the operating voltage was 5 Kv. The Photoluminescence F-2700 (Hitachi, Tokyo, Japan) emission spectra were measured at room temperature with a fluorescence spectrophotometer using 325 nm line with a Xe lamp.
4. Conclusions
Reports on the use of graphene-TiO2 composite material (RGO-P25) for odour decomposition are limited. Therefore, modified RGO-P25 composites were prepared in this study. Graphite oxide was successfully oxidized to graphene oxide by Hummer’s method, and then reduced graphene was prepared by reduction. Characterization by EDS and SEM found that the band gap of the RGO-P25 composite material declined, and photogenerated electrons and holes also dropped significantly, making its catalytic performance better than that of RGO or P25 alone. Experimental results show that degradation and absorption both existed when degrading the ammonia, with degradation being more dominant. The carrier (sand core plate) and RGO-P25 are effectively stabilized with Si–O–Ti, but the blank core plate carrier could not degrade the ammonia, and its adsorption was not obvious under ultraviolet light, the degradation rate of RGO-P25 to 119–124 ppm concentration in 50 min can be as high as 97.39%.
Author Contributions
In this paper, D.L. and S.P. designed the experiments; J.Z. conducted the experiments; Z.L. and F.Y. analysed the data; S.P. wrote the article.
Acknowledgments
This work was financially supported by national key research and development Program of China (2016YFD0500506), the program for Earmarked Fund for Modern Agro-industry Technology Research System (CARS-35), the guide performance fund of scientific research units in Chongqing (cstc2017jxjl80044), and Scientific Observation and Experiment Station of Livestock Equipment Engineering in Southwest, Ministry of Agriculture.
Conflicts of Interest
There is no conflict of interests exiting in the manuscript submission, and it is approved by all of the authors for publication. All the authors listed have approved the manuscript to be enclosed.
References
- Kong, Y.; Han, L. Environmental contamination from animal faeces in china and control countermeasures. J. China Agric. Univ. 2002, 7, 92–96. [Google Scholar]
- Meng, X.H.; Zhang, J.B.; Li, P.; Chen, X.K. Overview of environmental pollution situation and policy of animal husbandry. J. Ecol. Rural Environ. 2014, 30, 1–8. [Google Scholar]
- Yang, Z. Investigation of Agricultural Non-Point Source Pollution in Chongqing Section of the Three Gorges Based on Pressure-State-Response. Master’s Thesis, Southwest University, Chongqing, China, 2009. [Google Scholar]
- Pu, S.; Lin, B.; Liu, Z.; Yang, S. Research and application of air deodourization technology in livestock and poultry house. Shanghai J. Anim. Husb. Vet. Med. 2013, 6, 42–43. [Google Scholar]
- Mackie, R.I.; Stroot, P.G.; Varel, V.H. Biochemical identification and biological origin of key odour components in livestock waste. J. Anim. Sci. 1998, 76, 1331–1342. [Google Scholar] [CrossRef] [PubMed]
- Le, P.D.; Aarnink, A.J.; Jongbloed, A.W. Odour and ammonia emission from pig manure as affected by dietary crude protein level. Livest. Sci. 2009, 121, 267–274. [Google Scholar] [CrossRef]
- Miner, J.R.; Hazen, T.E. Ammonia and amines: Components of swine-building odour. ASAE Trans. 1969, 12, 772–774. [Google Scholar]
- Ministry of Environmental Protection of the People’s Republic of China, General Administration of Quality Supervision, Inspection and Quarantine of the People’s Republic of China. Emission Standards for Odour Pollutants (GBl4554–93); Standards Press of China: Beijing, China, 1994.
- Jian, B.; Zhou, L.; Yang, H. Research progress of odour controlling in scale livestock and poultry farms. J. Anhui Agric. Sci. 2014, 17, 5511–5513. [Google Scholar]
- Aarnink, A.J.; Verstegen, M.W. Nutrition key factor to reduce environmental load from pig production. Livest. Sci. 2007, 109, 194–203. [Google Scholar] [CrossRef]
- Mohammad, R.; Delsouz, K.; Mohammad, S.S.; Abdul Aziz, A.R.; Wan, M.A.; Wan, D. Evaluating the efficiency of nano-sized Cu doped TiO2/ZnO photocatalyst under visible light irradiation. J. Mol. Liq. 2018, 258, 354–365. [Google Scholar]
- Zhu, P.N.; Wu, Y.Z.; Reddy, M.V.; Nair, S.A.; Chowdari, B.V.R.; Ramakrishna, S. Long term cycling studies of electrospun TiO2 nanostructures and their composites with MWCNTs for rechargeable Li-ion batteries. RSC Adv. 2012, 2, 531–537. [Google Scholar] [CrossRef]
- Zhao, J.; Yang, Y.Y.; Li, Y.; Zhao, L.; Wang, H.; Song, G.L.; Tang, G.Y. Microencapsulated phase change materials with TiO2-doped PMMA shell for thermal energy storage and UV-shielding. Sol. Energy Mater. Sol. Cells 2017, 168, 62–68. [Google Scholar] [CrossRef]
- Fitra, M.; Daut, I.; Irwanto, M.; Gomesh, N.; Irwan, Y.M. Effect of TiO2 thickness dye solar cell on charge generation. Energy Procedia 2013, 36, 278–286. [Google Scholar] [CrossRef]
- Agatino, D.P.; Elisa, G.L.; Giuseppe, M.; Leonardo, P. A survey of photocatalytic materials for environmental remediation. J. Hazard. Mater. 2012, 211, 3–29. [Google Scholar]
- Wu, Y.C.; Wang, Y.; Cui, J. Applications of nanostructured TiO2 for pollution monitoring and remediation in aquatic systems. Funct. Mater. Inf. 2011, 8, 15–19. [Google Scholar]
- Chen, X.B.; Mao, S.S. Titanium dioxide nanomaterials: Synthesis, properties, modifications, and applications. Chem. Rev. 2007, 107, 2891–2959. [Google Scholar] [CrossRef] [PubMed]
- Kitano, M.; Matsuoka, M.; Ueshima, M.; Anpo, M. Recent developments in titanium oxide-based photocatalysts. Appl. Catal. A 2007, 325, 1–14. [Google Scholar] [CrossRef]
- Myung, H.W.; Byung, C.J.; Junhwan, C.; Khang, J.L.; Gwang, H.S.; Hyejeong, S.; Sung, G.I.; Sung, Y.C.; Memory, D. Low-power nonvolatile charge storage memory based on MoS2 and an ultrathin polymer tunneling dielectric. Adv. Funct. Mater. 2017, 27. [Google Scholar] [CrossRef]
- Atkin, P.; Daeneke, T.; Wang, Y.; Carey, B.J.; Berean, K.J.; Clark, R.M.; Ou, J.Z.; Trinchi, A.; Cole, I.S.; Kalantar-zadeh, K. 2D WS2/carbon dot hybrids with enhanced photocatalytic activity. J. Mater. Chem. A 2016, 4, 13563–13571. [Google Scholar] [CrossRef]
- Kourosh, K.Z.; Jian, Z.O.; Torben, D.; Arnan, M.; Takayoshi, S.; Michael, S.F. Two dimensional and layered transition metal oxides. Appl. Mater. Today 2016, 5, 73–89. [Google Scholar]
- Atout, H.; Álvarez, M.G.; Chebli, D.; Bouguettoucha, A.; Tichit, D.; Llorca, J.; Medina, F. Enhanced photocatalytic degradation of methylene blue: Preparation of TiO2/reduced graphene oxide nanocomposites by direct sol-gel and hydrothermal methods. Mater. Res. Bull. 2017, 95, 578–587. [Google Scholar] [CrossRef]
- Bhavana, G.; Ambrose, A.M.; Tom, M.; Dhara, S.; Dash, S.; Tyagi, A.K. Facile gamma radiolytic methodology for TiO2 -rGO synthesis: Effect on photo-catalytic H2 evolution. Hydrog. Energy 2015, 40, 5815–5823. [Google Scholar]
- Ganganagappa, N.; Gunter, E.; Renato, V.; Gonc, A.; Sergio, R.T.; Daniel, E.W.; Jairton, D. Controlled growth of TiO2 and TiO2-RGO composite nanoparticles in ionic liquids for enhanced photocatalytic H2 generation. J. Mol. Catal. A 2013, 378, 213–220. [Google Scholar]
- Fatima, T.J.; Woo, G.J. RGO-TiO2-ZnO composites: Synthesis, characterization, and application to photocatalysis. Appl. Catal. A 2015, 491, 52–57. [Google Scholar]
- Liang, Y.Y.; Wang, H.L.; Casalongue, H.S. TiO2 nanocrystals grown on graphene as advanced photocatalytic hybrid materials. Nano Res. 2010, 3, 701–705. [Google Scholar] [CrossRef]
- Chao, C.; Cai, W.; Long, M. Synthesis of visible-light responsive graphene Oxide/TiO2 composites with p/n heterojunction. ACS Nano 2010, 4, 6425–6432. [Google Scholar]
- Yoo, D.H.; Cuong, T.V.; Pham, V.H. Enhanced photocatalytic activity of graphene oxide decorated on TiO2 films under UV and visible irradiation. Curr. Appl. Phys. 2011, 11, 805–808. [Google Scholar] [CrossRef]
- Guarino, M.; Costa, A.; Porro, M. Photocatalytic TiO2 coating-to reduce ammonia and greenhouse gases concentration and emission from animal husbandries. Bioresour. Technol. 2008, 99, 2650–2658. [Google Scholar] [CrossRef] [PubMed]
- Costa, A.; Chiarello, G.L.; Selli, E. Effects of TiO2 based photocatalytic paint on concentrations and emissions of pollutants and on animal performance in a swine weaning unit. J. Environ. Manag. 2012, 96, 86–90. [Google Scholar] [CrossRef] [PubMed]
- Lee, S.M.; Lee, H.H.; Hong, S.C. Influence of calcination temperature on Ce/TiO2 catalysis of selective Catalytic oxidation of NH3 to N2. Appl. Catal. A. 2014, 470, 189–198. [Google Scholar] [CrossRef]
- Wu, H.M.; Ma, J.Z.; Li, Y.B.; Zhang, C.B.; He, H. Photocatalytic oxidation of gaseous ammonia over fluorinated TiO2 with exposed (001) facets. Appl. Catal. B 2014, 152–153, 82–87. [Google Scholar] [CrossRef]
- Liu, R.H. Preparation of TiO2 Nanocomposite Fabric and Its Photocatalytic Degradation on Ammonia. Master’s Thesis, Tianjin University of Technology, Tianjin, China, 2005. [Google Scholar]
- Ramasami, A.K.; Reddy, M.V.; Balakrishna, G.R. Combustion synthesis and characterization of NiO nanoparticles. Mater. Sci. Semicond. Process. 2015, 40, 194–202. [Google Scholar] [CrossRef]
- Ramasami, A.K.; Ravishankar, T.N.; Sureshkumar, K.; Reddy, M.V.; Chowdari, B.V.R.; Ramakrishnappa, T.; Balakrishna, G.R. Synthesis, exploration of energy storage and electrochemical sensing properties of hematite nanoparticles. J. Alloys Compd. 2016, 671, 552–559. [Google Scholar] [CrossRef]
- Hou, C.T.; Zhu, J.M.; Song, Q. Low temperature synthesis of nest-like microsphere with exposed (001) facets and its enhanced photocatalytic performance by NaOH alkalization. Catalysts 2018, 8, 70. [Google Scholar] [CrossRef]
- Iwata, T.; Watanabe, A.; Iseki, M.; Watanabe, M.; Kandor, H. Strong donation of the hydrogen bond of tyrosine during photoactivation of the bluf domain. J. Phys. Chem. Lett. 2011, 2, 1015–1019. [Google Scholar] [CrossRef]
- Yang, W.D.; Li, Y.R.; Lee, Y.C. Synthesis of r-GO/TiO2 composites via the UV-assisted photocatalytic reduction of graphene oxide. Appl. Surface Sci. 2016, 380, 249–256. [Google Scholar] [CrossRef]
- Bagri, A.; Mattevi, C.; Acik, M.; Chabal, Y.J.; Chhowalla, M.; Shenoy, V.B. Structural evolution during the reduction of chemically derived graphene oxide. Nat. Chem. 2010, 2, 581–587. [Google Scholar] [CrossRef] [PubMed]
- Hou, C.T.; Liu, W.L.; Zhu, J.M. Synthesis of NaOH-modified TiOF2 and its enhanced visible light photocatalytic performance on RhB. Catalysts 2017, 7, 4332. [Google Scholar] [CrossRef]
- Ding, Z.; Lu, G.Q.; Greenfield, P.F. Role of the crystallite phase of TiO2 in heterogeneous photocatalysis for phenol oxidation in water. J. Phys. Chem. B 2000, 104, 4815–4820. [Google Scholar] [CrossRef]
- Sarunas, V.; Dalius, G.; Marius, U.; Darius, M. Incorporation of SiO2 and TiO2 additives into expanded polystyrene foam using physical vapour deposition technique. Energy Procedia 2017, 128, 525–532. [Google Scholar]
- Wang, J.F.; Zhu, H.J.; Hurren, C.; Zhao, J.; Pakdel, E.; Li, Z.Y.; Wang, X.J. Degradation of organic dyes by P25-reduced graphene oxide: Influence of inorganic salts and surfactants. J. Environ. Chem. Eng. 2015, 3, 1437–1443. [Google Scholar] [CrossRef]
© 2018 by the authors. Licensee MDPI, Basel, Switzerland. This article is an open access article distributed under the terms and conditions of the Creative Commons Attribution (CC BY) license (http://creativecommons.org/licenses/by/4.0/).