Article

Deconstruction of the CYP153A6 Alkane Hydroxylase System: Limitations and Optimization of In Vitro Alkane Hydroxylation

Department of Biotechnology, University of the Free State, Bloemfontein 9300, South Africa
*
Authors to whom correspondence should be addressed.
Catalysts 2018, 8(11), 531; https://doi.org/10.3390/catal8110531
Submission received: 15 October 2018 / Revised: 31 October 2018 / Accepted: 2 November 2018 / Published: 9 November 2018

Abstract

:
Some of the most promising results for bacterial alkane hydroxylation to alcohols have been obtained with the cytochrome P450 monooxygenase CYP153A6. CYP153A6 belongs to the class I CYPs and is generally expressed from an operon that also encodes the ferredoxin (Fdx) and ferredoxin reductase (FdR) which transfer electrons to CYP153A6. In this study, purified enzymes (CYP, Fdx, FdR and dehydrogenases for cofactor regeneration) were used to deconstruct the CYP153A6 system into its separate components, to investigate the factors limiting octane hydroxylation in vitro. Proteins in the cytoplasm (cell-free extract) were found to better enhance and stabilize hydroxylase activity compared to bovine serum albumin (BSA) and catalase. Optimization of the CYP:Fdx:FdR ratio also significantly improved both turnover frequencies (TFs) and total turnover numbers (TTNs) with the ratio of 1:1:60 giving the highest values of 3872 h−1 and 45,828 moloctanol molCYP−1, respectively. Choice and concentration of dehydrogenase for cofactor regeneration also significantly influenced the reaction. Glucose dehydrogenase concentrations had to be as low as possible to avoid fast acidification of the reaction medium, which in the extreme caused precipitation of the CYP and other proteins. Cofactor regeneration based on glycerol failed, likely due to accumulation of dihydroxyacetone. Scaling the reactions up from 1 mL in vials to 60 mL in shake flasks and 120 mL in bioreactors showed that mixing and shear forces will be important obstacles to overcome in preparative scale reactions.

1. Introduction

Cytochrome P450 monooxygenases (CYPs or P450s) have long been recognized for their ability to catalyze the regio- and stereoselective oxyfunctionalization of a wide variety of hydrocarbons [1]. Apart from typical hydroxylation reactions, these heme containing enzymes have also been demonstrated in epoxidation, Baeyer-Villiger oxidation, dehydrogenation, isomerization, and demethylation reactions [2,3,4]. As these biocatalysts operate under mild conditions and only require molecular oxygen and reducing equivalents from NAD(P)H for activity, their promise as a green or environmentally friendly alternative to traditional chemical catalysts have prompted researchers to investigate their potential for industrial production of commodity/fine and bulk chemicals. Their substrate scope, regio- and enantioselectivity have also been expanded through directed evolution [5]. CYPs from the CYP153 and CYP52 families in particular have attracted interest due to their ability to selectively catalyze monoterminal oxidation of n-alkanes, a particularly difficult reaction to achieve using chemical catalysts [6]. Of the two families, the soluble bacterial CYP153s have received more attention, probably due in part to the inherent difficulties often encountered with the heterologous expression and purification of membrane associated fungal CYPs, to which the CYP52 family belongs. Some CYP153s have also been used in the terminal hydroxylation of fatty acids to produce ω-hydroxy fatty acids (ω-HFAs) [7], with further improvement towards this class of substrates through structure guided and semi-rational evolution [8,9,10].
Despite this superior regioselectivity, the applicability/feasibility of CYP153s have been hampered by various factors, including the requirement for cofactor regeneration as well as additional partner proteins for electron transfer. CYP153s belong to class I CYPs, which comprise three-component systems, requiring redox partner proteins such as ferredoxin (Fdx) and ferredoxin reductase (FdR) to shuttle electrons from NAD(P)H to the CYP (Scheme 1). The discovery of class VII and VIII CYPs [11], or so-called self-sufficient CYPs, where the redox partner proteins are naturally fused to the CYP (heme) domain, have prompted researchers to construct artificial self-sufficient CYP153s. The first artificial self-sufficient fusion was constructed by fusing the C-terminal redox domain (PFOR/RhfRed) of CYP116B2 (P450RhF), consisting of an FMN containing NADPH binding domain and an iron sulfur [2Fe2S]/ferredoxin-like domain to CYP153A13a (P450balk) [12]. More recently, CYP153AM.aq. has been fused to the cytochrome P450 reductase (CPR) domain of CYP102A1 (BM3), the PFOR domain of CYP116B3 [13] and CYP116B2 [10]. This is however no trivial task, as not only do the linker region’s sequence and length significantly influence the activity and coupling efficiency [10] but given that these reductase partners are not the CYPs’ natural redox partners, interdomain contacts also have to be optimized [14]. Although higher coupling efficiencies have been observed with artificial fusion systems such as CYP153A35 fused to the CPR of P450BM3, CYP153A35 displayed higher productivities in whole cells when used as a three-component system in combination with putidaredoxin (CamB) and putidaredoxin reductase (CamA) [15]. Different expression constructs to modulate the expression levels of the separate components also revealed the importance of the intracellular ratios of the components to drastically affect the activity. Although possible, optimization of heterologous protein expression ratios within a cell is difficult to accomplish, often requiring ribosomal binding site engineering [16].
To overcome many of these limitations, researchers have more frequently investigated the use of whole-cell systems for alkane and fatty acid hydroxylation. Unfortunately, these whole-cell systems also suffer from several limitations [17], including substrate uptake, product toxicity and inefficient cofactor regeneration. Substrate uptake can be improved through permeabilization of the whole cells or co-expression of transport proteins such as AlkL [13,18]. Product toxicity was confirmed through the addition of 1-octanol to whole-cell biotransformations using CYP153A6, requiring in situ product removal through a second organic phase such as bis(2-ethylhexyl) phthalate (BEHP) to alleviate the inhibition [19]. Co-expression of additional enzymes such as glycerol dehydrogenase (GlyDH) with the P450 enzymes in E. coli for adequate cofactor regeneration have also been investigated. Despite improved cofactor regeneration, this additional metabolic burden often is at the cost of P450 concentration [18].
To better understand the difficulties often encountered with whole-cell biotransformations we investigated a three-component CYP system using purified enzymes. As a continuation of our previous work, we chose CYP153A6, a well-known alkane hydroxylase, with n-octane as model substrate (Scheme 1).

2. Results and Discussion

2.1. Heterologous Expression and Purification

CYP153A6 from Mycobacterium sp. strain HXN-1500 naturally occurs in an operon with its redox partner proteins ferredoxin (Fdx) and ferredoxin reductase (FdR) [20]. We [21,22], and others [20,23,24], have traditionally studied CYP153A6 through heterologous expression in E. coli or Pseudomonas putida from this natural operon for both whole-cell (WC) and cell-free extract (CFE) biotransformations. The bacterial expression construct in pET28b(+) however only allows for the purification of the CYP153A6 which contained a plasmid-encoded hexa-histidine tag fused to the N-terminus of the protein. To purify the FdR and Fdx, each ORF of the three-component system was cloned separately into pET28b(+) with an N-terminal fused hexa-histidine tag. To improve the expression levels of the FdR and Fdx, the open reading frames were also codon optimized. Proteins were purified to near homogeneity using immobilized metal affinity chromatography with subsequent desalting through Sephadex desalting columns.

2.2. Cofactor Regeneration Using Glucose Dehydrogenase

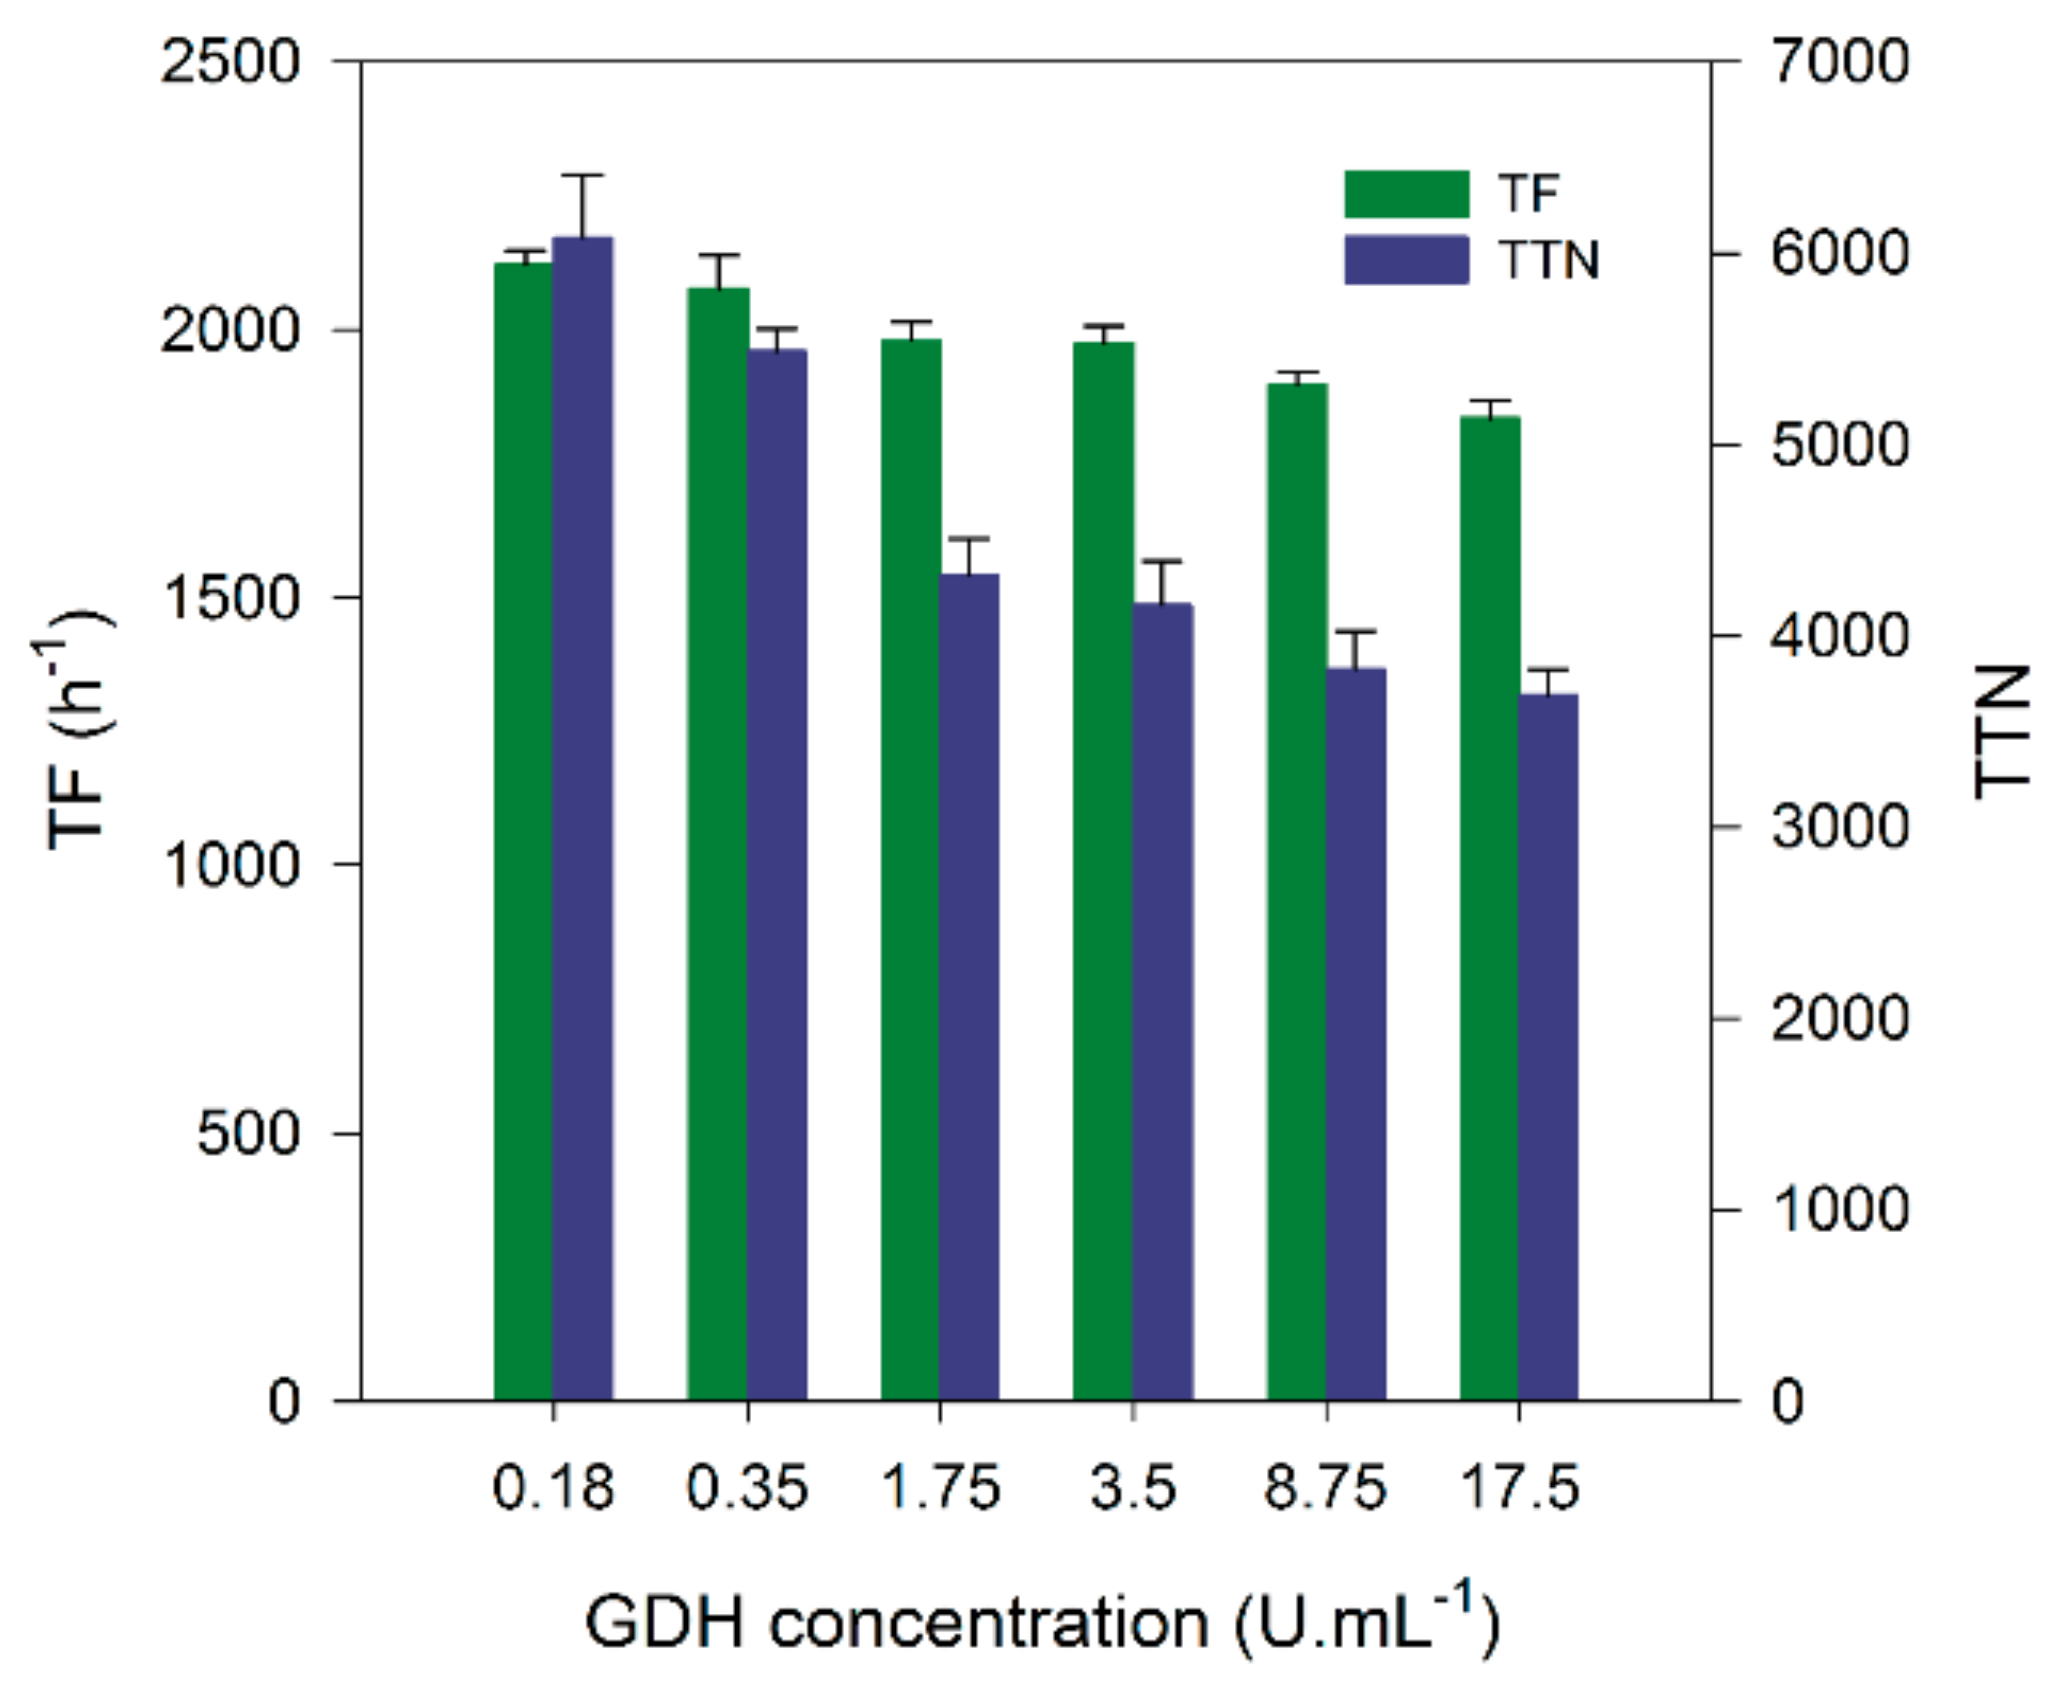
Purified biocatalysts were used in a 1:1:6 (CYP153A6:FdR:Fdx) molar ratio as previous investigation have indicated that Fdx concentration can significantly influence product yields [15,22]. Bovine serum albumin (BSA) and catalase have been shown to improve the stability of reactions using purified CYP153A13RhfRed [25] and were included in the reaction mixture to final concentrations of 10 mg mL−1 and 0.5 U mL−1, respectively. Glucose dehydrogenase (GDH) was selected as cofactor regeneration system as it can accept both NAD+ and NADP+ with similar turnover frequencies [26,27]. The influence of GDH concentration on the bioconversion of n-octane to 1-octanol was investigated between 0.18 U mL−1 to 17.5 U mL−1. The turnover frequencies (TF, after 1 h) and the total turnover numbers (TTN, after 17.5 h) were determined (Figure 1). Increasing the GDH concentration had a slight negative influence on the initial activity; however, this effect was more pronounced when considering TTNs, with TTNs decreasing approximately 50% with excess GDH. The lowered stability of the system could be explained by the increased production of gluconic acid and acidification of the reaction (vide infra). GDH concentrations of 0.1 or 0.2 U mL−1 was thus used in all further experiments.

2.3. Stabilization of Reactions

Biotransformations with purified proteins gave significantly lower product yields compared to previously reported results where the proteins were added as CFEs [22]. The addition of 10 mg mL−1 BSA did have a beneficial effect on the stability of the reaction system, as product concentrations were more than halved after 7 h in the absence of BSA, but no beneficial effect was observed when catalase was included. Given that these product yields were still significantly lower than our reactions with proteins in CFE, we decided to investigate whether the CFE, or any of its components, had a stabilizing effect on the reaction. E. coli CFE prepared from a 200 g (wet weight) L−1 cell suspension was added to a final concentration of 30% (v/v) to the biotransformations. The addition of the CFE significantly improved the product yields obtained after 7 h (Figure 2a). Reactions with Fdx or FdR omitted indicated that the CFE did not provide additional proteins able to facilitate electron transfer to the CYP. Reactions without GDH still achieved nearly half the product concentrations, with E. coli central metabolism (from the CFE) regenerating the required NADH from glucose in the reaction mixture. No additional added benefit could be detected with BSA and catalase when CFE was used. Time course reactions revealed 1-octanol concentrations reaching more than 16 mM after 17.5 h, approximately 4 times that observed with BSA, where the reaction already levelled off after only 3 h (Figure 2b). Also, no difference could be detected between reactions with purified Fdx added separately to the reaction or introduced as CFE containing Fdx (not purified).
To determine whether the proteins or small molecular weight compounds contained within the CFE (such as additional cofactor) were contributing to the improved activity and stabilizing effect, CFE were fractionated through ultrafiltration and again tested with purified proteins. When proteins were removed from the CFE, the stabilizing effect was not observed. The small molecular weight compound (>10 kDa) fraction was also combined with BSA, but improvements were comparable to that observed with BSA alone. We initially postulated that chaperone proteins could potentially be responsible for the increased activity/stability of the reaction system. CFE from different strains of E. coli, expressing different chaperones, were tested, but no significant differences could be detected. To optimize the amount/concentration of CFE, different volumes (300–600 µL) of CFE were added to the biotransformation mixtures. Optimal yields were obtained with 50% (v/v) CFE.
To evaluate whether self-sufficient CYPs would similarly benefit from the addition of CFE, CYP153A13RhFRed was purified and product yields from BSA and catalase supplemented reactions compared to those supplemented with CFE. Indeed, product yields of 1-octanol by CYP153A13RhFRed were also found to be significantly improved by CFE (data not shown).

2.4. Ratios of Three-Component Systems

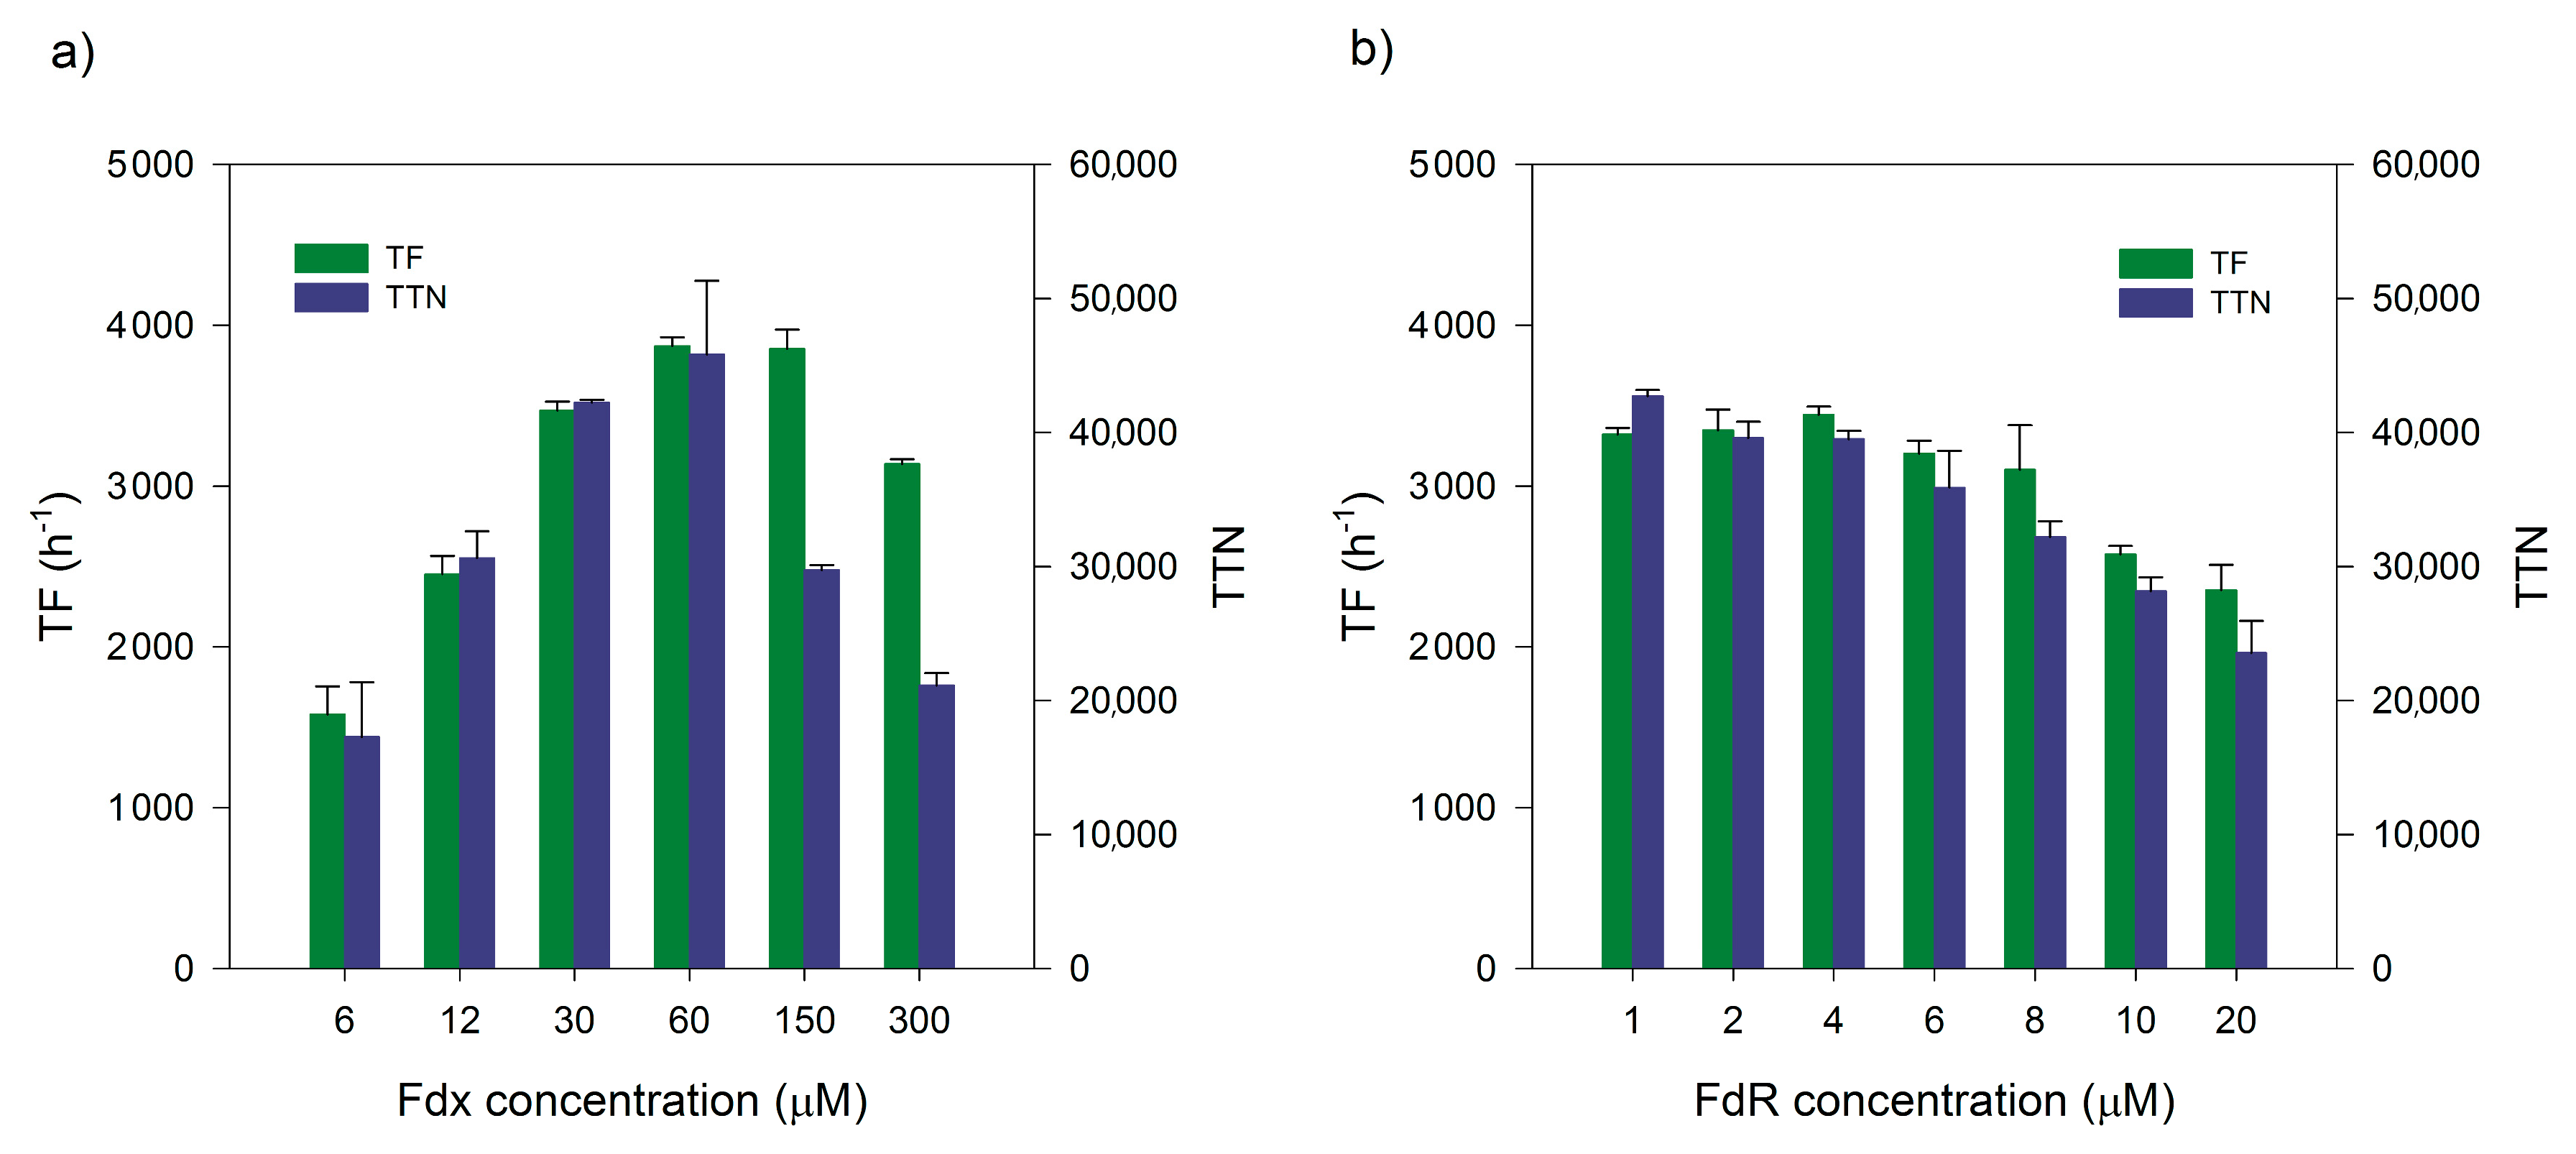
It has previously been reported that the relative concentrations (ratios) of the CYP and its electron transfer partner proteins significantly influences hydroxylase activity [15]. In a first round of optimization, the Fdx concentration was varied (6–300 µM) while maintaining the CYP153A6 and FdR concentrations at 1 µM (Figure 3a). Up to a ratio of 1:60 (CYP153A6:Fdx), the initial activity (TF) and the TTNs increased significantly, with TFs increasing from 1580 h−1 to 3872 h−1, and TTNs nearly tripling to approximately 46,000 (measured after 28 h). Ratios higher than 1:60 of CYP153A6:Fdx however had a severe negative impact on the TTNs and TFs to a lesser extent. In a second round of optimization, the FdR concentrations was varied between 1 and 20 µM, while maintaining the CYP153A6 at 1 µM and Fdx at 60 µM (Figure 3b). The initial activity was not influenced when increasing the FdR concentration to 4 µM but decreased when higher concentrations were used. The higher concentrations of FdR however did have a more pronounced effect on the TTNs, with concentrations higher than 1 µM decreasing the stability of the reaction.
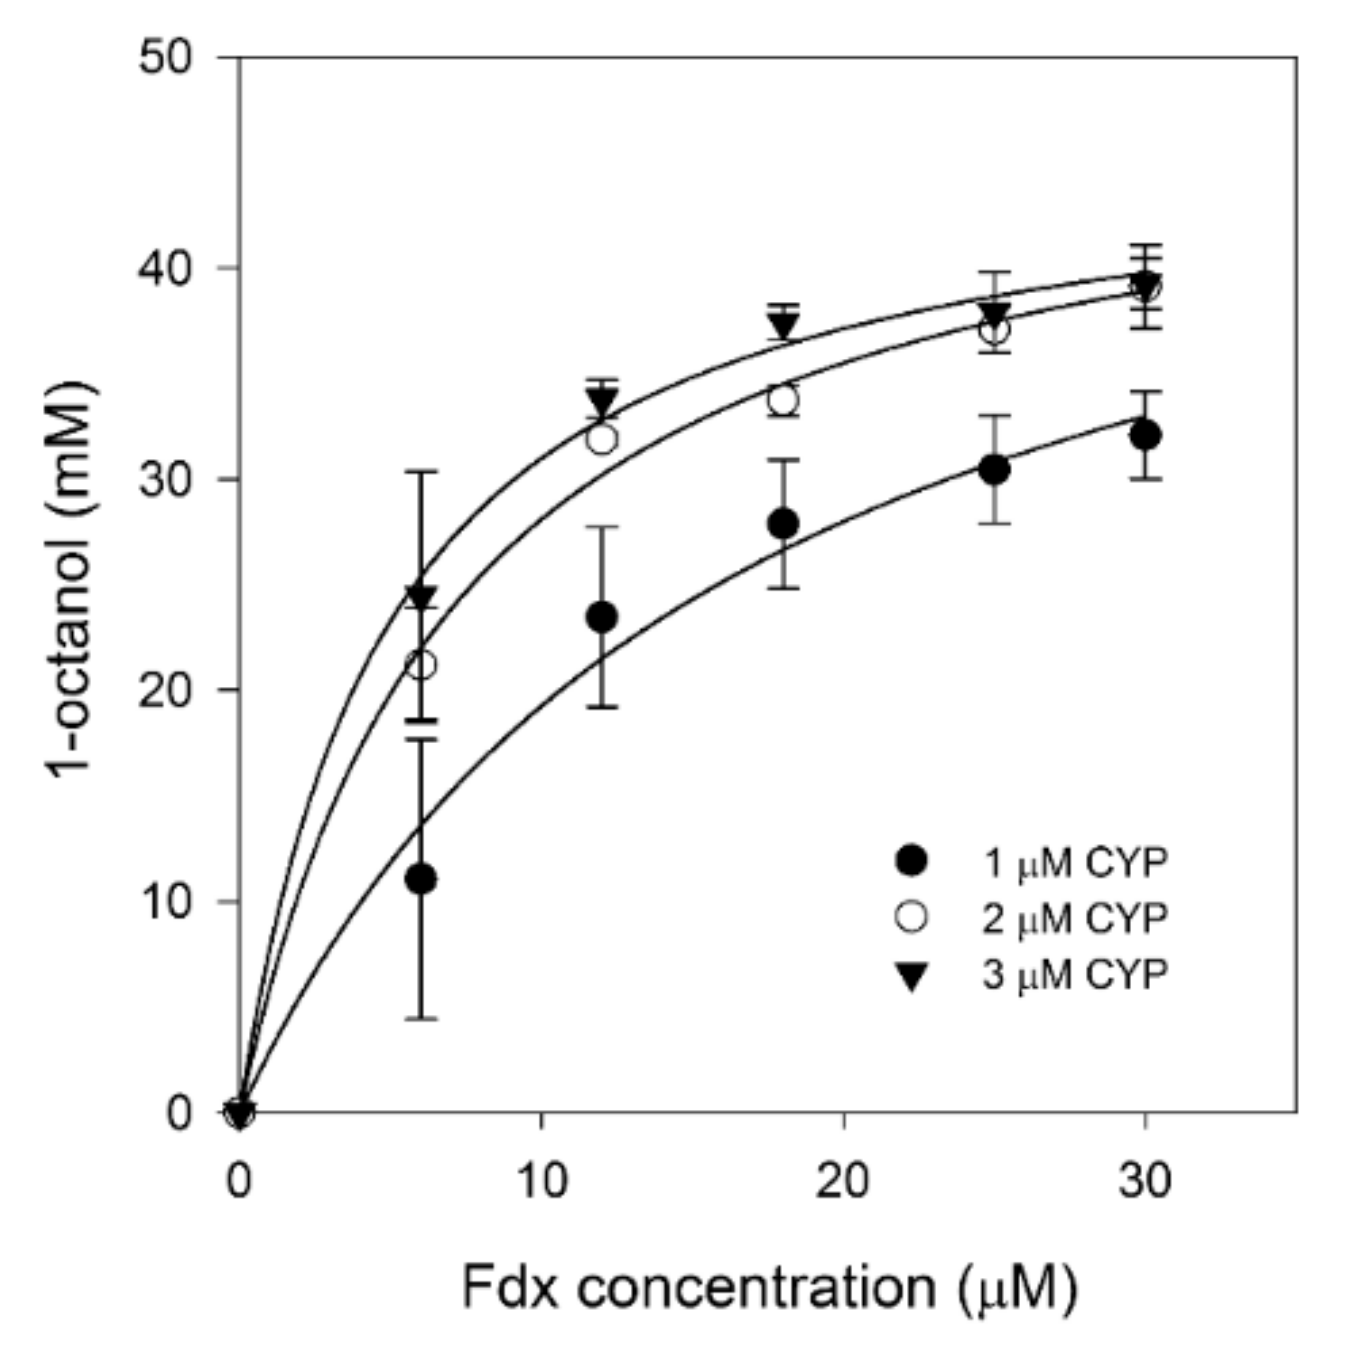
Finally, the concentration of the CYP153A6 was investigated (Figure 4). Concentrations of 1, 2 and 3 µM CYP153A6 was investigated with increasing concentrations of Fdx while maintaining the FdR concentration at 1 µM. The increased CYP153A6 concentration (2 and 3 µM) increased product yields as well as the TFs. Likewise, product concentrations increased with increasing Fdx concentrations up to 30 µM. No significant difference could however be detected in product yields after 17.5 h using 2 or 3 µM CYP153A6 at these high Fdx concentrations. Improved product yields (39 mM; 17.5 h) however resulted in a decreased TTN (measured relative to the CYP153A6 concentration).
Through these optimization experiments (Table 1), the TF increased approximately two-fold and the TTNs improved to approximately 20,000 (measured after 17.5 h using 2 µM CYP153A6).

2.5. Comparison of Glucose and Glycerol Dehydrogenase for Cofactor Regeneration

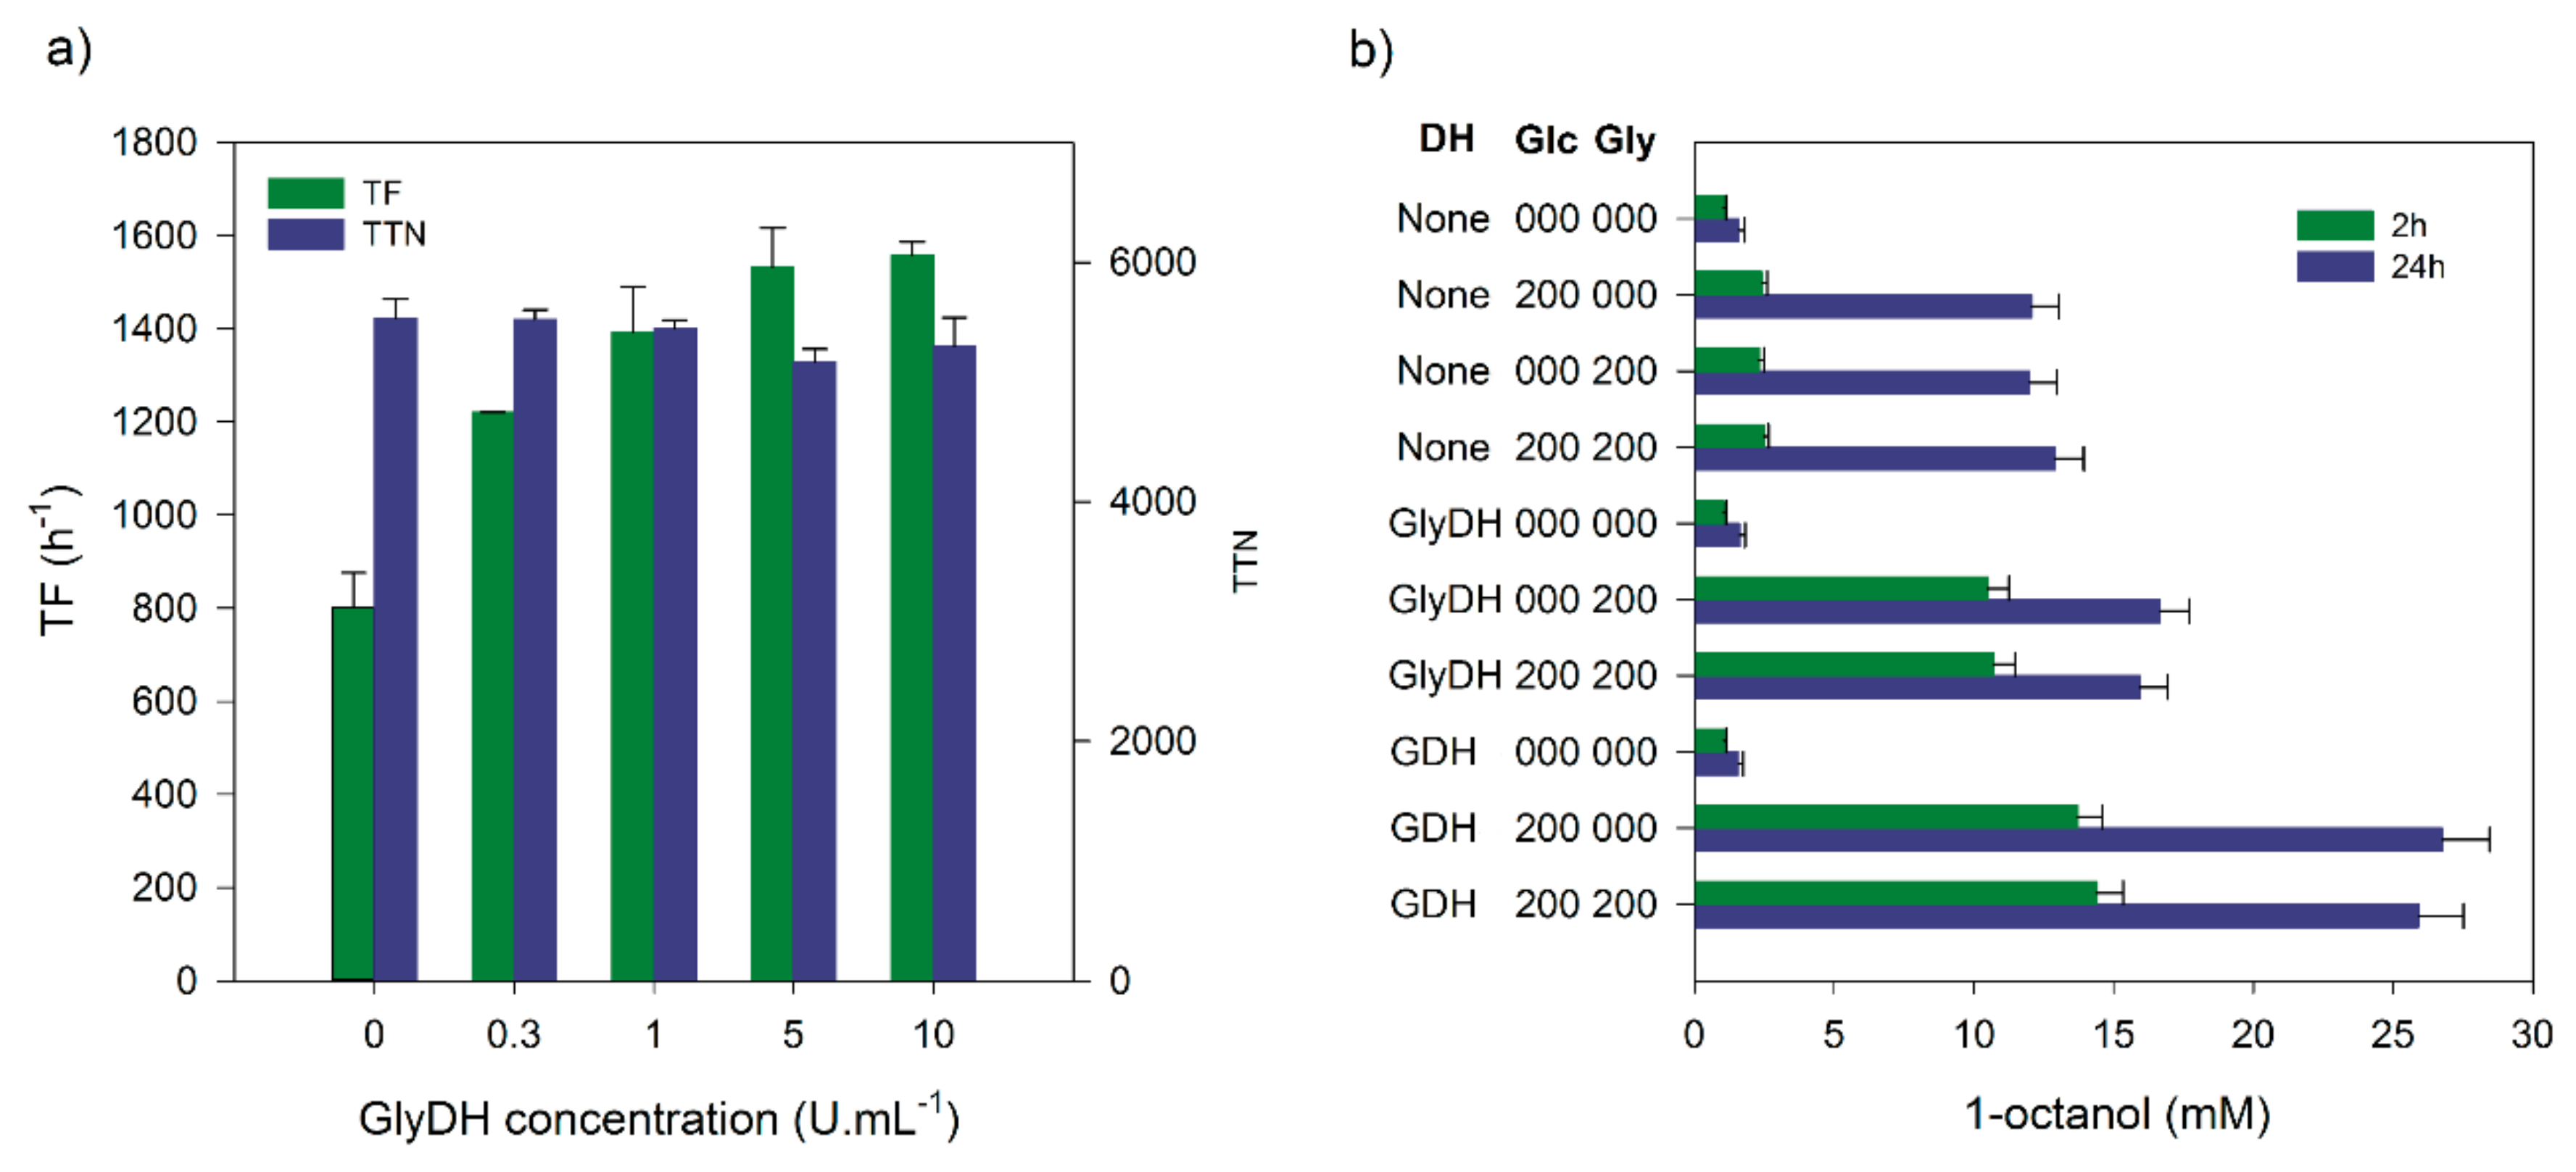
White et al. (2017) had found that an E. coli strain over expressing an additional E. coli glycerol dehydrogenase together with the CYP153A6 operon yielded excellent results when the cells were partially broken [18]. With this system, activity could be maintained for 72 h and a final product titer of 61 mM was achieved. To evaluate the E. coli GlyDH as a purified enzyme, the gene was cloned into pET28b(+) for expression in E. coli and similarly expressed and purified as the GDH. In the first set of experiments, different concentrations of GlyDH were evaluated in 1 mL reactions (Figure 5a). Concentrations of up to 6 U mL−1 improved initial reaction rates (TFs) significantly, but the GlyDH had very little, if any, effect on final product concentrations obtained after 24 h (TTNs). In a next set of 1 mL reactions the effects of the GDH, GlyDH and the remaining dehydrogenase activity in the CFE were compared (Figure 5b). Both dehydrogenases were added at 1 U mL−1. The effects of glucose and glycerol as substrates for cofactor regeneration were also evaluated. Although the high GDH concentration limited the final 1-octanol concentration to only 25 mM, this was still significantly higher than the product titers achieved when GlyDH was used. Addition of GlyDH improved the initial activity when compared to the remaining dehydrogenases in the CFE, but after 24 h it made little difference. Interestingly, performance of the dehydrogenases in the CFE was independent of whether glucose or glycerol was added as source of reducing equivalents. Simultaneous addition of both glucose and glycerol also did not improve performance of any of the cofactor regeneration systems.
In a final set of reactions, GDH (0.2 U mL−1) (Figure 6a) and GlyDH (1 U mL−1) (Figure 6b) were compared in shake flasks (60 mL aqueous reaction mixture) and vials (1 mL aqueous reaction mixture). CYP concentration and pH were monitored in the shake flask reactions. In the reactions with GlyDH performance was equally poor in the shake flasks and vials with a maximum 1-octanol concentration of only 20 mM achieved in the shake flasks after 48 h. In the reactions with GDH, 1-octanol titers levelled off at 43 mM after 18 h in the vials and at 30 mM after 12 h in the shake flasks. Despite the high concentration of buffer (200 mM Tris-HCl) used, a rapid drop in the pH was observed after only 6 h in the reactions containing GDH, causing the proteins in the reaction mixture to precipitate (Figure 6c,d) and the CYP concentration to drop to 0 (Figure 6a). In the case of the GlyDH reaction, the initial reaction rates were clearly limited by cofactor regeneration, while the GDH reactions were apparently limited by mixing, with mixing in vials most likely being more efficient than in shake flasks. In the GlyDH reactions where the pH only dropped to 7 the CYP concentration was still 1 µM after 48 h, clearly indicating that the reaction had stopped not because of a lack of CYP, but most likely because the GlyDH and other critical enzymes from the CFE were no longer active. Instability of the Fdx or FdR might of course also cause reactions to stop.

2.6. Biotransformations in 300 mL Stirred Bioreactors

To improve the mixing and maintain the pH of the reaction, biotransformations were carried out in 300 mL stirred bioreactors with online monitoring of pH and dissolved oxygen. In the first experiment the reaction mixture was stirred at 600 rpm to ensure complete mixing of the two phases. Product yield was however disappointing, with a maximum of only 8.7 mM 1-octanol produced after 49 h (Table 2). The levelling off of 1-octanol formation after 22 h corresponded to a drop in pH to below 7 (6.8). The poor performance in the bioreactor could be ascribed to several factors which included the drop in pH, evaporation of the octanol or shear forces inactivating the enzymes. In a next set of reactions, the stirrer speed was reduced from 600 rpm to 200 rpm and the pH in one reactor was maintained at 7.8 through titration with Tris-base (1 M). Neither of these measures improved product titers. The slower stirrer speed significantly reduced the initial reaction rate, while maintaining the pH at 8 did not prevent product formation levelling off after around 20 h. In fact, CYP measurements done after 30 and 48 h showed that the additional Tris-base had a negative effect on the stability of the CYP with final CYP concentration falling to 0.4 µM compared to 1.1 µM in the reactor where the pH fell to 6. Since the CYP concentration was still above 1 µM in the reactor where the pH was not controlled, the levelling off in product formation could also not be ascribed to a lack of CYP. Supplementing the reaction with additional FdR or Fdx, did not significantly improve 1-octanol yields.

3. Discussion

Members of the CYP153 class of enzymes have long been recognized for their ability to catalyze the selective terminal oxidation of alkanes and fatty acids. This selectivity and specificity have been expanded on in recent years [28,29,30,31,32,33]. Despite their impressive regioselectivity, their application in industrial processes have been hindered by various limitations, including among others, requirement for redox partner proteins, cofactor regeneration, stability, and low activity. To date, most studies have focused on the creation of self-sufficient CYP153s and WC (or permeabilized WC) biotransformations, with very few studies performed using CYP153s in vitro or as purified enzymes. Activity and stability of the self-sufficient CYP153A13RhFRed were shown to be improved through the addition of BSA and catalase [25]. Since we have observed that using CFE instead of purified enzymes led to significantly higher final product concentrations, we revisited the influence of BSA and catalase as well as CFE on the activity and stability of CYP153 biotransformations.
The addition of CFE to the purified proteins was found to significantly improve the product yields compared to that of BSA and catalase. The stabilizing effect depended on the proteins in the CFE, but whether it is due to a single protein, a combination of proteins or simply the increased molecular density provided by the CFE remains unknown. It has previously been shown that proteins can increase the solubility of alkanes in aqueous solutions, with different proteins binding (solubilizing) alkanes to different degrees [34]. While this could explain higher initial rates observed, it does not adequately explain the increased stability (TTNs) as the n-octane was added in excess (250 µL). Our previous investigations into n-octane hydroxylation by CYP153A6 have shown the reactions to greatly benefit from the addition of the substrate as a second phase despite the solubility of n-octane reported to be only 4 µM in aqueous solution and the apparent Kd value of CYP153A6 for n-octane being 0.17 µM [23]. The binding of the product 1-octanol could however result in increased TTNs due to a decrease in toxicity. No added benefit could be observed by adding exogenous catalase to the reactions. As E. coli BL21(DE3) is catalase positive, the CFE could provide protection against reactive oxygen species such as H2O2 formed as a result of uncoupling. CFE could also possibly limit the acidification of the reaction by GDH, through further metabolizing gluconic acid via the Entner-Doudoroff pathway, or if glucose is used via central metabolism for cofactor regeneration.
Another crucial factor for increasing the TFs of three-component systems such as CYP153A6 is the adjustment of the molar ratios of FdR and Fdx relative to the CYP. Deconstruction of the CYP153A6 operon system allowed us to optimize the molar ratios required for high initial reaction rates (TFs) as well as stability (TTNs) of the reaction system. Fdx concentration had the most prominent effect on TFs and TTNs of the reaction. A similar observation was made by Jung et al., where a CYP153A35:CamA:CamB ratio of 1:5:20 (µM) gave the highest product yields with palmitic acid [15]. This study however only evaluated product formation after 1 h of biotransformation and thus not the stability of the system. In our system, Fdx was shown to improve both the TF and TTN up to 60 µM. When increasing the Fdx concentration further to 150 µM, no effect was observed for TF, but the stability (TTN) of the system was significantly reduced. Product yields were also shown to be independent of initial CYP concentrations above 2 µM.
As GDH is known to acidify the reaction mixture, especially in the presence of reductases/hydrogenases with high uncoupling tendencies, GlyDH was also evaluated. GlyDH oxidizes glycerol to dihydroxyacetone, which in whole cells can enter central metabolism if dihydroxyacetone kinase is available. For efficient NADH production from glycerol it is, however, critical that dihydroxyacetone should not accumulate, as dihydroxyacetone is toxic to whole cells and is in fact at physiological pH the preferred substrate of GlyDH [35]. This potentially explains why the use of GlyDH for cofactor regeneration in the reconstituted CYP153A6 system only enhanced initial activity (TF) when compared to where only residual enzymes in the CFE were responsible for cofactor regeneration. The CFE enzymes were most likely unable to prevent accumulation of dihydroxyacetone and this within 10 h caused activity to level off at the same level as when only CFE enzymes were responsible for cofactor regeneration. This level was much lower than that achieved with GDH, despite the strong acidification observed with GDH causing proteins to precipitate when the pH dropped below 6. The possibility that the inherent instability of GlyDH, which loses 20% activity when incubated for 4 h at 30 °C and pH 8, contributed to the poor performance of GlyDH as cofactor regenerating enzyme, can also not be excluded [35].
Most of the data available on n-octane hydroxylations using the CYP153A6 system is from reactions carried out on a 1 mL scale in 40 mL vials. Scalability of this three-component system was investigated using both shake flasks and stirred bioreactors. With GDH as cofactor regenerating enzyme there was a decrease in final product titers as we moved from vials, to shake flasks to bioreactors, despite our efforts to maintain the pH in the bioreactors through titration with Tris-base. The higher initial reaction rate observed in the reaction stirred at 600 rpm indicates that mixing was a limiting factor. In the shake flasks and the reactor stirred at 200 rpm the n-octane formed a second layer indicating a possible lack of substrate availability although the solubility of n-octane is well above the apparent Kd value of CYP153A6 (vide supra). The shear forces associated with stirring for mixing and aeration could also have contributed to the poor performance of the cell-free enzymes in the bioreactors. In this respect the stability of CYP153A6 is remarkable, with 50% of the initial CYP still active after 48 h according to CO-difference spectra. White et al. had similarly noticed that even in cell-free reactions at least 75% of CYP153A6 was still intact after 24 h [18]. This again indicates that instability of other enzymes be considered.
The compromise of adequate mixing vs. protein stability, as well as the stabilizing effect of the CFE demonstrated with this study, provides further reason to accept the idea that CYP catalyzed hydroxylations for preparative/commercial purposes will only be feasible with whole cells or possibly immobilized enzymes. The use of purified enzymes however, allowed deconstruction of the CYP153A6 system into its separate components, making it possible to identify possible limiting factors important for optimization of WC processes. Strains engineered for such processes will have to express the Fdx at significantly higher levels (at least 30 times) than the CYP and FdR. It is also evident that cofactor regeneration activity must be closely matched with hydroxylase activity to minimize wastage of reducing equivalents through uncoupled reactions and unwanted metabolic activity that also causes unnecessary acidification. Reactor design will have to ensure proper mixing and aeration while pH control will be essential. The TFs and TTNs obtained in the vial reactions however, reflects the potential of the CYP153A6 system for alkane hydroxylation and set targets for WC processes.

4. Materials and Methods

4.1. Expression Constructs

The CYP153A6 operon and CYP153A13RhfRed in pET28b(+) were used as previously described [22]. The CYP153A6 was PCR amplified from the CYP153A6 operon containing plasmid and sub-cloned into pET28b(+) via NdeI and HindIII. The complete open reading frames of both the ferredoxin (Fdx) and ferredoxin reductase were codon optimized and synthesized by Genscript (Piscataway, NJ, USA), and sub-cloned into pET28b(+) using NdeI and XhoI. The glucose dehydrogenase (GDH) from Bacillus megaterium was kindly provided by Dr. Dirk Holtmann (Dechema, Germany) and sub-cloned into pET28b(+) using NdeI and XhoI. The glycerol dehydrogenase (GlyDH) from E. coli, previously cloned in pCDFDUET [18], were sub-cloned into pET28b(+) via NdeI and AvrII.

4.2. Heterologous Expression and Protein Purification

Plasmids were transformed into E. coli BL21(Gold)DE3 (Stratagene/Agilent, Santa Clara, CA, USA) and selected for on LB-medium containing 30 µg mL−1 kanamycin. Pre-cultures (50 mL) were grown overnight in LB-medium containing the same antibiotic with shaking (200 rpm) at 37 °C. Heterologous expression was performed using autoinduction medium (ZYP5052 medium) in a Biostat B plus bioreactor (5 L, Sartorius, Göttingen, Germany) containing 4 L medium. The media was supplemented with 0.5 mM 5-aminolevulinic acid and 0.05 mM FeCl3 for expression of the CYPs. Cells containing CYPs, FdR or Fdx were grown for 48 h at 20 °C, whereas cells expressing GDH or GlyDH were grown at 25 °C for 24 h with an air flow rate of 1.5 L min−1 and stirring at 300 rpm. Cells were harvested through centrifugation (8000× g, 4 °C, 10 min). For purification, cells were resuspended (0.2 g wet weight mL−1) in 50 mM Tris-HCl buffer (pH 7.4) containing 20 mM imidazole and 0.5 M NaCl (binding buffer). Cells were lysed through a single passage through a continuous cell disruptor (Constant systems Ltd, Daventry, UK) at 30 KPsi, followed by centrifugation (8000× g, 4 °C, 10 min) to remove unbroken cells. Soluble proteins were obtained through ultracentrifugation (100,000× g, 4 °C, 90 min). The supernatant was loaded onto a HisTrap FF column (GE Healthcare, Chicago, IL, USA) equilibrated with binding buffer and unbound proteins removed with 10 column volumes of binding buffer. Bound proteins were eluted with an increasing concentration of imidazole in the same buffer. Fractions containing the protein of interest were concentrated through ultrafiltration (10 or 30 kDa MWCO) using an Amicon Ultra-15 Centrifugal Filter Unit (Merck-Millipore, Massachusetts, MA, USA). Concentrated samples were desalted with a buffer change to 200 mM Tris-HCl (pH 8) buffer containing 0.1 M NaCl using PD10 desalting columns (GE Healthcare). Purified proteins were split in aliquots and stored at −80 °C.
CFEs were prepared from E. coli containing the pET28b(+) vector or the TaKaRa chaperone plasmid set with induction as described by the manufacturers. Cells were resuspended in 200 mM Tris-HCl buffer (pH 8) containing either 200 mM glucose or glycerol. CFEs were obtained from lysed cells after centrifugation (8000× g, 4 °C, 10 min). CFE could be stored at −80 °C with negligible differences observed.
The CYP153A6 concentration was determined using CO-difference spectra [36] in a microtiter plate format as previously described [22] using an extinction coefficient of 91 mM−1 cm−1. All other proteins were quantified using the bicinchoninic acid (Pierce BCA Protein Assay Kit, ThermoScientific, Waltham, MA, USA) or Bradford (Bio-Rad Bradford Protein Assay) methods as per manufacturers’ instructions. Concentration of the Fdx in CFE were determined through density analysis on SDS-PAGE through comparison with known concentrations of purified Fdx.
To ensure reproducibility between purification batches, the activity of FdR and Fdx were determined through the reduction of ferricyanide and cytochrome c, respectively. In short, the activity of FdR was determined through monitoring the direct reduction of ferricyanide by purified FdR at 420 nm (ε420 = 1.0 mM−1 cm−1) in 200 mM Tris-HCl buffer (pH 8) containing 1 mM ferricyanide, 2.5 mM NADH and purified FdR (10 nM). The activity of the purified Fdx, in turn, was determined through monitoring the reduction of equine cytochrome c at 550 nm (ε550 = 29.5 mM−1 cm−1) in the same buffer containing 25 nM FdR, 0.5 mM NADH, 0.05 mM cytochrome c and purified Fdx (1.25 µM).

4.3. Biotransformations—1 mL Scale

Biotransformations were performed in 40 mL amber glass vials containing 1 mL bioreaction mixture (BRM) and 250 µL n-octane. The BRM typically consisted of (unless otherwise stated) 200 mM Tris-HCl (pH 8) containing 2 µM CYP153A6, 1 µM FdR, 30 µM Fdx, 10 mg mL−1 BSA, 0.5 U mL−1 catalase, 50% (v/v) CFE from a 200 g (wet weight) L−1 cell suspension, 0.1 mM NADH, 0.1–0.2 U mL−1 GDH or 1 U mL−1 GlyDH and 200 mM glucose or glycerol. Vials were incubated at 20 °C with shaking (200 rpm). TFs were determined during the initial stages of the reaction and defined as mol1-octanol molCYP153−1 h−1, with TTNs given as mol1-octanol molCYP153−1 calculated at the end of the reaction [37].

4.4. Biotransformations on 60 mL Scale in Shake Flasks

Biotransformations were performed in 250 mL Erlenmeyer flasks containing 60 mL BRM and 15 mL n-octane. The BRM consisted of 200 mM Tris-HCl (pH 8) containing 2 µM CYP153A6, 1 µM FdR, 30 µM Fdx, 50% (v/v) CFE from a 200 g (wet weight) L−1 cell suspension, 0.1 mM NADH, 0.2 U mL−1 GDH or 1 U mL−1 GlyDH and 200 mM glucose or glycerol. Flasks were incubated at 20 °C with shaking (100 rpm). During sampling, the flasks were removed from the shaker and left for 20 s to allow for phase separation. The aqueous phase was used to determine pH (using pH strips), CYP concentration and SDS-PAGE analysis. The organic phase (upper layer) was used to determine 1-octanol production through correlating experimentally determined 1-octanol partition coefficients between aqueous (BRM) and organic (n-octane) phases.

4.5. Biotransformations on 120 mL Scale in Stirred Bioreactors

Biotransformations were performed using 300 mL Sixfors bioreactors (Infors HT, Bottmingen, Switzerland) containing a 120 mL BRM and 30 mL n-octane. The BRM contained 200 mM Tris-HCl buffer (pH 8), 200 mM glucose, 50% (v/v) CFE of a 200 g ww L−1 cell suspension, 2 µM A6, 1 µM FdR, 25 µM Fdx, 0.1 mM NADH and 0.1 U mL−1 GDH. The Sixfors bioreactors were stirred at 600 or 200 rpm at 20 °C measuring the dissolved oxygen concentration as well as pH online. When the pH was kept constant the BRM was titrated with 1 M Tris-base. Online dissolved oxygen levels showed oxygen to remain at 100% during the experiment.

Author Contributions

D.J.O. and M.S. conceptualized the study. K.S., J.v.M. and A.C.E. performed the experiments. All authors contributed to data analysis, writing, reviewing, and editing the final paper.

Funding

This research was funded by the Department of Science and Technology (DST, South Africa) through the national Centre of Excellence in Catalysis (c*change). Svenja Kochius’ postdoctoral scholarship was provided by the Claude-Leon Foundation.

Acknowledgments

The authors acknowledge Sarel Marais for GC analysis.

Conflicts of Interest

The authors declare no conflict of interest. The funders had no role in the design of the study; in the collection, analyses, or interpretation of data; in the writing of the manuscript, or in the decision to publish the results.

References

  1. Ortiz de Montellano, P.R. Hydrocarbon hydroxylation by cytochrome P450 enzymes. Chem. Rev. 2010, 110, 932–948. [Google Scholar] [CrossRef] [PubMed]
  2. Girvan, H.M.; Munro, A.W. Applications of microbial cytochrome P450 enzymes in biotechnology and synthetic biology. Curr. Opin. Chem. Biol. 2016, 31, 136–145. [Google Scholar] [CrossRef] [PubMed]
  3. Urlacher, V.B.; Girhard, M. Cytochrome P450 monooxygenases: An update on perspectives for synthetic application. Trends Biotechnol. 2012, 30, 26–36. [Google Scholar] [CrossRef] [PubMed]
  4. Urlacher, V.B.; Eiben, S. Cytochrome P450 monooxygenases: Perspectives for synthetic application. Trends Biotechnol. 2006, 24, 324–330. [Google Scholar] [CrossRef] [PubMed]
  5. Roiban, G.-D.; Reetz, M.T. Expanding the toolbox of organic chemists: Directed evolution of P450 monooxygenases as catalysts in regio- and stereoselective oxidative hydroxylation. Chem. Commun. 2015, 51, 2208–2224. [Google Scholar] [CrossRef] [PubMed]
  6. Johnston, J.B.; Ouellet, H.; Podust, L.M.; Ortiz de Montellano, P.R. Structural control of cytochrome P450-catalyzed ω-hydroxylation. Arch. Biochem. Biophys. 2010, 2, 2–10. [Google Scholar] [CrossRef] [PubMed]
  7. Malca, S.H.; Scheps, D.; Kühnel, L.; Venegas-Venegas, E.; Seifert, A.; Nestl, B.M.; Hauer, B. Bacterial CYP153A monooxygenases for the synthesis of omega-hydroxylated fatty acids. Chem. Commun. 2012, 48, 5115. [Google Scholar] [CrossRef] [PubMed]
  8. Hoffmann, S.M.; Danesh-Azari, H.R.; Spandolf, C.; Weissenborn, M.J.; Grogan, G.; Hauer, B. Structure-Guided Redesign of CYP153AM.aq for the Improved Terminal Hydroxylation of Fatty Acids. ChemCatChem 2016, 8, 3178. [Google Scholar] [CrossRef]
  9. Duan, Y.; Ba, L.; Gao, J.; Gao, X.; Zhu, D.; de Jong, R.M.; Mink, D.; Kaluzna, I.; Lin, Z. Semi-rational engineering of cytochrome CYP153A from Marinobacter aquaeolei for improved ω-hydroxylation activity towards oleic acid. Appl. Microbiol. Biotechnol. 2016. [Google Scholar] [CrossRef] [PubMed]
  10. Hoffmann, S.M.; Weissenborn, M.J.; Gricman, Ł.; Notonier, S.; Pleiss, J.; Hauer, B. The Impact of Linker Length on P450 Fusion Constructs: Activity, Stability and Coupling. ChemCatChem 2016, 8, 1591–1597. [Google Scholar] [CrossRef]
  11. Hannemann, F.; Bichet, A.; Ewen, K.M.; Bernhardt, R. Cytochrome P450 systems—Biological variations of electron transport chains. Biochim. Biophys. Acta 2007, 1770, 330–344. [Google Scholar] [CrossRef] [PubMed]
  12. Kubota, M.; Nodate, M.; Yasumoto-Hirose, M.; Uchiyama, T.; Kagami, O.; Shizuri, Y.; Misawa, N. Isolation and functional analysis of cytochrome P450 CYP153A genes from various environments. Biosci. Biotechnol. Biochem. 2005, 69, 2421–2430. [Google Scholar] [CrossRef] [PubMed]
  13. Scheps, D.; Honda Malca, S.; Richter, S.M.; Marisch, K.; Nestl, B.M.; Hauer, B. Synthesis of ω-hydroxy dodecanoic acid based on an engineered CYP153A fusion construct. Microb. Biotechnol. 2013, 6, 694–707. [Google Scholar] [CrossRef] [PubMed]
  14. Gricman, Ł.; Weissenborn, M.J.; Hoffmann, S.M.; Borlinghaus, N.; Hauer, B.; Pleiss, J. Redox Partner Interaction Sites in Cytochrome P450 Monooxygenases: In Silico Analysis and Experimental Validation. ChemistrySelect 2016, 1, 1243–1251. [Google Scholar] [CrossRef]
  15. Jung, E.; Park, B.G.; Ahsan, M.M.; Kim, J.; Yun, H.; Choi, K.-Y.; Kim, B.-G. Production of ω-hydroxy palmitic acid using CYP153A35 and comparison of cytochrome P450 electron transfer system in vivo. Appl. Microbiol. Biotechnol. 2016, 100, 10375–10384. [Google Scholar] [CrossRef] [PubMed]
  16. Kohl, A.; Srinivasamurthy, V.; Böttcher, D.; Kabisch, J.; Bornscheuer, U.T. Co-expression of an alcohol dehydrogenase and a cyclohexanone monooxygenase for cascade reactions facilitates the regeneration of the NADPH cofactor. Enzyme Microb. Technol. 2018, 108, 53–58. [Google Scholar] [CrossRef] [PubMed]
  17. Lundemo, M.T.; Notonier, S.; Striedner, G.; Hauer, B.; Woodley, J.M. Process limitations of a whole-cell P450 catalyzed reaction using a CYP153A-CPR fusion construct expressed in Escherichia coli. Appl. Microbiol. Biotechnol. 2016, 100, 1197–1208. [Google Scholar] [CrossRef] [PubMed] [Green Version]
  18. White, B.E.; Fenner, C.J.; Smit, M.S.; Harrison, S.T.L. Effect of cell permeability and dehydrogenase expression on octane activation by CYP153A6-based whole cell Escherichia coli catalysts. Microb. Cell Fact. 2017, 16, 1–12. [Google Scholar] [CrossRef] [PubMed]
  19. Olaofe, O.A.; Fenner, C.J.; Gudiminchi, R.K.; Smit, M.S.; Harrison, S.T. The influence of microbial physiology on biocatalyst activity and efficiency in the terminal hydroxylation of n-octane using Escherichia coli expressing the alkane hydroxylase, CYP153A6. Microb. Cell Fact. 2013, 12, 8. [Google Scholar] [CrossRef] [PubMed] [Green Version]
  20. Van Beilen, J.B.; Holtackers, R.; Lüscher, D.; Bauer, U.; Witholt, B.; Duetz, W.A. Biocatalytic production of perillyl alcohol from limonene by using a novel Mycobacterium sp. cytochrome P450 alkane hydroxylase expressed in Pseudomonas putida. Appl. Environ. Microbiol. 2005, 71, 1737–1744. [Google Scholar] [CrossRef] [PubMed]
  21. Gudiminchi, R.K.; Randall, C.; Opperman, D.J.; Olaofe, O.A; Harrison, S.T.L.; Albertyn, J.; Smit, M.S. Whole-cell hydroxylation of n-octane by Escherichia coli strains expressing the CYP153A6 operon. Appl. Microbiol. Biotechnol. 2012, 96, 1507–1516. [Google Scholar] [CrossRef]
  22. Pennec, A.; Jacobs, C.L.; Opperman, D.J.; Smit, M.S. Revisiting Cytochrome P450-Mediated Oxyfunctionalization of Linear and Cyclic Alkanes. Adv. Synth. Catal. 2015, 357, 118–130. [Google Scholar] [CrossRef]
  23. Funhoff, E.G.; Bauer, U.; García-Rubio, I.; Witholt, B.; van Beilen, J.B. CYP153A6, a soluble P450 oxygenase catalyzing terminal-alkane hydroxylation. J. Bacteriol. 2006, 188, 5220–5227. [Google Scholar] [CrossRef] [PubMed]
  24. Van Beilen, J.B.; Funhoff, E.G.; van Loon, A.; Just, A.; Kaysser, L.; Bouza, M.; Holtackers, R.; Röthlisberger, M.; Li, Z.; Witholt, B. Cytochrome P450 alkane hydroxylases of the CYP153 family are common in alkane-degrading eubacteria lacking integral membrane alkane hydroxylases. Appl. Environ. Microbiol. 2006, 72, 59–65. [Google Scholar] [CrossRef] [PubMed]
  25. Bordeaux, M.; Girval, D.; Rullaud, R.; Subileau, M.; Dubreucq, E.; Drone, J. High-cell-density cultivation of recombinant Escherichia coli, purification and characterization of a self-sufficient biosynthetic octane ω-hydroxylase. Appl. Microbiol. Biotechnol. 2014, 98, 6275–6283. [Google Scholar] [CrossRef] [PubMed]
  26. Weckbecker, A.; Hummel, W. Glucose dehydrogenase for the regeneration of NADPH and NADH. In Microbial Enzymes and Biotransformations; Barredo, J.L., Ed.; Humana Press: New York, NY, USA, 2005; Volume 17, pp. 225–238. [Google Scholar]
  27. Yamamoto, K.; Nagao, T.; Makino, Y.; Urabe, I.; Okada, H. Characterization of mutant glucose dehydrogenases with increasing stability. Ann. N. Y. Acad. Sci. 1990, 613, 362–365. [Google Scholar] [CrossRef] [PubMed]
  28. Yang, Y.; Chi, Y.T.; Toh, H.H.; Li, Z. Evolving P450pyr monooxygenase for highly regioselective terminal hydroxylation of n-butanol to 1,4-butanediol. Chem. Commun. 2015, 51, 914–917. [Google Scholar] [CrossRef] [PubMed]
  29. Yang, Y.; Li, Z. Evolving P450pyr Monooxygenase for Regio- and Stereoselective Hydroxylations. Chim. Int. J. Chem. 2015, 69, 136–141. [Google Scholar] [CrossRef] [PubMed]
  30. Nebel, B.A.; Scheps, D.; Honda Malca, S.; Nestl, B.M.; Breuer, M.; Wagner, H.G.; Breitscheidel, B.; Kratz, D.; Hauer, B. Biooxidation of n-butane to 1-butanol by engineered P450 monooxygenase under increased pressure. J. Biotechnol. 2014, 191, 86–92. [Google Scholar] [CrossRef] [PubMed]
  31. Yang, Y.; Liu, J.; Li, Z. Engineering of p450pyr hydroxylase for the highly regio- and enantioselective subterminal hydroxylation of alkanes. Angew. Chem. Int. Ed. Engl. 2014, 53, 3120–3124. [Google Scholar] [CrossRef] [PubMed]
  32. Li, A.; Liu, J.; Pham, S.Q.; Li, Z. Engineered P450pyr monooxygenase for asymmetric epoxidation of alkenes with unique and high enantioselectivity. Chem. Commun. 2013, 49, 11572. [Google Scholar] [CrossRef] [PubMed]
  33. Pham, S.Q.; Pompidor, G.; Liu, J.; Li, X.-D.; Li, Z. Evolving P450pyr hydroxylase for highly enantioselective hydroxylation at non-activated carbon atom. Chem. Commun. 2012, 48, 4618–4620. [Google Scholar] [CrossRef] [PubMed]
  34. Mohammadzadeh-K, A.; Feeney, R.E.; Samuels, R.B.; Smith, L.M. Solubility of alkanes in protein solutions. Biochim. Biophys. Acta–Protein Struct. 1967, 147, 583–589. [Google Scholar] [CrossRef]
  35. Piattoni, C.V.; Figueroa, C.M.; Asención Diez, M.D.; Parcerisa, I.L.; Antuña, S.; Comelli, R.A.; Guerrero, S.A.; Beccaria, A.J.; Iglesias, A.Á. Production and characterization of Escherichia coli glycerol dehydrogenase as a tool for glycerol recycling. Process Biochem. 2013, 48, 406–412. [Google Scholar] [CrossRef]
  36. Guengerich, F.P.; Martin, M.V.; Sohl, C.D.; Cheng, Q. Measurement of cytochrome P450 and NADPH-cytochrome P450 reductase. Nat. Protoc. 2009, 4, 1245–1251. [Google Scholar] [CrossRef] [PubMed]
  37. Schrewe, M.; Julsing, M.K.; Bühler, B.; Schmid, A. Whole-cell biocatalysis for selective and productive C–O functional group introduction and modification. Chem. Soc. Rev. 2013, 42, 6346–6377. [Google Scholar] [CrossRef] [PubMed]
Scheme 1. Terminal hydroxylation of n-octane to 1-octanol by CYP153A6. Reducing equivalents (NADH) are recycled using a cofactor regeneration system (e.g., glucose dehydrogenase), and shuttled via two redox partner proteins, ferredoxin reductase (FdR) and ferredoxin (Fdx) in class I CYPs, to the heme-domain of CYP153A6.
Catalysts 08 00531 sch001
Figure 1. Effect of glucose dehydrogenase (GDH) on initial activity (TF after 1 h) and stability (TTN after 17.5 h) of 1-octanol production from n-octane by CYP153A6. Reaction conditions: 1 mL aqueous reaction mixtures containing 1 µM CYP153A6, 1 µM FdR, 6 µM Fdx, 10 mg mL−1 BSA, 0.5 U mL−1 catalase, 0.1 mM NADH, 0.18–17.5 U mL−1 GDH, 200 mM glucose, buffer: 200 mM Tris-HCl (pH 8) with 250 μL n-octane added, 20 °C, 200 rpm.
Catalysts 08 00531 g001
Figure 2. Effect of Bovine serum albumin (BSA), catalase and cell-free extract (CFE), or the combination thereof, on 1-octanol production from n-octane by CYP153A6 (a) Blue bars represent the effect of additives. Green bars represent all additives without (w/o) one component. Reaction conditions: 1 mL aqueous reaction mixture containing 1 µM CYP153A6, 1 µM FdR, 6 µM Fdx, 0/10 mg mL−1 BSA, 0/0.5 U mL−1 catalase, 0.1 mM NADH, 0/0.2 U mL−1 GDH, 200 mM glucose, 0/30% (v/v) CFE from 200 g (wet weight) L−1 cell suspension, buffer: 200 mM Tris-HCl (pH 8) with 250 µL n-octane added, 20 °C, 200 rpm, t = 7 h. Time course reactions (b) of 1-octanol production by purified CYP153A6 (2 µM) stabilized by BSA or CFE Fdx (6 µM) added either as purified protein or contained within CFE, FdR (1 µM) added as purified protein.
Catalysts 08 00531 g002
Figure 3. Effect of ferredoxin (Fdx) and ferredoxin reductase (FdR) concentration on initial reaction rates (TF) and stability (TTN). Reaction conditions: 1 mL aqueous reaction mixture containing 1 µM CYP153A6, 1 (a) or 1–20 µM FdR (b), 6–300 (a) or 30 (b) µM Fdx, 10 mg mL−1 BSA, 0.5 U mL−1 catalase, 0.1 mM NADH, 0.1 U mL−1 GDH, 200 mM glucose, 50% (v/v) CFE from 200 g (wet weight) L−1 cell suspension, buffer: 200 mM Tris-HCl (pH 8) with 250 µL n-octane added, 20 °C, 200 rpm, t = 3 h for TF, t = 28 h for TTNs.
Catalysts 08 00531 g003
Figure 4. Effect of CYP153A6 and ferredoxin (Fdx) concentration on 1-octanol yields. Reaction conditions: 1 mL aqueous reaction mixture containing 1–3 µM CYP153A6, 1 µM FdR, 0–30 µM Fdx, 10 mg mL−1 BSA, 0.5 U mL−1 catalase, 0.1 mM NADH, 0.1 U mL−1 GDH, 200 mM glucose, 50% (v/v) CFE from 200 g (wet weight) L−1 cell suspension, buffer: 200 mM Tris-HCl (pH 8) with 250 µL n-octane added, 20 °C, 200 rpm, t = 17.5 h.
Catalysts 08 00531 g004
Figure 5. The effect of replacing GDH with GlyDH for cofactor regeneration in reactions performed in vials (40 mL). Reaction conditions: 1 mL (vials) aqueous reaction mixtures containing 2 µM CYP153A6, 1 µM FdR, 60 µM Fdx, 0.1 mM NADH, 0–10 U mL−1 GlyDH (a) or 0/1 U mL−1 GDH or GlyDH (b), 200 mM glycerol (a) or 0/200 mM glucose and/or 0/200 mM glycerol (b), 50% (v/v) CFE from 200 g (wet weight) L−1 cell suspension, buffer 200 mM Tris-HCl (pH 8) with 250 µL n-octane added. Temperature was maintained at 20 °C and vials were shaken at 200 rpm.
Catalysts 08 00531 g005
Figure 6. Effect of cofactor regenerating systems based on GDH (a) and GlyDH (b) on reactions performed in shake flasks and vials. Reaction conditions: 60 mL (in 250 mL shake flasks) or 1 mL (in 40 mL vials) aqueous reaction mixtures containing 2 µM CYP153A6, 1 µM FdR, 30 µM Fdx, 0.1 mM NADH, 0.2 U mL−1 GDH (a) or 1 U mL−1 GlyDH (b), 200 mM glucose (a) or 200 mM glycerol (b), 50% (v/v) CFE from 200 g (wet weight) L−1 cell suspension, buffer 200 mM Tris-HCl (pH 8) with 15 (shake flasks) or 0.25 (vials) mL n-octane added. Temperature was maintained at 20 °C and shake flasks and vials were shaken at 200 rpm. The appearance of the reaction mixtures (c) and SDS-PAGE analysis (d) of soluble proteins in the reaction mixtures after 48 h were also recorded; CYP153A6 (49.9 kDa), FdR (47.6 kDa), Fdx (13.5 kDa).
Catalysts 08 00531 g006
Table 1. Optimization of CYP153A6 biotransformations as evaluated through initial reaction rates (TF) and stability (TTN).
Optimization StepTF (h−1)TTN1-Octanol (mM)
GDH Concentration21226078 16.1
Addition of CFE193223,800 123.8
Biocatalysts Ratios
CYP153A6:FdR:Fdx (2:1:30)n.d.19,561 139.1
(1:1:60)387245,828 245.8
1 Measured after 17.5 h, 2 Measured after 28 h.
Table 2. Results from scale-up experiments performed using a Sixfors bioreactor system using 300 mL vessels.
ReactorStirring (rpm)pH ControlTF 1 (h−1)TTN 21-Octanol (mM) 2CYP153A6 (µM) 3pH 3
1600-69043558.71n.d.6.4
2200-18136907.381.16.0
3200+23035057.010.47.7
Reaction conditions: 120 mL aqueous reaction mixtures containing 2 µM CYP153A6, 1 µM FdR, 30 µM Fdx, 0.1 mM NADH, 0.1 U mL−1 GDH, 200 mM glucose, 50% (v/v) CFE from 200 g (wet weight) L−1 cell suspension, buffer 200 mM Tris-HCl (pH 8) with 30 mL n-octane. Temperature was maintained at 20 °C and reactors were stirred at either 600 or 200 rpm, and in one case controlled at pH 8 by the addition of 1 M Tris-base. 1 TF measured after 3 h. 2 TTN measured as maximum 1-octanol formed over 48 h biotransformation. 3 Measured after 48–49 h. n.d.—not determined.