1. Introduction
Iron catalyst is used in industrial processes of ammonia synthesis. The discovery of the iron-fused catalyst for the synthesis of ammonia has created the foundations for our current understanding of heterogeneous catalysis [
1,
2,
3,
4,
5]. Today, iron-based catalysts are tested in hydrogen gas processes e.g., water gas shift reaction and ammonia decomposition [
6,
7,
8,
9,
10]. Due to huge energy consumption in the process of ammonia synthesis, research into the creation of a new catalyst that enables running the synthesis at lower temperatures and pressures is still required.
On the basis of previous results it can be concluded that iron is the most effective catalyst in the ammonia synthesis among elements.
An iron catalyst precursor is obtained by melting magnetite and promoters. An oxidized form of the magnetite-based catalyst is composed mainly of iron oxide Fe
3O
4; other metal oxides play the role of promoters. Oxides of aluminum, calcium, and potassium (Al
2O
3, CaO, and K
2O) are most frequently used. Oxides of aluminum and calcium are structure-building promoters, and they influence the catalyst structure, its specific surface area, and thermal resistance under reaction conditions [
11,
12,
13,
14]. Potassium oxide is an activating promoter that changes iron sorption properties by the modification of iron surface. The nature of the potassium-activating role is not unambiguously clarified. According to Ertl [
15,
16], lattice planes, differing in Miller indices, showed differences in dissociative nitrogen chemisorption. The addition of potassium on the iron surface caused an equalization of activities of various lattice planes and, at the same time, made the activities much higher. Another mechanism has been proposed by Samorjai [
17,
18]. According to Samorjai, the presence of potassium eased desorption of the ammonia adsorbed on the catalyst surface and, as a result, more active sites were available. Moreover, the presence of potassium had a positive impact on the catalyst resistance to sulphur poisoning. On the other hand, the presence of potassium made the catalyst more sensitive to poisoning by oxygen compounds [
19]. Potassium influence on catalyst structure and activity was similar when potassium was added into magnetite during a fusion process, as well as by an impregnation of a pre-reduced catalyst [
20,
21].
Other alkali metals may have also had a positive impact on iron catalyst properties. It was found that cesium and rubidium activated a catalyst surface to a similar degree as potassium and, additionally, increased the thermal strength of the catalyst [
22,
23]. Lithium oxide, when added by impregnation, may be an effective promoter of an iron catalyst [
24]. However, different results were obtained by Aleksicz [
25]. Studying co-precipitated iron catalysts at atmospheric, as well as elevated, pressure (10 MPa) Aleksicz found that their activities decreased while the atomic number of alkali metals, used as a promoter, diminished. He proved that lithium was the worst promoter of iron catalysts. Bosch [
26] examined the impact of alkali metals on the activity of co-precipitated iron catalysts promoted with Al
2O
3 and prepared by impregnating the solutions of carbonates and hydroxides. Aleksicz highlighted that the activity of the catalysts diminished while a ratio charge/alkali metal atom radius increased. If Aleksicz’s results are to be taken as a rule, lithium should be a better activator than potassium. Interesting results were presented by the authors of another study [
27], who found that the presence of LiH on the surface of the catalyst beside a transition metal, iron, made the second active site for nitrogen hydrogenation. Their results showed that the presence of LiH enabled the ammonium synthesis under milder conditions.
Differences in an appraisal of the lithium oxide activity probably arise due to the way in which it is added into catalysts, and as a consequence its location in an oxidized form of the catalyst.
An active form of the iron catalyst is obtained by an iron catalyst precursor reduction in a hydrogen or hydrogen-nitrogen atmosphere. The reduction and its parameters are crucially important when considering catalyst physicochemical properties [
28]: namely, specific area and active surface area that have an influence on a total catalyst activity. The reduction of pure magnetite runs according to the shrinking core mechanism [
29,
30,
31,
32]. Hydrogen molecules diffuse through macropores in a grain of a precursor, and therefore, the reduction can also run inside the grain, after which a microcrystalline layer of iron is formed. The difference in lattice constants between iron and iron oxide causes micro stresses of crystals. The crystals reduce their size during the following reduction. Structure-building promoters are released from the precursor grain and they migrate to boundaries of the iron microcrystals preventing the crystals from sintering.
The aim of the current work was to examine the reduction process of fused iron catalyst precursors promoted with lithium oxide, in an attempt to provide clarification regarding the role of lithium oxide when introduced into catalyst precursors during a fusing process, and the lithium oxide location impact on the reduction process, and the activity in ammonia synthesis.
2. Results and Discussion
Two catalyst precursors promoted with oxides of calcium, aluminum, and lithium were prepared by a fusion method. Chemical composition and molar ratio Fe
2+/Fe
3+ of the prepared precursors are given in (
Table 1). A characteristic of the industrial iron catalyst (PS-3-INS Grupa Azoty) for the ammonia synthesis promoted with potassium oxide, marked as KAT-K
2O, was also given in
Table 1. That catalyst was used as a reference point.
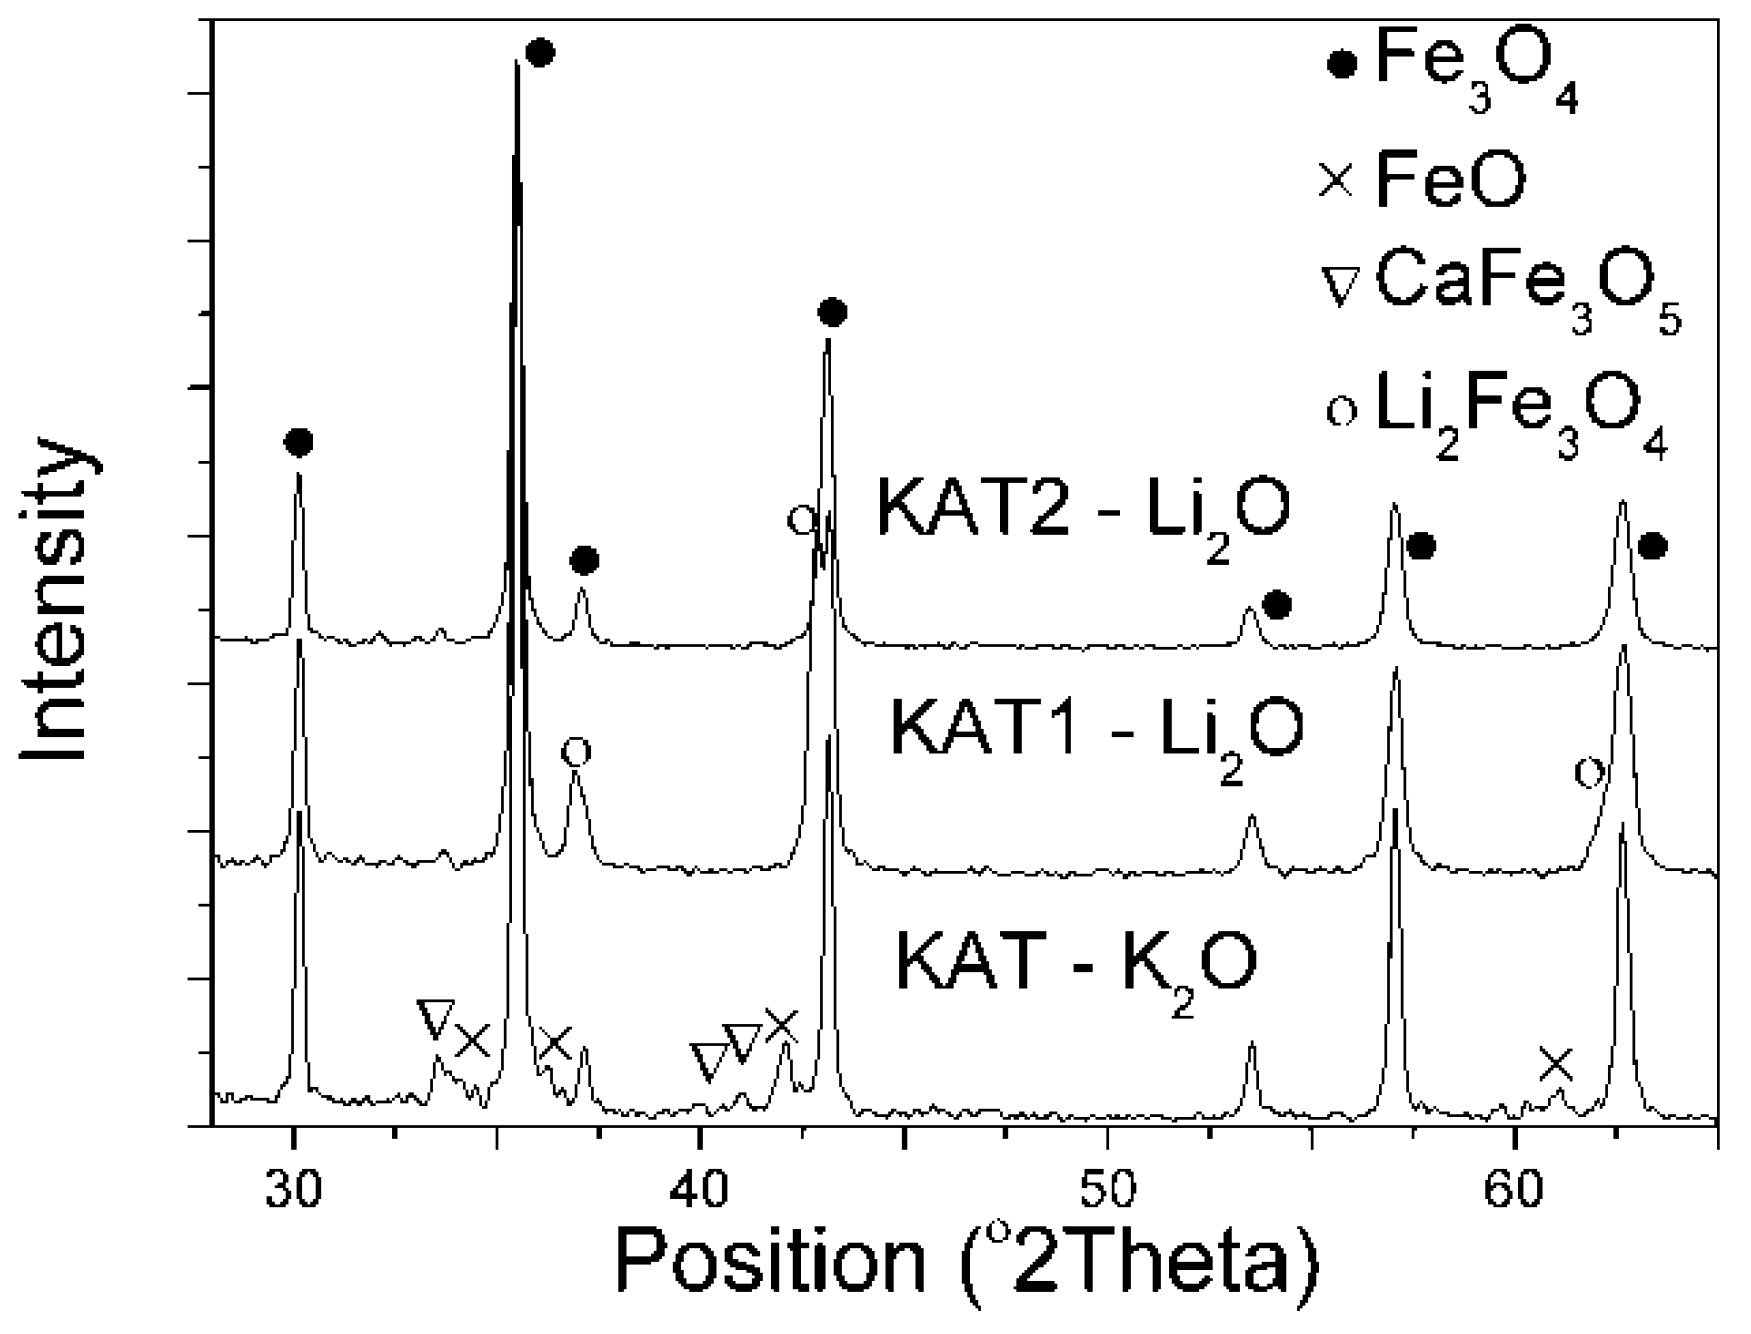
Contents of calcium, aluminum, and lithium oxides were similar in the prepared lithium catalysts. However, these catalysts differed in molar ratio R. X-ray patterns of the obtained precursors are presented in (
Figure 1).
Fe3O4, FeO, and CaFe3O5 phases were identified in the catalyst precursor KAT–K2O promoted with potassium oxide. In the catalyst precursor KAT1–Li2O, in that Li2O was an activating promoter and R = 0.68, the FeO phase did not occur in spite of an excess of Fe2+ ions in comparison to magnetite. The CaFe3O5 phase was not visible either. Peaks of magnetite and Li2Fe3O4 phases (according to ICDD: 37-1432 card) were identified. Both Li2Fe3O4 and Fe3O4 crystallized similarly in a cubic crystal system with the same space group, Fd-3 m, and space group number 227. In the X-ray pattern of KAT2-Li2O catalyst, there were peaks belonging tomagnetite. No other peaks were observed in that precursor.
Authors of the previous work [
33] found that potassium oxide in the iron magnetite-structure catalyst precursor was completely located within grain boundaries and not bound with iron oxides. The distribution of structural promoters (CaO, Al
2O
3) in an iron catalyst precursor depended on the molar ratio of iron ions R [
34]. The distribution of promoters in the structure of an iron catalyst promoted with Li
2O was presented in the paper [
35]. The authors concluded that lithium oxide was bound with iron oxides and formed a separate Li
2Fe
3O
4 phase.
On the basis of the X-ray diffraction, it was stated that lithium oxide in the iron catalyst precursor may have occurred as the separate phase Li
2Fe
3O
4 (KAT1-Li
2O) or formed the solid solution in magnetite (KAT2-Li
2O). Using the selective etching [
35] it was found thatlithium oxide in the catalyst KAT1-Li
2O in the amount of 14% formed the solid solution with magnetite while the rest formed the Li
2Fe
3O
4 phase.
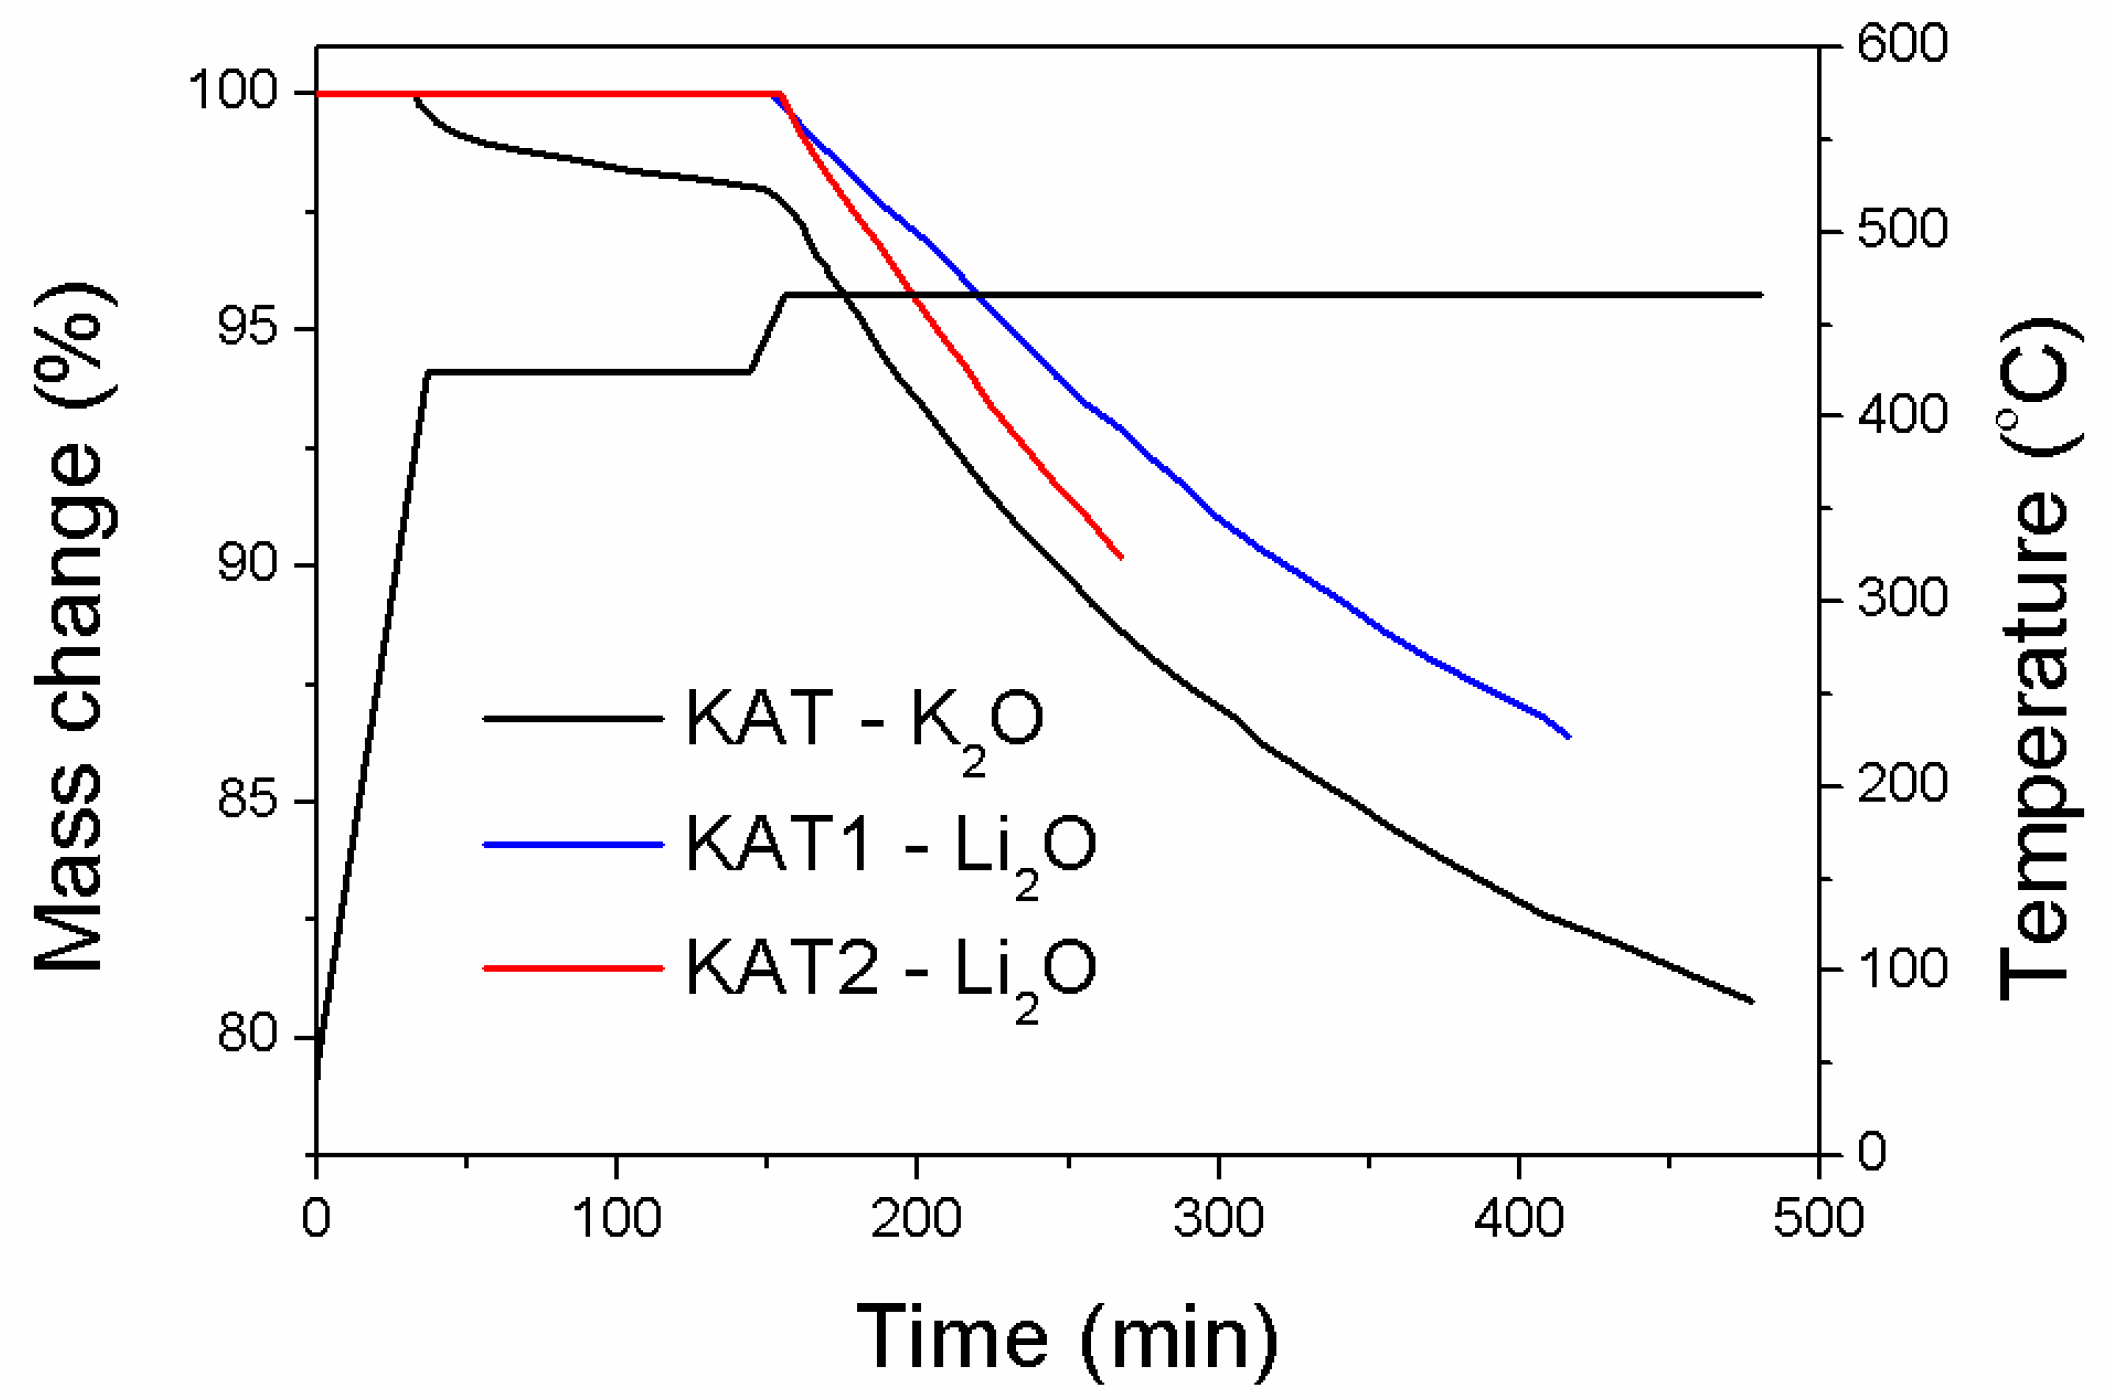
The reduction process of catalyst precursors in a hydrogen atmosphere was examined in a differential reactor with a thermogravimetric measurement device. The dependence of mass change on the precursor reduction time is shown in (
Figure 2).
The reduction was carried out according to the procedure: polythermal heating from 25 °C to 420 °C at a heating rate of 10 °C/min, next the isothermal reduction at a temperature of 420 °C until a sample mass was constant, polythermal heating from 420 °C to 470 °C at a heating rate of 3.5 °C/min, and the isothermal reduction at 470 °C. The reduction was not completed at any case. The aim of the procedure was to determine the reduction run at the initial stage for catalysts of different phase contents.
Only the precursor of the catalyst promoted with potassium oxide (KAT-K
2O), in which the wustite phase was present, started being reduced at a temperature of 420 °C. On the basis of literature [
1], it was known that the FeO phase started being reduced at a temperature of 380 °C. The catalyst precursor promoted with lithium oxide characterized with R = 0.68 (KAT1-Li
2O) had a similar molar ratio Fe
2+/Fe
3+ as the precursor promoted with potassium oxide. However, the reduction process of that precursor as well as the catalyst promoted with lithium oxide started at a higher temperature.
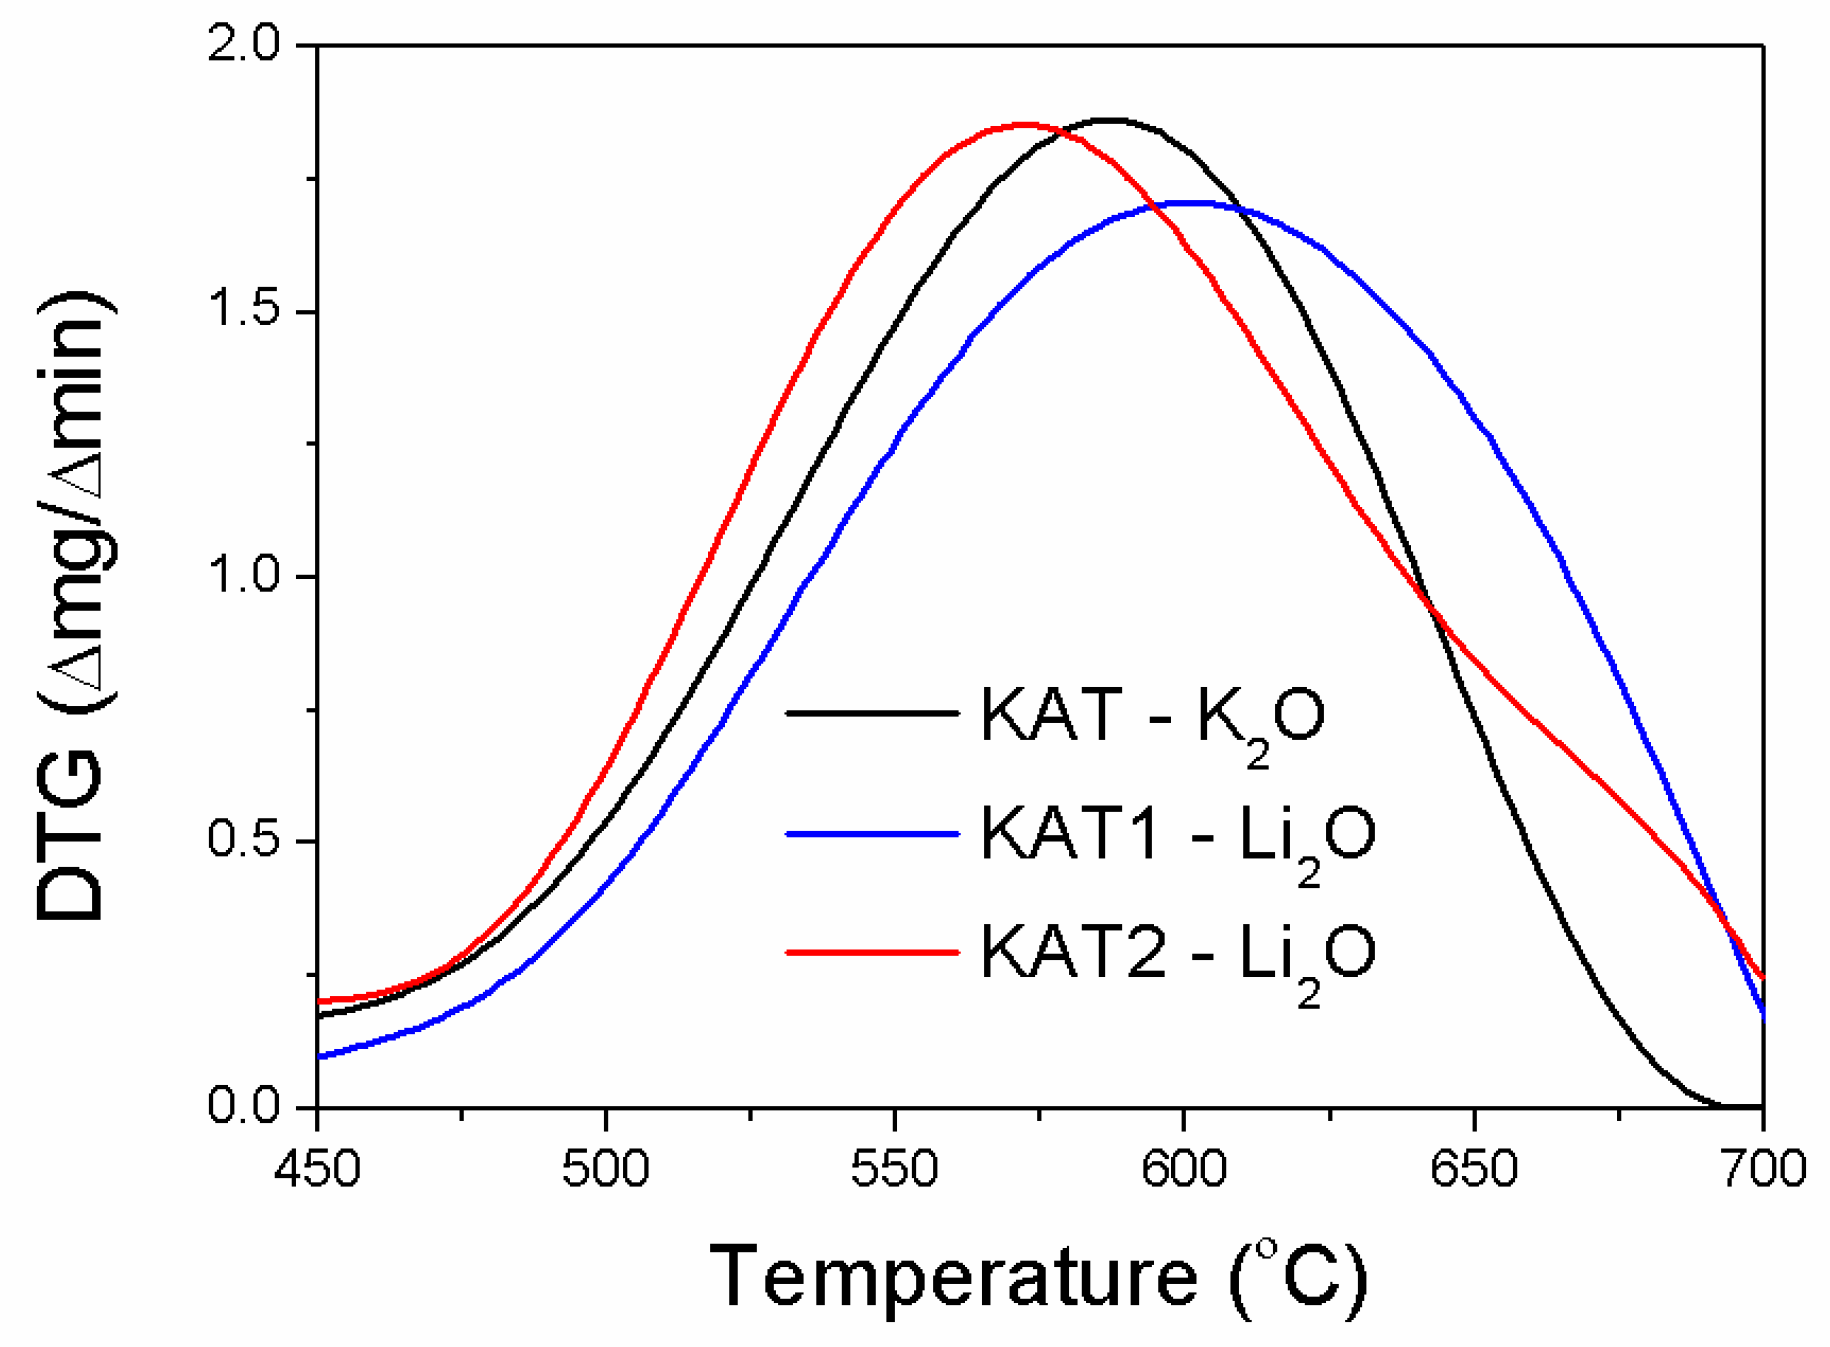
In the initial stage, the reductions of KAT-K
2O and KAT2-Li
2O precursors were similar. The reduction of KAT1-Li
2O ran slower (
Figure 3).
In the case of KAT2-Li2O, for which only the magnetite phase was identified in the X-ray pattern, the highest reduction rate was observed at 571 °C. For KAT-K2O and KAT1-Li2O catalyst precursors the highest reduction rate was observed at 587 °C and 600 °C respectively. The inflection at a temperature of about 680 °C was visible on the DTA curve made for KAT2-Li2O. It may have pointed out the reduction of the harder reducible phase required higher temperature. It was confirmed by further results.
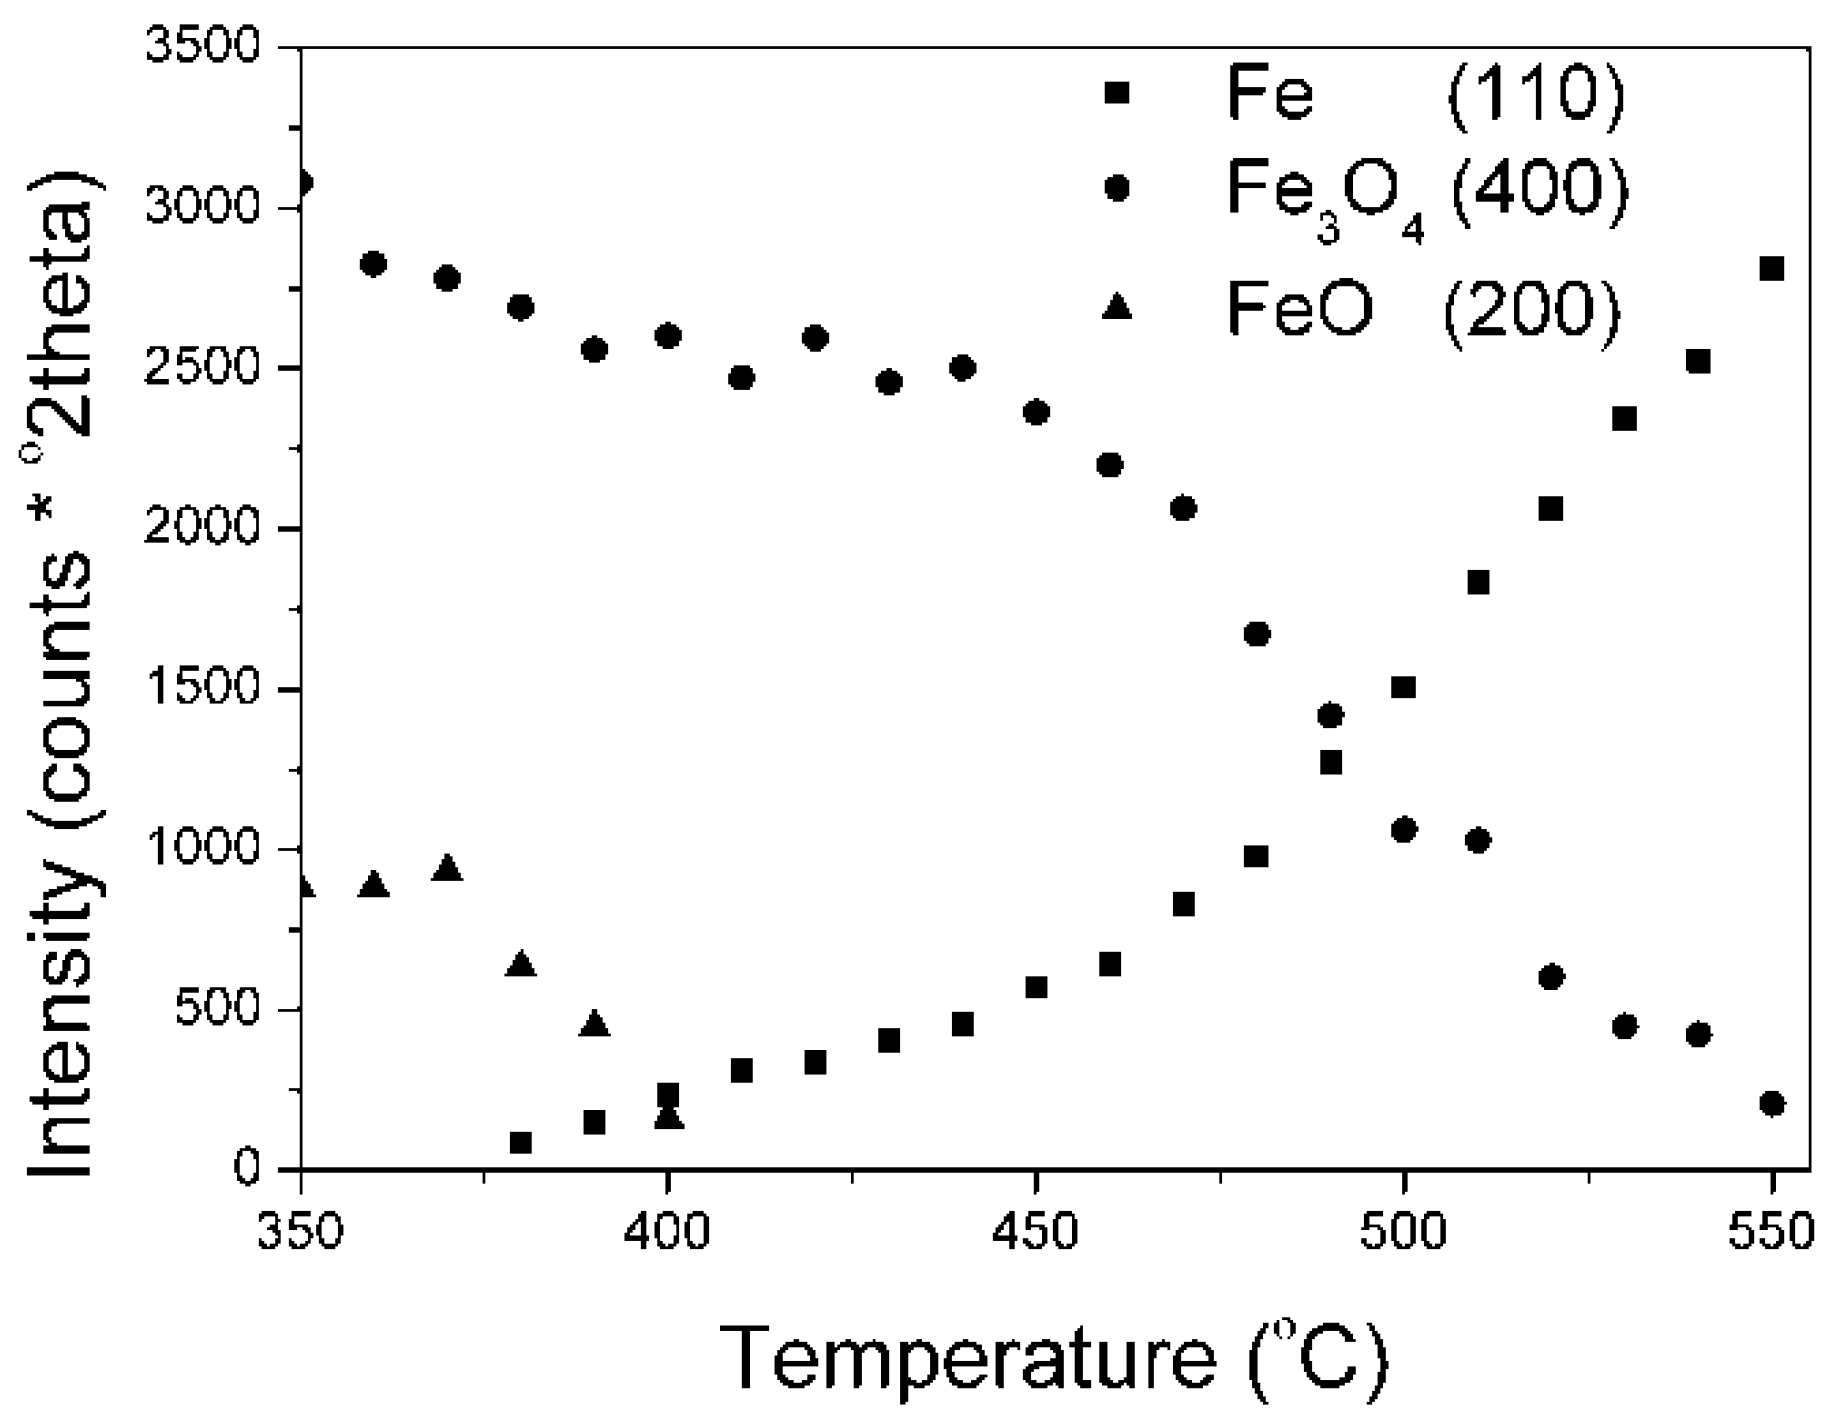
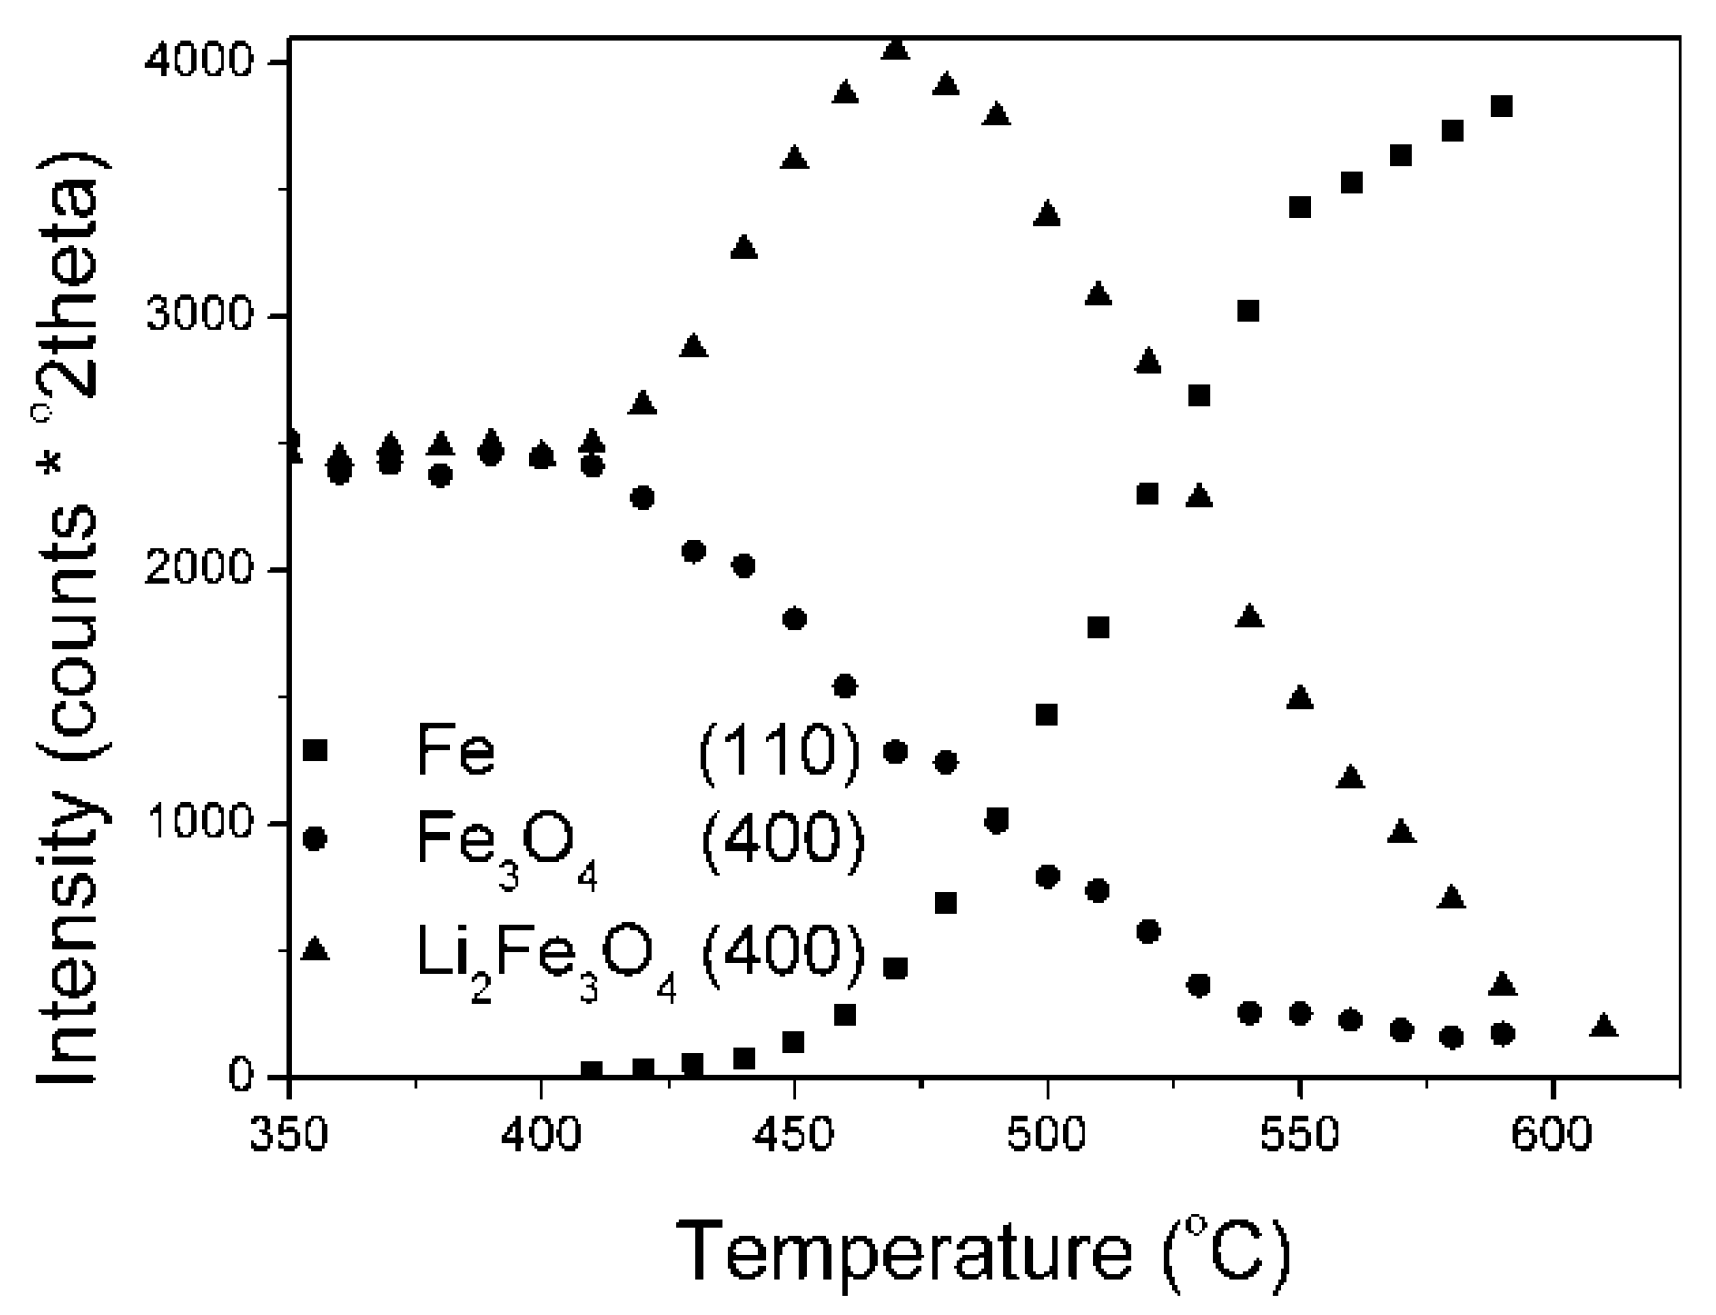
Results on the polythermal reduction of the industrial catalyst KAT-K
2O precursor in an XRK 900 reaction chamber are presented in (
Figure 4). Changes of peak intensities, given as peak areas (they are depicted by the Is symbols), of individual phases in dependence on temperature are presented.
Results on the polythermal reduction of the catalyst precursor promoted with potassium oxide were in a good accordance with literature data [
1]. At first, the wustite phase reduction took place (380–410 °C), then the magnetite phase (440–550 °C) was reduced.
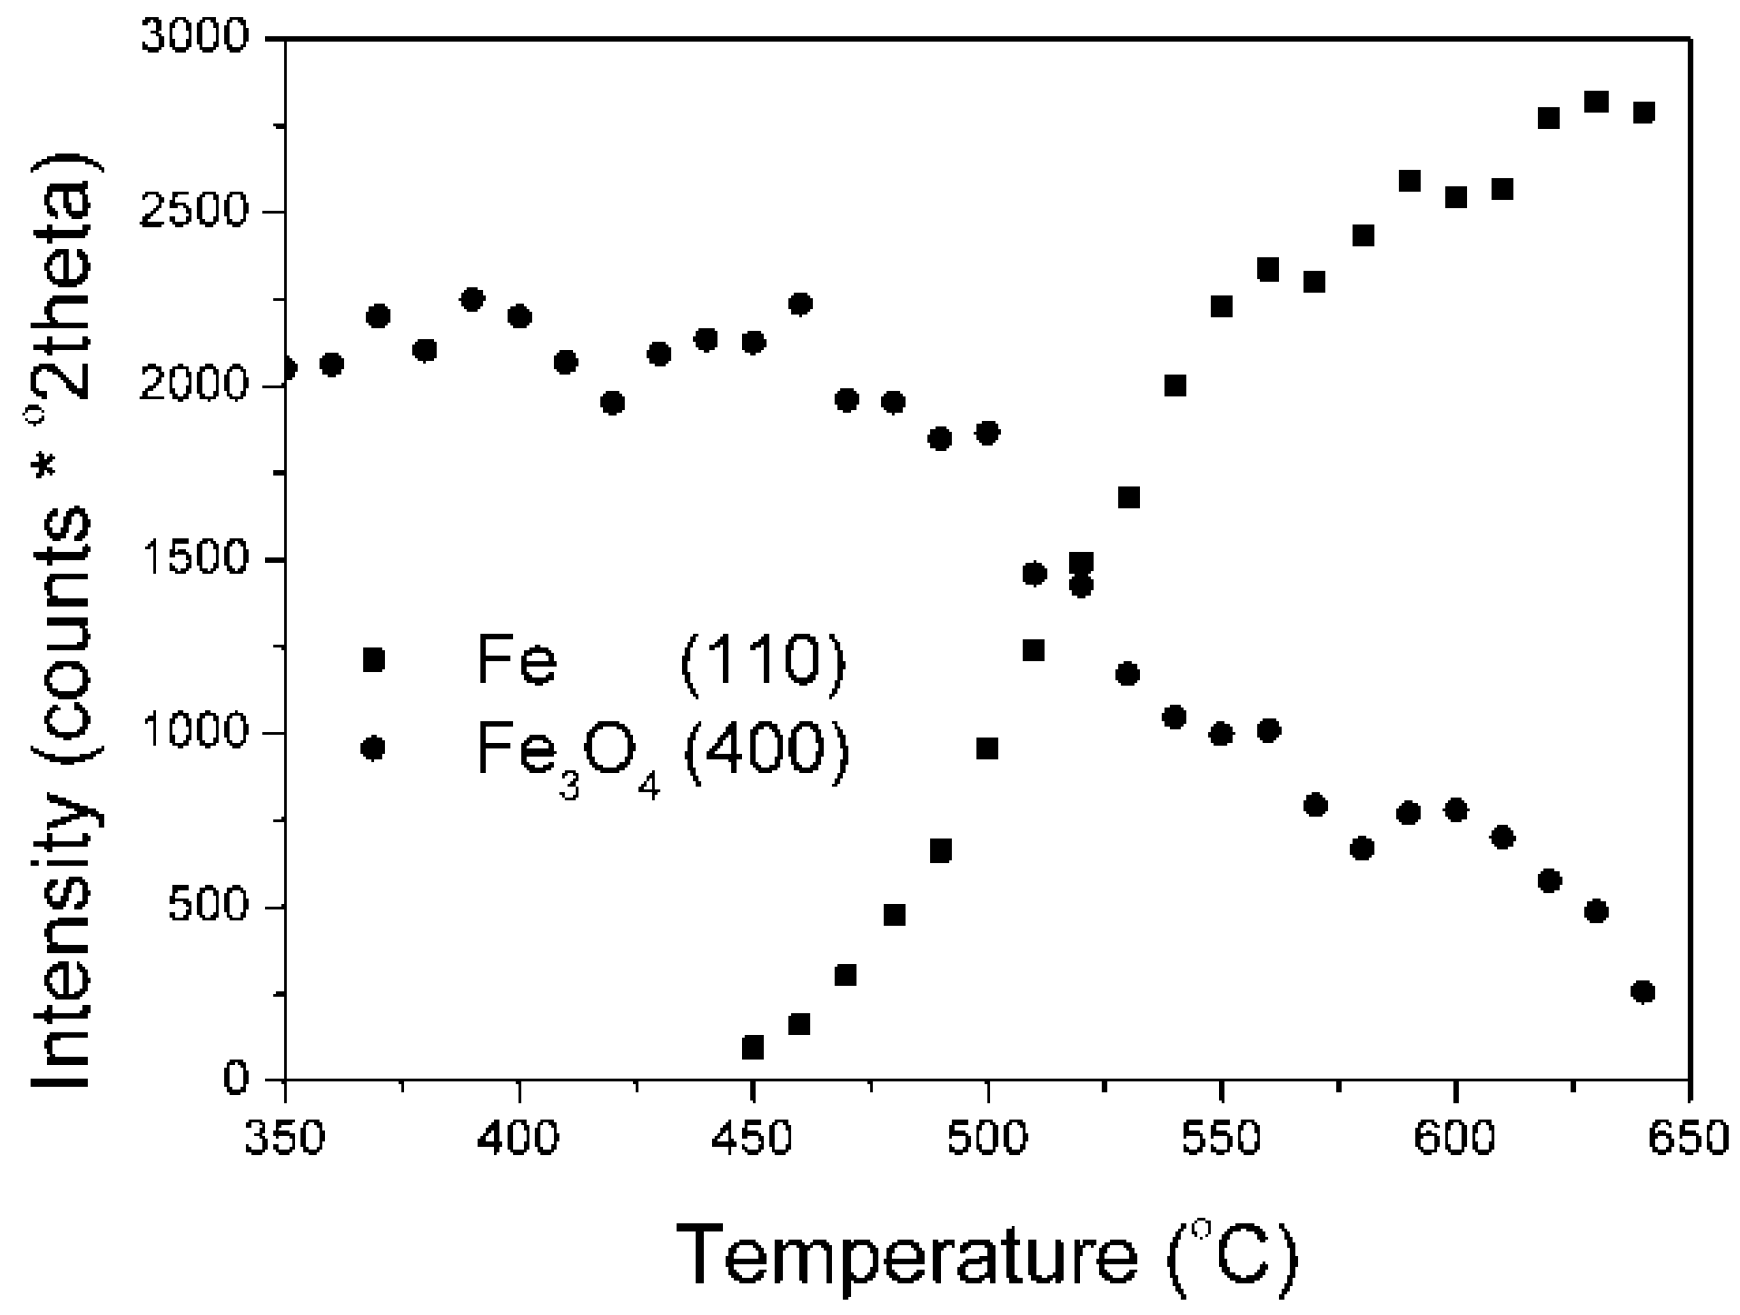
The dependence of peak intensity changes on reduction temperature of the catalyst precursors KAT1-Li
2O and KAT2-Li
2O are shown in (
Figure 5 and
Figure 6).
In the initial stage (from a temperature of 410 °C) the magnetite phase of the KAT1-Li
2O was reduced (
Figure 5). An increase in the area of Li
2Fe
3O
4 phase peak was visible at the same time. In the KAT2-Li
2O, of R = 0.54, lithium was only in the form of a solid solution in magnetite. The reduction process was noticeable at temperatures close to 450 °C (
Figure 6).
The reduction process of Li
2Fe
3O
4 in the KAT1-Li
2O catalyst did not run directly to iron in. On X-ray patterns in (
Supplementary Materials, Figure S3), it may have been observed that the peak of the Li
2Fe
3O
4 phase was asymmetric (it was broadened at lower scattering angles), what showed that a new phase was formed. It may have been supposed that the new phase was Li
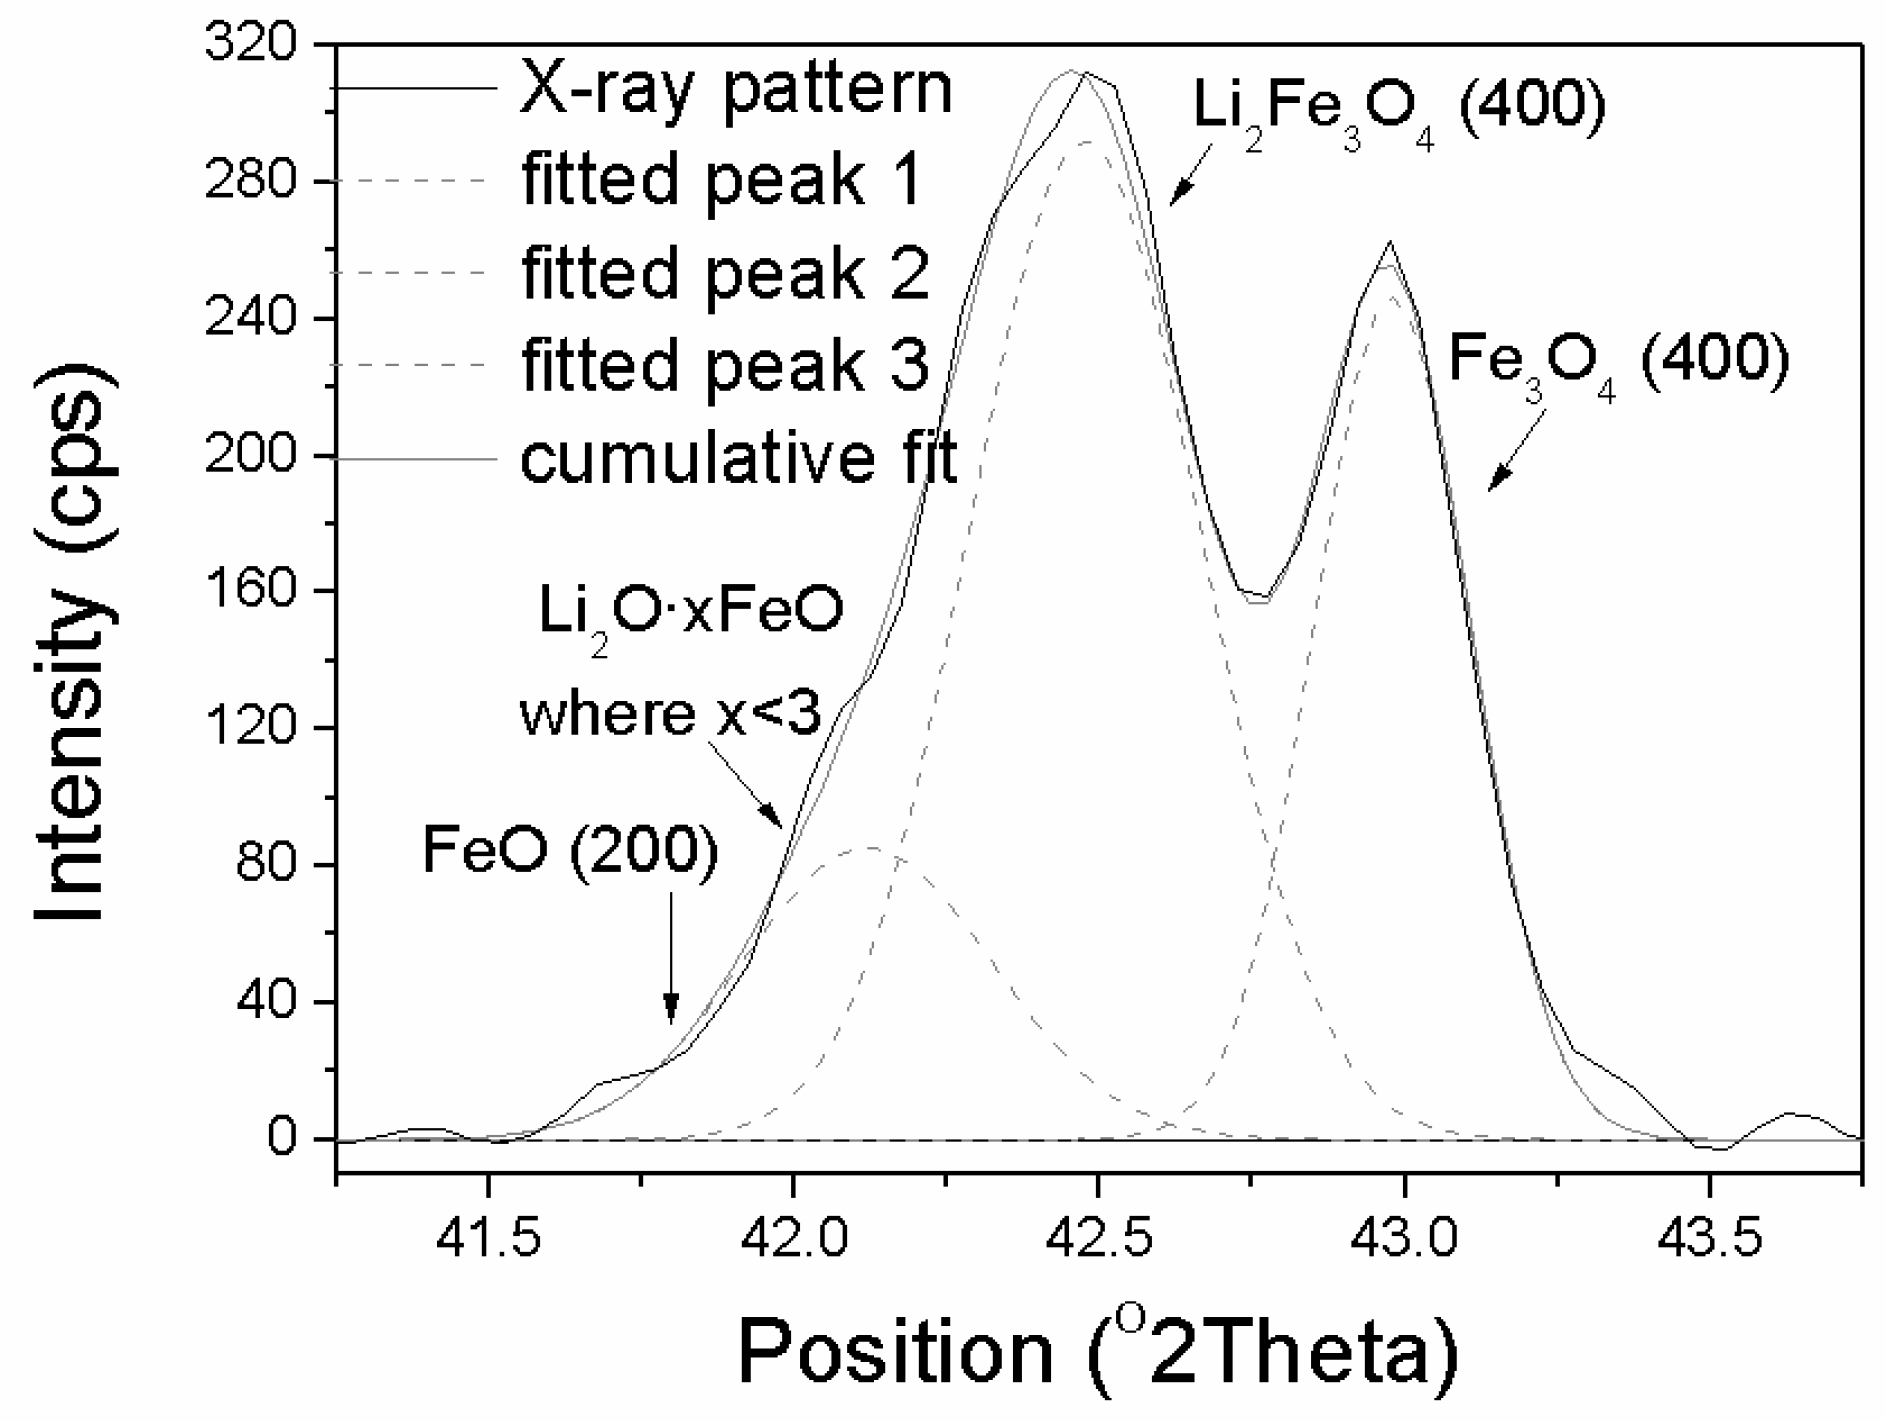
2O·xFeO, where x > 3. During the reduction process, a precise analysis of intensities and shapes of peaks belonging to Fe
3O
4 and Li
2Fe
3O
4 phases was carried out. The X-ray pattern, in the scattering angle range 2Θ from 41° to 44°, taken in the reduction stage when the intensity of the Li
2Fe
3O
4 peak was maximal, and the intensity of Fe
3O
4 peak decreased of 50%, are presented in (
Figure 7).
Deconvolution of that peak confirmed that during the reduction of the Li
2Fe
3O
4 phase a new transient phase occurred. Much better fitting was found when an additional peak at the angle 2θ of 42.1° was inserted (left of the phase Li
2Fe
3O
4 phase, 2θ = 42.45°). The peak could not be ascribed to the FeO phase because it would occur at the lower angle 2θ = 41.80° and at a temperature of 460 °C it would be reduced rapidly (
Supplementary Materials Figure S1).
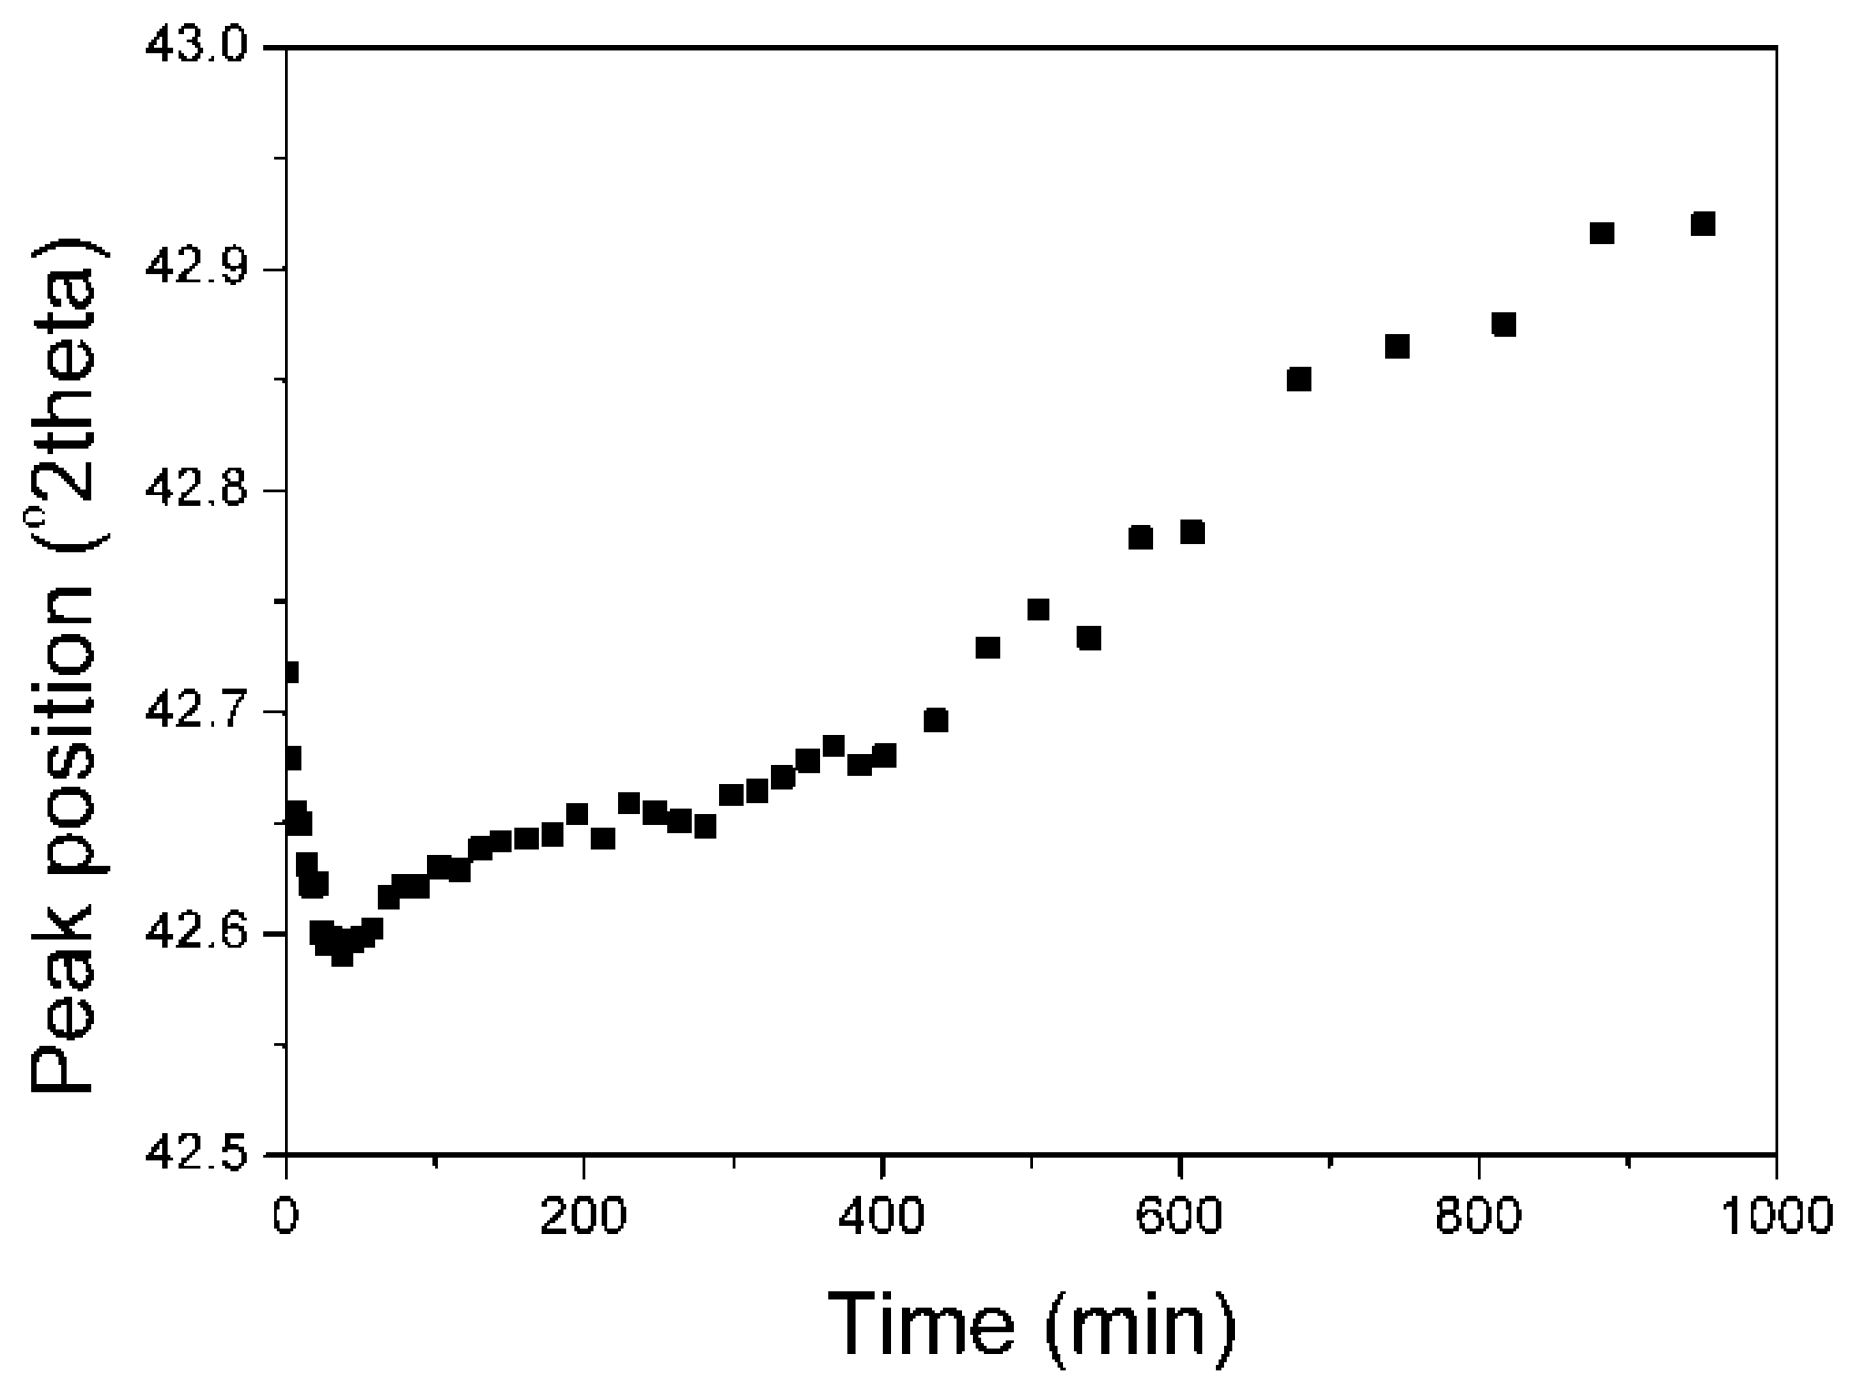
The analysis of the maximum position of the Li
2Fe
3O
4 peak during the reduction process is shown in (
Figure 8).
In the initial stage of the magnetite phase reduction, a new additional compound Li
2O·xFeO was formed. It shifted the peak maximum of Li
2Fe
3O
4 towards lower angles (the increase in lattice constant). After the reduction of the new phase Li
2O·xFeO, the maximum shifted towards higher angles (the decrease in lattice constant). Shifts towards higher angles were connected with non-stoichiometry of Li
2O·xFeO, where x < 3. During the reduction, FeO was reduced to Fe. The presence of lithium caused that magnetite was not reduced directly to Fe, but to FeO at a temperature of 460 °C. That oxide combined with Li
2O forming the additional phase Li
2O·xFeO. It is known from literature [
36] that magnetite was reduced only at temperatures over 570 °C through wustite to iron. The authors’ views on the direct reduction of magnetite to metallic iron are divided. Authors of the work [
1], on the basis of “in situ” examinations carried out in a reaction chamber, made with the aid of XRD method, confirmed the presence of wustite after the reduction at a temperature of 413 °C. Other authors on the ground of chemical analysis and Mössbauer investigations [
37,
38] made the wustite formation impossible during the reduction of the magnetite precursor. Results of our research confirmed that magnetite was reduced to iron through the wustite phases. The same phenomenon was observed for KAT-Li
2O in which lithium formed a solid solution in magnetite. Regarding temperature shifts connected with a lattice constant extend, isothermal examinations gave more information (
Supplementary Materials Figure S4).
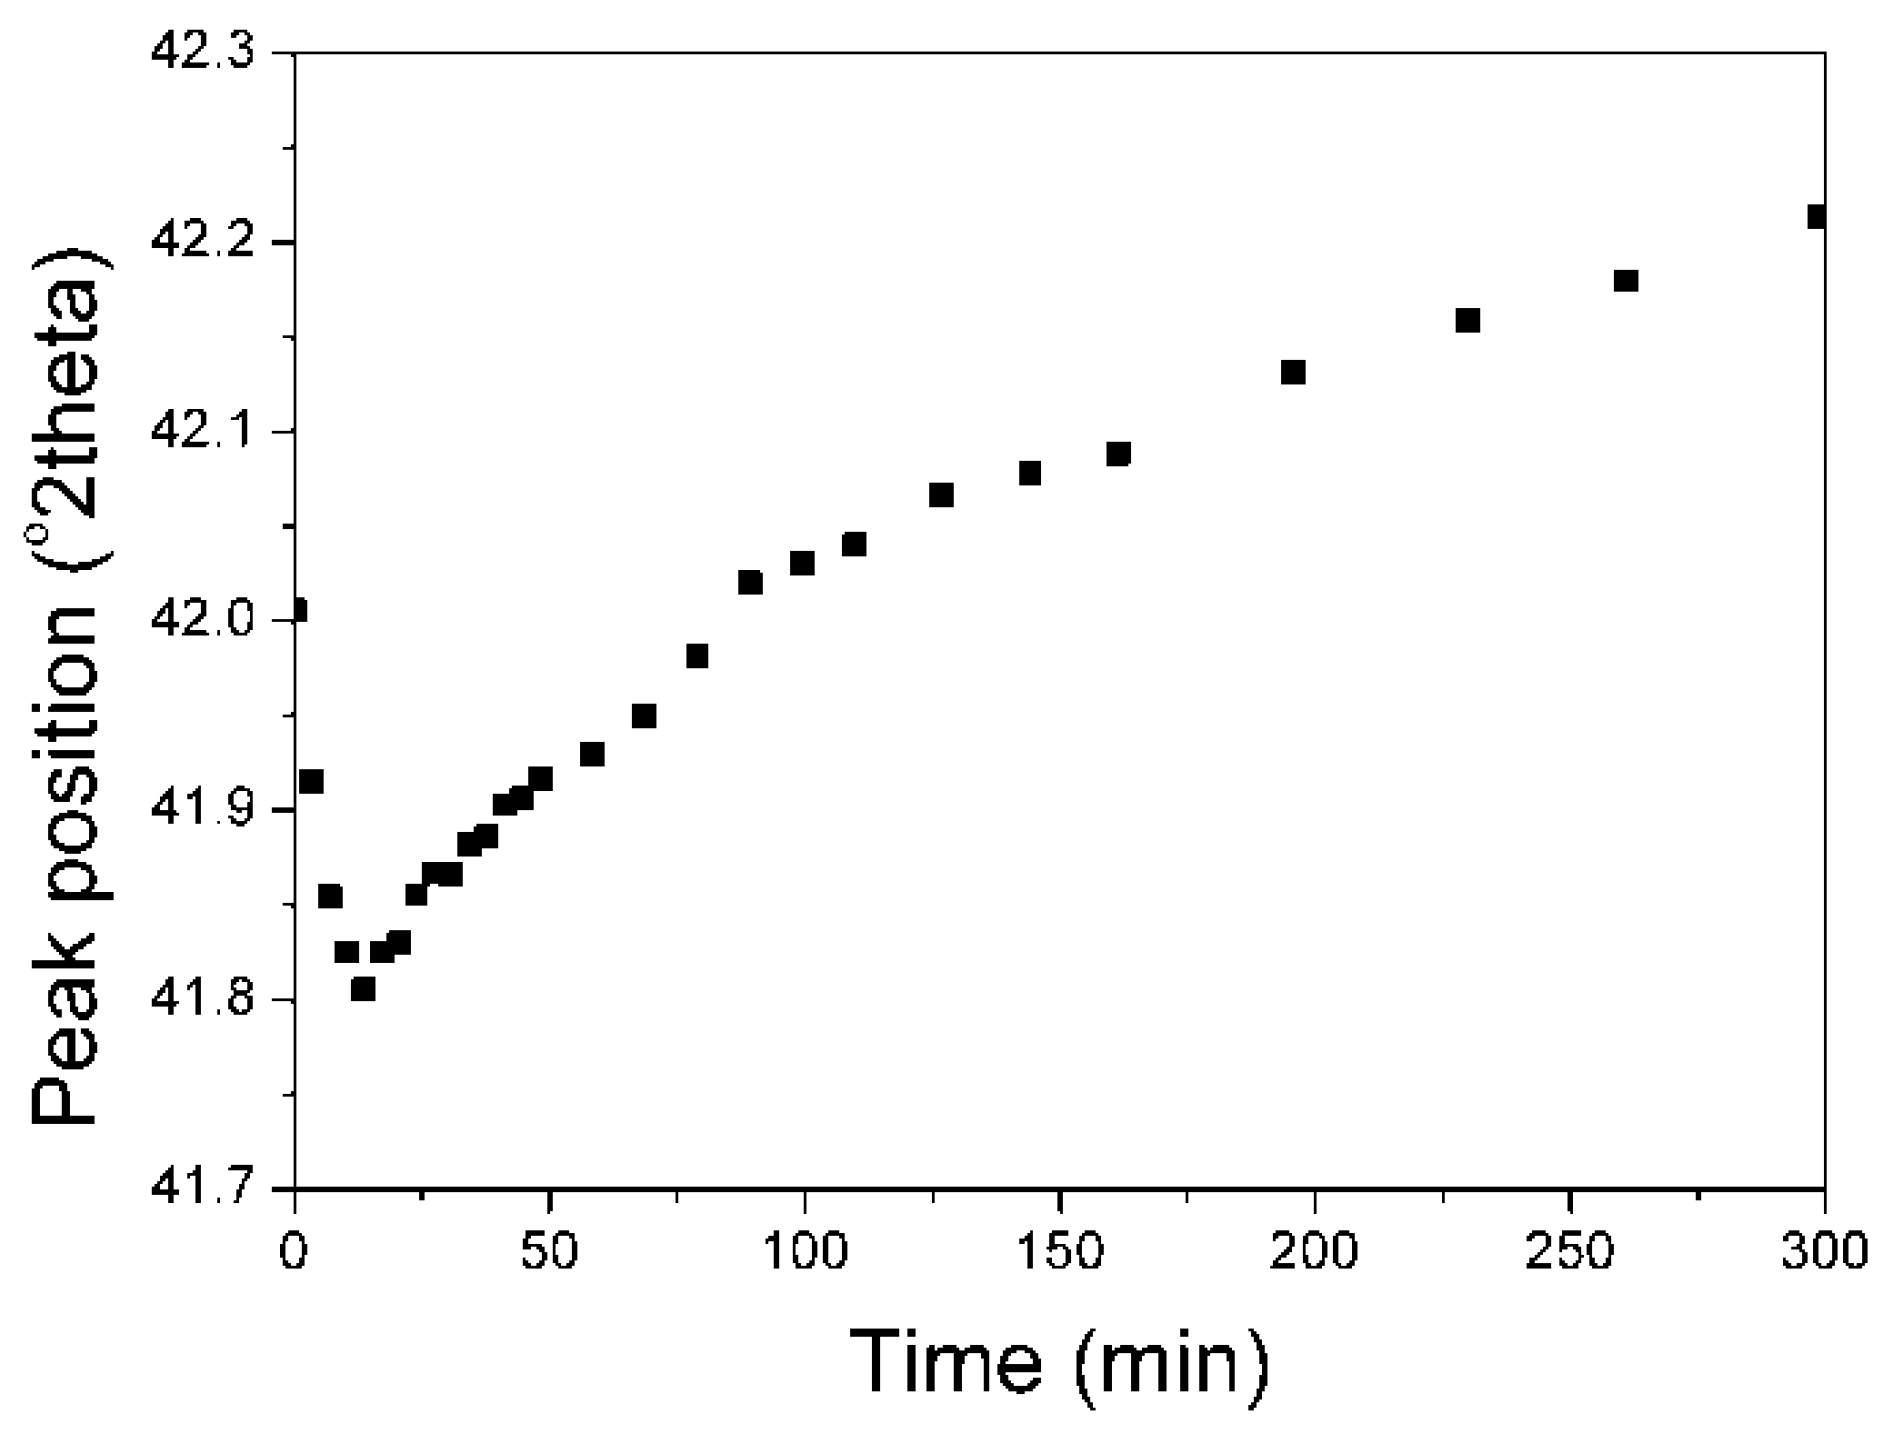
The change of Fe
3O
4 peak position, during the isothermal reduction, in the dependence on time was presented in (
Figure 9).
Similarly to the KAT1-Li2O catalyst, the shift of the peak maximum towards lower angles was observed what may have been attributed to a new phase Li2O·xFeO (where x < 3) formation. After the maximum of asymmetry had been attained it started getting smaller causing the shift of total peak towards higher angles.
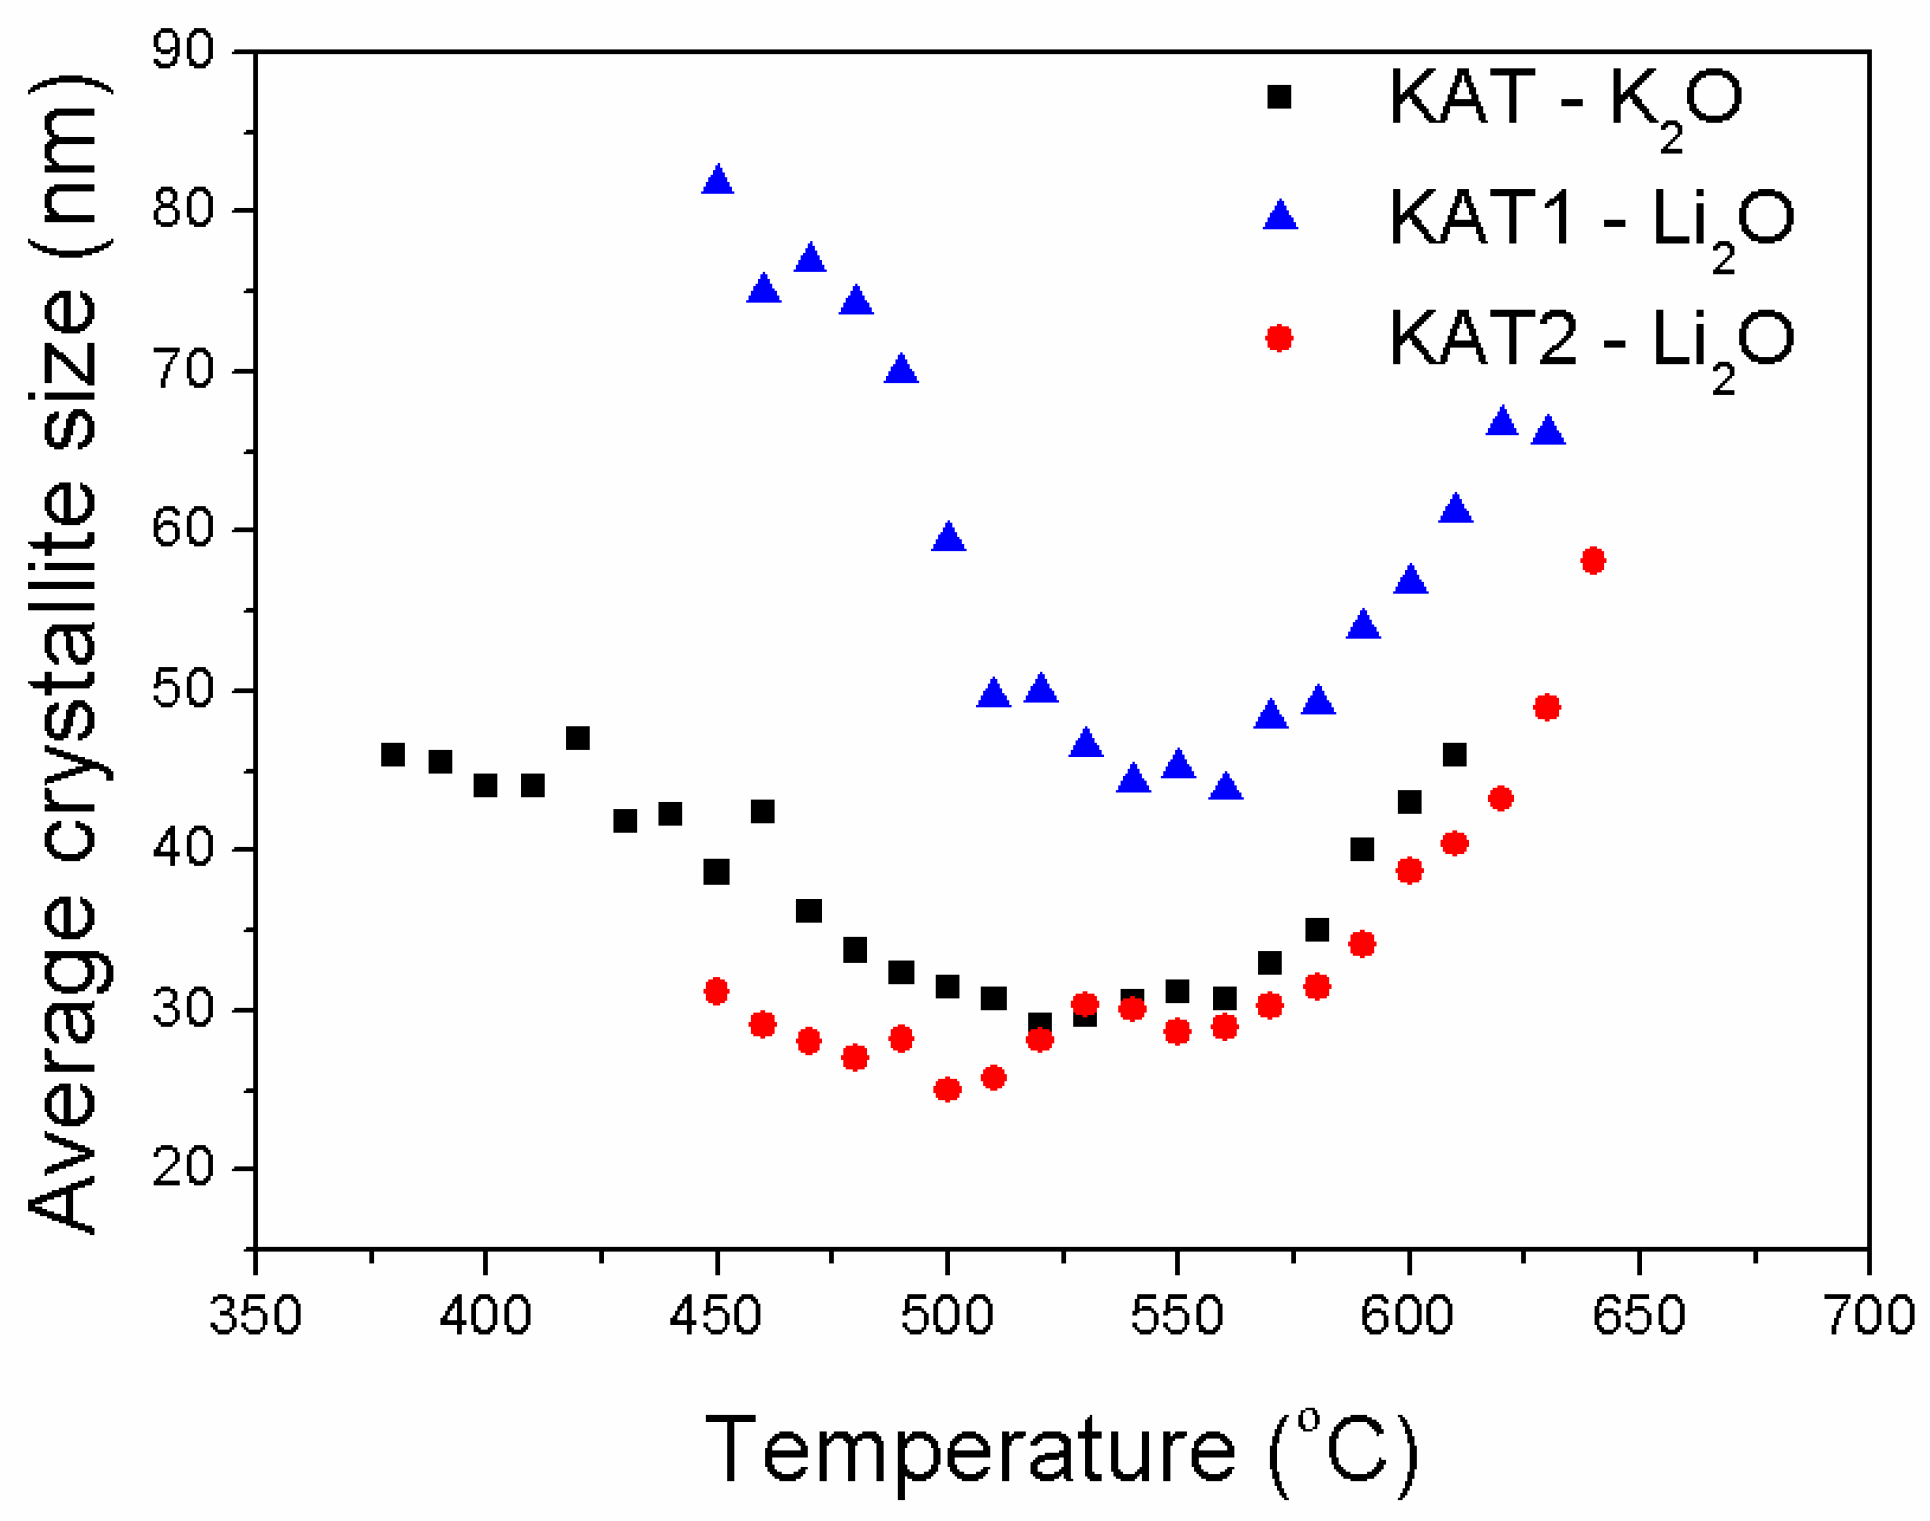
The average size of iron crystallites formed during the reduction processes of the examined catalysts was also compared (
Figure 10).
Sizes of iron crystallites formed during the reduction of KAT-K2O and KAT2-Li2O catalysts were very similar for both catalysts. It was found that the industrial catalyst of the magnetite structure and promoted with potassium oxide was fully reduced at 500 °C. The average size of iron crystallites was around 30 nm. The further increase in reduction temperature caused the recrystallization process and increase in size of iron crystallites.
Catalysts promoted with lithium oxide reached the full reduction only at a temperature of 600 °C. Under these conditions, the iron recrystallization process run; the average size of crystallites was in the range of 40 nm to 60 nm.
The catalyst KAT1-Li2O containing the additional phase Li2Fe3O4 was reduced faster and formed crystallites of iron that recrystallized easily while temperature rose. Structural promoters calcium and aluminum oxides, protecting iron against sintering, were released during the magnetite phase reduction, and formed a three-dimensional (3-D) structure; it means they formed bridges between iron crystallites. Significantly bigger iron crystallites were observed for the catalyst KAT1-Li2O than for the catalysts KAT2-Li2O that contained only magnetite.
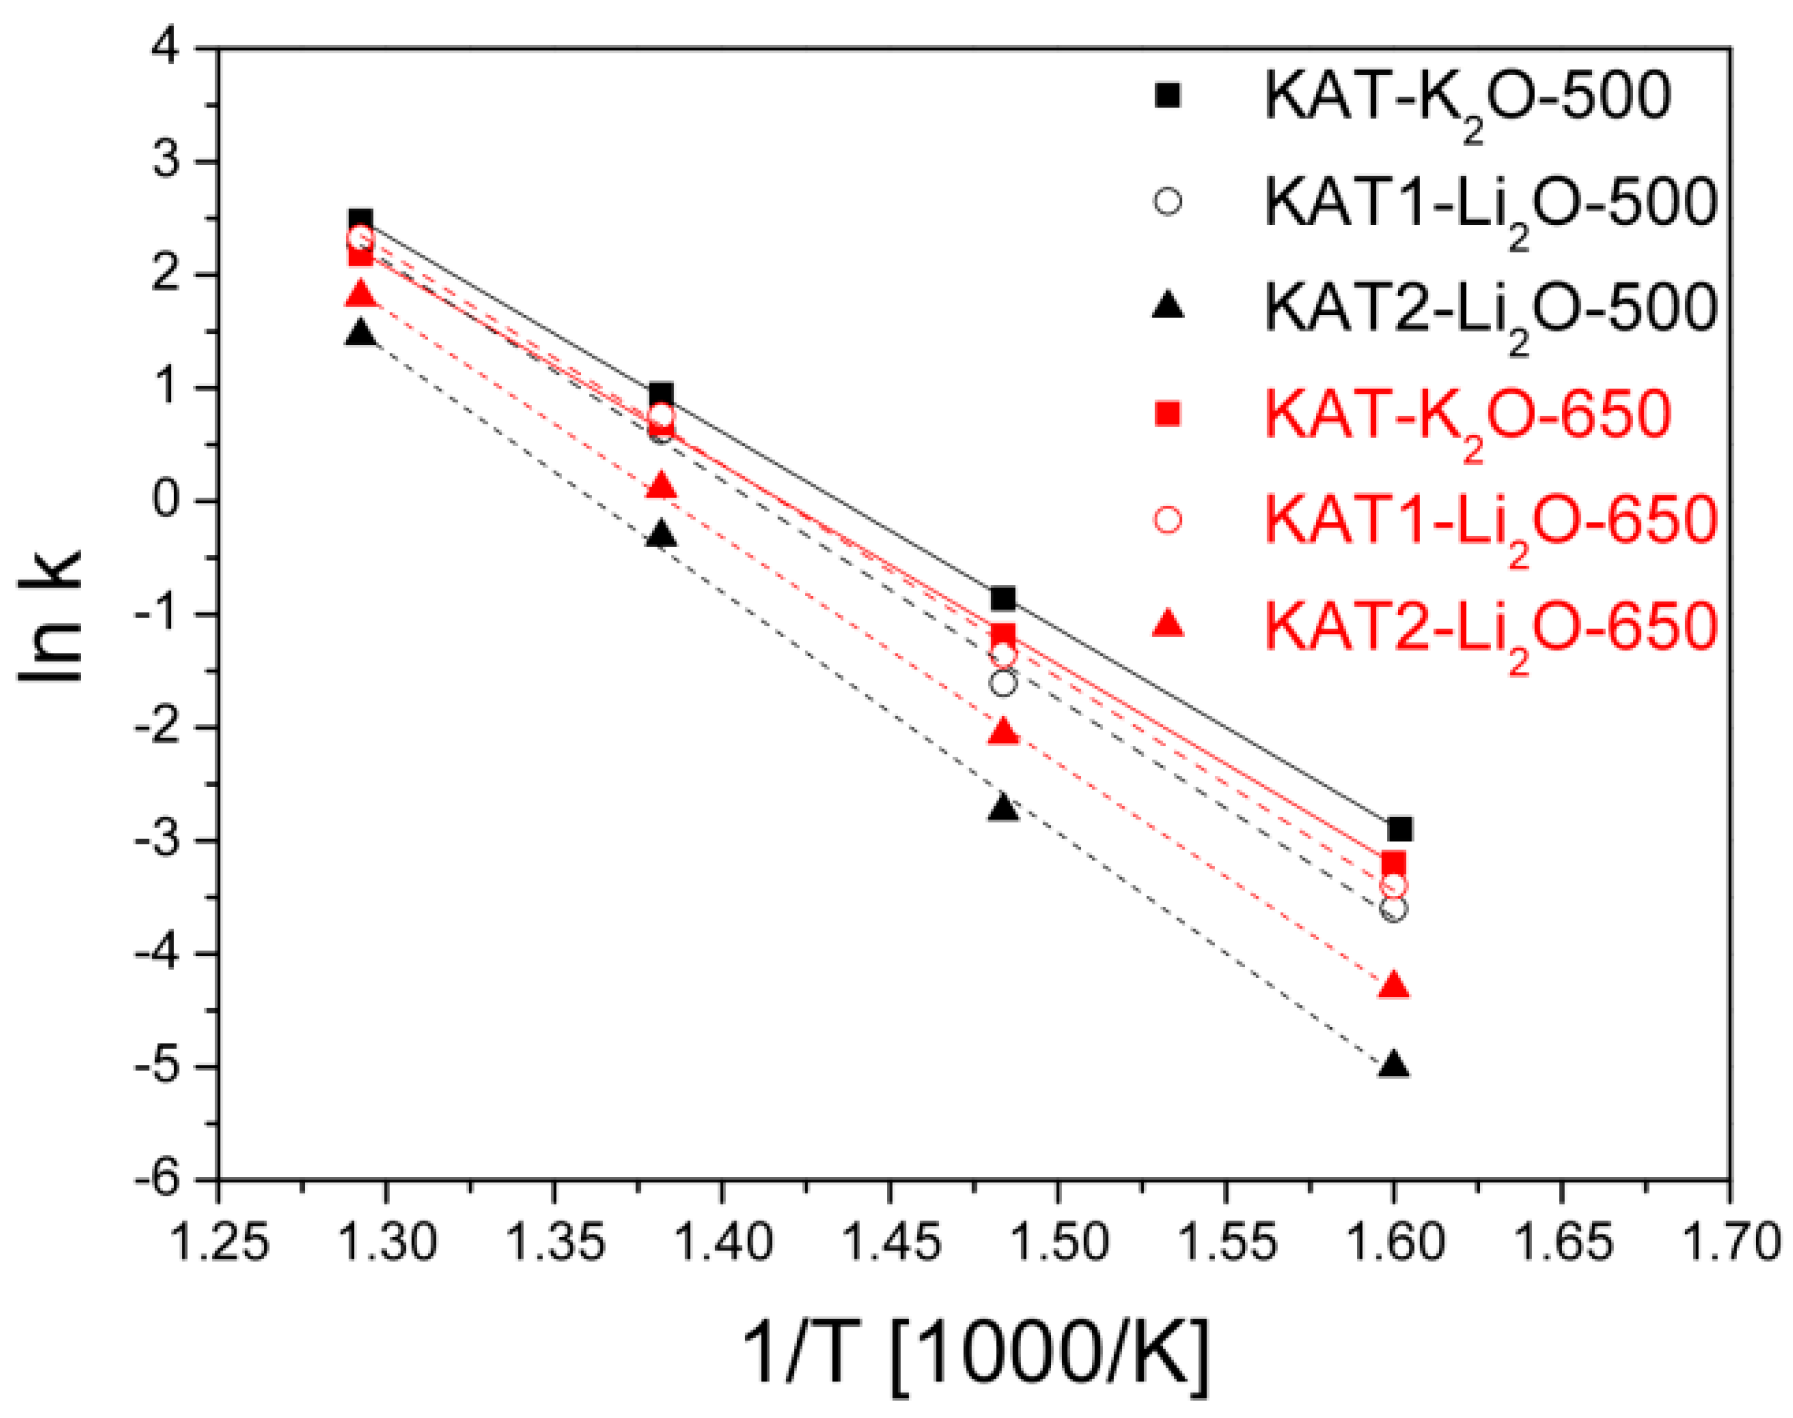
Arrhenius curves for the tested catalyst reduced at a temperature of 500 °C and after reduction at 650 °C are shown in
Figure 11.
Apparent activation energies were calculated from slopes of straights for catalysts reduced at various temperatures,
Table 2.
Catalysts promoted with lithium oxide and reduced at a temperature of 650 °C showed lower activity compared to the catalyst KAT-K2O promoted with potassium oxide. However, properties of the catalyst promoted with lithium oxide after reduction at 650 °C were very interesting—their activity rose.
The completed reduction at that temperature caused releasing of lithium oxide onto the iron surface. It was found [
35] from TPD-H
2 tests that the amount of hydrogen sorption sites on the surface of catalysts promoted with lithium oxide and reduced at 650 °C were significantly increased in comparison with the reduction at 500 °C when the total surface area was taken into account. As a result of the increase in the catalyst reduction degree at 650 °C, the catalyst absolute activity increased while lithium oxide concentration on the catalyst surface increased. However, the average size of crystallites was bigger at the same temperature as a result of the sintering,
Figure 10.
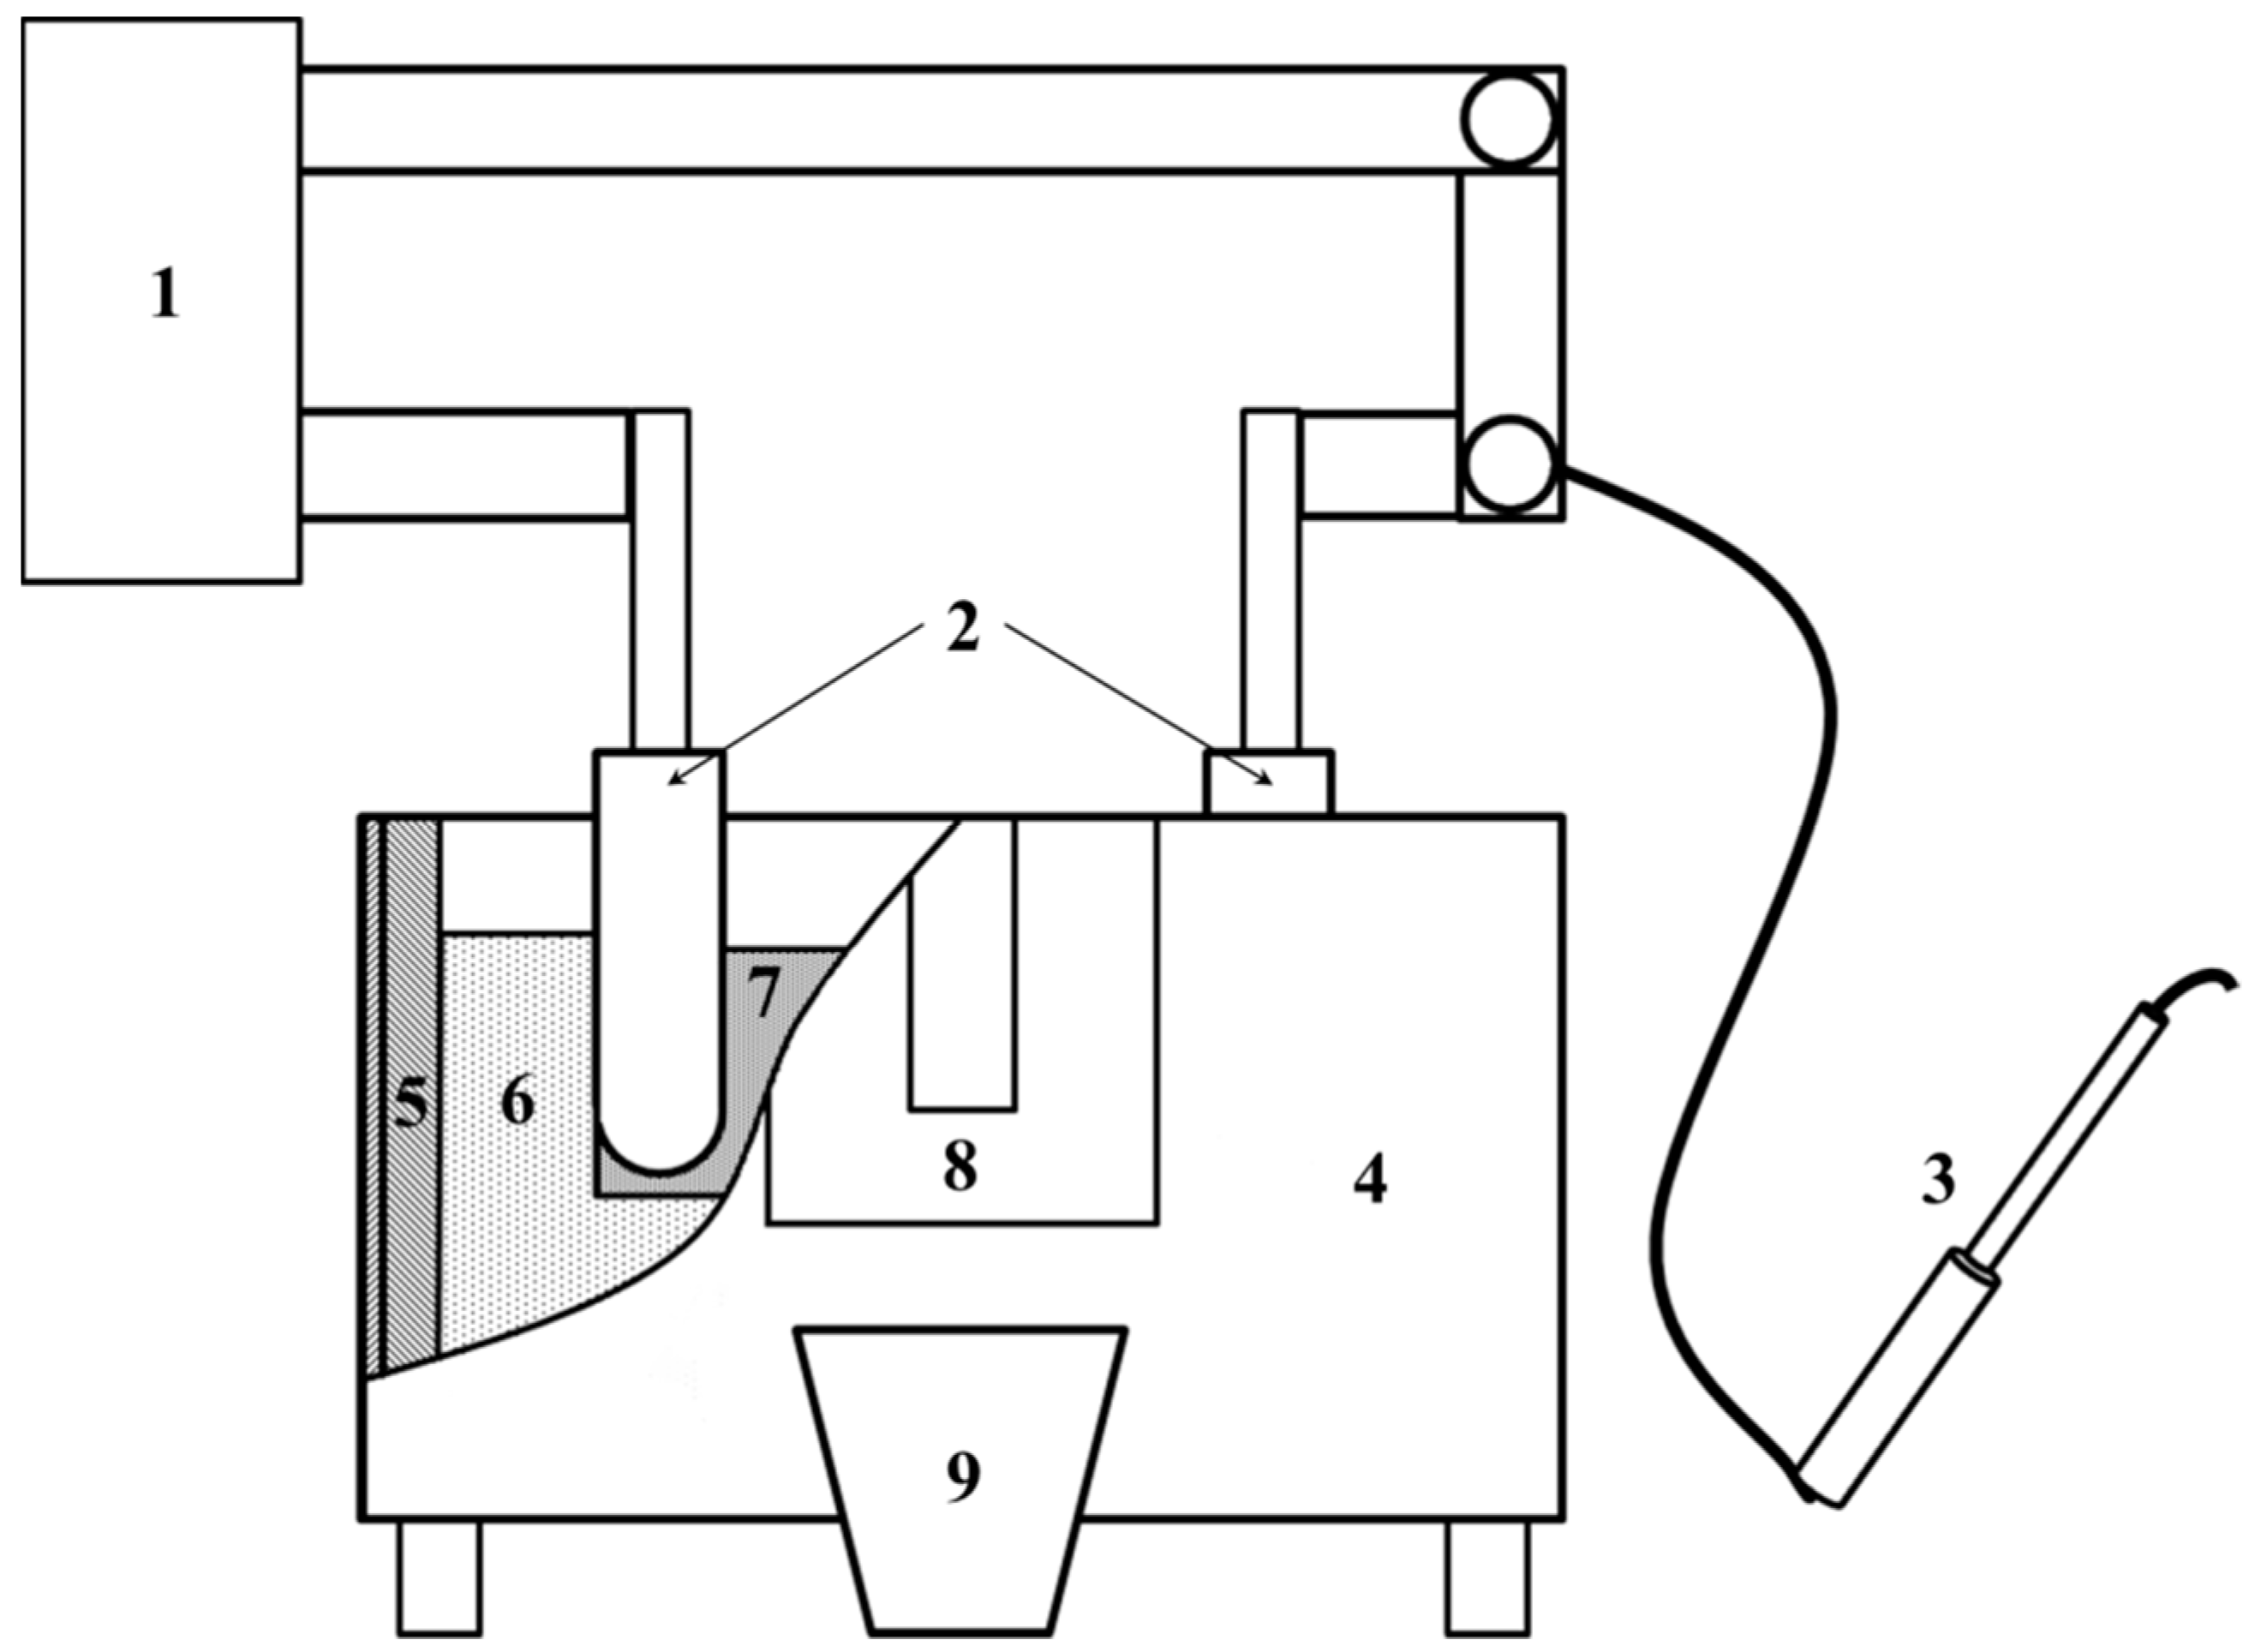
3. Materials and Methods
Precursors of catalysts for the ammonia synthesis were obtained by a fusing method in a laboratory plant for fused catalysts,
Scheme 1 [
39]. Feeding mixtures for the melting of catalysts were made of magnetite ore and oxide of calcium, aluminum, and lithium hydroxide. Molar ratio Fe
2+/Fe
3+ was adjusted using a proper amount of reducer, added during the melting process. With this technique, catalysts with various Fe
2+/Fe
3+ ratios were prepared. Precursors of catalyst with a constant ratio of the mass of promoter oxides to mass of iron (Al
2O
3-0.027, CaO-0.015, and Li2O-0.011) were studied. These catalysts were signed as KAT1-Li
2O and KAT2-Li
2O.
Chemical compositions of catalyst precursors were determined with the aid of inductively coupled plasma atomic emission spectroscopy (ICP-AES) using the PerkinElmer Optima 5300 DV (Waltham, MA, USA) spectrometer.
The ratio Fe2+/Fe3+ was determined with the manganometric titration method and denoted with an R letter in the whole paper.
The reduction of catalyst precursors was studied in a differential reactor equipped with a thermogravimetric measurement, in a hydrogen atmosphere at a flow of 80 dm3.h−1.g−1 under iso- (470 °C) and polythermal conditions during a heating from 350 °C to 750 °C at a rate of 3.5 °C/min.
In situ studies of the reduction of the catalysts were carried out in reaction chamber XRK900 (Antor Paar, Blankenfelde-Mahlow, German), connected with X-ray diffraction apparatus Philips X’Pert PRO (Almelo, The Netherland) using Cu-Kα radiation (λ = 1.54 Å). The reduction was carried out in a hydrogen atmosphere at a flow of 60 dm3.h−1.g−1 at a heating rate of 2.5 °C/min. The same diffractometer was used to determine a phase composition of the examined catalysts. Taken X-ray patterns were analyzed with the X’Pert HighScore Plus software (version 2.2, PANalytical, Almelo, The Netherland) and compared with the ICDD database.
The catalytic activity was measured in a six–channel integral reactor at the pressure of 10 MPa. A detailed description of the method has been reported previously in this work [
34]. Before activity tests, samples of the oxidized form of the catalysts were reduced polythermally in the temperature range of 350–500 °C, at a pressure of 0.1 MPa, by means of a nitrogen-hydrogen mixture using space velocity of about 20,000 h
−1. The final stage of reduction was executed at a pressure of 10 MPa and at a temperature of 500 °C. The activity studies were carried out under the same pressure in the temperature range of 350–500 °C. The rate constant calculated from the Temkin-Pyzhew equation was accepted as a measure of the activity. Subsequently, the catalysts were reduced polythermally into 650 °C, at a pressure of 0.1 MPa. When reduction was completed, the determination of the catalyst activities was performed again.


