Abstract
Developing photocatalysts with molecular recognition function is very interesting and desired for specific applications in the environmental field. Copper ferrite/N-doped graphene (CuFe2O4/NG) hybrid catalyst was synthesized and characterized by surface photovoltage spectroscopy, X-ray powder diffraction, transmission electron microscopy, Raman spectroscopy, UV–Vis near-infrared diffuse reflectance spectroscopy and X-ray photoelectron spectroscopy. The CuFe2O4/NG catalyst can recognize ammonia from rhodamine B (RhB) in ammonia-RhB mixed solution and selectively degrade ammonia under visible near-infrared irradiation. The degradation ratio for ammonia reached 92.6% at 6 h while the degradation ratio for RhB was only 39.3% in a mixed solution containing 100.0 mg/L NH3-N and 50 mg/L RhB. Raman spectra and X-ray photoelectron spectra indicated ammonia adsorbed on CuFe2O4 while RhB was adsorbed on NG. The products of oxidized ammonia were detected by gas chromatography, and results showed that N2 was formed during photocatalytic oxidization. Mechanism studies showed that photo-generated electrons flow to N-doped graphene following the Z-scheme configuration to reduce O2 dissolved in solution, while photo-generated holes oxidize directly ammonia to nitrogen gas.
1. Introduction
The selectively photocatalytic oxidization of specific pollutants in practical multicomponent systems such as waters contaminated by organics and ammonia is of significance for the removal of specific pollutants. The World Health Organization recommends that the total amount of ammonia (NH3) in drinking water should not exceed 1.5 mg/L [1]. Therefore, the development of the photocatalysts with the specific response to NH3 is very vital for the removal of ammonia in water treatments, which involves the molecular recognition to NH3.
CuFe2O4 is an interesting material with the band gap of 1.7 eV due to its unique electronic configuration of valence shell (Cu 3d104s1) [1]. It has been widely applied in magnetic memory, high-frequency devices, sensors, drug delivery, anode materials, and catalysts owing to its advantages of environmental benignity, moisture insensitive, high dispersion, high reactivity, low price, large abundance of Cu and easy separation with an external magnet [2,3,4,5]. CuFe2O4 was coupled to graphene [6], TiO2 [7], AgBr [8] and Ag3PO4 [9] to fabricate composites for degrading organic pollutants. Wang and co-workers utilized CuFe2O4 as a photocatalyst to selectively degrade methylene blue in the presence of methylene orange, rhodamine B and rhodamine 6G, and the authors attributed the selective degradation to the specific interaction of active sites of catalyst with the methylene blue molecule [10]. To the best of our knowledge, however, the coupling of CuFe2O4 to nitrogen-doped graphene (NG) for the selective photocatalytic oxidization of NH3 has not been reported.
Graphene is a two-dimensional sp2-hybridized carbon material with unique properties such as excellent charge transport, outstanding transparency, huge specific surface area, high mechanical strength and superior thermal conductivity, so it was often used as a co-catalyst [11,12,13,14,15,16,17]. Moreover, molecular tailoring (nitrogen atoms were doped into graphene framework) can module its intrinsic properties to meet the rapidly increasing demand for practical applications in various fields. For example, nitrogen doping can tailor its electrical properties, open a band gap and allow it to show semiconducting properties. As a result, nitrogen doping can significantly improve the catalytic activity toward photocatalytic reactions due to the enhanced electron transportation from semiconductors to NG and the reduced recombination of the photogenerated electron–hole pairs [18,19,20]. In the work, we coupled CuFe2O4 to NG to prepare CuFe2O4/NG hybrid catalyst, it is expected that the Cu-based hybrid catalyst can recognize ammonia via coordination effect since the formation constant of Cu(NH3)42+ approached 1.1 × 10¹³. This large constant implies a strong trend to form a complex between NH3 molecules and Cu sites, and also capturing capacity of NH3 from aqueous solutions.
2. Results and Discussion
2.1. X-ray Photoelectron Spectroscopic Characterization
X-ray photoelectron spectroscopic (XPS) determination indicated the as-prepared NG sample is composed of C, N and O elements (Figure 1A), in which C 1s, N 1s and O 1s peaks appeared at ~284.6, 400.0 and 534.0 eV, respectively. The percentages of C, N and O atoms are 83.24%, 7.84% and 8.92% in NG, respectively. The high-resolution XPS spectra of N, C, and O elements revealed the presence of the N 1s peaks at 398.7, 399.9, and 401.9 eV, which corresponded to the pyridinic, pyrrolic, and graphitic nitrogen atoms, respectively [21,22,23]. The pyridinic and pyrrolic nitrogen atoms are bonded with two carbon atoms and donate one or two p-electron to the aromatic π-system. Graphitic nitrogen, also called “quaternary nitrogen”, indicates that nitrogen atoms have substituted the carbon atoms in graphene layers [24]. The further studies showed the percentage of pyridinic, pyrrolic, and graphitic nitrogen atoms was 25.06%, 68.84% and 6.10%, respectively, which is consistent with those reported [25,26]. The atom ratios of copper to iron in both pure CuFe2O4 and CuFe2O4/NG samples were also determined, the results are 1:2.17 and 1:2.31, respectively, indicating very close to the 1:2 stoichiometry.
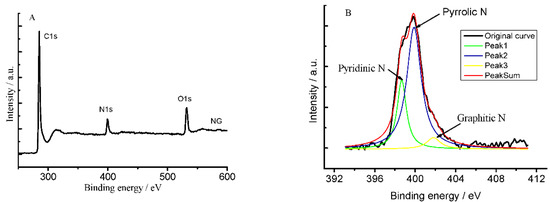
Figure 1.
A wide-scan XPS spectrum of as-synthesized NG sample (A) and the high-resolution spectrum of N 1s in NG sample (B).
2.2. X-ray Powder Diffraction Characterization
Figure 2 presented the X-ray powder diffraction (XRD) patterns of the as-prepared CuFe2O4/NG, CuFe2O4 and NG samples, with CuFe2O4 exhibiting the typical peaks of spinel ferrites with five prominent peaks occurring at 2θ = 30.28°, 35.75°, 57.80° and 62.83°. These diffraction peaks are indexed to Bragg planes (220), (311), (511) and (440), respectively. CuFe2O4 is the major crystal phase, which is in good agreement with JCPDS 25-0283 for the cubic spinel CuFe2O4 [27,28]. Peaks at 2θ = 32.90° [plane 110] and 39.11° [plane 111] suggests a small fraction of CuO. The diffraction peak at 26.43° is indexed to Bragg plane (002) assigned to N-doped graphene. The peak at 30.28° from the CuFe2O4/NG sample, as seen in curve a in Figure 2, is attributed to plane (220) of CuFe2O4 [29,30]. But, the peak did not appear in the single CuFe2O4 sample. It showed that NG component makes CuFe2O4 more regular. In addition, plane (002) assigned to N-doped graphene did not appear in the CuFe2O4/NG sample, because the amount of NG is very small in the CuFe2O4/NG sample. The average diameters (D) of the as-prepared CuFe2O4 and CuFe2O4/NG crystal sizes are 12.1 and 14.5 nm, respectively, which were determined using the Scherrer equation D = Kλ/(Wcosθ) at a diffraction angle of 35.75° (2θ). The average size of CuFe2O4/NG crystals is enlarged by the surface self-assembly of Cu2+ or Fe3+ ions on NG sheets.
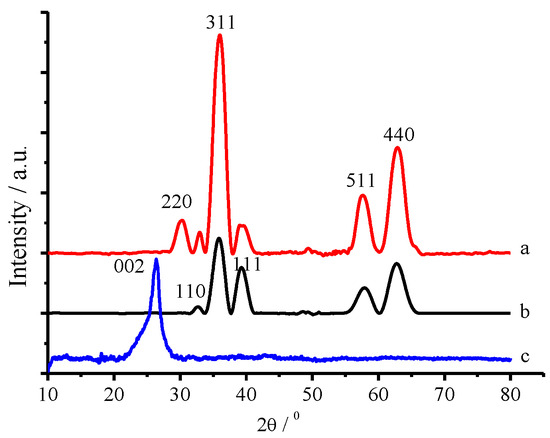
Figure 2.
XRD patterns of the as-prepared CuFe2O4/NG (a), CuFe2O4 (b) and NG (c) samples.
2.3. Transimission Electron Microscope Characterization
Figure 3A,B showed that the CuFe2O4 particles were dispersed on a layered structure of NG sheets. The high-resolution transmission electron microscopy (HRTEM) image displayed the lattice fringes. The d-spacing value between the adjacent lattice fringes is 0.25 nm (Figure 3C), which is characteristic of (211) spinel planes [27,28]. The size of CuFe2O4 crystals looked uniform; the diameter of most crystal particles is distributed about 25–30 nm, which is in the scope of the average particle size of CuFe2O4 crystals that was estimated by XRD.
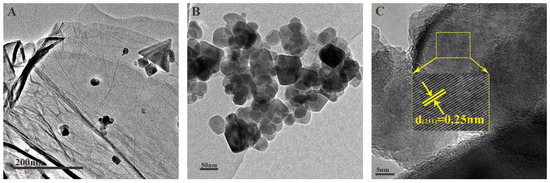
Figure 3.
TEM image of CuFe2O4/NG samples (A,B) and HRTEM image of CuFe2O4/NG sample (C).
2.4. Ultraviolet-Visible Near-Infrared Diffuse Reflectance Spectroscopy
UV–visible near-infrared diffuse reflectance spectra were measured to elucidate the enhanced photocatalytic activity of the CuFe2O4/NG hybrid catalyst. Compared with curve b (CuFe2O4) in Figure 4, curve a (CuFe2O4/NG) underwent a red-shift, indicating the CuFe2O4/NG hybrid catalyst can harvest more incident light energy.
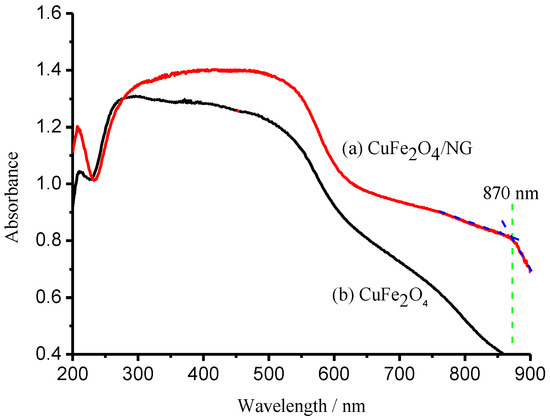
Figure 4.
UV–visible near-infrared diffuse reflectance spectra of CuFe2O4/NG (a), CuFe2O4 (b) catalysts.
Two Tauc-curves of the CuFe2O4/NG and CuFe2O4 catalysts for the direct transition were obtained using transformation data from Figure 4 and are presented in Figure 5, respectively. Extrapolation of linear portions of the curves towards absorbance axis to zero (y = 0) gave a band gap (Eg) of direct transitions. The direct band gap estimated for the CuFe2O4 sample is equal to 1.70 eV, which is in very good agreement with that reported [31]. As expected, the band gap for the CuFe2O4/NG sample shifted to 1.50 eV, the red-shift of 0.20 eV exhibited a strong electron-orbital interaction between NG and CuFe2O4 and a widened absorption scope of solar irradiation. In fact, the absorption edge for the CuFe2O4/NG composite catalyst was extended to 870 nm as indicated in curve a in Figure 4. This wavelength falls in the scope of near-infrared light irradiation, which revealed the CuFe2O4/NG composite catalyst can utilize near-infrared irradiation for photocatalysis.
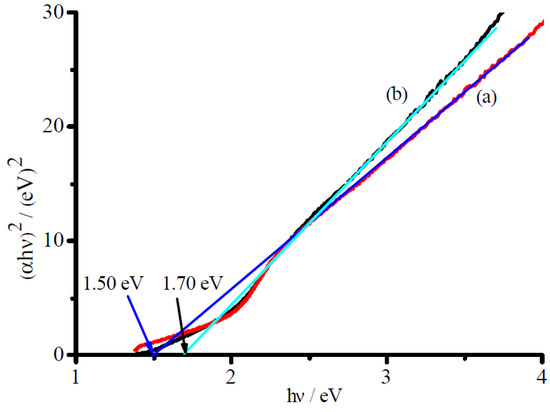
Figure 5.
Tauc-plots for direct transition of CuFe2O4/NG (a), CuFe2O4 (b) catalysts.
2.5. Molecular Recognition and Selective Photocatalysis
Figure 6 presented the separate degradation of ammonia and RhB using CuFe2O4/NG as the photocatalyst under visible near-infrared irradiation. The degradation ratios of 96.3% for ammonia and of 63.6% for RhB were achieved, respectively, at 5 h under visible-near-infrared irradiation in 100 mg/L ammonia solution alone and 50 mg/L RhB solution alone (for the blank or controlled tests, see Figure S1 in Supplementary Materials). The facts show that the photocatalyst can degrade both ammonia and RhB in a single-component solution. The degradation for organic pollutants is consistent with the references reported by Qu and Wang [32,33]. In a mixture of ammonia and RhB with the same concentration of ammonia and RhB as that in Figure 6, however, the degradation ratio for ammonia reached 92.6% at 6 h whereas the degradation ratio for RhB decreased to 39.3% as shown in Figure 7. The high degradation ratio for ammonia but low one for RhB in the mixed solution confirms the CuFe2O4/NG photocatalyst prefers to degrade ammonia in mixed solution containing ammonia and organic compounds under visible near-infrared irradiation. The phenomenon also occurred between ammonia and methyl orange. The preference indicates that the CuFe2O4/NG photocatalyst can selectively eliminate ammonia.
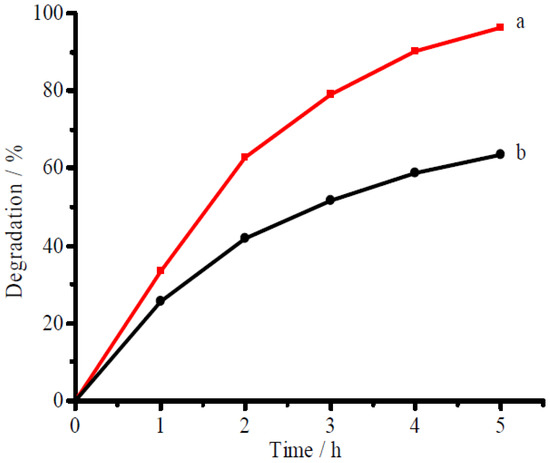
Figure 6.
Photocatalytic degradation of ammonia (a) and RhB (b) in 100 mg/L ammonia-N solution alone and in 50 mg/L RhB solution alone, respectively. The CuFe2O4/NG catalyst of 0.1 g was used in 50 mL volume with pH 9.5 under visible light irradiation.
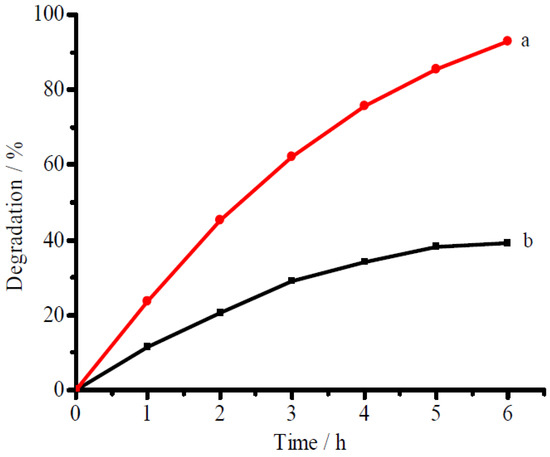
Figure 7.
Selective degradation of ammonia (a) and RhB (b) in a mixed solution containing 100 mg/L ammonia-N plus 50 mg/L RhB. The other conditions are the same as those in Figure 6.
2.6. Effect of NG Content
In order to obtain the optimal degradation conditions, the mass ratio of NG to CuFe2O4 was optimized, the results were shown in Figure 8 (see detailed information in Figure S2 in Supplementary Materials), the mass percentage of 6% for NG to CuFe2O4 resulted in an optimal degradation ratio (96.3%) at 5 h. Comparative studies showed that the CuFe2O4/NG catalyst possessed the highest activity for ammonia, compared with those of the CuFe2O4 and CuFe2O4/rGO catalysts (see Figure S3 in Supplementary Materials). Therefore, NG can enhance the photocatalytic activity of CuFe2O4.
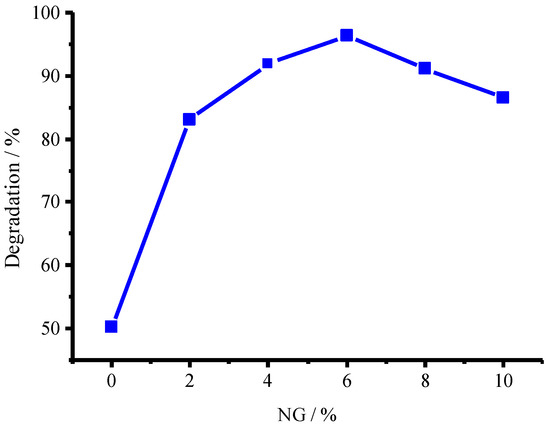
Figure 8.
Dependence of photocatalytic activity for the as-prepared CuFe2O4/NG photocatalyst on NG percentage.
2.7. Degradation Kinetics
The different initial concentrations of ammonia were used as desired while the dosage of 0.1 g catalyst in 50.0 mL solution with pH 9.5 was kept constant. The degradation kinetic curves for the various ammonia concentrations were shown in Figure 9. The parameter ln(C0/Ct) is linearly proportional to the irradiation time t, following a pseudo-first order kinetic equation
ln(C0/Ct) = Kapp t + b
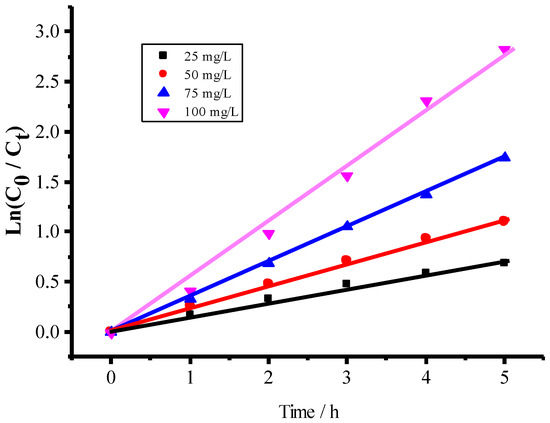
Figure 9.
Dependence of ln(C0/Ct) on irradiation time in 50 mL solutions at pH 9.5 during the photocatalytic degradation of ammonia at different concentrations of 25, 50, 75, 100 mg/L with 0.1 g CuFe2O4/NG catalyst.
The average value of the apparent rate constant kapp can be estimated as 0.3224 h−1, the standard error is equal to 0.01278.
2.8. Stability of CuFe2O4/NG Catalyst
The cyclic tests were performed in order to evaluate the catalytic stability during a series of experiments. The catalyst of 0.1 g CuFe2O4/NG was tested in six consecutive experiments using the fresh ammonia solutions. The reaction time was about 5 h for each run. At the end of the previous experiment, the catalyst was collected using an external magnetite, and then separated and washed with deionized water for three times. It was observed that the sixth photocatalytic degradation ratio of ammonia using the same CuFe2O4/NG catalyst still achieved 92% (Figure 10), showing the CuFe2O4/NG catalyst is very stable. The spent catalyst was taken out after 6 runs and it was measured by TEM to confirm the stability. As seen in Figure S4 in Supplementary Materials, the nanoparticles were still distributed on NG sheets, the d-spacing value of 0.25 nm indicated that the adjacent lattice fringes of (211) spinel planes remained.
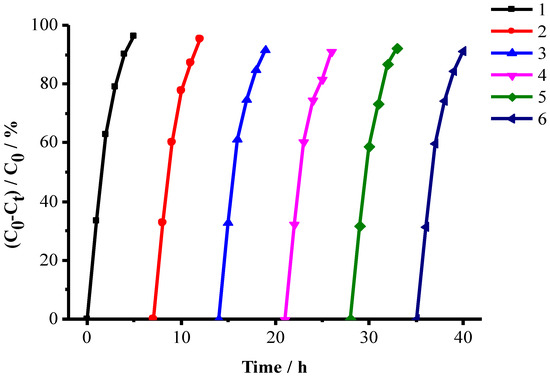
Figure 10.
Cyclic tests for checking CuFe2O4/NG stability. The volume of the test solutions is 50 mL, which contained 100 mg/L ammonia-nitrogen at pH 9.5 under visible-near-infrared irradiation.
2.9. Identification of Products
According to Chio’s and Butler’s investigations [1,34], ammonia was oxidized into N2 and NO3− (NO2−) by two paths. One is through a series of ·NH2, ·NH, N2Hx+y(x+y =0,1,2) intermediates, giving out N2 as a consequence. The other is to form the HONH2 and NO2− intermediates, finally generating NO3−. NO3− or NO2− ions will appear the absorption band in the wavelength range of 200 to 260 nm if there exists NO3− or NO2− in aqueous solution [33] (see Figures S5 and S6 in Supplementary Materials).
In our case the ultraviolet–visible spectroscopic measurements displayed that there is not any absorption band from 200 nm to 260 nm except noise wave during the photocatalytic process as shown in Figure 11, suggesting neither nitrite nor nitrate were formed during the degradation process since NO2− and NO3− can generate the absorption peaks at 211 nm and 206 nm, respectively [34,35,36].
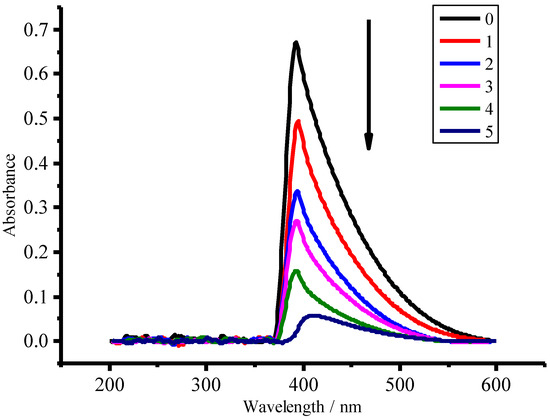
Figure 11.
Ultraviolet-visible absorption spectra of ammonia solution during photocatalytic degradation process at 0, 1, 2, 3, 4, 5 h, respectively. Experimental conditions as follows: the concentration of ammonia-nitrogen, 100 mg/L; catalyst mass of CuFe2O4/NG, 0.1 g; solution volume: 50 mL with pH 9.5.
In order to confirm the product of oxidized ammonia, the detection of nitrogen gas (N2) was performed during the photocatalytic degradation of ammonia in the sealed photocatalytic reaction system mentioned previously, in which a 50 mL aqueous solution containing 100.0 mg/L NH3-N was irradiated under visible-near-infrared light, the mixed gas of oxygen and argon was cycled, and the released N2 was detected with gas chromatograph. The results were displayed in Figure 12. During the visible-near-infrared light irradiation, the peak of O2 gas in the sealed reaction system was declining with irradiation time, while the peak of N2 gas was boosting with the irradiation time, indicating the generation of N2 gas during the photocatalytic decomposition of ammonia.
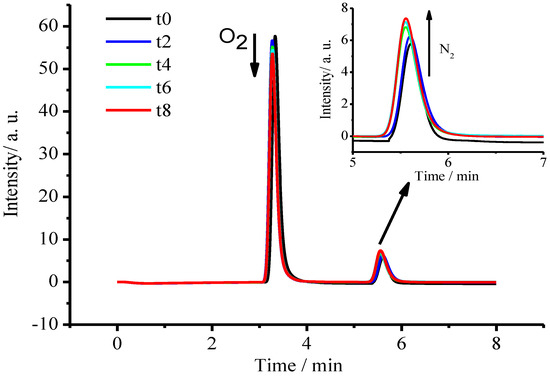
Figure 12.
Gas chromatograms during the photocatalytic degradation of ammonia under visible near-infrared light irradiation at t = 0.0, 2.0, 4.0, 6.0 and 8.0 h, respectively.
2.10. Molecular Recognition Evidence
In order to explore the mechanism for the selective degradation of ammonia, Raman spectroscopic measurements were performed before and after the CuFe2O4/NG catalyst was immersed in NH3 solution and NH3-RhB mixed solution, respectively. Figure 13 displayed the Raman spectra of the CuFe2O4/NG catalyst (a) itself and NH3 adsorbed on the CuFe2O4/NG catalyst (b) and both NH3 and RhB adsorbed on the CuFe2O4/NG catalyst (c). As to the assignments of the Raman shifts of the CuFe2O4 component in the composite catalyst, they were listed in Table 1 based on the FeO4 symmetry [37].
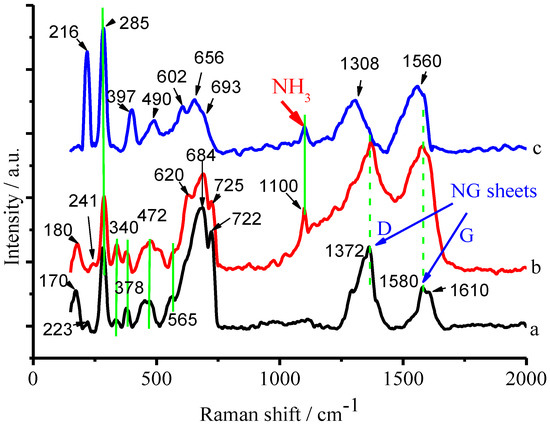
Figure 13.
Raman spectra of the CuFe2O4/NG sample (a), the CuFe2O4/NG sample after being immersed in 100 mg/L NH3-N solution for 4 h (b) and the CuFe2O4/NG sample after being immersed in 100 mg/L NH3-N and 50.0 mg/L RhB mixed solution for 4 h (c).

Table 1.
Assignments of Raman shifts for CuFe2O4/NG.
Besides the Raman peaks of CuFe2O4/NG itself, a new peak at 1100 cm−1 appeared in Raman spectra both (b) and (c) after the CuFe2O4/NG catalyst was immersed in NH3 solution and NH3-RhB mixed solution, respectively. This Raman shift at 1100 cm−1 was assigned to the bending vibration of NH3-H2O complex [38]. Thus, it unambiguously revealed that NH3 was adsorbed on the CuFe2O4/NG catalyst in both cases.
For RhB Raman shifts, it is known that the spontaneous Raman shift range of RhB is from 500 to 1700 cm−1 [39], thus, the shift at 602 cm−1 from Raman spectrum (c) in Figure 13 was attributed to the C–C bending vibration of xanthene ring in the molecular structure of RhB [40,41]. For the NG component, there were two Raman shifts located at 1372 and 1580 cm−1 as seen in curves (a) and (b), respectively, which were attributed to D (defect-induced mode) and G (in-plane vibration mode) bands. The G band (1580 cm−1) derived from the G (1610 cm−1) of the pristine graphene, which also confirmed that nitrogen atoms were incorporated into graphene framework [42,43]. Compared with curve (b), the significant shifts occurred of D and G bands after the CuFe2O4/NG catalyst was immersed in NH3-RhB mixed solution, as seen curve (c). The D and G bands were shifted from 1372 and 1580 cm−1 to 1308 and 1560 cm−1, respectively, which indicated the strong interaction between NG sheets and RhB, thereby RhB being adsorbed on NG sheets. It is reasonable that the π-π interaction between NG and RhB occurs because there are π bonds in their planar aromatic moieties [44,45] (for RhB structure, see Figure S7 in Supplementary Materials). However, compared with curve (a) in Figure 13, no shift of the D and G bands appeared in curve (b) after the CuFe2O4/NG catalyst was immersed in the single NH3 component solution. It suggested that NH3 was adsorbed preferentially on CuFe2O4 moiety, but not NG, in the composite catalyst.
In order to confirm ammonia adsorbed on CuFe2O4, the single CuFe2O4 sample (to avoids interference of nitrogen from NG) was synthesized and immersed in 100 mg/L NH3-N solution for 4 h for adsorption, then it was taken out and washed with deionized water for three times to remove ammonia adsorbed physically. Finally, it was dried at 60 °C in a vacuum chamber for XPS measurement. For the sake of contrast, other CuFe2O4 component that was not immersed in NH3 solution was also used for XPS measurement. Figure 14 displayed the high-resolution XPS spectrum of N 1s in the CuFe2O4 sample after it was immersed in a 100 mg/L NH3-N solution. It indicated evidently the presence of nitrogen atoms, whereas an N 1s peak was not detected out when the CuFe2O4 sample was not immersed in such 100 mg/L NH3-N solution. The dissimilarity implies that ammonia was adsorbed on the CuFe2O4 sample when it was immersed in ammonia solution. Deconvolution of the XPS spectrum of N 1s may be ascribed to the Eb of NH3 (399.97 eV), copper-NH3 (398.30 eV) and NO2− [46], which implied ammonia is partly oxidized in air atmosphere.
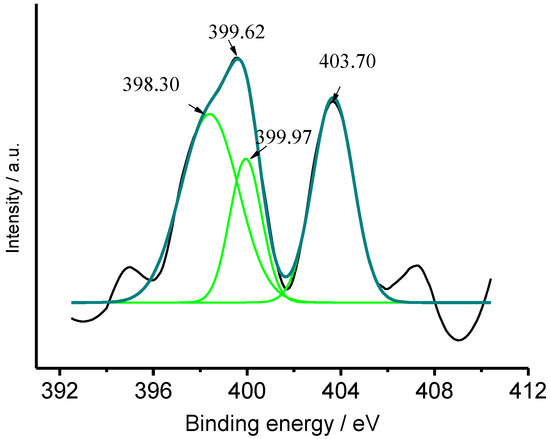
Figure 14.
High-resolution XPS spectrum of N 1s on the CuFe2O4 sample after it was immersed in 100 mg/L NH3-N solution.
Furthermore, the coordination between NH3 and Cu(II) or Fe(III) was identified by XPS technique. The high-resolution XPS measurements of Cu 2p and Fe 2p in the CuFe2O4 sample were conducted as shown in Figure 15 and Figure 16 before (a) and after (b) the CuFe2O4 sample was immersed in 100 mg/L NH3-N solution, respectively. Very interestingly, the shifts of Eb at 933.10 eV for Cu 2p 3/2 (0.75 eV) and at 953.06 eV for Cu 2p 1/2 (0.50 eV) were observed [47], implying that the chemical surroundings of copper in the CuFe2O4 sample were altered after it was immersed in 100 mg/L NH3-N solution. However, the shifts of Eb at 710.56 eV for Fe 2p 3/2 and Eb at 724.10 eV for Fe 2p 1/2 were not observed as shown in Figure 15 [48]. It is well known that the formation constant of Cu(NH3)42+ is up to 1.1 × 10¹³. Thus, it is reasonable that the CuFe2O4/NG catalyst can recognize ammonia via a coordination effect between copper atoms in the catalyst and nitrogen atoms in ammonia; it is concluded that the coordination interaction occurred between copper, but not iron and ammonia.
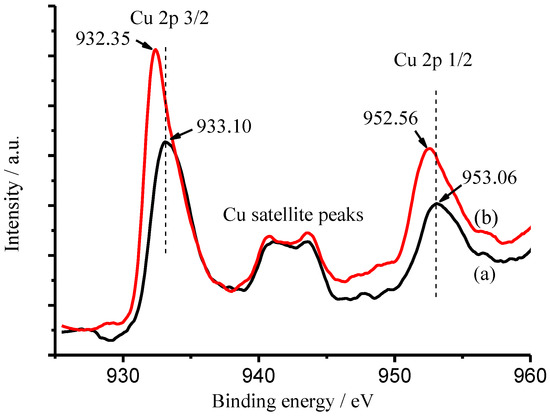
Figure 15.
High-resolution XPS spectra of Cu component in the CuFe2O4 sample before (a) and after (b) it was immersed in 100 mg/L NH3-N solution, respectively.
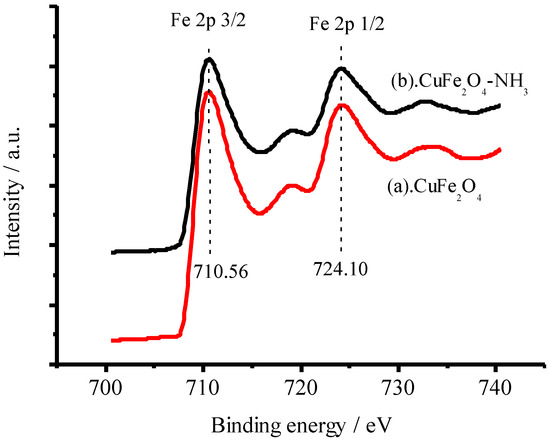
Figure 16.
High-resolution XPS spectra of Fe 2p in the CuFe2O4 sample before (a) and after (b) adsorbing ammonia.
2.11. Reaction Mechanism
The surface photovoltage spectroscopy (SPV) was utilized to explore the transfer of the photo-generated holes and photo-generated electrons in order to elucidate the degradation mechanism of ammonia. As known, the surface photovoltage is defined as the illumination-induced change in the surface potential [49], being equal to the difference between the surface potential under illumination and the surface potential in dark given by Equation (2)
SPV = Vs(ill) − Vs(dark)
As far as the band-to-band transitions are concerned, a positive response of SPV means that the photo-generated holes move to the irradiation side of the sample, whereas the photo-generated electrons move into the bulk of the sample [50,51]. That is, the semiconductor material is an n-type semiconductor in this case. On the contrary, a negative response represents a p-type semiconductor. In the present case, the SPV responses measured for the CuFe2O4 sample were shown in Figure 17.
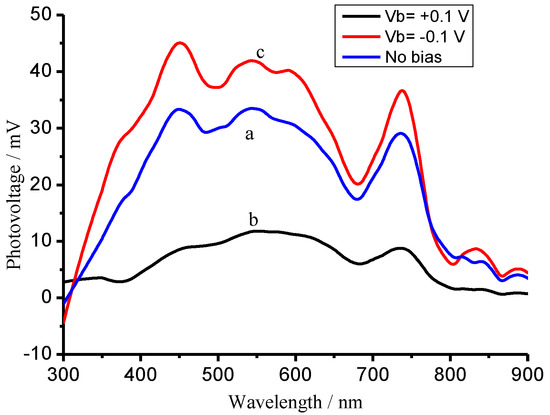
Figure 17.
SPV spectra of the CuFe2O4 sample biased by an external electrical field at zero (a), +0.1 V (b) and −0.1 V (c).
Curve (a) in Figure 17 presents a positive response under incident light illumination, suggesting that the photo-generated holes move to the illuminated surface of the CuFe2O4 sample. Applying a positive bias of 0.1 V to the CuFe2O4 sample suppressed the holes moving to the surface, resulting in a decreased SPV response (b); whereas a negative bias of 0.1 V promoted the holes moving to the surface, leading to an increased SPV response (c). It can be concluded from these facts that the CuFe2O4 material is an n-type semiconductor in the case [52,53]. The XPS valence band spectra for the CuFe2O4 and NG semiconductor materials have been determined as shown in Figure 18A,B. The valence bands are equal to 1.7 eV and 1.4 eV for CuFe2O4 and NG [54], respectively. The conduction bands are equal to 0.2 eV and −0.1 eV for CuFe2O4 and NG, respectively, based on their measurements of band gaps.
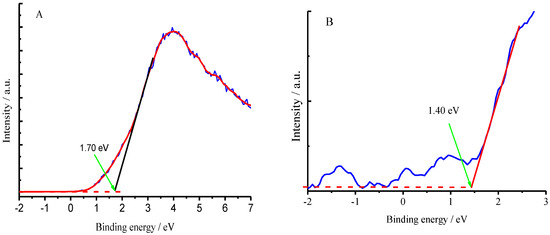
Figure 18.
XPS valence band spectra of CuFe2O4/NG (A) and NG (B).
UV–visible near-infrared diffuse reflectance spectrum of NG sheets has been measured as shown in Figure 19. As seen, the absorption edge of NG sheets extended to near-infrared region, the insert indicated a direct band gap of 1.50 eV for the as-synthesized NG sheets, corresponding to 826 nm near-infrared incident light. As Eda and Chai have postulated that isolated sp2 nanodomains are likely to exhibit quantum confinement-induced semiconducting behavior [55,56]. The local energy gaps of π-π* transition then vary depending on the size, shape and fraction of these sp2 domains. The smaller this sp2 domain, the higher the outcome of the energy gap [53]. The calculated energy gap between HOMO and LUMO for a cluster of 37 rings is ∼2 eV, and this energy gap progressively increases to ∼7 eV for a single benzene ring [57]. Therefore, it is reasonable that the as-synthesized NG sheets work as a semiconductor with a band gap of 1.50 eV in the present case. The conduction band of NG sheets can thereby be estimated as −0.10 eV based on its band gap of 1.50 eV and valence band of 1.40 eV measured in Figure 18B.
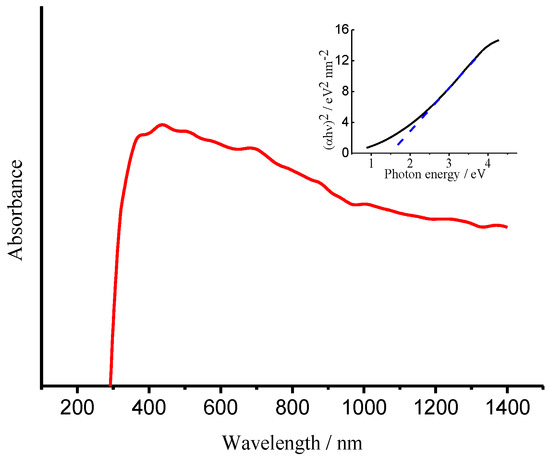
Figure 19.
UV–visible near-infrared diffuse reflectance spectrum of the NG sample. Tauc-plots for the direct band-gaps of the NG sample.
Under consideration of the standard electrodes (E0 for N2/NH3 redox is 0.057 V vs. NHE, E0 for O2/H2O is 1.23 V vs. NHE), a Z-scheme mechanism can be suggested as demonstrated in Scheme 1 [2,8].
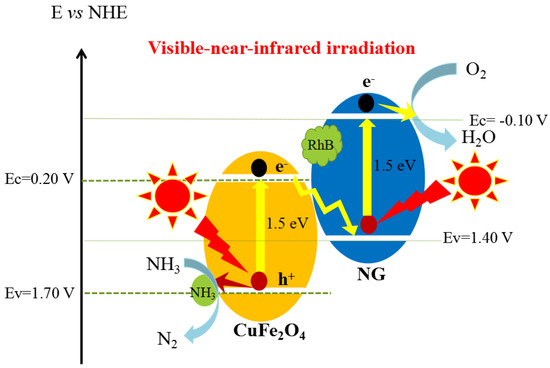
Scheme 1.
Z-scheme photocatalytic mechanism of CuFe2O4/NG. The photo-generated holes leave on CuFe2O4 to oxidize NH3 to N2, while the photo-generated electrons on the conduction band of CuFe2O4 flow to NG sheets along the Z-scheme configuration to reduce O2 molecules under visible-near-infrared light irradiation.
As mentioned previously, NH3 molecules were selectively adsorbed on the CuFe2O4 component, while RhB molecules were dominantly adsorbed on the NG sheets by π-π interaction. Therefore, NH3 molecules were oxidized by photo-generated holes on the valence band of copper ferrite to N2.
2NH3 + 6h+ = N2 + 6H+
At the same time, photo-generated electrons reduce O2 dissolved in solution to H2O2 through O2−· first, then continue to reduce H2O2 to H2O [58].
O2 + e− = O2−·
O2−· + 2H+ + e− = H2O2
H2O2 + 2H+ + 2e− = 2H2O
Thus, the overall photocatalytic reaction can be formulated as follows in Scheme 1.
2NH3 + 3/2O2 = N2 + 3H2O
3. Experimental Section
3.1. Synthetic Procedures
3.1.1. Synthesis of N-Doped Graphene
Hummers’ method was initially adopted to synthesize graphene oxide (GO) as our group has previously synthesized [59] and NG was synthesized as the reference [25]. The as-synthesized GO (0.1000 g) was ultrasonically dispersed in 25.0 mL of deionized water. Urea (30.0000 g) was dissolved in 25.0 mL of deionized water under stirring. The urea solution was added dropwise to the GO suspension solution under stirring. Subsequently, deionized water of 10 mL was added in the mixture and ultrasonicated for 2 h. After that, the mixture was transferred to a Teflon-lined stainless-steel autoclave with a volume of 60 mL, sealed and heated to 170 °C for 12 h to form NG. Finally, the resulting product was filtered, washed and dried in a vacuum chamber for use.
3.1.2. Synthesis of CuFe2O4/NG
A one-step hydrothermal route has been used for preparing CuFe2O4/NG samples [60]. Cu(NO3)2·3H2O (1.2080 g, 0.005 mol) and Fe(NO3)3·9H2O (4.0400 g, 0.01 mol) were separately dissolved in 10.0 mL of deionized water. NG (0.072 g, 6.0% of the CuFe2O4 mass) was dispersed in 10.0 mL of deionized water by an ultrasonic vibrator. The Cu(II) and Fe(III) solutions were added to NG suspension solution under stirring. NaOH (1.6 g, 0.04 mol) was dissolved in 10.0 mL of deionized water, and this solution was added dropwise to the mixed suspension solution described above under continuous stirring. Deionized water was also added to the suspension to obtain a final volume of 60 mL. The suspension solution was then transferred to a 100 mL Teflon-lined stainless-steel autoclave that was subsequently sealed and maintained at 180 °C for 10 h. The solution was cooled to room temperature and filtered to obtain CuFe2O4/NG precipitates. The CuFe2O4 nanoparticles can be formed by reaction Equation (4). The products were rinsed thrice with water to remove excess NaOH and other electrolytes and dried at 60 °C in a vacuum chamber for use.
Cu(NO3)2 + 2Fe(NO3)3 + 8NaOH = CuFe2O4 + 8NaNO3 + 4H2O
3.2. Photovoltage Characterization
Surface photovoltage spectra were recorded using a lock-in amplifier (SR830, Stanford Research Systems, Sunnyvale, CA, USA). The measurement system was composed of a 500 W xenon lamp, a monochromator (SBP500, Zolix Instruments Co., Ltd., Beijing China), a lock-in amplifier with a light chopper (SR540, Stanford Research Systems, Sunnyvale, CA, USA), and a sample chamber. The xenon lamp emitted incident photons with various wavelengths, which then passed through the monochromator to provide monochromatic light. The light was chopped with a frequency of 23 Hz, and its intensity depended on the spectral energy distribution of the lamp. The monochromator and the lock-in amplifier were controlled by a computer. The input resistance of the lock-in amplifier was set as 10 MΩ. SPV spectra were recorded by scanning from low to high photon energy. A UV–cutoff filter (λ > 420 nm) was employed at incident photon energy hv < 2.14 eV (λ > 580 nm) to remove the frequency and double the amount of light generated by the grating monochromator (doubled frequency of λ > 580 nm). The system was calibrated by a DSI200 UV–enhanced silicon detector to eliminate possible phase shift not correlated with the SPV response; thus, any phase retardation reflected the kinetics of SPV response [61].
3.3. Molecular Recognition and Selective Photocatalysis
Photocatalytic experiments were conducted under visible-near-infrared irradiation (λ > 400 nm). A 300 W UV–visible lamp (OSRAM, Munich, Germany) was used as a light source. Photocatalytic degradation was performed in a 100 mL beaker at room temperature (25 ± 2 °C). The distance between the lamp and test solution was approximately 10 cm, and the wall of the beaker was shielded from surrounding light by aluminum foil. Visible-near-infrared light was allowed to pass through a λ > 400 nm cut-off filter covering the window of the beaker; this filter absorbed UV light and allowed visible-near-infrared light of λ > 400 nm to pass through. In a typical photocatalytic experiment, 50 mL of test solution was used. The NH3 solutions were prepared according to the desired concentrations, and the CuFe2O4/NG catalyst of 0.1 g was used for the photocatalytic experiments. NaHCO3-Na2CO3 (0.1 mol/L) buffer was used to control the pH of the test solutions. For the selective photocatalytic degradation, the CuFe2O4/NG catalyst of 0.1 g was immersed in NH3-RhB mixed solution for 2 h first, then the visible-near-infrared light source was turned on for the photocatalytic tests.
A double-beam TU-1901 spectrophotometer (PGENERAL Instrument Limited-liability Company, Beijing, China) was used to determine the concentration of NH3 by reaction with Nessler reagent during the photocatalytic process. Nessler reagent is an alkaline solution of dipotassium tetraiodomercurate(II), this reagent was prepared by dissolving 10 g of HgI2 and 7 g of KI in water, adding to NaOH solution (16 g NaOH in 50 mL of water), and then diluting with deionized water to 100 mL. The reagent was stored in dark bottles and diluted properly before analysis. NH3 reacts with this reagent to yield colored solutions via Reaction (2) previously. As the absorbance of the solutions showed a maximum value at 392 nm, the absorbance was measured at the wavelength of 392 nm.
The procedures for the stability tests are follows: The CuFe2O4/NG catalyst was sunk by a magnetic field outside due to the CuFe2O4 magnetism after the last test finished. And then, the supernatant solution tested was poured out, the solid catalyst was kept in. Finally, a 50 mL fresh NH3 solution was poured into the reactor. Subsequently, the next test was carried out again.
4. Conclusions
The composite photocatalyst composed of copper ferrite and N-doped graphene enables to recognize ammonia from NH3-RhB mixed solution. The measurements of gas chromatography show that the composite photocatalyst oxidizes NH3 selectively to non-toxic N2 under visible near-infrared light irradiation, thereby fulfilling the removal of nitrogen, the effect solar use and purification of water. The mechanism studies indicate that the photo-generated electrons flow to N-doped graphene following the Z-scheme configuration to reduce O2 dissolved in solution.
Supplementary Materials
The following are available online at http://www.mdpi.com/2073-4344/8/10/405/s1, Figure S1: Blank test. (a) visible-near-infrared irradiation without the photocatalyst; (b) 0.1 g CuFe2O4/NG catalyst used in solution without irradiation; (c) 0.1 g CuFe2O4/NG catalyst used in solution under visible-near-infrared irradiation. The solution used is a 50 mL solution containing 100 mg/L ammonia-nitrogen at pH = 9.5. Figure S2: Effects of NG percentage on the photocatalytic activity of the as-prepared CuFe2O4/NG photocatalyst. 0.1 g photocatalyst in 50 mL solution at pH 9.5 containing 100 mg/L ammonia-nitrogen. Figure S3: Photocatalytic degradation of ammonia using different catalysts: CuFe2O4/NG (a), CuFe2O4/rGO (b), and bare CuFe2O4 (c) in 100 mg/L ammonia-N solution, respectively. The catalyst of 0.1 g was added in 50 mL solution containing 100 mg/L ammonia-N with pH 9.5 under visible-near-infrared irradiation. Figure S4: HRTEM image of the CuFe2O4/NG catalyst after it was tested for 6 runs. Figure S5: The absorption spectra of nitrate and nitrite standard solutions containing 1 mg L−1 of nitrogen. It is from the reference (see reference: D. L. Miles, C. Espejo, Comparison Between an Ultraviolet Spectrophotometric Procedure and the 2,4-Xylenol Method for the Determination of Nitrate in Ground waters of Low Salinity, Analyst, 1977,102, 104–109). Figure S6: The calibration curve of NO3− in the concentration range of 0.2–5.0 mg/L. Figure S7: The chemical structure of Rhodamine B.
Author Contributions
H.Z., Y.Z. and Q.-Q.G. conducted the experiments and collected the data. S.-Q.L. designed the experiments and reviewed the article. Z.-D.M. analyzed the data and discussed the results. L.L. wrote draft. All authors discussed the results and commented on the manuscript.
Funding
This research was funded by the National Natural Science Foundation of China (Nos. 21576175, 51502187), the key industrial prospective program of Jiangsu Science and Technology Department (BE2015190), the Natural Science Foundation of Jiangsu Province of China (No. BK20141178), the General Program of the Natural Science Foundation of the Jiangsu Higher Education Institutions of China (No. 16KJB150036), the Earmarked Nanotechnology Fund of the Bureau of Science and Technology of Suzhou City (No. ZXG201429) and Collaborative Innovation Center of Technology and Material of Water Treatment.
Conflicts of Interest
The authors declare no conflict of interest.
References
- Lee, J.; Park, H.; Choi, W. Selective photocatalytic oxidation of NH3 to N2 on platinized TiO2 in water. Environ. Sci. Technol. 2002, 36, 5462–5468. [Google Scholar] [CrossRef] [PubMed]
- Hussain, S.; Hussain, S.; Waleed, A.; Tavakoli, M.M.; Wang, Z.; Yang, S.; Fan, Z.; Nadeem, M.A. Fabrication of CuFe2O4/α-Fe2O3 Composite Thin Films on FTO Coated Glass and 3-D Nanospike Structures for Efficient Photoelectrochemical Water Splitting. ACS Appl. Mater. Interfaces 2016, 8, 35315–35322. [Google Scholar] [CrossRef] [PubMed]
- Jing, P.; Li, J.; Pan, L.; Wang, J.; Sun, X.; Liu, Q. Efficient photocatalytic degradation of acid fuchsin in aqueous solution using separate porous tetragonal-CuFe2O4 nanotubes. J. Hazard. Mater. 2015, 284, 163–170. [Google Scholar] [CrossRef] [PubMed]
- Xu, H.; Wang, Y.; Zheng, L.; Duan, X.; Wang, L.; Yang, J.; Qian, Y. Preparation of polypyrrole-coated CuFe2O4 and their improved electrochemical performance as lithium-ion anodes. J. Energy Chem. 2014, 23, 354–357. [Google Scholar] [CrossRef]
- Zhang, H.; Gao, S.; Shang, N.; Wang, C.; Wang, Z. Copper ferrite–graphene hybrid: A highly efficient magnetic catalyst for chemoselective reduction of nitroarenes. RSC Adv. 2014, 4, 31328–31332. [Google Scholar] [CrossRef]
- Fu, Y.; Chen, Q.; He, M.; Wan, Y.; Sun, X.; Xia, H.; Wang, X. High photocatalytic activity of magnetically separable manganese ferrite–graphene heteroarchitectures. Ind. Eng. Chem. Res. 2012, 51, 725–731. [Google Scholar] [CrossRef]
- Golshan, M.; Kakavandi, B.; Ahmadi, M.; Azizi, M. Photocatalytic activation of peroxymonosulfate by TiO2 anchored on cupper ferrite (TiO2@CuFe2O4) into 2,4-D degradation: Process feasibility, mechanism and pathway. J. Hazard. Mater. 2018, 359, 325–337. [Google Scholar] [CrossRef] [PubMed]
- Li, Z.; Lyu, J.; Sun, K.; Ge, M. Construction of magnetic AgBr/Cu/CuFe2O4 Z-scheme photocatalyst with improved photocatalytic performance. Mater. Lett. 2018, 214, 257–260. [Google Scholar] [CrossRef]
- Zhou, T.; Zhang, G.; Ma, P.; Qiu, X.; Zhang, H.; Yang, H.; Liu, G. Novel magnetically separable Ag3PO4@CuFe2O4 micro-nanocomposite with highly enhanced visible-light-driven photocatalytic activity. Mater. Lett. 2018, 210, 271–274. [Google Scholar] [CrossRef]
- Wang, L.; Hu, G.; Wang, Z.; Wang, B.; Song, Y.; Tang, H. Highly efficient and selective degradation of methylene blue from mixed aqueous solution by using monodisperse CuFe2O4 nanoparticles. RSC Adv. 2015, 5, 73327–73332. [Google Scholar] [CrossRef]
- Giovannetti, R.; Rommozzi, E.; Zannotti, M.; D’Amato, C.A. Recent Advances in Graphene Based TiO2 Nanocomposites (GTiO2Ns) for Photocatalytic Degradation of Synthetic Dyes. Catalysts 2017, 7, 305. [Google Scholar] [CrossRef]
- Li, W.; Zhang, Y.; Tian, G.; Wang, L.; Tian, J.; Bu, Y. Fabrication of graphene-modified nano-sized red phosphorus for enhanced photocatalytic performance. J. Mol. Catal. A Chem. 2016, 423, 356–364. [Google Scholar] [CrossRef]
- Tian, H.; Wan, C.; Xue, X.; Hu, X.; Wang, X. Effective Electron Transfer Pathway of the Ternary TiO2/RGO/Ag Nanocomposite with Enhanced Photocatalytic Activity under Visible Light. Catalysts 2017, 7, 156. [Google Scholar] [CrossRef]
- Zabihi, F.; Ahmadian-Yazdi, M.R.; Eslamian, M. Photocatalytic Graphene-TiO2 Thin Films Fabricated by Low-Temperature Ultrasonic Vibration-Assisted Spin and Spray Coating in a Sol-Gel Process. Catalysts 2017, 7, 136. [Google Scholar] [CrossRef]
- Arcibar-Orozco, J.A.; Giannakoudakis, D.A.; Bandosz, T.J. Copper hydroxyl nitrate/graphite oxide composite as superoxidant for the decomposition/mineralization of organophosphate-based chemical warfare agent surrogate. Adv. Mater. Interfaces 2015, 2, 1–9. [Google Scholar] [CrossRef]
- Su, P.; Iwase, K.; Nakanishi, S.; Hashimoto, K.; Kamiya, K. Nickel-nitrogen-modified graphene: An efficient electrocatalyst for the reduction of carbon dioxide to carbon monoxide. Small 2016, 12, 6083–6089. [Google Scholar] [CrossRef] [PubMed]
- Stankovich, S.; Dikin, D.A.; Dommett, G.H.B.; Kohlhaas, K.M.; Zimney, E.J.; Stach, E.A.; Piner, R.D.; Nguyen, S.B.T.; Ruoff, R.S. Graphene-based composite materials. Nature 2006, 442, 282–286. [Google Scholar] [CrossRef] [PubMed]
- Dai, L.; Xue, Y.; Qu, L.; Choi, H.J.; Baek, J.B. Metal-free catalysts for oxygen reduction reaction. Chem. Rev. 2015, 115, 4823–4892. [Google Scholar] [CrossRef] [PubMed]
- Wang, H.; Maiyalagan, T.; Wang, X. Review on recent progress in nitrogen-doped graphene: Synthesis, characterization, and its potential applications. ACS Catal. 2012, 2, 781–794. [Google Scholar] [CrossRef]
- Chang, D.W.; Baek, J.B. Nitrogen-Doped Graphene for Photocatalytic Hydrogen Generation. Chem. Asian J. 2016, 11, 1125–1137. [Google Scholar] [CrossRef] [PubMed]
- Feng, L.; Chen, Y.; Chen, L. Easy-to-operate and low-temperature synthesis of gram-scale nitrogen-doped graphene and its application as cathode catalyst in microbial fuel cells. ACS Nano 2011, 5, 9611–9618. [Google Scholar] [CrossRef] [PubMed]
- Ma, G.; Jia, R.; Zhao, J.; Wang, Z.; Song, C.; Jia, S.; Zhu, Z. Nitrogen-doped hollow carbon nanoparticles with excellent oxygen reduction performances and their electrocatalytic kinetics. J. Phys. Chem. C 2011, 115, 25148–25154. [Google Scholar] [CrossRef]
- Rao, C.V.; Ishikawa, Y. Activity, selectivity, and anion-exchange membrane fuel cell performance of virtually metal-free nitrogen-doped carbon nanotube electrodes for oxygen reduction reaction. J. Phys. Chem. C 2012, 116, 4340–4346. [Google Scholar]
- Shao, Y.; Zhang, S.; Engelhard, M.H.; Li, G.; Shao, G.; Wang, Y.; Lin, Y. Nitrogen-doped graphene and its electrochemical applications. J. Mater. Chem. 2010, 20, 7491–7496. [Google Scholar] [CrossRef]
- Wu, J.; Zhang, D.; Wang, Y.; Hou, B. Electrocatalytic activity of nitrogen-doped graphene synthesized via a one-pot hydrothermal process towards oxygen reduction reaction. J. Power Sources 2013, 227, 185–190. [Google Scholar] [CrossRef]
- Zheng, B.; Wang, J.; Wang, F.B.; Xia, X.H. Synthesis of nitrogen doped graphene with high electrocatalytic activity toward oxygen reduction reaction. Electrochem. Commun. 2013, 28, 24–26. [Google Scholar] [CrossRef]
- Shen, Y.; Wu, Y.; Xu, H.; Fu, J.; Li, X.; Zhao, Q.; Hou, Y. Facile preparation of sphere-like copper ferrite nanostructures and their enhanced visible-light-induced photocatalytic conversion of benzene. Mater. Res. Bull. 2013, 48, 4216–4222. [Google Scholar] [CrossRef]
- Li, Y.; Shen, J.; Hu, Y.; Qiu, S.; Min, G.; Song, Z.; Li, C. General flame approach to chainlike MFe2O4 spinel (M = Cu, Ni, Co, Zn) nanoaggregates for reduction of nitroaromatic compounds. Ind. Eng. Chem. Res. 2015, 54, 9750–9757. [Google Scholar] [CrossRef]
- Guo, T.; Dang, C.; Tian, S.; Wang, Y.; Cao, D.; Gong, Y.; Zhao, S.; Mao, R.; Yang, B.; Zhao, X. Persulfate enhanced photoelectrocatalytic degradation of cyanide using a CuFe2O4 modified graphite felt cathode. Chem. Eng. J. 2018, 347, 535–542. [Google Scholar] [CrossRef]
- Gao, J.; Wu, S.; Han, Y.; Tan, F.; Shi, Y. 3D Mesoporous CuFe2O4 as a Catalyst for photo-Fenton Removal of Sulfonamide Antibiotics at Near Neutral pH. J. Colloid Interface Sci. 2018, 524, 409–416. [Google Scholar] [CrossRef] [PubMed]
- Nasrallah, N.; Kebir, M.; Koudri, Z.; Trari, M. Photocatalytic reduction of Cr (VI) on the novel hetero-system CuFe2O4/CdS. J. Hazard. Mater. 2011, 185, 1398–1404. [Google Scholar] [CrossRef] [PubMed]
- Chen, P.; Xing, X.; Xie, H.; Sheng, Q.; Qu, H. High catalytic activity of magnetic CuFe2O4/graphene oxide composite for the degradation of organic dyes under visible light irradiation. Chem. Phys. Lett. 2016, 660, 176–181. [Google Scholar] [CrossRef]
- Fu, Y.; Chen, Q.; He, M.; Wan, Y.; Sun, X.; Xia, H.; Wang, X. Copper ferrite-graphene hybrid: A multifunctional heteroarchitecture for photocatalysis and energy storage. Ind. Eng. Chem. Res. 2012, 5, 11700–11709. [Google Scholar] [CrossRef]
- Zhu, X.; Castleberry, S.R.; Nanny, M.A.; Butler, E.C. Effects of pH and catalyst concentration on photocatalytic oxidation of aqueous ammonia and nitrite in titanium dioxide suspensions. Environ. Sci. Technol. 2005, 39, 3784–3791. [Google Scholar] [CrossRef] [PubMed]
- Miles, D.L.; Espejo, C. Comparison between an ultraviolet spectrophotometric procedure and the 2,4-xylenol method for the determination of nitrate in groundwaters of low salinity. Analyst 1977, 102, 104–109. [Google Scholar] [CrossRef]
- Xiao, B.; Liu, S.Q. Photocatalytic oxidation of ammonia via an activated carbon-nickel ferrite hybrid catalyst under visible light irradiation. Acta Phys. Chim. Sin. 2014, 30, 1697–1705. [Google Scholar]
- Silva, M.D.P.; Silva, F.C.; Sinfrônio, F.S.M.; Paschoal, A.R.; Silva, E.N.; Paschoal, C.W.A. The effect of cobalt substitution in crystal structure and vibrational modes of CuFe2O4 powders obtained by polymeric precursor method. J. Alloys Compd. 2014, 584, 573–580. [Google Scholar] [CrossRef]
- Ujike, T.; Tominaga, Y. Raman spectral analysis of liquid ammonia and aqueous solution of ammonia. J. Raman Spectrosc. 2002, 33, 485–493. [Google Scholar] [CrossRef]
- Fang, W.; Shan, X.; Li, Z.; Sun, C.; Li, Z.; Men, Z.; Fan, L. Stimulated resonance Raman scattering of Rhodamine B. Optik 2012, 123, 1845–1846. [Google Scholar] [CrossRef]
- Geiman, I.; Leona, M.; Lombardi, J.R. Application of raman spectroscopy and surface-enhanced raman scattering to the analysis of synthetic dyes found in ballpoint pen inks. J. Forensic Sci. 2009, 54, 947–952. [Google Scholar] [CrossRef] [PubMed]
- Sun, C.H.; Wang, M.L.; Feng, Q.; Liu, W.; Xu, C.X. Surface-enhanced Raman scattering (SERS) study on rhodamine B adsorbed on different substrates. Russ. J. Phys. Chem. A 2015, 89, 291–296. [Google Scholar] [CrossRef]
- Wang, X.; Weng, Q.; Liu, X.; Wang, X.; Tang, D.M.; Tian, W.; Zhang, C.; Yi, W.; Liu, D.; Bando, Y.; et al. Atomistic origins of high rate capability and capacity of n-doped graphene for lithium storage. Nano Lett. 2014, 14, 1164–1171. [Google Scholar] [CrossRef] [PubMed]
- He, L.; Jing, L.; Luan, Y.; Wang, L.; Fu, H. Enhanced visible activities of α-Fe2O3 by coupling N-doped graphene and mechanism insight. ACS Catal. 2014, 4, 990–998. [Google Scholar] [CrossRef]
- Varghese, N.; Ghosh, A.; Voggu, R.; Ghosh, S.; Rao, C. Selectivity in the interaction of electron donor and acceptor molecules with graphene and single-walled carbon nanotubes. J. Phys. Chem. C 2009, 113, 16855–16859. [Google Scholar] [CrossRef]
- Feng, S.; Santos, M.C.; Carvalho, B.R.; Lv, R.; Li, Q.; Fujisawa, K.; Elías, A.L.; Lei, Y.; Perea-López, N.; Endo, M.; et al. Ultrasensitive molecular sensor using N-doped graphene through enhanced Raman scattering. Sci. Adv. 2016, 2, e1600322. [Google Scholar] [CrossRef] [PubMed]
- Hendrickson, D.N.; Hollander, J.M.; Jolly, W.L. Nitrogen ls electron binding energies. Correlations with molecular orbital calculated nitrogen charges. Inorg. Chem. 1969, 8, 2642–2647. [Google Scholar] [CrossRef]
- Battistoni, C.; Mattogno, G.; Paparazzo, E. An XPS and auger study of some polynuclear copper compounds. Inorg. Chim. Acta 1985, 102, 1–3. [Google Scholar] [CrossRef]
- Zhang, W.; Quan, B.; Lee, C.; Park, S.K.; Li, X.; Choi, E.; Diao, G.; Piao, Y. One-step facile solvothermal synthesis of copper ferrite-graphene composite as a high-performance supercapacitor material. ACS Appl. Mater. Interfaces 2015, 7, 2404–2414. [Google Scholar] [CrossRef] [PubMed]
- Kronik, L.; Shapira, Y. Surface photovoltage phenomena: Theory, experiment, and applications. Surf. Sci. Rep. 1999, 37, 1–206. [Google Scholar] [CrossRef]
- Fan, H.; Jiang, T.; Li, H.; Wang, D.; Wang, L.; Zhai, J.; He, D.; Wang, P.; Xie, T. Effect of BiVO4 crystalline phases on the photoinduced carriers behavior and photocatalytic activity. Phys. Chem. C 2012, 116, 2425–2430. [Google Scholar] [CrossRef]
- Zhang, Z.; Yates, J.T., Jr. Band Bending in Semiconductors: Chemical and Physical Consequences at Surfaces and Interfaces. Chem. Rev. 2012, 112, 5520–5551. [Google Scholar] [CrossRef] [PubMed]
- Li, C.; Jiao, C.Q.; Sun, Z.G.; Chen, K.; Wang, C.L.; Zhu, Y.Y.; Zhu, J.; Zhao, Y.; Zheng, M.J.; Sun, S.H.; et al. Synthesis, structures and surface photovoltage properties of four novel metal phosphonateswith a 3D supramolecular structure. CrystEngComm 2012, 14, 5479–5486. [Google Scholar] [CrossRef]
- Zheng, M.J.; Zhu, Y.Y.; Sun, Z.G.; Zhu, J.; Jiao, C.Q.; Chu, W.; Sun, S.H.; Tian, H. Synthesis, crystal structures, and surface photovoltage properties of four new metal diphosphonates based on the mixed ligands. CrystEngComm 2013, 15, 1445–1453. [Google Scholar] [CrossRef]
- Yang, M.L.; Zhang, N.; Lu, K.Q.; Xu, Y.J. Insight into the role of size modulation on tuning the band gap and photocatalytic performance of semiconducting nitrogen-doped graphene. Langmuir 2017, 33, 3161–3169. [Google Scholar] [CrossRef] [PubMed]
- Eda, G.; Lin, Y.Y.; Mattevi, C.; Yamaguchi, H.; Chen, H.A.; Chen, I.S.; Chen, C.W.; Chhowalla, M. Blue photoluminescence from chemically derived graphene oxide. Adv. Mater. 2010, 22, 505–509. [Google Scholar] [CrossRef] [PubMed]
- Putri, L.K.; Ng, B.J.; Ong, W.J.; Lee, H.W.; Chang, W.S.; Chai, S.P. Heteroatom nitrogen- and boron-doping as a facile strategy to improve photocatalytic activity of standalone reduced graphene oxide in hydrogen evolution. ACS Appl. Mater. Interfaces 2017, 9, 4558–4569. [Google Scholar] [CrossRef] [PubMed]
- Chen, C.W.; Robertson, J. Nature of disorder and localization in amorphous carbon. J. Non-Cryst. Solids 1998, 227–230, 602–606. [Google Scholar] [CrossRef]
- Song, J.; Yan, L.; Duan, J.; Jing, C. TiO2 crystal facet-dependent antimony adsorption and photocatalytic oxidation. J. Colloid Interface Sci. 2017, 496, 522–530. [Google Scholar] [CrossRef] [PubMed]
- Liu, S.Q.; Xiao, B.; Feng, L.R.; Zhou, S.S.; Chen, Z.G.; Liu, C.B.; Meng, Z.D. Graphene oxide enhances the Fenton-like photocatalytic activity of nickel ferrite for degradation of dyes under visible light irradiation. Carbon 2013, 64, 197–206. [Google Scholar] [CrossRef]
- Zhao, Y.; He, G.; Dai, W.; Chen, H. High catalytic activity in the phenol hydroxylation of magnetically separable CuFe2O4–reduced graphene oxide. Ind. Eng. Chem. Res. 2014, 53, 12566–12574. [Google Scholar] [CrossRef]
- Liu, S.; Zhu, X.; Zhou, Y.; Meng, Z.; Chen, Z.; Liu, C.; Chen, F.; Wu, Z.; Qian, J. Smart photocatalytic removal of ammonia through molecular recognition of zinc ferrite/reduced graphene oxide hybrid catalyst under visible-light irradiation. Catal. Sci. Technol. 2017, 7, 3210–3219. [Google Scholar] [CrossRef]


© 2018 by the authors. Licensee MDPI, Basel, Switzerland. This article is an open access article distributed under the terms and conditions of the Creative Commons Attribution (CC BY) license (http://creativecommons.org/licenses/by/4.0/).