Influence of the Sodium Impregnation Solvent on the Deactivation of Cu/FER-Exchanged Zeolites Dedicated to the SCR of NOx with NH3

Abstract
:
1. Introduction
2. Results
2.1. Structural/Textural Characterisation of the Catalysts, Elemental Analysis
2.1.1. Sodium Free Catalysts
2.1.2. Na Impregnated Catalysts
2.2. Catalytic Activity
2.3. Redox Properties and Copper Characterization
2.3.1. NH3 and NO Oxidation
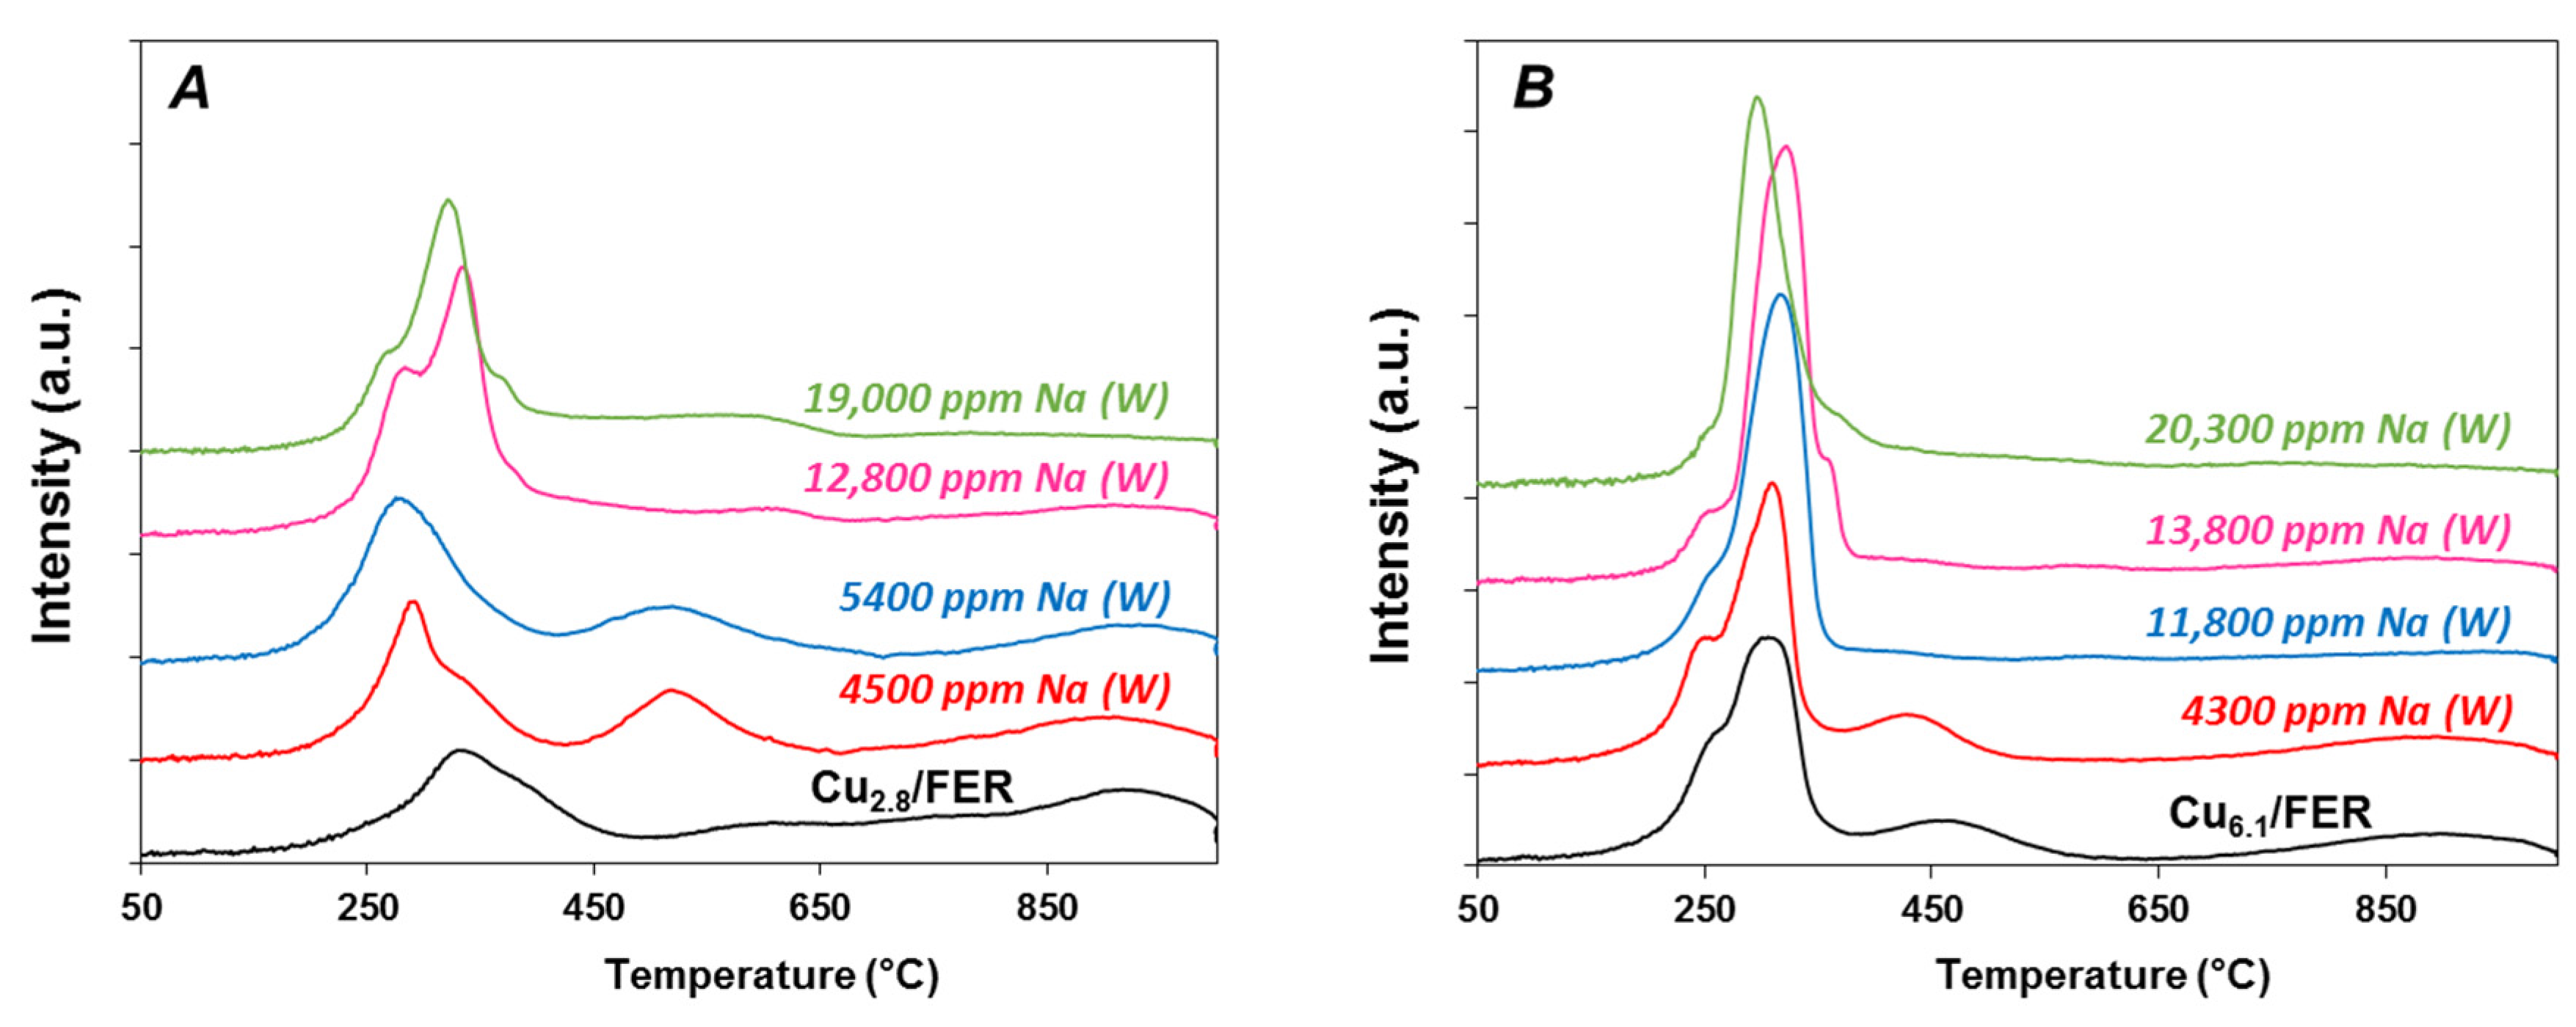
2.3.2. Temperature Programmed Reduction by Hydrogen (H2-TPR)
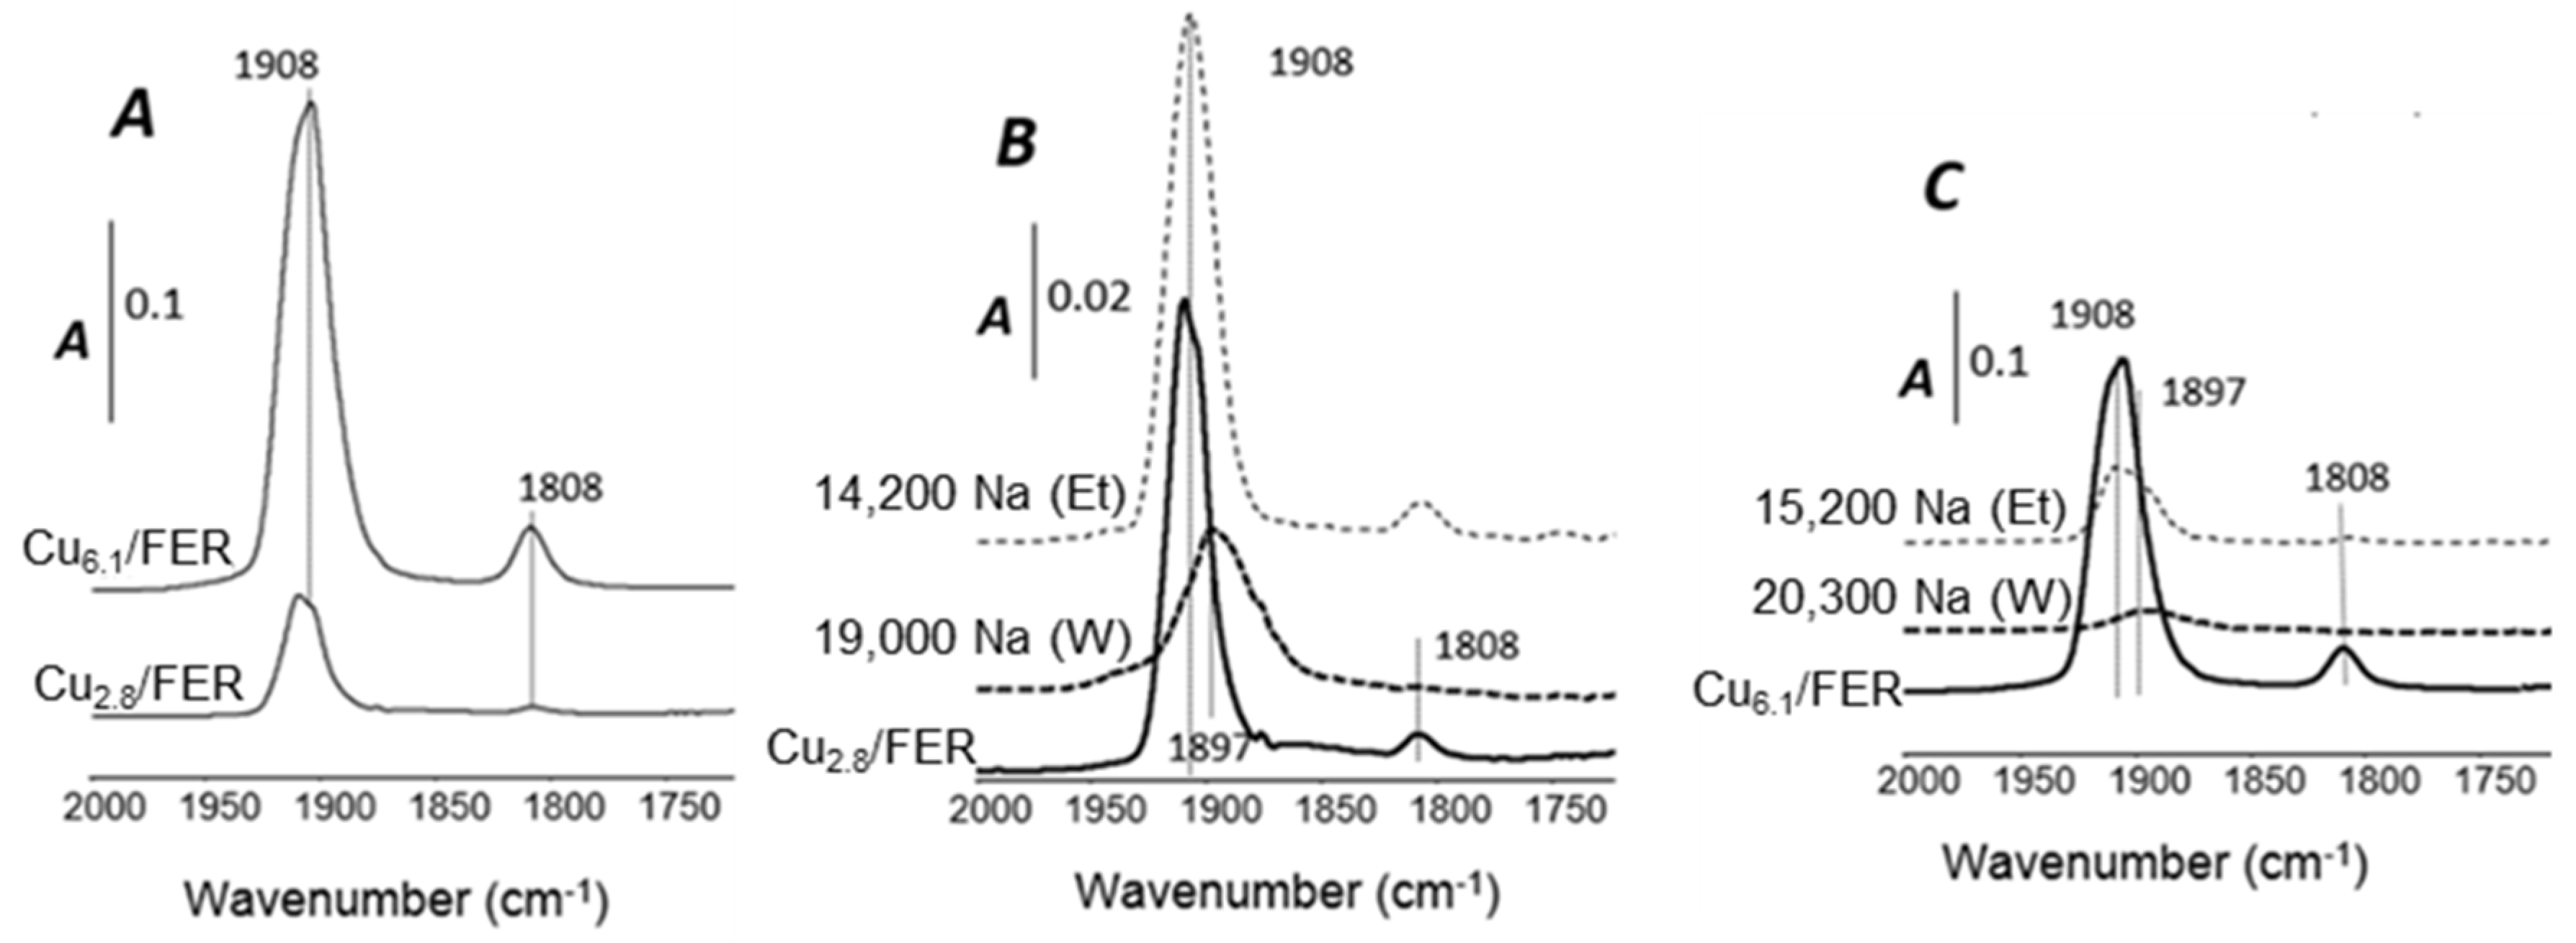
2.3.3. NO Adsorption Monitored by FT-IR Spectroscopy
2.4. Effect of the Na Additions on the Surface OH Groups and NH3 Adsorption Capacity
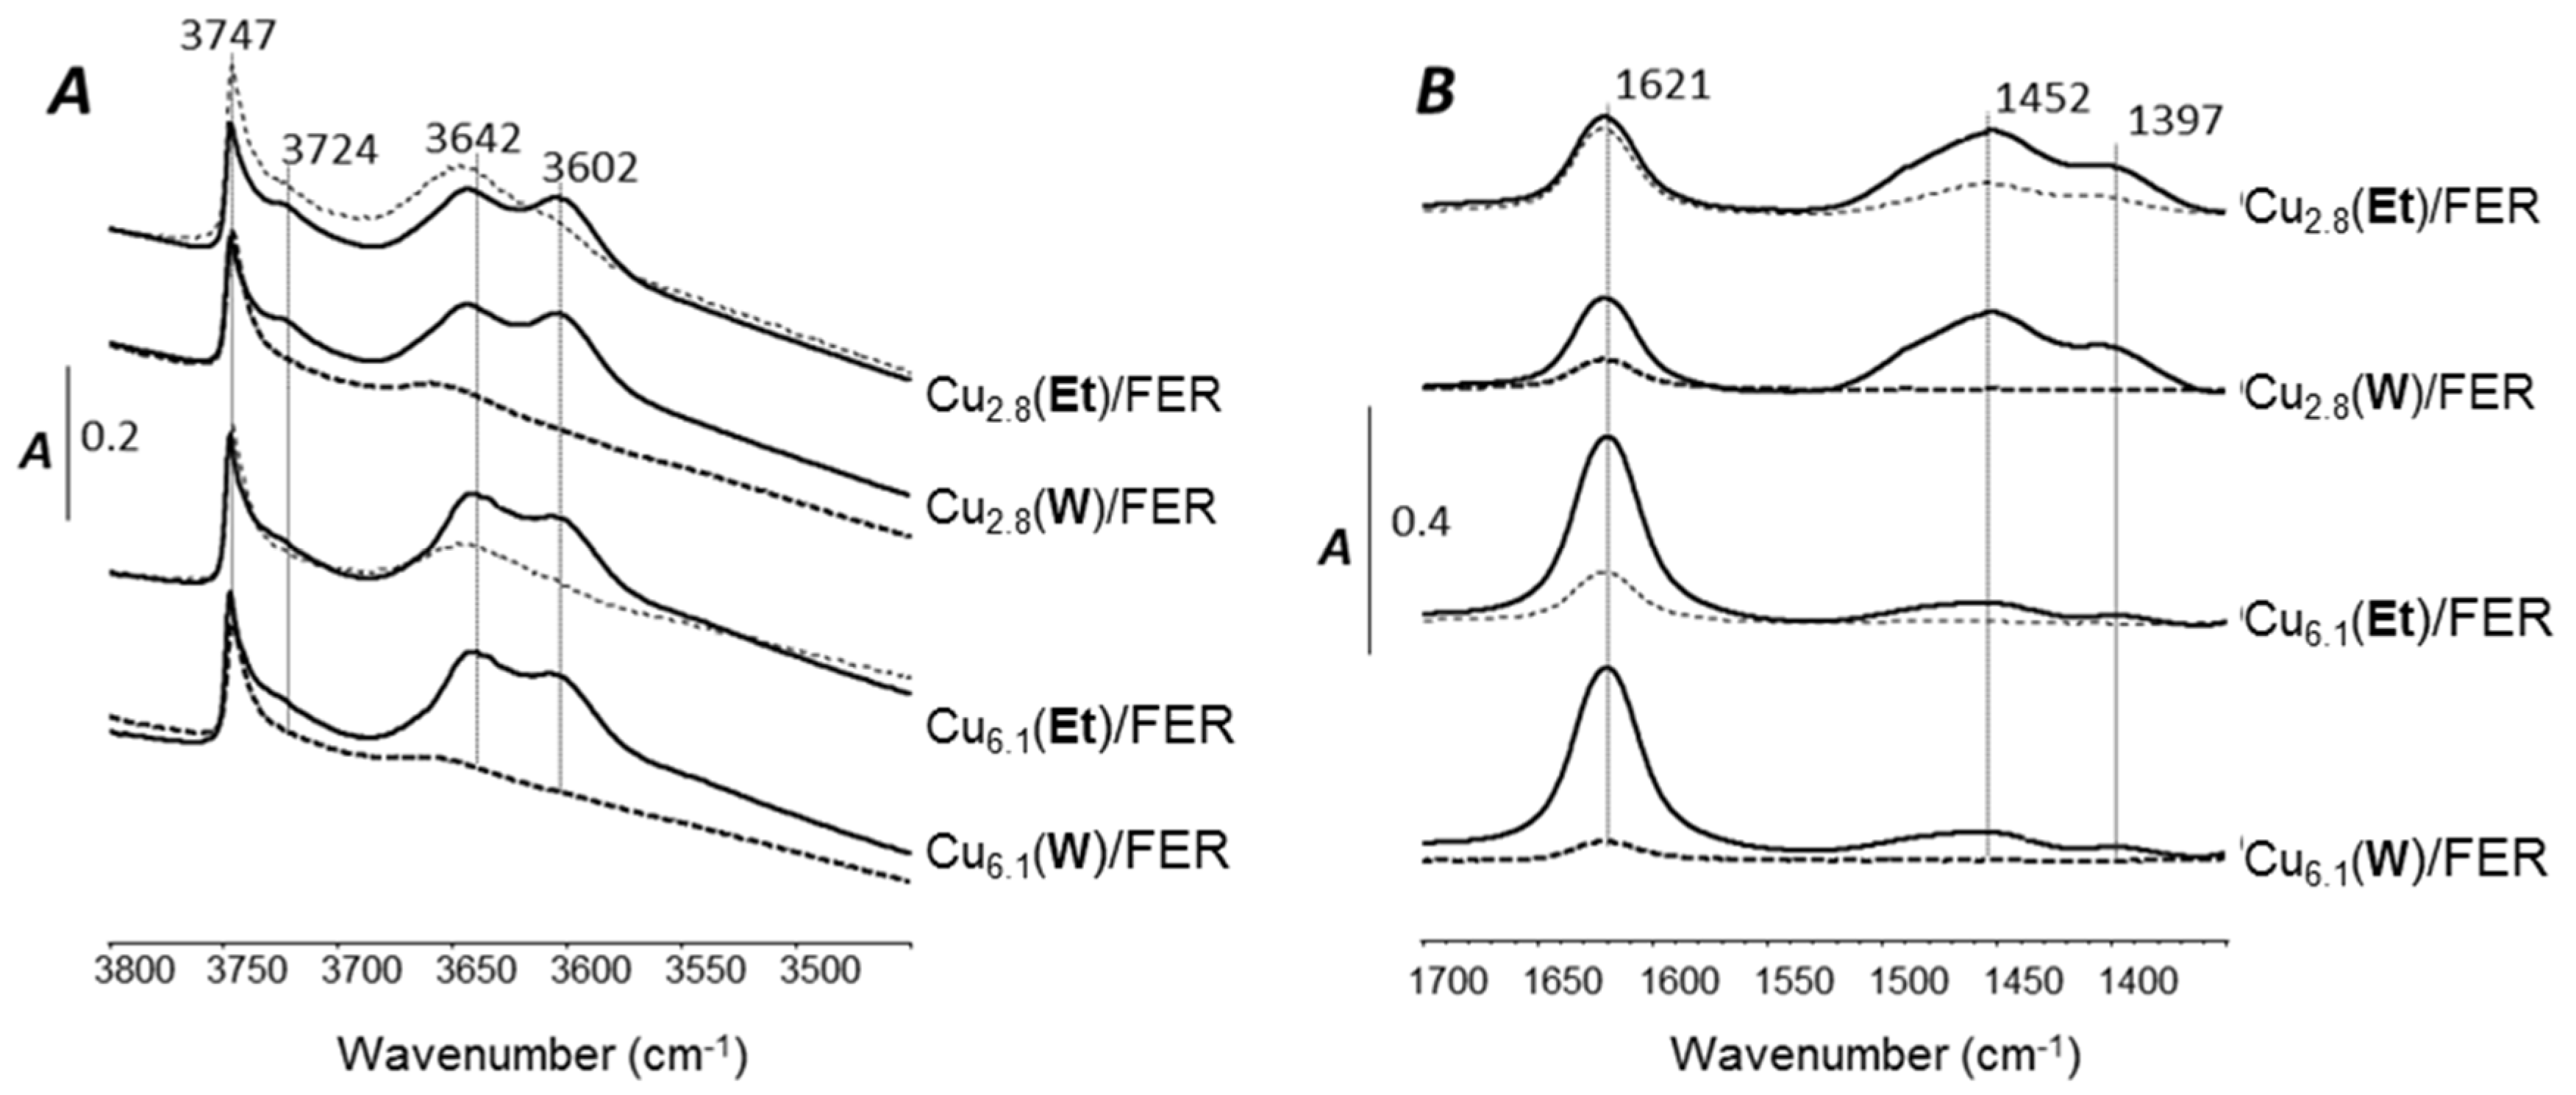
2.4.1. OH Groups
2.4.2. NH3 Adsorption
3. Discussion
3.1. Ammonia Adsorption and Copper State
3.2. Effect of Na Deposit over NH3-SCR Behaviour
4. Materials and Methods
4.1. Catalyst Preparation
4.2. Sodium Addition
4.3. Characterization Techniques and Catalytic Tests
4.3.1. Structural/Textural Characterizations, Elemental Analysis
4.3.2. Catalytic Activity
4.3.3. Redox Properties
Temperature Programmed Reduction (TPR) with Hydrogen
NO and NH3 Oxidation
4.3.4. Adsorption of Probe Molecules Monitored by FT-IR
5. Conclusions
Supplementary Materials
Acknowledgments
Author Contributions
Conflicts of Interest
References
- Wang, D.; Zhang, L.; Li, J.; Kamasamudram, K.; Epling, W.S. NH3-SCR over Cu/SAPO-34—Zeolite acidity and Cu structure changes as a function of Cu loading. Catal. Today 2014, 231, 64–74. [Google Scholar] [CrossRef]
- Ma, L.; Cheng, Y.; Cavataio, G.; McCabe, R.W.; Fu, L.; Li, J. Characterization of commercial Cu-SSZ-13 and Cu-SAPO-34 catalysts with hydrothermal treatment for NH3-SCR of NOx in diesel exhaust. Chem. Eng. J. 2013, 225, 323–330. [Google Scholar] [CrossRef]
- Kwak, J.H.; Tonkyn, R.G.; Kim, D.H.; Szanyi, J.; Peden, C.H.F. Excellent activity and selectivity of Cu-SSZ-13 in the selective catalytic reduction of NOx with NH3. J. Catal. 2010, 275, 187–190. [Google Scholar] [CrossRef]
- Kim, Y.J.; Lee, J.K.; Min, K.M.; Hong, S.B.; Nam, I.-S.; Cho, B.K. Hydrothermal stability of CuSSZ13 for reducing NOx by NH3. J. Catal. 2014, 311, 447–457. [Google Scholar] [CrossRef]
- Brandenberger, S.; Kröcher, O.; Tissler, A.; Althoff, R. The state of the art in selective catalytic reduction of NOx by ammonia using metal-exchanged zeolite catalysts. Catal. Rev. 2008, 50, 492–531. [Google Scholar] [CrossRef]
- Guan, B.; Zhan, R.; Lin, H.; Huang, Z. Review of state of the art technologies of selective catalytic reduction of NOx from diesel engine exhaust. Appl. Therm. Eng. 2014, 66, 395–414. [Google Scholar] [CrossRef]
- Nicosia, D.; Czekaj, I.; Kröcher, O. Chemical deactivation of V2O5/WO3–TiO2 SCR catalysts by additives and impurities from fuels, lubrication oils and urea solution: Part II. Characterization study of the effect of alkali and alkaline earth metals. Appl. Catal. B 2008, 77, 228–236. [Google Scholar] [CrossRef]
- Klimczak, M.; Kern, P.; Heinzelmann, T.; Lucas, M.; Claus, P. High-throughput study of the effects of inorganic additives and poisons on NH3-SCR catalysts—Part I: V2O5–WO3/TiO2 catalysts. Appl. Catal. B 2010, 95, 39–47. [Google Scholar] [CrossRef]
- Chen, L.; Li, J.; Ge, M. The poisoning effect of alkali metals doping over nano V2O5–WO3/TiO2 catalysts on selective catalytic reduction of NOx by NH3. Chem. Eng. J. 2011, 170, 531–537. [Google Scholar] [CrossRef]
- Kern, P.; Klimczak, M.; Heinzelmann, T.; Lucas, M.; Claus, P. High-throughput study of the effects of inorganic additives and poisons on NH3-SCR catalysts. Part II: Fe–zeolite catalysts. Appl. Catal. B 2010, 95, 48–56. [Google Scholar] [CrossRef]
- Shwan, S.; Jansson, J.; Olsson, L.; Skoglundh, M. Chemical deactivation of H-BEA and Fe-BEA as NH3-SCR catalysts—Effect of potassium. Appl. Catal. B 2015, 166–167, 277–286. [Google Scholar] [CrossRef]
- Ma, J.; Si, Z.; Weng, D.; Wu, X.; Ma, Y. Potassium poisoning on Cu-SAPO-34 catalyst for selective catalytic reduction of NOx with ammonia. Chem. Eng. J. 2015, 267, 191–200. [Google Scholar] [CrossRef]
- Brookshear, D.W.; Nguyen, K.; Toops, T.J.; Bunting, B.G.; Rohr, W.F. Impact of Biodiesel-Based Na on the Selective Catalytic Reduction of NOx by NH3 over Cu–Zeolite Catalysts. Top. Catal. 2013, 56, 62–67. [Google Scholar] [CrossRef]
- Brookshear, D.W.; Nguyen, K.; Toops, T.J.; Bunting, B.G.; Rohr, W.F.; Howe, J. Investigation of the effects of biodiesel-based Na on emissions control components. Catal. Today 2012, 184, 205–218. [Google Scholar] [CrossRef]
- Rahkamaa-Tolonen, K.; Maunula, T.; Lomma, M.; Huuhtanen, M.; Keiski, R.L. The effect of NO2 on the activity of fresh and aged zeolite catalysts in the NH3-SCR reaction. Catal. Today 2005, 100, 217–222. [Google Scholar] [CrossRef]
- Hamon, C.; Blanchard, G. Device for Treating Exhaust Gases. European Patent EP 2857084 A1, 8 April 2015. [Google Scholar]
- Lezcano-Gonzalez, I.; Deka, U.; van der Bij, H.E.; Paalanen, P.; Arstad, B.; Weckhuysen, B.M.; Beale, A.M. Chemical deactivation of Cu-SSZ-13 ammonia selective catalytic reduction (NH3-SCR) systems. Appl. Catal. B 2014, 154–155, 339–349. [Google Scholar] [CrossRef]
- Sultana, A.; Nanba, T.; Haneda, M.; Sasaki, M.; Hamada, H. Influence of co-cations on the formation of Cu+ species in Cu/ZSM-5 and its effect on selective catalytic reduction of NOx with NH3. Appl. Catal. B 2010, 101, 61–67. [Google Scholar] [CrossRef]
- Mihai, O.; Widyastuti, C.R.; Andonova, S.; Kamasamudram, K.; Li, J.; Joshi, S.Y.; Currier, N.W.; Yezerets, A.; Olsson, L. The effect of Cu-loading on different reactions involved in NH3-SCR over Cu-BEA catalysts. J. Catal. 2014, 311, 170–181. [Google Scholar] [CrossRef]
- Bulánek, R.; Wichterlová, B.; Sobalı́k, Z.; Tichý, J. Reducibility and oxidation activity of Cu ions in zeolites: Effect of Cu ion coordination and zeolite framework composition. Appl. Catal. B 2001, 31, 13–25. [Google Scholar] [CrossRef]
- Delahay, G.; Valade, D.; Guzmán-Vargas, A.; Coq, B. Selective catalytic reduction of nitric oxide with ammonia on Fe-ZSM-5 catalysts prepared by different methods. Appl. Catal. B 2005, 55, 149–155. [Google Scholar] [CrossRef]
- Delahay, G.; Coq, B.; Broussous, L. Selective catalytic reduction of nitrogen monoxide by decane on copper-exchanged beta zeolites. Appl. Catal. B 1997, 12, 49–59. [Google Scholar] [CrossRef]
- Dumas, J.M.; Geron, C.; Kribii, A.; Barbier, J. Preparation of supported copper catalysts. Appl. Catal. B 1989, 47, L9–L15. [Google Scholar] [CrossRef]
- Torre-Abreu, C.; Ribeiro, M.F.; Henriques, C.; Delahay, G. NO TPD and H2-TPR studies for characterisation of CuMOR catalysts the role of Si/Al ratio, copper content and cocation. Appl. Catal. B 1997, 14, 261–272. [Google Scholar] [CrossRef]
- Severino, F.; Brito, J.L.; Laine, J.; Fierro, J.L.G.; Agudo, A.L. Nature of copper active sites in the carbon monoxide oxidation on Cual2O4 and cucr2o4 spinel type catalysts. J. Catal. 1998, 177, 82–95. [Google Scholar] [CrossRef]
- Deka, U.; Lezcano-Gonzalez, I.; Weckhuysen, B.M.; Beale, A.M. Local environment and nature of Cu active sites in zeolite-based catalysts for the selective catalytic reduction of NOx. ACS Catal. 2013, 3, 413–427. [Google Scholar] [CrossRef]
- Dědeček, J.; Wichterlová, B. Role of hydrated Cu ion complexes and aluminum distribution in the framework on the Cu ion siting in ZSM-5. J. Phys. Chem. B 1997, 101, 10233–10240. [Google Scholar] [CrossRef]
- Costa, P.D.; Modén, B.; Meitzner, G.D.; Lee, D.K.; Iglesia, E. Spectroscopic and chemical characterization of active and inactive Cu species in NO decomposition catalysts based on Cu-ZSM5. Phys. Chem. Chem. Phys. 2002, 4, 4590–4601. [Google Scholar] [CrossRef]
- Henriques, C.; Ribeiro, M.F.; Abreu, C.; Murphy, D.M.; Poignant, F.; Saussey, J.; Lavalley, J.C. An FT-IR study of NO adsorption over Cu-exchanged MFI catalysts: Effect of Si/Al ratio, copper loading and catalyst pre-treatment. Appl. Catal. B 1998, 16, 79–95. [Google Scholar] [CrossRef]
- Hadjiivanov, K.I. Identification of neutral and charged Nx Oy surface species by IR spectroscopy. Catal. Rev. 2000, 42, 71–144. [Google Scholar] [CrossRef]
- Trombetta, M.; Busca, G.; Rossini, S.; Piccoli, V.; Cornaro, U.; Guercio, A.; Catani, R.; Willey, R.J. FT-IR studies on light olefin skeletal isomerization catalysis: III surface acidity and activity of amorphous and crystalline catalysts belonging to the SiO2–Al2O3 system. J. Catal. 1998, 179, 581–596. [Google Scholar] [CrossRef]
- Chakarova, K.; Hadjiivanov, K. FTIR study of N2 and CO adsorption on H-D-FER. Microporous Mesoporous Mater. 2013, 177, 59–65. [Google Scholar] [CrossRef]
- De Ménorval, B.; Ayrault, P.; Gnep, N.S.; Guisnet, M. Mechanism of n-butene skeletal isomerization over HFER zeolites: A new proposal. J. Catal. 2005, 230, 38–51. [Google Scholar] [CrossRef]
- Fritz, P.O.; Lunsford, J.H. The effect of sodium poisoning on dealuminated Y-type zeolites. J. Catal. 1989, 118, 85–98. [Google Scholar] [CrossRef]
- Datka, J.; Gil, B.; Kubacka, A. Acid properties of NaH-mordenites: Infrared spectroscopic studies of ammonia sorption. Zeolites 1995, 15, 501–506. [Google Scholar] [CrossRef]
- Kosslick, H.; Berndt, H.; Lanh, H.D.; Martin, A.; Miessner, H.; Tuan, V.A.; Jänchen, J. Acid properties of ZSM-20-type zeolite. J. Chem. Soc. Faraday Trans. 1994, 90, 2837. [Google Scholar] [CrossRef]
- Elzey, S.; Mubayi, A.; Larsen, S.C.; Grassian, V.H. FTIR study of the selective catalytic reduction of NO2 with ammonia on nanocrystalline NaY and CuY. J. Mol. Catal. A 2008, 285, 48–57. [Google Scholar] [CrossRef]
- Poignant, F.; Saussey, J.; Lavalley, J.-C.; Mabilon, G. In situ FT-IR study of NH3 formation during the reduction of NOx with propane on H/Cu-ZSM-5 in excess oxygen. Catal. Today 1996, 29, 93–97. [Google Scholar] [CrossRef]
- Poignant, F.; Saussey, J.; Lavalley, J.-C.; Mabilon, G. NH3 formation during the reduction of nitrogen monoxide by propane on H–Cu–ZSM-5 in excess oxygen. J. Chem. Soc. Chem. Commun. 1995, 89–90. [Google Scholar] [CrossRef]
- Can, F.; Travert, A.; Ruaux, V.; Gilson, J.-P.; Maugé, F.; Hu, R.; Wormsbecher, R.F. FCC gasoline sulfur reduction additives: Mechanism and active sites. J. Catal. 2007, 249, 79–92. [Google Scholar] [CrossRef]
- Ajmal, M.; Hussain Khan, A.; Ahmad, S.; Ahmad, A. Role of sawdust in the removal of copper(II) from industrial wastes. Water Res. 1998, 32, 3085–3091. [Google Scholar] [CrossRef]
- Wichterlová, B.; Tvarůžková, Z.; Sobalı́k, Z.; Sarv, P. Determination and properties of acid sites in H-ferrierite: A comparison of ferrierite and MFI structures. Microporous Mesoporous Mater. 1998, 24, 223–233. [Google Scholar] [CrossRef]

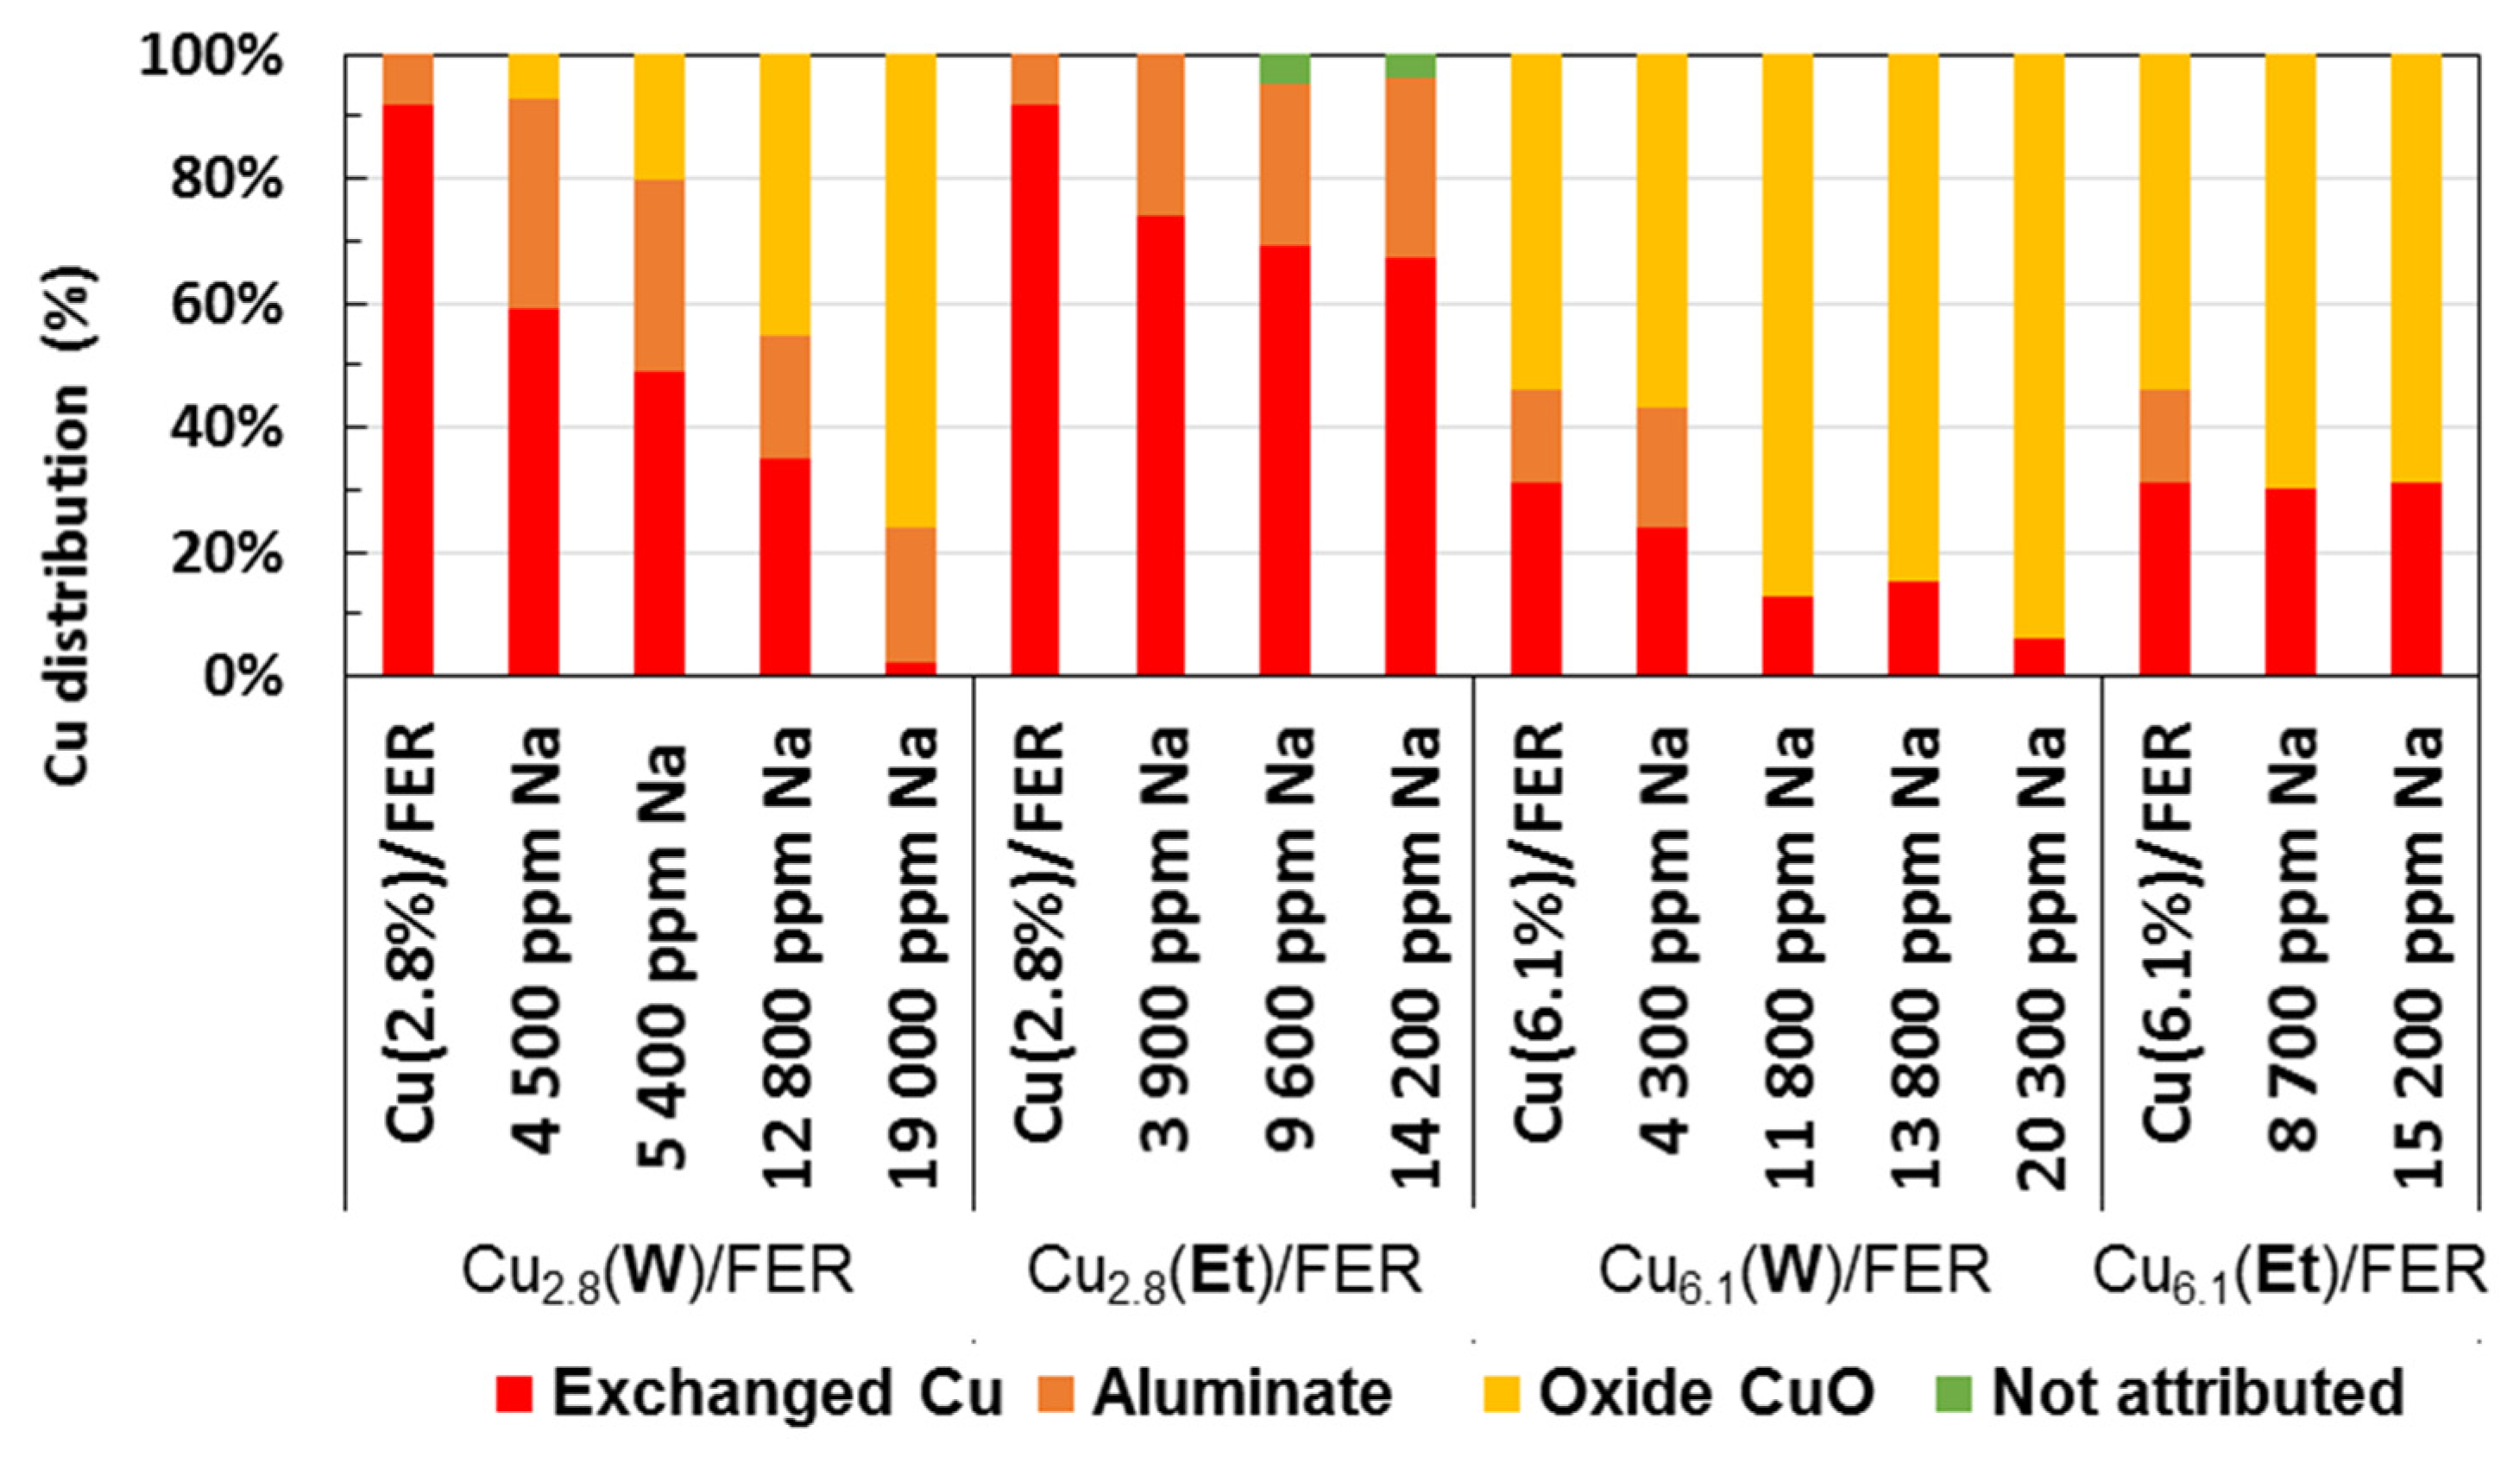
 ): exchanged Cu; (
  ): aluminate Cu; (
  ): oxide Cu; (
  ): no attributed.
): exchanged Cu; ( ): aluminate Cu; ( ): oxide Cu; ( ): no attributed.
): no attributed.
): exchanged Cu; ( ): aluminate Cu; ( ): oxide Cu; ( ): no attributed.
 : Cu2.8(Et)/FER; ⚪: Cu6.1(W)/FER;
  : Cu6.1(Et)/FER.
: Cu2.8(Et)/FER; ⚪: Cu6.1(W)/FER; : Cu6.1(Et)/FER.
: Cu6.1(Et)/FER.
: Cu2.8(Et)/FER; ⚪: Cu6.1(W)/FER; : Cu6.1(Et)/FER.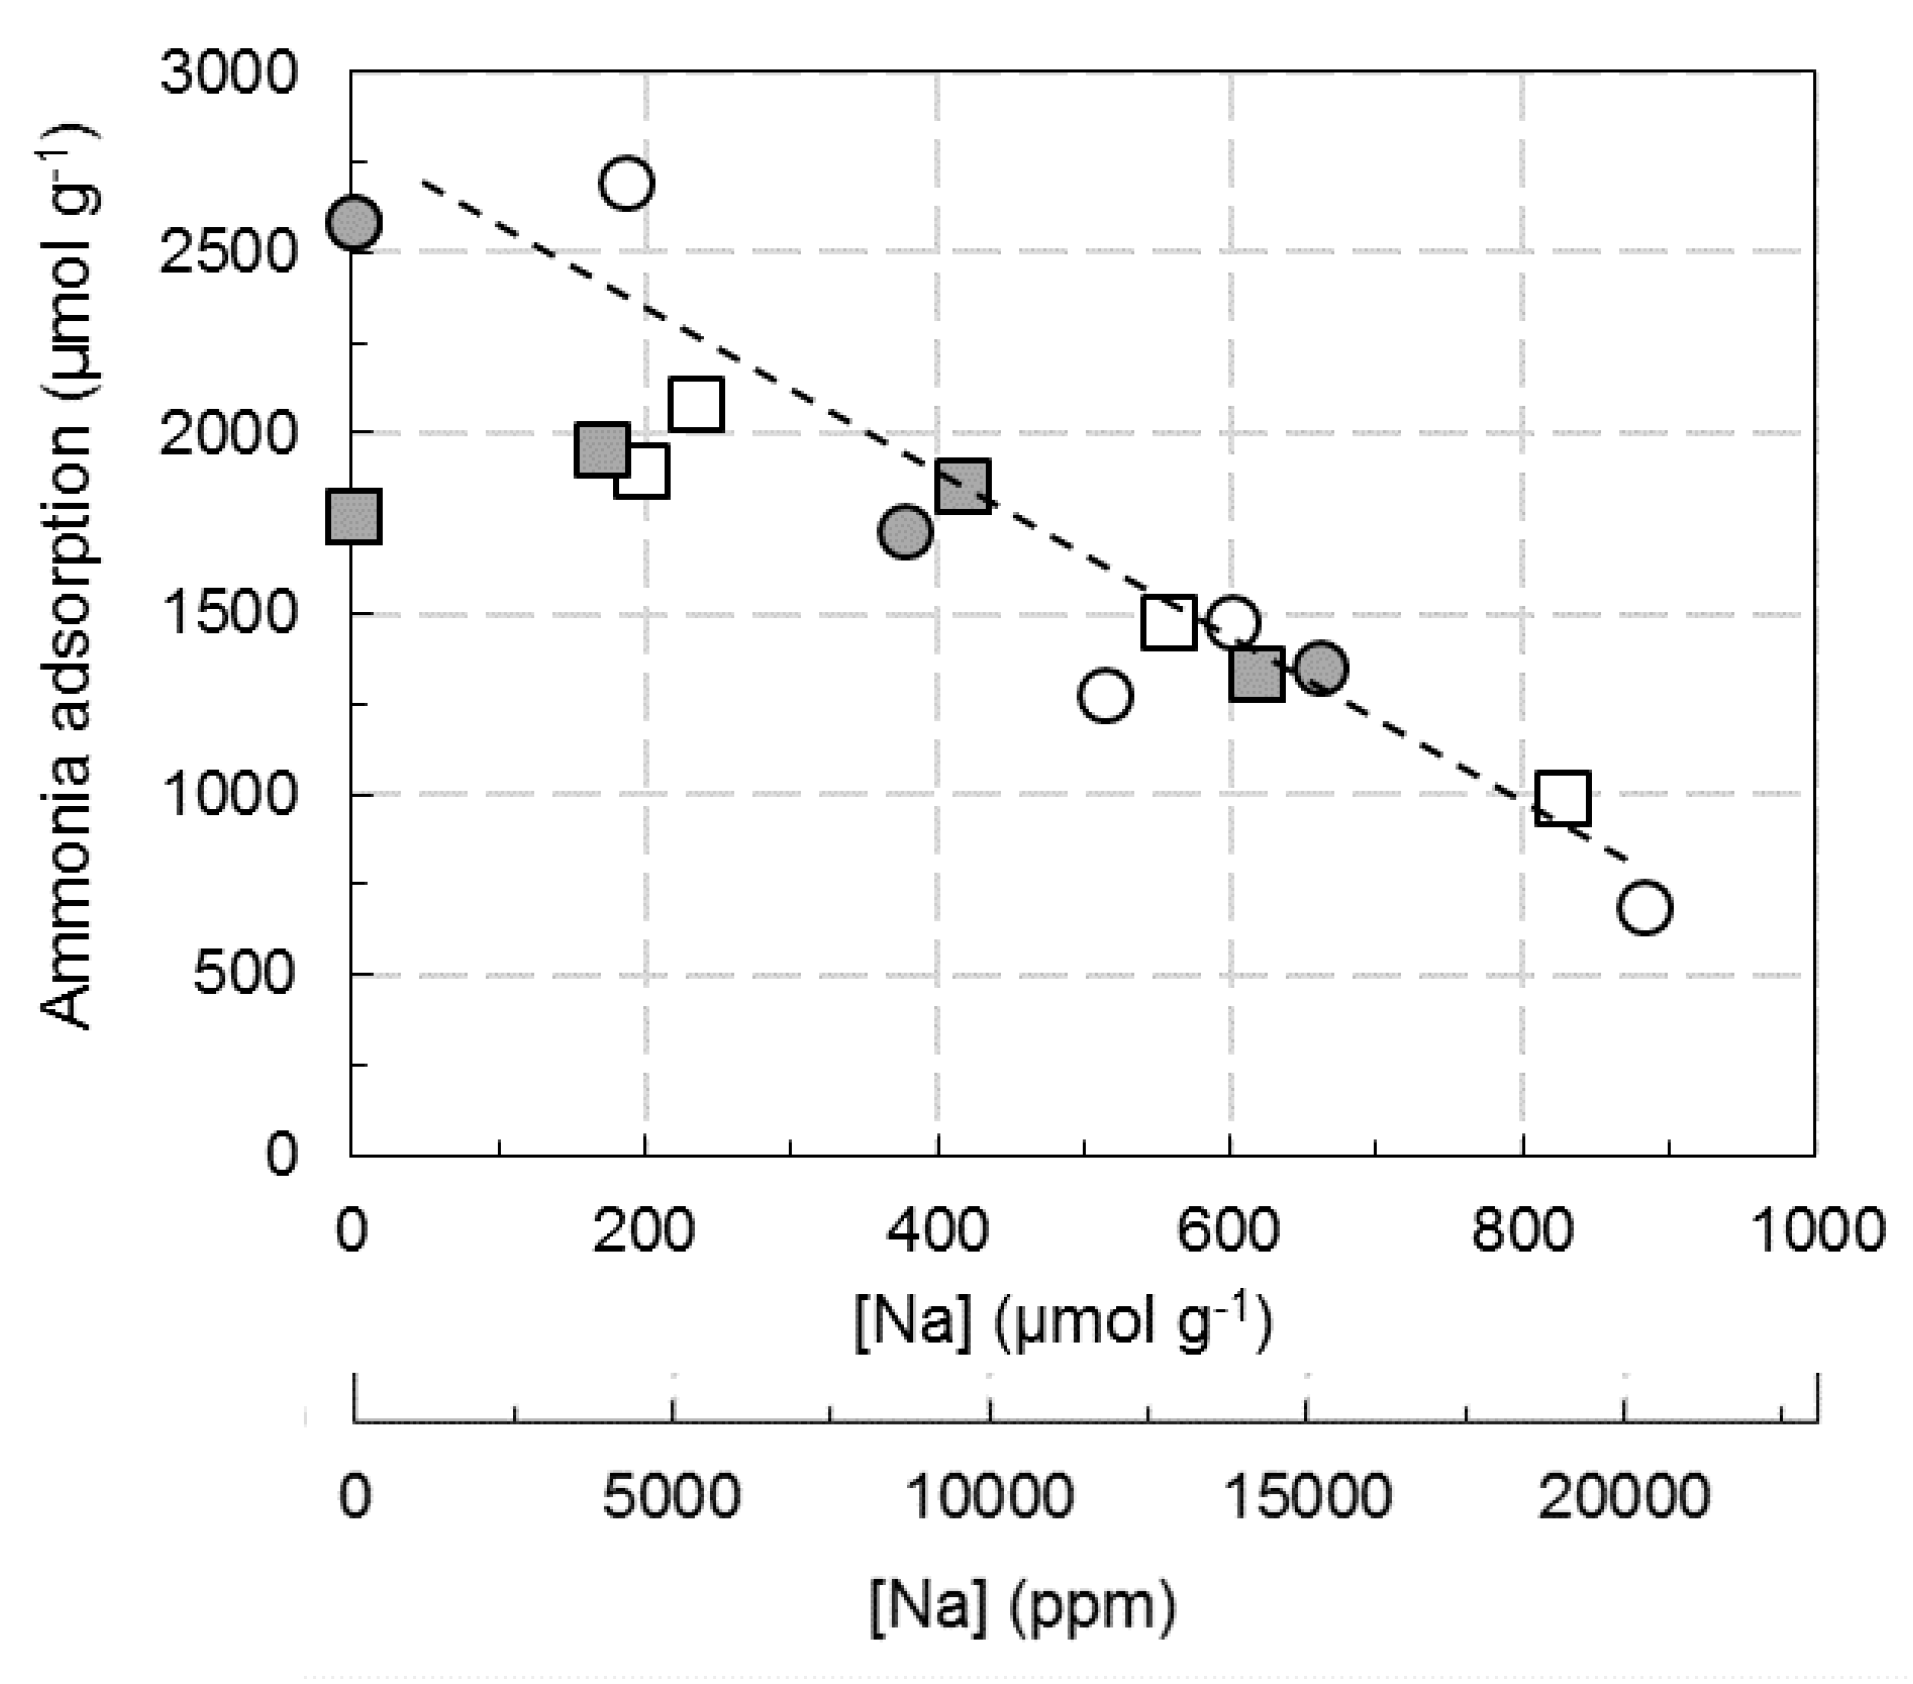 : Cu2.8(Et)/FER; ⚪: Cu6.1(W)/FER; : Cu6.1(Et)/FER.
: Cu2.8(Et)/FER; ⚪: Cu6.1(W)/FER; : Cu6.1(Et)/FER.
: Cu2.8(Et)/FER; ⚪: Cu6.1(W)/FER; : Cu6.1(Et)/FER.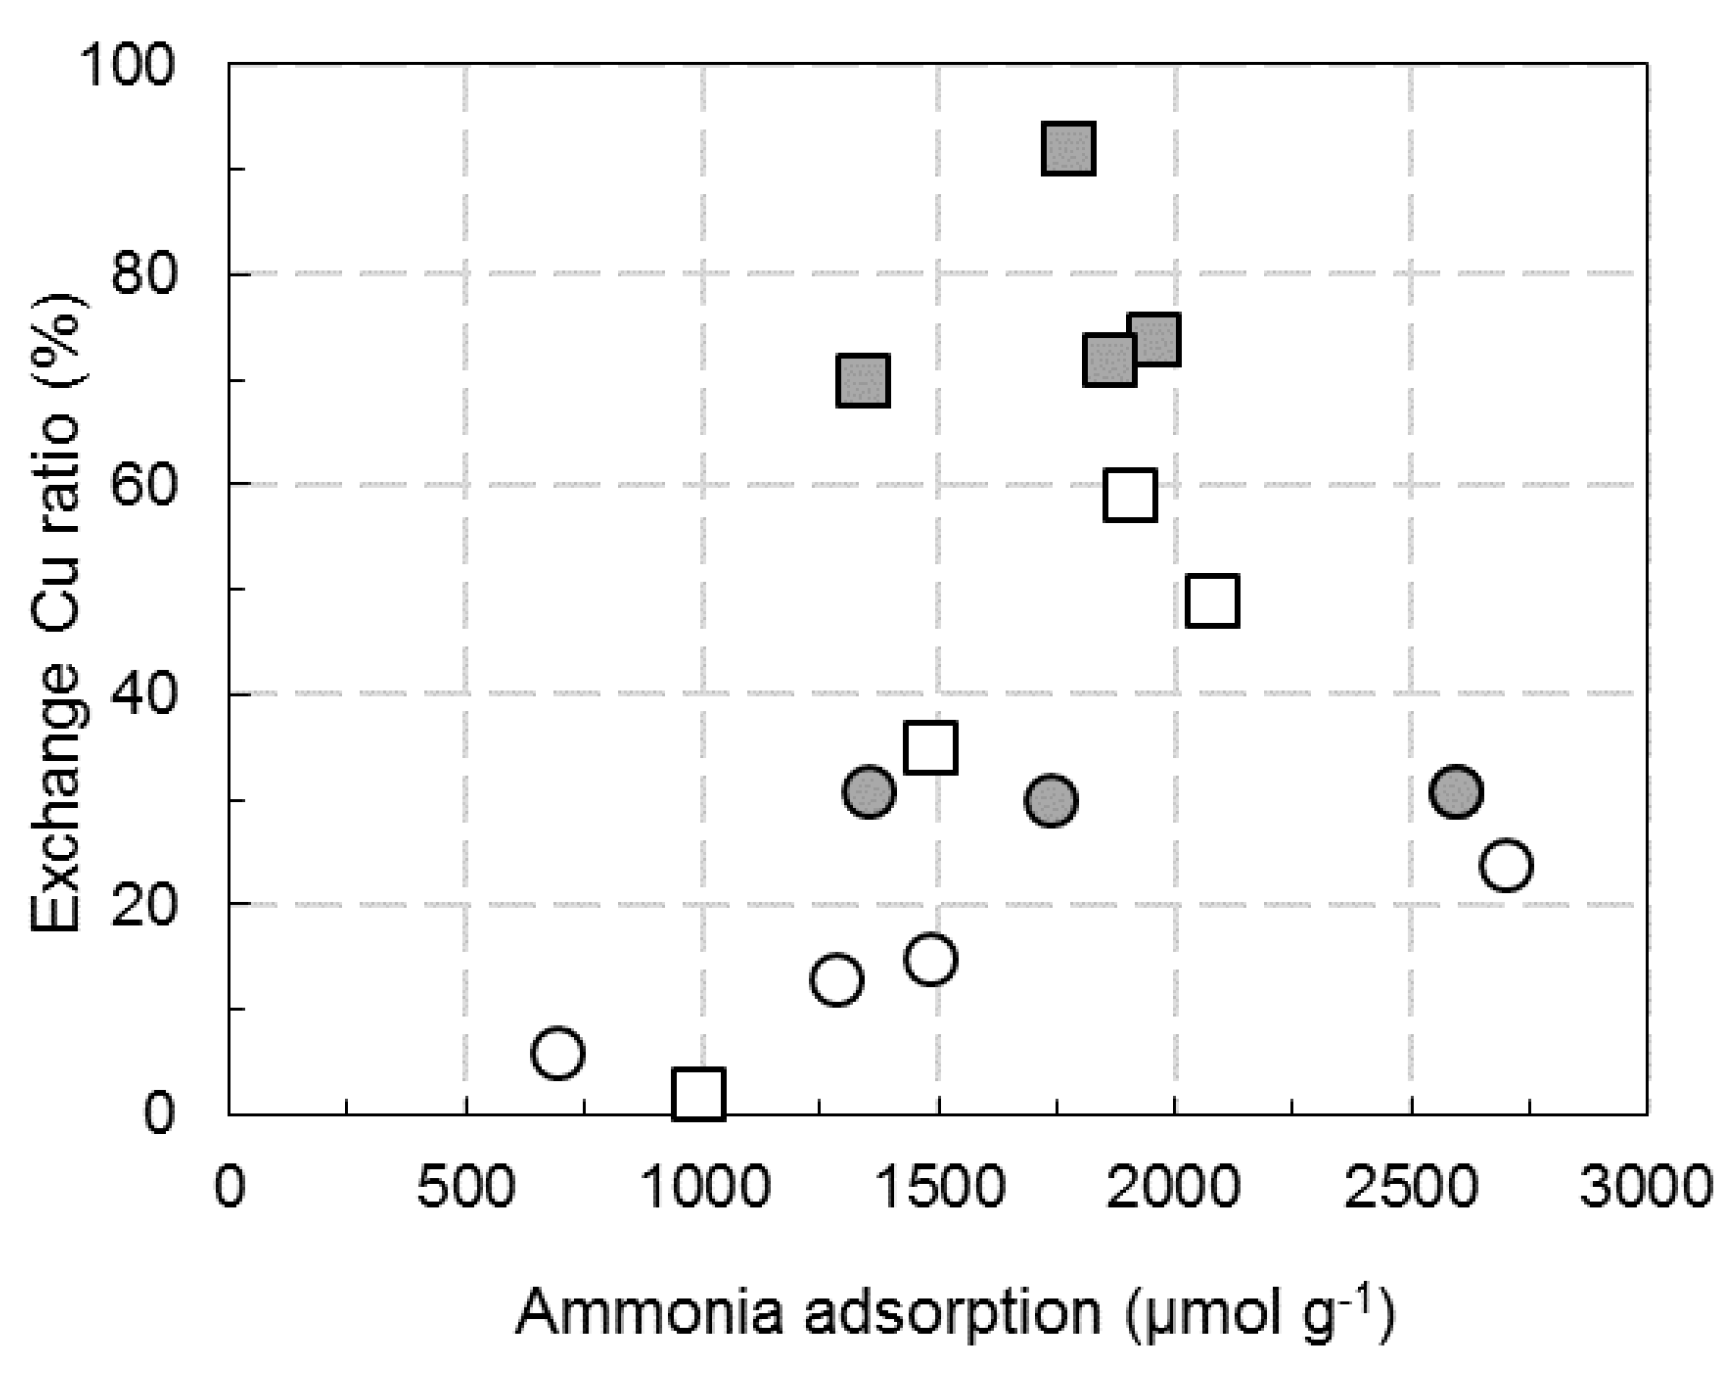
 ,
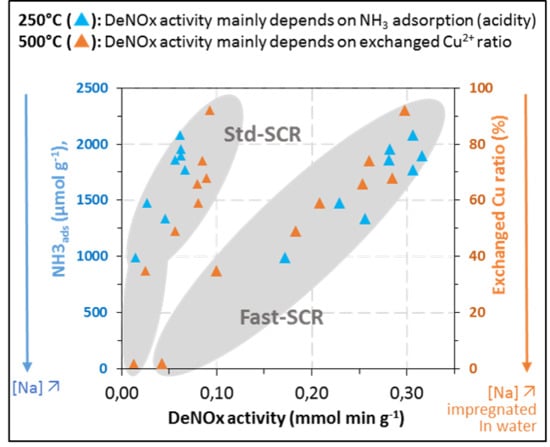
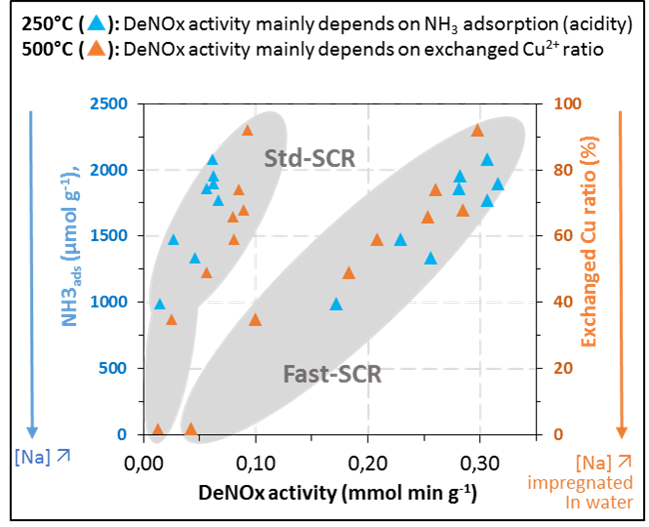
,  ) and Cu6.1/FER (⚪, △) catalysts in the relationship between deNOx activity in Standard-SCR (⚪) and Fast-SCR (△) and exchanged Cu ((A) 250 °C; (C) 500 °C) or ammonia adsorption ((B) 250 °C, (D) 500 °C).
, ) and Cu6.1/FER (⚪, △) catalysts in the relationship between deNOx activity in Standard-SCR (⚪) and Fast-SCR (△) and exchanged Cu ((A) 250 °C; (C) 500 °C) or ammonia adsorption ((B) 250 °C, (D) 500 °C).
) and Cu6.1/FER (⚪, △) catalysts in the relationship between deNOx activity in Standard-SCR (⚪) and Fast-SCR (△) and exchanged Cu ((A) 250 °C; (C) 500 °C) or ammonia adsorption ((B) 250 °C, (D) 500 °C).
, ) and Cu6.1/FER (⚪, △) catalysts in the relationship between deNOx activity in Standard-SCR (⚪) and Fast-SCR (△) and exchanged Cu ((A) 250 °C; (C) 500 °C) or ammonia adsorption ((B) 250 °C, (D) 500 °C).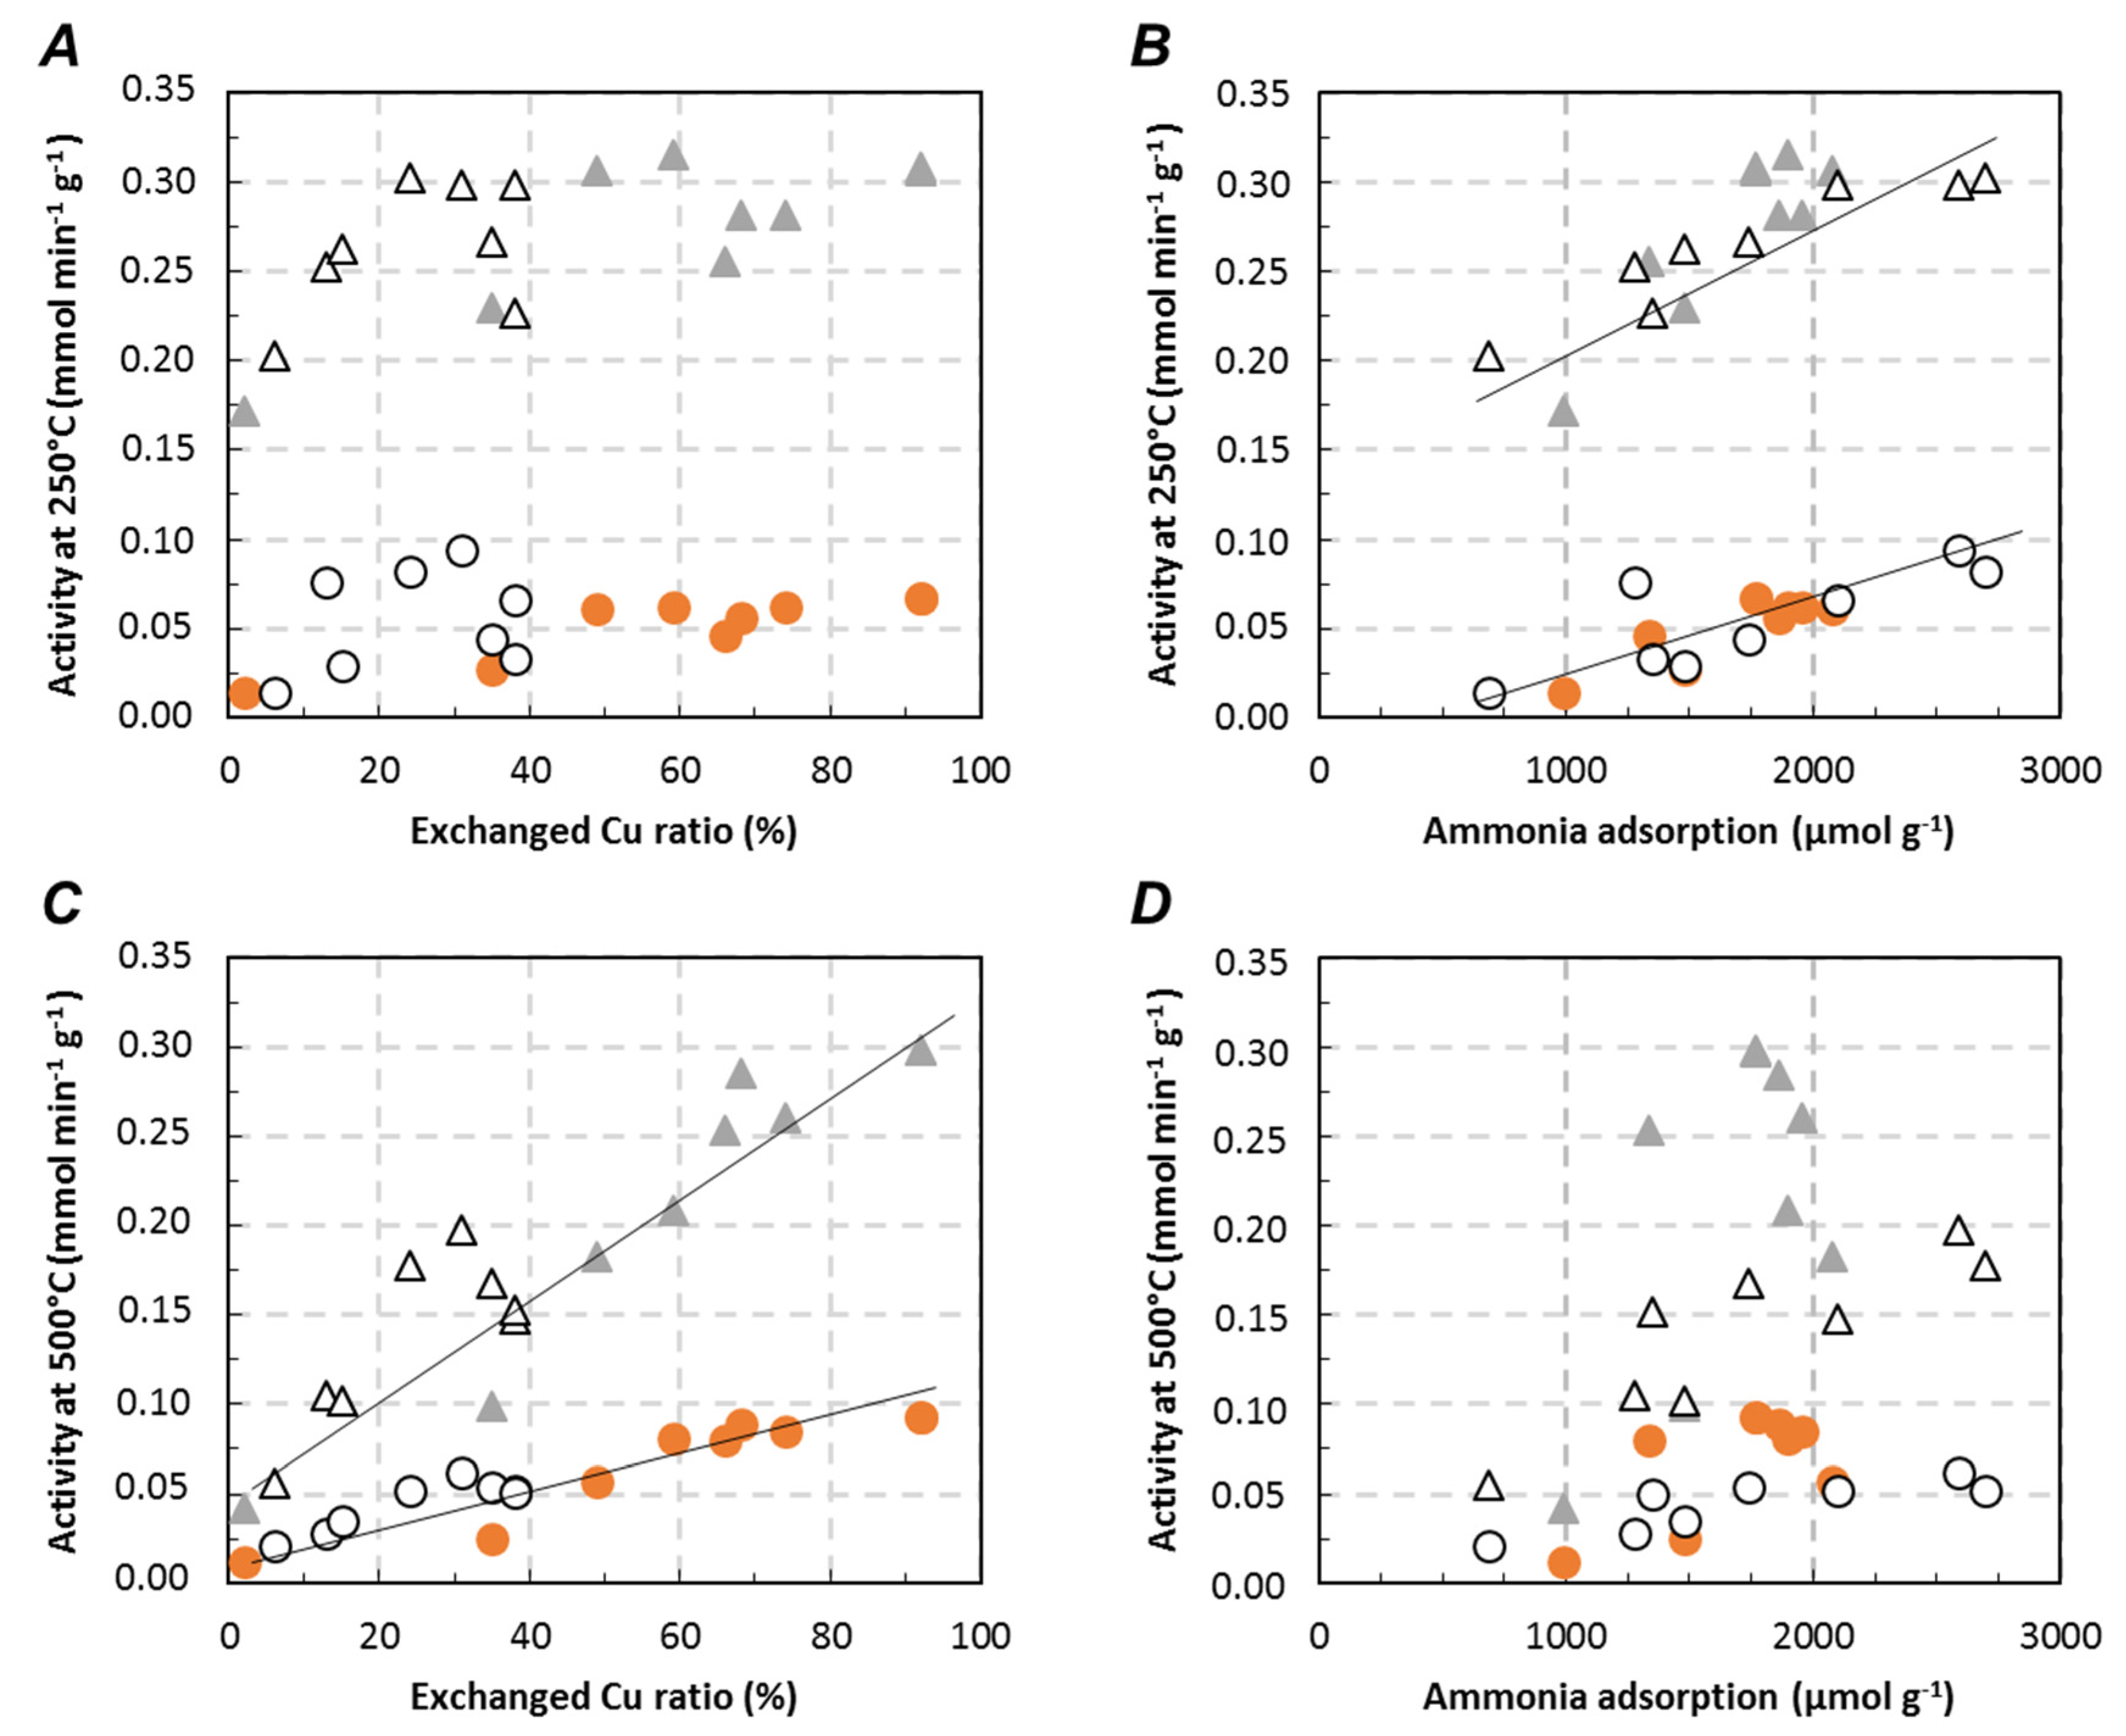

| [Cu] (wt. %) | nCu/nAl | Na Impregn Solvent | [Na] (ppm/µmol g−1) | nNa/nAl | SBET (m2 g−1) | Vµ (i) (cm3 g−1) | Vtotal (ii) (cm3 g−1) | H2-TPR (nH2/nCu) | L:B (iii) |
|---|---|---|---|---|---|---|---|---|---|
| 2.8 (Cu2.8/FER) | 0.30 | Na free sample | 0 | 0 | 352 | 0.12 | 0.22 | 1.02 | 83:17 |
| Water (W) | 4500/195 | 0.13 | 0.98 | 91:9 | |||||
| 5400/235 | 0.16 | 1.00 | 96:4 | ||||||
| 12,800/560 | 0.37 | 1.03 | 100:0 | ||||||
| 19,000/830 | 0.56 | 270 | 0.11 | 0.17 | 1.04 | 100:0 | |||
| Ethanol (Et) | 3900/170 | 0.11 | 1.05 | 91:9 | |||||
| 9600/420 | 0.28 | 1.02 | 89:11 | ||||||
| 14,200/620 | 0.41 | 238 | 0.06 | 0.17 | 1.10 | 92:8 | |||
| 6.1 (Cu6.1/FER) | 0.67 | Na free sample | 0 | 0 | 352 | 0.12 | 0.23 | 1.03 | 96:4 |
| Water (W) | 4300/190 | 0.12 | 1.03 | 97:3 | |||||
| 11,800/515 | 0.34 | 1.02 | 100:0 | ||||||
| 13,800/600 | 0.40 | 1.08 | 100:0 | ||||||
| 20,300/885 | 0.59 | 265 | 0.09 | 0.16 | 1.02 | 100:0 | |||
| Ethanol Et) | 8700/380 | 0.25 | 1.06 | 98:2 | |||||
| 15,200/665 | 0.44 | 251 | 0.09 | 0.15 | 0.96 | 99:1 |
© 2017 by the authors. Licensee MDPI, Basel, Switzerland. This article is an open access article distributed under the terms and conditions of the Creative Commons Attribution (CC BY) license (http://creativecommons.org/licenses/by/4.0/).
Share and Cite
Tarot, M.-L.; Barreau, M.; Duprez, D.; Lauga, V.; Iojoiu, E.E.; Courtois, X.; Can, F. Influence of the Sodium Impregnation Solvent on the Deactivation of Cu/FER-Exchanged Zeolites Dedicated to the SCR of NOx with NH3. Catalysts 2018, 8, 3. https://doi.org/10.3390/catal8010003
Tarot M-L, Barreau M, Duprez D, Lauga V, Iojoiu EE, Courtois X, Can F. Influence of the Sodium Impregnation Solvent on the Deactivation of Cu/FER-Exchanged Zeolites Dedicated to the SCR of NOx with NH3. Catalysts. 2018; 8(1):3. https://doi.org/10.3390/catal8010003
Chicago/Turabian StyleTarot, Marie-Laure, Mathias Barreau, Daniel Duprez, Vincent Lauga, Eduard Emil Iojoiu, Xavier Courtois, and Fabien Can. 2018. "Influence of the Sodium Impregnation Solvent on the Deactivation of Cu/FER-Exchanged Zeolites Dedicated to the SCR of NOx with NH3" Catalysts 8, no. 1: 3. https://doi.org/10.3390/catal8010003
APA StyleTarot, M.-L., Barreau, M., Duprez, D., Lauga, V., Iojoiu, E. E., Courtois, X., & Can, F. (2018). Influence of the Sodium Impregnation Solvent on the Deactivation of Cu/FER-Exchanged Zeolites Dedicated to the SCR of NOx with NH3. Catalysts, 8(1), 3. https://doi.org/10.3390/catal8010003