Article

Effect of Water Clustering on the Activity of Candida antarctica Lipase B in Organic Medium

by
Sindrila Dutta Banik
1,
Mathias Nordblad
2,
John M. Woodley
2,* and
Günther H. Peters
1,*
1
Department of Chemistry, Technical University of Denmark, Building 207, 2800 Kgs, Lyngby, Denmark
2
Department of Chemical and Biochemical Engineering, Technical University of Denmark, Building 229, 2800 Kgs, Lyngby, Denmark
*
Authors to whom correspondence should be addressed.
Catalysts 2017, 7(8), 227; https://doi.org/10.3390/catal7080227
Submission received: 10 July 2017 / Revised: 21 July 2017 / Accepted: 25 July 2017 / Published: 29 July 2017

Abstract

:
The effect of initial water activity of MTBE (methyl tert-butyl ether) medium on CALB (Candida antarctica lipase B) catalyzed esterification reaction is investigated using experimental methods and classical molecular dynamics (MD) simulations. The experimental kinetic studies show that the initial reaction rate of CALB-catalyzed esterification reaction between butyric acid and ethanol decreases with increasing initial water activity of the medium. The highest rate of esterification is observed at the lowest water activity studied. MD simulations were performed to gain a molecular insight on the effect of initial water activity on the rate of CALB-catalyzed reaction. Our results show that hydration has an insignificant effect on the structure and flexibility of CALB. Rather, it appears that water molecules bind to certain regions (“hot spots”) on the CALB surface and form clusters. The size of the water clusters at these hot spot regions gradually increase and expand with increasing water activity. Consequently, the surface area of CALB covered by the water molecules also increases. Specifically, our results indicate that a particular water cluster located close to the active site partially cover the binding pocket of substrate at high water activity. As a consequence, the effective concentration of substrate at the catalytic site decreases. Therefore, the reaction rate slows down with increasing water activity, which correlates well with the observed decrease in the experimentally determined initial reaction rate.

1. Introduction

Organic solvents are nowadays broadly used as a reaction medium for enzyme-catalyzed reactions due to several well-documented advantages such as increasing thermostability of enzymes, limiting side reactions with water, eliminating microbial contamination and shifting the thermodynamic equilibrium in favor of synthesis over hydrolysis [1,2,3,4]. Nevertheless, for some time it has been recognized that the water content of the medium significantly influences the enzyme activity in a non-aqueous medium. Water molecules act as a lubricant for the protein in a non-aqueous medium. Dry enzymes are usually very rigid and addition of a small amount of water (molecules which are mostly associated with the enzyme surface due to limited miscibility with the organic solvent) increases the flexibility of the enzyme in low dielectric solvents. While high water content in the organic medium has generally a decremental effect on enzyme activity. In this way, there exists a delicate balance between having the necessary amount of water to ensure protein flexibility and an excess of water that might lead to conformational changes of the protein resulting negatively affect enzyme activity [5,6].
Several studies have shown that the precise optimal water activity (aw) corresponding to the highest enzyme activity depends on several factors such as enzyme structure, reaction medium, type of enzyme-catalyzed reaction and enzyme formulation. Valivety and co-workers found that lipases with a high degree of sequence homology showed similar activity at a given aw [7]. The optimal water activity for esterification reactions of lipases from Candida rugosa and Candida antarctica in hexane medium (0.53 and 0.75; respectively) differs due to the structural differences between these two enzymes [8]. Hydrolysis of lutein diesters catalyzed by lipase B from Candida antarctica (CALB) and lipase from Mucor miehei is favored at low water activity (<0.2) due to the accumulation of water molecules at the enzyme surface which is independent of the nature of solvent considered in the study(isooctane, toluene, supercritical CO2) [9]. The role of water molecules becomes crucial for the hydrolysis at high water activity, where water molecules adsorbed to the protein surface create hydrophilic microenvironments, which prevent the diffusion of substrate (i.e. ester) molecules to the catalyst resulting in a decrease in enzyme activity [9]. For example, Watanabe and co-workers showed that the equilibrium conversion for the CALB-catalyzed condensation of mannose and lauric acid in four different organic solvents (acetonitrile, acetone, 2-methyl-2-propanol, 2-methyl-2butanol) is higher at lower initial water content [10]. Likewise, the initial reaction rate of the CALB-catalyzed fructose palmitate synthesis decreases with increasing aw in 2-methyl 2-butanol [11]. Since one of the products of condensation is water, according to Le Chatelier’s principle, there may be an increase in hydrolysis of acyl-enzyme complex at high water activity, which results in a decrease of ester synthesis [10]. Similarly, the initial rate of a CALB-catalyzed transesterification reaction is maximum when the water activity is lower than 0.1 in 2-methyl-2-butanol [12]. Although it appears that low water activity is required to ensure a relatively high initial rate, there exist exceptions. For instance, the yield of mono-laurate ester catalyzed by the CALB-displaying Pichia pastoris whole-cell biocatalyst is favored at low water activity, while the trend is different for di-ester synthesis [13].
The interplay between water activity and initial rate becomes even more complex when considering different enzyme formulations. For instance, Secundo and coworkers [14] studied the transesterification reaction of vinylacetate and 1-octanol in toluene, carbon tetrachloride and 1,4-dioxane using different formulations of CALB. The authors compared soluble CALB, CALB lyophilized with either polyethylene glycol or oleic acid and Novozyme 435 (CALB immobilized on acrylic resin). The authors showed that for soluble CALB, the transesterification activity increases with increasing aw, whereas the transesterification activity of the lyophilized CALBs and Novozyme 435 decrease with increasing water activity [14]. Even though there is a vast amount of experimental data, the molecular interpretation of the effects of initial aw of the organic medium on enzyme-catalyzed reactions is limited and therefore it is still a topic of ongoing debate.
The current study is motivated by our previous work, where we have investigated the structure and activity of CALB in different organic media: hexane (HEX), methyl tert-butyl ether (MTBE), tert-butyl alcohol (TBU) and acetonitrile (ACN) at a fixed initial aw of 0.5 [15]. We considered the model enzymatic reaction of the ethyl butyrate synthesis from butyric acid and ethanol [16,17] using a complementary approach that combined experimental and molecular dynamics (MD) simulations. This study provided us with the framework of the current investigation, since we could identify a key parameter from simulations and successfully correlate the enzymatic activity with the free energy of binding of substrate/solvent molecules in the active site of CALB. The focus of the study was to explore the effect of physicochemical properties of solvent on the CALB-catalyzed reaction. The results showed that solvent molecules can act as inhibitors. In particular, TBU as a hydrogen donor/acceptor is prone to bind strongly to the CALB active site and consequently the enzymatic activity decreases. While HEX and MTBE do not bind in the active site of enzyme, the enzyme acts more efficiently in these solvents. However, as discussed above, enzyme activity in a particular organic solvent depends on several factors including water content in the organic medium. Therefore, to address this point, we present here results that provide a molecular insight how initial water activity of MTBE (extensively used in the industry) affects the catalytic activity of CALB employing an interdisciplinary approach that combines experimental techniques and MD simulations.

2. Results and Discussion

The current student focusses on the esterification reaction between ethanol and butyric acid catalyzed by CALB. The reactions were performed in MTBE at different fixed initial water activities. Particularly, we were interested in obtaining a molecular understanding of the interplay between initial water activity and initial rate of the CALB-catalyzed esterification reaction. To achieve this goal, we chose an interdisciplinary approach that combines expertise in enzyme kinetics and biophysics. Experiments were performed to determine the specific activities, and MD simulations were carried out to study structural properties of CALB and adsorption behavior of water and substrate molecules to the enzyme surface at different physicochemical conditions.

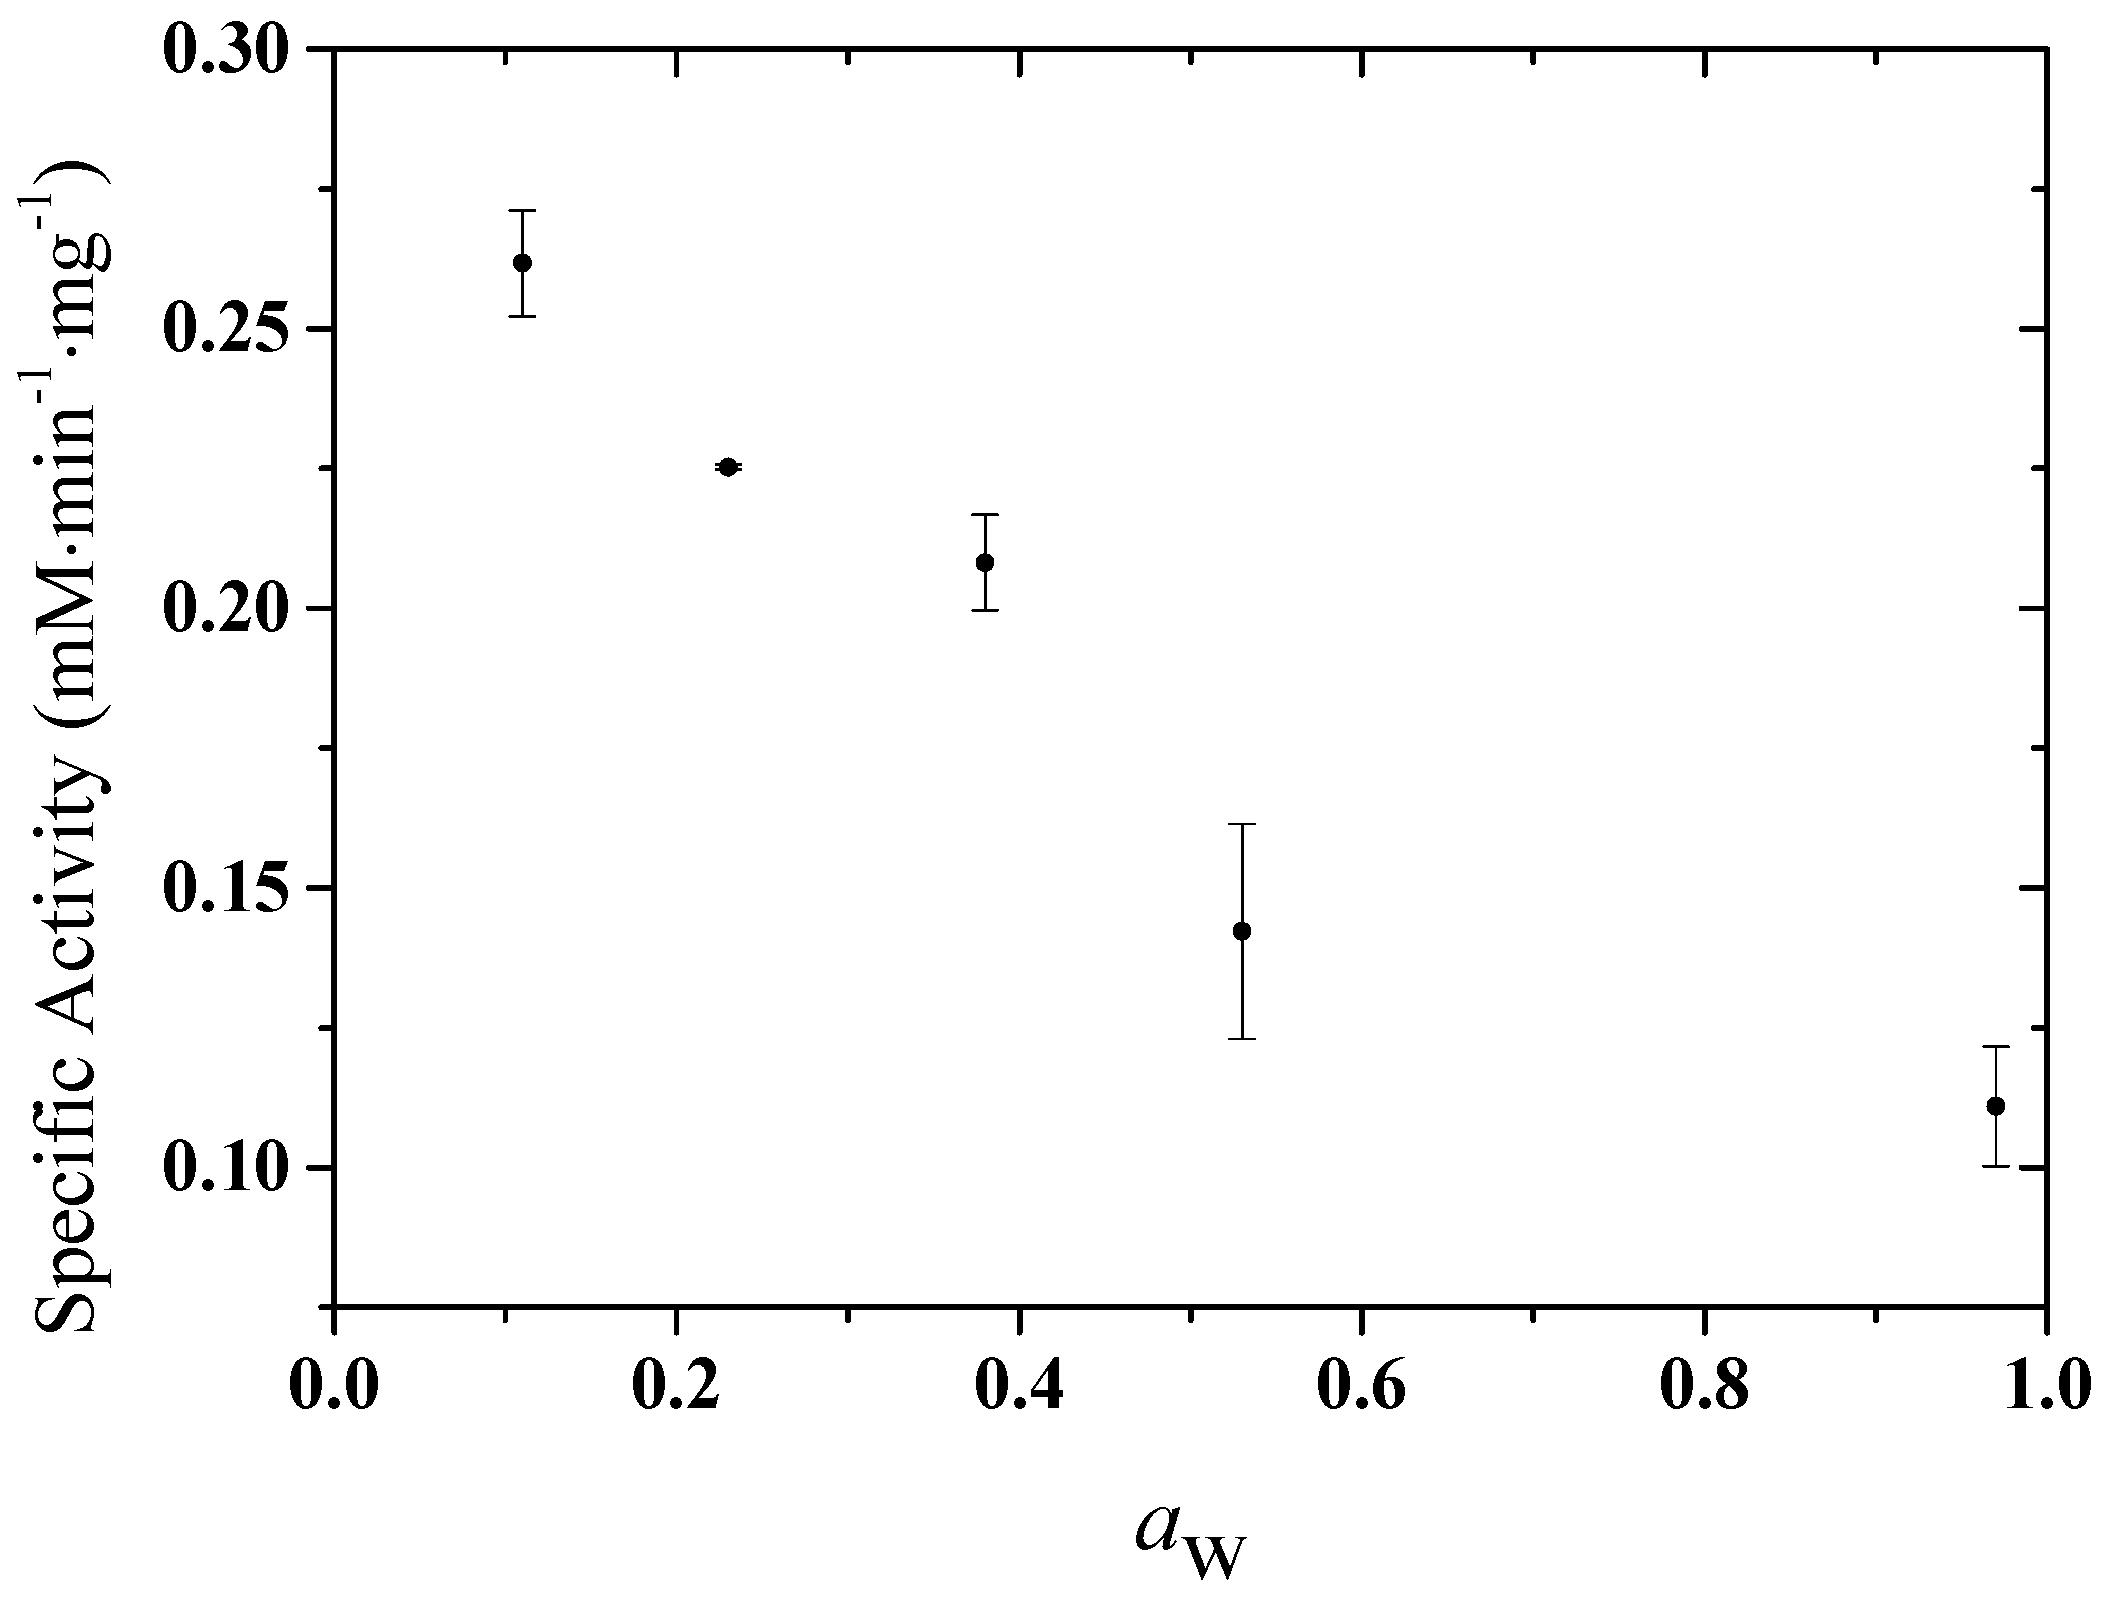
2.1. Experimental Results

The synthesis of ethyl butyrate was investigated as a model reaction system using immobilized CALB (Novozyme 435) in MTBE at different water activities. In a series of experiments, we measured the initial reaction rate of the esterification at initial controlled water activities from 0.1 up to 0.9 and determined the specific activity from the measured initial reaction rate by dividing the rate by the amount of catalyst used. As one of the products of esterification reaction is water, aw of the medium during the reaction increases. To allow for a fixed reference of the water activity, we have reported the dependency of initial reaction rate on the initial aw of the medium. The results shown in Figure 1 and listed in Table 1, exhibit that the catalytic activity gradually decreases with increasing initial aw of the organic medium. Since one of the products is water, according to Le Chatelier’s principle, we reasoned that at higher water activity the equilibrium of the reaction will shift towards the hydrolysis (to adjust the effect of change in water activity), and the observed conversion to ester will be lower. However, the decline in the initial reaction rate with increasing water activity cannot be explained by the Le Chatelier’s principle since it predicts changes in concentrations when an equilibrium is disturbed by changing the reaction conditions, which relates to the yield of the reaction.
Rather, the decrease in initial reaction rate might be explained by other factors such as structural changes to CALB in the presence of water molecules, binding of water molecules on the CALB surface (CALBsurface) and/or diffusional limitations of substrate molecules to the active site region of CALB. Such arguments are based on previous reports, where for example, the hydration has a noticeable effect on the stability and flexibility of ubiquitin and cutinase in a non-aqueous medium [5]. At an optimal water activity, the protein structure becomes more native-like which in turn can explain the experimentally observed bell-shaped dependence of the enzymatic rate with varying water activity. Additionally, the optimal water activity also provides the conditions for the stabilization of one enantiomer over another to maximize the enantioselectivity of the enzyme [18]. The water molecules can form large clusters and bind to certain preferred sites or regions on the enzyme surface [19]. Alternatively, the water molecules can form a monolayer surrounding the biocatalyst particles that can prevent substrate molecules from coming into close contact with the enzyme, resulting in low enzymatic activity [9]. To understand the present scenario at a molecular level, we carried out MD simulations, and the results are described in the section below.

2.2. Computational Results
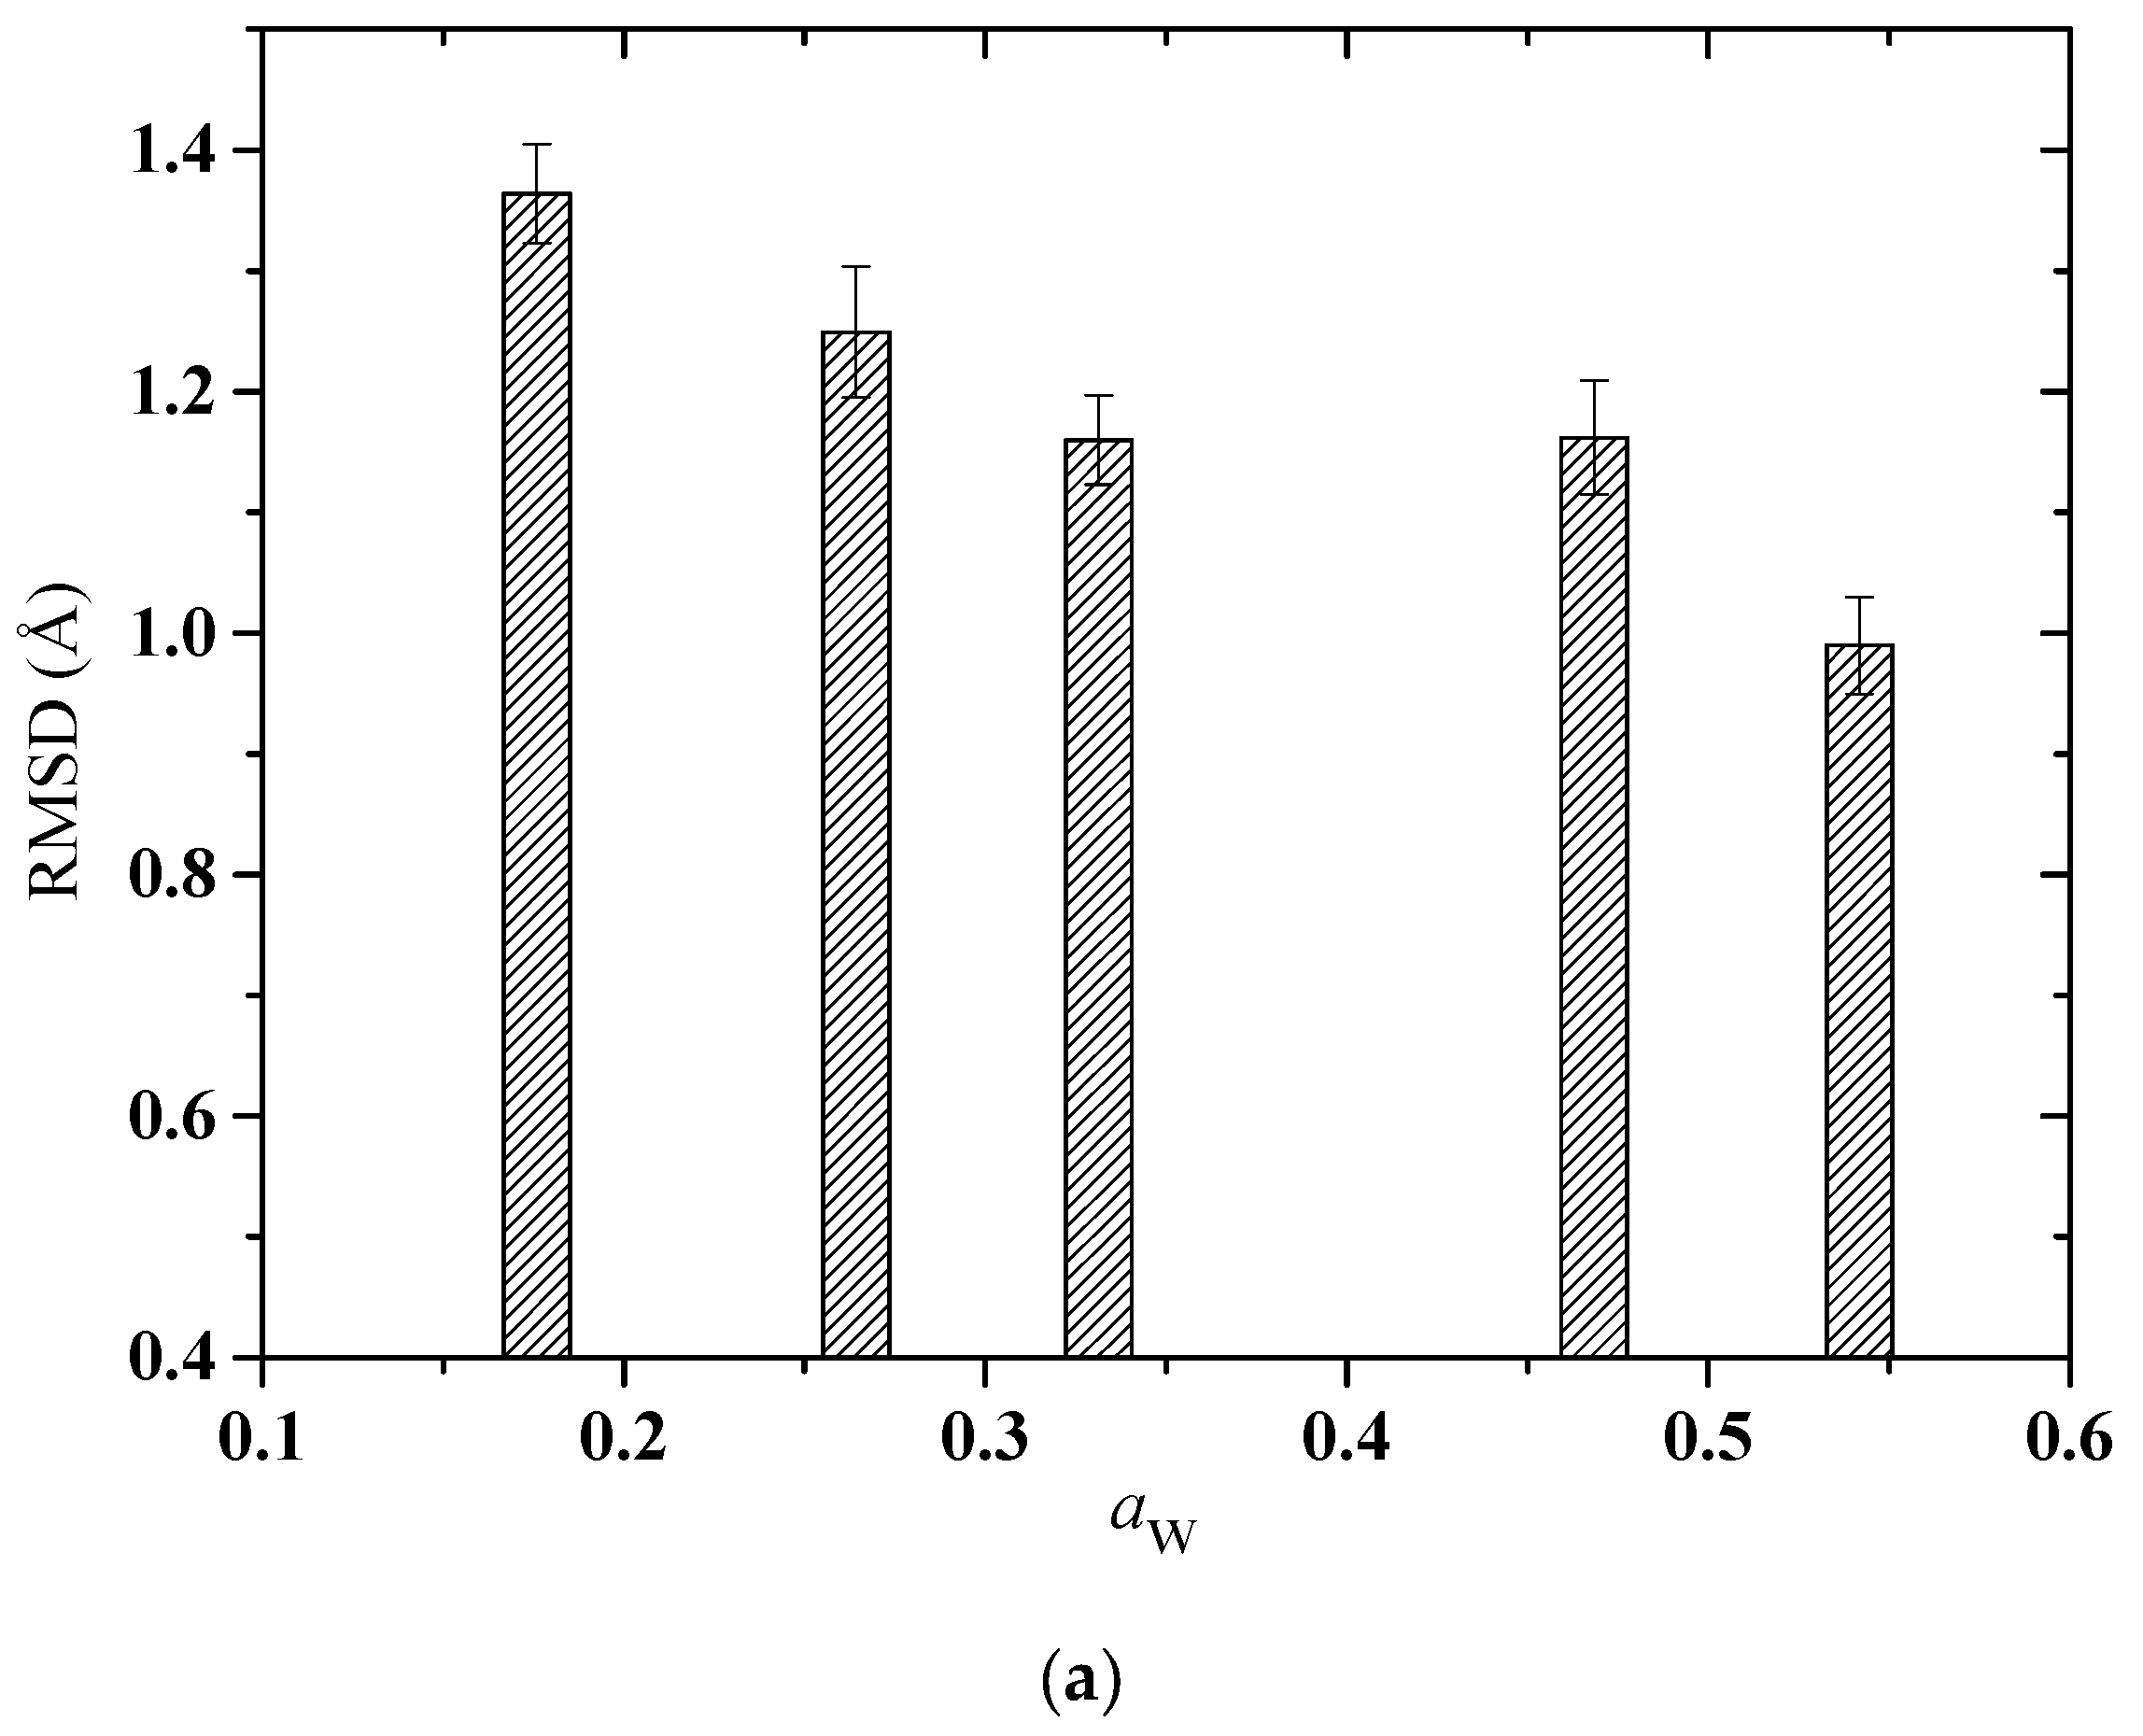
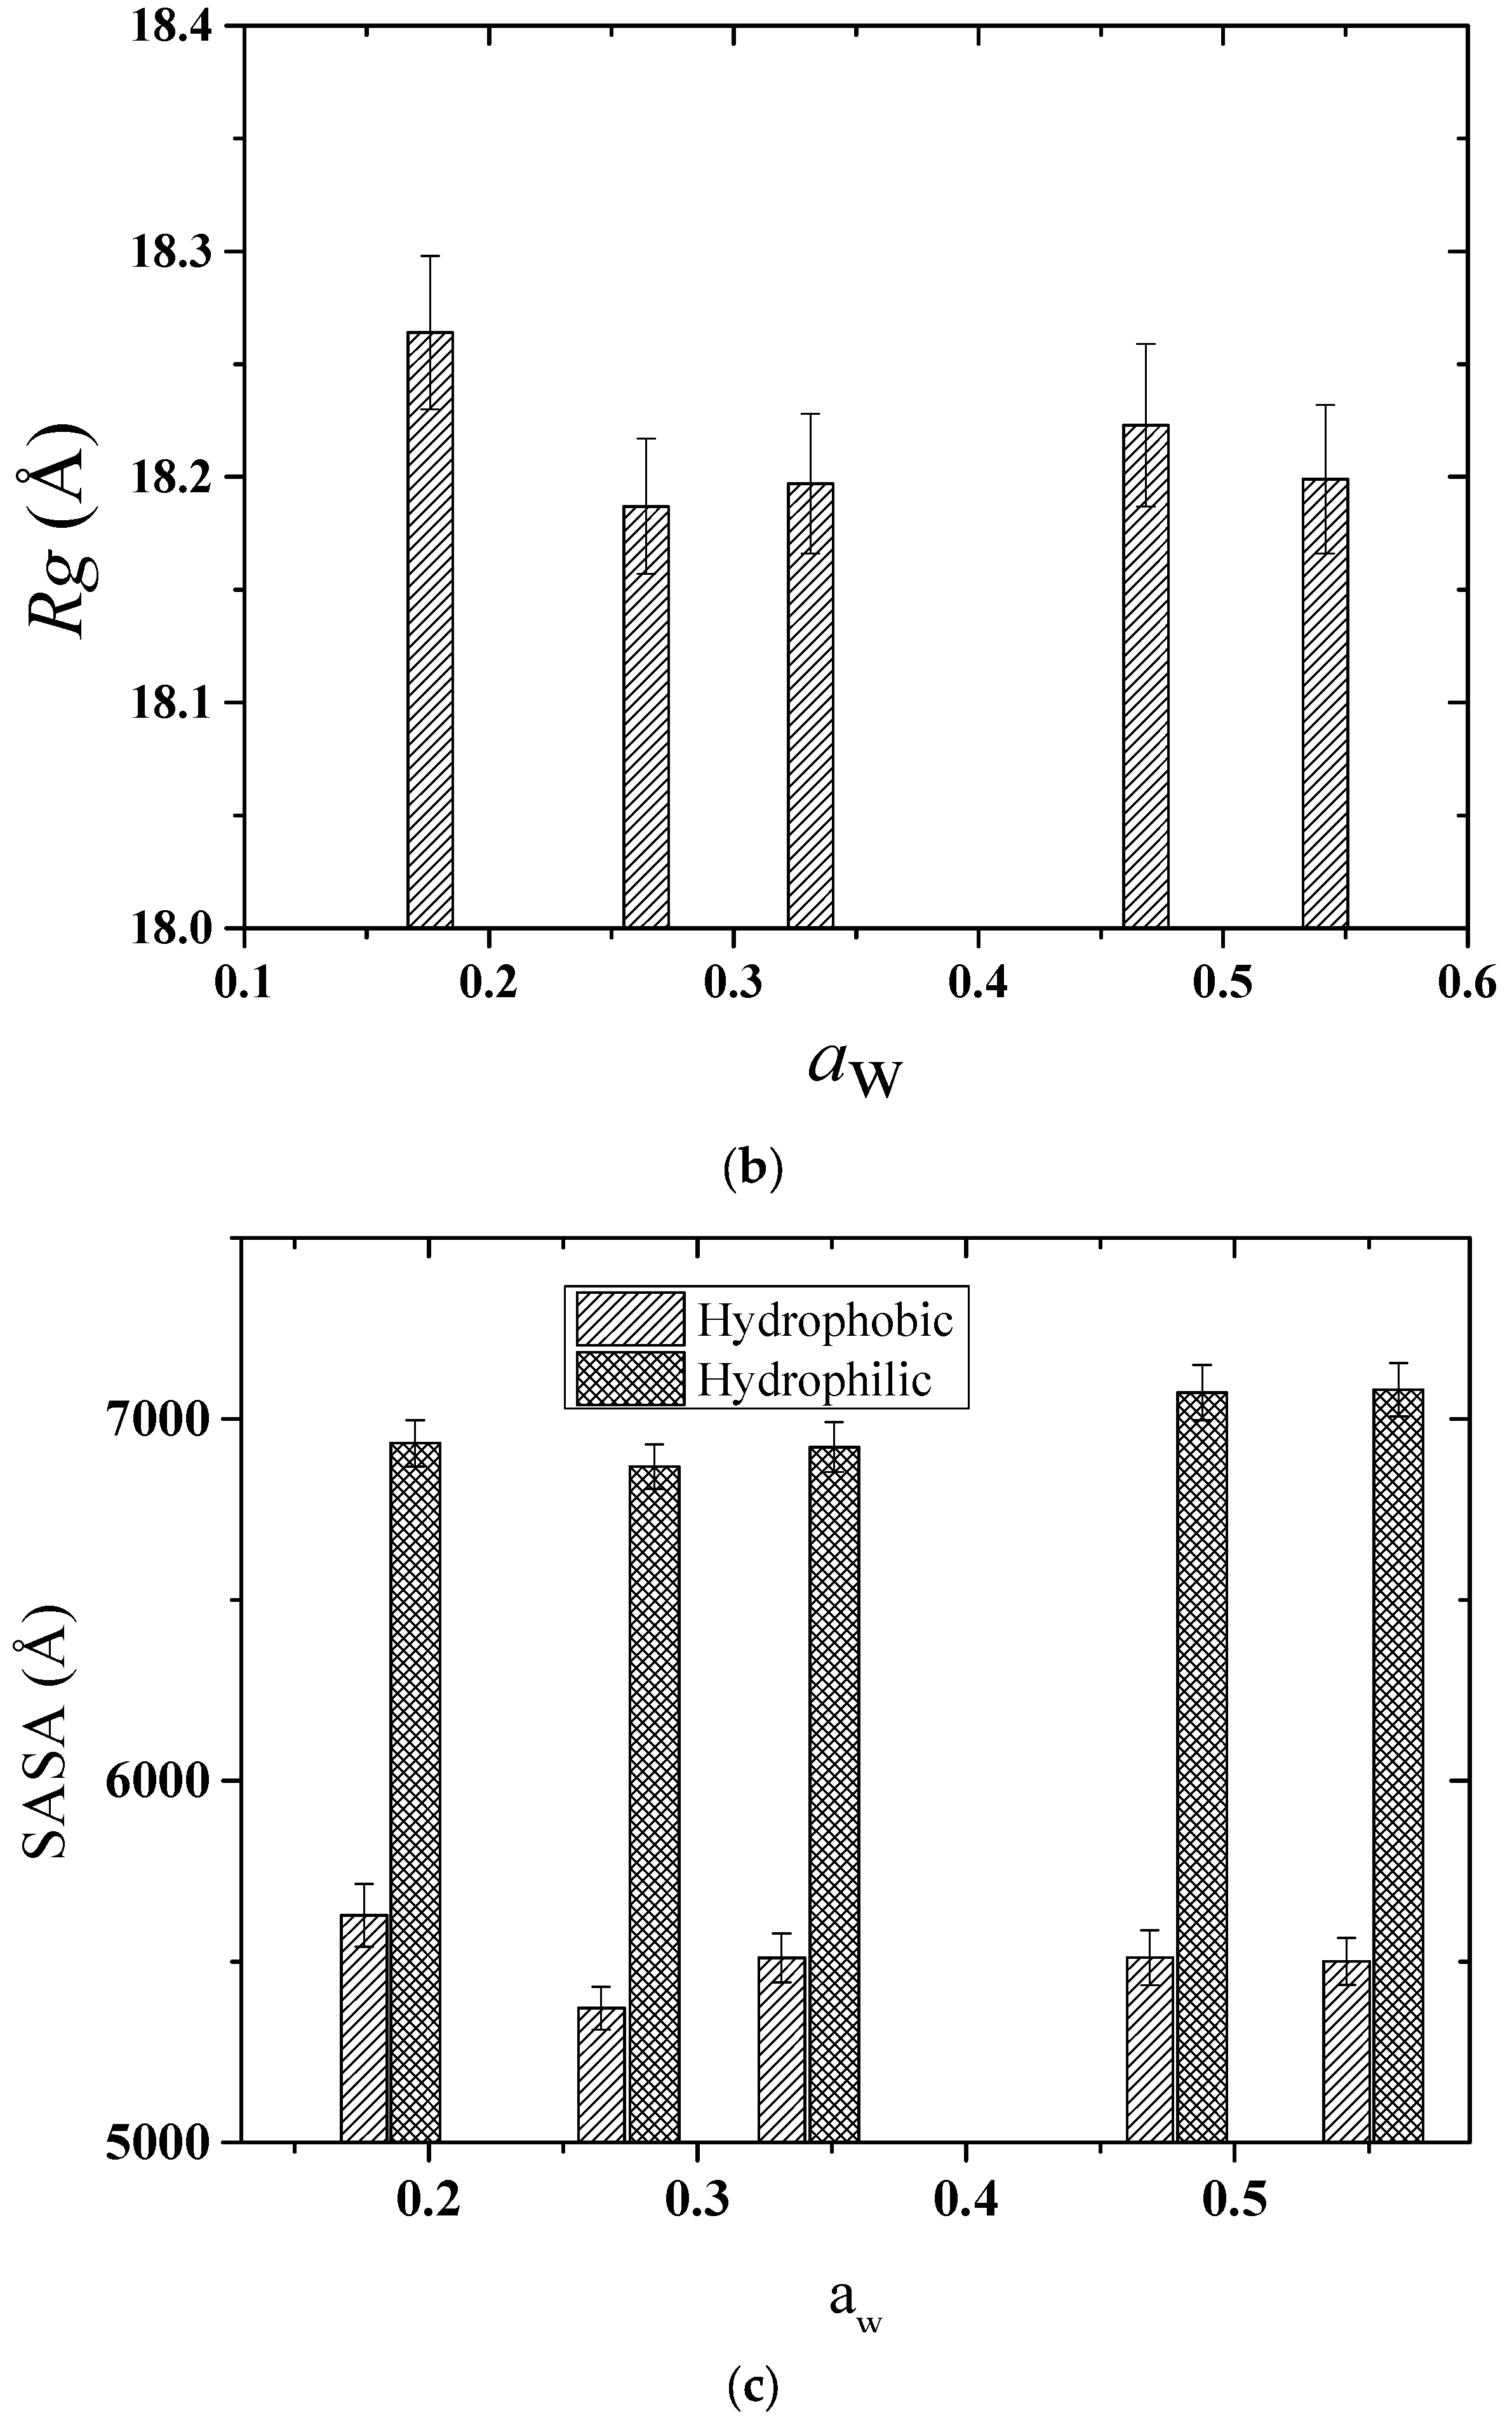
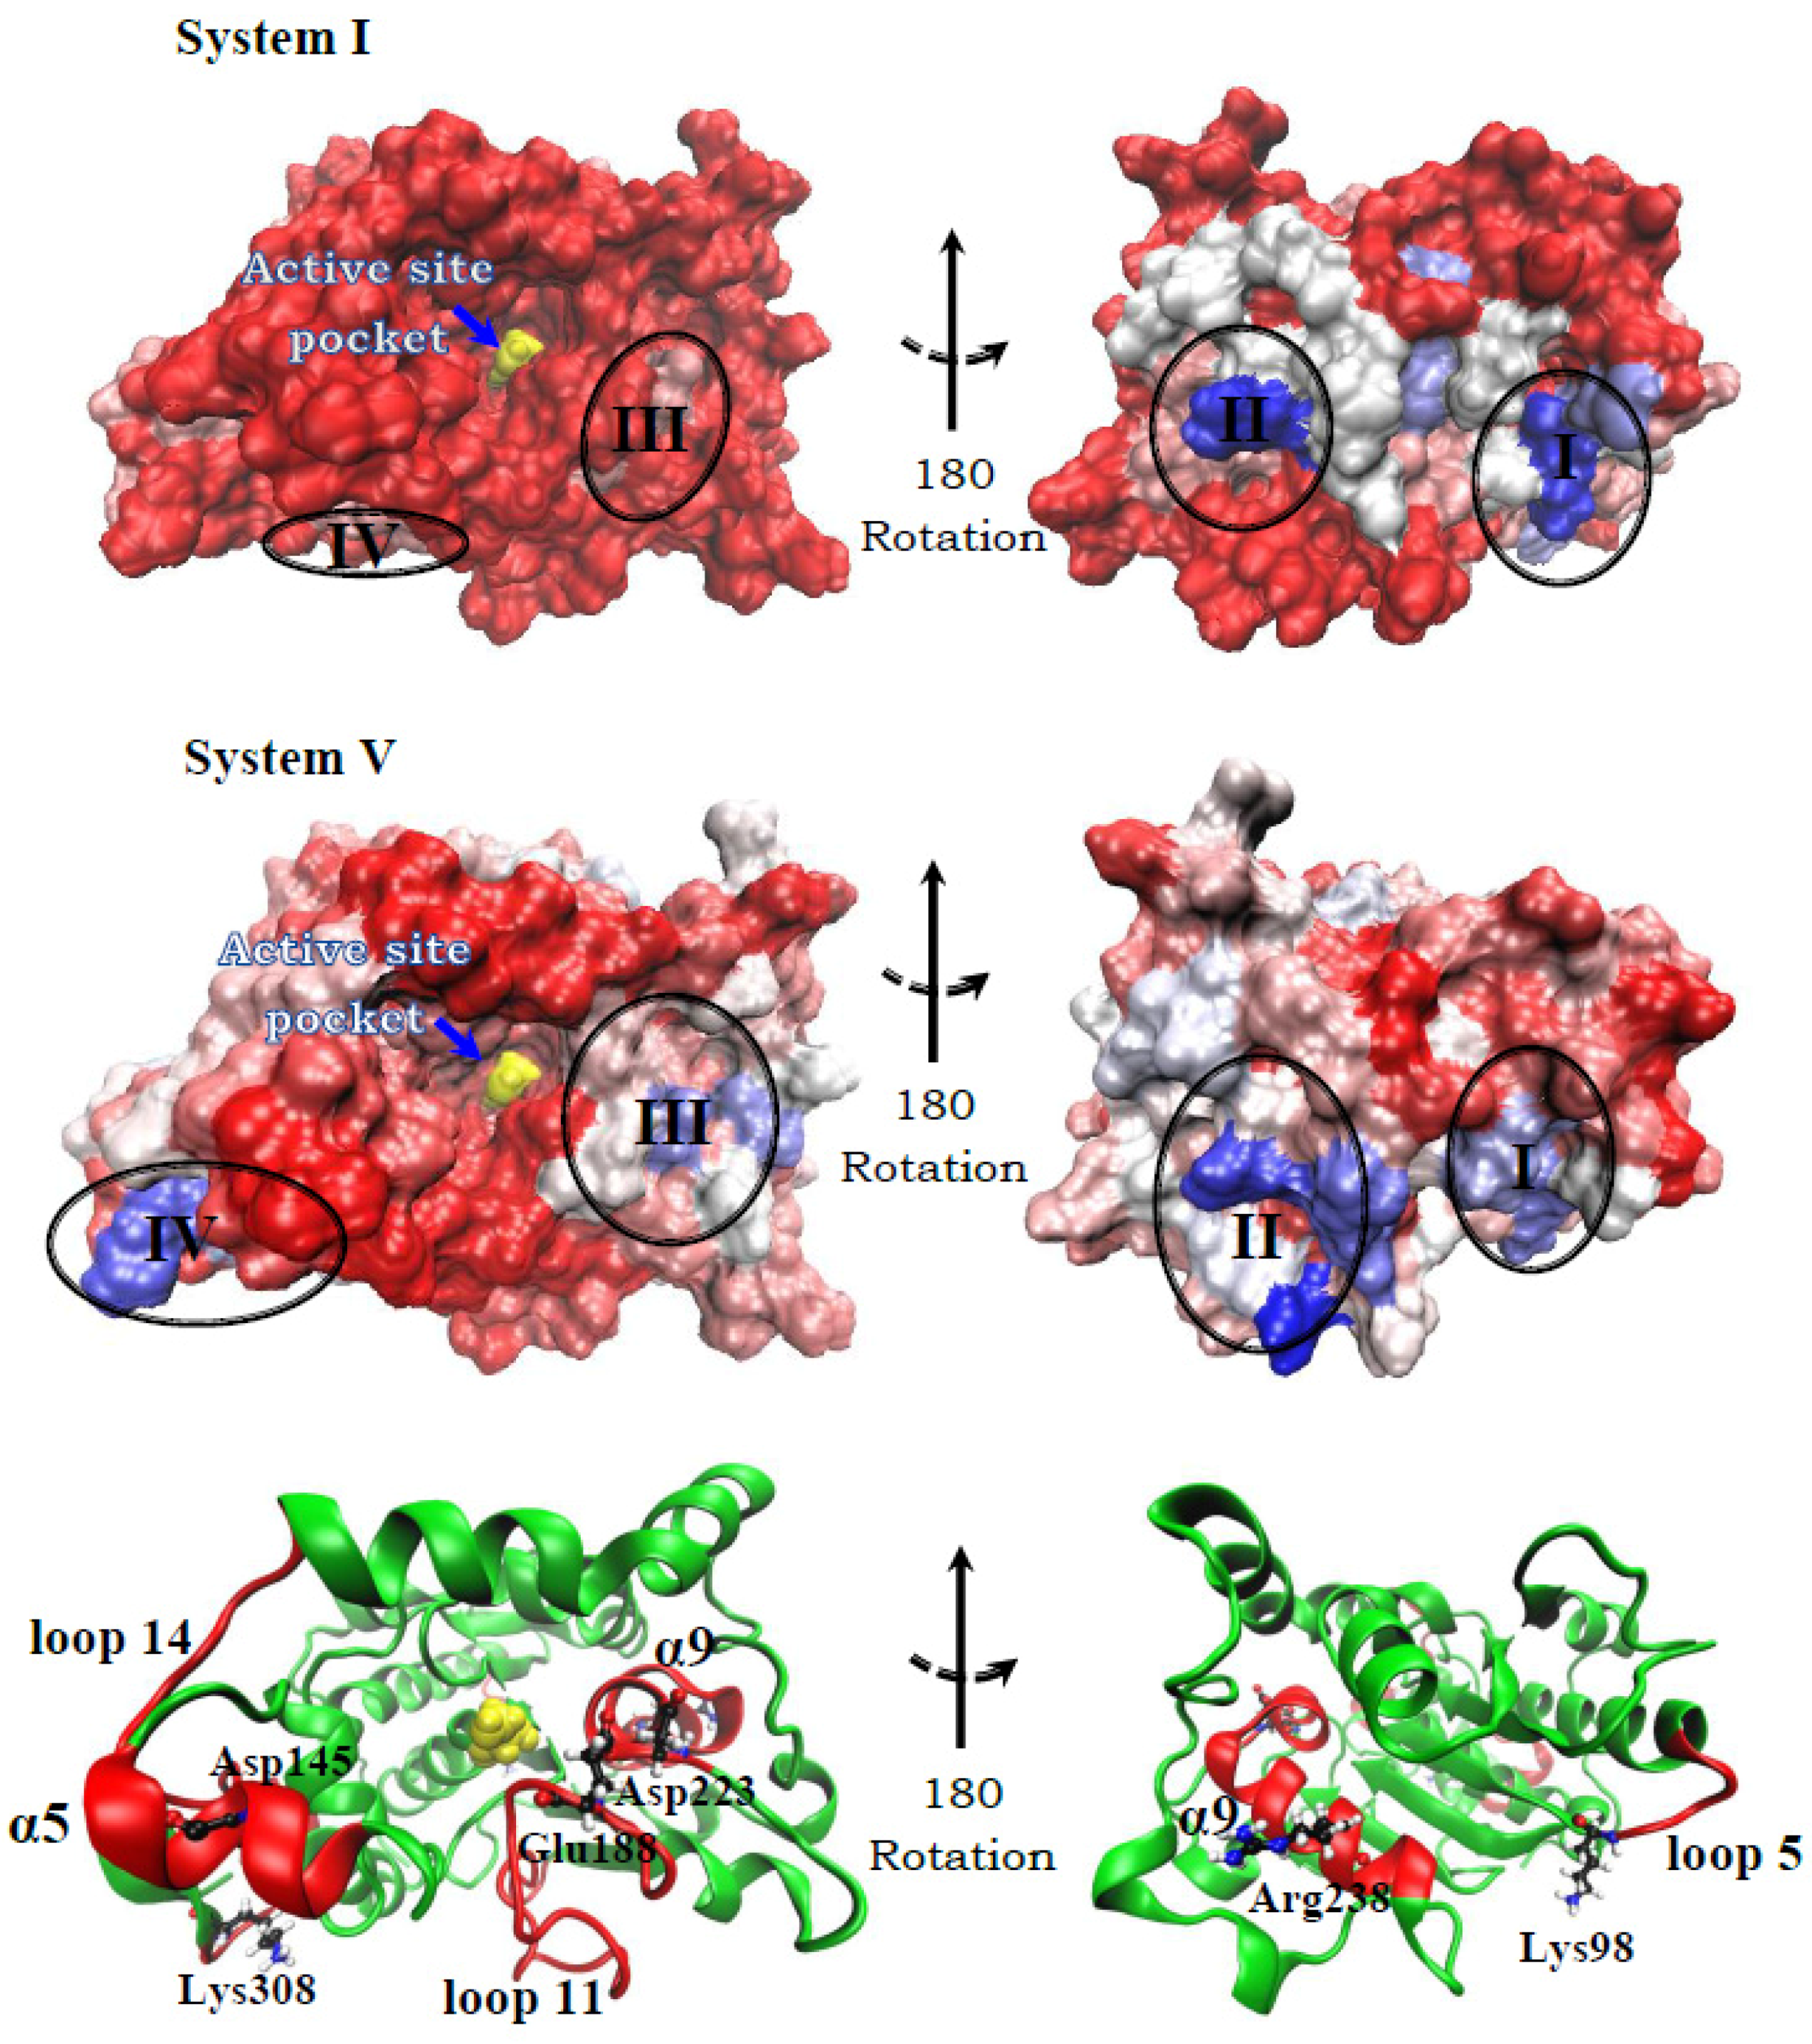
2.2.1. Structure

Figure 2a shows the time averaged root mean square deviation (RMSD) of all heavy atoms of CALB with respect to the crystal structure at different water activities. The RMSD data are below ~1.4 Å for all water percentages and slightly decreases (by ~0.3 Å) with increasing water activity of the MTBE medium. This implies that the overall structure of CALB is stable throughout the simulations and maintained over the entire range of water activities. The variation in RMSD is not statistically significant. To further investigate the structural changes of CALB due to change in water activity of the medium, we have analyzed the radius of gyration (Rg) and the hydrophilic and hydrophobic solvent accessible surface area (SASA) for CALB. Rg shows a much smaller variation at different water activities (Figure 2b). The change in hydrophilic and hydrophobic surface area of CALB (Figure 2c) with increasing water activity is statistically insignificant, implying that the water activity has minimal effect on the surface characteristics of CALB.
In view of the RMSD and Rg data, the global CALB structure does not change significantly with increasing water content in the MTBE medium. This observation (that CALB is stable at different water activities of MTBE medium) is comparable with our previous results showing that the overall CALB structure is stable in: HEX, MTBE, ACN, TBU [15]. The present results indicate that there must be other factors affecting the activity of CALB in MTBE at different water activities that could explain the experimental observations. Consequently, we have examined the behavior of water molecules on CALBsurface and investigated how water molecules interact with CALB at different water activities.

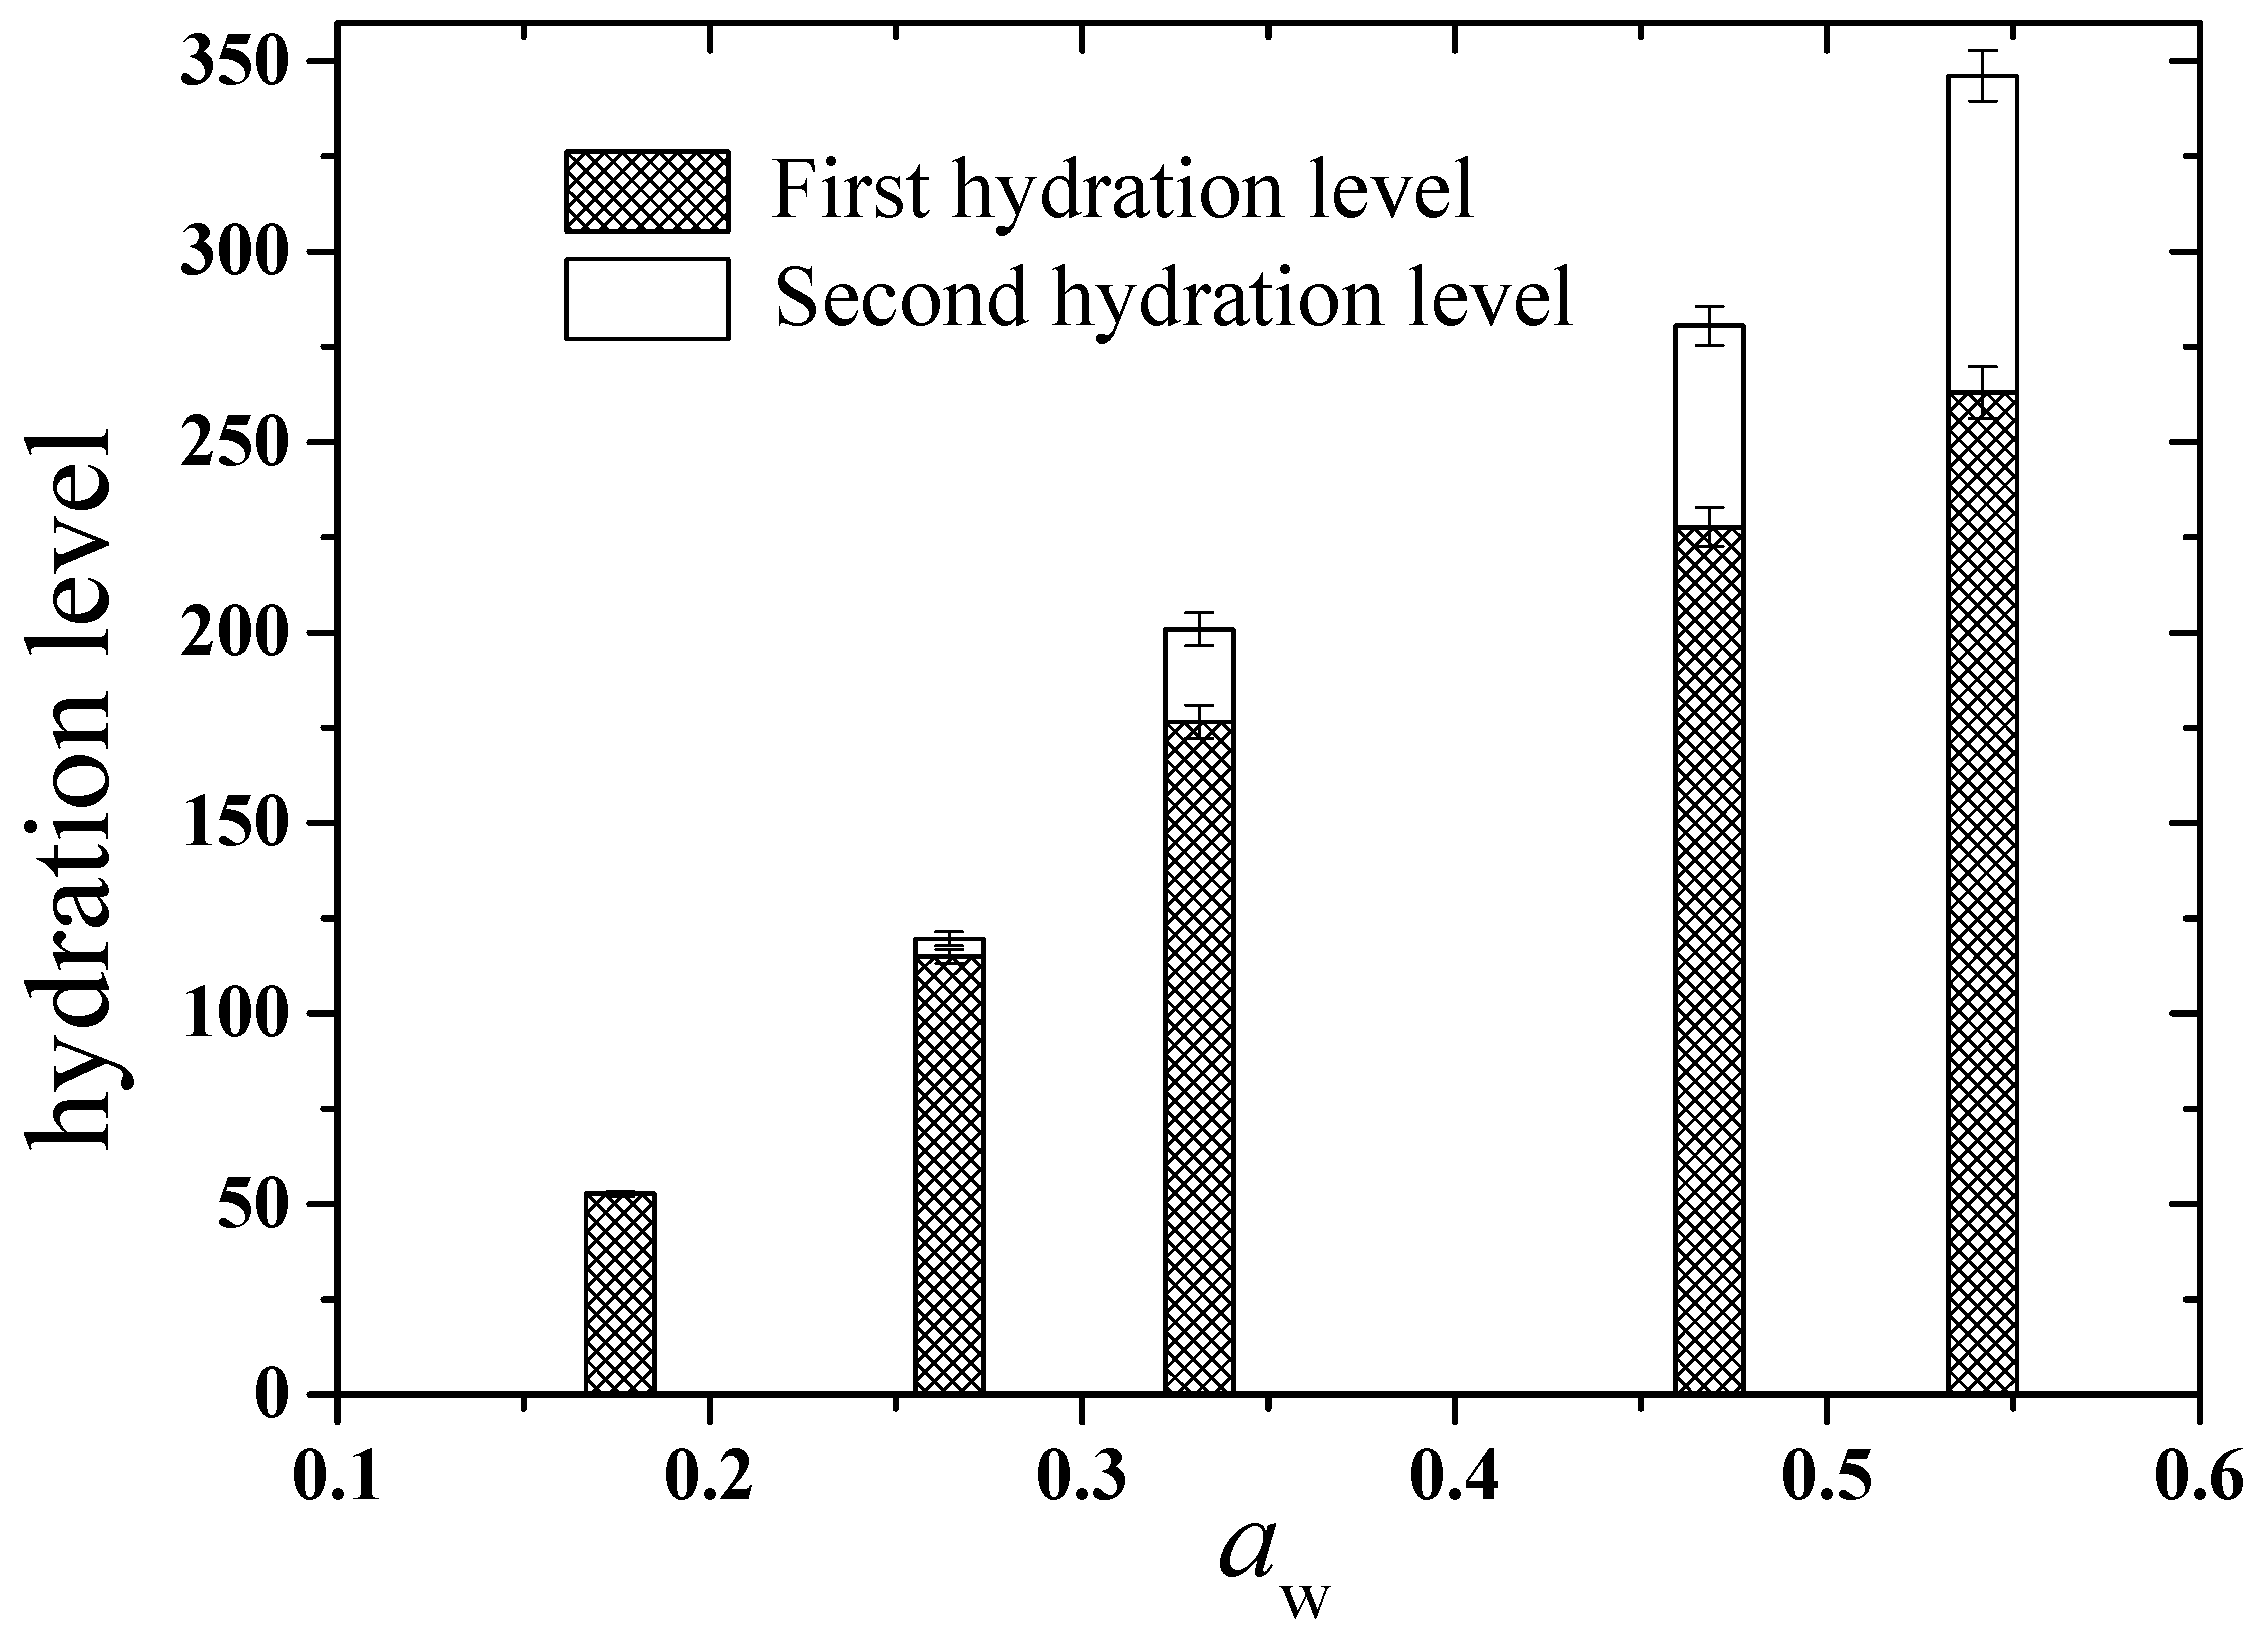
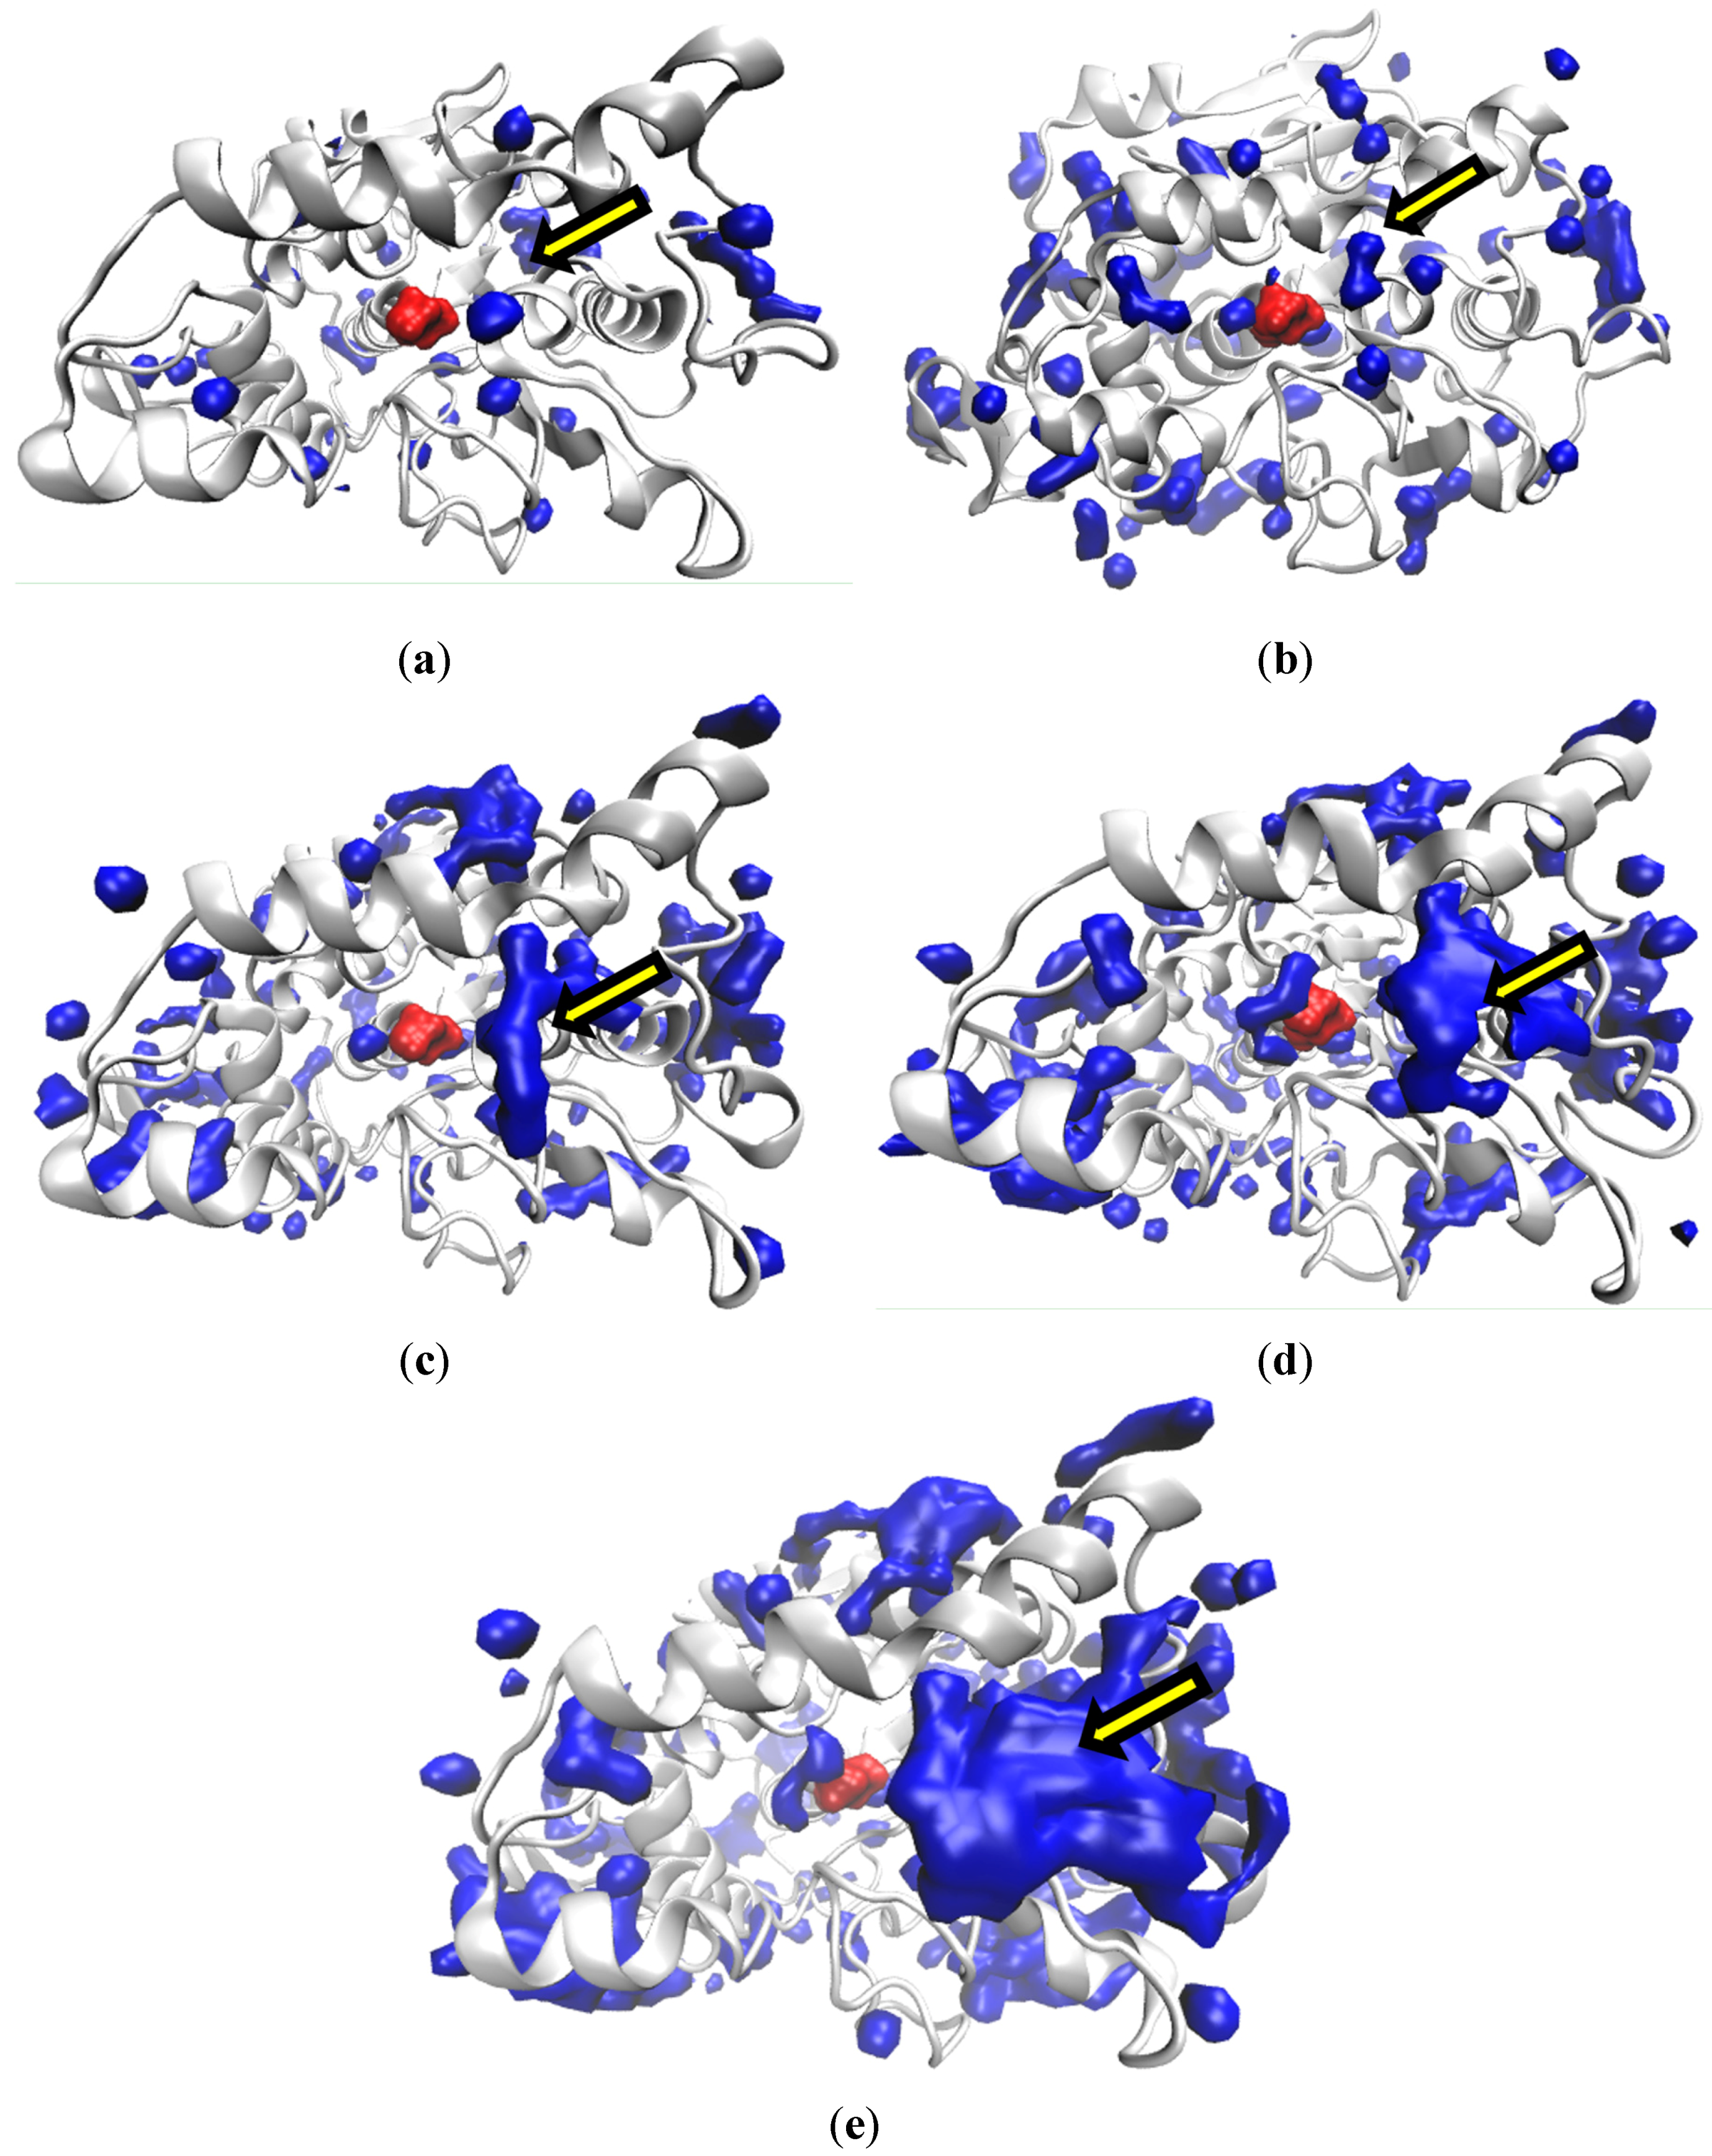
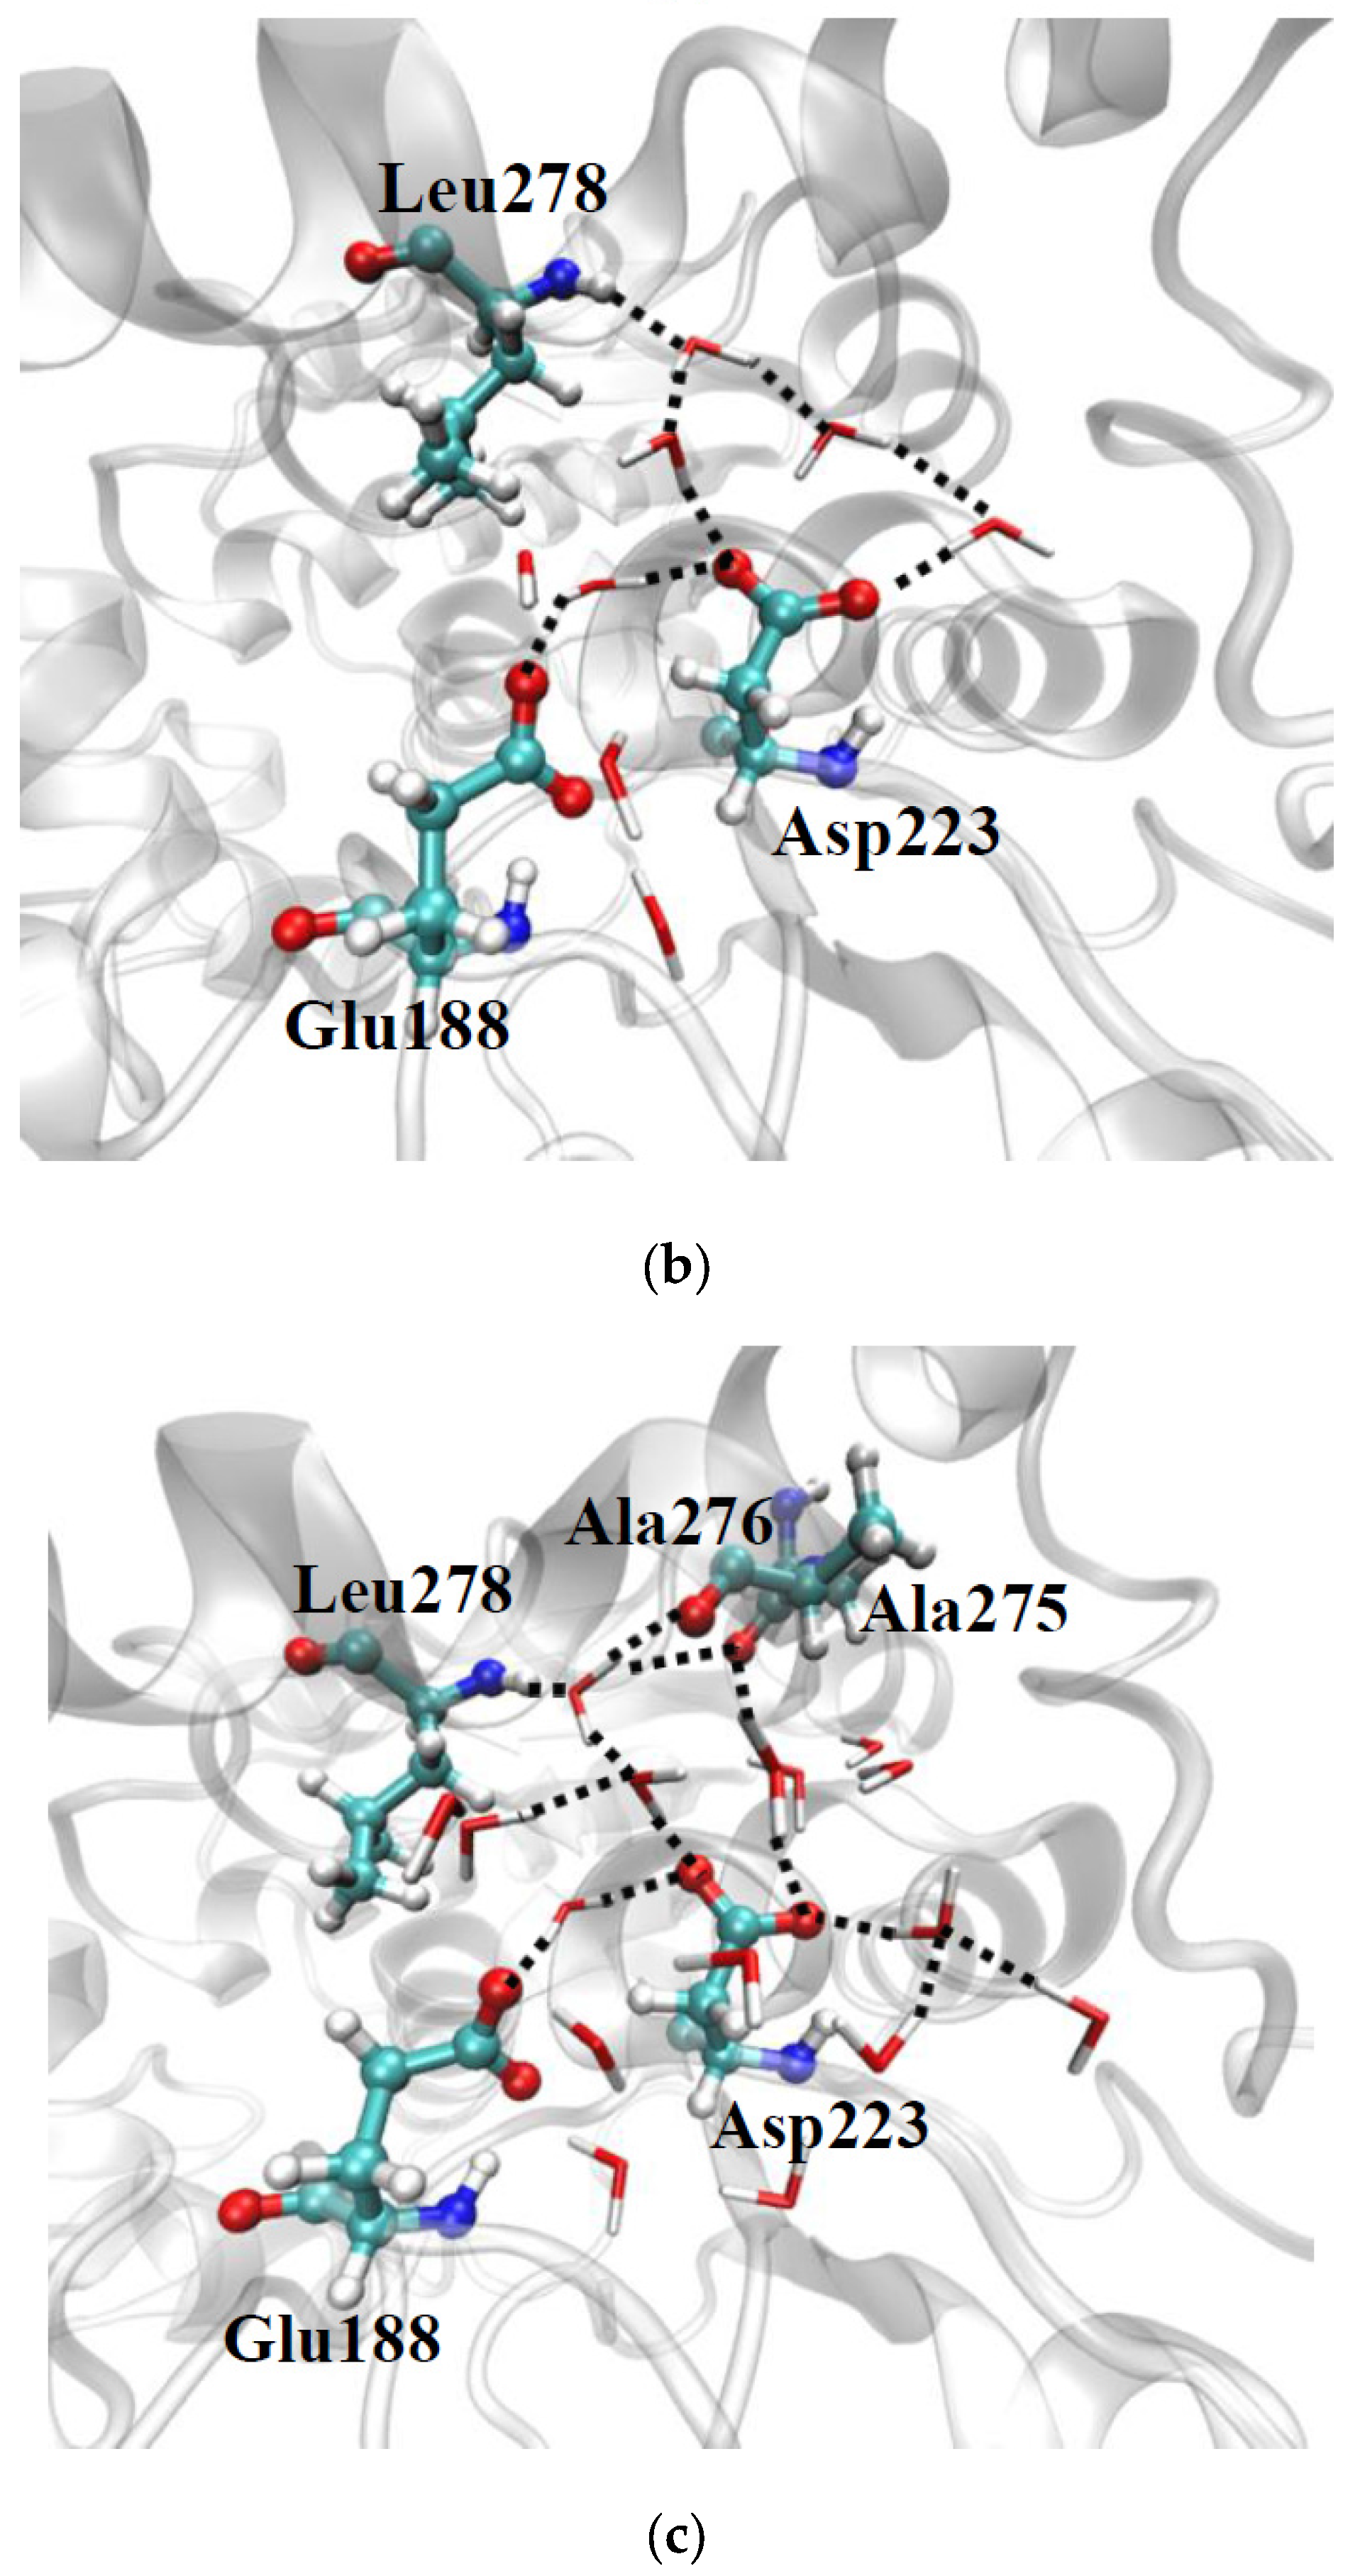
2.2.2. Hydration Level

In order to gain an insight into the behavior of water molecules in the first hydration shell of CALB, we have analyzed the hydration level of CALB at different water activities. The results are shown in Figure 3. Water molecules, whose O atoms are within 3.5 Å and 6 Å of any heavy atom of CALB, are considered to be part of the first and second hydration shell, respectively. These distances correspond to the first and second minimum of the radial distribution function for water molecules around a protein [20]. The number of water molecule(s) in the hydration shell defines the hydration level. Figure 3 shows first a rapid increase in the first hydration level with increasing water activity (up to aw = 0.35) which is followed by a less pronounced increase than observed for aw < 0.35. The result implies that at low water activity most of the water molecules are located in the first hydration shell around CALBsurface. As the water activity of the organic medium increases, the number of water molecules being part of the first hydration shell increases, and the hydration level reaches a saturation point at high water activity. Analysis of the number of water molecules in the second hydration shell shows that most of the water molecules in the system are present in the first and second hydration shells of CALB reflecting the accumulation of water molecules at the protein surface. This results in the formation of clusters of water molecules spanning eventually the first and second hydration shells of CALB a high water activity. Although the analysis of the hydration level provides a first glance of the hydration process, a molecular level understanding of the arrangement and localization of water molecules on CALBsurface are still missing. This will be addressed in the following.
Figure 4a–e shows the average spatial distribution of water molecules on CALBsurface at different water activities. For each system, the localization of water molecules on CALBsurface was obtained by averaging the water occupancy over the last 10 ns of simulations. The spatial distribution map of water molecules indicates an important point that the water molecules have some preferred binding sites at CALBsurface, which is independent of the water activity. This region will be referred to as “hot spot” region in the following discussion. A few such preferred hot spot regions are shown by arrows in Figure 4a–e. Indeed, one can easily understand, by comparing the spatial distribution map of water at different water activities, that at low aw, most of the water molecules present in the system are found on CALBsurface and with increasing water activity, the hot spot regions gradually expand (clearly seen from Figure 4, where the blue area gradually increases). Interestingly, at no point, there is evidence of a complete water monolayer covering CALBsurface. Rather, there are few regions on CALBsurface where the water occupancy is zero even at high water percentage as shown in Figure S1 (Supplementary Materials). This clearly indicates that solvent molecules cover these regions of the CALB surface. This observation is in good agreement with previous studies by Pleiss and co-workers. The authors identified six regions (α-helices α2, α5, α8, α10 and β-strands β1 and β4) of high hydrophobicity that can function as putative membrane interaction sites (studies based on a water-substrate interface system [21]) and three water binding sites at CALBsurface (studies based on water-organic solvent binary mixtures [22]). Our study shows that even at high water activity, these six hydrophobic regions are not covered by water molecules and that the hot spot regions on CALBsurface identified here are comparable with the water binding sites suggested by Kulschewski and Pleiss [22].
In order to specify the hot spot regions at CALBsurface, we have calculated the average number of bound water molecule(s) (nw) for each residue at different water activities. The magnitude of nw reflects the affinity of water molecules to that hot spot region. We found several residues with high nw which indicates multiple water binding sites on CALBsurface (Figure 5). Lys98 (loop 5) and Arg238 (α9) are two such residues with relatively high nw values which signifies that water molecules have a high affinity to the corresponding hot spot regions (hereafter named region I and II, respectively). These two residues located at CALBsurface are distal from the active site pocket (Figure 5). Four more residues are identified as high affinity water binding sites which are part of two hot spot regions near the entrance to the active site pocket; hot spot region III (residue Glu188 (loop 11) and Asp223 (α9)) and hot spot region IV (residue Asp145 (α5) and Lys308 (loop 14)). A few other hot spot regions with high affinity are found near the C-terminal and N-terminal regions of CALB. At high water activity, water molecules form an elaborated or elongated hydrogen bond network that connects water molecules that belong to two different nearby hot spot regions. The number of hot spot regions is independent of the water activity of the medium, and the only difference is the number of water molecules bound in each hot spot region. As the water activity increases, the number of water molecules bound to each hot spot region increases, which is expected from the hydration level analysis (further explained in detail below). However, a common feature is observed for all hot spot regions: each hot spot region is comprised of at least one charged residue (such as negatively charged Glu and/or Asp or positively charged Arg and/or Lys). Water molecules are attracted by the local electrostatic field created by these charged residues, promoting hydrogen bond formation between water molecules and these residues.
We observe that water molecules usually form clusters at the hot spot regions and interact with a group of residues. At low water activity, the hot spot regions are occupied by only a few strongly bound water molecules (low nw) that were also present in the crystal structure. These water molecules maintained their position throughout the entire simulations. The number of water molecules in each cluster gradually increases with increasing water activity of the medium, and for the larger clusters, water molecules undergo rapid exchange with water molecules in the organic medium. However, the time averaged nw value confirms the existence or residence of water clusters on CALBsurface. The cluster formation is described in more detail below for the four regions starting with the hot spot region III, which is the one that is located near to the active site pocket of CALB. At low water activity, only one water molecule is found near the entrance of the active site pocket, and it forms hydrogen bonds with two negatively charged residues Glu188 (loop 11) and Asp223 (α9). These two negatively charged residues point outwards from CALBsurface interact relatively strongly with the water molecule and consequently hold this water molecule tightly in this location. This is shown in Figure 6a. As the water activity increases, additional water molecules bind in the local electrostatic field created by these two residues. Consequently, as shown in Figure 6a–c, the number of water molecules in the hot spot region III increases, as also seen by the increase in the hydration level (Figure 3). In other words, the number of water molecules on CALBsurface gradually increases with increasing water activity. In addition to Glu188 and Asp223, other residues such as Ala275, Ala276, Leu278 also form hydrogen bonds with water molecules via their polar backbone atoms. This set of residues creates a hydrophilic environment (or hydration site) near the active site of CALB, which attracts water molecules to be bound to the hot spot region via hydrogen bond interactions. This is further shown in Figure 7a,b. Similar patterns are seen for the other regions, which are briefly discussed in the following. In hot spot region IV, first water molecules (at low water activity) interact with the negatively charged Asp145 and positively charged Lys308 (Figure S2, Supplementary Materials). As the water cluster size increases (with increasing water activity), other surrounding residues such as Thr159, Glu294, Arg309, Thr158, Gly160 interact with water molecules in the water cluster (Figure S2, Supplementary Materials). Water molecules at hot spot region II near the residue Arg238 (high nw) form hydrogen bond with Arg238 and Asp257/Asp265 at low water activity (Figure S3, Supplementary Materials). As the water activity increases, other residues such as Gln58, Gln231, Arg242, Asp252, Asn264 interact with the additional water molecules bound to that hot spot region (Figure S3, Supplementary Materials). In case of hot spot region I, the side chain of Lys98 is facing towards CALBsurface and proximal to the side chain of Asp126 as well as the backbone of Ser123 (Figure S4, Supplementary Materials). The water molecules in the binding site are anchored by hydrogen bond interactions with the positively charged amino group of Lys98 and side chain of Asp126 and backbone of Ser123 (Figure S4, Supplementary Materials).
The results show that with increasing water activity, the size of the water cluster on CALBsurface gradually increases, and the hot spot regions gradually expand. As a result, the surface area of CALB covered by water molecules also increases. This is confirmed by the analysis of water accessible surface area (WASA) and MTBE accessible surface area (MASA) of CALB. The analysis shows that WASA gradually increases (as shown in Figure 8a) and MASA decreases with increasing water activity (data not shown). Accumulation of water molecules at the hot spot region III is of particular interest since the region is located near the active site pocket and therefore can interfere with the binding of substrate molecules at high water activity. This is seen from Figure 6 and Figure 7. Figure 6 shows that the size of the water cluster at the hot spot region III increases with increasing water activity and eventually at high water activity interferes with the binding of ethanol to the active site. This consequently reduces the probability of substrate molecules reaching the active site. In other words, the effective substrate concentrations are reduced at the active site, which correlates well with the experimentally observed decrease in specific activities with increasing aw (Figure 1 and Figure 8a).
To understand the behavior of the substrate molecules at different water activities, we have performed additional simulations where we placed 12 substrate molecules (6 ethanol and 6 butyric acid) randomly on CALBsurface for the CALB/MTBE system at different water activities. The number of substrate molecules corresponds to the experimental concentration of ethanol and butyric acid. Simulations were carried out for 5 ns, which is sufficient for the equilibration of these systems as shown previously [15]. The average number of substrate molecules (ethanol and butyric acid) on CALBsurface was calculated based on the last 1 ns of the simulations. The results are shown in Figure 8b. The number of substrate molecules on CALBsurface gradually decreases as the water activity in the organic medium increases. As the number of substrate molecules on CALBsurface is relatively low at high water activity, the probability of substrate molecules entering into the active site is reduced at high water activity, which correlates well with the experimental observation that the enzymatic activity of CALB decreases with increasing aw.

3. Methods

3.1. Experimental Procedures

3.1.1. Materials

Immobilized Lipase B from Candida antarctica (Novozyme 435) provided by Novozymes A/S (Bagsvaerd, Denmark) was used in the present work. Butyric acid, ethanol, ethyl butyrate, lithium chloride (LiCl), potassium acetate (CH3COOK), magnesium chloride (MgCl2), magnesium nitrate hexahydrate (Mg(NO3)2·6H2O), potassium sulfate (K2SO4) and MTBE were bought from Sigma-Aldrich GmbH (Steinheim, Germany).

3.1.2. Esterification Reactions

To set aw, the reaction medium and immobilized enzyme were pre-equilibrated (in separate containers) overnight with the water vapor of saturated aqueous salt solutions. The salts used for the equilibrations were LiCl (aw = 0.12), CH3COOK (aw = 0.23), MgCl2 (aw = 0.33), Mg(NO3)2·6H2O (aw = 0.53) and K2SO4 (aw = 0.97) [23]. The reaction was started by mixing pre-equilibrated enzyme phase (approximately 10 mg) and organic phase (containing MTBE and reactants) in 4 mL vial. The initial butyric acid and ethanol concentration were 25 mM. Reactions were carried out at in a thermo-shaker at 30 °C and 800 rpm with a working volume of 3 mL. For GC analysis 100 µL samples were withdrawn at regular time intervals (1 min) from the reaction mixture. Two independent sets of experiments were performed for each water activity.

3.1.3. GC Analysis

The Perkin Elmer Clarus 600 GC-FID instrument supplied with a split injector (Skovlunde, Denmark) was used to monitor the amount of ester produced. The samples were injected to a Nukol™ (Sigma-Aldrich) column (15 m length, 0.31 mm i.d., 0.25 µm df) at 200 °C with a split ratio of 1:50. Helium was used as the carrier gas at a flow rate of 0.75 mL/min. Column temperature was set to 50 °C for initial 5 min. The temperature was increased by 50 °C at a rate of 25 °C/min and maintained for 2 min. Finally, the temperature was increased from 100 °C to 175 °C at a rate of 25 °C/min and maintained for 2 min at the final temperature. The detector temperature was maintained at 260 °C.

3.1.4. Kinetic Parameters Estimation

The amount of ester produced was plotted against the reaction time, and the initial reaction rates for the esterification reaction where the conversions were below 10% were determined from the slope of the plot (amount of product produced vs. time) by linear regression. The initial reaction rate (mM·min−1) was divided by the catalyst amount to obtain the specific activity (mmol·min−1·gm−1) (i.e., initial reaction rate/amount of catalyst).

3.2. Molecular Dynamics Simulations

To understand the effect of water activity on the CALB-catalyzed esterification reaction at a molecular level, we have carried out molecular dynamics simulations of CALB at different water activity in MTBE as solvent.

3.2.1. Structure

The crystal structure of CALB (PDB ID: 1TCA) [24] was used as the starting structure for all simulations. The enzyme consists of 317 amino acids forming seven central β-sheets surrounded by ten α-helices. Ser105-His224-Asp187 catalytic triad is located at the bottom of the active site cavity (12 Å depth). The active site is accessible to solvent through a narrow channel of approximately 10 Å × 4 Å width. The protonation state of the ionizable residues was assigned as described previously [15].

3.2.2. System Setup

We have performed several simulations of CALB solvated in MTBE and hydrated with varying numbers of water molecules as listed in Table 1. The systems were prepared as follows: CALB including crystallographic water molecules (286 molecules) was solvated applying the SOLVATE plug-in of VMD. From this solvated system, different numbers of water molecules were selected based on their distance to CALBsurface to achieve different water mole fractions. Water molecules beyond this distance were deleted from the solvated system. These different systems (CALB at various water mole fraction) were placed in a pre-equilibrated solvent cell of MTBE (74 Å × 74 Å × 74 Å), and MTBE molecules within 3 Å of CALB were removed following the procedure described previously [15].

3.2.3. Simulations

Simulations were performed with the NAMD 2.9 software [25] using the CHARMM27 force field [26,27] and the CHARMM35 [28] ether force field for CALB and MTBE, respectively. For the water molecules, the TIP3P model [29] with flexible bonds was used. Atomic RESP point charges for MTBE were computed using the R.E.D. package [30]. The conjugate gradient method was applied to initial configurations for energy minimization, which was followed by 30 ns isothermal-isobaric ensemble simulations at 298K and 1 atm. The first 10 ns of the trajectory were used for equilibration, and the remaining part of the trajectory was used for analysis. The Langevin thermostat and Langevin piston (period of 200 fs with a decay constant of 500 fs) were implemented to control the temperature and pressure, respectively. The damping constant was set to 5 ps−1. The short-range Lennard-Jones potential was evaluated using a 12 Å cutoff in combination with a switching function starting at 10 Å ensuring that the potential smoothly approaches zero at 12 Å. The particle mesh Ewald summation method with a grid spacing of 1 Å was employed to evaluate long-range electrostatic forces every 2 fs. Non-bonded forces were determined using a pair list with a maximum radius of 14 Å. The velocity Verlet algorithm was employed to integrate the equation of motion. The time step used was 1 fs. Periodic boundary conditions were employed in all three Cartesian coordinate directions.

3.2.4. Water activity Calculation

It is challenging to calculate the thermodynamic activity of water in a binary mixture; water/organic solvent. The water activity is expressed by aw = γw(xwxw, where γw(xw) refers to the activity coefficient of water in a binary mixture at the water mole fraction xw. In the present study, the bulk xw for all studied MTBE/water systems are less than 0.02 (Table 1) and therefore, γw(xw) is approximated by the water activity coefficient at infinite dilution γ w ; as this approach has been successfully used previously [31]. The alchemical free energy perturbation approach [32] is used to determine γ w . The thermodynamic activity can be expressed in terms of the difference in chemical potential of the pure state ( μ w ° ) and of a mixture ( μ w ) as follows:
k b · T · ln x w · γ w = μ w μ w °
Using Widom’s expression [33] for the chemical potential, Equation (1) becomes:
k b · T · ln x w · γ w = G solv G water + k b · T · ln ρ w ρ w °
where k b , T, ρ w and ρ w ° refer to Boltzmann constant, absolute temperature, molar water density in the mixture and molar water density of pure water, respectively. In the limit as x w 0 , Equation (2) becomes:
ln γ w = G solv G water k b · T + ln ρ solv ° ρ w °
where ρ solv ° denotes the molar density of pure organic solvent. G solv and G water describe the energy cost for introducing a single water molecule in organic solvent and in water, respectively. To estimate G solv and G water , a single water molecule is built in a pure solvent box of MTBE containing 512 molecules and in a pure water box containing 258 molecules, respectively. Prior to the free energy calculation, the system is minimized and equilibrated for 500 ps. The free energy difference between the two states is calculated by defining a new function for the potential energy in terms of the interaction parameter λ. The potential energy is varied as a function of λ from one state (λ = 0) to another state (λ = 1) with increments of δλ equal to 0.0625. The electrostatic interactions involving the outgoing atoms are gradually decoupled as λ changes from 0 to 0.5, and the van der Waals interactions are decoupled as λ changes from 0 to 1 using soft core scaling [34] with a shift parameter of 5 Å2. At each λ value, the system is equilibrated for 10 ps. The production run is performed for 400 ps. The calculated G water = −6.98 ± 0.07 kcal/mol compares well with G water calculated by Goncalves et al. [35]. The authors reported a value of −6.7 ± 0.3 kcal/mol by considering the solvation free energy as a combination of creation of a volume for the solvent around the solute and electrostatic and van der Waal interactions between solvent and solute [35].
Water molecules located near a protein surface exhibit different properties than water molecules in a pure bulk phase. These water molecules are often classified as bound water (located closely to the protein surface) and free water (in the bulk phase). In order to calculate the bulk water mole fraction, xw, the simulation cell was divided into two regions: “bulk” and “protein vicinity” region. These two regions are separated by an imaginary boundary with distance Rbound. A water or organic solvent molecule was classified to be in the bulk region when the distance of the oxygen atom of that water molecule or the tertiary carbon atom of that MTBE molecule to the nearest non-hydrogen atom of CALB is greater than Rbound otherwise the molecules were considered to be in the protein vicinity region. To determine Rbound, the average fraction of water molecules to the protein surface (xw(r)) was calculated using the following relation:
x w ( r ) = < N w ( r ) > < N w ( r ) > + < N s ( r ) >
Nw(r) and Ns(r) refer to the number of water and MTBE molecules, respectively, that are a distance between r − 0.25 Å and r + 0.25 Å away from the protein surface. < ... > denotes time average. xw(r) varies as a function of r and approaches a fairly constant value as r increases (Figure 9). The region, where the variation of xw(r) as a function of r is small (<0.001), is considered to be bulk region, and the corresponding smallest value of r defines Rbound, which is used to evaluate the bulk xw.

4. Conclusions

The present study provides insight into the effect of initial water activity of organic medium on the catalytic activity of CALB at a molecular level. The results show that water clustering on CALBsurface plays an important role that affects the catalytic activity of CALB. For the esterification reaction between butyric acid and ethanol in MTBE, the activity of CALB decreases with increasing aw of the organic medium. The results show further that water molecules have preferred binding sites at CALBsurface (“hot spot”). As the water activity of MTBE increases, more water molecules bind to the hot spot regions, which gradually expand. Consequently, the number of substrate molecules approaching the catalytic site of CALB decreases due to an expansion of the water hot spot regions close to the active site. In other words, the increase in the size of the water clusters at the hot spot region limits the diffusion of substrate molecules to the active site of CALB, which in turn results in a decrease in the enzymatic activity with increasing water activity as confirmed by the experimentally determined initial rates.

Supplementary Materials

The following are available online at www.mdpi.com/2073-4344/7/8/227/s1, Figure S1. The spatial distribution of water occupancy at CALBsurface in MTBE at high water percentage (16.62%) averaged over the last 10 ns of simulation. The contours are shown for the isovalue 0.5. The enzyme is shown as a surface representation and colored white; the active site residue, Ser105, is shown in red, and the spatial distribution of water molecules are shown in blue. In order to give a complete view of the surface, two sides (front and back sides) of the enzyme are shown, Figure S2: Selected part of the hydrogen-bonding network of the hot spot region IV located close to the active site pocket of CALB at water activities (a) 0.18 and (b) 0.54. The network gradually increases with increasing water activity. At low water activity, there are two water molecules, while with increasing water activity more water molecules bind to that hot spot region leading to an increase in cluster size, Figure S3: Selected part of the hydrogen-bonding network of the hot spot region II distal from the active site pocket of CALB at water activities (a) 0.18 and (b) 0.54. The network gradually increases with increasing water activity. At low water activity, there are relatively few water molecules, while with increasing water activity more water molecules bind to that hot spot region leading to an increase in cluster size, Figure S4: The hydrogen-bonding network of the hot spot region I of CALB at water activity 0.54.

Acknowledgments

Simulations were carried out at the Danish Center for Scientific Computing at the Technical University of Denmark. The study has received funding from the Novo Nordisk Foundation, Biotechnology-based synthesis and production research grant (Grant No. 5473). Graphical images were produces using VMD.

Author Contributions

John M. Woodley conceived and designed the experiments, contributed to the interpretation of the results and writing the article; Sindrila Dutta Banik performed the experiments and simulations; analyzed the data and wrote the major part of the article; Mathias Nordblad contributed reagents/materials/analysis tools; Günther H. Peters conceived and designed the in-silico modelling, contributed to the analysis of the data, interpretation of the results and writing the article.

Conflicts of Interest

The authors declare no conflict of interest.

References

  1. Houde, A.; Kademi, A.; Leblanc, D. Lipases and Their Industrial Applications: An Overview. Appl. Biochem. Biotechnol. 2004, 118, 155–170. [Google Scholar] [CrossRef]
  2. Adlercreutz, P. Immobilisation and application of lipases in organic media. Chem. Soc. Rev. 2013, 42, 6406–6436. [Google Scholar] [CrossRef] [PubMed]
  3. Klibanov, A.M. Improving enzymes by using them in organic solvents. Nature 2001, 409, 241–246. [Google Scholar] [CrossRef] [PubMed]
  4. Choudhury, P.; Bhunia, B. Industrial application of lipase: A review. Biopharm J. 2015, 1, 41–47. [Google Scholar]
  5. Soares, C.M.; Teixeira, V.H.; Baptista, A.M. Protein structure and dynamics in nonaqueous solvents: Insights from molecular dynamics simulation studies. Biophys. J. 2003, 84, 1628–1641. [Google Scholar] [CrossRef]
  6. Xu, Z.; Suzawa, V.; Focht, K.; Clark, D.S.; Dordick, J.S. Enzymatic catalysis and dynamics in low-water environments. Proc. Natl. Acad. Sci. USA 1992, 89, 1100–1104. [Google Scholar]
  7. Valivety, R.H.; Halling, P.J.; Peilow, A.D.; Macrae, A.R. Lipases from different sources vary widely in dependence of catalytic activity on water activity. Biochim. Biophys. Acta 1992, 1122, 143–146. [Google Scholar] [CrossRef]
  8. Tsitsimpikou, C.; Daflos, H.; Kolisis, F.N. Comparative studies on the sugar esters synthesis catalysed by Candida antarctica and Candida rugosa lipases in hexane. J. Mol. Catal. B Enzym. 1997, 3, 189–192. [Google Scholar] [CrossRef]
  9. Mora-pale, J.M.; Munguia, S.P.; Gonzalez-Mejia, J.C.; Dordick, J.S.; Barzana, E. The Lipase-Catalyzed Hydrolysis of Lutein Diesters in Non-Aqueous Media is Favored at Extremely Low Water Activities. Biotechnol. Bioeng. 2007, 98, 535–542. [Google Scholar] [CrossRef] [PubMed]
  10. Watanabe, Y.; Miyawaki, Y.; Adachi, S.; Nakanishi, K.; Matsuno, R. Equilibrium constant for lipase-catalyzed condensation of mannose and lauric acid in water-miscible organic solvents. Enzym. Microb. Technol. 2001, 29, 494–498. [Google Scholar] [CrossRef]
  11. Chamouleau, F.; Coulon, D.; Girardin, M.; Ghoul, M. Influence of water activity and water content on sugar esters lipase-catalyzed synthesis in organic media. J. Mol. Catal. B Enzym. 2001, 11, 949–954. [Google Scholar] [CrossRef]
  12. Humeau, C.; Girardin, M.; Rovel, B.; Miclo, A. Effect of the thermodynamic water activity and the reaction medium hydrophobicity on the enzymatic synthesis of ascorbyl palmitate. J. Biotechnol. 1998, 63, 1–8. [Google Scholar] [CrossRef]
  13. Jin, Z.; Liang, S.; Zhang, X.; Han, S.; Ren, C.; Lin, Y.; Zheng, S. Synthesisof Fructose Laurate Esters Catalyzed by a CALB-displaying Pichia pastoris Whole-cell Biocatalyst in a Non-aqueous System. Biotechnol. Bioeng. 2013, 18, 365–374. [Google Scholar] [CrossRef]
  14. Secundo, F.; Carrea, G.; Soregaroli, C.; Varinelli, D.; Morrone, R.; Molecolare, R.; Bianco, M. Activity of Different Candida antarctica Lipase B Formulations in Organic Solvents. Biotechnol. Bioeng. 2001, 73, 157–163. [Google Scholar] [CrossRef] [PubMed]
  15. Banik, S.D.; Nordblad, M.; Woodley, J.M.; Peters, G.H. A Correlation between the Activity of Candida antarctica Lipase B and Di ff erences in Binding Free Energies of Organic Solvent and Substrate. ACS Catal. 2016, 6, 6350–6361. [Google Scholar] [CrossRef]
  16. Ates, S.; Türk, B.; Bayraktar, E.; Güvenc, A. Enhanced ethyl butyrate production using immobilized lipase. Artif. Cells Nanomed. Biotechnol. 2013, 41, 339–343. [Google Scholar] [CrossRef] [PubMed]
  17. Rodriguez-nogales, J.M.; Roura, E.; Contreras, E. Biosynthesis of ethyl butyrate using immobilized lipase: A statistical approach. Process Biochem. 2005, 40, 63–68. [Google Scholar] [CrossRef]
  18. Baptista, M. Water Dependent Properties of Cutinase in Nonaqueous Solvents: A Computational Study of Enantioselectivity. Biophys. J. 2005, 89, 999–1008. [Google Scholar]
  19. Micaêlo, N.M.; Soares, C.M. Modeling hydration mechanisms of enzymes in nonpolar and polar organic solvents. FEBS J. 2007, 274, 2424–2436. [Google Scholar] [CrossRef] [PubMed]
  20. Schröder, C.; Rudas, T.; Boresch, S.; Steinhausera, O. Simulation studies of the protein-water interface. I. Properties at the molecular resolution. J. Chem. Phys. 2006, 124, 234907. [Google Scholar] [CrossRef] [PubMed]
  21. Gruber, C.C.; Pleiss, J. Enzymatic Lipase B from Candida antarctica binds to hydrophobic substrate—Water interfaces via hydrophobic anchors surrounding the active site entrance. J. Mol. Catal. B Enzym. 2012, 84, 48–54. [Google Scholar] [CrossRef]
  22. Kulschewski, T.; Pleiss, J. Binding of Solvent Molecules to a Protein Surface in Binary Mixtures Follows a Competitive Langmuir Model. Langmuir 2016, 32, 8960–8968. [Google Scholar] [CrossRef] [PubMed]
  23. Goderis, H.L.; Ampe, G.; Feyten, M.P.; Fouwe, B.L.; Guffens, W.M.; van Cauwenbergh, S.M.; Tobback, P.P. Lipase-catalysed ester exchange reaction in organic media with controlled humidity. Biotechnol. Bioeng. 1987, 30, 258–266. [Google Scholar] [CrossRef] [PubMed]
  24. Uppenberg, J.; Hansen, M.T.; Patkar, S.; Jones, T.A. The sequence, crystal structure determination and refinement of two crystal forms of lipase B from Candida antarctica. Structure 1994, 2, 293–308. [Google Scholar] [CrossRef]
  25. Phillips, J.C.; Braun, R.; Wang, W.; Gumbart, J.; Tajkhorshid, E.; Villa, E.; Chipot, C.; Skeel, R.D.; Kalé, L.; Schulten, K. Scalable molecular dynamics with NAMD. J. Comput. Chem. 2005, 26, 1781–1802. [Google Scholar] [CrossRef] [PubMed]
  26. AMacKerell, D.; Bashford, D.J.; Bellott, M.; Dunbrack, R.L.; Evanseck, J.D.; Field, M.J.; Fischer, S.; Gao, J.; Guo, H.; Ha, S.; et al. All-Atom Empirical Potential for Molecular Modeling and Dynamics Studies of Proteins. J. Phys. Chem. B 1998, 102, 3586–3616. [Google Scholar] [CrossRef] [PubMed]
  27. Mackerell, A.D.; Feig, M.; Brooks, C.L. Extending the treatment of backbone energetics in protein force fields: Limitations of gas-phase quantum mechanics in reproducing protein conformational distributions in molecular dynamics simulations. J. Comput. Chem. 2004, 25, 1400–1415. [Google Scholar] [CrossRef] [PubMed]
  28. Vorobyov, I.; Anisimov, V.M.; Greene, S.; Venable, R.M.; Moser, A.; Pastor, R.W.; MacKerell, A.D. Additive and classical drude polarizable force fields for linear and cyclic ethers. J. Chem. Theory Comput. 2007, 3, 1120–1133. [Google Scholar] [CrossRef] [PubMed]
  29. Jorgensen, W.L.; Chandrasekhar, J.; Madura, J.D.; Impey, R.W.; Klein, M.L. Comparison of simple potential functions for simulating liquid water. J. Chem. Phys. 1983, 79, 926. [Google Scholar] [CrossRef]
  30. Vanquelef, E.; Simon, S.; Marquant, G.; Garcia, E.; Klimerak, G.; Delepine, J.C.; Cieplak, P.; Dupradeau, F.Y. R.E.D. Server: A web service for deriving RESP and ESP charges and building force field libraries for new molecules and molecular fragments. Nucleic Acids Res. 2011, 39, 511–517. [Google Scholar] [CrossRef] [PubMed]
  31. Wedberg, R.; Abildskov, J.; Peters, G.H. Protein dynamics in organic media at varying water activity studied by molecular dynamics simulation. J. Phys. Chem. B 2012, 116, 2575–2585. [Google Scholar] [CrossRef] [PubMed] [Green Version]
  32. Dixit, S.B.; Chipot, C.; Poincare, H.; Vandœu, V. Can Absolute Free Energies of Association Be Estimated from Molecular Mechanical Simulations? The Biotin—Streptavidin System Revisited. J. Phys. Chem. A 2001, 105, 9795–9799. [Google Scholar] [CrossRef]
  33. Frenkel, D.; Smit, B. Understanding Molecular Simulation; Academic Press: Cambridge, MA, USA, 2002. [Google Scholar]
  34. Zacharias, M.; Straatsma, T.P.; Mccammon, J.A.; Zacharias, M.; Straatsma, T.P.; Mccammon, J.A. Separation-shifted scaling, a new scaling method for Lennard-Jones interactions in thermodynamic integration Separation-shifted scaling, a new scaling method for Lennard-Jones interactions in thermodynamic integration. J. Chem. Phys. 1994, 100, 9025–9031. [Google Scholar] [CrossRef]
  35. Gonçalves, P.F.B.; Stassen, H. Calculation of the free energy of solvation from molecular dynamics simulations. Pure Appl. Chem. 2004, 76, 231–240. [Google Scholar] [CrossRef]
Figure 1. Average specific activity (mM·min−1·mg−1) for the esterification reaction catalyzed by Candida antarctica lipase B in MTBE as a function of initial water activity, aw, of the medium obtained from two sets of independent experiments.
Catalysts 07 00227 g001
Figure 2. Analyses of the structural properties of CALB in MTBE at different water activities. (a) Time-averaged root mean square deviation (RMSD) of CALB with respect to the crystal structure, (b) radius of gyration (Rg) of CALB and (c) hydrophilic and hydrophobic solvent accessible surface areas (SASAs) of CALB in MTBE as a function of water activity, aw. Mean values and standard deviations (error bars) were calculated from the last 10 ns of each simulation performed at a given water activity, aw (Table 1).
Catalysts 07 00227 g002aCatalysts 07 00227 g002b
Figure 3. First and second hydration levels of CALB in MTBE as a function of water activity. Mean values and standard deviations (error bars) were calculated from the last 10 ns of each simulation performed at a given water activity, aw (Table 1).
Catalysts 07 00227 g003
Figure 4. The spatial distribution of water occupancy at CALBsurface calculated for the CALB/MTBE systems at water activities of (a) 0.18; (b) 0.26; (c) 0.33; (d) 0.47 and (e) 0.54 averaged over the last 10 ns of each simulation. The contours are shown for the isovalue 0.4. The enzyme is shown as carton representation and colored white. The active site residue, Ser105, is shown in red, and the spatial distribution of water molecules are shown in blue. Few preferred water binding sites (“hot spot regions”) on CALBsurface are highlighted by an arrow at the different water activities. Noticeable is that the hot spot regions gradually expand with increasing water activity from 0.18 to 0.54.
Catalysts 07 00227 g004
Figure 5. The hot spot regions on CALBsurface are shown at water activity 0.18 (system I) and 0.54 (system V). CALB is shown in surface representation. The residues are colored based on their nw value. The residues with maximum nw value are shown in blue, as the nw decrease the color changes from blue to red via white. The red colors identifies the residues with minimal nw. The active site residue, Ser105, is shown as van der Waals presentation and colored yellow. The active site pocket is shown by an arrow. In order to give a complete view, two sides of CALB (front (left) and back (right)) are shown. Location of few hot shop regions (two near the entrance of the active site pocket (III, IV) and two distal from the active site pocket (I, II) with high affinity are indicated by circles.
Catalysts 07 00227 g005
Figure 6. Selected part of the hydrogen-bonding network of the hot spot region III located closely to the active site pocket of CALB at water activities (a) 0.18, (b) 0.33 and (c) 0.54. The network gradually increases with increasing water activity. At low water activity, there is only one water molecule, while with increasing water activity, more water molecules bind to that hot spot region leading to an increase in cluster size.
Catalysts 07 00227 g006aCatalysts 07 00227 g006b
Figure 7. (a) CALB with bound substrate molecules. (b) Water cluster at hot spot region III at high water activity. CALB is shown in cartoon representation. Substrate molecules (ethanol (E) and butyric acid (BA)) are shown in surface representation and colored red and yellow. Water molecules are shown in surface representation where oxygen and hydrogen atoms are colored red and white, respectively.
Catalysts 07 00227 g007
Figure 8. (a) The water accessible surface area (WASA) of CALB (left y-axis) and experimentally determined specific activity (right y-axis) are shown as a function of water activity, aw. (b) Number of the substrate molecules butyric acid (BA), ethanol and both butyric acid and ethanol (All) at CALBsurface as a function of water activity, aw.
Catalysts 07 00227 g008aCatalysts 07 00227 g008b
Figure 9. The variation of water mole fraction (xw) with distance (r in Å) from CALBsurface. A shell thickness of 0.5 Å was used in the calculations. Data are shown for system I (Table 1). The horizontal dashed line refers to Rbound.
Catalysts 07 00227 g009
Table 1. List of number of water molecules (nw), number of MTBE molecules (nMTBE), mole fraction (xw), bulk mole fraction (bulk xw), initial water activity (aw) and specific activity (mM·min−1·mg−1) for the CALB-catalyzed esterification reaction between butyric acid and ethanol in MTBE at different aw.
SystemnwnMTBExwBulk xwawSpecific Activity
I5417880.0290.00070.180.26172
II12017880.0630.00110.260.22522
III20417880.1020.00140.330.20815
IV28617880.1380.00200.470.1422
V35417520.1680.00230.540.11095

