
Support Screening Studies on the Hydrogenation of Levulinic Acid to γ-Valerolactone in Water Using Ru Catalysts


Abstract
: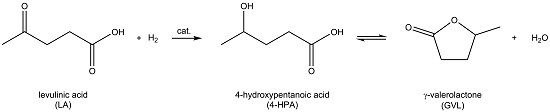
1. Introduction
2. Results and Discussion
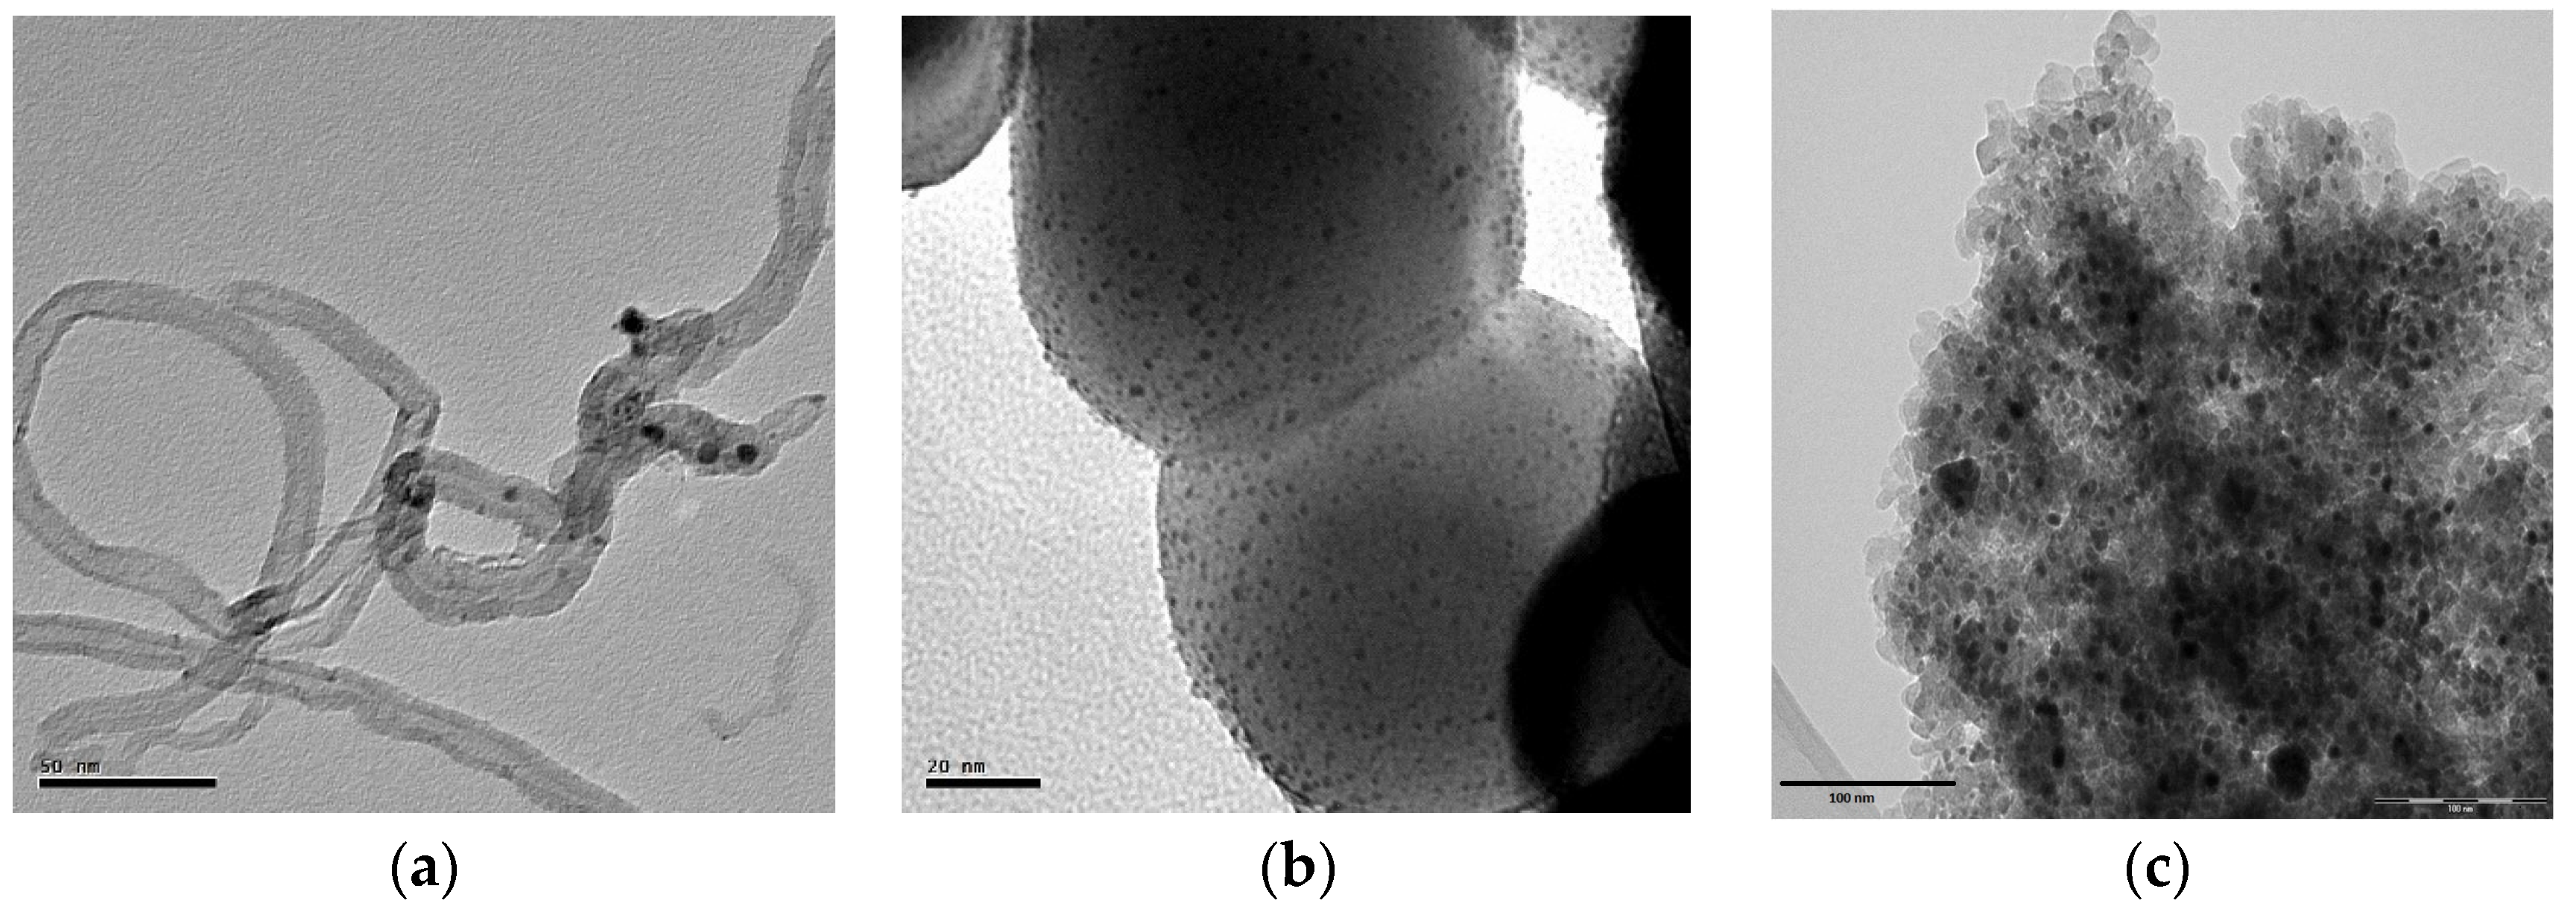
2.1. Catalyst Characterization
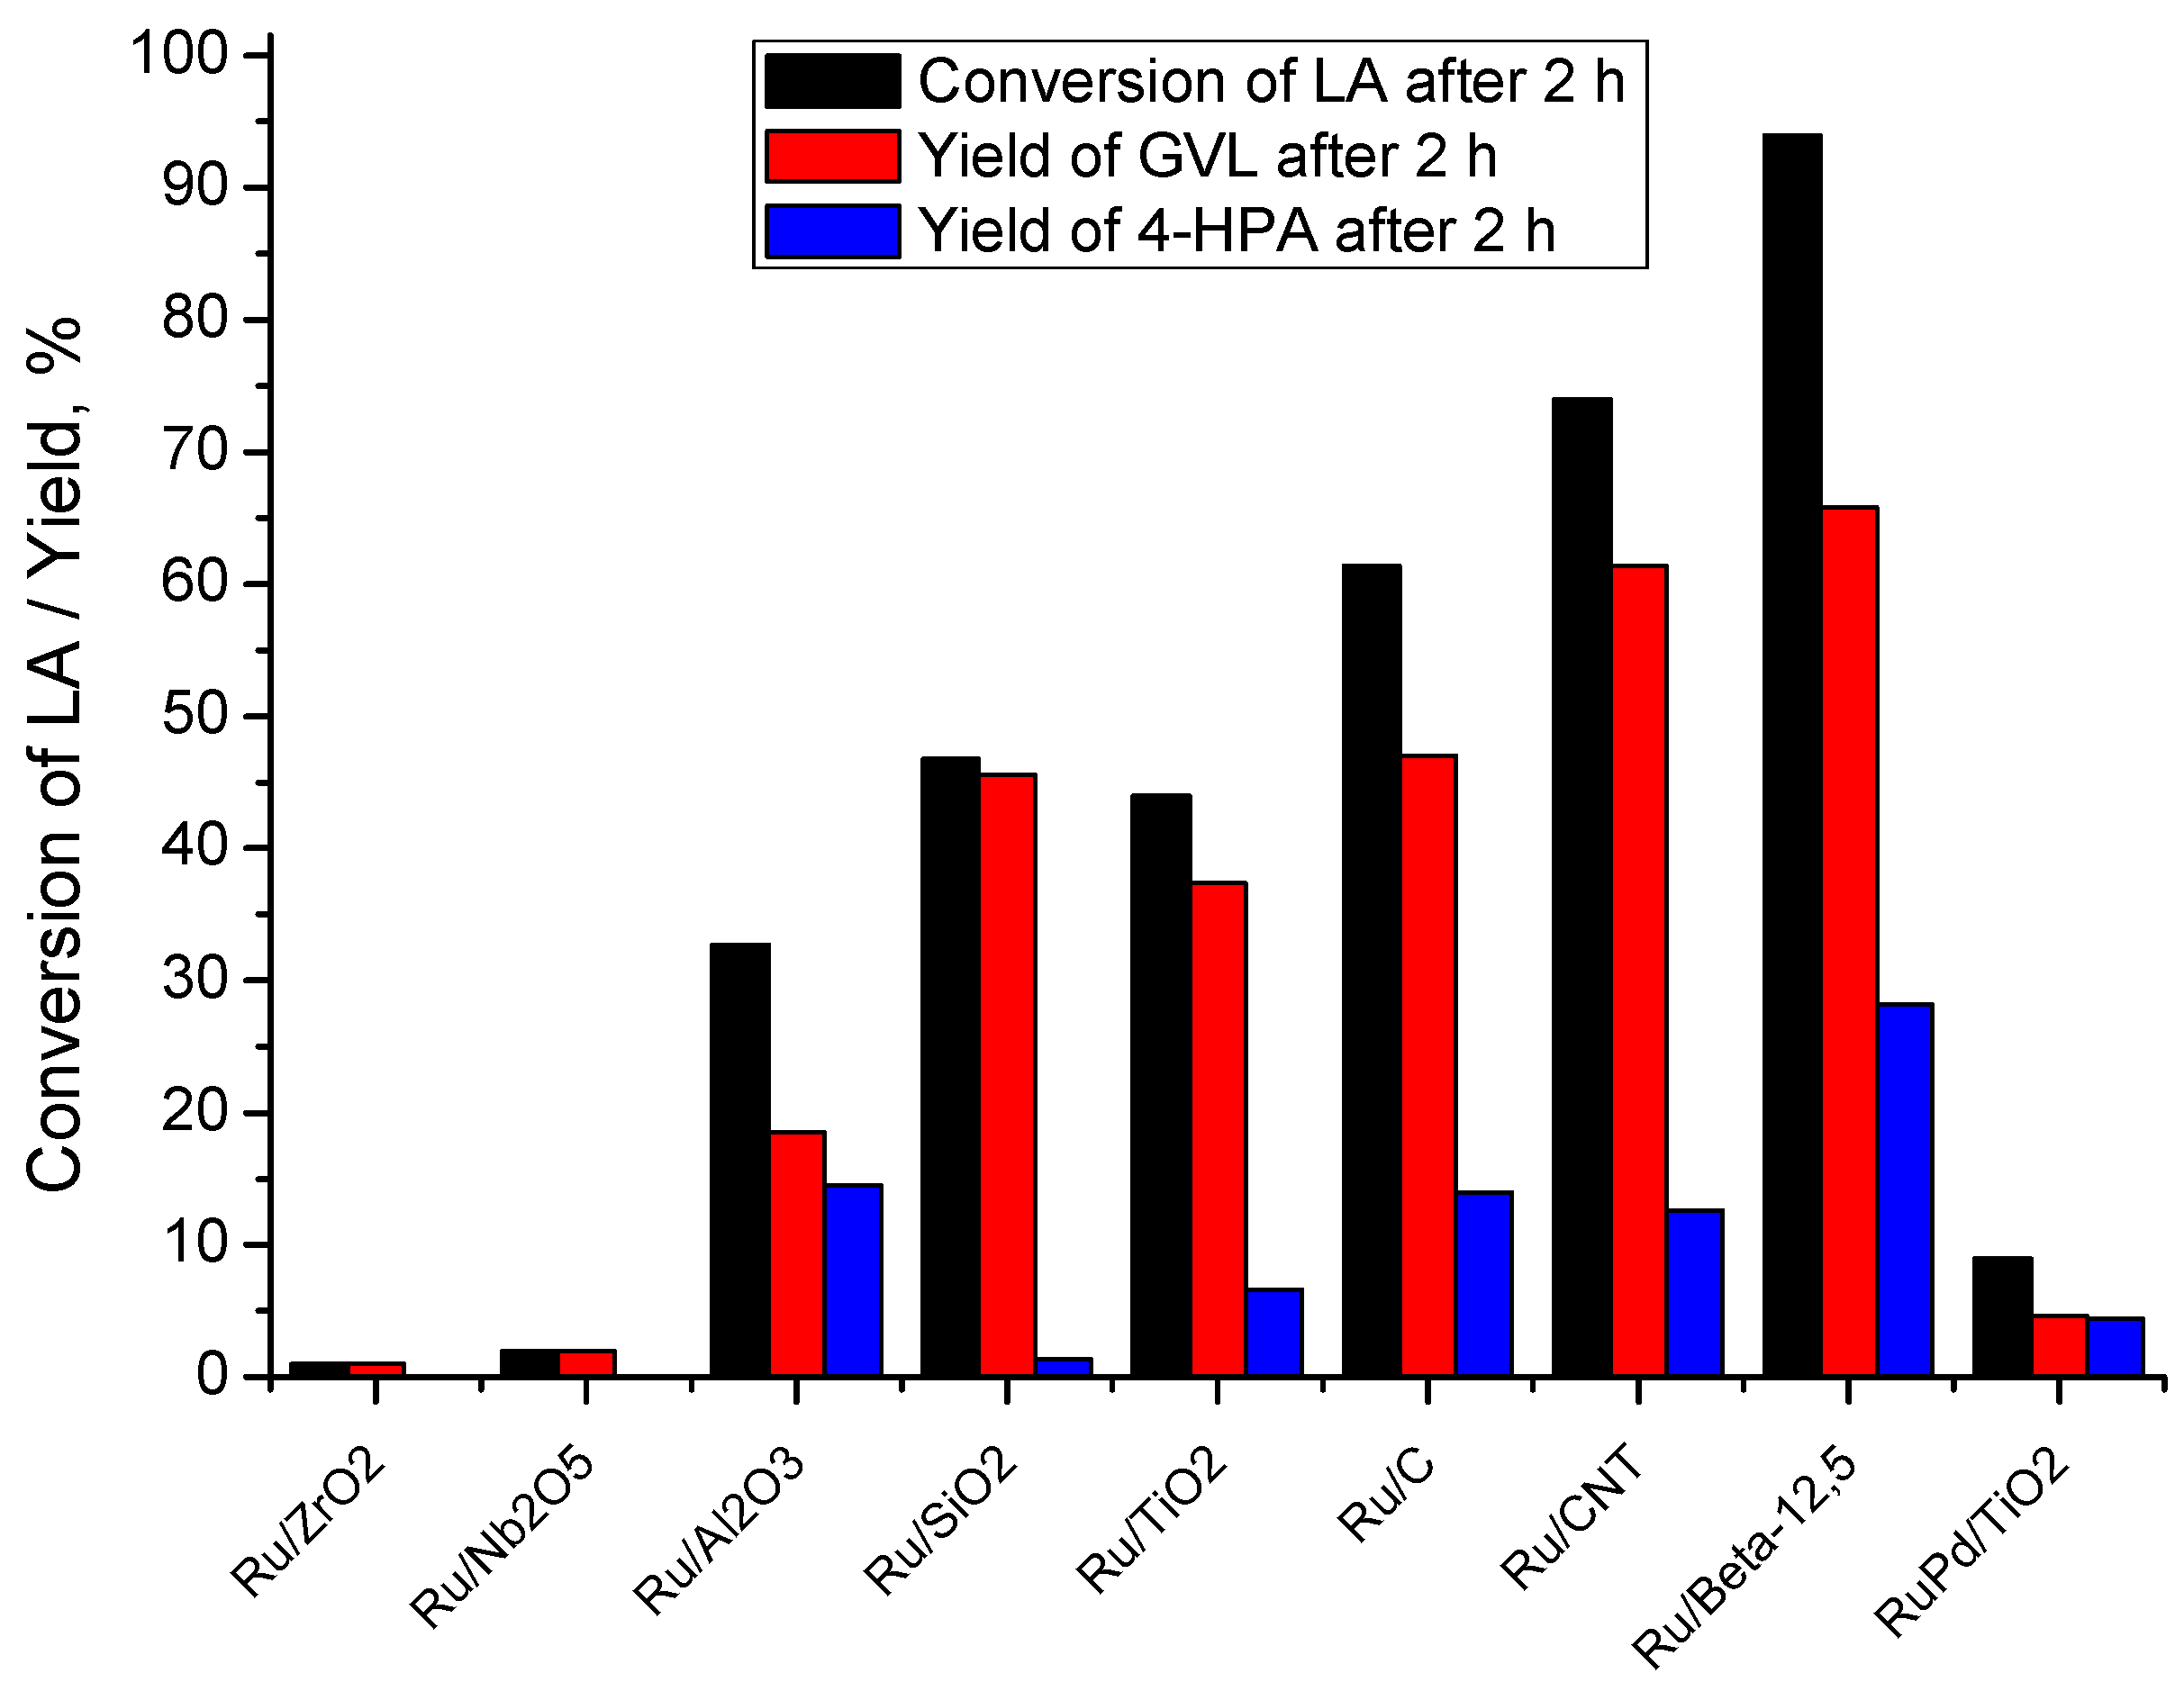
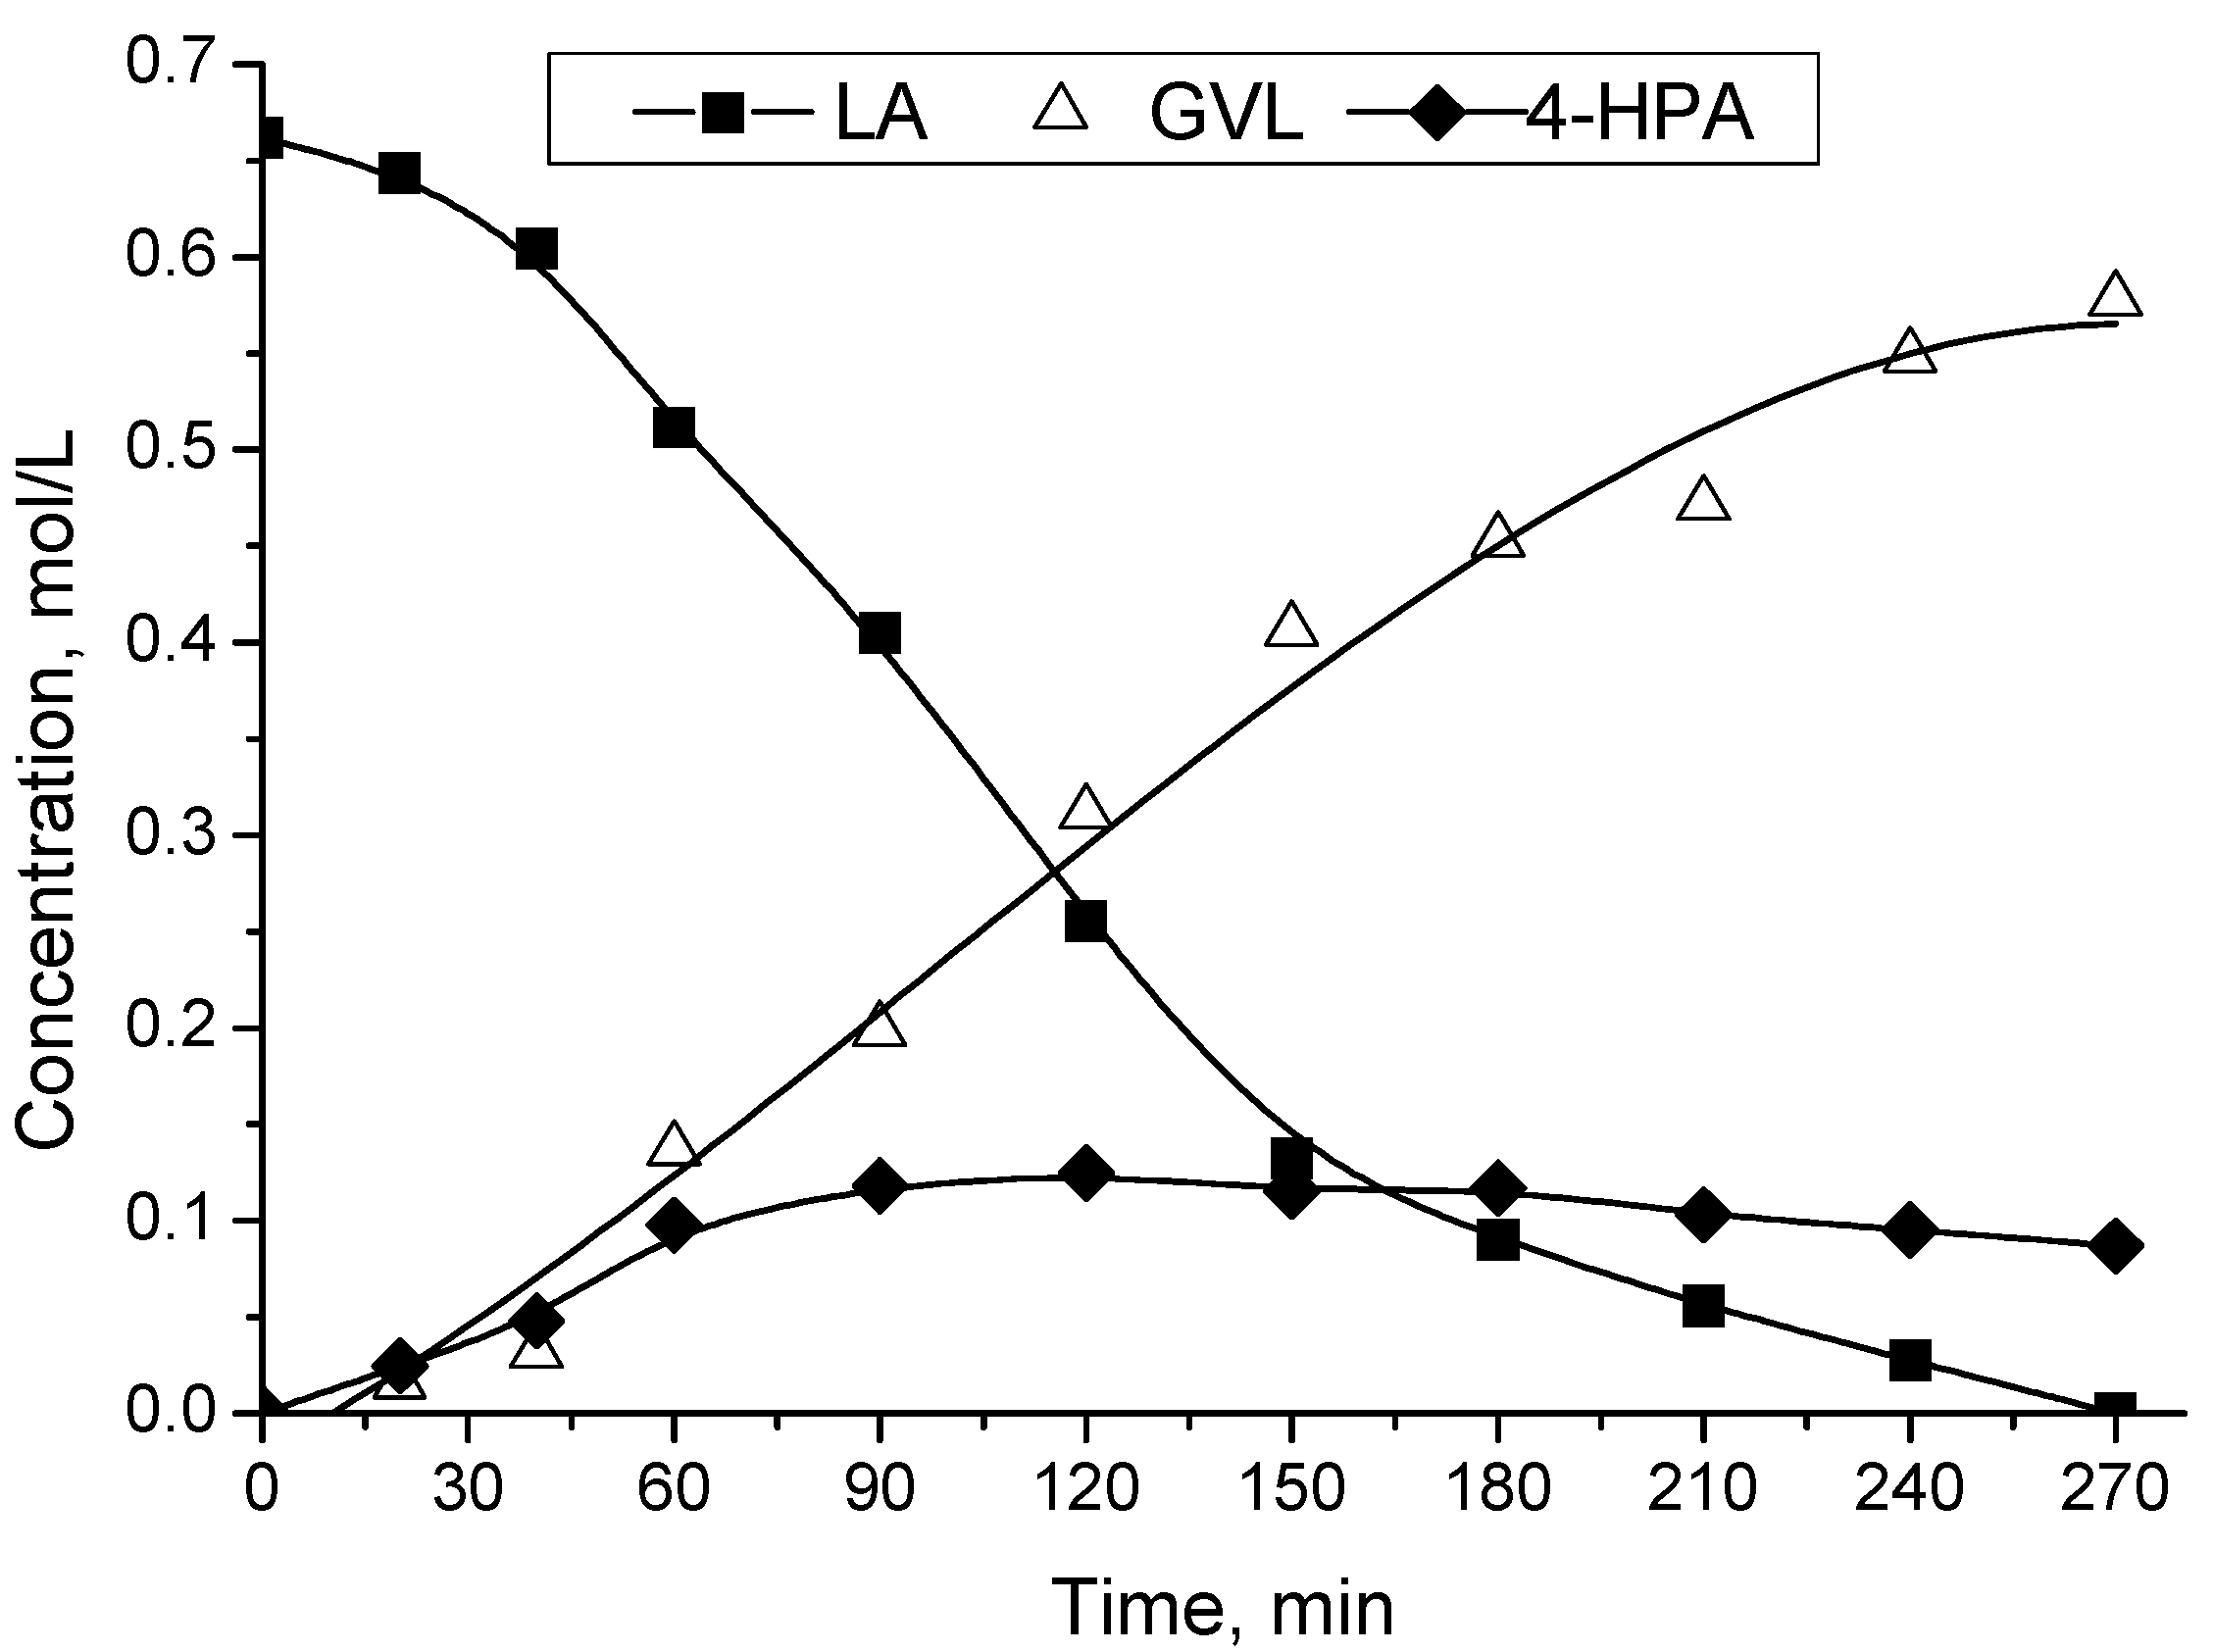
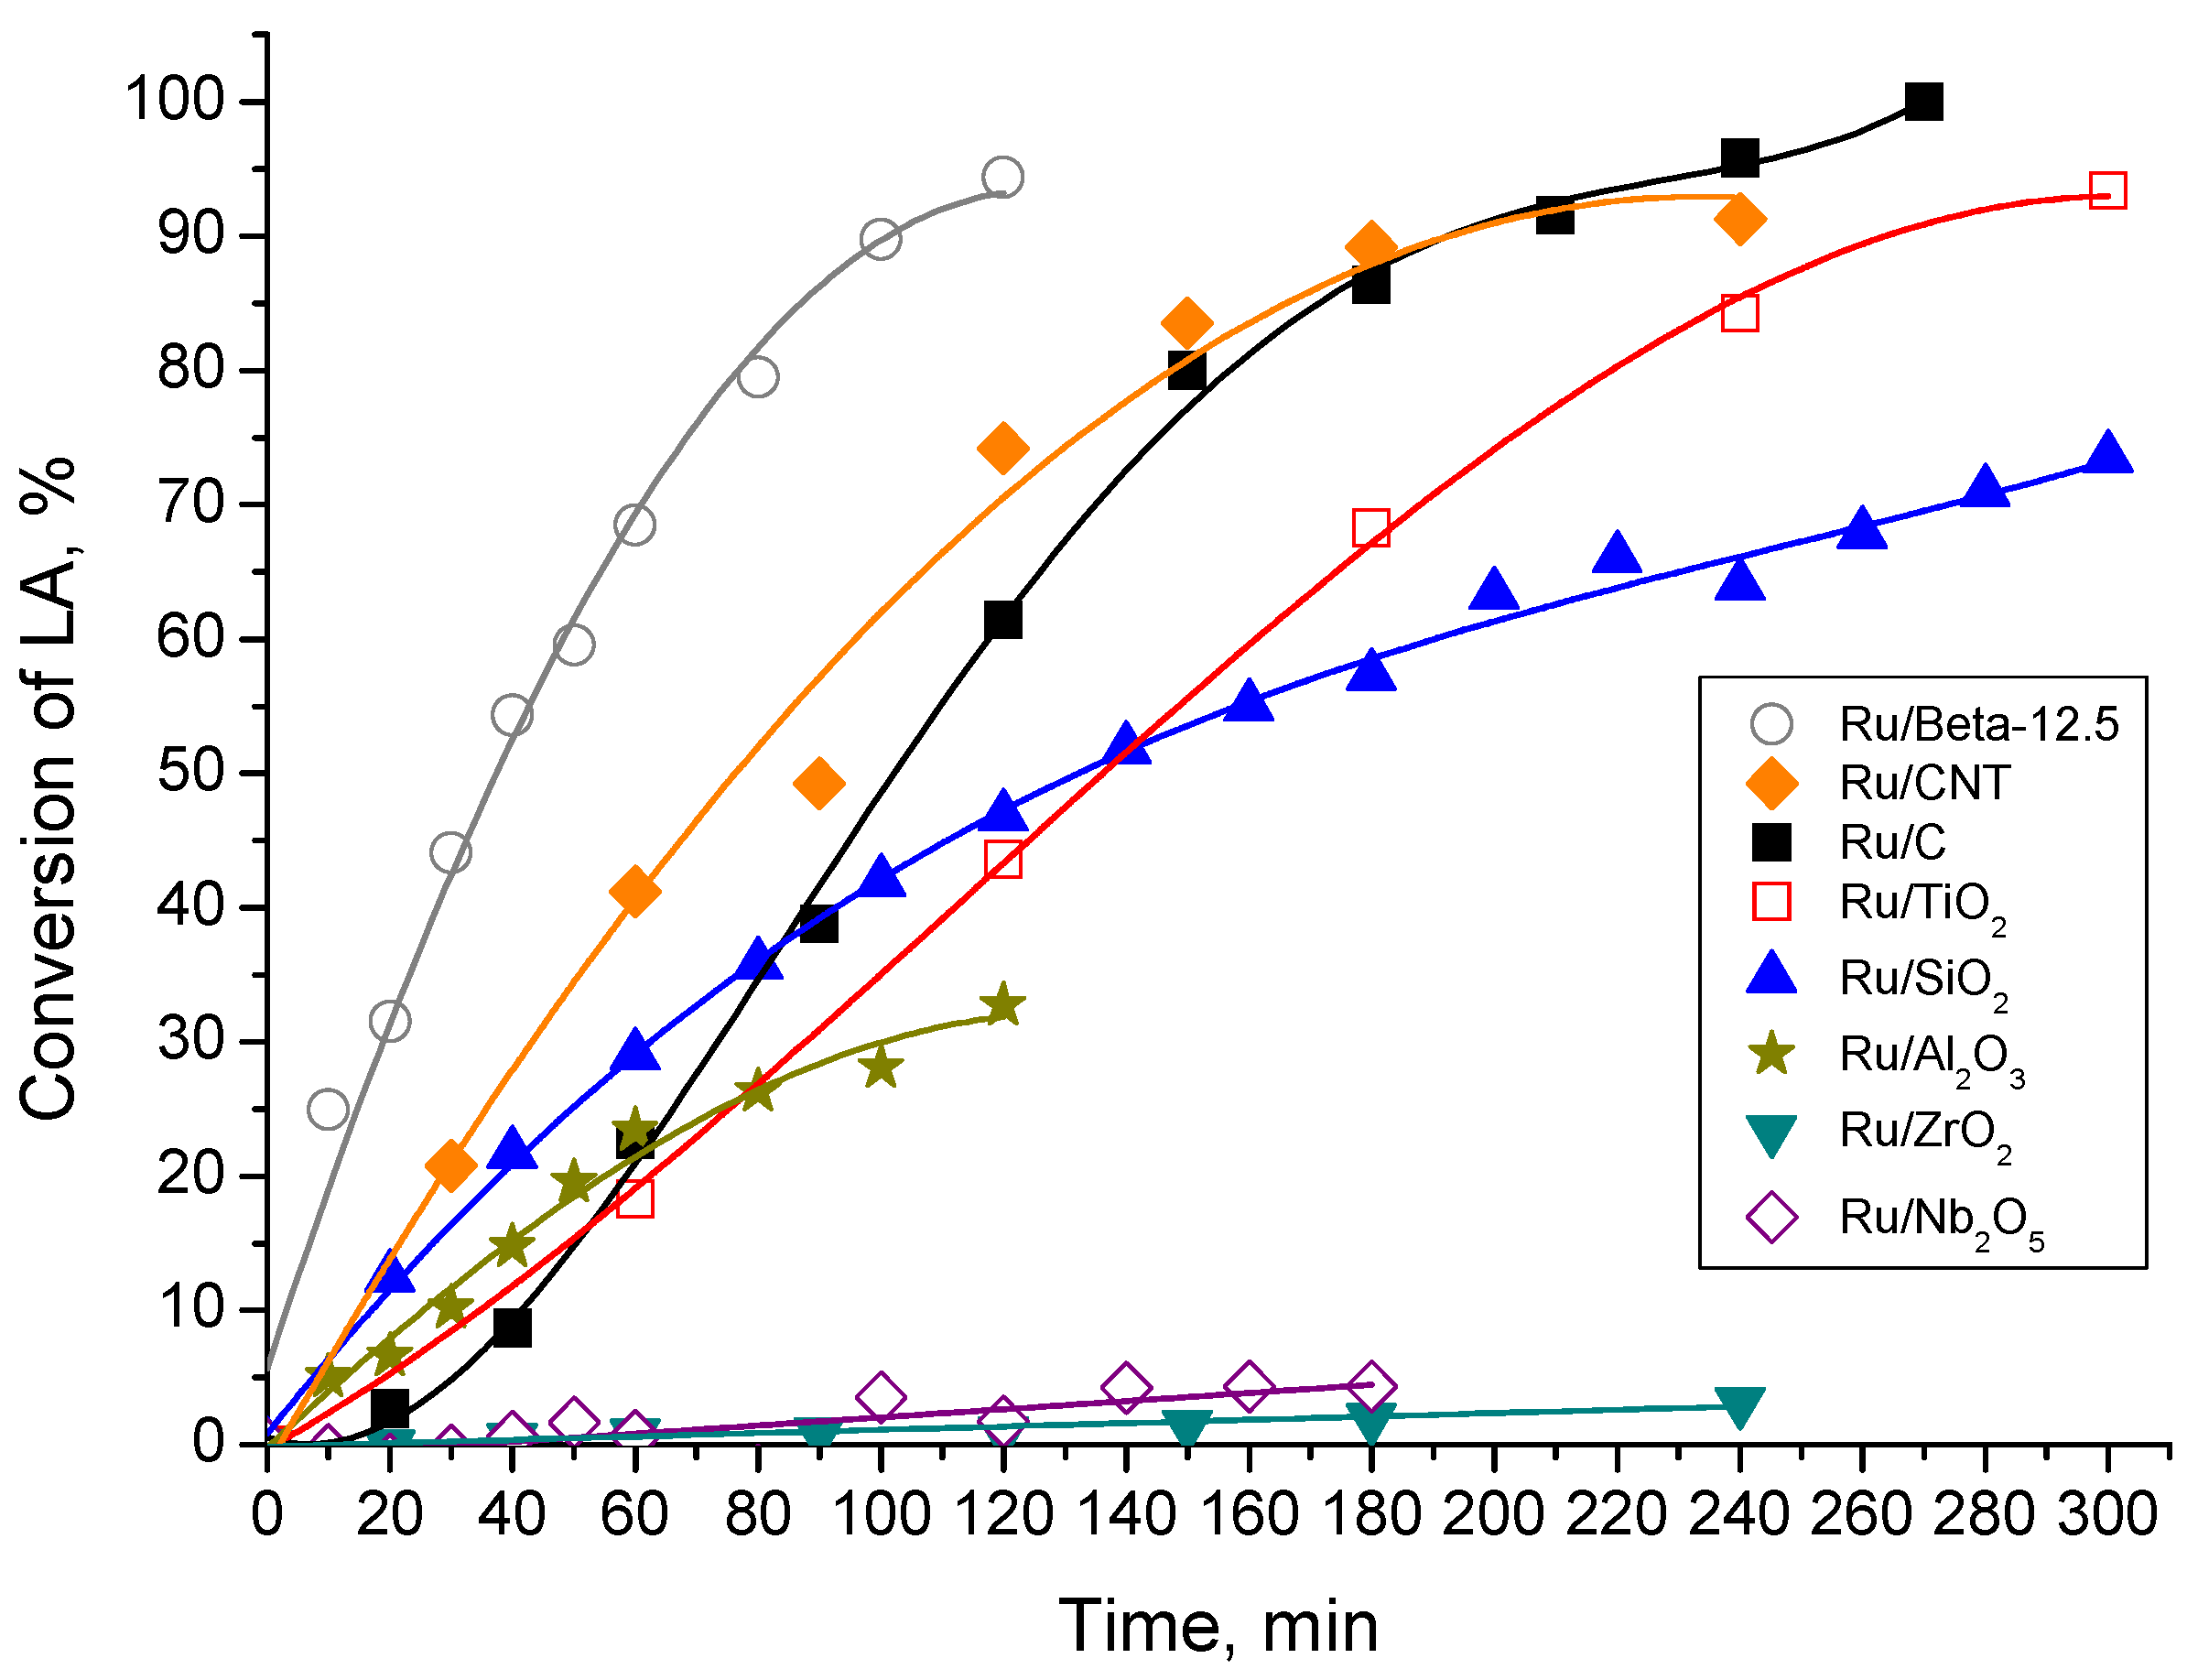
2.2. Catalytic LA Hydrogenation Experiments
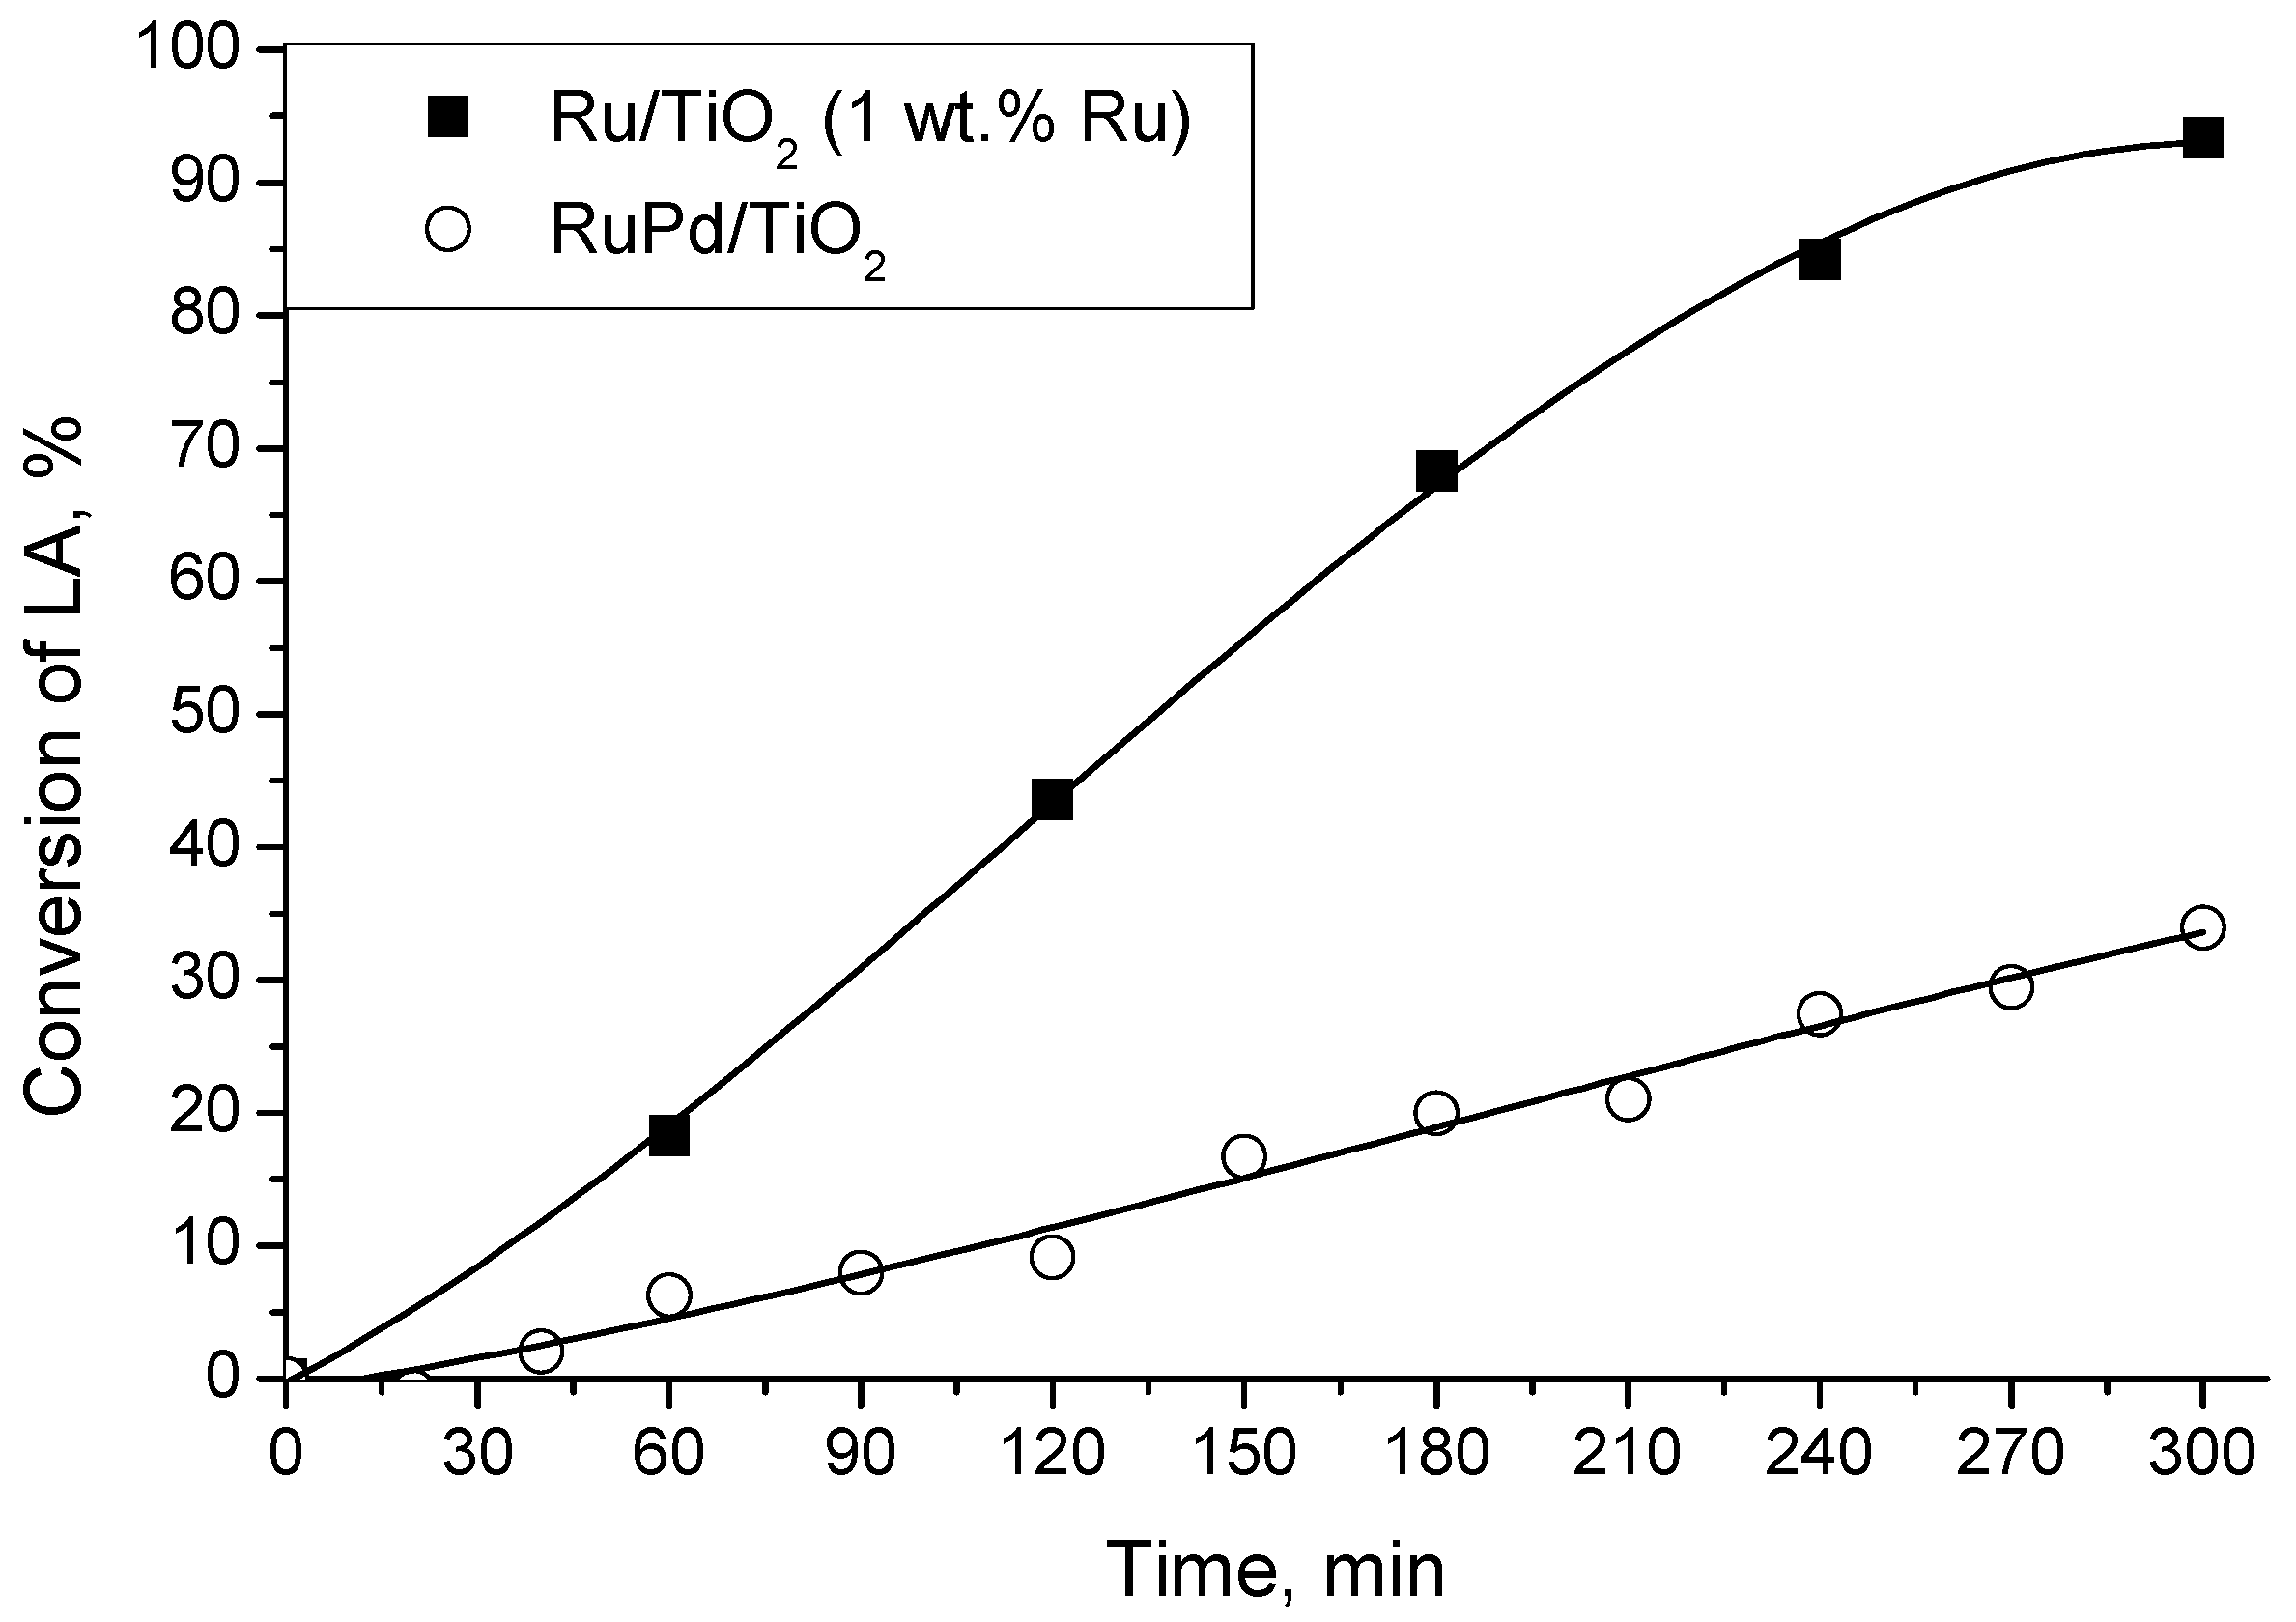
2.3. LA Hydrogenation with a Bimetallic Catalyst
2.4. Comparison of Activity of the Catalyst with Literature Data
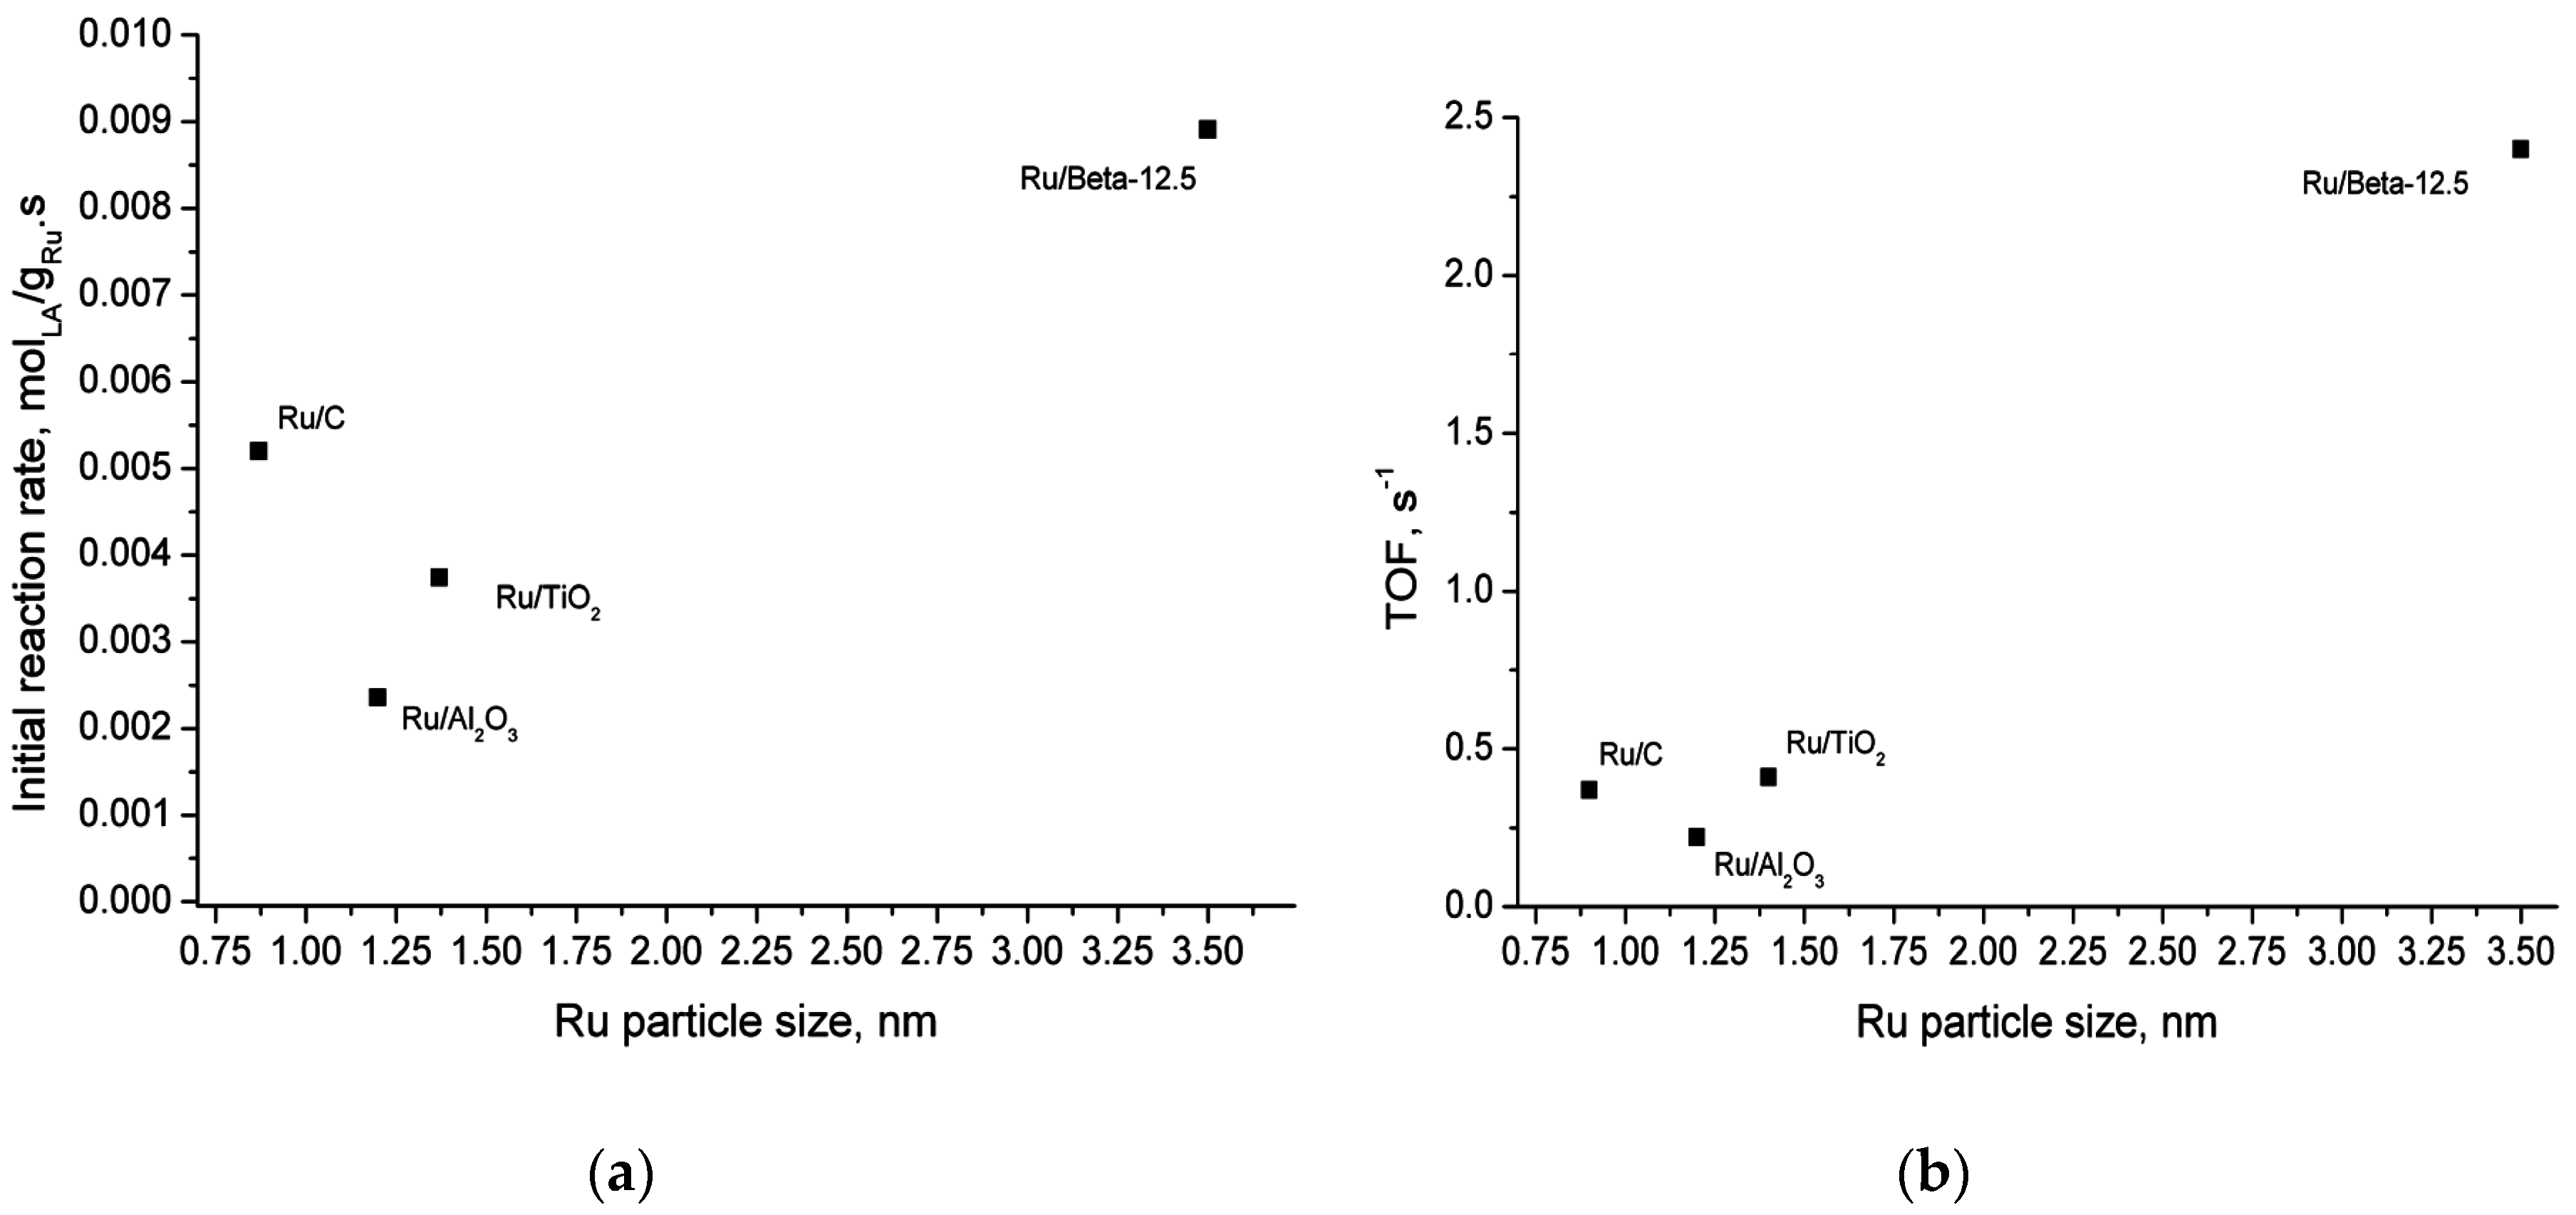
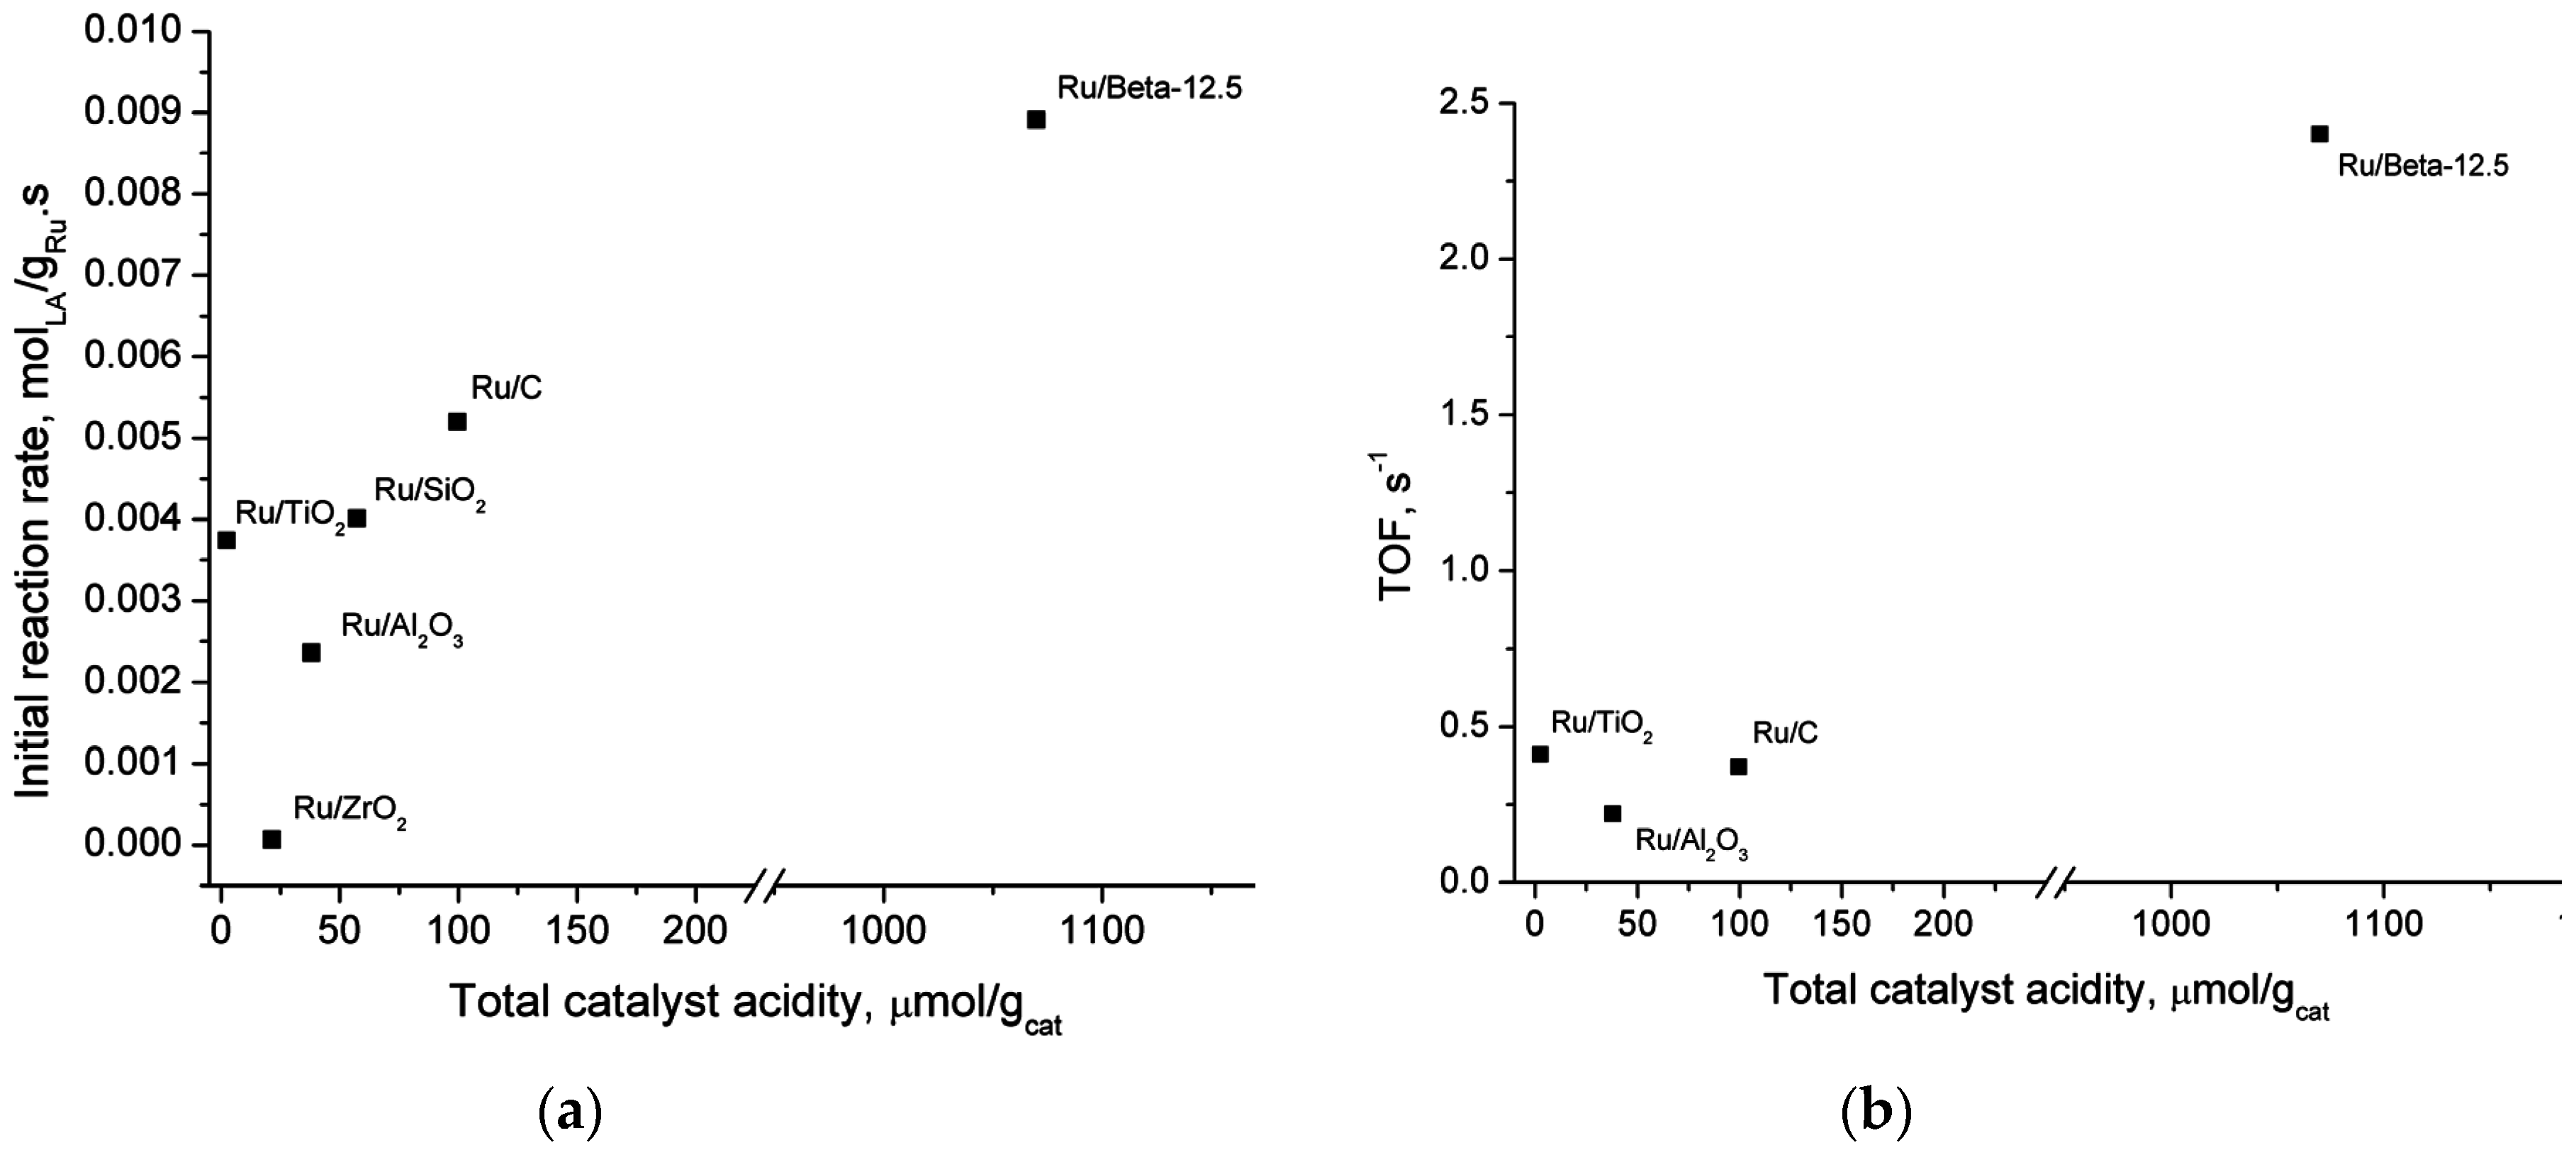
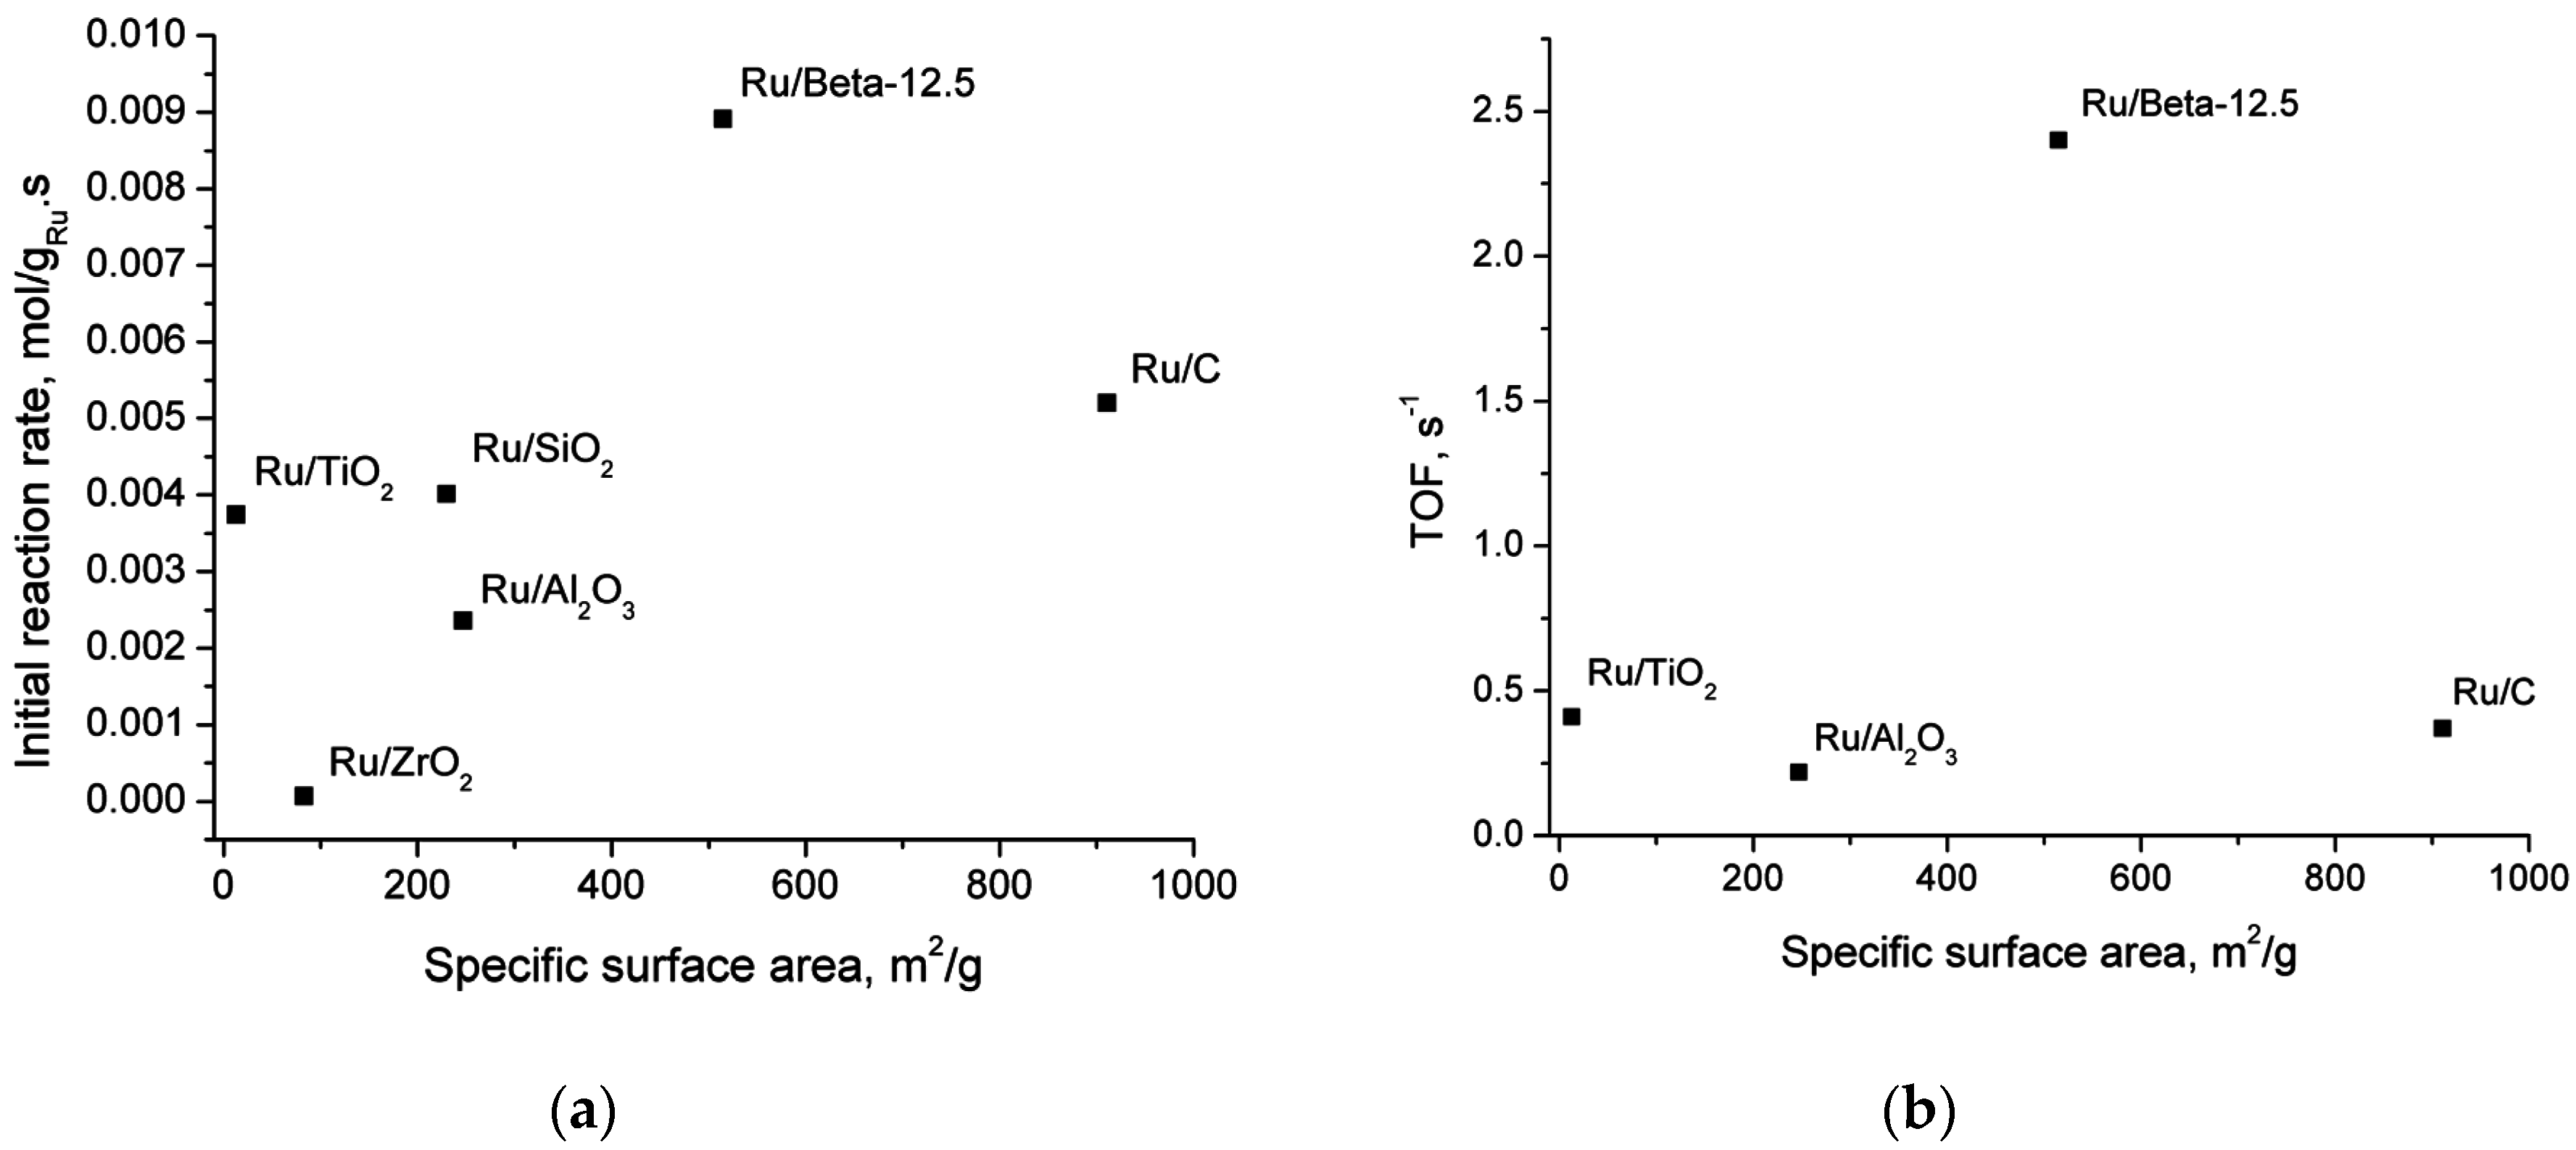
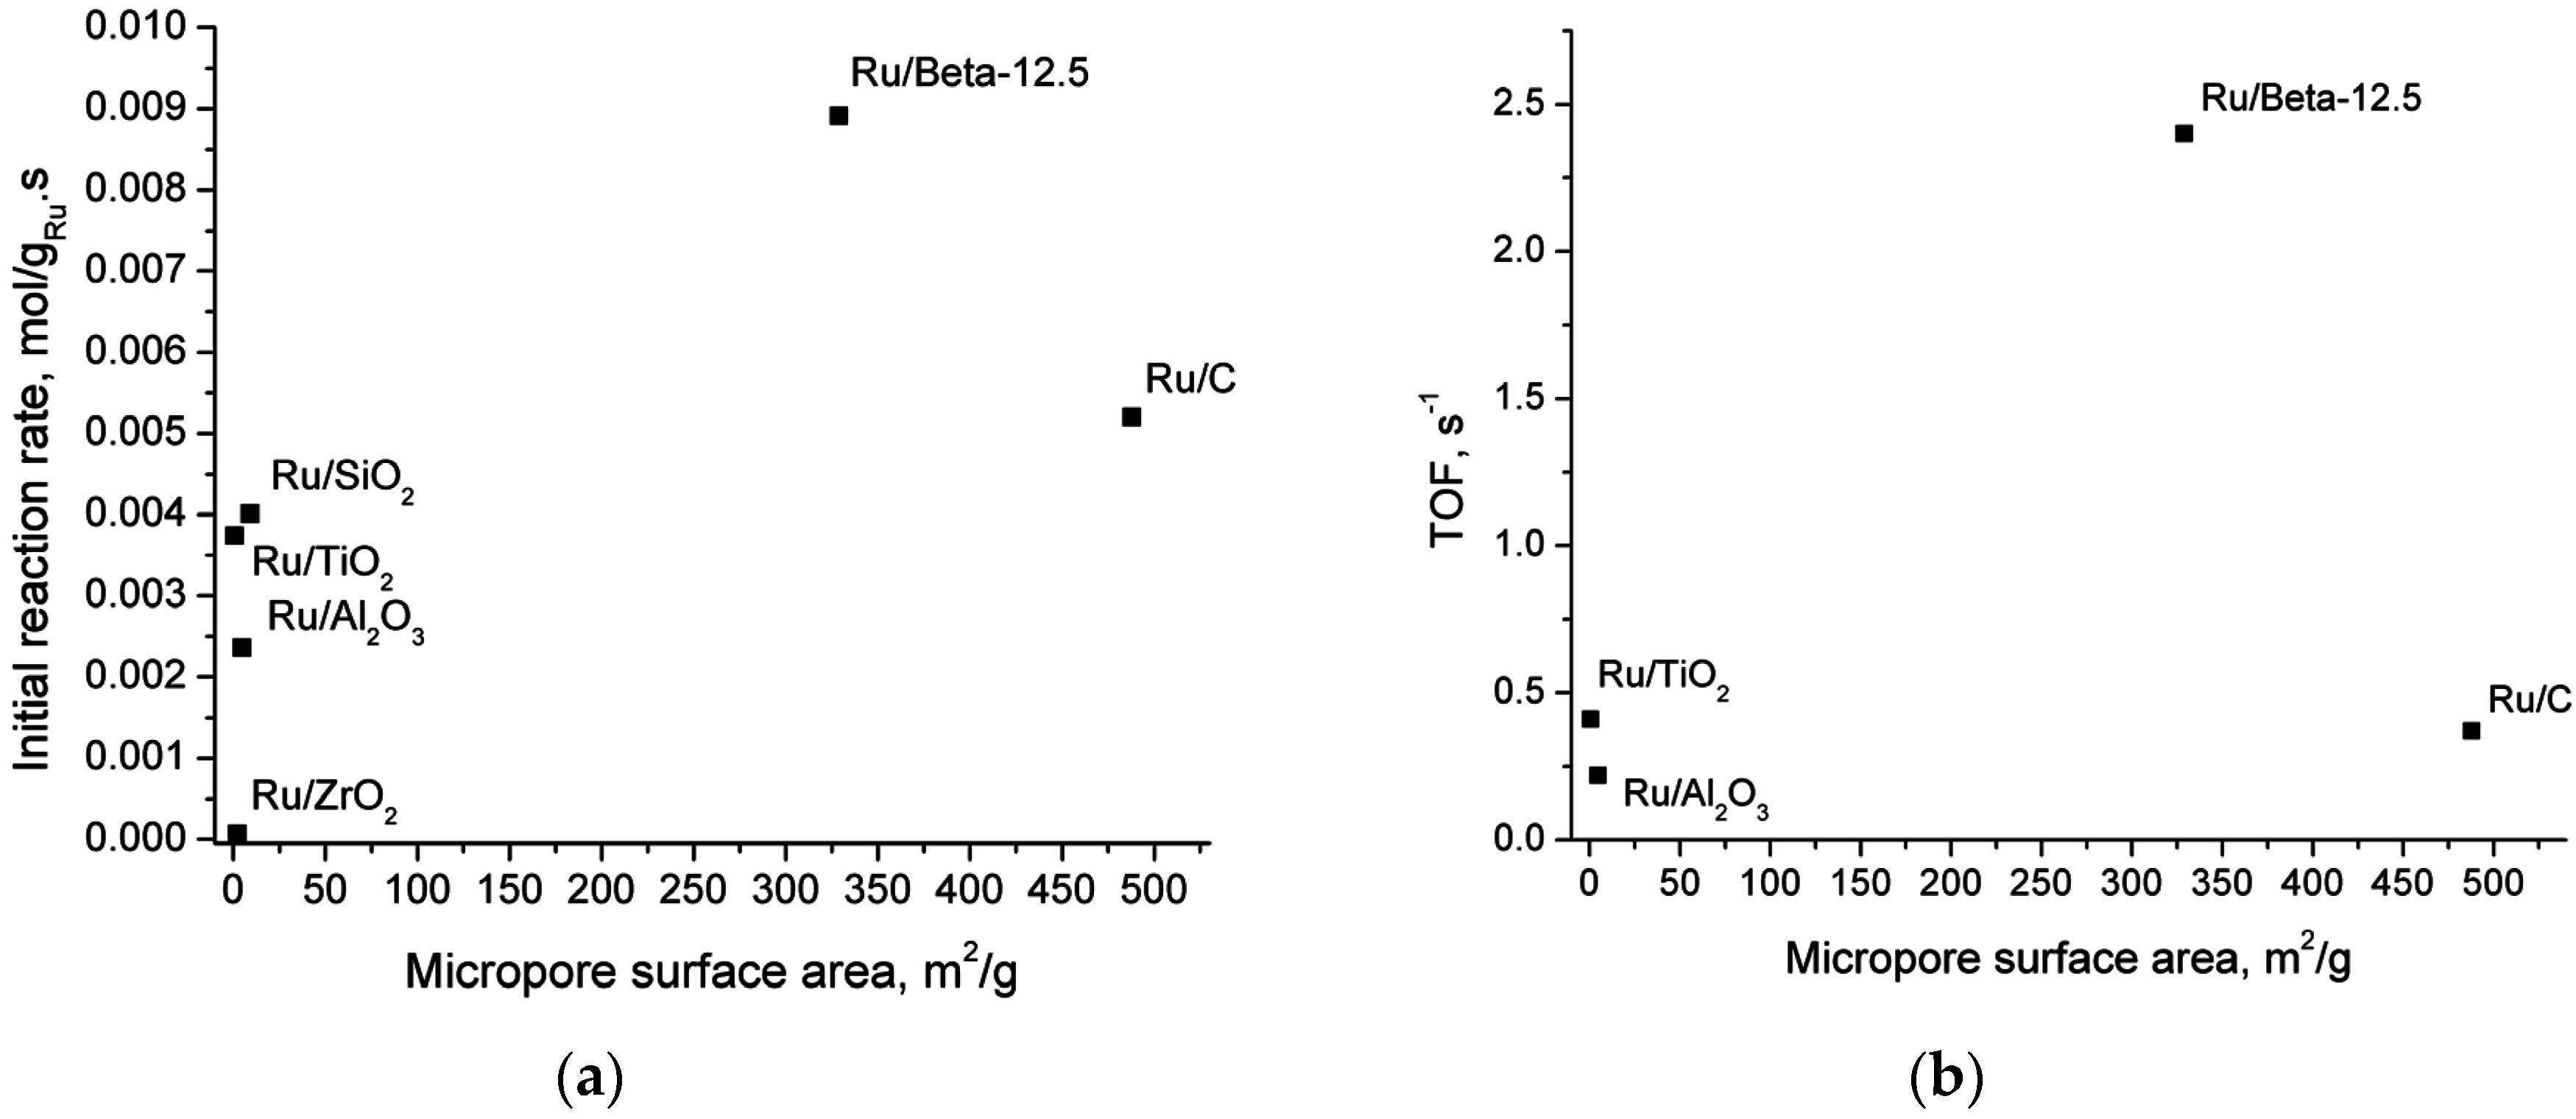
2.5. Catalyst Structure-Activity Relations
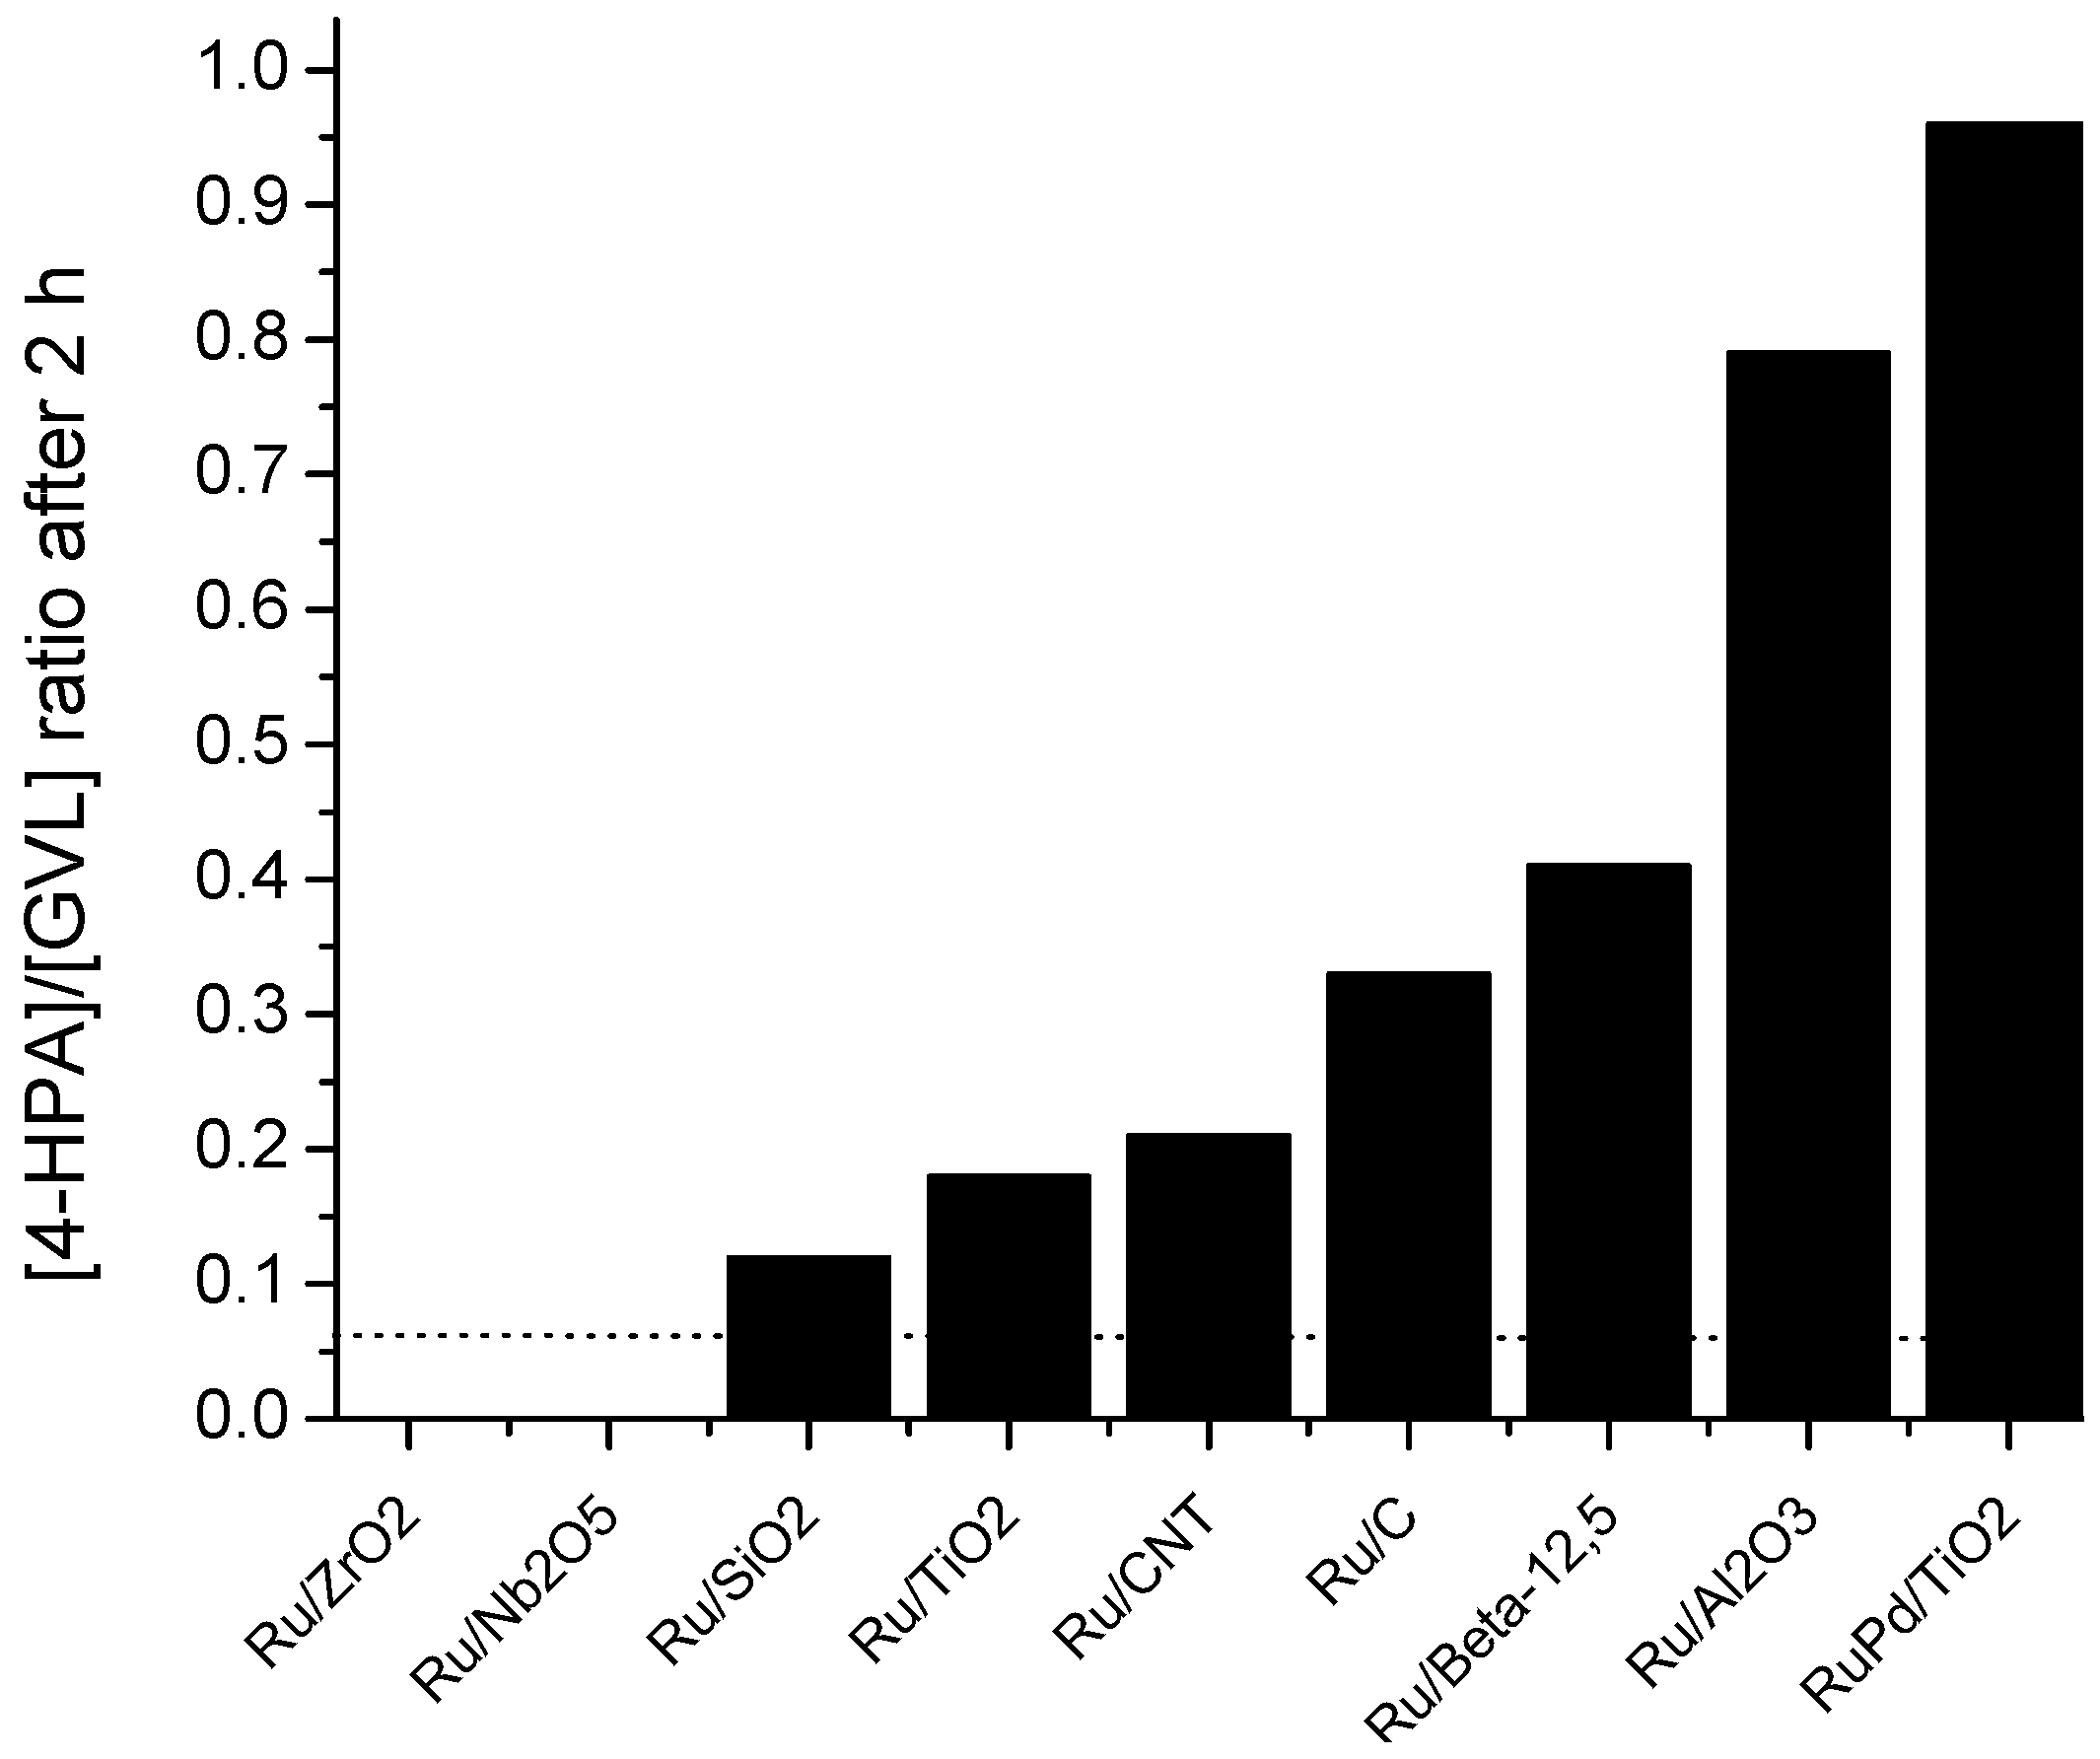
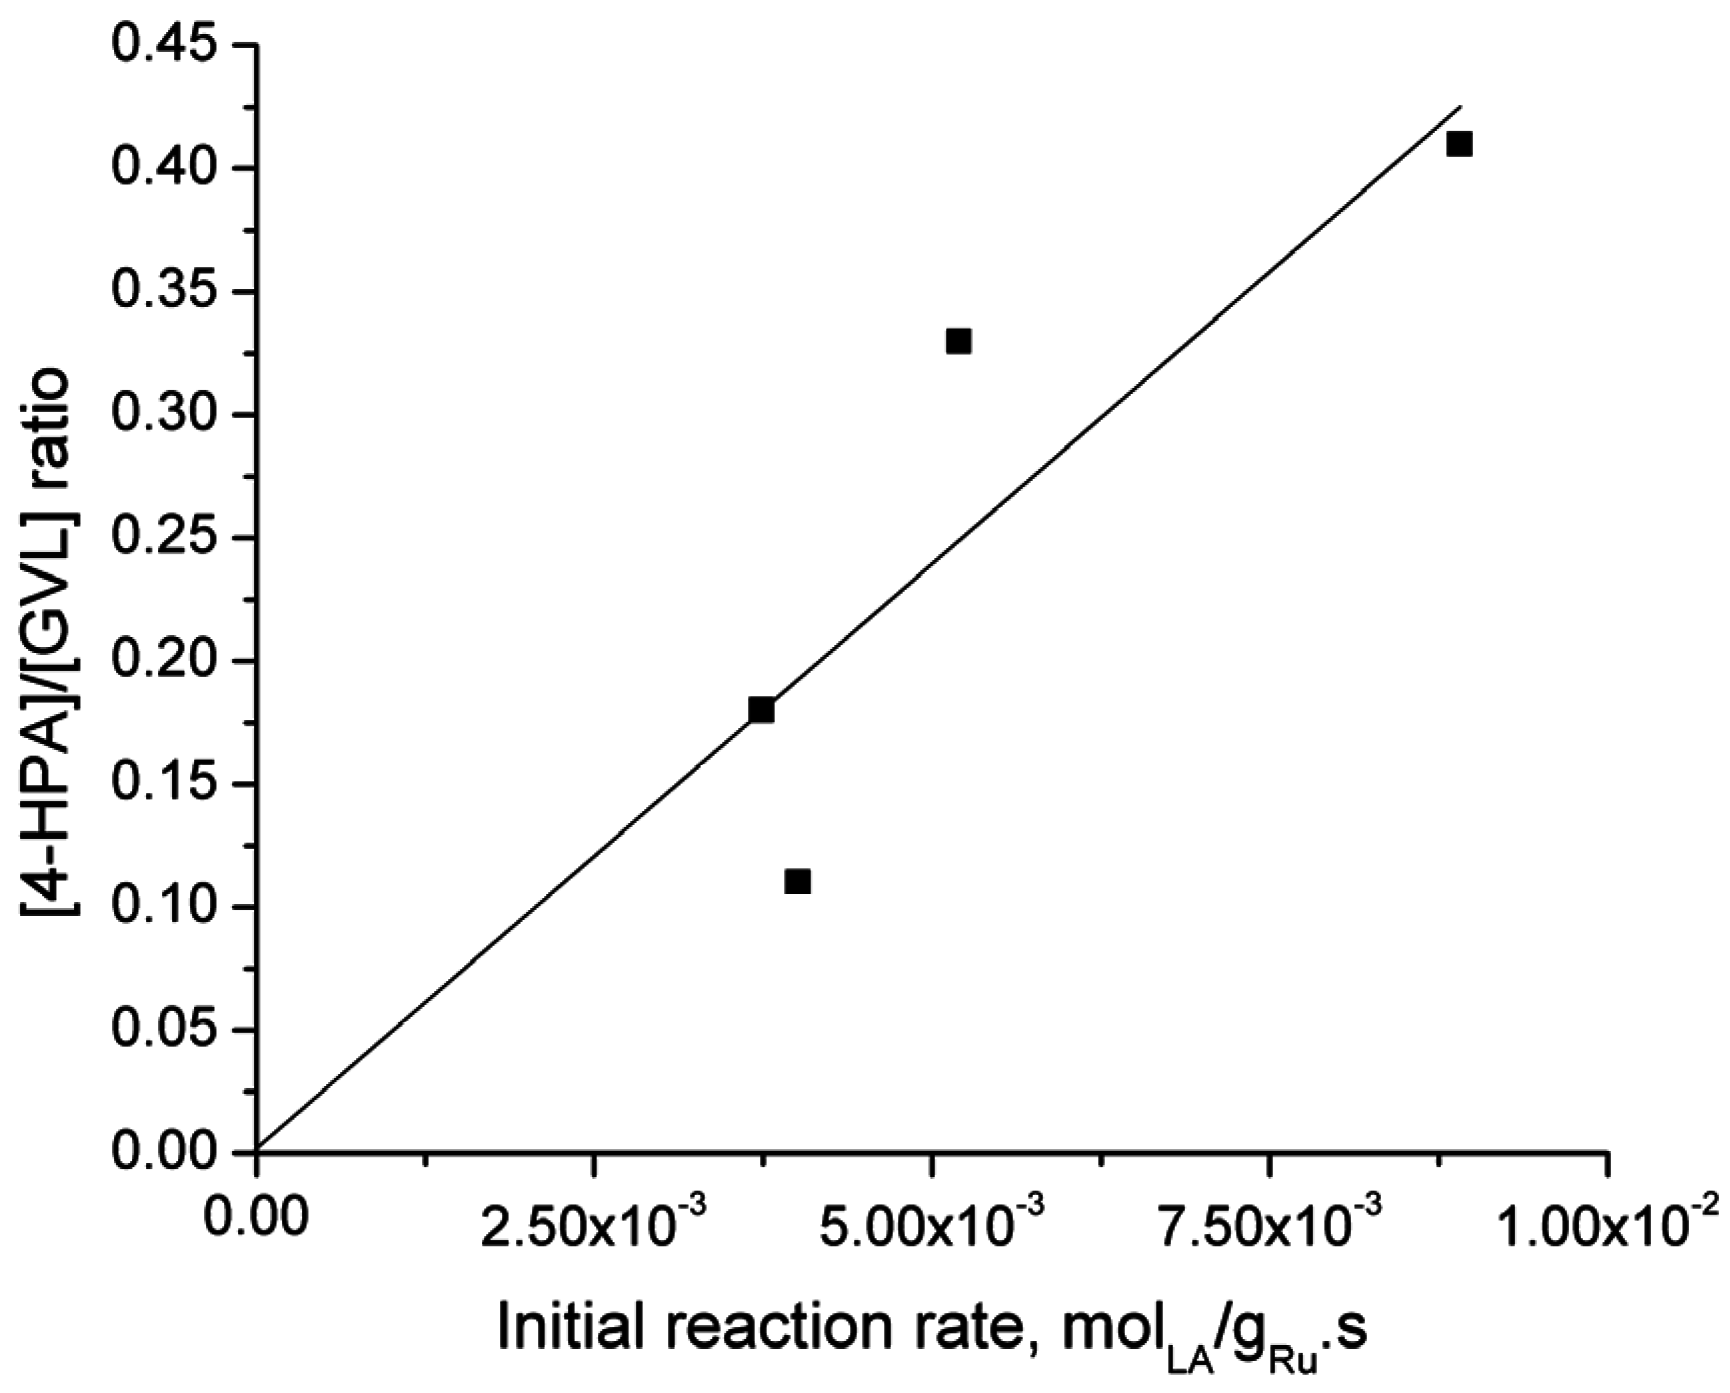
2.6. Catalyst Structure-Selectivity Relations
3. Experimental Section
3.1. Materials
3.2. Catalysts Preparation
3.3. Analysis
3.4. Catalytic Hydrogenation Experiments of LA
3.5. Definitions
3.6. Determination of the Concentrations of LA, GVL and 4-HPA
3.7. Determination of the Initial Rates
4. Conclusions
Supplementary Materials
Acknowledgments
Author Contributions
Conflicts of Interest
References
- Biddy, M.J.; Scarlata, C.; Kinchin, C. Chemicals from Biomass: A Market Assessment of Bioproducts with Near-Term Potential; National Renewable Energy Laboratory: Golden, CO, USA, 2016. [Google Scholar]
- Yan, K.; Jarvis, C.; Gu, J.; Yan, Y. Production and catalytic transformation of levulinic acid: A platform for speciality chemicals and fuels. Renew. Sustain. Energy Rev. 2015, 51, 986–997. [Google Scholar] [CrossRef]
- Morone, A.; Apte, M.; Pandey, R.A. Levulinic acid production from renewable waste resources: Bottlenecks, potential remedies, advancements and applications. Renew. Sustain. Energy Rev. 2015, 51, 548–565. [Google Scholar] [CrossRef]
- Liguori, F.; Moreno-Marrodan, C.; Barbaro, P. Environmentally friendly synthesis of γ-valerolactone by direct catalytic conversion of renewable sources. ACS Catal. 2015, 5, 1882–1894. [Google Scholar] [CrossRef]
- Manzer, L.E. Catalytic synthesis of α-methylene-γ-valerolactone: A biomass-derived acrylic monomer. Appl. Catal. A Gen. 2004, 272, 249–256. [Google Scholar] [CrossRef]
- Al-Shaal, M.G.; Wright, W.R.H.; Palkovits, R. Exploring the ruthenium catalysed synthesis of γ-valerolactone in alcohols and utilisation of mild solvent-free reaction conditions. Green Chem. 2012, 14, 1260–1263. [Google Scholar] [CrossRef]
- Michel, C.; Zaffran, J.; Ruppert, A.M.; Matras-Michalska, J.; Jędrzejczyk, M.; Grams, J.; Sautet, P. Role of water in metal catalyst performance for ketone hydrogenation: A joint experimental and theoretical study on levulinic acid conversion into gamma-valerolactone. Chem. Commun. 2014, 50, 12450–12453. [Google Scholar] [CrossRef] [PubMed]
- Piskun, A.; van de Bovenkamp, H.H.; Rasrendra, C.B.; Winkelman, J.G.M.; Heeres, H.J. Kinetic modeling of levulinic acid hydrogenation to γ-valerolactone in water using a carbon supported ruthenium catalyst. Appl. Catal. A 2016, 525, 1–10. [Google Scholar] [CrossRef]
- Yang, Y.; Gao, G.; Zhang, X.; Li, F. Facile fabrication of composition-tuned Ru-Ni bimetallics in ordered mesoporous carbon for levulinic acid hydrogenation. ACS Catal. 2014, 4, 1419–1425. [Google Scholar] [CrossRef]
- Ding, D.; Wang, J.; Xi, J.; Liu, X.; Lu, G.; Wang, Y. High-yield production of levulinic acid from cellulose and its upgrading to γ-valerolactone. Green Chem. 2014, 16, 3846–3853. [Google Scholar] [CrossRef]
- Castelijns, A.M.C.F.; Janssen, M.C.C.; Vaessen, H.W.L.M. Process to Produce Valerolactone from Levulinic Acid. U.S. Patent 20120329981A1, 27 December 2012. [Google Scholar]
- Raspolli Galletti, A.M.; Antonetti, C.; De Luise, V.; Martinelli, M. A sustainable process for the production of γ-valerolactone by hydrogenation of biomass-derived levulinic acid. Green Chem. 2012, 14, 688–694. [Google Scholar] [CrossRef]
- Yan, Z.P.; Lin, L.; Liu, S. Synthesis of γ-valerolactone by hydrogenation of biomass-derived levulinic acid over Ru/C catalyst. Energy Fuels 2009, 23, 3853–3858. [Google Scholar] [CrossRef]
- Gong, Y.; Lin, L.; Yan, Z. Catalytic hydrogenation and oxidation of biomass-derived levulinic acid. BioResources 2011, 6, 686–699. [Google Scholar]
- Luque, R.; Clark, J.H. Water-tolerant Ru-Starbon® materials for the hydrogenation of organic acids in aqueous ethanol. Catal. Commun. 2010, 11, 928–931. [Google Scholar] [CrossRef]
- Hengne, A.M.; Kamble, S.B.; Rode, C.V. Single pot conversion of furfuryl alcohol to levulinic esters and γ-valerolactone in the presence of sulfonic acid functionalized ILs and metal catalysts. Green Chem. 2013, 15, 2540–2547. [Google Scholar] [CrossRef]
- Abdelrahman, O.A.; Luo, H.Y.; Heyden, A.; Román-Leshkov, Y.; Bond, J.Q. Toward rational design of stable, supported metal catalysts for aqueous-phase processing: Insights from the hydrogenation of levulinic acid. J. Catal. 2015, 329, 10–21. [Google Scholar] [CrossRef]
- Alonso, D.M.; Wettstein, S.G.; Dumesic, J.A. Gamma-valerolactone, a sustainable platform molecule derived from lignocellulosic biomass. Green Chem. 2013, 15, 584–595. [Google Scholar] [CrossRef]
- Chalid, M. Levulinic Acid as a Renewable Source for Novel Polymers. Ph.D. Thesis, University of Groningen, Groningen, The Netherlands, 18 June 2012. [Google Scholar]
- Xianlong, D.; Yongmei, L.; Jianqiang, W.; Yong, C.; Kangnian, F. Catalytic conversion of biomass-derived levulinic acid into γ-valerolactone using iridium nanoparticles supported on carbon nanotubes. Chin. J. Catal. 2013, 34, 993–1001. [Google Scholar]
- Pan, X.L.; Fan, Z.L.; Chen, W.; Ding, Y.J.; Luo, H.Y.; Bao, X.H. Enhanced ethanol production inside carbon-nanotube reactors containing catalytic particles. Nat. Mater. 2007, 6, 507–511. [Google Scholar] [CrossRef] [PubMed]
- Xiao, C.; Goh, T.-W.; Qi, Z.; Goes, S.; Brashler, K.; Perez, C.; Huang, W. Conversion of levulinic acid to γ-valerolactone over few-layer graphene-supported ruthenium catalysts. ACS Catal. 2016, 6, 593–599. [Google Scholar] [CrossRef]
- Mai, E.F.; Machado, M.A.; Davies, T.E.; Lopez-Sanchez, J.A.; da Silva, V.T. Molybdenum carbide nanoparticles within carbon nanotubes as superior catalysts for γ-valerolactone production via levulinic acid hydrogenation. Green Chem. 2014, 16, 4092–4097. [Google Scholar] [CrossRef]
- Lange, J.-P. Renewable feedstocks: The problem of catalyst deactivation and its mitigation. Angew. Chem. Int. Ed. 2015, 54, 13186–13197. [Google Scholar] [CrossRef] [PubMed]
- Lange, J.-P.; Price, R.; Ayoub, P.M.; Louis, J.; Petrus, L.; Clarke, L.; Gosselink, H. Valeric biofuels: A platform of cellulosic transportation fuels. Angew. Chem. Int. Ed. 2010, 49, 4479–4483. [Google Scholar] [CrossRef] [PubMed]
- Luo, W.; Deka, U.; Beale, A.M.; van Eck, E.R.H.; Bruijnincx, P.C.A.; Weckhuysen, B.M. Ruthenium-catalyzed hydrogenation of levulinic acid: Influence of the support and solvent on catalyst selectivity and stability. J. Catal. 2013, 301, 175–186. [Google Scholar] [CrossRef]
- Luo, W.; Bruijnincx, P.C.A.; Weckhuysen, B.M. Selective, one-pot catalytic conversion of levulinic acid to pentanoic acid over Ru/H-ZSM-5. J. Catal. 2014, 320, 33–41. [Google Scholar] [CrossRef]
- Bourne, R.A.; Stevens, J.G.; Ke, J.; Poliakoff, M. Maximising opportunities in supercritical chemistry: The continuous conversion of levulinic acid to γ-valerolactone in CO2. Chem. Commun. 2007, 4632–4634. [Google Scholar] [CrossRef] [PubMed]
- Manzer, L.E.; Hutchenson, K.W. Production of 5-Methylbutyrolactone from Levulinic Acid. U.S. Patent 20040254384A1, 20 March 2003. [Google Scholar]
- Luo, W.; Sankar, M.; Beale, A.M.; He, Q.; Kiely, C.J.; Bruijnincx, P.C.A.; Weckhuysen, B.M. High performing and stable supported nano-alloys for the catalytic hydrogenation of levulinic acid to γ-valerolactone. Nat. Commun. 2015, 6, 6540–6550. [Google Scholar] [CrossRef] [PubMed]
- Sudhakar, M.; Kantam, M.L.; Jaya, V.S.; Kishore, R.; Ramanujachary, K.V.; Venugopal, A. Hydroxyapatite as a novel support for Ru in the hydrogenation of levulinic acid to γ-valerolactone. Catal. Commun. 2014, 50, 101–104. [Google Scholar] [CrossRef]
- Yao, Y.; Wang, Z.; Zhao, S.; Wang, D. A stable and effective Ru/polyethersulfone catalyst for levulinic acid hydrogenation to γ-valerolactone in aqueous solution. Catal. Today 2014, 234, 245–250. [Google Scholar] [CrossRef]
- Heeres, H.; Handana, R.; Chunai, D.; Rasrendra, C.B.; Girisuta, B.; Heeres, H.J. Combined dehydration/(transfer)-hydrogenation of C6-sugars (d-glucose and d-fructose) to γ-valerolactone using ruthenium catalysts. Green Chem. 2009, 11, 1247–1255. [Google Scholar] [CrossRef]
- Raspolli Galletti, A.M.; Antonetti, C.; Ribechini, E.; Colombini, M.P.; Nassi o Di Nasso, N.; Bonari, E. From gient reed to levulinic acid and gamma-valerolactone: A high yield catalytic route to valeric biofuels. Appl. Energy 2013, 102, 157–162. [Google Scholar] [CrossRef]
- Son, P.A.; Nishimura, S.; Ebitani, K. Production of γ-valerolactone from biomass-derived compounds using formic acid as a hydrogen source over supported metal catalysts in water solvent. RSC Adv. 2014, 4, 10525–10530. [Google Scholar] [CrossRef]
- Lee, M.; Seo, Y.; Shin, H.S.; Jo, C.; Ryoo, R. Anatase TiO2 nanosheets with surface acid, sites for Friedel-Crafts alkylation. Microporous Mesoporous Mater. 2016, 222, 185–191. [Google Scholar] [CrossRef]
- Kaplan, R.; Erjavec, B.; Dražić, G.; Grdadolnik, J.; Pintar, A. Simple synthesis of anatase/rutile/brookite TiO2 nanocomposite with superior mineralization potential for photocatalytic degradation of water pollutants. Appl. Catal. B 2016, 181, 465–474. [Google Scholar] [CrossRef]
- Lin, B.; Wei, K.; Ma, X.; Lin, J.; Ni, J. Study of potassium promoter effect for Ru/AC catalysts for ammonia synthesis. Catal. Sci. Technol. 2013, 3, 1367–1374. [Google Scholar] [CrossRef]
- Deng, W.; Tan, X.; Fang, W.; Zhang, Q.; Wang, Y. Conversion of cellulose into sorbitol over carbon nanotube-supported ruthenium catalyst. Catal. Lett. 2009, 133, 167–174. [Google Scholar] [CrossRef]
- Mierczynski, P.; Vasilev, K.; Mierczynska, A.; Maniukiewicz, W.; Ciesielski, R.; Rogowski, J.; Szynkowska, I.M.; Trifonov, A.Y.; Dubkov, S.V.; Gromov, D.G.; et al. The effect of gold on modern bimetallic Au-Cu/MWCNT catalysts for the oxy-steam reforming of methanol. Catal. Sci. Technol. 2016, 6, 4168–4183. [Google Scholar] [CrossRef]
- Kumar, V.P.; Beltramini, J.N.; Priya, S.S.; Srikanth, A.; Bhanuchander, P.; Chary, K.V.R. Catalytic functionalities of nano Ru catalysts supported on TiO2-ZrO2 mixed oxide for vapor phase hydrogenolysis of glycerol to propanediols. Appl. Petrochem. Res. 2016, 6, 73–87. [Google Scholar] [CrossRef]
- Leo, I.M.; Granados, M.L.; Fierro, J.L.G.; Mariscal, R. Sorbitol hydrogenolysis to glycols by supported ruthenium catalysts. Chin. J. Catal. 2014, 35, 614–621. [Google Scholar] [CrossRef]
- Wang, M.; Yang, H.; Xie, Y.; Wu, X.; Chen, C.; Ma, W.; Dong, Q.; Hou, Z. Catalytic transformation of glycerol to 1-propanol by combining zirconium phosphate and supported Ru catalysts. RCS Adv. 2016, 6, 29769–29778. [Google Scholar] [CrossRef]
- Serp, P.; Corrias, M.; Kalck, P. Carbon nanotubes and nanofibers in catalysis. Appl. Catal. A 2003, 253, 337–358. [Google Scholar] [CrossRef]
- Martinez-Franco, R.; Paris, C.; Martinez-Armero, M.E.; Martinez, C.; Moliner, M.; Corma, A. High-silica nanocrystalline Beta zeolites: Efficient synthesis and catalytic application. Chem. Sci. 2016, 7, 102–108. [Google Scholar] [CrossRef]
- López, T.; Herrera, L.; Mendez-Vivar, J.; Bosch, P.; Gómez, R.; Gonzalez, R.D. Support effect in ruthenium sol-gel catalysts on silica and alumina. J. Non Cryst. Solids 1992, 147–148, 773–777. [Google Scholar] [CrossRef]
- Sun, G.; Xu, A.; He, Y.; Yang, M.; Du, H.; Sun, C. Ruthenium catalysts supported on high-surface-area zirconia for the catalytic wet oxidation of N,N-dimethyl formamide. J. Hazard. Mater. 2008, 156, 335–341. [Google Scholar] [CrossRef] [PubMed]
- Okal, J. Characterization and thermal stability of ruthenium nanoparticles supported on γ-alumina. Catal. Commun. 2010, 11, 508–512. [Google Scholar] [CrossRef]
- Abdelrahman, O.A.; Heyden, A.; Bond, J.Q. Analysis of kinetics and reaction pathways in the aqueous-phase hydrogenation of levulinic acid to form γ-valerolactone over Ru/C. ACS Catal. 2014, 4, 1171–1181. [Google Scholar] [CrossRef]
- Ruppert, A.M.; Grams, J.; Jędrzejczyk, M.; Matras-Michalska, J.; Keller, N.; Ostojska, K.; Sautet, P. Titania-supported catalysts for levulinic acid hydrogenation: Influence of support and its impact on γ-valerolactone yield. ChemSusChem. 2015, 8, 1538–1547. [Google Scholar] [CrossRef] [PubMed]
- Maris, E.P.; Ketchie, W.C.; Vladimir, O.; Davis, R.J. Metal particle growth during glucose hydrogenation over Ru/SiO2 evaluated by X-ray absorption spectroscopy and electron microscopy. J. Phys. Chem. B 2006, 110, 7869–7876. [Google Scholar] [CrossRef] [PubMed]
- Piskun, A.; van de Bovenkamp, H.H.; Pidko, E.; Heeres, H.J. Experimental and modeling studies on the equilibrium reaction between gamma-valerolactone and 4-hydroxypentanoic acid in water. 2016; Manuscript in preparation. [Google Scholar]
- Toebes, M.L.; Prinsloo, F.F.; Bitter, J.H.; van Dillen, A.J.; de Jong, K.P. Influence of oxygen-containing surface groups on the activity and selectivity of carbon nanofiber-supported ruthenium catalysts in the hydrogenation of cinnamaldehyde. J. Catal. 2003, 214, 78–87. [Google Scholar] [CrossRef]
- Fogler, H.S. Elements of Chemical Reaction Engineering, 4th ed.; Prentice Hall: Upper Saddle River, NJ, USA, 2006. [Google Scholar]


| Catalyst | Additives | Solvent | T (°C) | H2 (Bar) | Time (h) | LA Conversion (%) | GVL Selectivity(%) | Reference |
|---|---|---|---|---|---|---|---|---|
| Ru/C (5 wt. % Ru) | - | dioxane | 150 | 55 | 2 | 80 | 92 | [5] |
| Ru/C (5 wt. % Ru) | - | H2O | 130 | 12 | 2.7 | 99.5 | 86.6 | [6] |
| methanol | 99 | 85 | ||||||
| ethanol | 76 | 81 | ||||||
| 1-butanol | 49 | 82 | ||||||
| dioxane | 99 | 98 | ||||||
| methanol + H2O | 96 | 88 | ||||||
| ethanol + H2O | 99 | 90 | ||||||
| butanol + H2O | 99 | 76 | ||||||
| Ru/C (3 wt. % Ru) | - | H2O | 90 | 45 | 1 | 100 | 98 | [8] |
| Ru0.9Ni0.1/OMC (0.56 wt. % Ru 0.08 wt. % Ni) | - | H2O | 150 | 45 | 2 | 99 | 97 | [9] |
| Ru/C (5 wt. % Ru) | - | H2O | 180 | 30 | 12 | 100 | 57 | [10] |
| Ru/C (5 wt. % Ru) | - | H2O (0.08 wt. %) | 130 | 20.6 | 49.5 | 51 | >99 | [11] |
| Ru/C (5 wt. % Ru) | - | H2O | 70 | 30 | 3 | 48 | 98 | [12] |
| A 70 a | 100 | 99 | ||||||
| Ru/C (5 wt. % Ru) | - | methanol | 130 | 12 | 2.7 | 92 | 99 | [13] |
| Ru/C (5 wt. % Ru) | - | methanol | 130 | 12 | 2.7 | 93 | 99 | [14] |
| 1-butanol | 0 | 0 | ||||||
| benzaldehyde | 0 | 0 | ||||||
| DMSO | 0 | 0 | ||||||
| dioxane | 4 | 0 | ||||||
| Ru/Starbon (5 wt. % Ru) | - | ethanol + H2O | 100 | 10 | 2.2 | >99 | <5 | [15] |
| Ru/C, (5 wt. % Ru) | [BMIm-SH] [HSO4] | methanol | 130 | 34.5 | 2 | 99 | 68 | [16] |
| A 15 | 99 | 14 | ||||||
| SO4-ZrO2 | 99 | 18 |
| Catalyst | Additives | Solvent | T (°C) | H2 (Bar) | Time (h) | LA Conversion (%) | GVL Selectivity (%) | Reference |
|---|---|---|---|---|---|---|---|---|
| Ru/SiO2 (5 wt. % Ru) | - | ethanol | 130 | 12 | 2.7 | 83 | 93 | [6] |
| ethanol + H2O | 98 | 77 | ||||||
| Ru/Al2O3 (5 wt. % Ru) | - | ethanol | 130 | 12 | 2.7 | 38 | 86 | [6] |
| ethanol + H2O | 95 | 80 | ||||||
| Ru/TiO2 (Rutile) (5 wt. % Ru) | ethanol | 130 | 12 | 2.7 | 0 | - | [6] | |
| ethanol + H2O | 0 | - | ||||||
| Ru/TiO2 (P25) (5 wt. % Ru) | ethanol | 130 | 12 | 2.7 | 68 | 92 | [6] | |
| ethanol + H2O | 81 | 88 | ||||||
| Ru/TiO2 (1 wt. % Ru) | - | H2O | 70 | 50 | 1 | 99 | 95 | [7] |
| THF | 0 | 0 | ||||||
| Ru/Nb2O5 (1 wt. % Ru) | - | dioxane | 200 | 40 | 4 | 72 | 86 | [26] |
| Ru/TiO2 (1 wt. % Ru) | - | dioxane | 200 | 40 | 4 | 100 | 92 | [26] |
| Ru/Beta-12.5 (1 wt. % Ru) | - | dioxane | 200 | 40 | 4 | 100 | 60 | [26] |
| Ru/H-ZSM-5-11.5 (1 wt. % Ru) | - | dioxane | 200 | 40 | 10 | 100 | 70 | [27] |
| Ru/Al2O3 (5 wt. % Ru) | - | H2O | 70 | 30 | 3 | 24 | 96 | [12] |
| A 70 | 57 | 98 | ||||||
| Ru/SiO2 (5 wt. % Ru) | scCO2 | H2O | 200 | 100 | n.a. a | 98 | > 99 | [28] |
| Ru/Al2O3 (5 wt. % Ru) | scCO2 | - | 150 | 145 | n.a. a | 99 | 99 | [29] |
| RuPd/TiO2 (1 wt. % Ru) | - | dioxane | 200 | 40 | 0.5 | 99 | 99 | [30] |
| Ru/hydroxyapatite (5 wt. % Ru) | - | H2O | 70 | 5 | 4 | 99 | 99 | [31] |
| ethanol | 92 | 76 | ||||||
| ethanol + H2O | 92 | 82 | ||||||
| toluene | 30 | 92 | ||||||
| Ru/SPES (polyethersulfone) (2 wt. % Ru) | - | H2O | 70 | 30 | 2 | 88 | 99 | [32] |
| Catalyst | Actual Ru Content (wt.%) b | Total Acidity (μmol/gcat) | Type of Acid Sites | Average Ru Particle Size (TEM), (nm) | Specific Surface Area (m2/g) | Micropore Surface Area (m2/g) |
|---|---|---|---|---|---|---|
| Ru/Beta-12.5 | 0.97 | 1070 | weak and medium | 3.5 | 515 | 329 |
| Ru/CNT | n.d. c | 46 | strong | 1.1 | 272 | 14 |
| Ru/C | 1 d | 99 | medium | 0.9 | 911 | 487 |
| Ru/TiO2 | 0.85 | 2.5 | weak | 1.4 | 13 | 0.8 |
| Ru/SiO2 | 0.71 | 57 | weak, medium and strong | n.d. | 230 | 9 |
| Ru/Al2O3 | 1.2 | 38 | weak, medium and strong | 1.2 | 247 | 4.8 |
| Ru/ZrO2 | 0.71 | 22 | weak and medium | n.d. | 83 | 2.1 |
| Ru/Nb2O5 a | n.d. | 140 | weak | n.d. | 98 | 0 |
| Catalyst | XLA (%) | SGVL (%) | YGVL (%) | S4-HPA (%) | Y4-HPA (%) | [4-HPA]/[GVL] | R0 (molLA/s·gRu b) |
|---|---|---|---|---|---|---|---|
| Ru/C | 61 | 77 | 47 | 23 | 14 | 0.33 | 5.2 × 10⁻³ |
| Ru/CNT | 74 | 83 | 61 | 17 | 13 | 0.21 | n.d. c |
| Ru/SiO2 | 47 | 97 | 46 | 3 | 1 | 0.11 | 4.0 × 10⁻³ |
| Ru/Al2O3 | 33 | 56 | 18 | 44 | 14 | 0.79 | 2.4 × 10⁻³ |
| Ru/ZrO2 | 1 | >99 | 1 | 0 | 0 | 0 | 6.4 × 10⁻⁵ |
| Ru/Nb2O5 | 2 | >99 | 2 | 0 | 0 | 0 | n.d. c |
| Ru/TiO2 | 44 | 85 | 37 | 15 | 7 | 0.18 | 3.8 × 10⁻³ |
| Ru/Beta-12.5 | 94 | 70 | 66 | 30 | 28 | 0.41 | 8.9 × 10⁻³ |
| RuPd/TiO2 | 9 | 51 | 5 | 49 | 4 | 0.96 | n.d. c |
| Catalyst | wt. % Ru | T (°C) | LA Conversion after 2 h, (%) | GVL Selectivity after 2 h, (%) | 4-HPA Selectivity after 2 h, (%) | R0 (molLA/gRu·s b) | Reference |
|---|---|---|---|---|---|---|---|
| Ru/C | 1 | 90 | 61 | 75 | 24 | 5.2 × 10⁻³ | This study a |
| Ru/CNT | 1 | 74 | 83 | 17 | n.d. | ||
| Ru/SiO2 | 1 | 47 | 97 | 3 | 4.0 × 10⁻³ | ||
| Ru/Al2O3 | 1 | 33 | 56 | 44 | 2.4 × 10⁻³ | ||
| Ru/ZrO2 | 1 | 1 | 99 | 1 | 6.4 × 10⁻⁵ | ||
| Ru/Nb2O5 | 1 | 2 | 98 | 1 | n.d. | ||
| Ru/TiO2 | 1 | 44 | 79 | 15 | 3.7 × 10⁻³ | ||
| Ru/Beta-12.5 | 1 | 95 | 70 | 30 | 8.9 × 10⁻³ | ||
| RuPd/TiO2 | 1 | 9 | 51 | 49 | n.d. | ||
| Ru/C | 5 | 130 | 160 min—99.5 | 160 min—86.6 | - | 3.5 × 10⁻⁴ | [6] |
| Ru/SiO2 | 5 c | 160 min—98 | 160 min—76.5 | - | 3.5 × 10⁻⁴ | ||
| Ru/Al2O3 | 5 c | 160 min—94.7 | 160 min—80.4 | - | 3.4 × 10⁻⁴ | ||
| Ru/TiO2 | 5 c | 160 min—81.2 | 160 min—87.8 | - | 2.9 × 10⁻⁴ | ||
| Ru/TiO2 | 1 | 70 | 1 h—99% | 1 h—95 | - | 7.9 × 10⁻⁴ | [7] |
| Ru/C | 3 | 90 | 50 min—100% | 50 min—83% | 50 min—17% | 4.5 × 10⁻² | [8] |
| Ru/C | 5 | 70 | 3 h—48 | 3 h—97.5 | - | 7.5 × 10⁻⁴ | [12] |
| Ru/Al2O3 | 5 | 70 | 3 h—24 | 3 h—96 | - | 3.7 × 10⁻⁴ |
© 2016 by the authors; licensee MDPI, Basel, Switzerland. This article is an open access article distributed under the terms and conditions of the Creative Commons Attribution (CC-BY) license (http://creativecommons.org/licenses/by/4.0/).
Share and Cite
Piskun, A.; Winkelman, J.G.M.; Tang, Z.; Heeres, H.J. Support Screening Studies on the Hydrogenation of Levulinic Acid to γ-Valerolactone in Water Using Ru Catalysts. Catalysts 2016, 6, 131. https://doi.org/10.3390/catal6090131
Piskun A, Winkelman JGM, Tang Z, Heeres HJ. Support Screening Studies on the Hydrogenation of Levulinic Acid to γ-Valerolactone in Water Using Ru Catalysts. Catalysts. 2016; 6(9):131. https://doi.org/10.3390/catal6090131
Chicago/Turabian StylePiskun, Anna, Jozef G. M. Winkelman, Zhenchen Tang, and Hero Jan Heeres. 2016. "Support Screening Studies on the Hydrogenation of Levulinic Acid to γ-Valerolactone in Water Using Ru Catalysts" Catalysts 6, no. 9: 131. https://doi.org/10.3390/catal6090131
APA StylePiskun, A., Winkelman, J. G. M., Tang, Z., & Heeres, H. J. (2016). Support Screening Studies on the Hydrogenation of Levulinic Acid to γ-Valerolactone in Water Using Ru Catalysts. Catalysts, 6(9), 131. https://doi.org/10.3390/catal6090131