Article

Effects of the Electrodeposition Time in the Synthesis of Carbon-Supported Pt(Cu) and Pt-Ru(Cu) Core-Shell Electrocatalysts for Polymer Electrolye Fuel Cells

by
Griselda Caballero-Manrique
1,
Immad Muhammed Nadeem
2,3,
Enric Brillas
1,
Francesc Centellas
1,
José Antonio Garrido
1,
Rosa María Rodríguez
1 and
Pere-Lluís Cabot
1,*
1
Laboratori d’Electroquímica dels Materials i del Medi Ambient, Departament de Química Física, Facultat de Química, Universitat de Barcelona, Martí i Franquès 1-11, 08028 Barcelona, Spain
2
London Centre for Nanotechnology and Department of Chemistry, University College London, 20 Gordon Street, London, WC1H 0AJ, UK
3
Diamond Light Source Ltd, Harwell Science and Innovation Campus, Didcot, Oxfordshire, OX11 0DE, UK
*
Author to whom correspondence should be addressed.
Catalysts 2016, 6(8), 125; https://doi.org/10.3390/catal6080125
Submission received: 22 June 2016 / Revised: 29 July 2016 / Accepted: 10 August 2016 / Published: 18 August 2016
(This article belongs to the Special Issue Catalysis for Low Temperature Fuel Cells)

Abstract

:
Pt(Cu)/C and Pt-Ru(Cu)/C electrocatalysts with core-shell structure supported on Vulcan Carbon XC72R have been synthesized by potentiostatic deposition of Cu nanoparticles on the support, galvanic exchange with Pt and spontaneous deposition of Ru species. The duration of the electrodeposition time of the different species has been modified and the obtained electrocatalysts have been characterized using electrochemical and structural techniques. The High Resolution Transmission Electron Microscopy (HRTEM), Fast Fourier Transform (FFT) and Energy Dispersive X-ray (EDX) microanalyses allowed the determining of the effects of the electrodeposition time on the nanoparticle size and composition. The best conditions identified from Cyclic Voltammetry (CV) corresponded to onset potentials for CO and methanol oxidation on Pt-Ru(Cu)/C of 0.41 and 0.32 V vs. the Reversible Hydrogen Electrode (RHE), respectively, which were smaller by about 0.05 V than those determined for Ru-decorated commercial Pt/C. The CO oxidation peak potentials were about 0.1 V smaller when compared to commercial Pt/C and Pt-Ru/C. The positive effect of Cu was related to its electronic effect on the Pt shells and also to the generation of new active sites for CO oxidation. The synthesis conditions to obtain the best performance for CO and methanol oxidation on the core-shell Pt-Ru(Cu)/C electrocatalysts were identified. When compared to previous results in literature for methanol, ethanol and formic acid oxidation on Pt(Cu)/C catalysts, the present results suggest an additional positive effect of the deposited Ru species due to the introduction of the bifunctional mechanism for CO oxidation.

Graphical Abstract

1. Introduction

Direct Methanol Fuel Cells (DMFCs) operating under ambient temperature are gaining interest due to their safe and profitable use as portable power in the market for mobile phones, laptops and other portable electric devices [1,2,3]. However, the attractive low temperature DMFCs possess presents certain drawbacks. The anodic electrooxidation of methanol maintains unfavorable slow kinetics, which coupled with the tendency of methanol to migrate across the proton exchange membrane and oxidize at the cathode ultimately results in reduced operative capacity [4]. High surface area Pt-based nanostructured electrocatalysts are commonly employed. However, the methanol electrooxidation is a self-poisoning reaction because the electrogenerated CO intermediate strongly adsorbs onto the Pt surface, thus limiting the methanol adsorption [4,5,6,7]. CO interacts with the platinum surface in a linear, bridge and three fold configuration where each CO molecule strongly adsorbs onto one, two and three Pt atoms, respectively [8]. The carbon supported Pt becomes around 50% less efficient even on trace levels of CO [5]. Hence, widespread research has been conducted to prepare suitable nanostructured electrocatalysts to mitigate the problematic slow kinetics and self-poisoning.
CO poisoning can be addressed by alloying Pt with transition metals such as Ru, Mo, Re, W and others [5,6,7,8,9,10]. Ru appears between the most interesting ones [2,6,7,10,11]. The high tolerance to CO exhibited by the Pt-Ru alloys has been explained by two different mechanisms. The first one considers the favored oxidation of CO adsorbed on Pt by the Ru-OH species, which are formed by water dissociation on Ru at lower potentials than on Pt (bifunctional mechanism). The second one establishes the Pt-CO bond weakening via the electronic effect induced by Ru on Pt.
Currently, attention has been focused on synthesizing electrode materials with lower Pt content, thus allowing decreasing the cost of the catalyst and/or improving the catalyst performance [12,13,14,15,16,17,18,19,20,21,22,23,24,25,26,27,28,29,30]. They have been applied for very different reactions of interest including hydrogen, borohydride, methanol, CO, ethanol and formic acid oxidation and also oxygen reduction. Different nanoparticulate catalysts have been synthesized by deposition of a core of transition metal on carbon support which can be partially replaced by Pt through galvanic exchange [14,15,16,17,18,19,20,21,22,23,24,26,27,28,30]. This method is based on the displacement of the less noble metal by the nobler one under open circuit conditions. Particularly, Cu has been often used as the core metal in acidic solutions because the potential of the Cu2+/Cu pair is sufficiently low but at the same time more positive than the potential of the standard hydrogen electrode (SHE) [14,16,18,20,24,26,27,28,30]. The displacement of Cu is not then complicated by hydrogen evolution. The galvanic exchange of Cu with PtCl62− can be represented as follows:
2Cu + PtCl62− → Pt + 2Cu2+ + 6Cl
which has a standard cell potential of E° = 0.404 V vs. SHE. The most part of the Pt-Cu/C catalysts in which the galvanic exchange has been used, have been prepared starting from Cu/C precursors obtained by chemical reduction of Cu2+ [24,26,27,28,30]. They have been mainly applied to methanol [24,28], ethanol [27] and formic acid oxidation [25,30] and oxygen reduction [26] The synthesis of nanoparticle catalysts starting from the electrochemical reduction of Cu2+ is scarcely found in the literature [18]. There is also an additional interest in studying whether there is a further positive effect in the introduction of Ru deposited species.
The suitable potential for the potentiostatic deposition of Cu core nanoparticles on carbon Vulcan XC72R to synthesize Pt(Cu)/C and Pt-Ru(Cu)/C core-shell electrocatalysts with a tentative constant Cu electrodeposition charge has been studied by us in a previous work [18]. The respective CO stripping peak potentials were about 0.1 and 0.2 V more negative than those corresponding to Pt/C and Ru-decorated Pt/C, thus indicating the higher activity of the Pt and the Pt-Ru shells towards the CO oxidation. This increased activity was explained by the structural effect induced by the Cu core. Moreover, the use of the Cu cores allowed the Pt economy in these catalysts. The main objective of this work is to study the effect of the electrodeposition times in the synthesis of these nanostructured electrocatalysts, i.e. time of Cu electrodeposition, galvanic exchange with Pt and spontaneous deposition of the Ru species. The morphology, particle size distribution and composition of the relevant specimens have been determined by means of Transmission Electron Microscopy (TEM), High Resolution (HR) TEM, Electron Diffraction, Fast Fourier Transform (FFT), and Energy Dispersive X-ray Spectroscopy (EDS). The electrochemical performance of the catalysts prepared for the CO and methanol oxidation has been tested using Cyclic Voltammetry (CV) and Linear Sweep Voltammetry on a Rotating Disk Electrode (RDE).

2. Results and Discussion

2.1. Charge of Cu Electrodeposition in the Synthesis Sequence i

Different catalysts were obtained starting from Cu electrodeposition at −0.1 V by changing the electrodeposition charge (qCu) between 20 and 50 mC. The measured deposition efficiencies were always close to 100%, in agreement with previous results of the authors [18]. The resulting Cu loads were in the range of 93–232 µgCu cm−2. After each Cu electrodeposition, the different specimens were prepared following the sequence i. Some examples of the cyclic voltammograms recorded for the Pt(Cu)/C and the Pt-Ru(Cu)/C electrocatalysts in 0.5 M H2SO4 and for CO stripping are depicted in Figure 1a and b. The cyclic voltammograms depicted in Figure 1a present the same essential features as those previously reported for Pt-exposed surfaces [10,18,31]. Thus, the cyclic voltammogram for Pt(Cu)/C of Figure 1a shows the hydrogen adsorption/desorption region in the potential range from 0.0 to 0.3 V [31], the Pt oxidation formation about 0.65 V in the anodic sweep and the reduction of the Pt oxide around the cathodic peak potential of 0.8 V. Figure 1a also shows that the profile of the cyclic voltammogram for Pt-Ru(Cu)/C was quite similar, although the anodic and cathodic currents for the hydrogen adsorption/desorption region were smaller due to the partial blocking of the Pt sites by the Ru species.
The nature of the Ru species formed on Pt by spontaneous deposition was determined using commercial Pt/C [32] and only oxidized Ru species (RuO2 and RuOxHy) were found. Considering that the atomic hydrogen is not adsorbed on the Ru species [7], the Pt coverage (θ) in the Pt-Ru(Cu)/C electrocatalyst can be estimated according to the following equation [33]:
θ = (QH,0 − QH,1)/QH,0
where QH,0 and QH,1 are the mean charges involved in the hydrogen adsorption/desorption, after substracting the double layer charge, before and after the deposition of the Ru species, respectively. Note that the anodic and cathodic currents for Pt-Ru(Cu)/C in the potential region between 0.3 and 0.55 V, related to the double layer charge, were relatively greater than for Pt(Cu)/C. This can be explained by the pseudocapacitive behavior related to the hydroxylation of the Ru species [34,35]. The experimental results showed Ru coverages in the range 0.2–0.35 for qCu values between 20 and 40 mC. These values indicate that more than the half of the Pt surface was free from Ru species, falling in the suitable range for the best catalytic activity of the Pt-Ru/C catalysts in front of the CO, methanol and ethanol oxidation, which were about 0.25–0.3 for the Pt-Ru/C catalysts obtained by spontaneous deposition of Ru species on commercial Pt/C [36].
Figure 1b shows some examples of the CO stripping experiments both, for Pt(Cu)/C (curve a) and Pt-Ru(Cu)/C (curve b). The anodic sweep always starts at 0.0 V with negligible currents. Adsorbed hydrogen, if present, would be oxidized in the potential region between 0.0 and 0.3 V. However, the Pt sites for hydrogen adsorption are now blocked by strongly adsorbed CO, which is oxidized at potentials in the range of 0.4–0.8 V [36,37]. Pt can be oxidized in the Pt sites where CO has been removed, between 0.6 and 1.0 V. In the reverse sweep, Pt oxide is reduced to Pt (cathodic peak potential at about 0.8 V) and in the potential region between 0.3 and 0.0 V, hydrogen can be adsorbed on the Pt sites. Note that CO oxidation on Pt(Cu)/C (curve a) occurs at more positive potentials than on Pt-Ru(Cu)/C (curve b) because the Ru species favor the CO oxidation by means of the bifunctional mechanism [6,7,10]. We have included in this figure curve c, which corresponds to the catalyst preparation with a Cu electrodeposition charge of only 20 mC. This curve presents an anodic peak in the potential range 0.2–0.4 V, which is not found for electrodeposition charges of 30 mC or higher. According to previous work of the authors [18], it is due to the copper oxidation, thus indicating that there are Cu sites exposed to the electrolyte and therefore, Cu electrodeposition charges of 20 mC are not adequate to produce the core-shell electrocatalysts studied in this work. Previous work of Podlovchenko et al. [14,16] about the galvanic exchange between Cu and Pt reported that in some cases, depending on the amount of deposited Cu, on the solution stirring rate, and on the oxidation state of Pt in the complex, Pt was not able to completely cover the Cu surface. The reason for this is not clear. However, we may imagine that for very small Cu nanoparticles, the Pt complex is not able to sufficiently approach the Cu atoms which are partially occluded by the surface Pt metal atoms already deposited. Moreover, according to Equation 1, two Cu atoms per Pt complex are needed in the galvanic exchange. In addition we may suppose that Cu nuclei can be generated at relatively occluded points in the carbon. Probably, when they are too small, the Cu nuclei could not be easily reached by the Pt complex also by steric hindrance. Conversely, these partially occluded Cu atoms could probably be easily oxidized in the acidic aqueous environment.
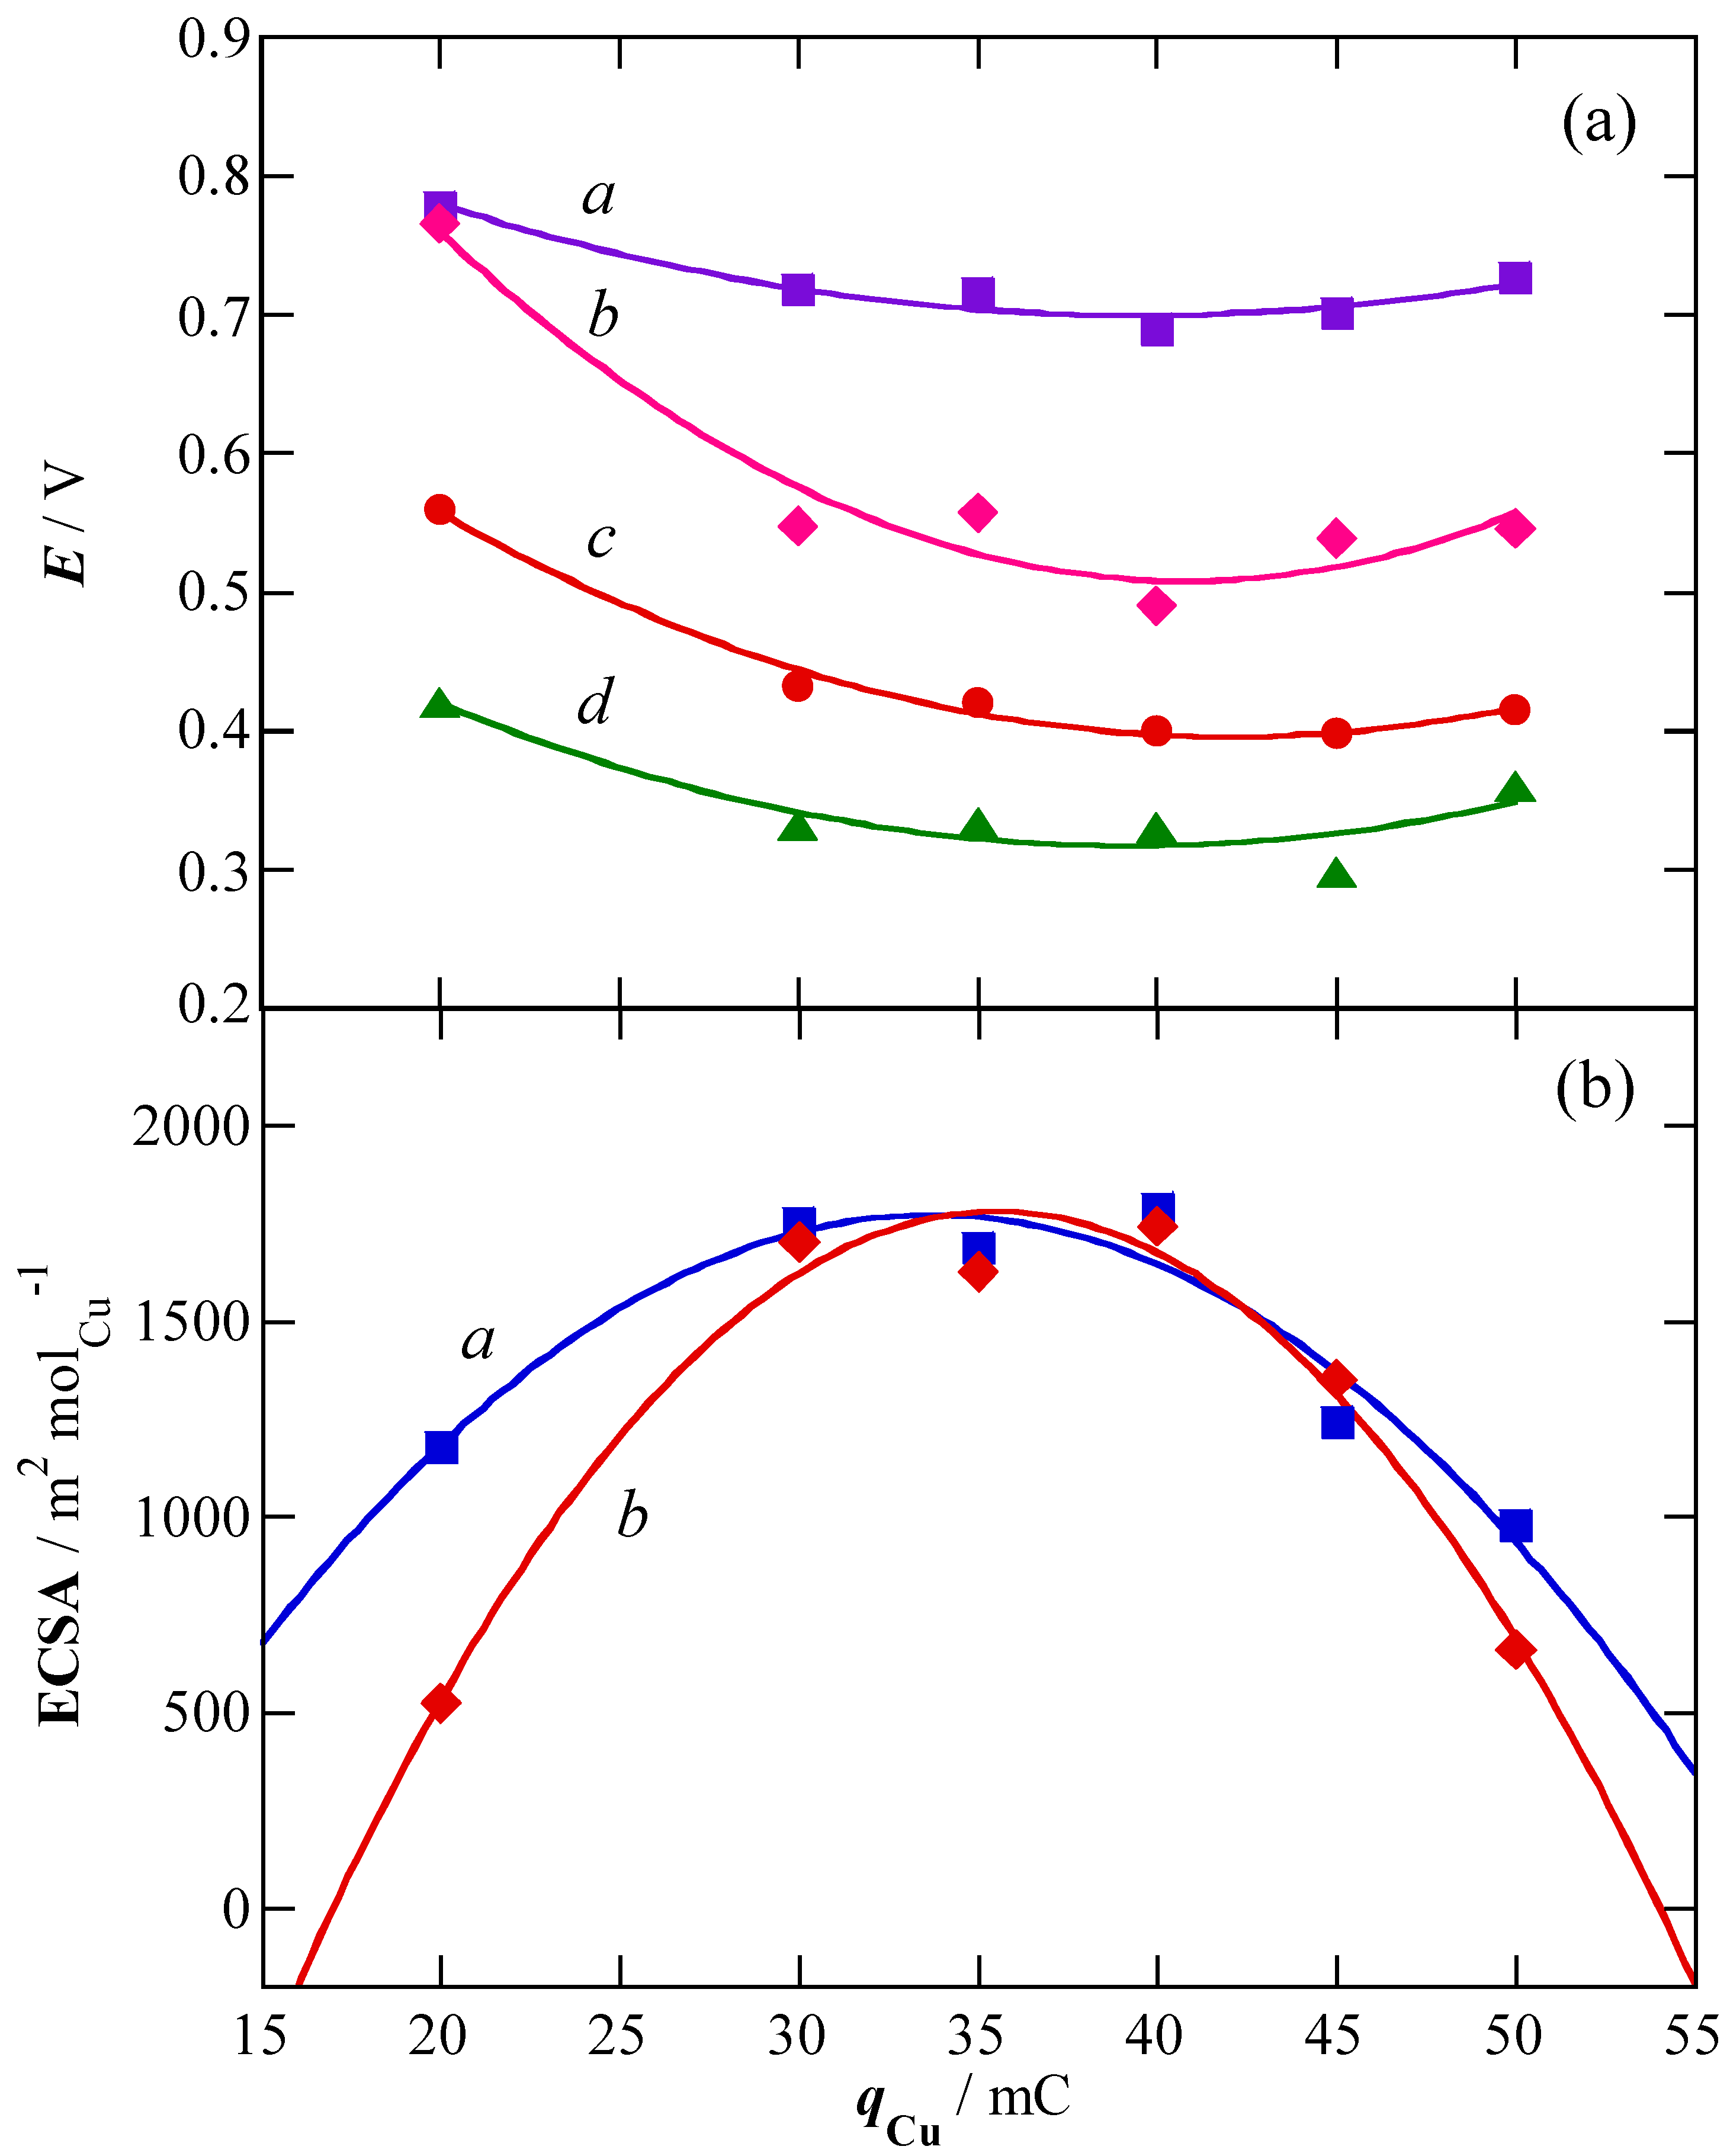
Figure 2a collects the peak potential for CO oxidation on Pt(Cu)/C and on Pt-Ru(Cu)/C, curves a and b respectively, as a function of the Cu electrodeposition charge. It is shown here that the respective minimum peak potentials for CO oxidation on Pt(Cu)/C and Pt-Ru(Cu)/C are about 0.72 and 0.55 V. It is worth mentioning that these values are significantly more negative than those measured for the catalysts without the Cu core. Thus, the peak potential for CO oxidation on carbon-supported cubo-octahedral Pt nanoparticles was about 0.8 V [37], whereas on the carbon-supported Pt-Ru alloys they were in the range of 0.65–0.75 V [36]. This means that the Cu core-shell catalysts have higher CO tolerance than those without the Cu core. The ligand (electronic) effect of Cu on Pt would explain the shift of these potentials to more negative values, in agreement with previously reported results [26]. Note in addition to the CO stripping peaks in the core-shell, catalysts appear to be composed of at least two peaks (see curve b in Figure 1b). This indicates that there are Pt sites of different nature in the catalyst where CO can be adsorbed. The CO molecules are then oxidized at different potentials on the different sites, depending on their adsorption energy. As long as there is only one peak for CO oxidation for cubo-octahedral Pt and Pt-Ru alloy, we may conclude that such different Pt sites would result from the effect of the Cu core.
The onset potentials for CO and methanol oxidation on Pt-Ru(Cu)/C are also depicted in Figure 2a, curves c and d, respectively. They were identified as the potentials in which the current significantly increased from the base line. As shown in curve d of Figure 2a, the onset potential for the methanol oxidation on the Pt-Ru(Cu)/C electrocatalyst followed the same trend as for CO (curve c), with minimum values of 0.32 and 0.41 V at about 40 mC, also respectively. These values are about 0.05 V smaller than those obtained for Ru-decorated Pt/C catalysts [36], in agreement with the higher reactivity for the present core-shell structure.
Figure 2b depicts the electrochemical surface area (ECSA) values for CO oxidation after normalization by the actual amount of electrodeposited Cu (determined from the Cu electrodeposition charge after correcting by the Cu electrodeposition efficiency). They were calculated from dividing the ECSA by the amount of copper in order to determine the conditions in which the nanoparticles with the highest ECSAs for CO oxidation were obtained. It is apparent from this figure that the normalized ECSAs for Pt(Cu)/C (curve a) and Pt-Ru(Cu)/C (curve b) depended on the Cu electrodeposition charge. Note in addition that the ECSAs for the Pt(Cu)/C and Pt-Ru(Cu)/C catalysts prepared with Cu electrodeposition charges in the range of 30–45 mC are nearly coincident. It seems strange because in the Pt-Ru(Cu)/C nanoparticles the Pt surface must be partially covered by Ru species, all of them in oxidized form [32] and not able to adsorb CO [38]. Moreover, the successive cycling of Pt-Ru(Cu)/C in the same electrolyte was repetitive, thus indicating that such oxidized species remained on the Pt surface without being dissolved into the electrolyte [32]. However, they can be at least partially reduced to Ru metal during the potential cycling [36,39] and as long as CO can be adsorbed not only on the Pt sites but also on the Ru metal [10], CO adsorption is not only restricted to surface Pt, but also takes place on the Ru metal surface. The ECSA for CO oxidation on Pt-Ru(Cu)/C may then approach the value obtained for Pt(Cu)/C.
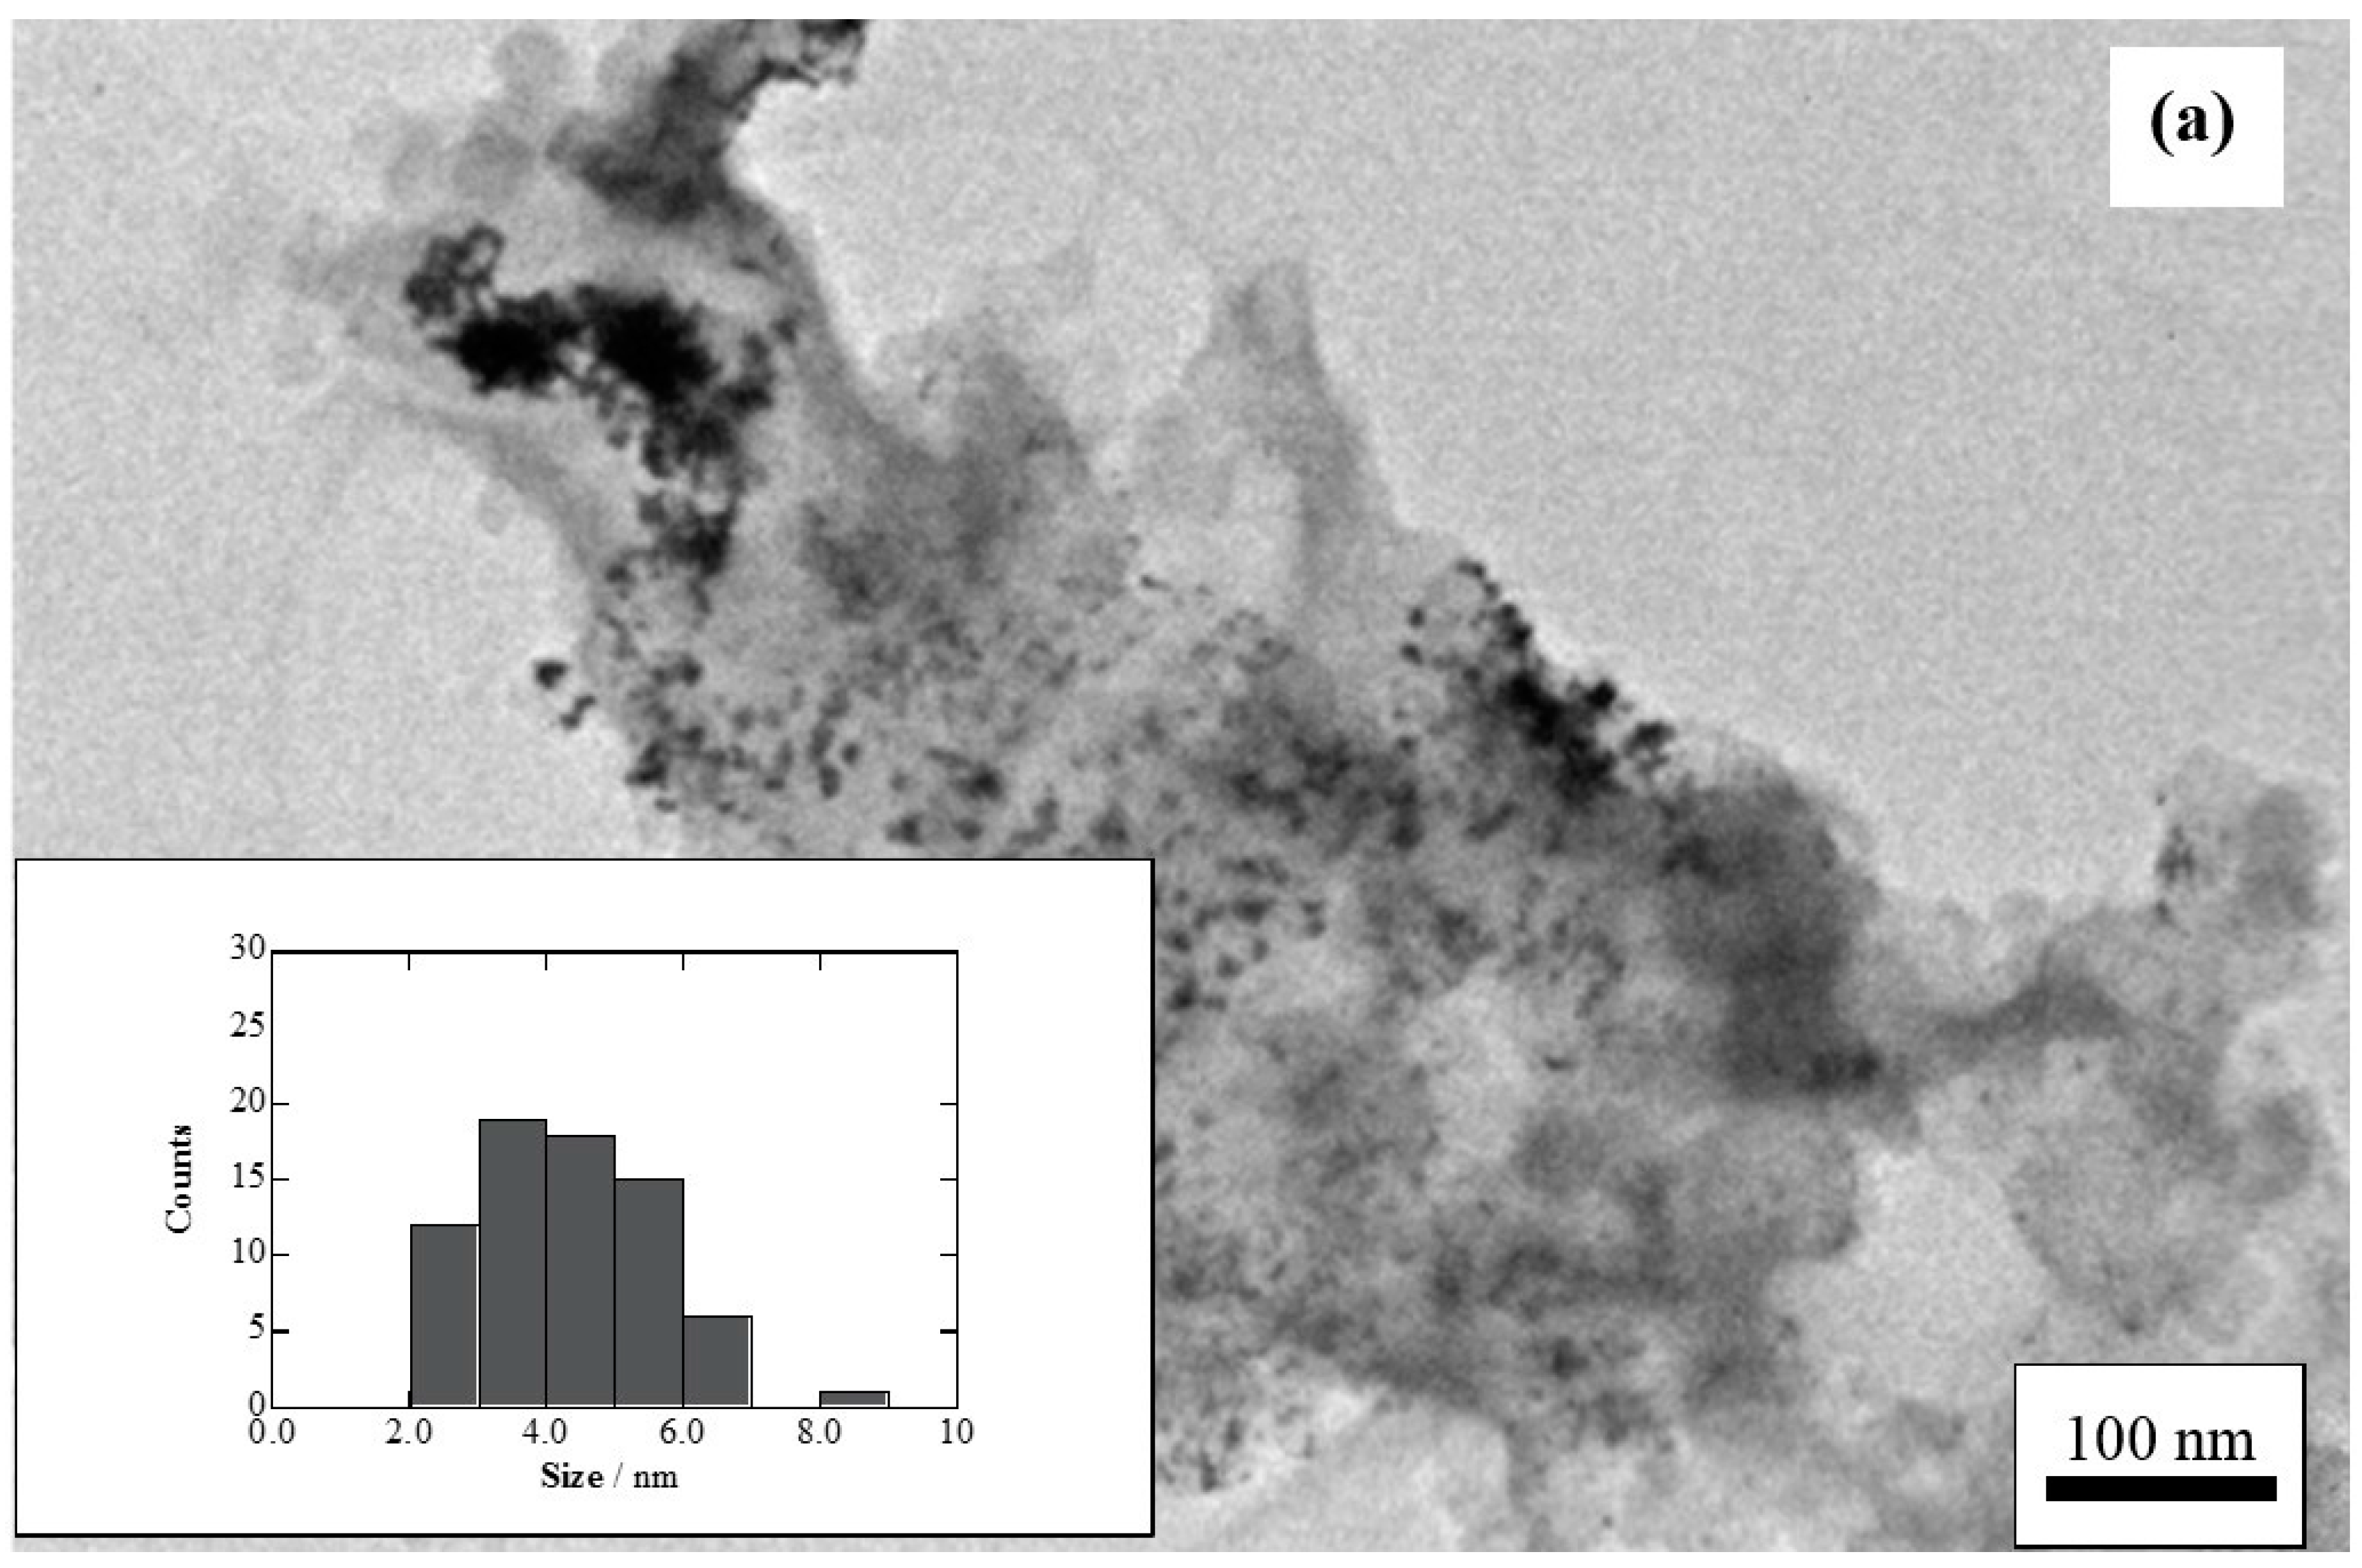
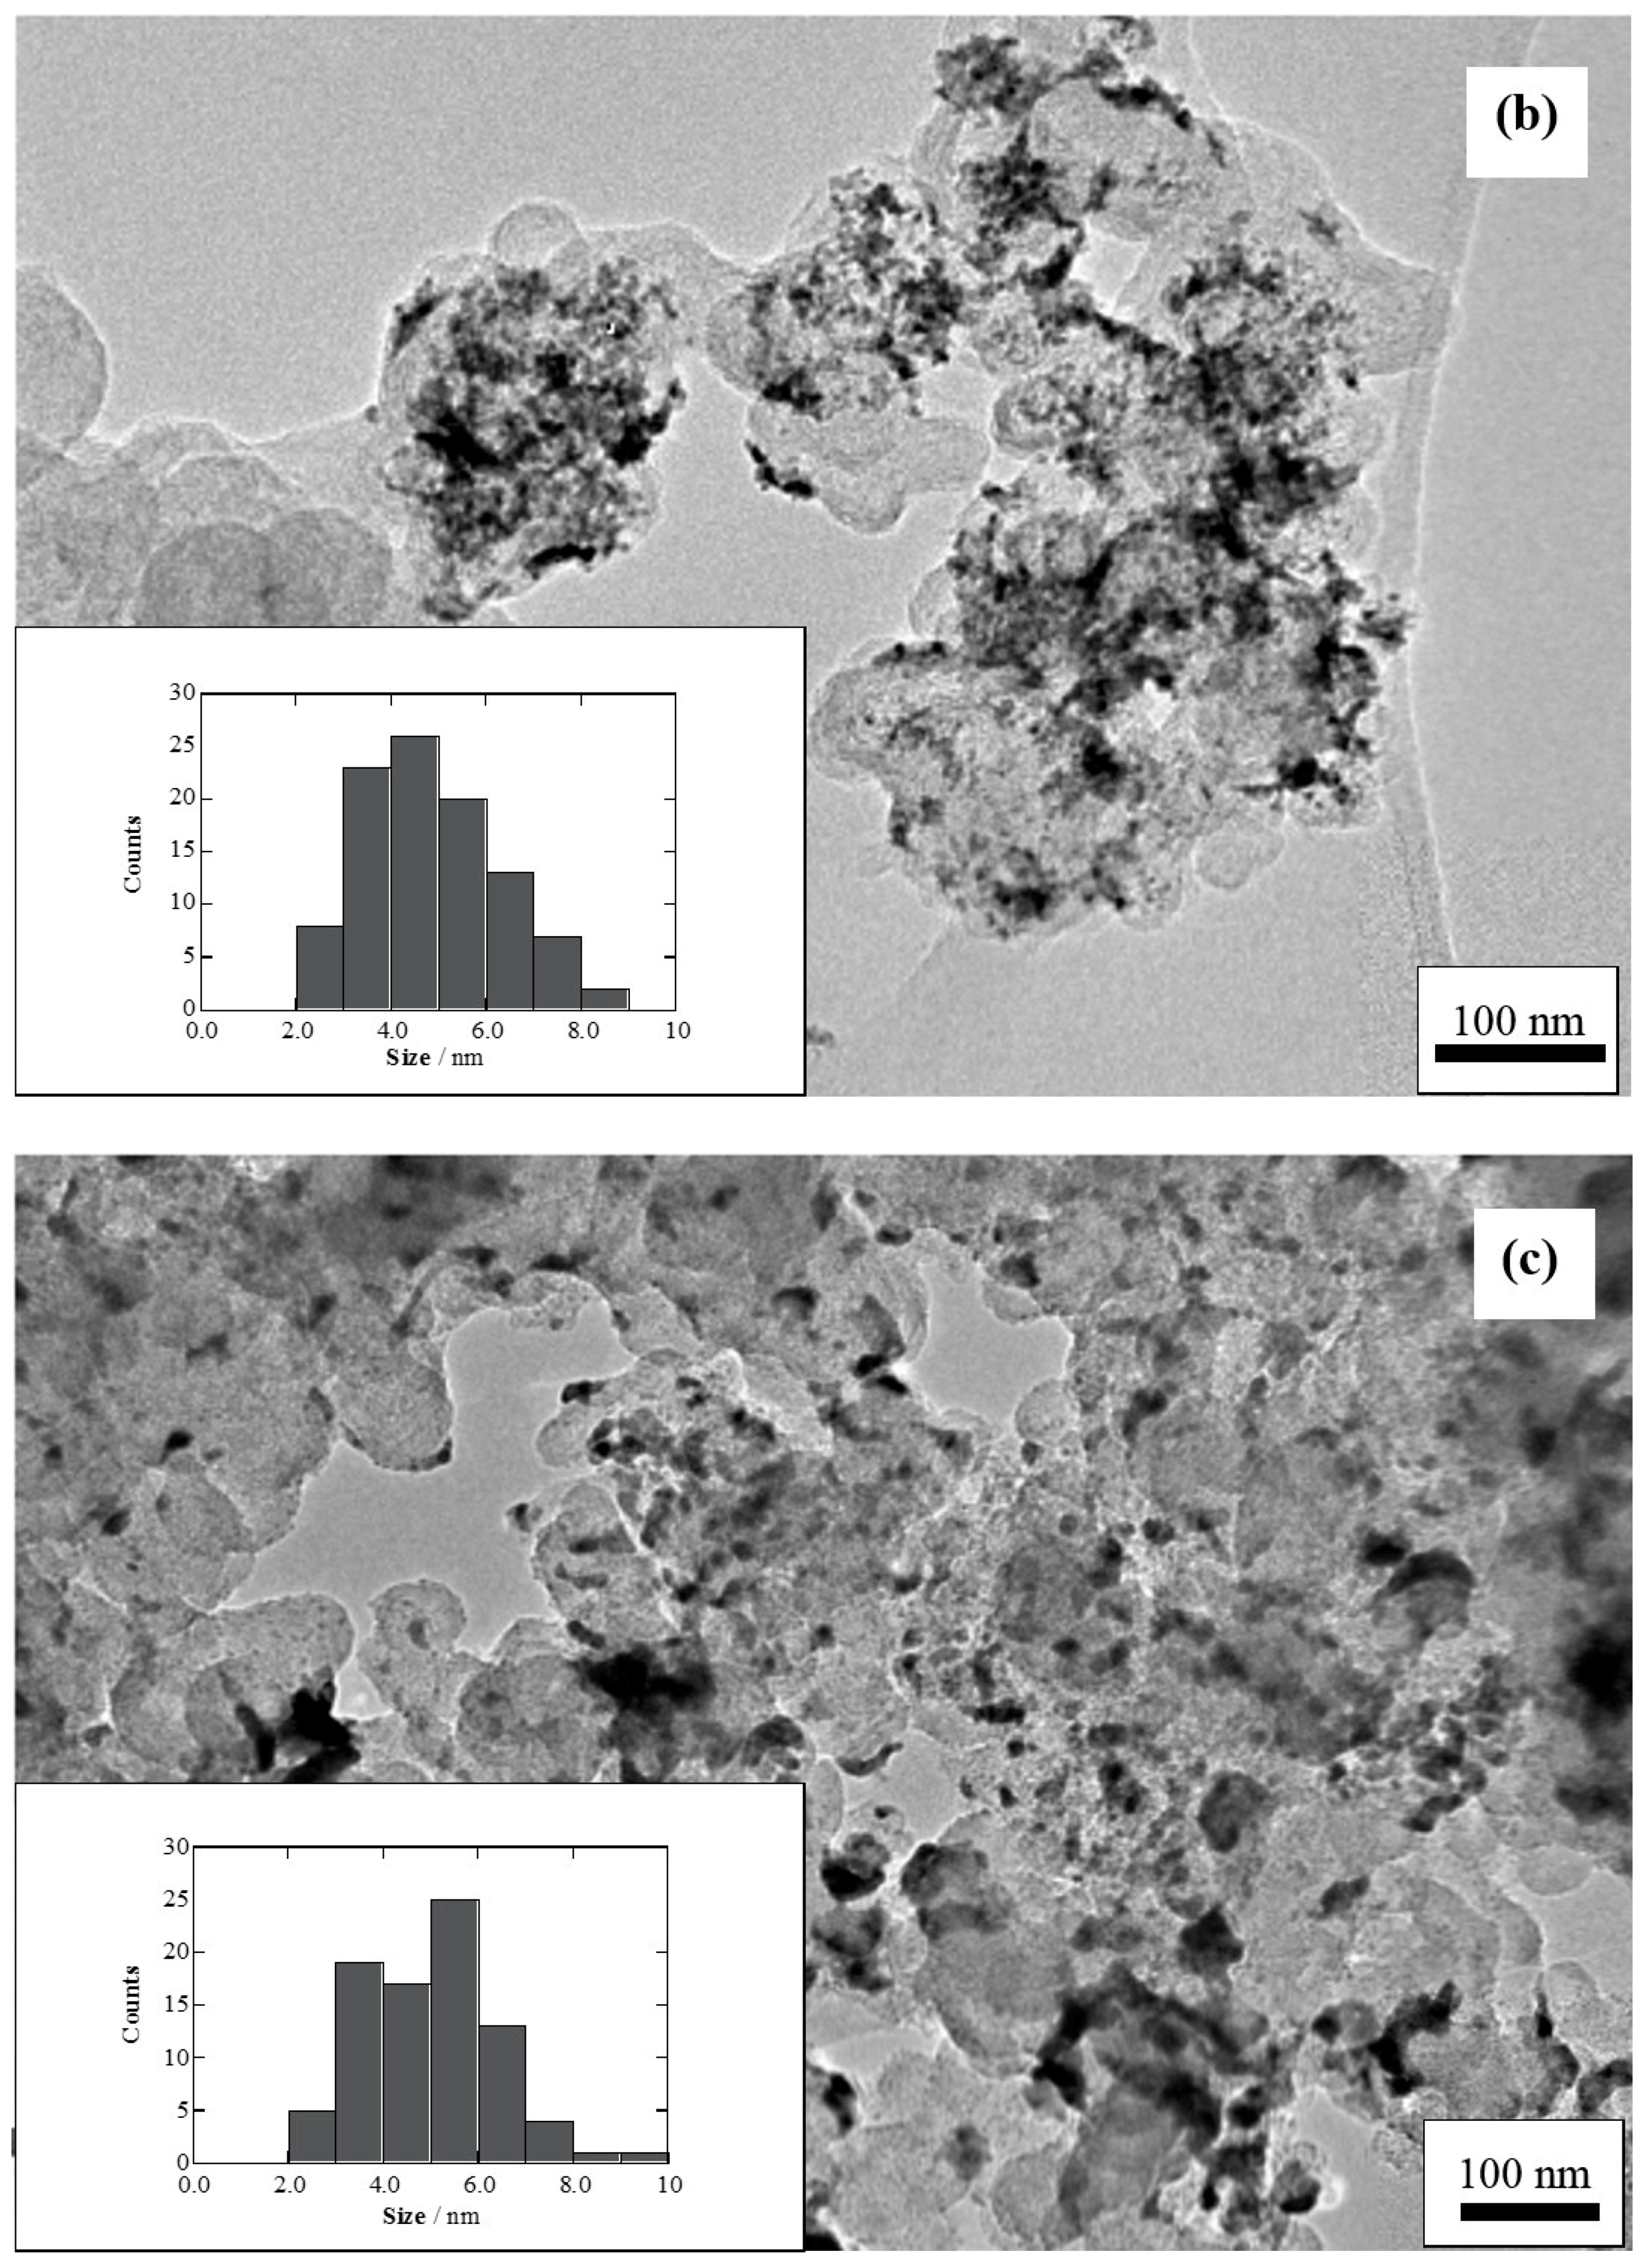
Figure 2b shows similar values for the ESCAs in the range of 30–40 mC but they are significantly smaller for 20, 45 and 50 mC. As a result, and within the experimental error (about 5%), the ECSA vs. qCu curves could be tentatively adjusted to a parabolic form. To gain a further insight into this behavior, the specimens prepared with qCu equal to 45 mC were examined by means of the TEM. The corresponding images together with the size distribution and the HRTEM and FFT analyses of Cu/C, Pt(Cu)/C, and Pt-Ru(Cu)/C are shown in Figure 3 and Figure 4. According to Figure 3, the mean sizes of the nanoparticles were 4.3 ± 1.3, 4.9 ± 1.5, and 4.9 ± 1.4 nm, respectively. These values were somewhat higher than 3.9 and 3.6 nm for Cu/C and Pt-Ru(Cu)/C respectively, previously reported for qCu = 40 mC [18]. The parabolic form of the curves depicted in Figure 2a can then be explained by a size effect. The nanoparticle size increased with qCu and thus, when referring the ECSA per mol of Cu, the active area for the CO adsorption decreased. For the same reason, at qCu as low as 20 mC, the Cu nanoparticles were probably too small to allow for building up stable Pt(Cu)/C and Pt-Ru(Cu)/C electrocatalysts. The nanoparticles cannot be completely covered by Pt in these conditions and then, Cu dissolution in the potential cycling cannot be avoided, as discussed above in relation to the curve c depicted in Figure 1b.
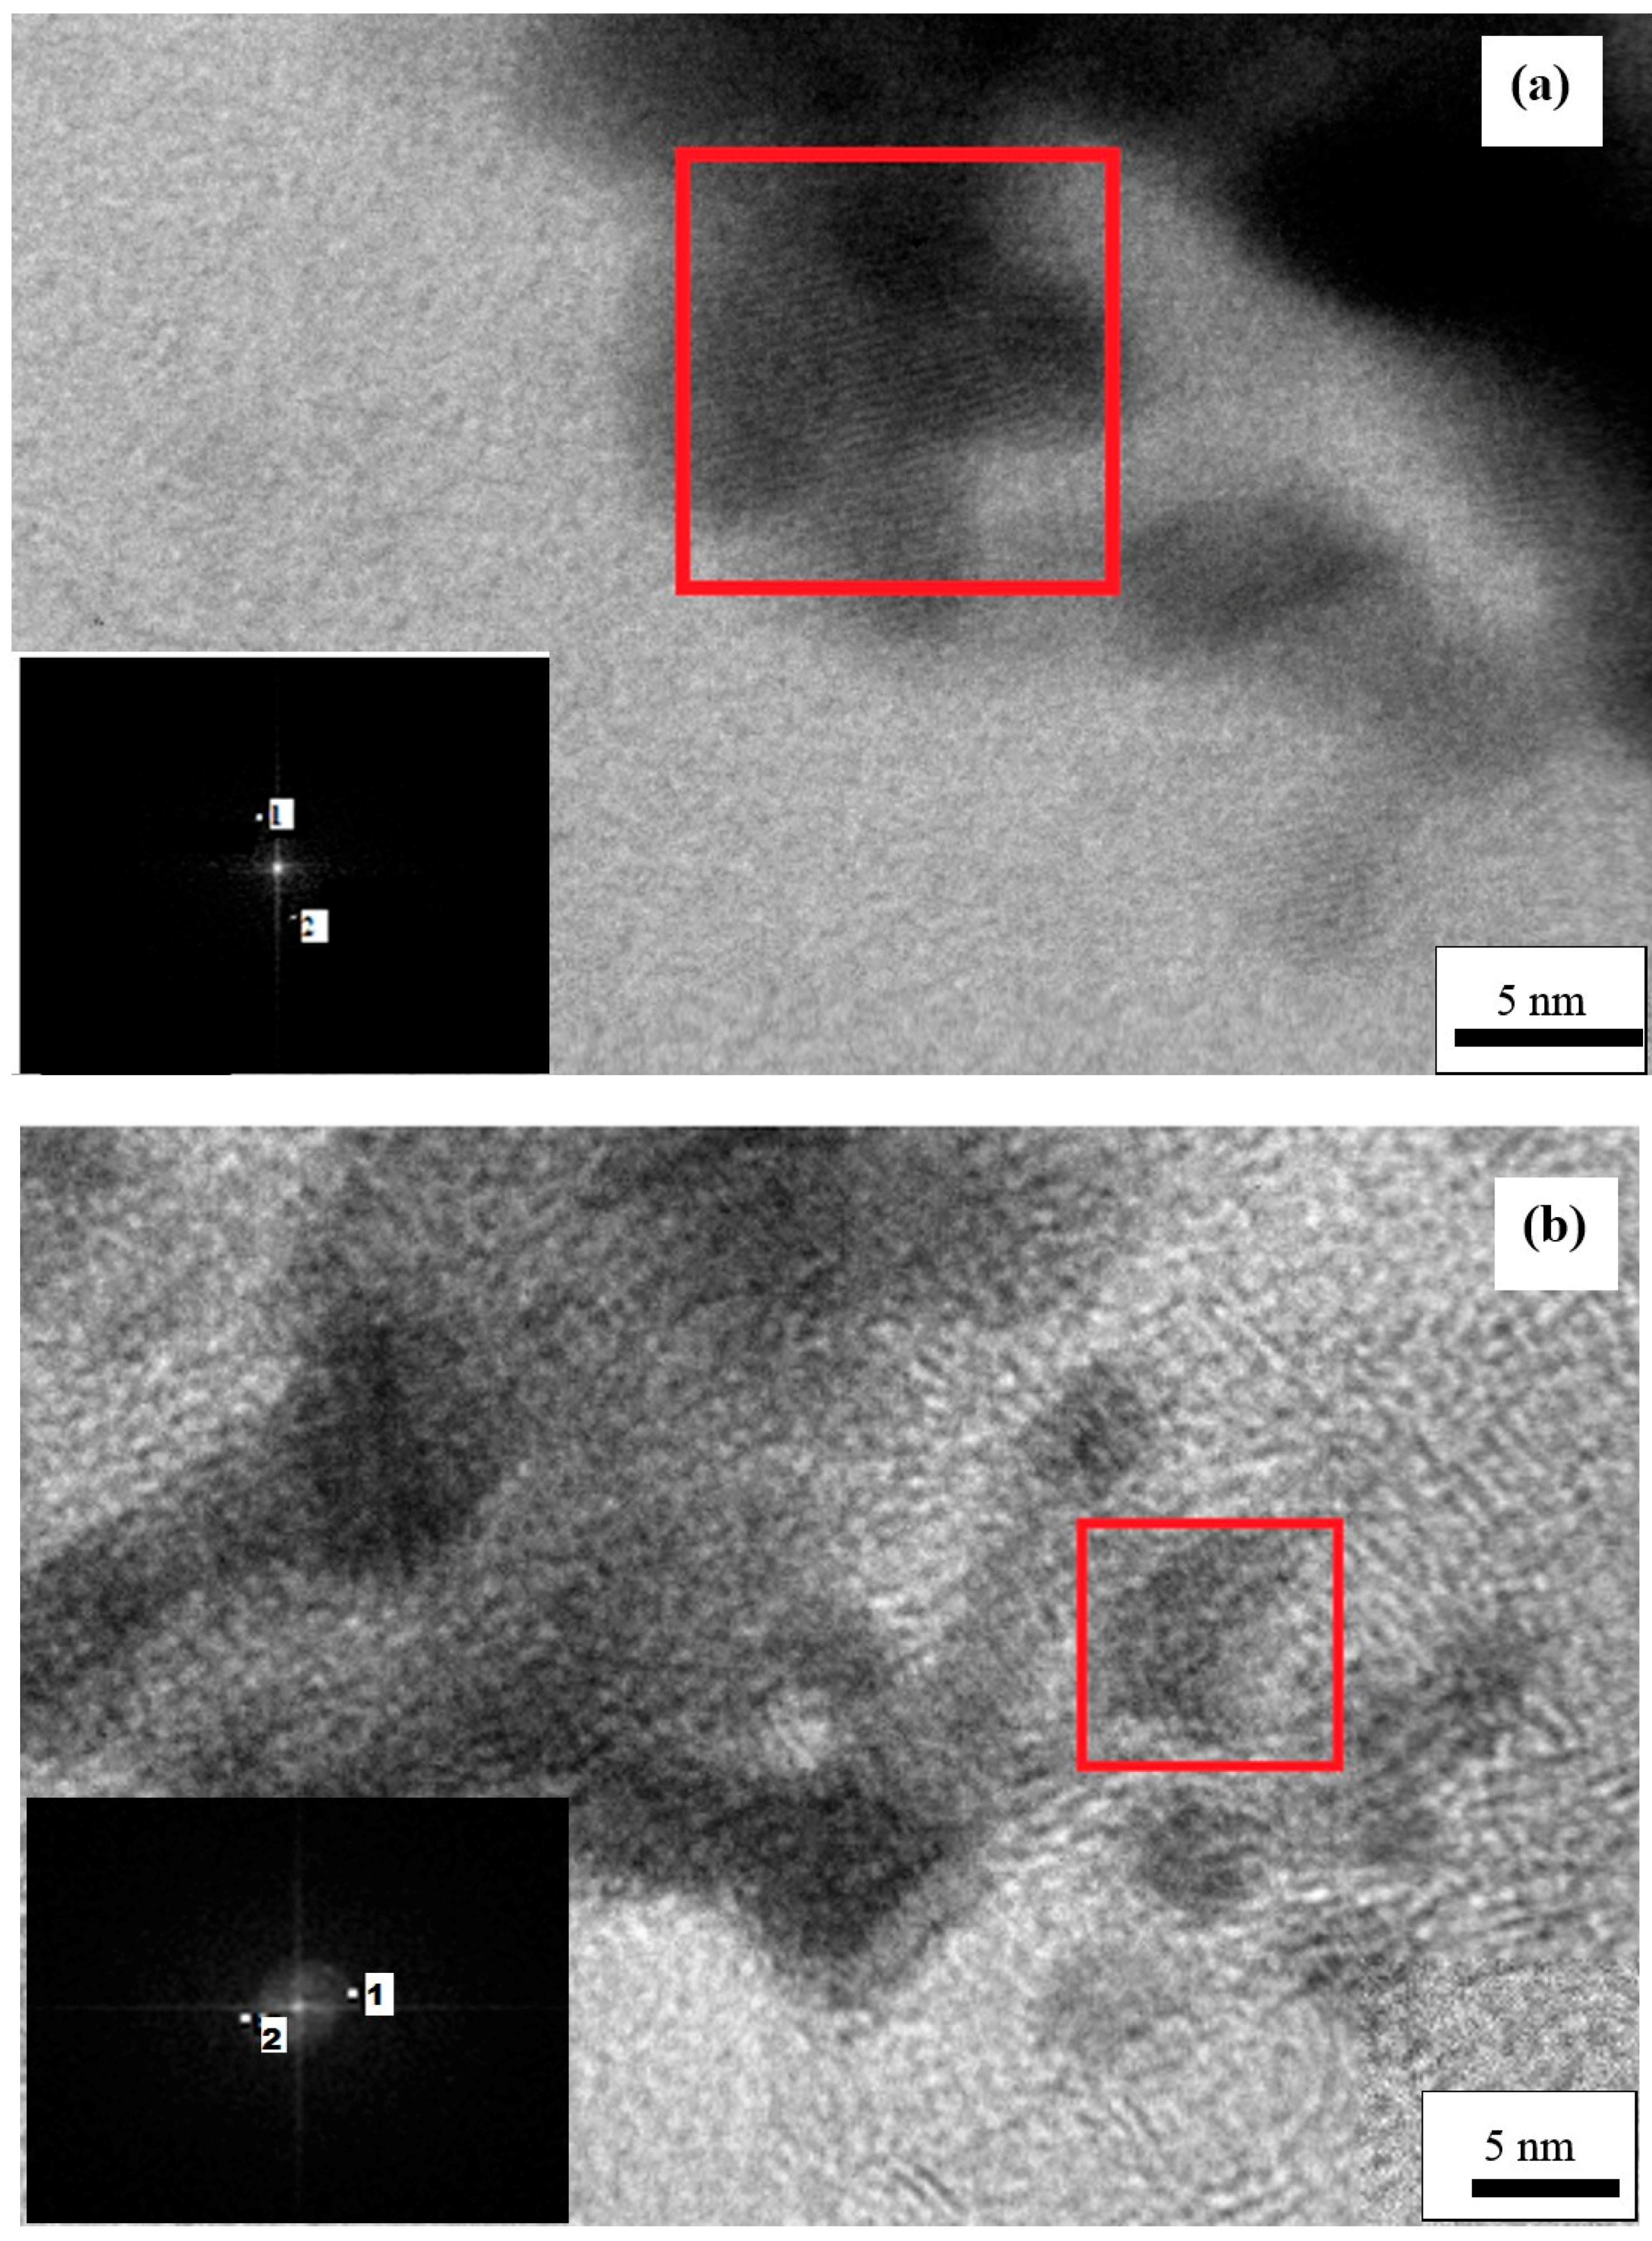
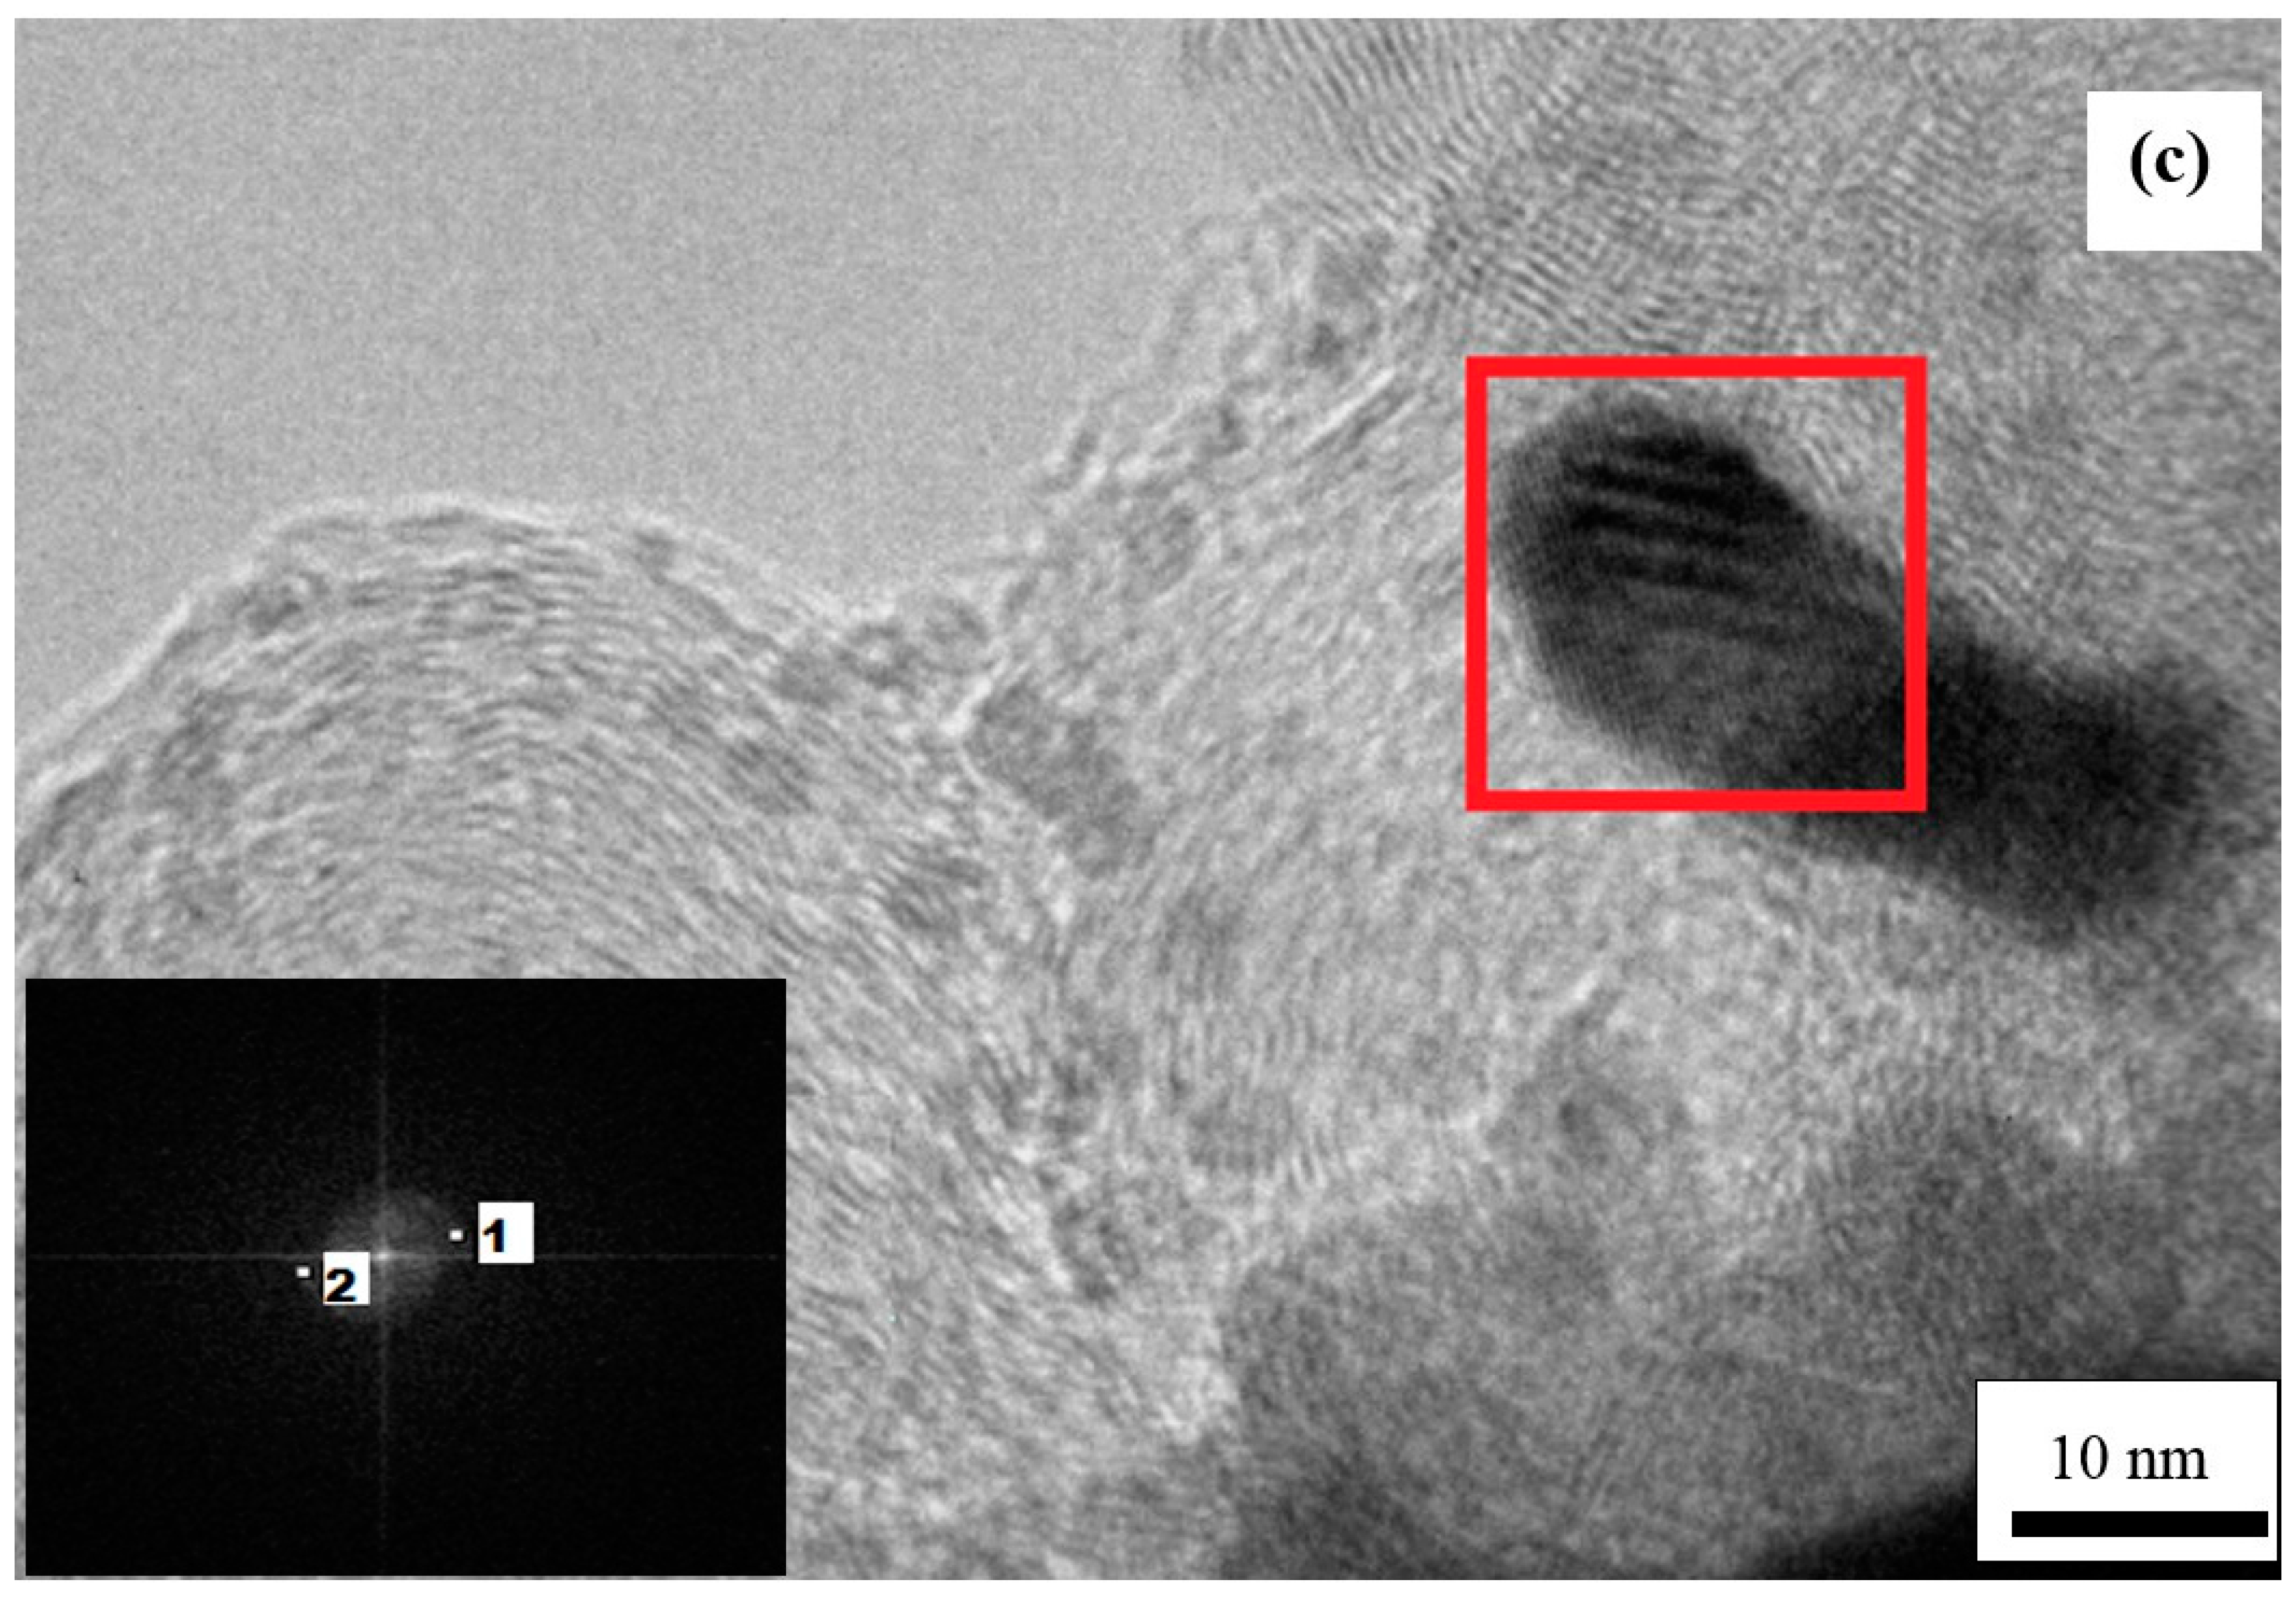
Another interesting point resulting from Figure 3 and Figure 4 is the composition of the electrocatalysts. The FFT analysis of the Cu nanoparticles exemplified in Figure 4a leads to an interplanar space of 0.215 nm, which clearly matches (relative error of about 2%) with the value of 0.219 nm corresponding to the Cu(111) crystallographic planes [40].
The interplanar spacings resulting from the FFT analysis of the marked region in Figure 4b,c are of 0.2244 and 0.2216 nm for Pt(cu) and Pt-Ru(Cu)/C, respectively, which can all be assigned to the Pt(111) planes [40] (relative errors of about 1 and 2%, also respectively). This indicates that Pt has essentially the same lattice structure as pure Pt, thus suggesting that the performance improvement in the CO and methanol oxidation discussed above is mainly due to the electronic effect of Cu on Pt. However, this is compatible with the generation of active Pt sites of different nature due to the Cu core effect. The corresponding EDS analyses of Pt(Cu)/C and Pt-Ru(Cu)/C gave Pt:Cu atomic ratios of about 1.4, that is somewhat smaller than the value of 1.6 obtained for the specimens prepared with qCu equal to 40 mC [18]. The smaller relative Pt content of the former can also be explained by the different nanoparticle size, because in the core-shell structure a higher relative amount of Cu is expected to remain under the Pt shell when increasing the nanoparticle size. These EDS results together with the absence of Cu oxidation peaks in the cyclic voltammograms of Figure 1a,b (curves a and b) clearly indicate the formation of the core-shell structures.
Figure 2 also allows concluding about the best preparation conditions of the Pt-Ru(Cu)/C catalysts for CO and methanol electrooxidation. These should be at least those leading to the most negative onset potentials for CO and methanol oxidation. According to this figure, this approximately corresponds to the most negative peak potential of CO stripping and also to the maximum ECSA for CO oxidation. The coincidence of the catalyst preparation conditions to obtain the lowest onset potentials for methanol oxidation together with the maximum ECSA values for CO oxidation is in agreement with the participation of CO as intermediate in the electrooxidation of methanol. Parallel results were also found for Pt-Ru/C catalysts obtained by spontaneous deposition of Ru species on commercial Pt/C [36], in which case the most negative potential for the CO stripping peak corresponded to the greatest ECSA for CO oxidation together with the highest currents for the methanol oxidation. According to the curves bd in Figure 2a and curve b in Figure 2b, the most suitable Cu electrodeposition charge is estimated to be of 38 ± 2 mC, which corresponds to a Cu load of 5.4 (± 0.3) × 102 mC cm−2. It has been determined in these conditions that 0.38 mol Pt is deposited per mol of electrodeposited Cu [18] and, therefore, the corresponding specific Pt load would be of 0.21 mgPt cm−2, which falls in the range of suitable Pt loads for catalytic purposes.

2.2. Pt Deposition Time by Galvanic Exchange in the Synthesis Sequence ii

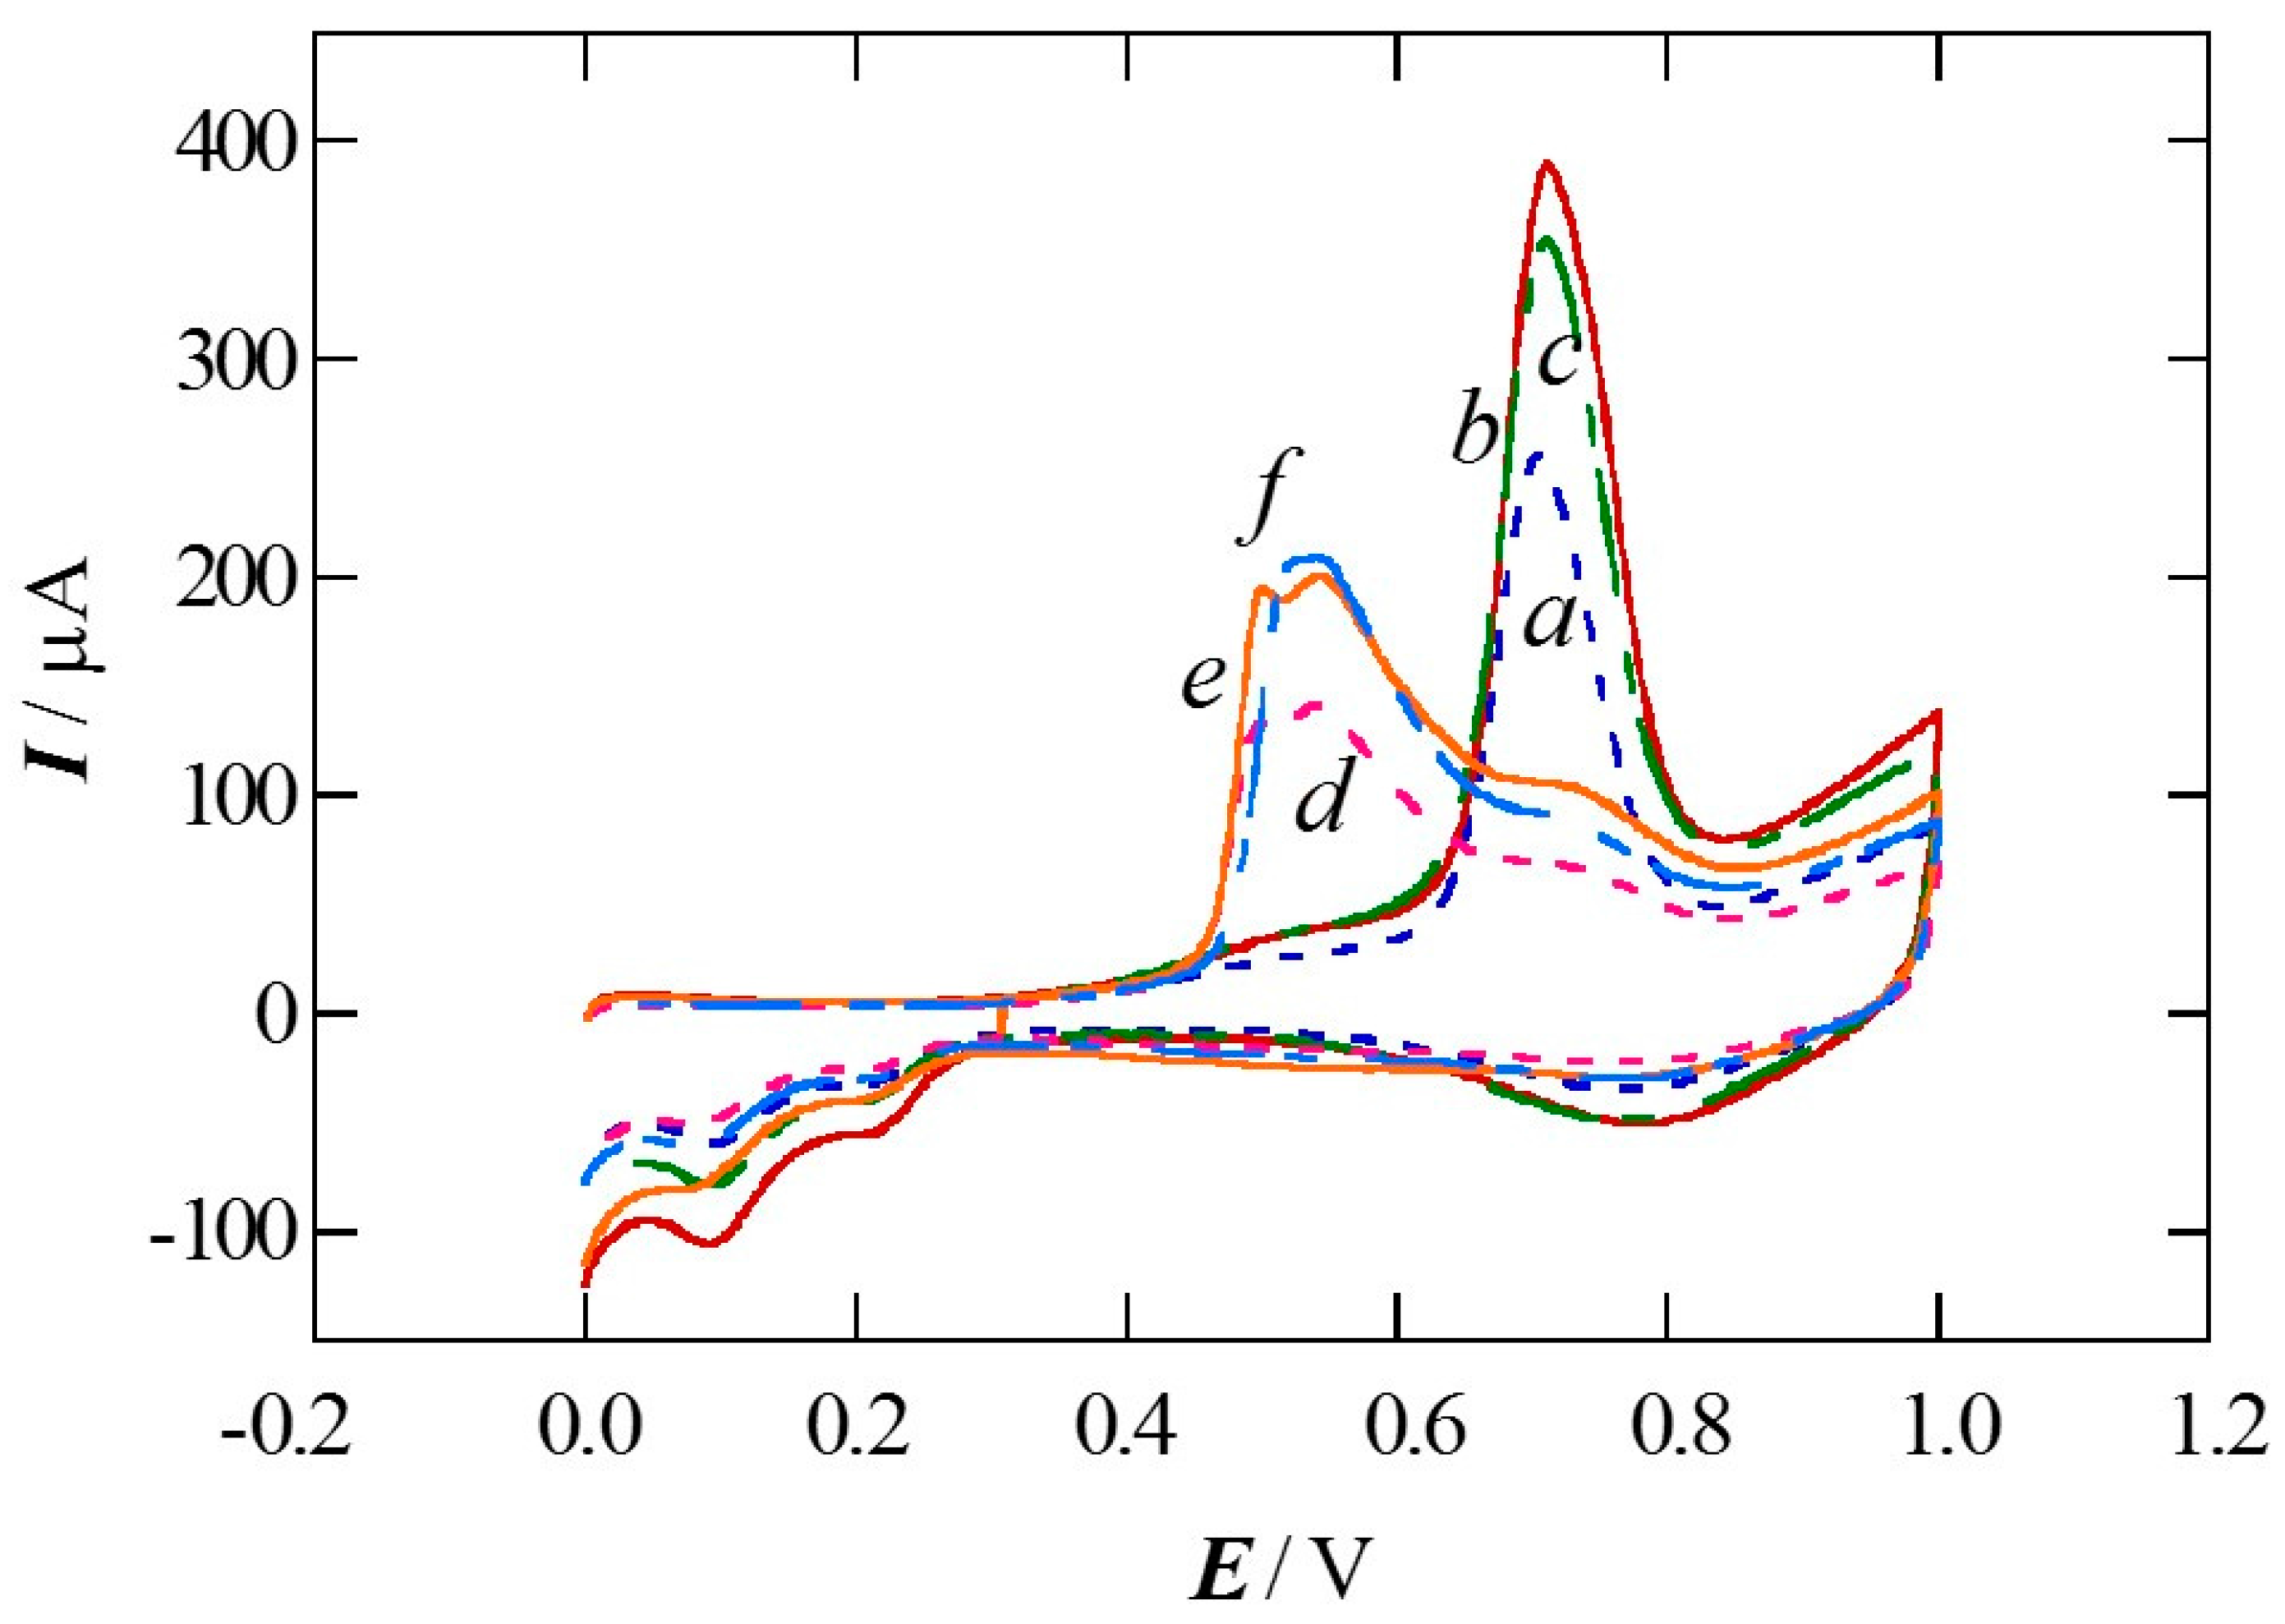
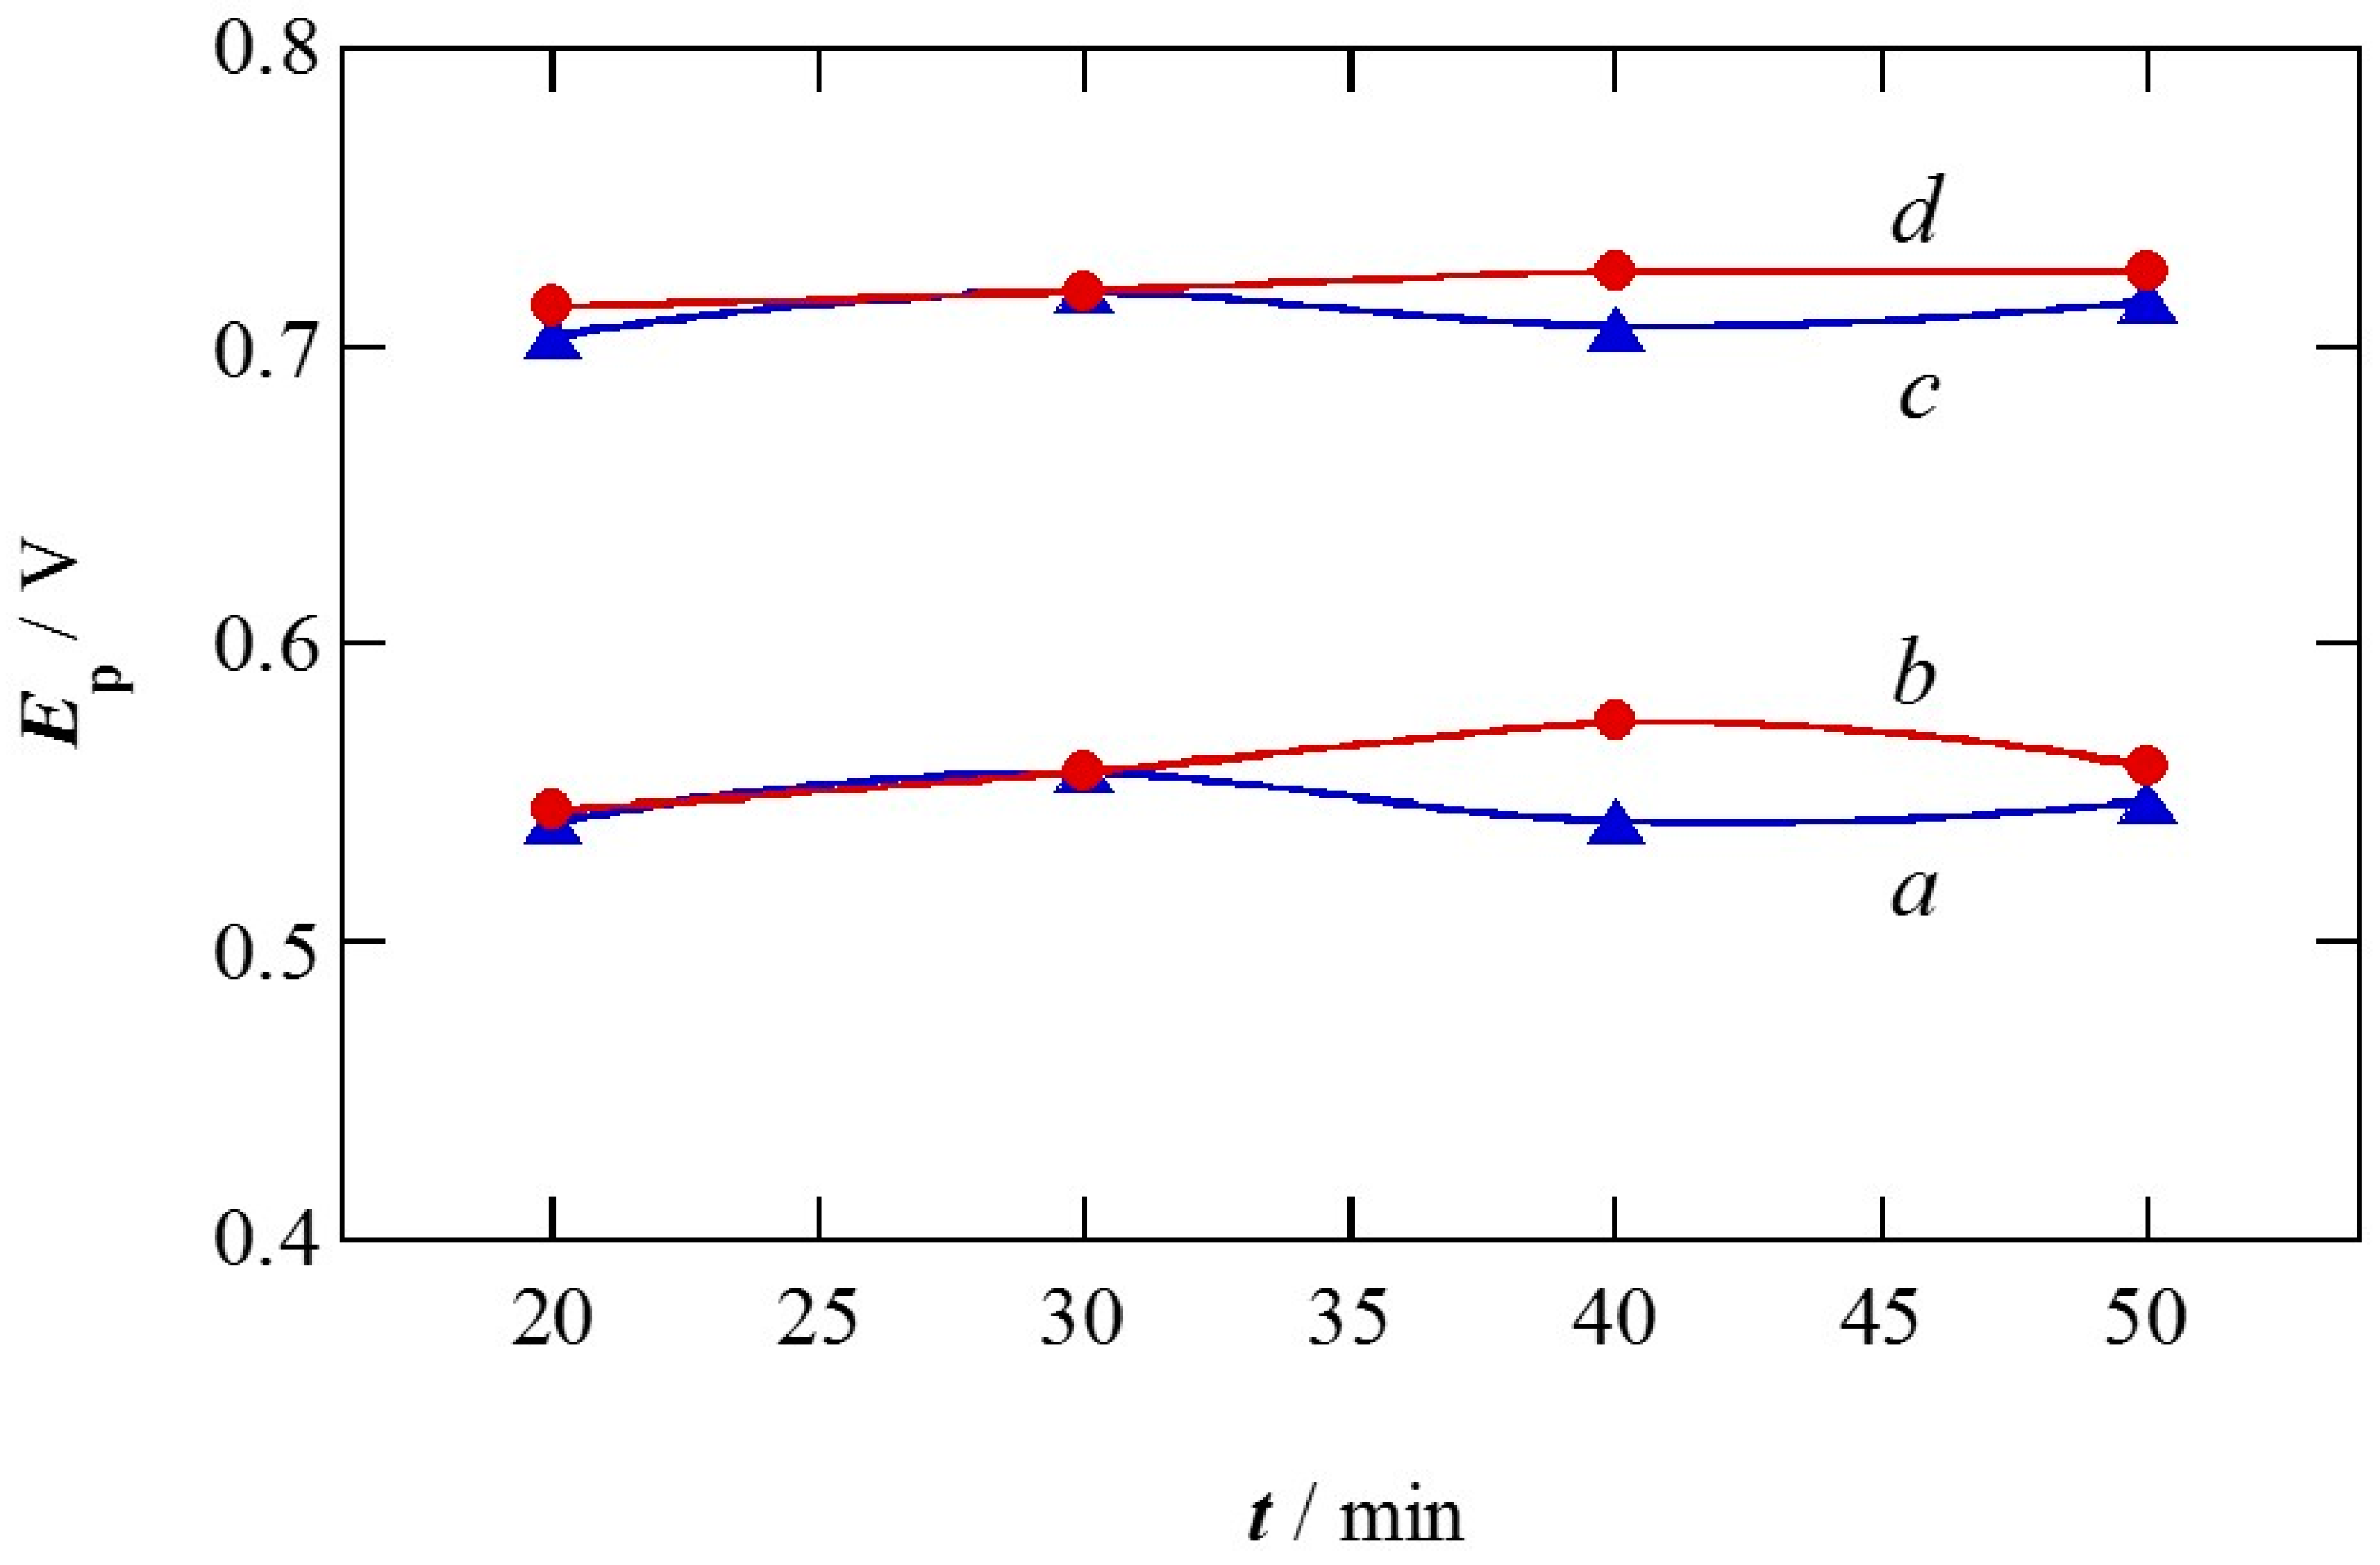
After identifying the suitable Cu deposition charge, this was applied to obtain the Pt(Cu) core-shell structure with different times of galvanic exchange between Cu and Pt, following the synthesis sequence ii. Figure 5 depicts the CO stripping voltammograms for Pt(Cu)/C and Pt-Ru(Cu)/C for different times of galvanic exchange, showing the same essential features as those of Figure 2a, that is, CO stripping peaks at about 0.72 and 0.55 V for the former and for the latter respectively, in agreement with the better CO tolerance of Pt-Ru(Cu)/C. These stripping peak potentials are depicted in Figure 6, curves a and c, for both electrocatalysts at different times of galvanic exchange. As can be seen, these values did not significantly depend on the immersion time in the Pt(IV) solution. Figure 5 highlights that the highest stripping currents were obtained for 30 min. In fact, they increased from 10 to 30 min and then they remained almost constant or even decreased slightly. The same change takes place with the corresponding anodic charges. Note that the stripping voltammograms recorded for 30 (curves b and e) and 60 min (curves c and f) were very similar. As long as the charges of these anodic peaks approached to the ECSAs of CO oxidation, one can conclude that 30 min appeared to be the most adequate time for the Pt exchange with Cu. Increasing the immersion time in the Pt(IV) solution did not significantly affect the catalyst performance, most probably because no more Cu can be exchanged and the nanoparticles remain the same.

2.3. Spontaneous Deposition Time of Ru Species on Pt in the Synthesis Sequence iii

In this case, after 38 mC of Cu electrodeposition and 30 min of galvanic exchange with Pt, the spontaneous deposition of Ru species were allowed for different times in the quiescent solution. Representative CO stripping curves of the resulting Pt-Ru(Cu)/C catalysts are depicted in Figure 5. The CO stripping peak potentials for the Pt(Cu)/C and the Pt-Ru(Cu)/C catalysts as a function of the immersion time in the Ru(III) solution are represented in curves b and d of Figure 6, respectively. No important changes in these parameters were found when compared to the different immersion times in the Pt(IV) solution.
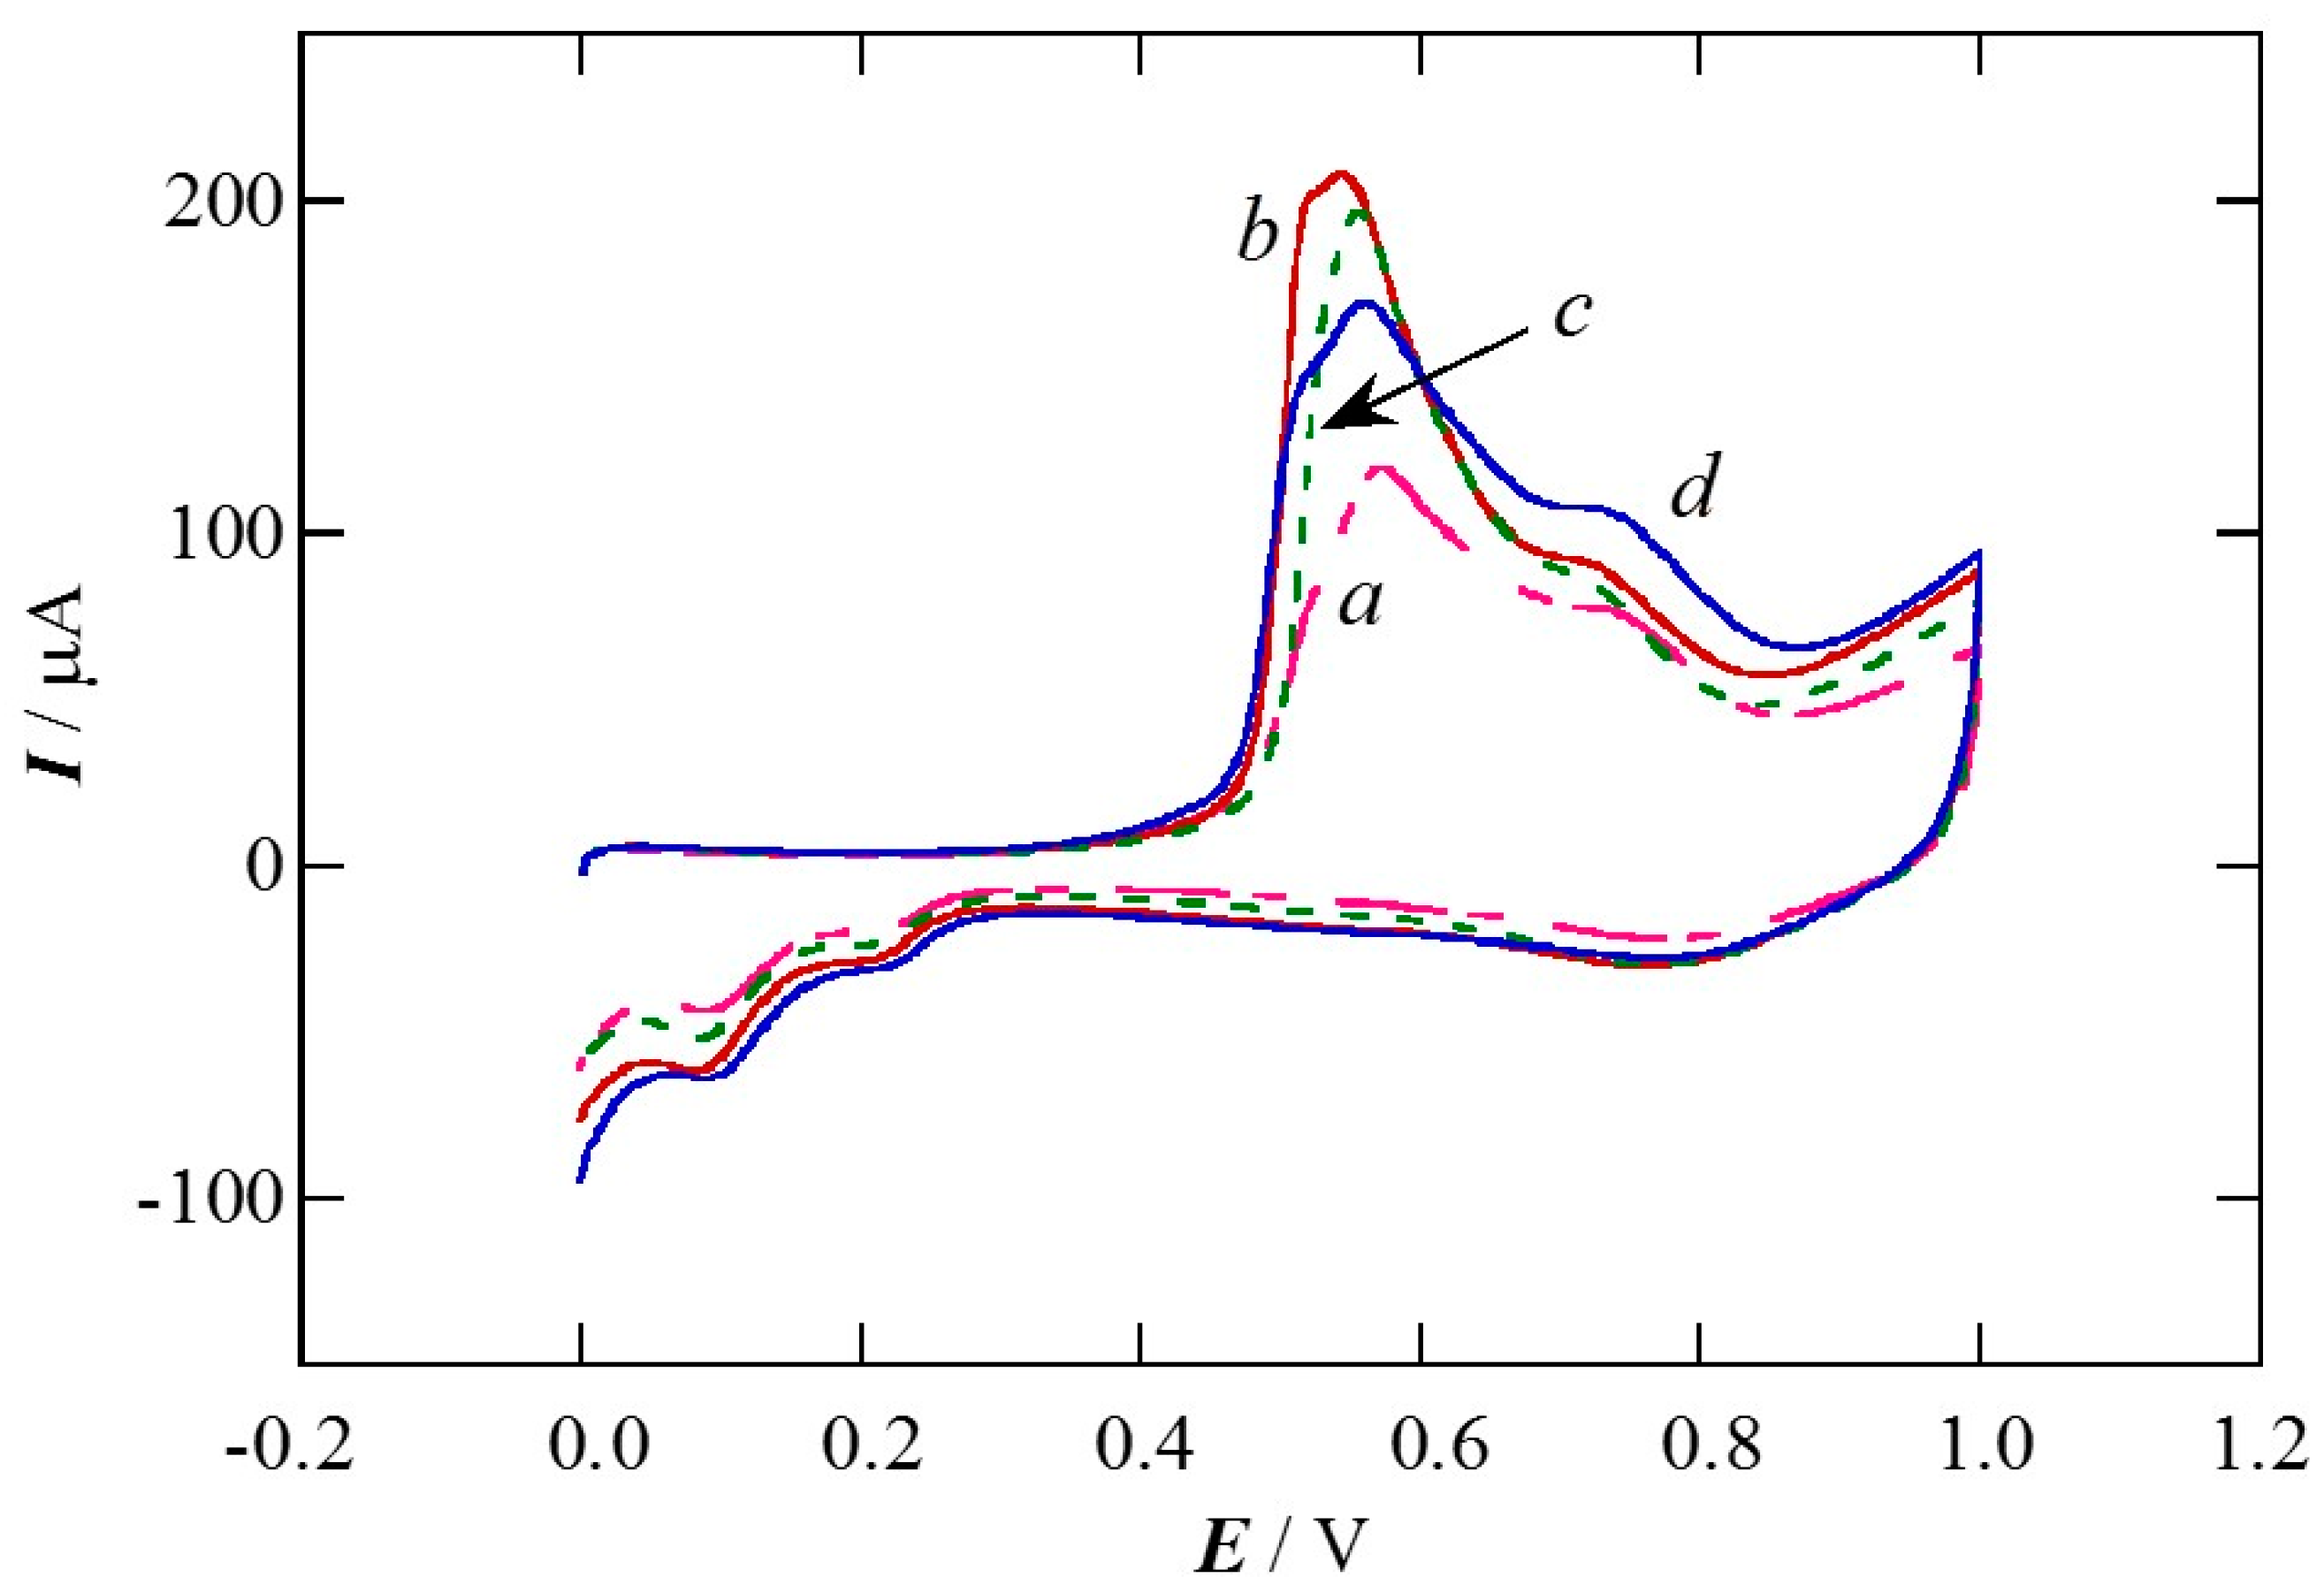
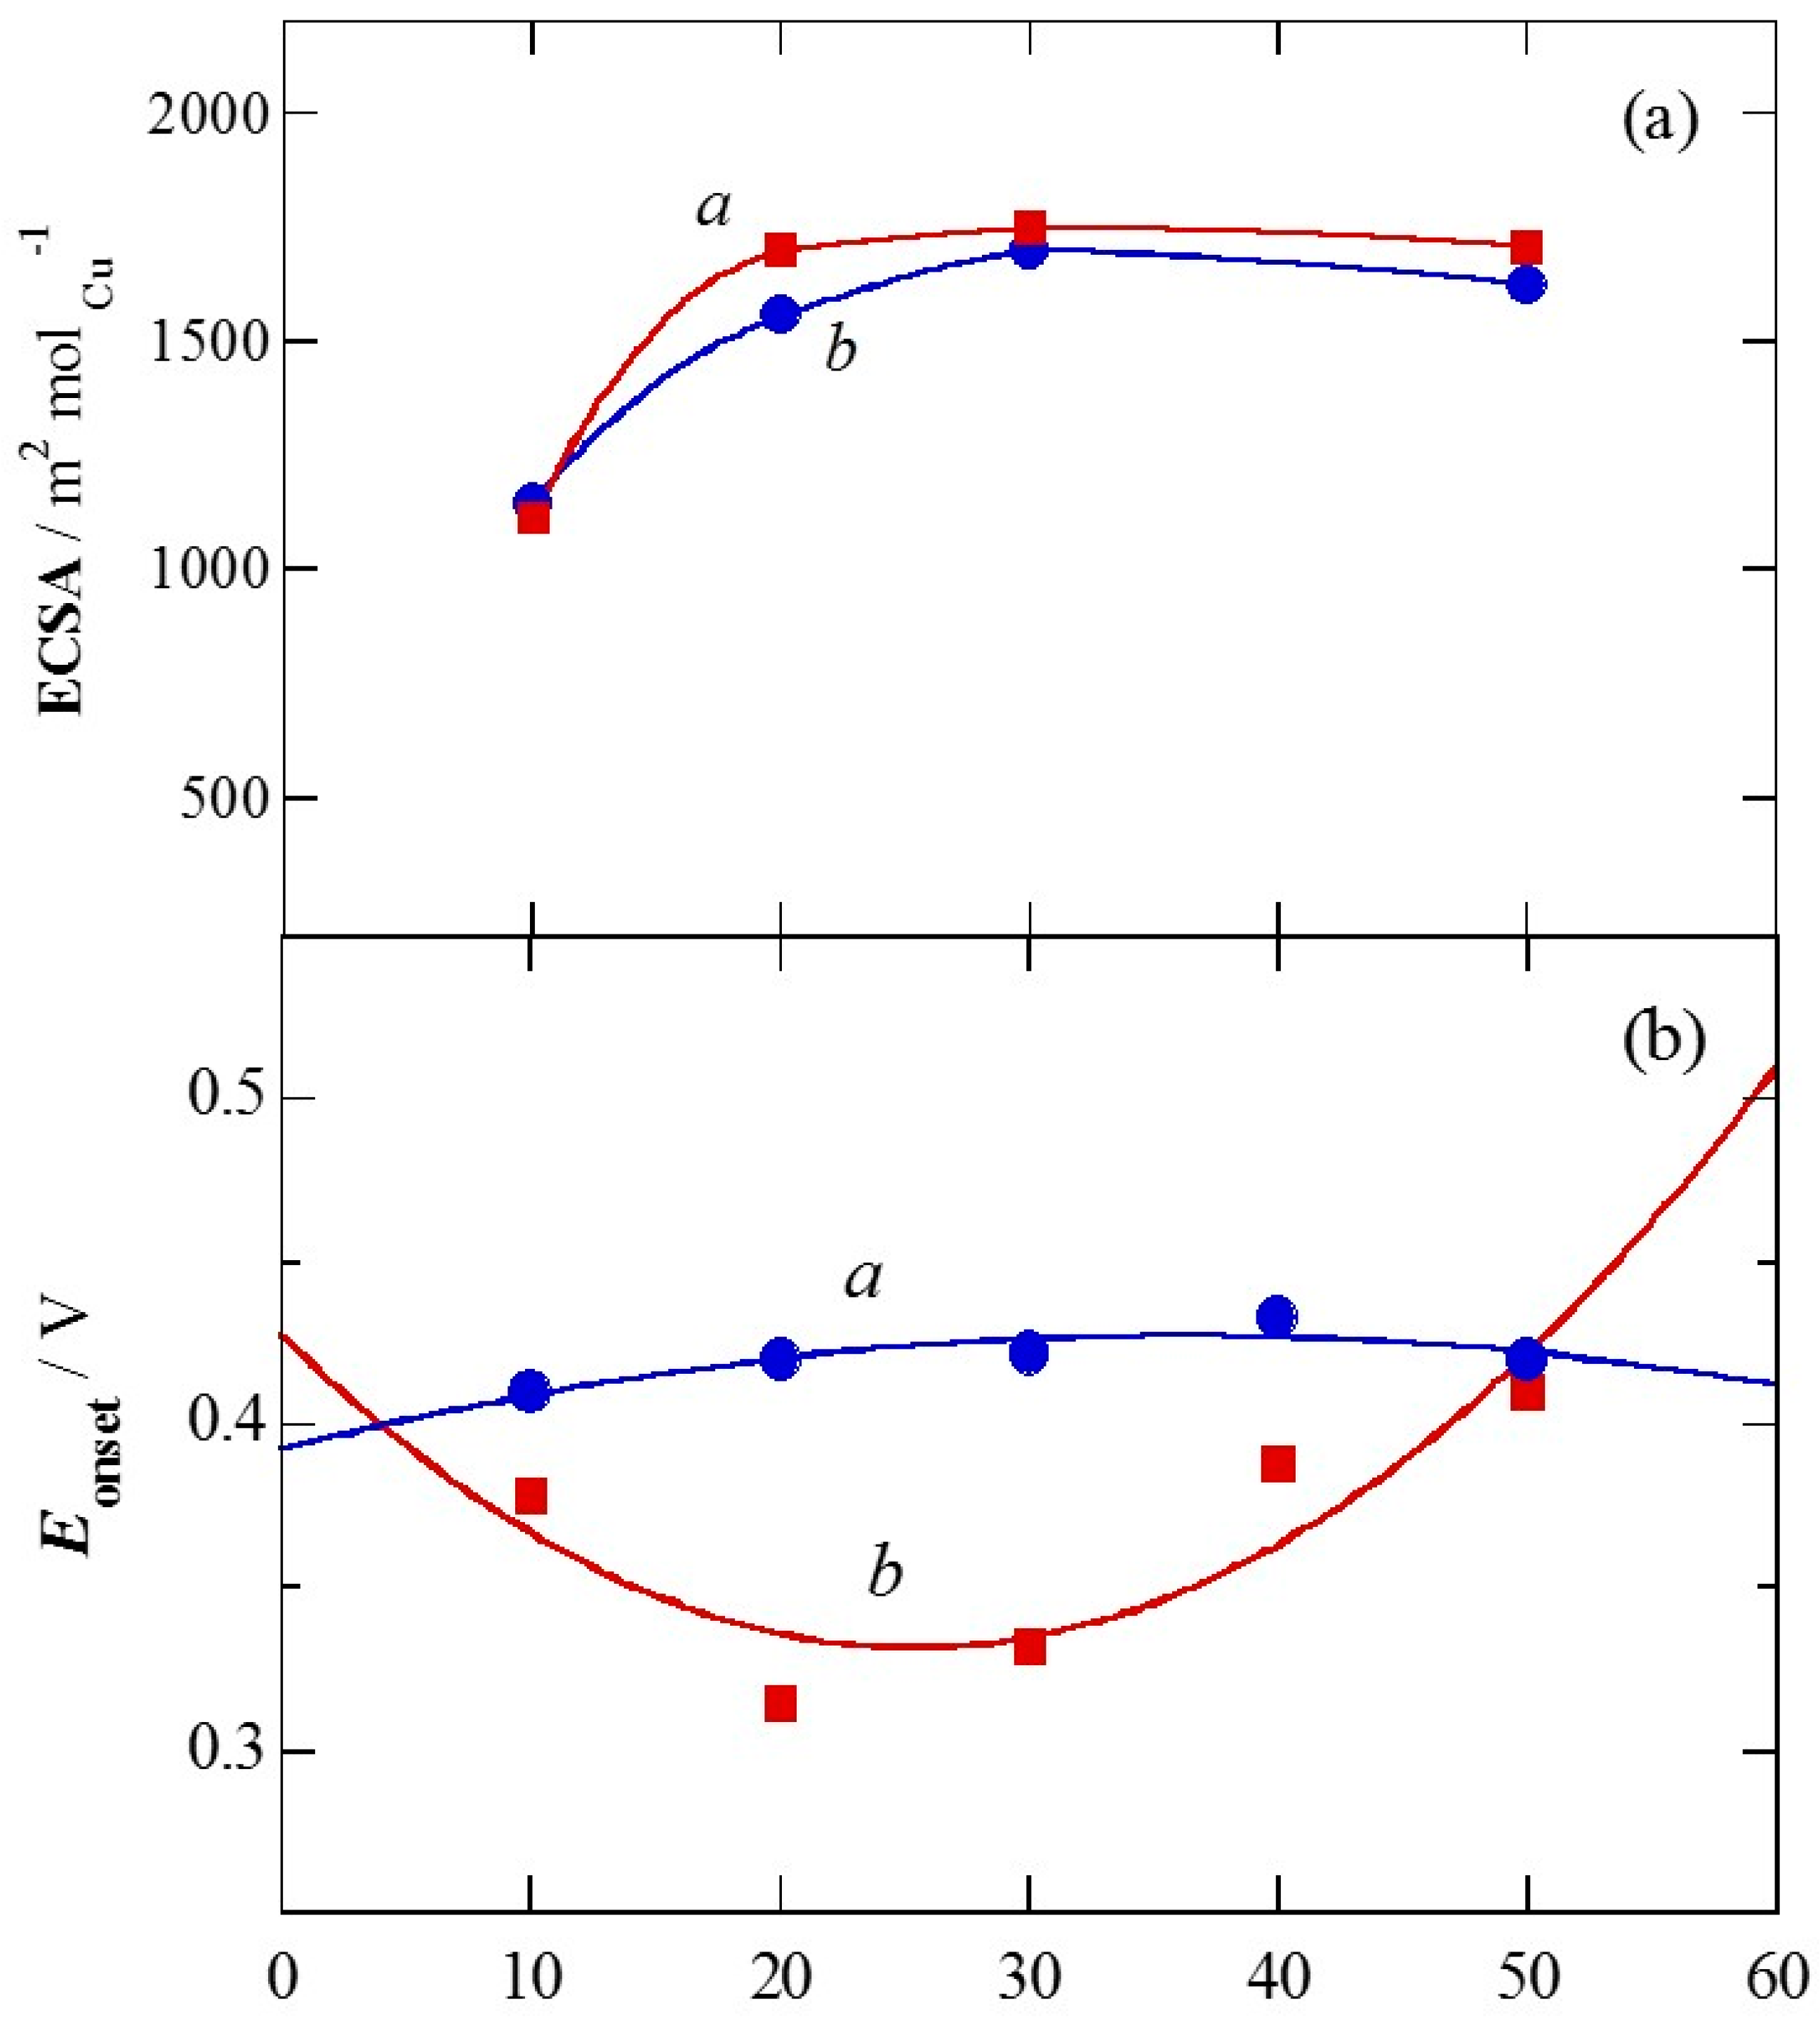
Figure 7 shows that the currents increased when passing from 10 to 20 min of spontaneous deposition of the Ru species and then, the stripping profile presented small changes. In fact, the ECSAs for CO oxidation are 1.11 × 10³ m2 molCu−1 for 10 min and increases to 1.70 × 10³ m2 molCu−1 for 20 min, being 1.71 × 10³ m2 molCu−1 for 50 min (see Figure 8a). In addition, the onset potentials for CO and methanol oxidation were minimal and about 0.41 and 0.32 V respectively, for about 22 ± 2 min of spontaneous deposition of the Ru species (see Figure 8b). At the same time, the coverage by the Ru species increased from about 0.2 after 10 min of spontaneous deposition to about 0.5 after 40 min. This variation of the onset potential for methanol oxidation on the Ru coverage is probably due to the deposition of the Ru species on active sites of the Pt shell structure. Again, suitable coverage of Ru species of about 0.3 were found for 20–30 min of spontaneous deposition of Ru(III) species, as discussed above.
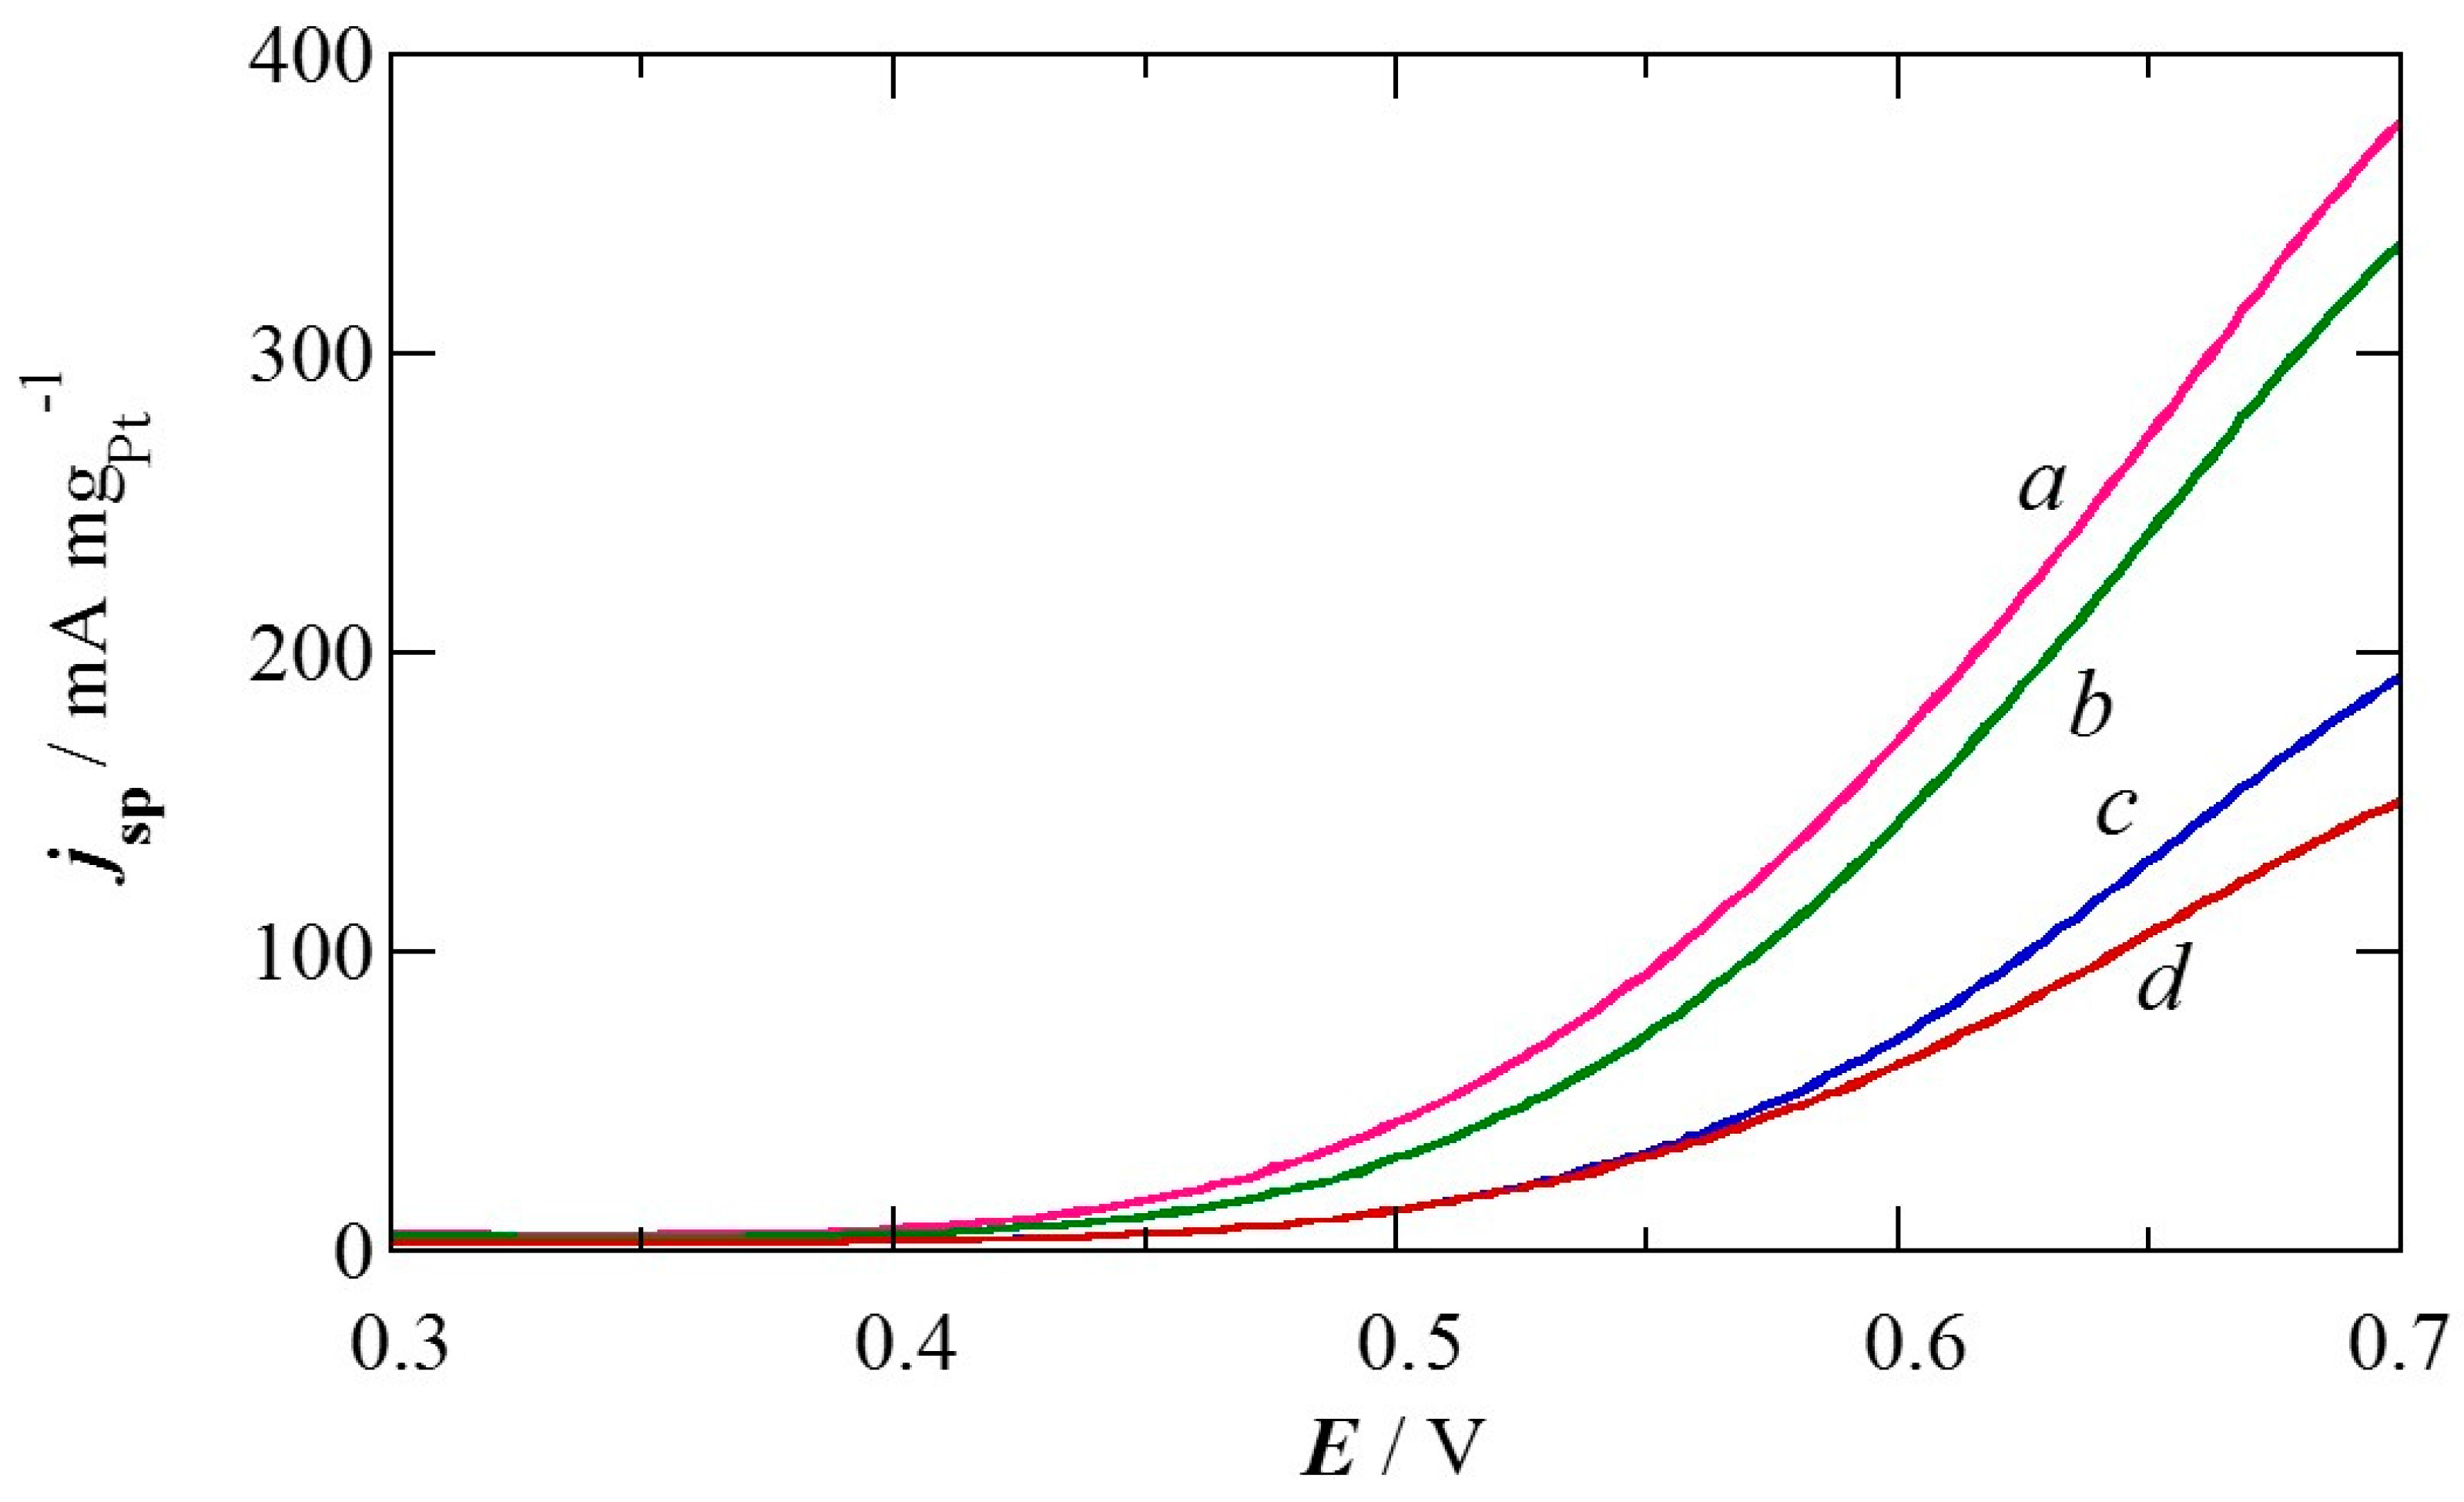
Considering that 0.38 mol Pt are produced per mol of electrodeposited Cu [18], the voltammograms of the methanol oxidation were recorded and are shown in Figure 9, represented as specific currents per unit mass of Pt (mass activities). Note that the current density vs. potential curves referred to the electrode section (i.e. prior to the normalization by the Pt mass), presented the same sequence as that shown in this figure because the nanoparticles contained the same amount of Pt, only changing the amount of spontaneously deposited Ru species. It can be mentioned however, that the current density at 0.7 V corresponding to the curve a in Figure 9 was of 76 mA cm−2. In agreement with the onset potentials for methanol oxidation, the best performance can be observed for 22 min of spontaneous deposition of the Ru(III) species. From these findings, the sequence iii with qCu of 38 mC with a rotation rate of 100 rpm, a galvanic exchange with the Pt(IV) solution for 30 min also at 100 rpm and finally a spontaneous deposition time of 22 min in the quiescent Ru(III) solution were identified to be the best conditions for the electrochemical preparation of the present core-shell electrocatalysts.
Figure 9 also shows that the best mass activity achieved at 0.7 V was 375 mA mgPt−1, corresponding to a spontaneous deposition time of Ru species of 22 min. The direct comparison with previous results in the literature is not possible because there are too many variables to fix. However, we have selected some values from literature in order to have a rough approach. Thus, for 2.0 M CH3OH + 0.1 M H2SO4 on Pt(Cu)/C core-shell electrocatalysts, the best mass activity at 0.7 V and 50 mV s−1 was about 250 mA mgPt−1, for a Pt:Cu molar ratio of 0.17:0.83 [24]. Note that the linear sweep voltammograms in Figure 9 have been obtained at 20 mV s−1 and 1.0 M CH3OH. The mass activity reported for methanol oxidation at the same potential for Pt-Cu core-shell alloy with 9.5 wt % Pt at 5 mV s−1 in 0.5 M CH3OH + 1 M HClO4 was about 140 mA mgPt−1 [28]. Therefore, the results reported in curve a of Figure 9 can be considered good. Other works report on different fuels. The best mass activity for ethanol oxidation at the same potential for Pt-Cu core-shell catalysts with similar content in Pt and Cu at 20 mV s−1 in 0.17 M CH3CH2OH + 0.5 M H2SO4 was about 4 mA mgPt−1 [27]. In the case of formic acid oxidation, the mass activity also at 0.7 V for highly dispersed Pt-Cu/C catalysts via surface substitution and etching separation at 50 mV s−1 in 0.25 M HCOOH + 0.5 M H2SO4 was about 250 mA mgPt−1 [30]. In a different synthesis process, novel excavated rhombic dodecahedral PtCu3 nanocrystals with (110) facets prepared by a wet chemical route, gave about 600 mA mgPt−1 in the same conditions of potential, sweep rate and electrolyte than the latter [25]. In all these cases, the mass activity in front of the fuel oxidation was always much better than that for commercial Pt/C and also with much better stability under cycling than the latter, assigned to the superior catalytic activity and selectivity of the Pt-Cu alloy in decreasing the generation of CO [30]. The ligand effect of Cu has also been argued to explain the superior activity of Pt-Cu for oxygen reduction [26]. In the present paper, the positive results can be assigned not only to the electronic effect of Cu but also to the positive effect of the deposited Ru species, which are easily hydroxylated and allow enhancing the CO oxidation due to the bifunctional mechanism [7,35,36,41]:
RuOxHy(OH) + Pt-CO → RuOxHy + Pt + CO2 + H+ + e
Ru(OH) + Pt-CO → Ru + Pt + CO2 + H+ + e
in which RuOxHy(OH) and Ru(OH) result from the hydroxylation of RuOxHy and Ru respectively.

3. Experimental Section

3.1. Materials and Reagents

The supporting carbon was Vulcan XC72R produced by Cabot Corporation, Boston, MA, USA (mean particle size and specific surface area of about 30 nm and 250 m2 g−1 respectively [42]). It was deposited onto a Metrohm glassy carbon (GC) tip of 3 mm in diameter (section of 0.071 cm2), previously polished with Micropolish II deagglomerated α-alumina (0.3 μm) and γ-alumina (0.05 μm) on a PSA-backed White Felt cloth from Buehler, Coventry, UK. The solutions were prepared using Millipore Milli Q high-purity water from Merck KGaA, Darmstadt, Germany (resistivity >18 MΩ cm at 25 °C), analytical grade 96 wt % H2SO4 from Acros Organics, HClO4, hydrated RuCl3, and H2PtCl6 from Merck, and CuSO4·5H2O, and Na2SO4 from Panreac. N2 and CO gases were Linde 3.0 (purity ≥ 99.9%).

3.2. Working Electrodes

The preparation and testing of the electrodes were performed by means of a PGSTAT100 potentiostat-galvanostat commanded by the NOVA 1.10 software both from Metrohm Autolab B.V., Utrecht, The Netherlands. The electrochemical cell was Metrohm 200 mL-volume with a double wall, which was connected to a MP-5 thermostat from JULABO GmbH, Seelbach, Germany to maintain the temperature to 25.0 ± 0.1 °C. A double junction Ag|AgCl|KCl(sat) (0.199 V vs. SHE at 25 °C) and a Pt rod were used as the reference and the auxiliary electrodes respectively. However, all the potentials given in this paper have been referred to the RHE. The electrocatalysts were prepared on the carbon support deposited on the GC tip, which was coupled to a RDE from Metrohm Autolab B.V., Utrecht, The Netherlands. N2 was bubbled through the electrolyte before the deposition of Cu, Pt and the Ru species and also before the CV experiments. N2 was passed over the electrolyte during the deposition processes and the electrochemical testing.
The Pt(Cu)/C and Pt-Ru(Cu)/C working electrodes were prepared as follows, based on the electrodeposition method previously described [18]. First, 20 µL of the carbon suspension (4 mg in 4 mL of water, sonicated for at least 45 min) were deposited onto the polished GC tip (0.28 mgC cm−2) and dried under the heat of a lamp. Afterwards, it was cleaned on the RDE in deaerated 0.5 M H2SO4 by CV scans within the limits of 0.0 and 1.0 V at 100, 50 and 20 mVs−1 for 10, 5 and 3 cycles, respectively (cleaning protocol). The electrodeposition of the catalysts consisted in the following consecutive steps: (a) potentiostatic Cu electrodeposition at −0.1 V and 100 rpm in 1.0 mM CuSO4 + 0.1 M Na2SO4 + 0.01 M H2SO4 (Cu/C electrode); (b) Pt deposition on the Cu nuclei by galvanic exchange in 1 mM H2PtCl6 + 0.1 M HClO4 at 100 rpm (Pt(Cu)/C); (c) spontaneous deposition of Ru species on the Pt(Cu)/C electrode in aged (for at least one week) and quiescent 8.0 mM RuCl3 + 0.1 M HClO4 (Pt-Ru(Cu)/C). The Cu electrodeposition efficiency was determined through the Cu oxidation charge in the same solution after sweeping the potential from 0.0 to 1.0 V at 10 mV s−1. The variables studied were:
(i) Cu electrodeposition between 20 and 50 mC followed by the galvanic exchange with Pt for 30 min and the spontaneous deposition of Ru species for 30 min.
(ii) Galvanic exchange with Pt from 10 to 60 min after the best Cu electrodeposition charge (obtained from sequence i), followed by the spontaneous deposition of the Ru species for 30 min.
(iii) Spontaneous deposition of the Ru species between 10 and 60 min after the best Cu electrodeposition charge (from sequence i) and the best time of galvanic exchange with Pt (from sequence ii).
Immediately after preparation, the Cu/C electrode was carefully cleaned in water, whereas the Pt(Cu)/C and Pt-Ru(Cu)/C ones were submitted to the cleaning protocol described above. The CV profiles obtained from this protocol were always practically stationary after the second scan, confirming their stability and cleanliness.

3.3. Electrochemical Testing

The CO tolerance of the electrocatalysts was studied by CV in 0.5 M H2SO4. CO gas was first bubbled through the solution for 15 min while setting the electrode potential at 0.1 V. Afterwards, the dissolved CO was removed by N2 bubbling through the solution for 30 min and then, the adsorbed CO was stripped by sweeping the potential between 0.0 and 1.0 V at 20 mV s−1 without stirring. The ECSA for the CO oxidation was estimated taking into account that the oxidation of a CO monolayer on polycrystalline Pt needs 420 µC cm−2 [4,9,43]. After CO stripping, the activity of the Pt(Cu)/C and Pt-Ru(Cu)/C catalysts was recovered as demonstrated by the consecutive cyclic voltammograms, which retraced those obtained before the CO adsorption.
The methanol oxidation performance for the different Pt-Ru(Cu)/C electrocatalysts was characterized by CV in a previously deaereated 1.0 M CH3OH + 0.5 M H2SO4 solution between 0.0 and 0.7 V at 20 mVs1. The CV experiments before and after the methanol oxidation analyses in the deaerated 0.5 M H2SO4 confirmed that there was not loss of catalyst loading.

3.4. Structural Characterization

The morphological and structural characterization of the catalysts was performed by means of the TEM and HRTEM techniques using a 200 kV JEM 2100 LaB6 transmission electron microscope from JEOL, Peabody, MA, USA, furnished with EDS facilities. For the microscopic examination, the electrocatalysts prepared on the GC tip were dispersed in 3 mL of n-hexane for 10 min by ultrasonication. A drop of the suspension was then placed on a holley-carbon Ni grid. The electrocatalyst was ready for examination after the solvent evaporation under the heat of a 40 W lamp for 5 min. The TEM and HRTEM images were taken using an Orius MultiScan 794 charge-coupled device (CCD) camera from Gatan, Pleasanton, CA, USA. More than one hundred nanoparticles were counted to depict their size distribution. The interplanar spacing of the nanoparticles was determined from the digital treatment of the HRTEM pictures by means of the Digital Micrograph software, version 3.7.0, from Gatan, Pleasanton, CA, USA. First, the Fourier diffractogram was obtained by the Fast Fourier Transform of the HRTEM images of selected areas performed with this software. Then, the reciprocal value of the interplanar spacing was given by the distance between each identified spot and the center of the diffractogram. The interplanar spacing thus calculated was contrasted with the results listed in the MinCryst Database of the Institute of Experimental Mineralogy, Chernogolovka, Moscow region, Russia, revision of August 2008 [40].

4. Conclusions

This work studied the performance of carbon-supported core-shell Pt(Cu)/C and Pt-Ru(Cu)/C electrocatalysts, obtained by Cu electrodeposition, galvanic exchange with Pt(IV) and spontaneous deposition of Ru species. The Cu electrodeposition potential was −0.1 V vs. RHE and the variables explored were Cu electrodeposition charge, time of galvanic exchange with Pt(IV) and time of spontaneous deposition of Ru species. The ECSA for CO oxidation was determined per mol of electrodeposited Cu in order to identify the preparation conditions to obtain the most suitable core-shell nanoparticles. It was found that these normalized ECSA values were practically the same for Cu electrodeposition charges qCu in the range of 30–40 mC. However, they decreased for qCu equal to or greater than 45 mC. The HRTEM analyses indicated that the nanoparticle size increased for qCu exceeding 40 mC, thus justifying the concomitant decrease in the ECSA. Electrodeposition charges about 20 mC were insufficient to create suitable core-shell nanoparticles probably because a significant number of Cu atoms were partially occluded in the Pt shells and in the carbon. In this case, the steric hindrance impeded the Pt complex approach. However, the further Cu oxidation in these points could be easier. Based on the peak potentials for CO oxidation and the onset potentials for CO and methanol oxidation together with ECSA values, the suitable Cu electrodeposition charge to obtain the Pt-Ru(Cu)/C electrocatalysts was 38 ± 2 mC. The most suitable time for galvanic exchange of Cu by Pt(IV) was 30 min, the Pt shells completely covering the Cu cores. Under these conditions, maximum ECSA values for CO oxidation, normalized per mol of electrodeposited Cu on the Pt-Ru(Cu)/C electrocatalyst were achieved. A spontaneous deposition time of the Ru species on Pt(Cu)/C of 22 ± 2 min led to the smallest onset potentials for CO and methanol oxidation, which were about 0.05 V smaller than those determined for Ru-decorated commercial Pt/C catalysts. These conditions yielded the highest normalized ECSA values for CO oxidation and the best specific anodic current for methanol oxidation. For these best conditions, surface coverage of Pt by the Ru species in the Pt-Ru(Cu)/C electrocatalyst were determined and their normalized ECSA values for CO oxidation were comparable to those of Pt(Cu)/C, thus suggesting that the deposited Ru species were partially reducible to Ru metal during the cyclic scans. The positive effect of Cu was related to the electronic effect of the Cu core on the Pt shells and also to the generation of new active sites for CO oxidation. The best mass activities obtained for the methanol oxidation were compared to those previously reported in literature for the same fuel and also for ethanol and formic acid oxidation on Pt(Cu)/C catalysts prepared by different procedures. The present results strongly indicate an additional positive effect of the Ru spontaneously deposited species due to the bifunctional mechanism for CO oxidation.

Acknowledgments

The authors thank the financial support of Secretaria Nacional de Ciencia, Tecnología e Innovación (SENACYT, Panama) fellowship received by Griselda Caballero-Manrique and the Erasmus Undergraduate Research Placement achieved by Immad Muhammed Nadeem. The authors also thank the CCiT-UB (Scientific and Technological Centers of the Universitat de Barcelona) for the microscopic analysis facilities.

Author Contributions

G.C.-M. and P.-L.C. conceived and designed the experiments; G.C.-M. and I.M.N. performed the experiments; G.C.-M., E.B., J.A.G. and P.-L.C. analyzed the data; F.C. and R.M.R. contributed reagents/materials/analysis tools; G.C.-M., P.-L.C and E.B. wrote the paper.

Conflicts of Interest

The authors declare no conflict of interest. The founding sponsors had no role in the design of the study; in the collection, analyses, or interpretation of data; in the writing of the manuscript, and in the decision to publish the results.

References

  1. Costamagna, P.; Srinivasan, S. Quantum jumps in the PEMFC science and technology from the 1960s to the year 2000: Part 1. Fundamental scientific aspects. J. Power Sources 2001, 102, 242–252. [Google Scholar] [CrossRef]
  2. Liu, H.; Song, Ch.; Zhang, L.; Zhang, J.; Wang, H.; Wilkinson, D. A review of anode catalysis in the direct methanol fuel cell. J. Power Sources 2006, 155, 95–110. [Google Scholar] [CrossRef]
  3. Zainoodin, A.M.; Kamarudin, S.K.; Daub, W.R.W. Electrode in direct methanol fuel cells. Review. Int. J. Hydrogen Energy 2010, 35, 4606–4621. [Google Scholar] [CrossRef]
  4. Dos Santos, L.; Colmati, F.; González, E.R. Preparation and characterization of supported Pt-Ru catalysts with a high Ru content. J. Power Sources 2006, 159, 869–877. [Google Scholar] [CrossRef]
  5. Antolini, E. Platinum-based ternary catalysts for low temperature fuel cells: Part I. Preparation methods and structural characteristics. Appl. Catal. B Environ. 2007, 74, 324–336. [Google Scholar] [CrossRef]
  6. Iwasita, T. Methanol and CO electrooxidation. In Handbook of Fuel Cells-Fundamentals, Technology and Applications; Vielstich, W., Gasteiger, H.A., Lamm, A., Eds.; John Wiley & Sons: New York, NY, USA, 2003; Volume 3, pp. 603–622. [Google Scholar]
  7. Ruth, K.; Vogt, M.; Zuber, R. Development of CO-tolerant catalysts. In Handbook of Fuel Cells-Fundamentals, Technology and Applications; Vielstich, W., Gasteiger, H.A., Lamm, A., Eds.; John Wiley & Sons: New York, NY, USA, 2003; Volume 3, pp. 489–496. [Google Scholar]
  8. Lamy, C.; Lima, A.; LeRhun, V.; Delime, F.; Coutanceau, C.; Léger, J.M. Recent advances in the development of direct alcohol fuel cells (DAFC). J. Power Sources 2002, 105, 283–296. [Google Scholar] [CrossRef]
  9. Gasteiger, H.A.; Markovic, N.M.; Ross, N.P., Jr.; Cairns, E.J. CO electrooxidation on well-characterized Pt-Ru alloys. J. Phys. Chem. 1994, 98, 617–625. [Google Scholar] [CrossRef]
  10. Gasteiger, H.A.; Markovic, N.M.; Ross, P.N., Jr. H2 and CO electrooxidation on well-characterized Pt, Ru and Pt-Ru Rotating disk electrode studies of the pure gases including temperature effects. J. Phys. Chem. 1995, 99, 8290–8298. [Google Scholar] [CrossRef]
  11. Aricó, A.S.; Baglio, V.; Di Blasi, A.; Modica, E.; Antonucci, P.L.; Antonucci, V. Analysis of the high-temperature methanol oxidation behavior at carbon-supported Pt-Ru catalysts. J. Electroanal. Chem. 2003, 557, 167–176. [Google Scholar] [CrossRef]
  12. Tegou, A.; Papadimitriou, S.; Pavlidou, E.; Kokkinidis, G.; Sotiropoulos, S. Oxygen reduction at platinum- and gold-coated copper deposits on glassy carbon substrates. J. Electroanal. Chem. 2007, 608, 67–77. [Google Scholar] [CrossRef]
  13. Papadimitriou, S.; Tegou, A.; Pavlidou, E.; Armyanov, S.; Valova, E.; Kokkinidis, G.; Sotiropoulos, S. Preparation and characterization of platinum- and gold-coated copper, iron, cobalt and nickel deposits on glassy carbon substrates. Electrochim. Acta 2008, 53, 6559–6567. [Google Scholar] [CrossRef]
  14. Podlovchenko, B.I.; Gladysheva, T.D.; Filatov, Y.; Yashina, L.V. The use of galvanic displacement in synthesizing Pt(Cu) catalysts with the core-sell structure. Russ. J. Electrochem. 2010, 46, 1189–1197. [Google Scholar] [CrossRef]
  15. Kuznetsov, V.V.; Podlovchenko, B.I.; Kavyrshina, K.V.; Maksimov, Y.M. Oxidation of methanol on Pt(Mo) electrodes obtained using galvanic displacement method. Russ. J. Electrochem. 2010, 46, 1353–1359. [Google Scholar] [CrossRef]
  16. Podlovchenko, B.I.; Krivchenko, V.A.; Maksimov, Y.M.; Gladysheva, T.D.; Yashina, L.V.; Evlashin, S.A.; Pilevsky, A.A. Specific features of the formation on Pt(Cu) catalysts by galvanic displacement with carbon nanowalls used as support. Electrochim. Acta 2012, 76, 137–144. [Google Scholar] [CrossRef]
  17. Tegou, A.; Armyanov, S.; Valova, E.; Steenhaut, O.; Hubin, A.; Kokkinidis, G.; Sotiropoulus, S. Mixed platinum-gold electrocatalysts for borohydride oxidation prepared by the galvanic replacement of nickel deposits. J. Electroanal. Chem. 2009, 634, 104–110. [Google Scholar] [CrossRef]
  18. Caballero-Manrique, G.; Velázquez-Palenzuela, A.; Centellas, F.; Garrido, J.A.; Arias, C.; Rodríguez, R.M.; Brillas, E.; Cabot, P.L. Electrochemical synthesis and characterization of carbon-supported Pt and Pt-Ru nanoparticles with Cu cores for CO and methanol oxidation in polymer electrolyte fuel cells. Int. J. Hydrogen Energy 2014, 39, 12859–12869. [Google Scholar] [CrossRef]
  19. Mohl, M.; Kumar, A.; Reddy, A.L.M.; Kukovecz, A.; Konya, Z.; Kiricsi, I.; Vajtai, R.; Ajayan, P.M. Synthesis of catalytic porous metallic nanorods by galvanic exchange reaction. J. Phys. Chem. C 2010, 114, 389–393. [Google Scholar] [CrossRef]
  20. Mohl, M.; Dobo, D.; Kukovecz, A.; Konya, Z.; Kordas, K.; Wei, J.; Vajtai, R.; Ajayan, P.M. Formation of CuPd and CuPt bimetallic nanotubes by galvanic replacement reaction. J. Phys. Chem. C 2011, 115, 9403–9409. [Google Scholar] [CrossRef]
  21. Cheng, B.; Cheng, D.; Zhu, J. Synthesis of PtCu nanowires in nonoaqueous solvent with enhanced activity and stability for oxygen reduction reaction. J. Power Sources 2014, 267, 380–387. [Google Scholar] [CrossRef]
  22. Kokkinidis, G.; Papoutsis, A.; Stoychev, D.; Milchev, A. Electroless deposition of Pt on Ti—Catalytic activity for the hydrogen evolution reaction. J. Electroanal. Chem. 2000, 486, 48–55. [Google Scholar] [CrossRef]
  23. Kokkinidis, G.; Lazarov, V.; Papoutsis, A.; Stoychev, D.; Milchev, A. Electroless deposition of Pt on Ti: Part II. Catalytic activity for oxygen reduction. J. Electroanal. Chem. 2001, 511, 20–30. [Google Scholar] [CrossRef]
  24. Liu, Y.; Huang, Y.; Xie, Y.; Yang, Z.; Huang, H.; Zhou, Q. Preparation of highly dispersed CuPt nanoparticles on ionic-liquid-assisted grapheme sheets for direct methanol fuel cell. Chem. Eng. J. 2012, 197, 80–87. [Google Scholar] [CrossRef]
  25. Jia, Y.; Jiang, Y.; Zhang, J.; Zhang, L.; Chen, Q.; Xie, Z.; Zheng, L. Unique excavated rhombic dodecahedral PtCu3 alloy nanocrystals constructed with ultrathin nanosheets of high-energy (110) facets. J. Am. Chem. Soc. 2014, 136, 3748–3751. [Google Scholar] [CrossRef] [PubMed]
  26. Geboes, B.; Mintsouli, I.; Wouters, B.; Georgieva, J.; Kakaroglou, A.; Sotiropoulos, S.; Valova, E.; Armyanov, S.; Hubin, A.; Breugelmans, T. Surface and electrochemical characterization of a Pt-Cu/C nano-structured electrocatalysts, prepared by galvanic displacement. Appl. Catal. B: Environ. 2014, 150–151, 249–256. [Google Scholar] [CrossRef]
  27. Ammam, M.; Easton, E.B. PtCu/C and Pt(Cu)/C catalysts: Synthesis, characterization and catalytic activity towards ethanol electrooxidation. J. Power Sources 2013, 222, 79–87. [Google Scholar] [CrossRef]
  28. Mintsouli, I.; Georgieva, J.; Armyanov, S.; Valova, E.; Avdeev, G.; Hubin, A.; Steenhaut, O.; Dille, J.; Tsiplakides, D.; Balomenou, S.; et al. Pt-Cu electrocatalysts for methanol oxidation prepared by partial galvanic replacement of Cu/carbon powder precursors. Appl. Catal. B: Environ. 2013, 136–137, 160–167. [Google Scholar] [CrossRef]
  29. Qiu, H.J.; Xu, H.T.; Li, X.; Wang, J.Q.; Wang, Y. Core-shell-structured nanoporous PtCu with high C content and enhanced catalytic performance. J. Mater. Chem. A 2015, 3, 7939–7944. [Google Scholar] [CrossRef]
  30. Huang, Y.; Zhao, T.; Zeng, L.; Tan, P.; Xu, J. A facile approach for preparation of highly dispersed platinum-copper/carbon nanocatalyst toward formic acid electro-oxidation. Electrochim. Acta 2016, 190, 956–963. [Google Scholar] [CrossRef]
  31. Solla-Gullón, J.; Vidal-Iglesias, F.J.; Herrero, E.; Feliu, J.M.; Aldaz, A. CO monolayer oxidation on semi-spherical and preferentially oriented (100) and (111) platinum nanoparticles. Electrochem. Commun. 2006, 8, 189–194. [Google Scholar] [CrossRef]
  32. Velázquez-Palenzuela, A.; Brillas, E.; Arias, C.; Centellas, F.; Garrido, J.A.; Rodríguez, R.M.; Cabot, P.L. Structural characterization of Ru-modified carbon-supported Pt nanoparticles using spontaneous deposition with CO oxidation activity. J. Phys. Chem. C 2012, 116, 18469–18478. [Google Scholar]
  33. MacDonald, J.P.; Gualtieri, B.; Runga, N.; Teliz, E.; Zinola, C.F. Modification of platinum surfaces by spontanoeous deposition: methanol oxidation electrocatalysis. Int. J. Hydrogen Energy 2008, 33, 7048–7061. [Google Scholar] [CrossRef]
  34. Gasteiger, H.A.; Markovic, N.; Ross, P.N., Jr.; Cairns, E.J. Temperature-dependent methanol electro-oxidation on well-characterized Pt-Ru alloys. J. Electrochem. Soc. 1994, 141, 1795–1803. [Google Scholar] [CrossRef]
  35. Sugimoto, W.; Yokoshima, K.; Murakami, Y.; Takasu, Y. Charge storage mechanism of nanostructured anhydrous and hydrous ruthenium-based oxides. Electrochim. Acta 2006, 52, 1742–1748. [Google Scholar] [CrossRef]
  36. Velázquez-Palenzuela, A.; Brillas, E.; Arias, C.; Centellas, F.; Garrido, J.A.; Rodríguez, R.M.; Cabot, P.L. Carbon monoxide, methanol and ethanol electro-oxidation on Ru decorated carbon-supported Pt nanoparticles prepared by spontaneous deposition. J. Power Sources 2013, 225, 163–171. [Google Scholar] [CrossRef]
  37. Schmidt, T.J.; Gasteiger, H.A.; Stäb, G.D.; Urban, P.M.; Kolb, D.M.; Behm, R.J. Characterization of high-surface-area electrocatalysts using a rotating disk electrode configuration. J. Electrochem. Soc. 1998, 145, 2354–2358. [Google Scholar] [CrossRef]
  38. Gómez de la Fuente, J.L.; Martínez-Huerta, M.V.; Rojas, S.; Hernández-Fernández, P.; Terreros, P.; Fierrro, J.L.G.; Peña, M.A. Tailoring and structure of PtRu nanoparticles supported on functionalized carbon for DMFC applications: New evidence of the hydrous ruthenium oxide phase. Appl. Catal. B Environ. 2009, 88, 505–514. [Google Scholar] [CrossRef]
  39. Chrzanowski, W.; Wieckowski, A. Ultrathin films of ruthenium on low index platinum single crystal surfaces: An electrochemical study. Langmuir 1997, 13, 5974–5978. [Google Scholar] [CrossRef]
  40. WWW-MINCRYST. Crystallographic and Crystallochemical Database for Minerals and their Structural Analogues. Institute of Experimental Mineralogy. Russian Academy of Sciences. Available online: http://database.iem.ac.ru/mincryst/index.php (accessed on 7 January 2016).
  41. Rolison, D.R.; Hagans, P.L.; Swider, K.E.; Long, J.W. Role of hydrous ruthenium oxide in Pt-Ru direct methanol fuel cell anode electrocatalysts. The importance of mixed electron/proton conductivity. Langmuir 1999, 15, 774–779. [Google Scholar] [CrossRef]
  42. Cabot Corporation. Specialty Chemicals and Performance Materials. Available online: http://www.cabotcorp.com (accessed on 10 October 2015).
  43. Maillard, F.; Savinova, E.; Stimming, U. CO monolayer oxidation on Pt nanoparticles: Further insights into the particle size effects. J. Electroanal. Chem. 2007, 599, 221–232. [Google Scholar] [CrossRef]
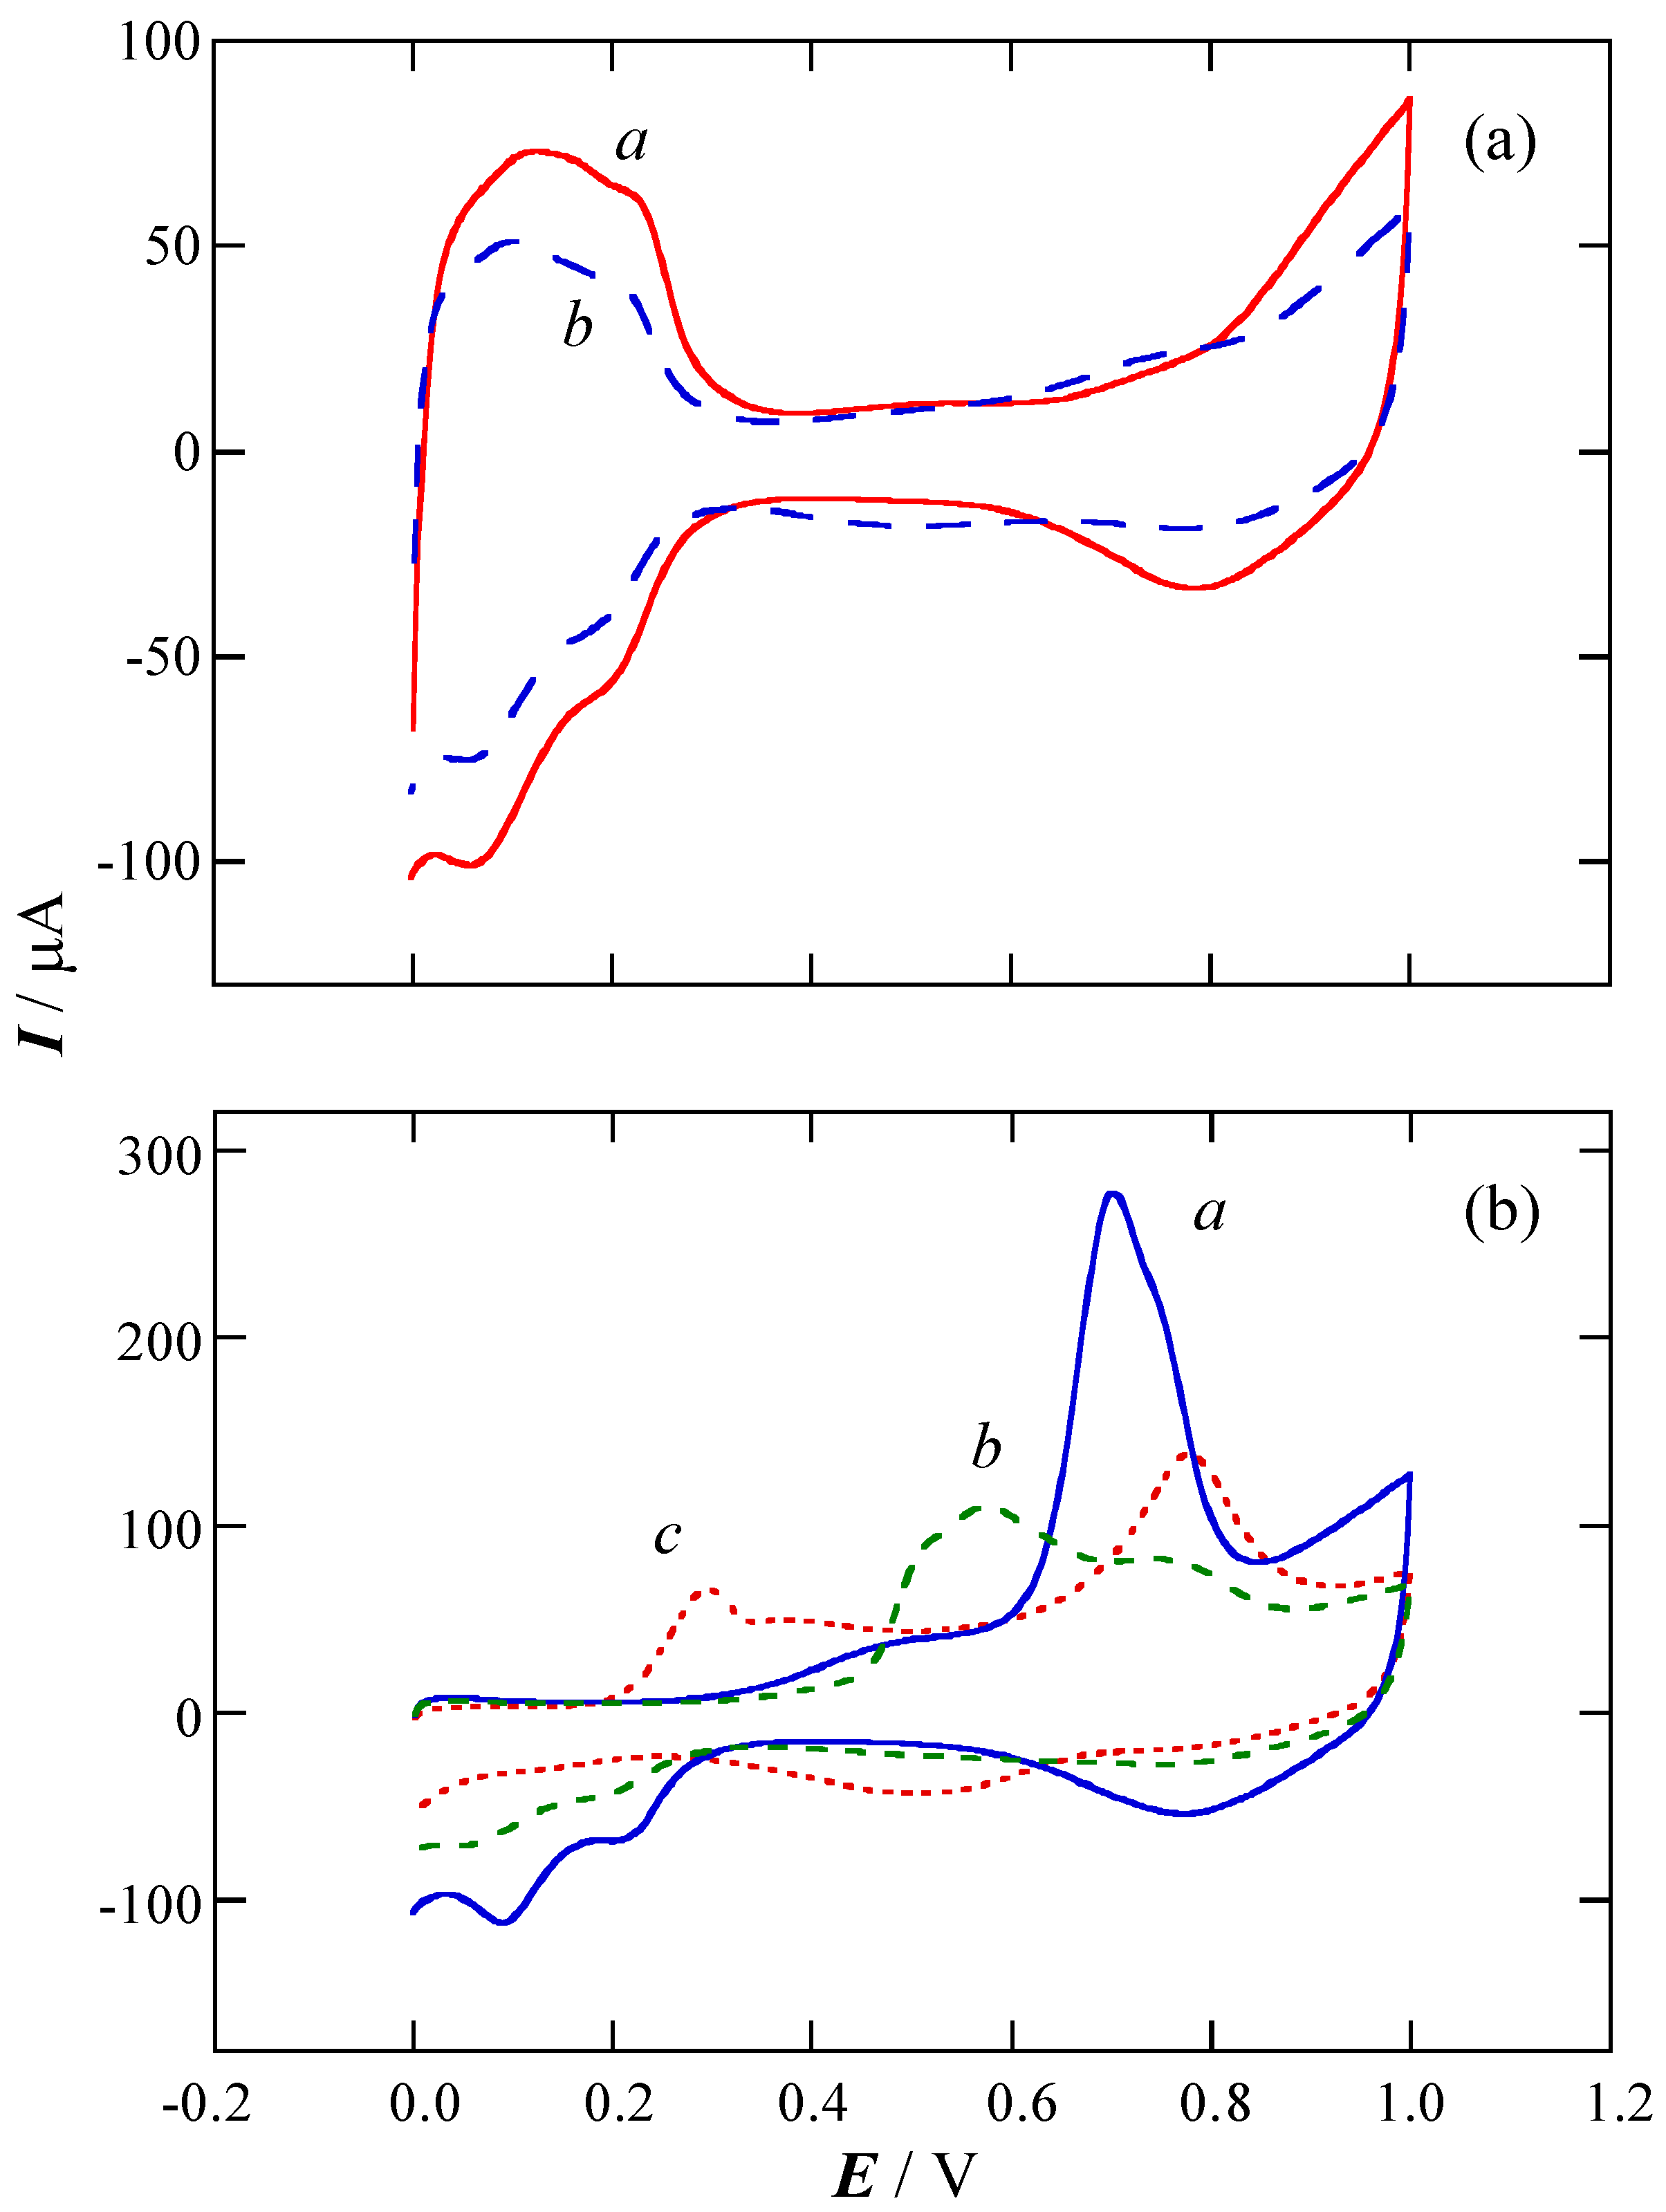
Figure 1. (a) Cyclic voltammograms of Pt(Cu)/C (curve a) and Pt-Ru(Cu)/C (curve b) in deaerated 0.5 M H2SO4 after a Cu electrodeposition charge (qCu) of 30 mC following the sequence i; (b) CO stripping experiments on Pt(Cu)/C for qCu of 45 (curve a) and 20 mC (curve c) and on Pt-Ru(Cu)/C for qCu = 45 mC (curve b). Sweep rate 20 mV s−1.
Catalysts 06 00125 g001
Figure 2. (a) Peak potentials for CO oxidation on Pt(Cu)/C (curve a) and on Pt-Ru(Cu)/C (curve b), and onset potentials for CO (curve c) and methanol oxidation (curve d) on Pt-Ru(Cu)/C, as a function of the electrodeposition charge qCu; (b) Dependence of the electrochemical surface area (ECSA) for CO oxidation on qCu for Pt(Cu)/C (curve a) and for Pt-Ru(Cu)/C (curve b). The electrocatalysts were prepared according to sequence i.
Catalysts 06 00125 g002
Figure 3. TEM analysis of the nanoparticles supported on Vulcan carbon XC72R prepared from a Cu electrodeposition charge of 45 mC and following the sequence i. (a) Cu/C; (b) Pt(Cu)/C; (c) Pt-Ru(Cu)/C. The insets show the size distribution of the nanoparticles.
Catalysts 06 00125 g003aCatalysts 06 00125 g003b
Figure 4. High Resolution Transmission Electron Microscopy (HRTEM) images of the: (a) Cu/C; (b) Pt(Cu)/C; (c) Pt-Ru(Cu)/C electrocatalysts of Figure 3. The insets depict the Fast Fourier Transform (FFT) analyses of the marked zones.
Catalysts 06 00125 g004aCatalysts 06 00125 g004b
Figure 5. CO stripping curves for the different electrocatalysts recorded after different times of Pt exchange following the synthesis sequence ii: 20 (curves a and d), 30 (curves b and e) and 60 min (curves c and f). Curves a, b and c correspond to Pt(Cu)/C and curves d, e and f, to Pt-Ru(Cu)/C. Sweep rate 20 mV s−1.
Catalysts 06 00125 g005
Figure 6. CO stripping peak potentials as a function of the immersion time in the Pt(IV) solution following the sequence ii (spontaneous deposition of the Ru species for 30 min, curves a and c) and in the Ru(III) solution following the sequence iii (galvanic exchange with Pt(IV) species for 30 min, curves b and d). Curves a and b refer to Pt-Ru(Cu)/C and curves c and d, to Pt(Cu)/C. In all cases, qCu was of 38 mC.
Catalysts 06 00125 g006
Figure 7. CO stripping curves for the different Pt-Ru(Cu)/C electrocatalysts obtained after different times of spontaneous deposition of Ru species following the synthesis sequence iii: 10 (curve a), 20 (b), 30 (c) and 50 (d) min. Sweep rate 20 mV s−1.
Catalysts 06 00125 g007
Figure 8. (a) Electrochemical surface areas for CO oxidation per mol of electrodeposited Cu on the Pt-Ru(Cu)/C (curve a) and the Pt(Cu)/C (curve b) electrocatalysts; (b) onset potentials for CO (curve a) and methanol oxidation (curve b) on the Pt-Ru(Cu)/C electrocatalyst in front of the spontaneous deposition time of Ru species from the quiescent solution.
Catalysts 06 00125 g008
Figure 9. Linear sweep voltammograms corresponding to the methanol oxidation in 1.0 M CH3OH + 0.5 M H2SO4 on different Pt-Ru(Cu)/C electrocatalysts synthesized from spontaneous deposition times of 22 (curve a), 30 (curve b), 10 (curve c) and 40 min (curve d), following the sequence iii. Sweep rate 20 mV s−1.
Catalysts 06 00125 g009