Article

Adsorption and Oxidation Investigations over Pt/Al2O3 Catalyst: A Microcalorimetric Study

1
Chemical Reaction Engineering and Competence Centre for Catalysis, Chalmers University of Technology, Göteborg SE-412 96, Sweden
2
Department of Petroleum Processing Engineering and Environmental Protection, Petroleum-Gas University of Ploiesti, 39 Bucuresti Blvd., Ploiesti 100680, Romania
*
Author to whom correspondence should be addressed.
Catalysts 2016, 6(5), 73; https://doi.org/10.3390/catal6050073
Submission received: 11 February 2016 / Revised: 27 April 2016 / Accepted: 5 May 2016 / Published: 17 May 2016
(This article belongs to the Special Issue Automotive Emission Control Catalysts)

Abstract

:
The differential adsorption heats of oxygen and NO, as well as catalytic oxidation behavior during NO oxidation and NO2 dissociation reactions over supported Pt-catalysts, were investigated by microcalorimetric measurements. The average heat of adsorption (∆H) of oxygen ranged from 310 kJ/mol at 200 °C to 289 kJ/mol at 400 °C. Over this temperature range formation of platinum oxides and coverage dependence caused variations in the apparent heat of adsorption. NO heat of adsorption from 50 to 150 °C was near constant with an average value of 202 kJ/mol over the temperature range.

Graphical Abstract

1. Introduction

There are stringent requirements on vehicle emissions and their environmental impact is an important issue. Vehicle NOx emission after-treatment technologies (NOx storage-reduction, selective catalytic reduction) play a significant role on the reduction of vehicle emissions [1,2]. Furthermore, diesel oxidation catalysts (DOC) are important for meeting the emission standards of CO and hydrocarbons and, additionally, the DOC converts nitric oxide to nitrogen dioxide, which is important for the downstream catalytic processes. Extensive research has been undertaken on the noble metals (e.g., Pt) supported on high surface area materials (e.g., γ-Al2O3) to improve their activity during various oxidation reactions (e.g., CO, NO) [3,4,5,6], which are important for the DOC functionality. Platinum was found to be very active, but when it is exposed to oxygen at high temperatures for long periods of time it can sinter, involving migration of oxide species [7]. The formation of platinum oxide is also induced by NO2 and its ability to develop a high oxygen surface coverage on the Pt (111) surface due to its coordinative flexibility [8]. Based on the reduction temperatures from TPR (temperature programmed reduction) experiments, four different platinum oxide species (surface platinum oxide, PtO, PtO2, and PtAl2O4) have been reported by Yeh’s group [9,10,11] and their formation depends on the oxidation temperatures. By using a simultaneous TG-DSC technique, Wang and Yeh [10] observed that oxygen adsorbs at ambient or lower temperature, while above 27 °C the platinum surface is reconstructed for extensive accommodation of oxygen. In addition, a stable surface layer of platinum oxides is formed at about 477 °C. Advanced studies on the adsorption of NO on stepped Pt surfaces using density functional theory (DFT), reflection absorption infrared spectroscopy (RAIRS), fast X-ray photoelectron spectroscopy (XPS), and other techniques were reported [12,13,14], concluding that above −23 °C, NO adsorbs both molecularly and dissociatively, while NO adsorption was found to be only dissociative at about 100 °C [13].
Heat-flow microcalorimetry gives the opportunity of directly exploring the strength of surface chemical bonds, the coverage of adsorbates involving the interaction between adsorbates and solid catalytic surfaces, and the heats of adsorption [15,16]. The studies of heats of adsorption for NO and oxygen on a Pt (110) surface using microcalorimetric measurements has been described by Wartnaby et al. [17], concluding that the adsorption heat shows a strong coverage dependence, with an initial heat of adsorption of 335 kJ/mol for O2 Pt(110) at 27 °C. Furthermore, Brown et al. [18] found an initial heat of adsorption of oxygen for Pt(110) of 316 ± 34 kJ/mol, which is in good agreement with the study by Wartnaby et al. [17]. Moreover, Fiorin et al. [19] reported heats of adsorption of NO on Pt (111) and Pt (211) of 182 kJ/mol and 192 kJ/mol, respectively, whereas Wartnaby et al. [17] reported a slightly lower heat of adsorption of NO on Pt (110) of 160 kJ/mol.
Pt supported on alumina plays a significant role as a DOC catalyst in exhaust after treatment systems. The formation of Pt oxides and so called “structure sensitivity” of Pt also influences its performance. A comprehensive evaluation of adsorption heats of NO and oxygen on Pt supported on alumina should contribute to a deeper understanding for its application in the automotive sector and can be used as a base for kinetic modelling. There are some studies in the literature that describe the heat of adsorption of O2 and NO on single-crystal platinum surfaces. However, there are, to our knowledge, no studies available where heat of adsorption of NO and O2 is measured on supported platinum particles on alumina at atmospheric pressure, which is the objective of the present study. This is done by performing temperature-programmed desorption experiments (O2 TPD, NO TPD), at different temperatures. Furthermore, the activity of the catalyst for NO oxidation and NO2 dissociation was examined.

2. Results and Discussion

2.1. Pt Dispersion

The Pt surface dispersion was determined by analyzing the results from a N2O dissociation experiment using 200 ppm N2O at 100 °C for 1 h. The total amount of N2 produced during the N2O dissociation was 1.12 × 10⁻⁵ mol/gcat, which results in a dispersion of 12%, when assuming that the number of formed N2 molecules is equal to the number of surface metal sites, since N2O dissociation results in the formation of an O atom on Pt and N2 in the gas phase. The evolution of N2 and N2O were qualitatively the same as that reported earlier [20].

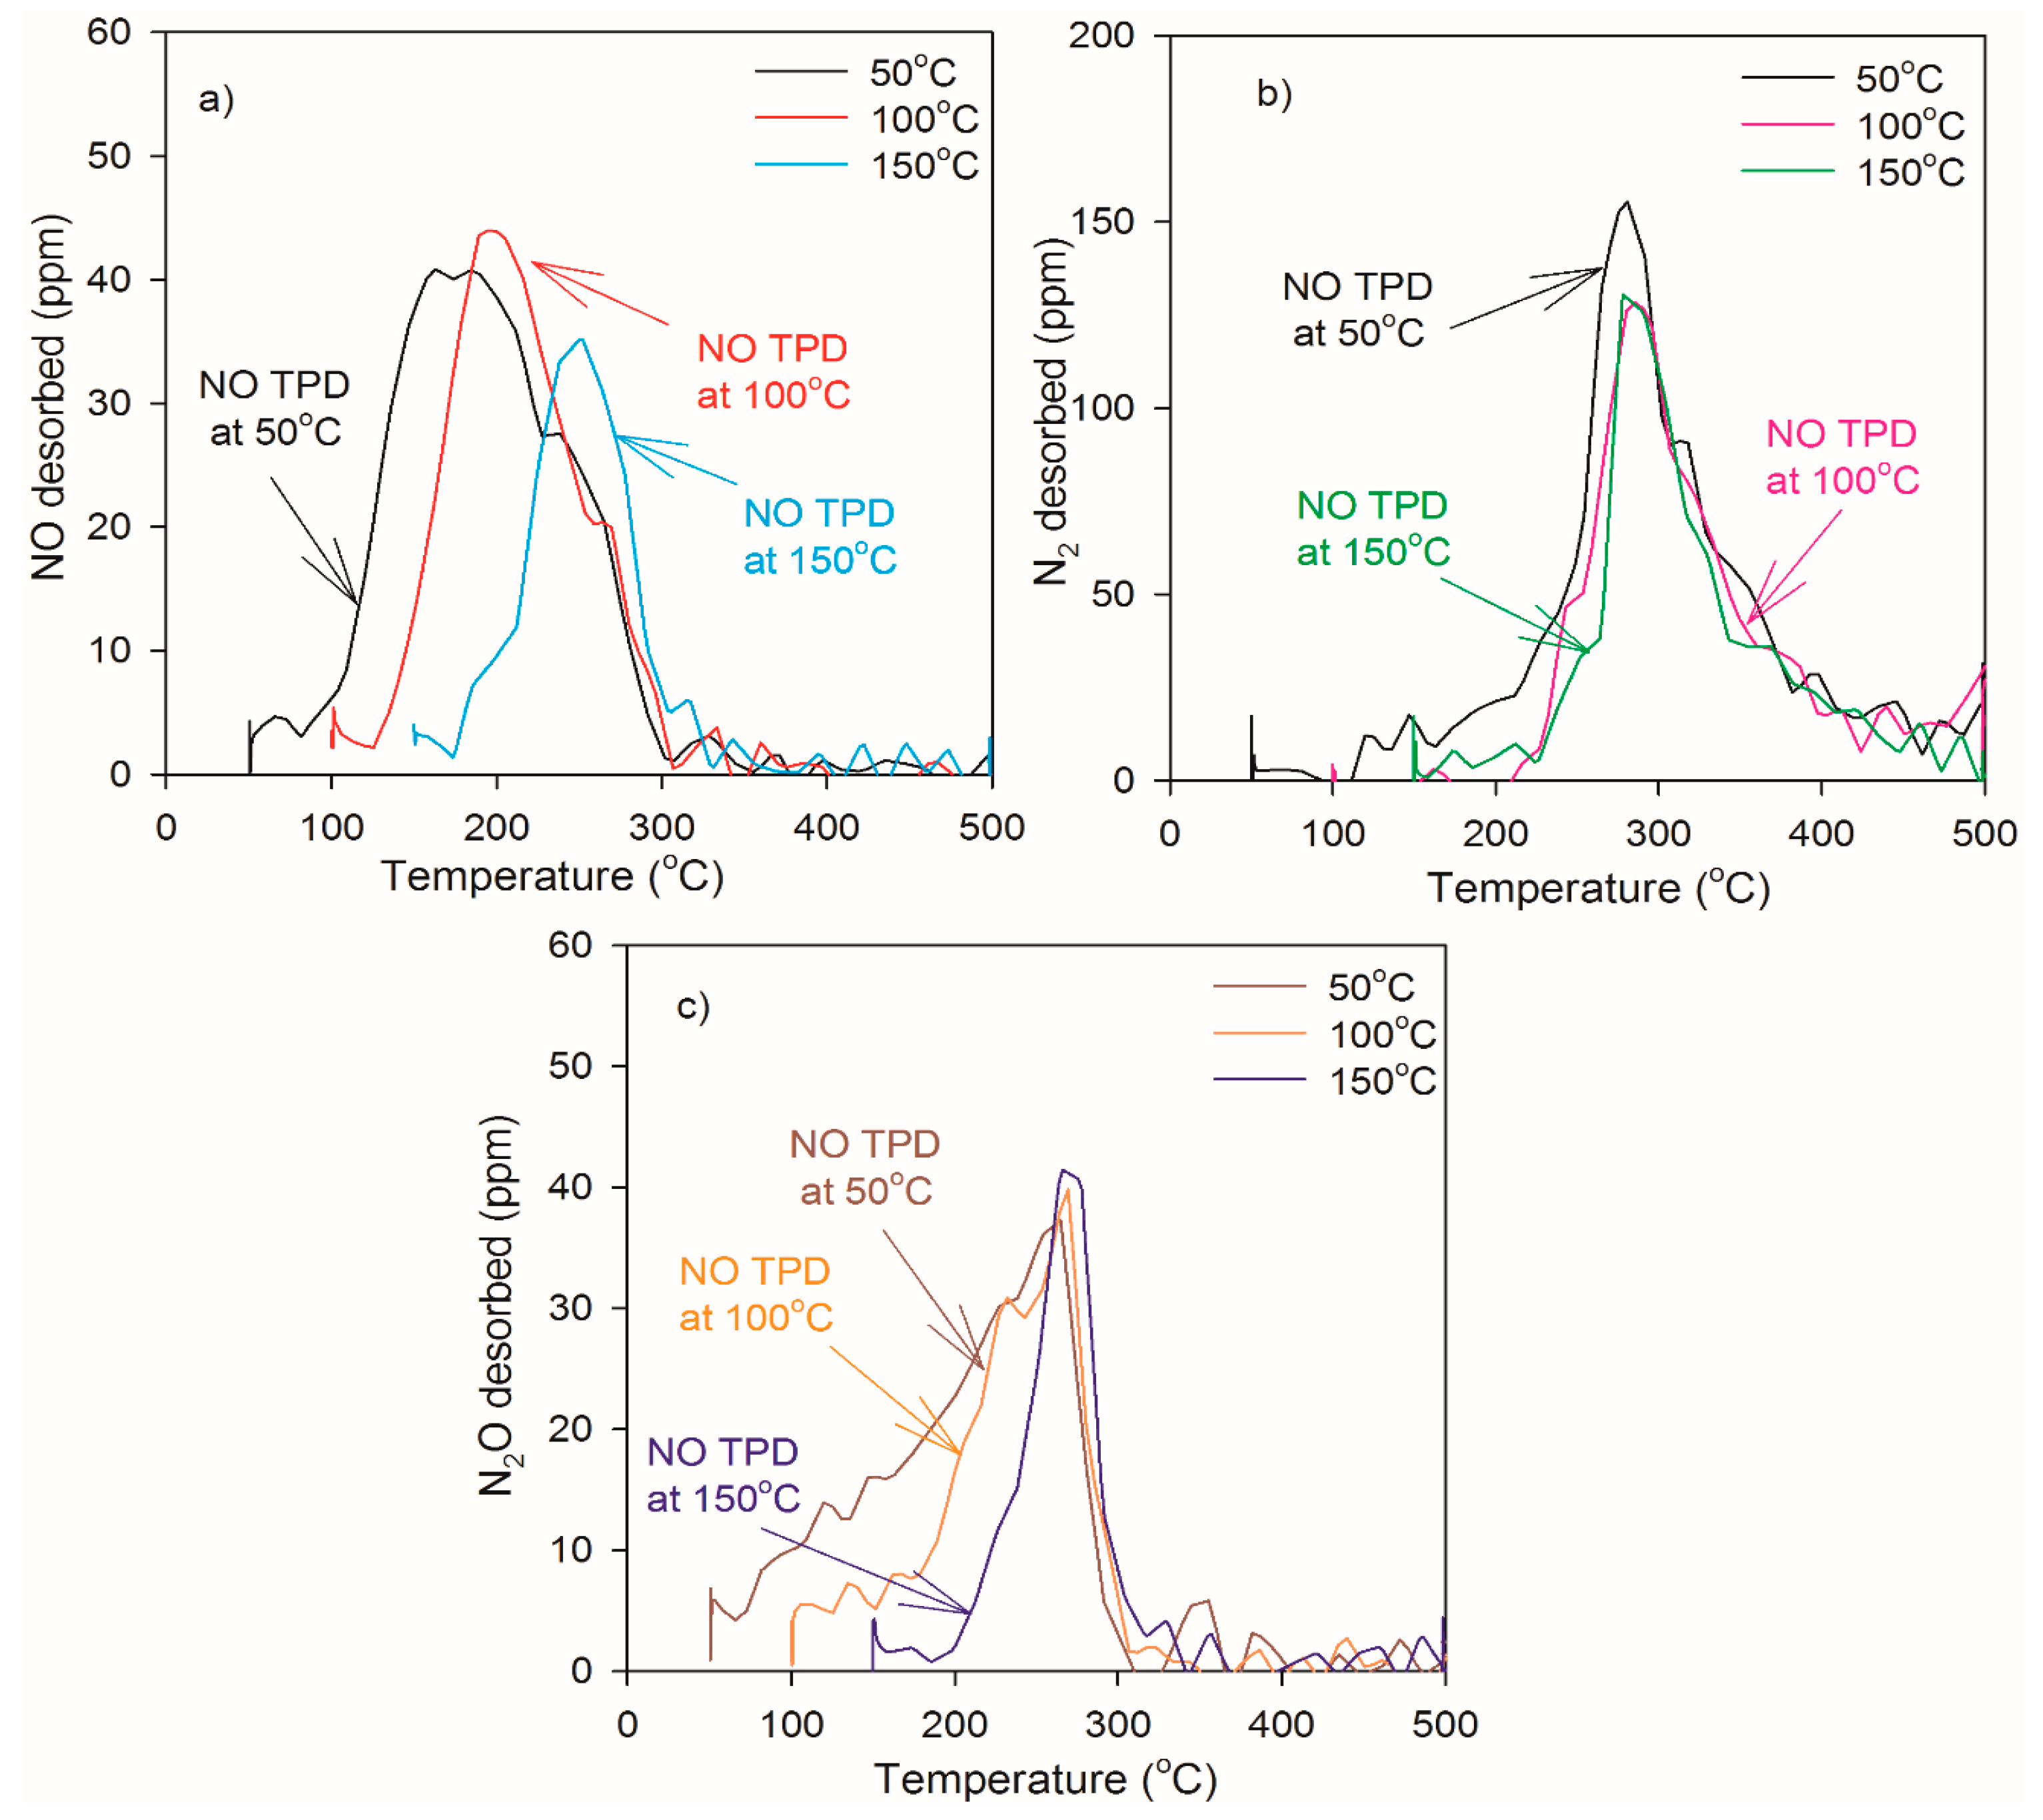
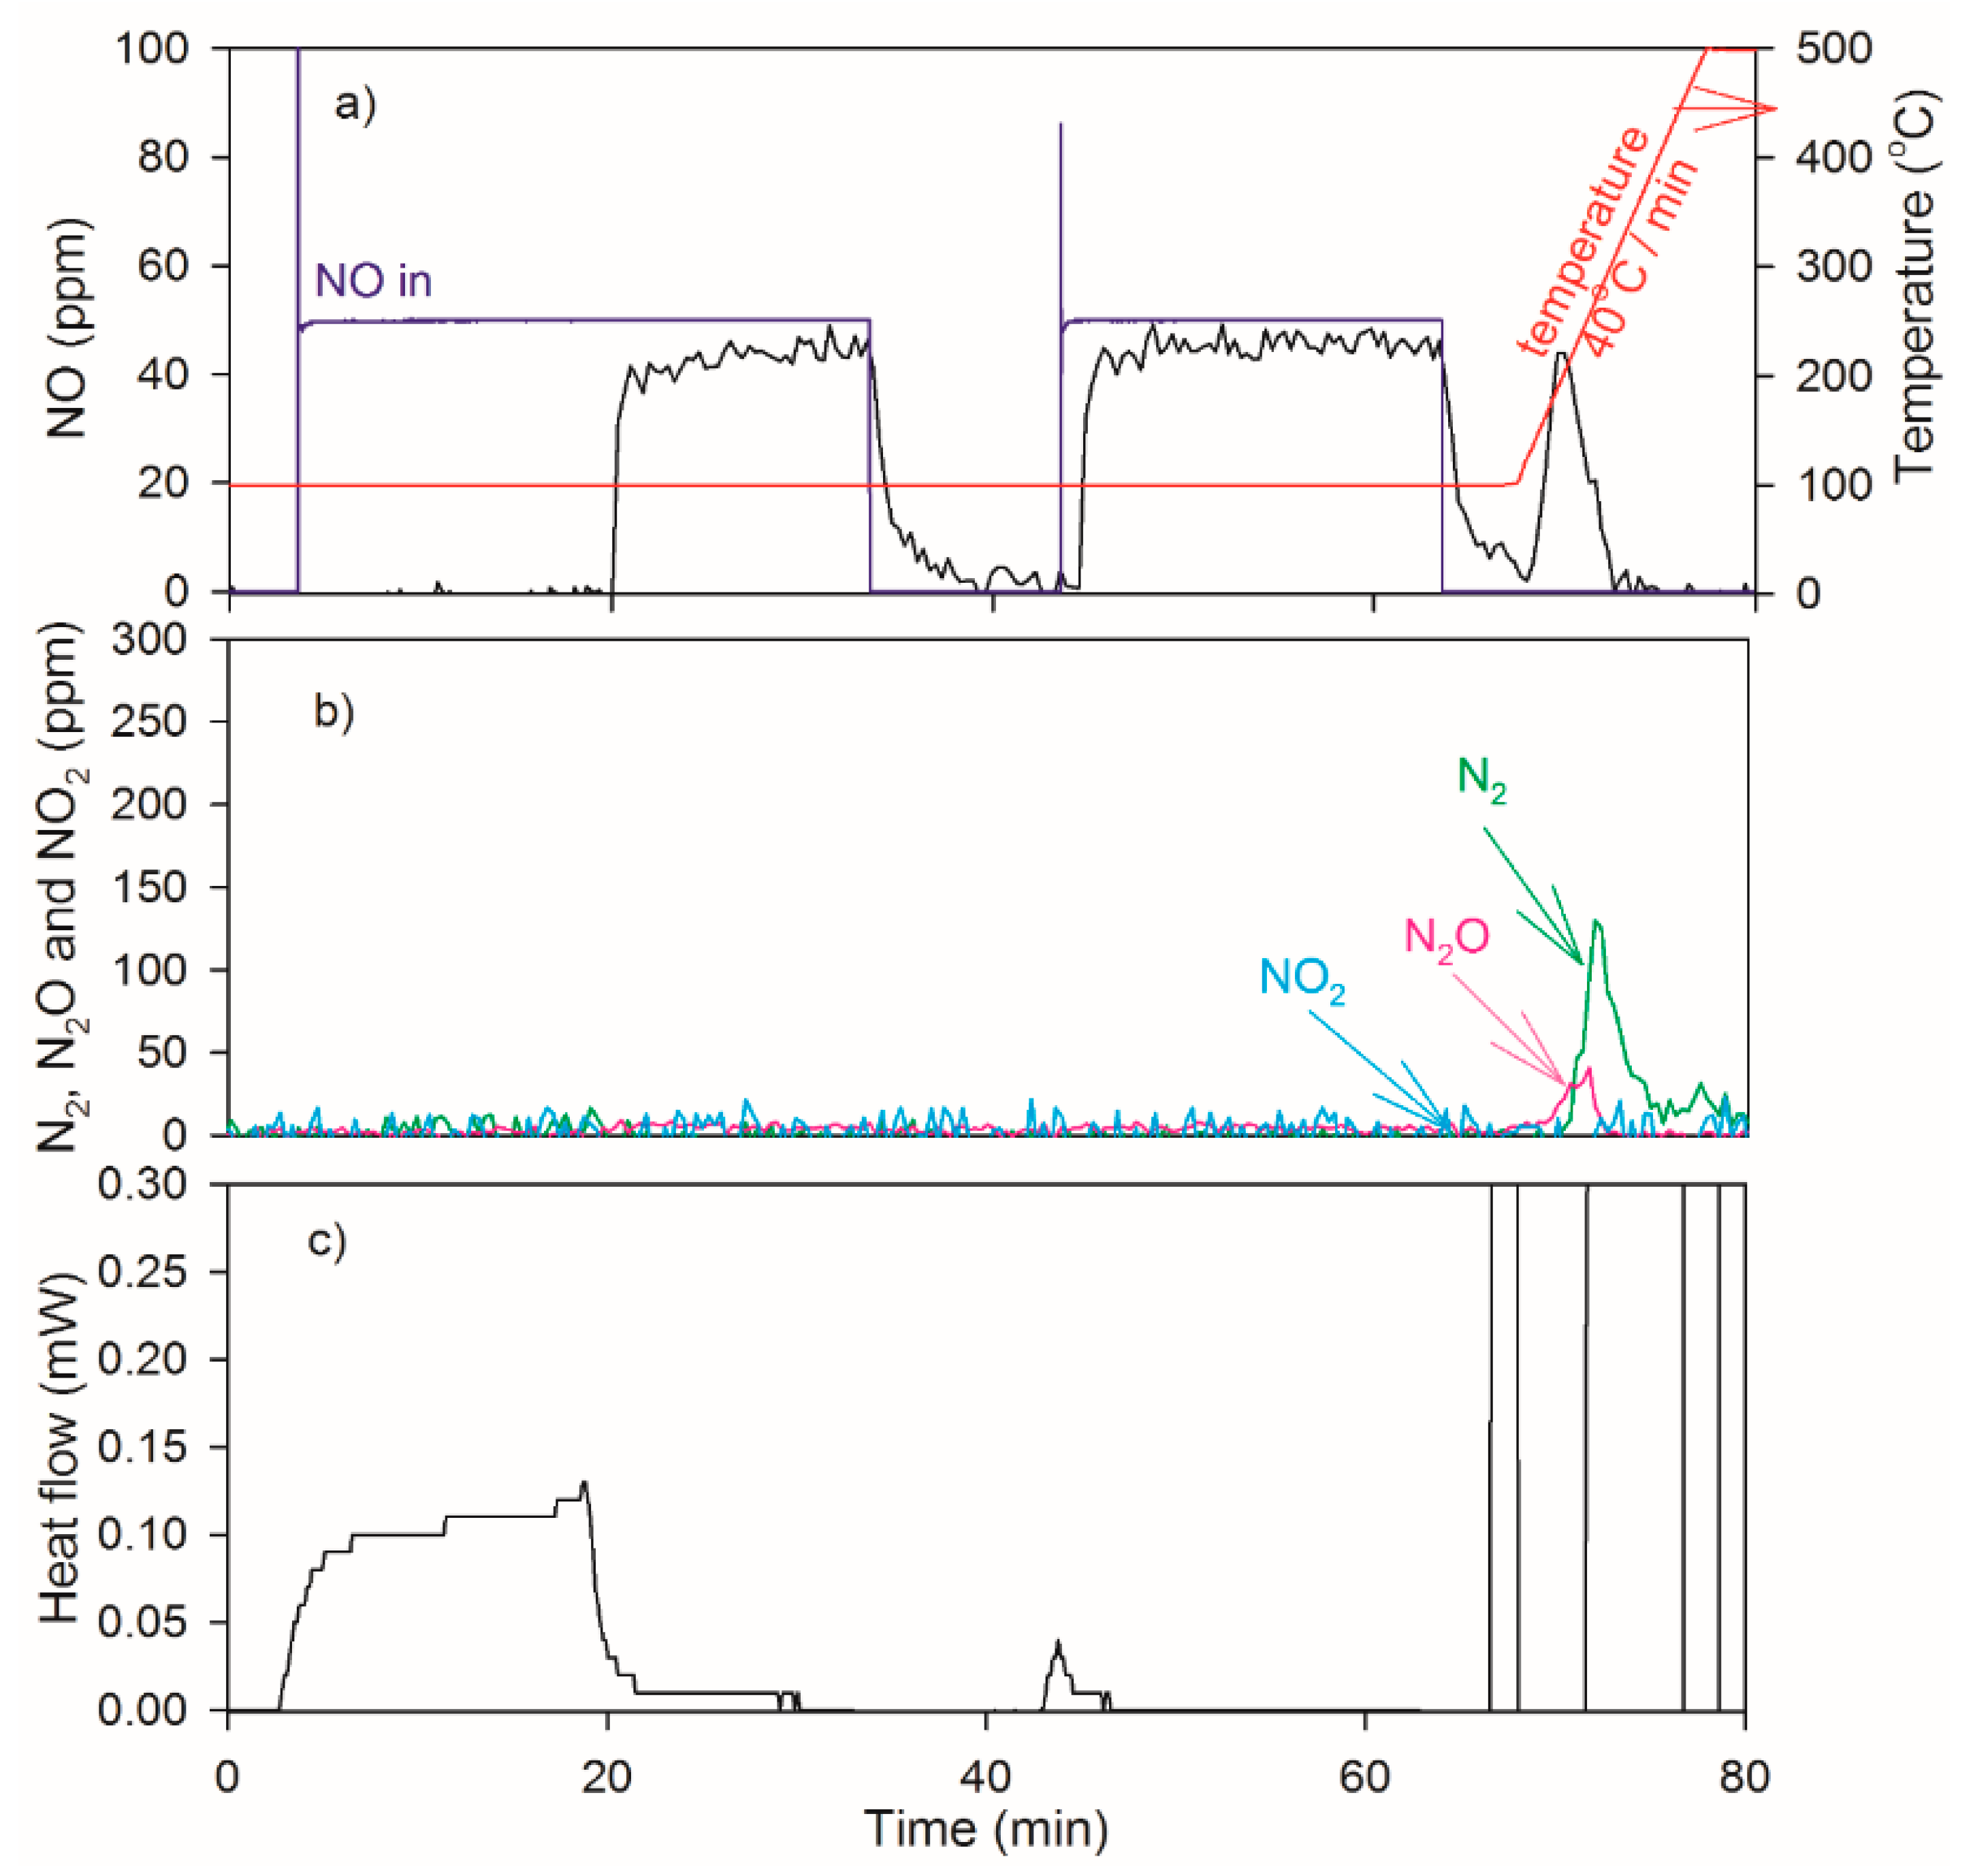
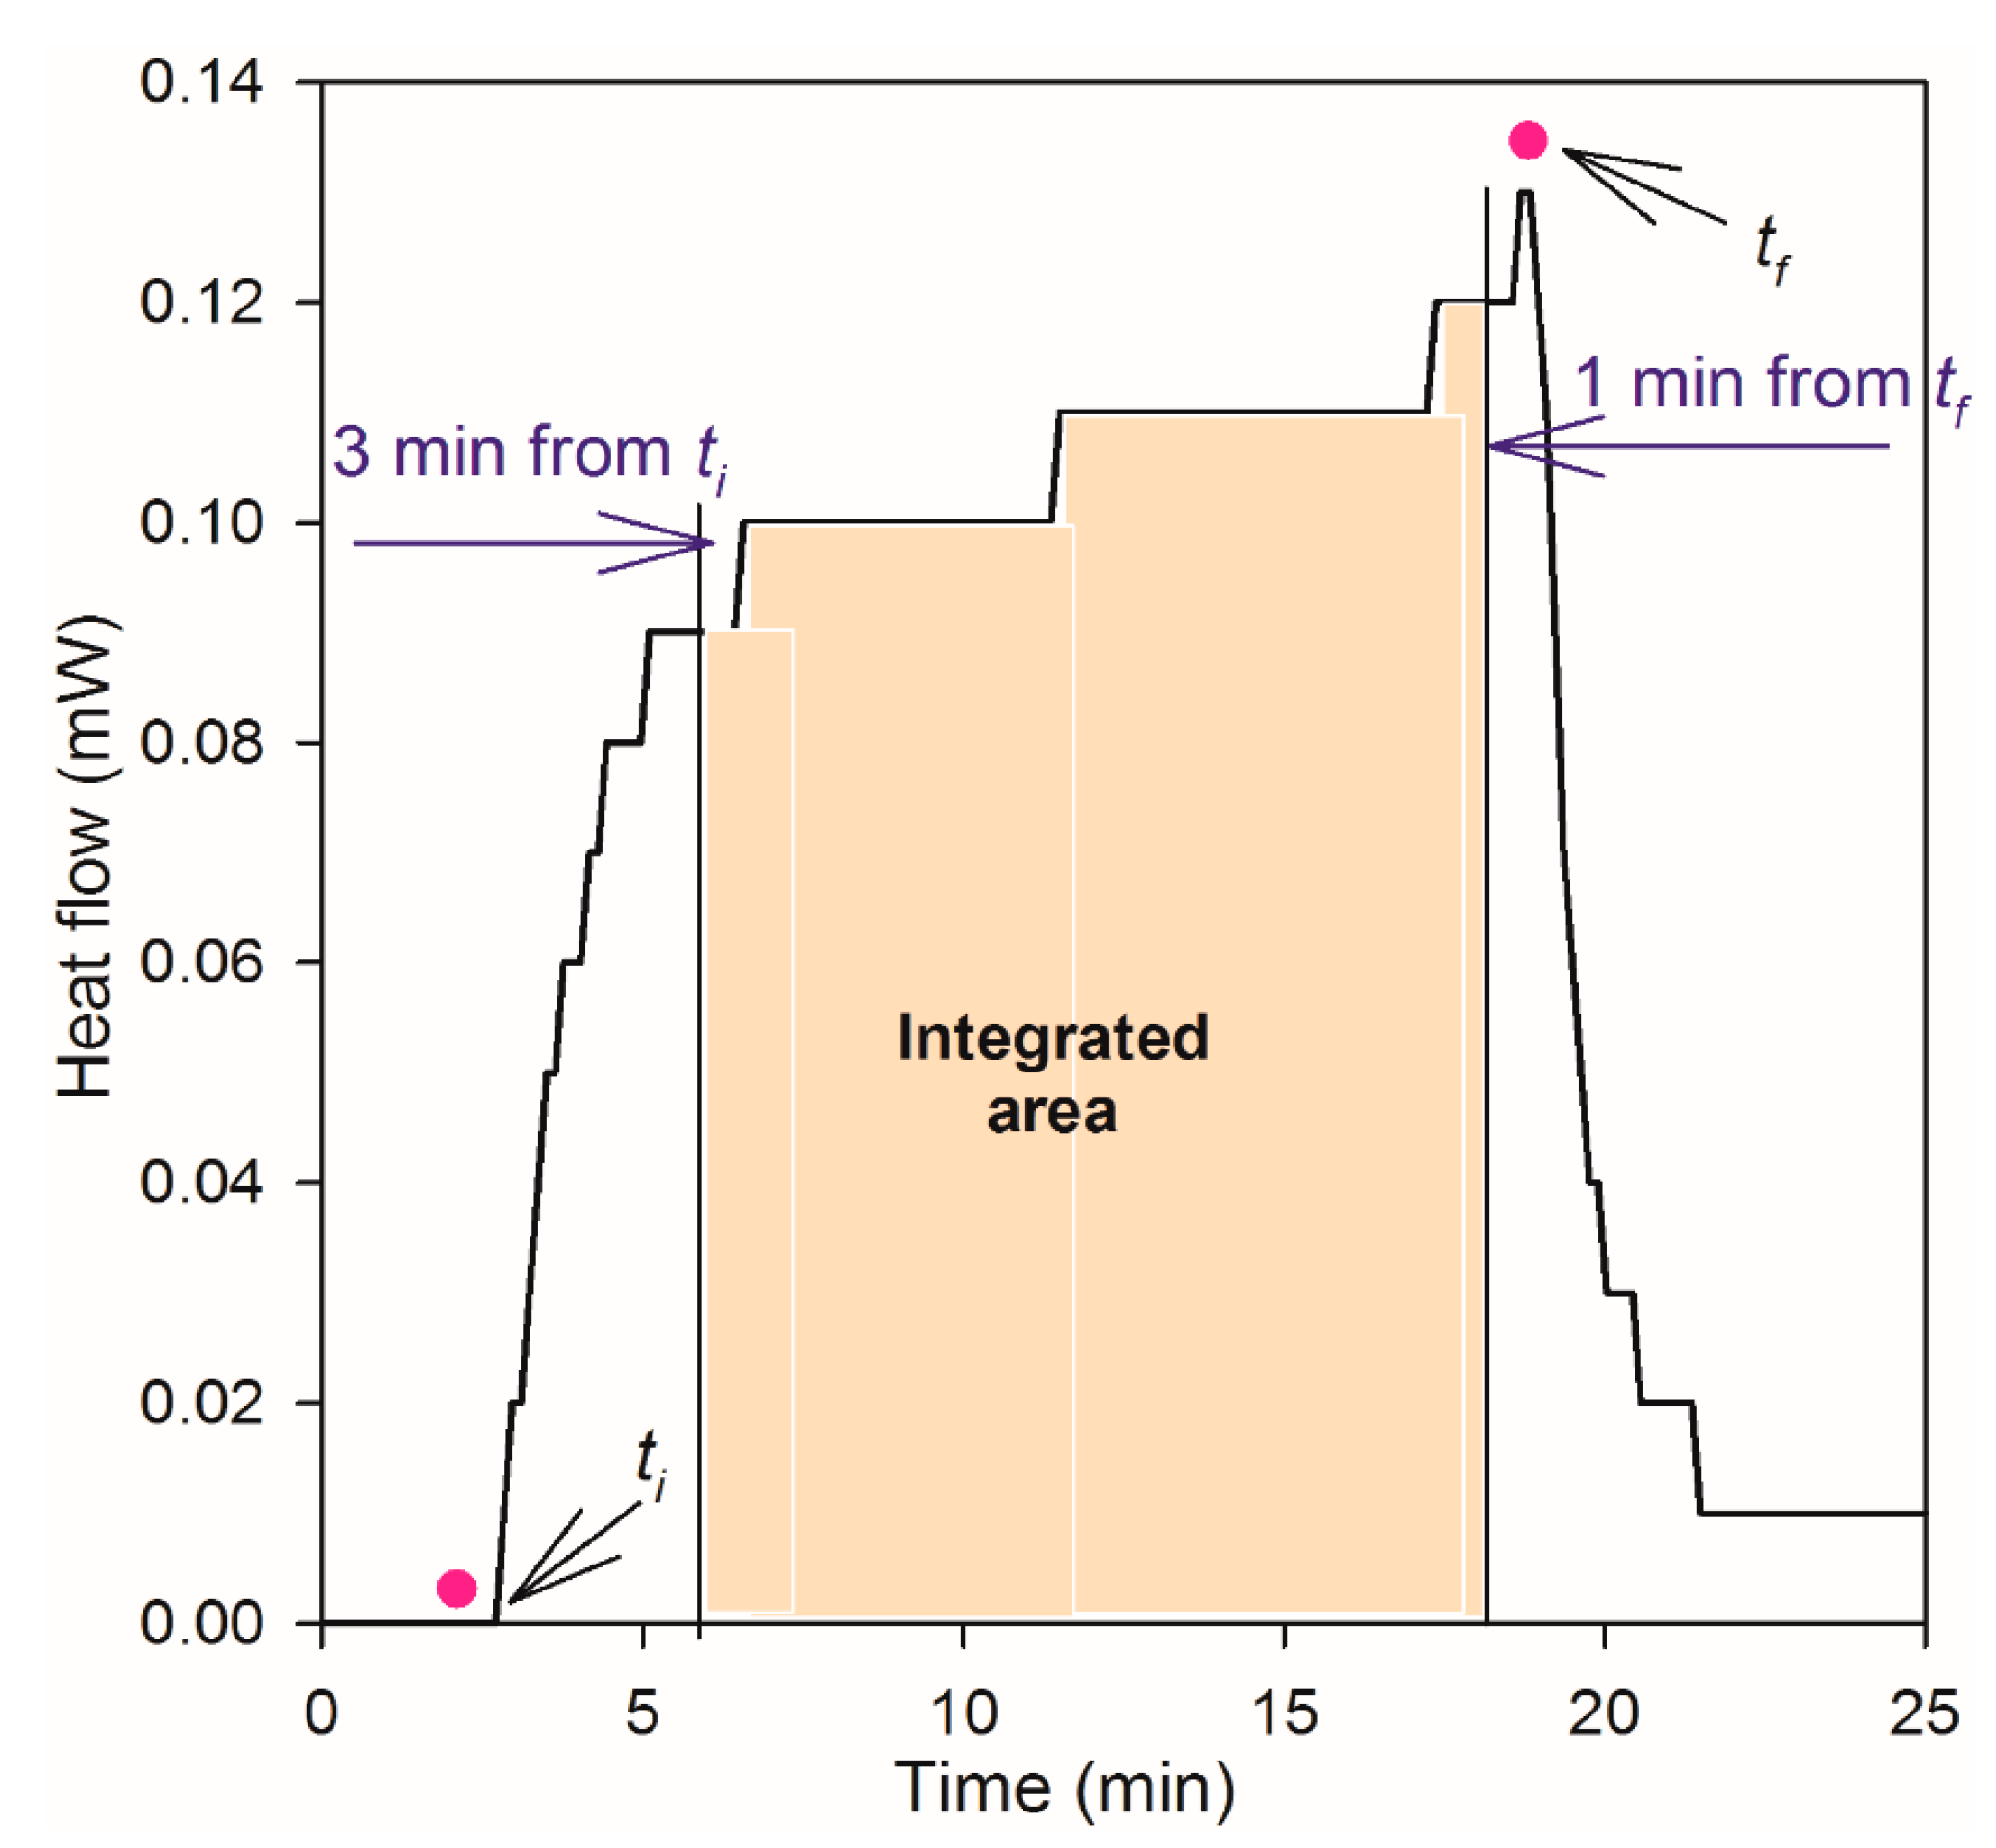
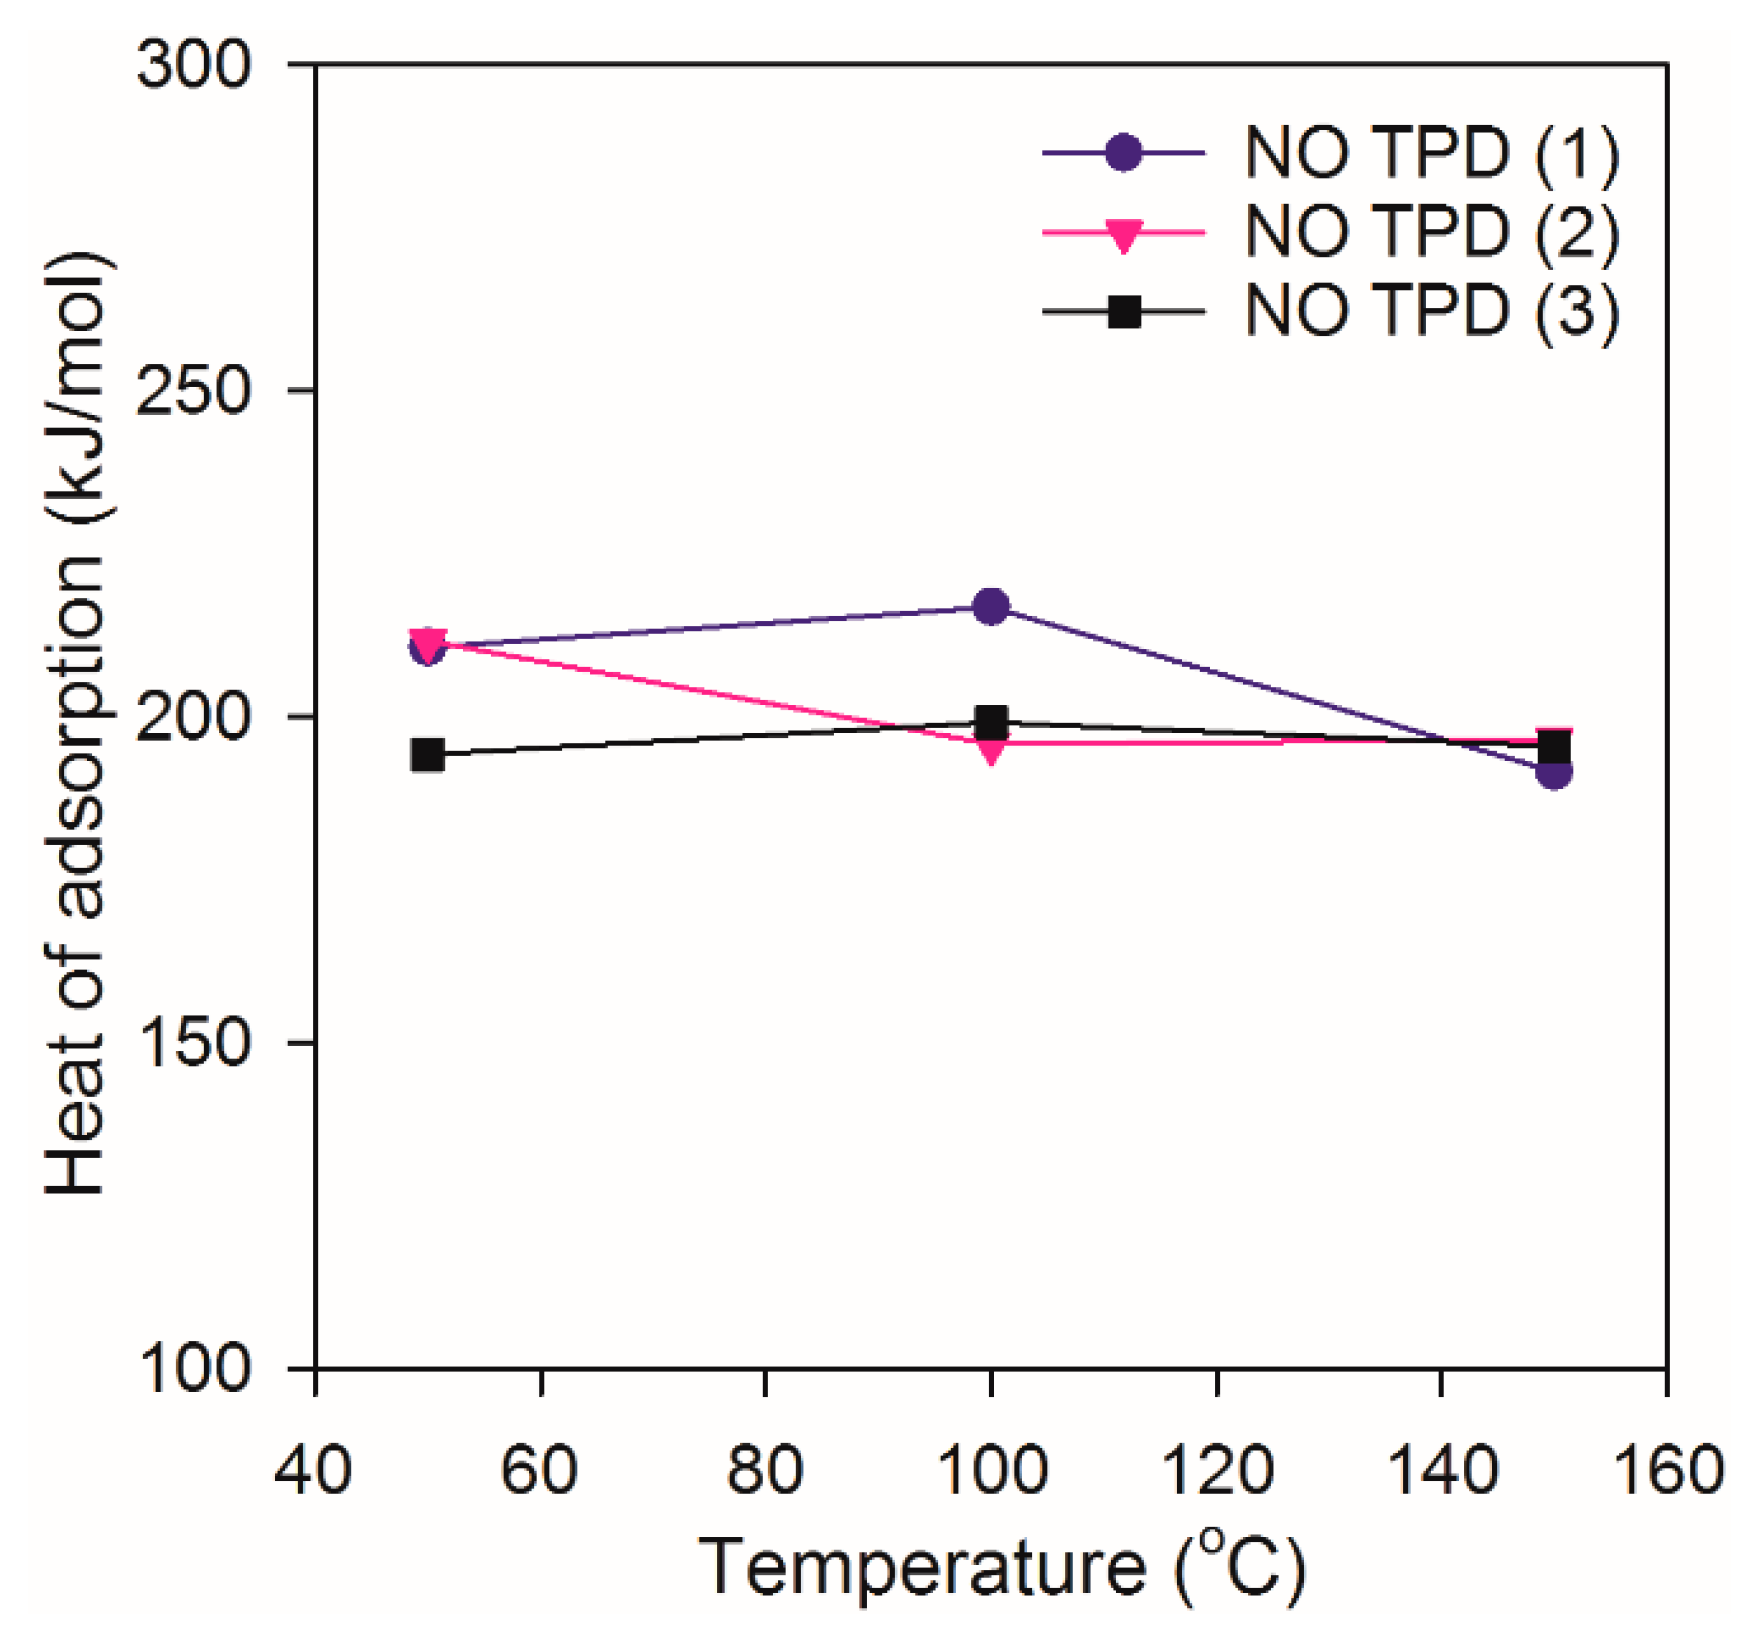
2.2. Heat of Adsorption during NO TPD Experiments

A calorimeter combined with an MS for gas phase analysis was used to measure both the amount of gas adsorbed during gas dosing and the heat developed during adsorption of a given amount of adsorbate. The dynamic profile of measured NO during the NO TPD experiment with 50 ppm NO feed at 100 °C (chosen as an example) is depicted in Figure 1a. Prior to the experiment, the catalyst was pre-treated with 2% H2 at 500 °C for 20 min and, thereafter, cooled in Ar, in order to clean the noble metal surface. The resulting amounts of N2, NO2, and N2O formed during the TPD are also shown in Figure 1b. NO was adsorbed on the Pt surface at a constant temperature (100 °C), 16 min of total uptake was observed and, thereafter, a breakthrough of NO was seen due to saturation of the catalytic surface with NO. A small release of NO from the catalyst was observed when the NO feed was switched off and the catalyst was exposed to Ar only at 100 °C for 10 min, but then an approximately equal amount re-adsorbed when the catalyst was re-exposed to 100 ppm NO. Moreover, rapid desorption of NO was observed during the linear increase of the temperature (heating rate of 40 °C/min up to 500 °C) in Ar. In addition to NO desorption (see Figure 1a), N2O and N2 are produced during the NO TPD (see Figure 1b). Both N2O and N2 are desorbed at higher temperature compared to NO (Figure 1a). These features are also clearly seen when comparing the desorption peaks for NO TPD at 50 °C, 100 °C, and 150 °C (see Figure 2). The desorption peaks have their maximum in the range of 170–252 °C for NO, 263–267 °C for N2O, and 280–285 °C for N2. Thus, first NO is desorbing, which is followed by a small N2O production and, finally, N2 is observed. Relatively high amounts of N2 were desorbed for all three NO TPD experiments (Figure 2b), which is related to the dissociation of the adsorbed NO on the catalyst surface. A nitrogen balance resulted in that 0.83 μmol NO was stored during the first storage phase, which corresponded to a coverage of 68% on Pt. During the desorption phase after the second pulse 0.096 μmol was desorbed. In addition, some loosely bound NO was desorbing after the first pulse, but this is re-adsorbed in the second pulse and was, therefore, not considered in the molar balance. Moreover, 0.32 μmol N2 was formed and 0.076 μmol N2O was formed during the desorption, which results in 0.93 μmol nitrogen atoms and this is similar to the stored amount (0.83 μmol). The small difference is likely due to the accuracy of the MS measurement at these very low concentrations. For the oxygen balance, a small amount of oxygen was produced (0.008 μmol), in addition to the oxygen atoms present in the desorbed NO and N2O. However, this results in a deficiency of 0.65 μmol of oxygen atoms and the reason for that is likely that oxygen is very stable on Pt and a large part of it does not desorb during the ramp up to 500 °C. The oxygen coverage remaining is 53% (considering 12% Pt dispersion).
The heat flow signal from the TPD experiment as a function of time is presented in Figure 1c. Heat flow was immediately observed when the sample was exposed to 50 ppm NO with a maximum exotherm of 0.13 mW. After being exposed to NO, the catalyst was flushed with Ar and a small heat flow was observed corresponding to the amount of NO, which is re-adsorbed during the second NO readsoption. Figure 3 shows the enlarged heat flow measured during the first 30 min of the first NO exposure (see Figure 1). The details used for the calculation of the adsorption heat are schematically shown in Figure 3. The initial time (ti) is taken into account when the catalyst is exposed to 50 ppm NO, while tf represents the highest point of heat flow, just before the catalyst becomes saturated and heat flow decreases. During the first few minutes the heat flow rapidly increased and the data in this region are highly influenced by the transient response behavior of the calorimeter. Therefore, the middle region of the heat signal is used to determine the heat of adsorption. More specifically, we chose 3 min after ti and 1 min before tf for the measurement time interval. During this time interval there was total uptake of the adsorbate and the heat flow, since it varied slightly, was integrated to calculate the heat of adsorption. The heat signal varied only about 0.03 mW during the measurement time interval. This indicates that the gas flows through the catalyst bed in a near plug flow manner, first saturating the front of the bed with adsorbate and, thereafter, the adsorption front moves through the catalyst bed [21].
The heat of adsorption (in kJ/mol) of NO at adsorption temperatures 50 °C, 100 °C, and 150 °C are displayed in Figure 4. Moreover, there are some variations between individual tests, likely due to the very small heat release (in the range of 0.1 mW) and the experiments were, therefore, repeated to increase the accuracy. At 50 °C, 100 °C, and 150 °C, the respective average heats of adsorptions are 206, 204, and 195 kJ/mol, with corresponding standard deviations of 9.8, 11.2, and 2.6 kJ/mol. Thus, the NO heat of adsorption was quite constant in this temperature interval. It should be noted that, for the adsorption temperature of 150 °C, N2 production was observed during NO adsorption period and this means that the heat of adsorption measured is a combination of adsorption heat for NO, dissociation of NO and formation of N2. This could be the reason for that this adsorption heat being slightly lower than the others. For adsorption temperatures of 50 °C and 100 °C the values are very similar (206 and 204 kJ/mol). Our results on supported platinum on alumina are in agreement with heat of adsorption measured over single-crystal platinum surfaces, where Fiorin et al. [19] reported values of 182 kJ/mol on Pt (111) and 192 kJ/mol on Pt (211). However, the values found by Wartnaby et al. [17] for NO on Pt (110) is slightly lower (160 kJ/mol).

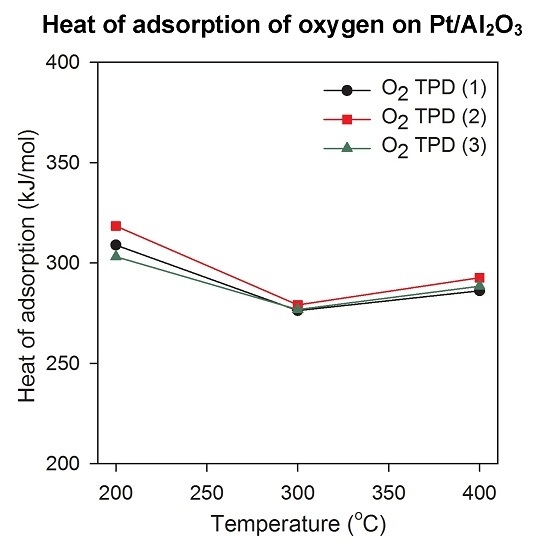
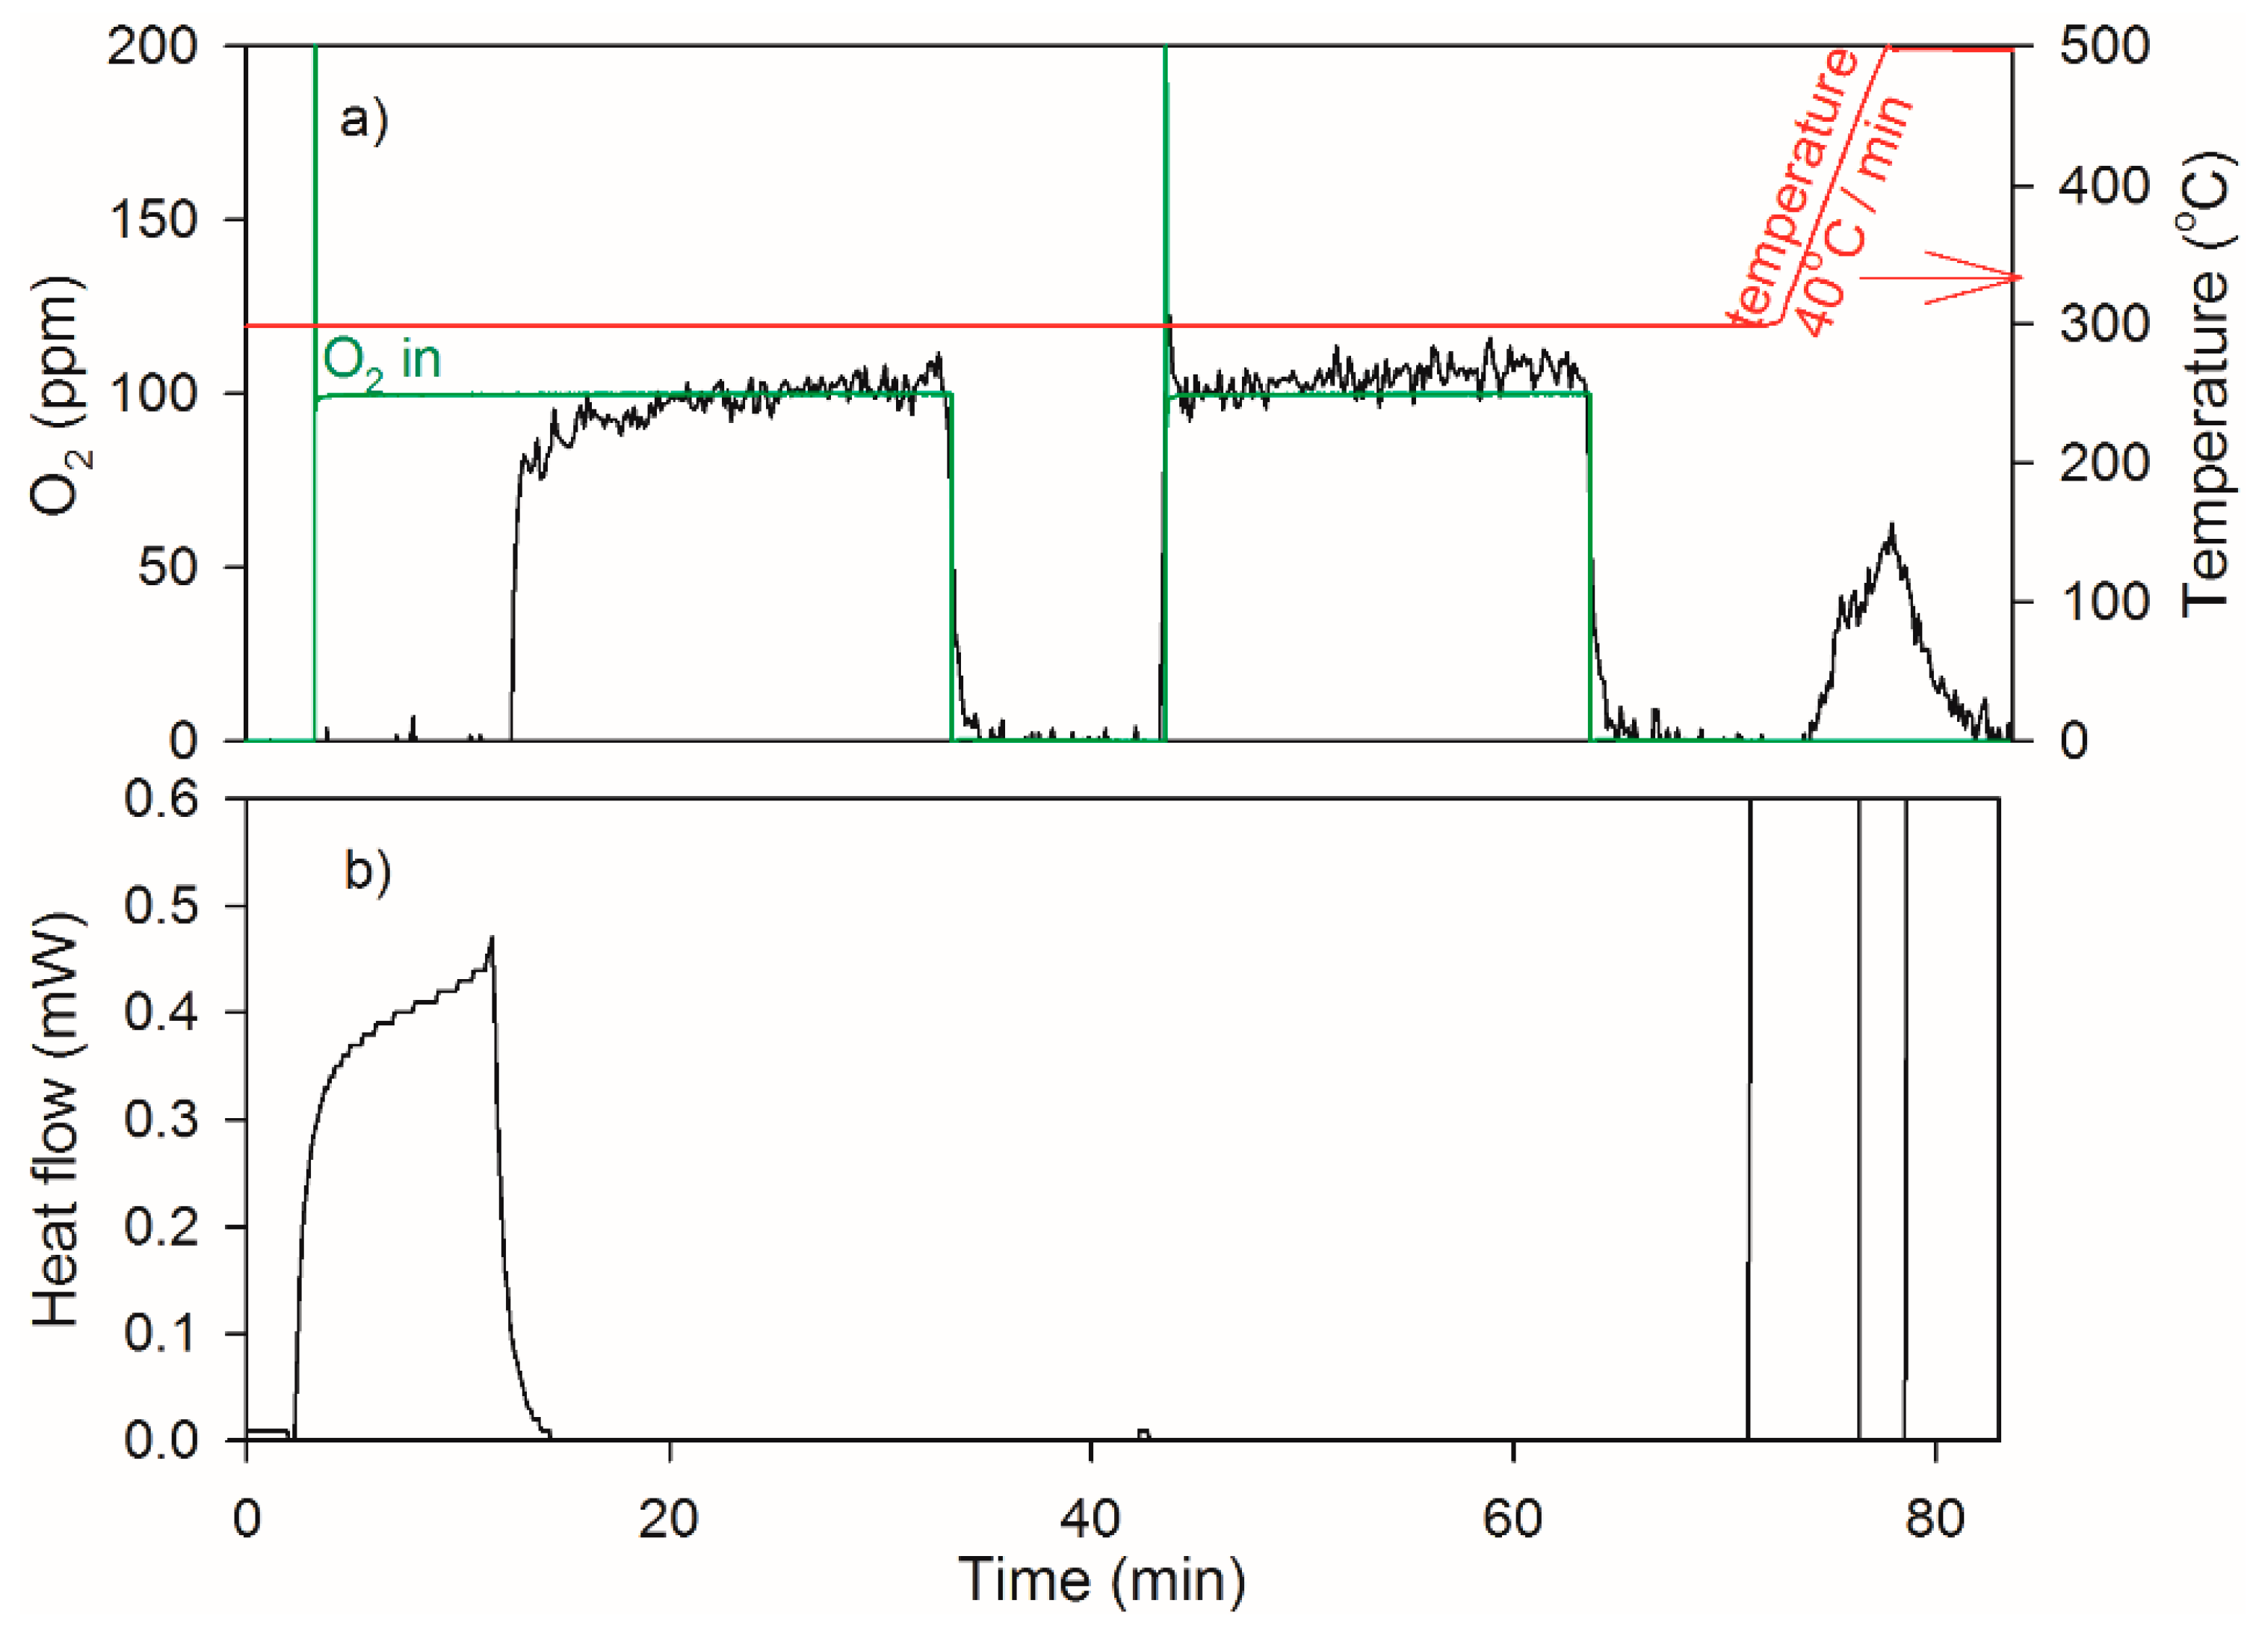
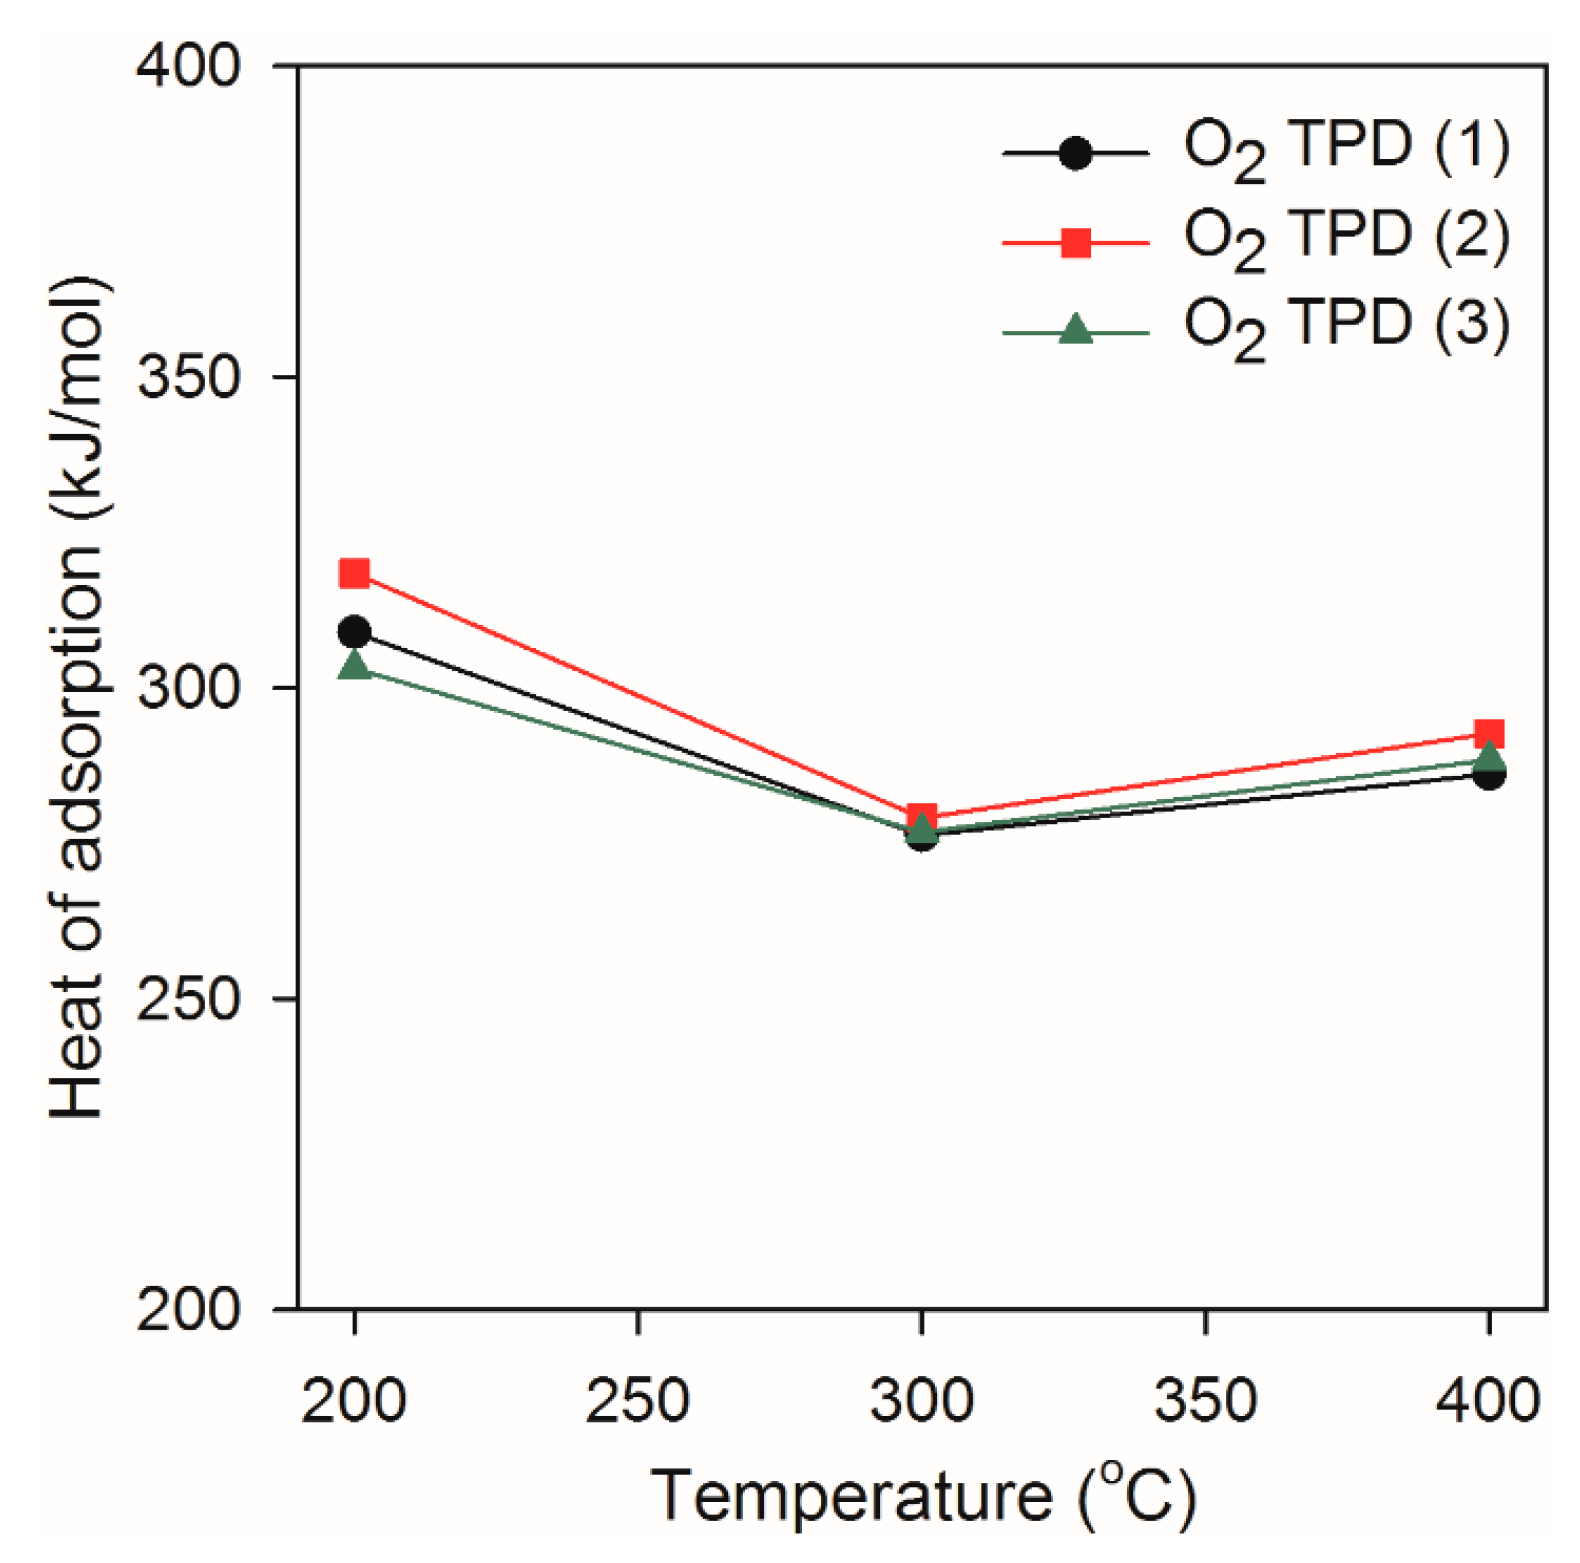
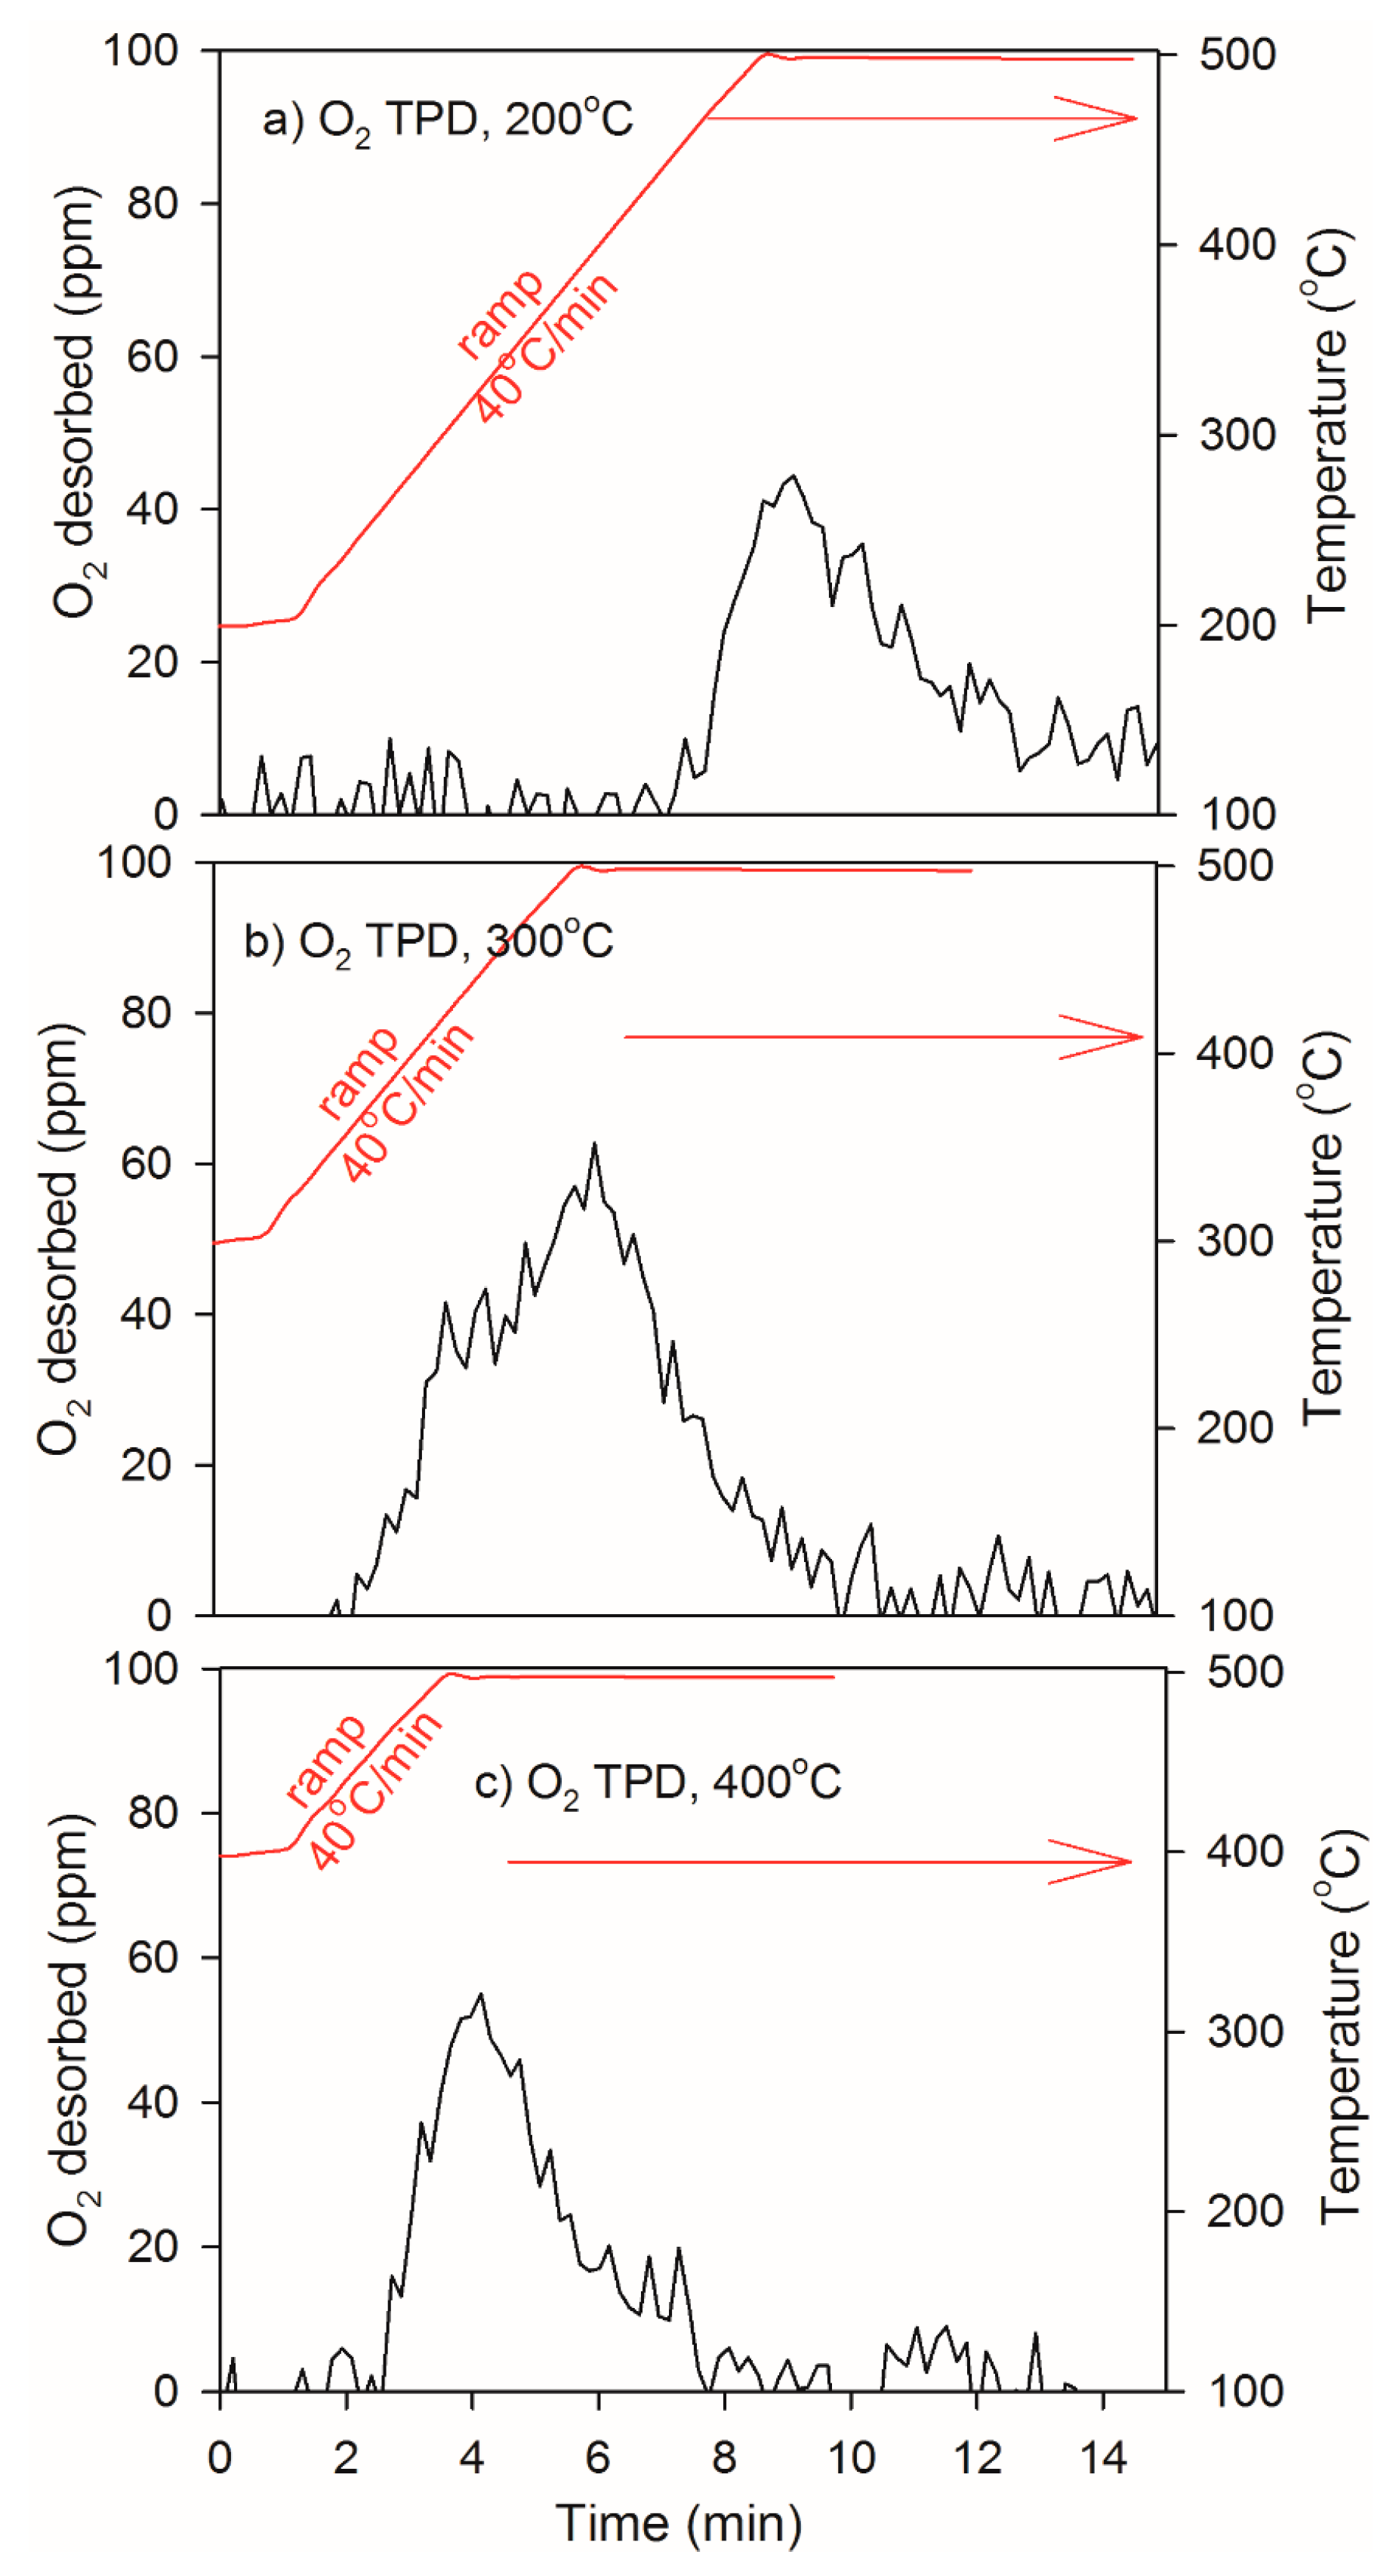
2.3. Heat of Adsorption during O2 TPD Experiments

Additionally, for the O2 TPD experiments, 100 ppm was dosed and three adsorption temperatures were investigated (200 °C, 300 °C, and 400 °C) and the results for the adsorption temperature at 300 °C are shown in Figure 5. In the same way as for the NO TPD, there is a clear exotherm observed when starting the oxygen adsorption. However, the exotherm is much larger, since the heat of adsorption of oxygen is higher compared to NO. During the Ar period between the oxygen steps, no O2 desorption is visible, which also is the reason why no O2 re-adsorption is observed in the second step. The oxygen storage corresponded to 0.96 μmol, which gives an O coverage of 1.6 per Pt surface sites (considering the dispersion of 12%). Thus, subsurface oxygen was produced. This is in line with an earlier study by Olsson and Fridell [22], where Pt/Al2O3 was exposed to 200 ppm O2 for 5 min, 8.1% O2 for 5 min, and 8.1% O2 for 4.5 h, respectively, at 350 °C, which resulted in oxygen coverage of 1.0, 1.6, and 2.4. In the present experiments, our catalyst was exposed to oxygen for quite a long time (30 min) and it is, therefore, reasonable that some sub-surface oxygen was produced. Finally, a temperature ramp was conducted to 500 °C and only small amounts of oxygen was desorbing. The desorbed amount corresponded to only 23% of the stored oxygen, hence, large amount of oxygen is remaining on the surface, which clearly shows the large binding strength of oxygen to the platinum sites.
From the adsorption part of the TPD experiments, the heat of adsorption is derived and the results are displayed in Figure 6. In order to determine experimental variance and reproducibility, the experiments were repeated and the results for three repeated experiments at each temperature are shown in Figure 6. At 200 °C, 300 °C, and 400 °C the respective average heats of adsorptions are 310, 278, and 289 kJ/mol with corresponding standard deviations of 7.7, 1.5, and 3.3 kJ/mol. At higher adsorption temperature the loosely bound species will not adsorb, which results in higher heat of adsorption, which we previously found for NH3 adsorption on Cu/SSZ-13 [23], and is also the case in this study comparing 400 °C and 300 °C. These results are also in line with the amount of O2 desorbed (see Figure 7), where 0.25 μmol is desorbed after 400 °C TPD, while 0.41 μmol for the TPD at 300 °C. This is also in line with the study by Wartnaby et al. [17] who observed that the oxygen adsorption heat decreases with the oxygen coverage. Surprisingly, the heat of adsorption of oxygen at 200 °C is higher than the other two temperatures. In addition, the O2 desorption peak is significantly smaller, where only 0.30 μmol is released for the TPD at 200 °C, but for TPD at 300 °C the corresponding value is 0.41 μmol. It should be noted that at higher temperatures formation of Pt-oxides have been suggested based on TPD experiments [24] and the formation of these species is an activated process. These results are in line with the study by Olsson et al. [24], where larger amounts of O2 was desorbing during the TPD at 300 compared to 200 °C. It should be noted that the heat of adsorption is the difference between activation energy for desorption minus the activation energy for adsorption, and if the activation energy for adsorption is higher, it can result in a lower heat of adsorption, which we observe at 300 °C. Thus, we suggest that the reason for the lower heat of adsorption at 300 °C compared to 200 °C could be the formation of some platinum oxides/subsurface oxygen that has a lower heat of adsorption (due to formation via an activated process) compared to chemisorbed oxygen. Moreover, our results for the heat of adsorption of oxygen on Pt/Al2O3 at atmospheric pressure (310 kJ/mol, 278 and 289 kJ/mol for adsorption temperatures of 200 °C, 300 °C, and 400 °C, respectively) is in line with single crystal measurements at UHV conditions where, for example, Brown et al. [18] reported an initial heat of adsorption of oxygen of 316 ± 34 kJ/mol for Pt (110), which decreased with increasing coverage. Moreover, Wartnaby et al. [17], received an initial heat of adsorption of 335 kJ/mol for O2 on Pt (110) at 300 K. Thus, interestingly, the ∆H of oxygen on platinum seems not to be sensitive to the effect of the support, since similar results are observed for single crystals. Moreover, these results also show that similar results are retrieved at atmospheric pressure as for UHV.

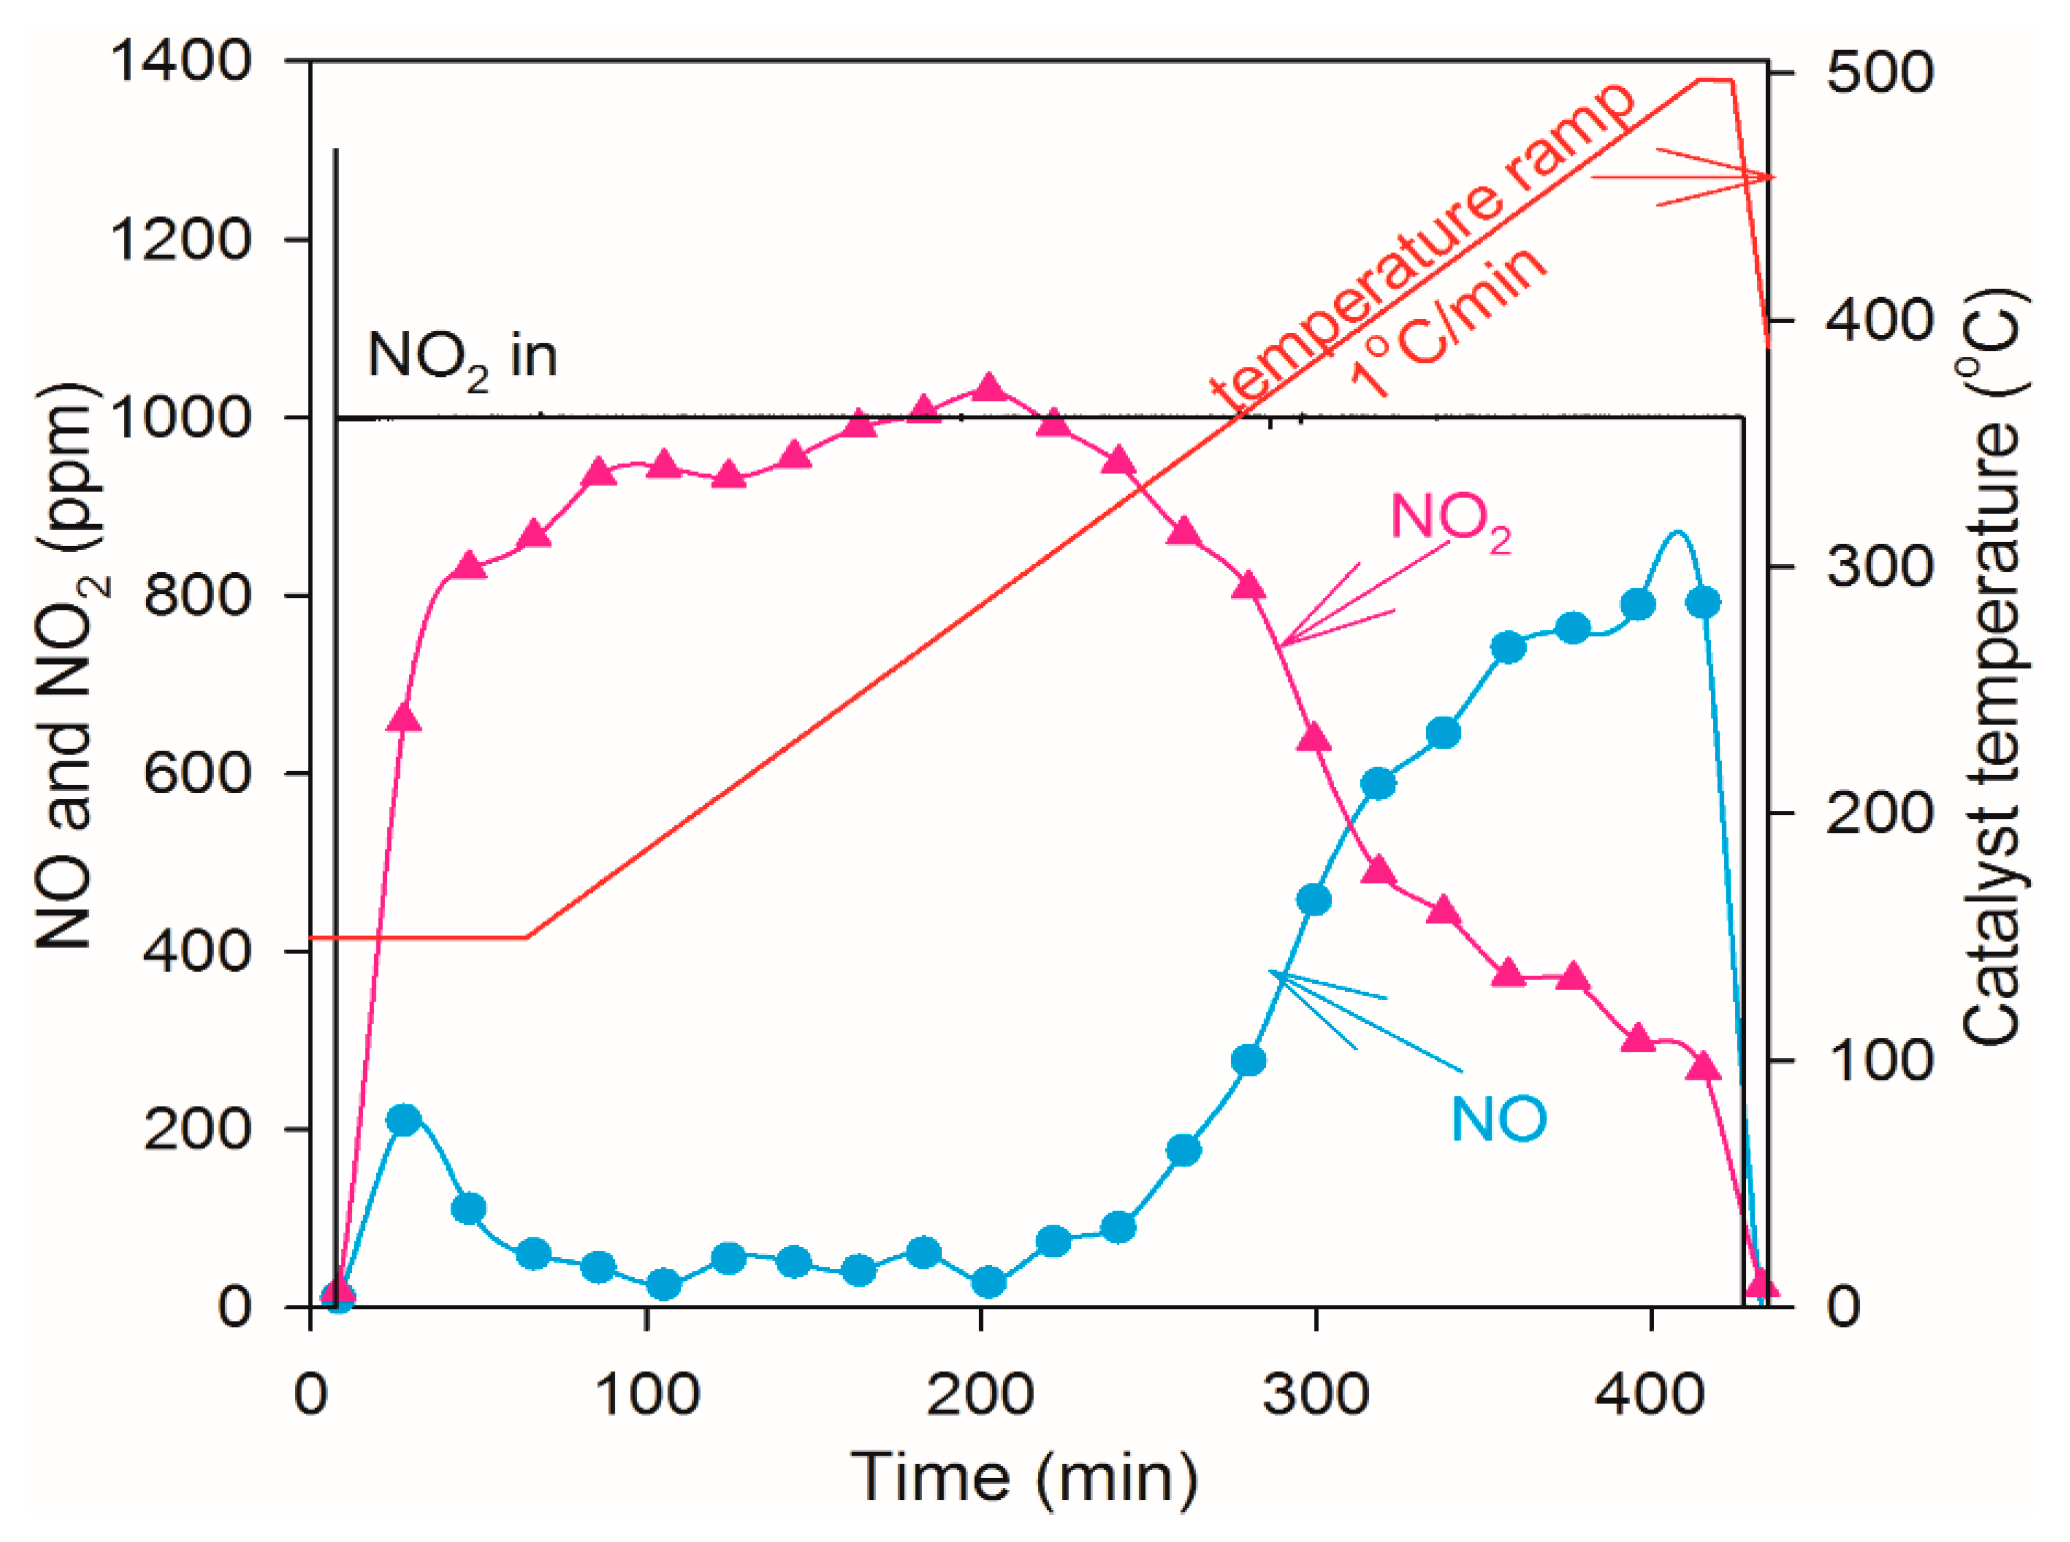
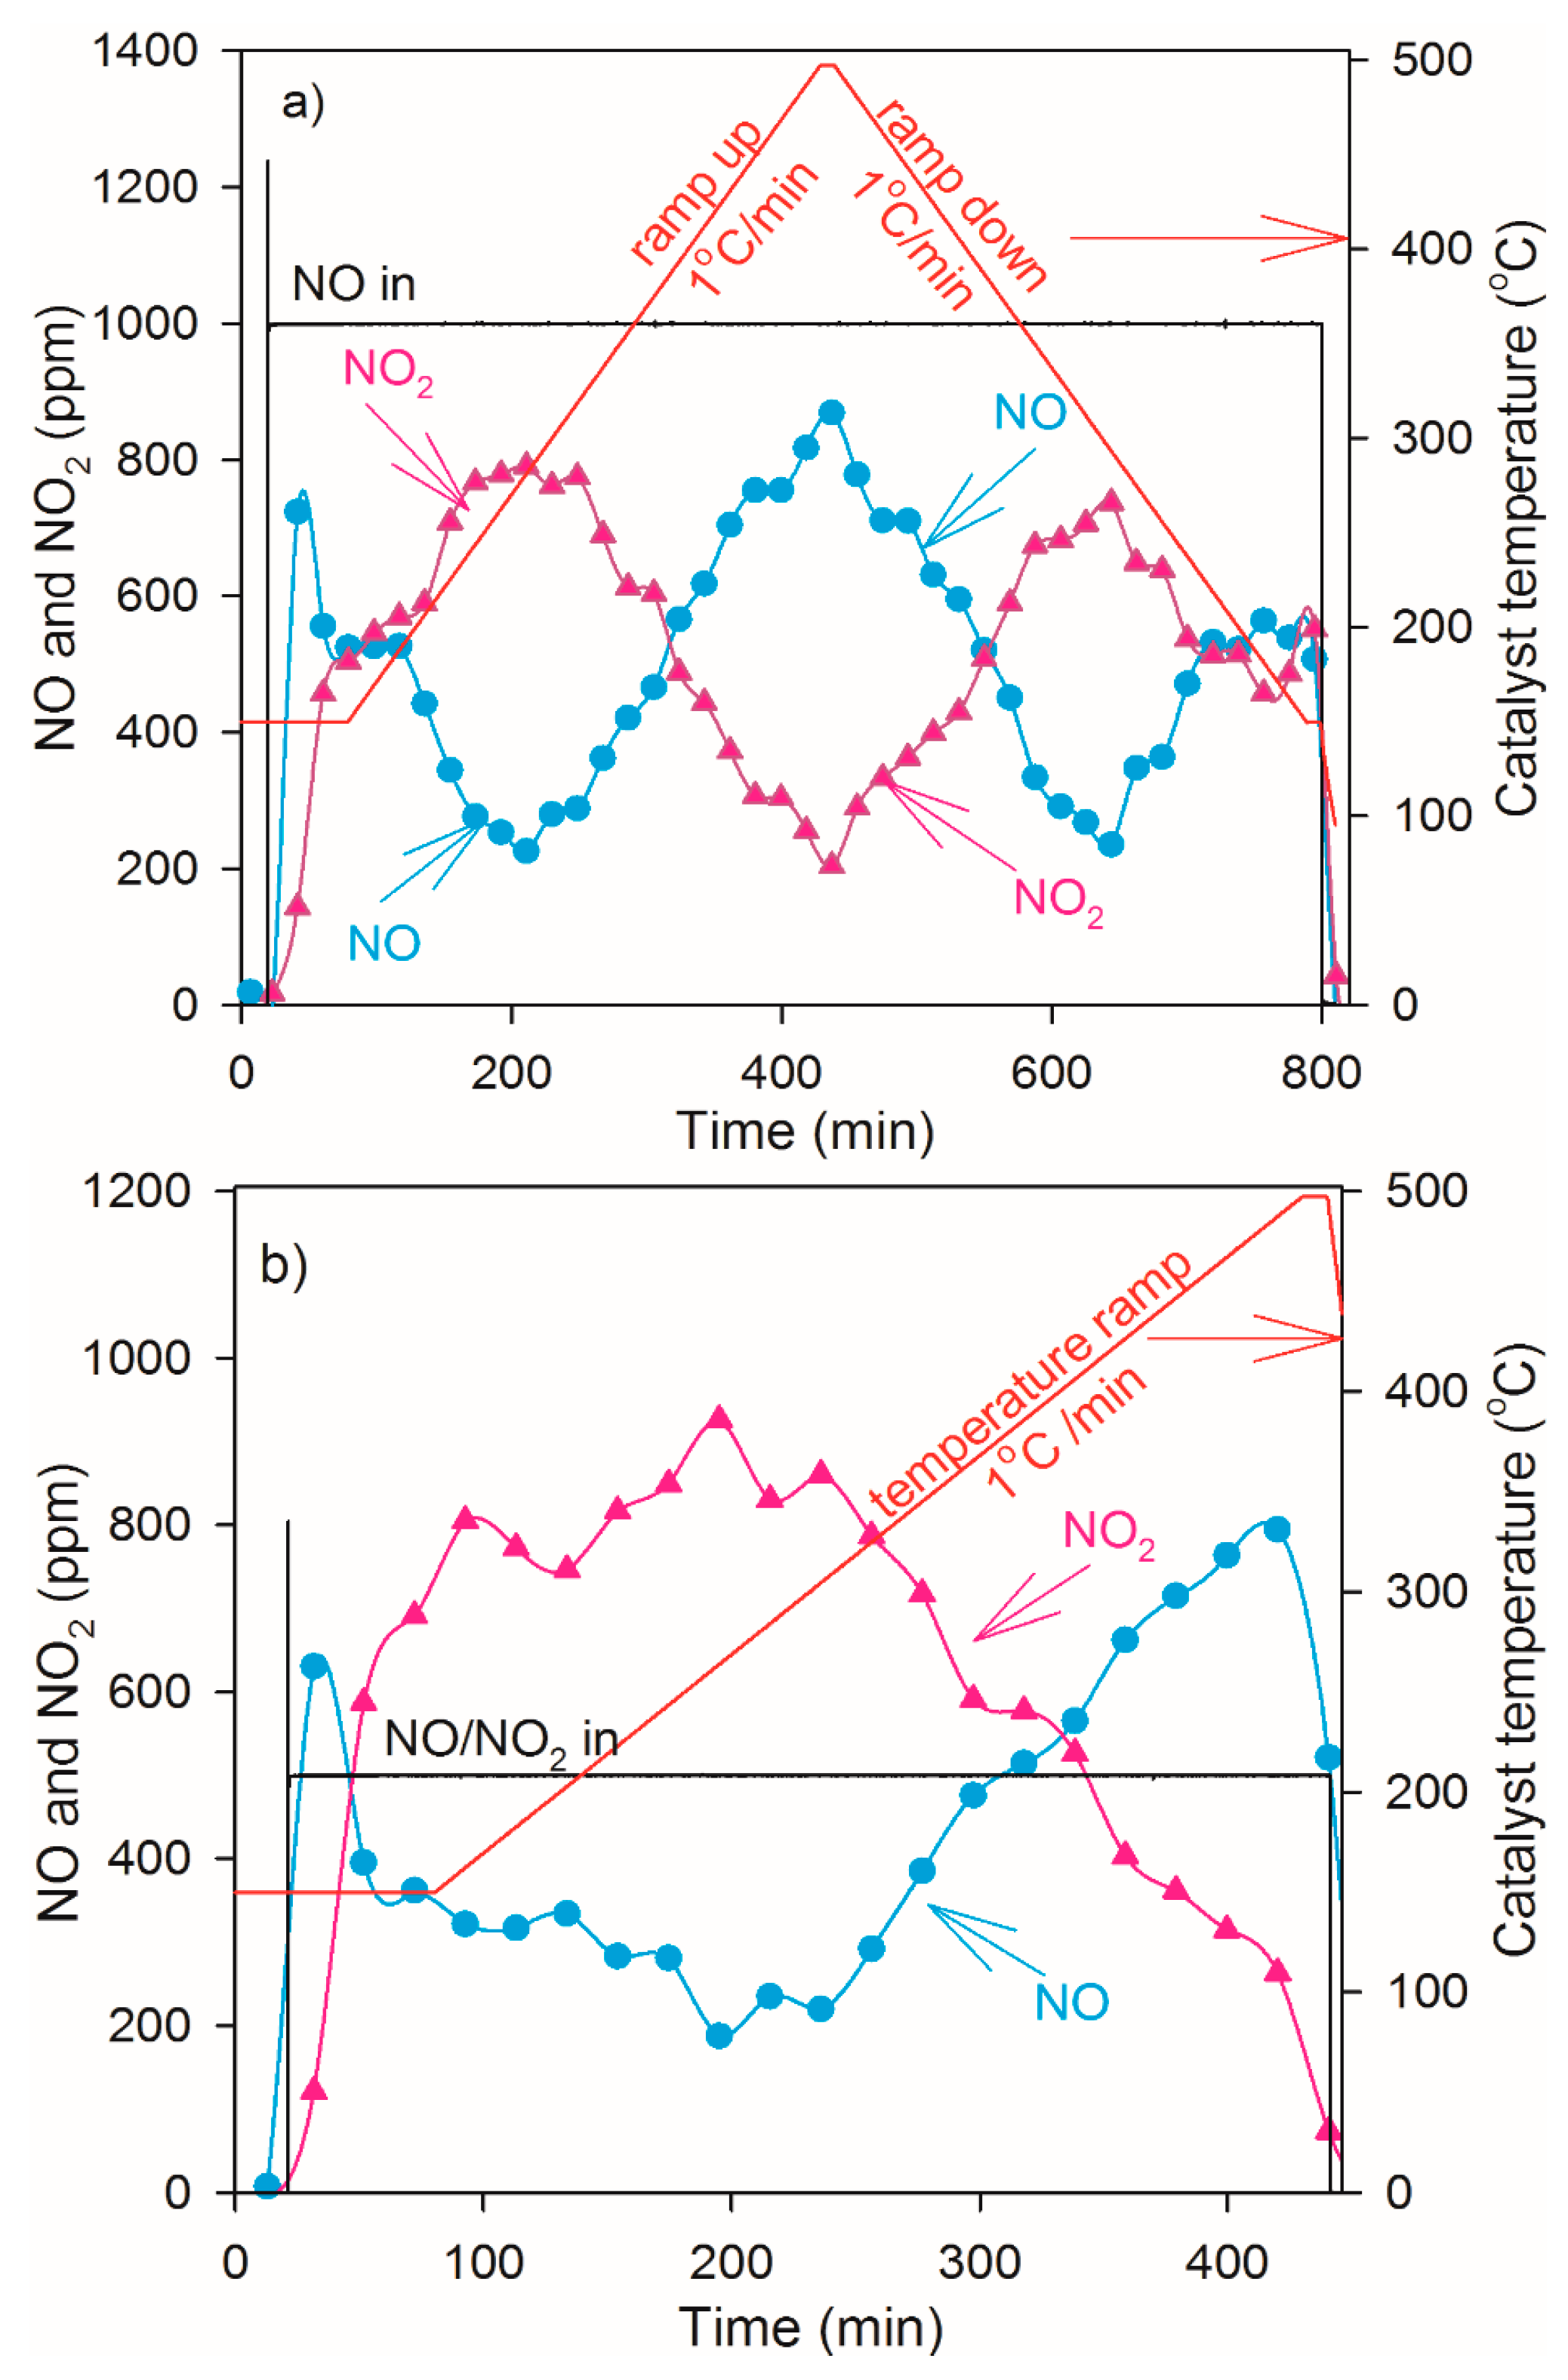
2.4. NO Oxidation and NO2 Dissociation Reaction

NO oxidation on supported platinum is investigated in this study first with only NO and O2 as reactants. The increase in NO2 concentration followed by its decrease and opposite trend for NO concentration during a temperature ramp from 150 °C to 500 °C (ramp 1 °C/min) is shown in Figure 8a. The reason for the observed decrease in NO oxidation at higher temperatures is due to thermodynamic equilibrium [25]. The results clearly show that the catalyst is active for NO oxidation. Regarding the NO concentration profile, when NO and O2 are simultaneously dosed into the system, there is a short initial overshoot of NO during the first minutes of the experiment (Figure 8a). The reason for this is probably NO formation during the storage of nitrates from the NO2 produced, according to:
2NO2+SS-NO3+NO
where S is a storage site. In addition, there appears to be a hysteresis behavior, where the catalyst is more active for NO oxidation during ramp up compared to ramp down. This can be due to Pt-oxides formation during the ramp up [26], which are less active for NO oxidation [22].
Figure 8b shows the evolution of NO and NO2 concentrations over the Pt catalyst during simultaneous dosing of 500 ppm NO and 500 ppm NO2 with 8% O2. When the catalyst is oxidized with a mixture of (NO and NO2) at 150 °C, nitrates and/or nitrites are first formed on the catalytic surface (same as in Figure 8a). This results in NO production, which are clearly seen by the NO concentration being higher than the inlet NO. A decrease in NO and an increase in NO2 is then observed during the temperature ramp from 150 to 500 °C.
Finally, the NO2 dissociation was studied and Figure 9 shows the NO and NO2 concentration profiles as a function of temperature during NO2 dissociation starting at 150 °C. Initially, there is a production of NO observed, and as discussed above, this relates to the formation of nitrates on the alumina. It requires high temperatures before an increasing production of NO is seen during NO2 dissociation (starts at about 310 °C), which is significantly higher compared to the start of NO oxidation, which was actually already active at the lowest temperature of the experiment, i.e., 150 °C (see Figure 8a). According to our earlier study where we developed a kinetic model for NO oxidation and NO2 dissociation, we found, based on Gibbs free energy analysis, that for NO2 dissociation the rate-determining step is oxygen desorption [24]. Thus, the reason for the low activity for NO2 dissociation observed in Figure 9 is the slow desorption of oxygen, and indeed the heat of adsorption for oxygen is very high; therefore, the activation energy for O2 desorption is very high.

3. Experimental Section

3.1. Synthesis of 2 wt. % Pt/γ-Al2O3 Powder Catalyst

The used catalyst in this study was synthesized by a conventional wetness impregnation method of γ-alumina (Puralox Sasol SBa-200, Hamburg, Germany) with an appropriate concentration of an aqueous solution containing the Pt precursor in the form of Pt(NO3)2 (W.C. Heraeus GmbH, Hanau, Germany) corresponding to a Pt loading of 2 wt. %. The commercial γ-Al2O3 powder was pre-calcined at 750 °C for 2.5 h before the synthesis in order to prevent the phase changes after metal deposition. After 2 h of vigorous stirring at room temperature, the resulting solution was freeze dried (ScanVac Cool Safe) at the temperature of liquid nitrogen for 24 h. The obtained 2 wt. % Pt/Al2O3 was then ground into a powder and calcined at 500 °C for 2 h in air.

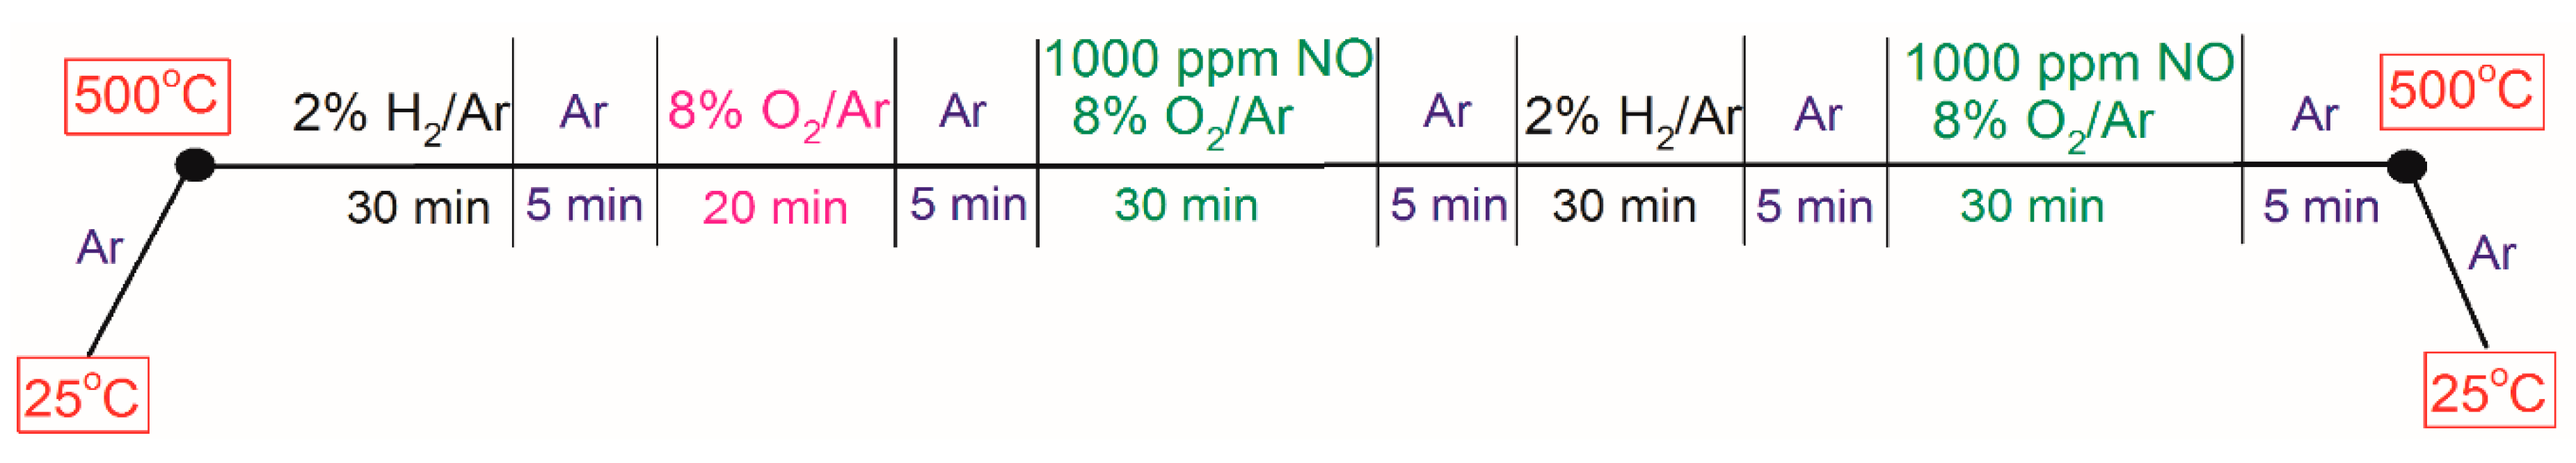
3.2. Microcalorimeter Measurements

The experimental setup consisted of a differential scanning calorimeter (Setaram Sensys DSC, SETARAM Instrumentation, Caluire, France) instrument with two vertical quartz tube reactors. One micro-reactor served as the reference and the second was used for loading the powder catalyst. An amount of 100 mg of 2 wt. % Pt/Al2O3 was loaded onto the sintered quartz bed in the micro-reactor for N2O dissociation and he TPD experiments, while 40 mg of catalyst was used for the NO, NO + NO2 oxidations, and NO2 dissociation. The inlet gas flow composition was controlled by Bronkhorst mass flow controllers (Bronkhorst High-Tech B.V., Ruurlo, The Netherlands). The composition of the reaction products was analyzed with a Hiden Analytical HPR 20 quadrupole mass spectrometer (MS, Hiden Analytical Ltd., Warrington, England) equipped with a capillary probe connected directly to the exit of the second reactor. The reaction products were monitored by recording the MS signals for each compound. The fragmentation in the MS of NO2 to produce mass 30 (for NO) and N2O to produce mass 28 (for N2) is considered in the calibration and data analysis. The total flow rate was 20 mL·min−1 at room conditions in all of the experiments described below. Prior to the desired experiments, the catalysts were subjected to a degreening procedure. Figure 1 shows an overview of the degreening sequence. As is shown in the Figure 10, the sample was conditioned two times in 2% H2 at 500 °C for 30 min each, followed by exposure in a mixture of 1000 ppm NO + 8% O2 at the same temperature for 30 min. The sample was also treated with 8% O2 at 500 °C for 20 min, as is depicted in Figure 10. The degreening treatment was intended to stabilize the catalyst, so that it should return to the same reproducible state under identical reaction conditions.
The degreened catalyst was subjected to various transient experiments: O2 TPD at three different temperatures (200 °C, 300 °C, and 400 °C), with NO TPD at 50 °C, 150 °C, and 150 °C. The samples were pre-treated using to 2% H2 at 500 °C for 20 min. After pre-treatment, the catalysts were exposed to 100 ppm O2 at the target temperatures (200 °C, 300 °C, or 400 °C) in two steps: in the first step the samples were exposed to oxygen for 30 min followed by an inert period for 10 min; in the second step the catalysts were flowed with oxygen for 20 min. Thereafter, the temperature was raised to 500 °C at a ramping rate of 40 °C·min−1 in an Ar stream. The NO TPD tests were performed in the same way as for O2 TPD, but using 50 ppm NO in the storage phases instead. The NO TPD experiments were conducted at three temperatures: 50 °C, 100 °C, and 150 °C, respectively.
The surface Pt dispersion was evaluated by N2O dissociation based on the N2 produced during the experiment performed at 100 °C. It was assumed that the number of formed N2 molecules is equal with the number of surface noble metal sites [20], which we have used successfully for Pt/Al2O3 and Pt/BaO/Al2O3, previously [27]. The degreened sample was pre-treated with 2% H2 at 500 °C for 30 min, followed by decreasing to the desired temperature (100 °C) in Ar. N2O dissociation experiment was then performed in which the catalysts were exposed to 200 ppm N2O at 100 °C for 1 h.
In order to evaluate the Pt behavior when NO and NO2 are fed either independently and/or simultaneously in the reactor, various experiments were designed such as: NO oxidation, (NO + NO2) oxidation, and NO2 dissociation. Prior to each of these experiments, the degreened sample was pre-treated following the same procedure as used for TPD experiments. In these experiment the catalyst was exposed to either of the three gas mixtures (1000 ppm NO and 8% O2, 500 ppm NO, 500 ppm NO2 and 8% O2 or 1000 ppm NO2 and 8% O2) at 150 °C for 1 h. Afterwards, the temperature was raised to 500 °C at a rate of 1 °C·min−1 while exposing the catalyst to the same gas mixture and the sample was maintained at 500 °C for 10 min. For the NO oxidation case, the sample was also cooled in the same gas mixture to 150 °C at 1 °C·min−1.

4. Conclusions

In this study we have shown that it is possible to measure the heats of adsorption of NO and oxygen on a functional oxidation catalyst, i.e., Pt supported on Al2O3, using microcalorimeter experiments at atmospheric pressure. For reproducible results it was important that the catalyst was stabilized by a thorough degreening treatment. The heats of adsorption were, in most cases, comparable to those reported for measurements on single crystal platinum surfaces. The results from this work can be used when developing kinetic models for DOC. The main findings in this study is (i) ∆H for oxygen adsorption of Pt/Al2O3 as a function of temperature, (ii) platinum oxide formation may result in lowering of ∆H, (iii) ∆H for oxygen is changing at higher temperatures due to repulsive interactions, and (v) ∆H for NO adsorption on Pt/Al2O3. The results, in a more detailed description, can be found in the following sections:
The initial averaged values of the adsorption heats of oxygen are 310 kJ/mol at 200 °C and it declines to 278 kJ/mol at 300 °C, followed by its increase to 289 kJ/mol at 400 °C. At 300 °C a greater quantity of oxygen was adsorbed compared to the TPD at 200 °C, indicating the formation of platinum oxides via an activated process. Oxygen, as platinum oxides, might have a lower heat of formation compared to chemisorbed oxygen formed mainly at 200 °C, which could be due to that oxide formation likely being an activated process which reduces the ∆H (∆H = activation energy for decomposition of Pt oxides − activation energy for formation of Pt oxides ). The smaller increase in the heat of adsorption from 300 to 400 °C indicates coverage dependence of the heat of adsorption in this temperature range.
For nitric oxide, the initial heat of adsorption for a fresh sample is 206 kJ/mol (at 50 °C) and 195 kJ/mol (at 150 °C). At the lowest adsorption temperature (50 °C) no N2 formation was observed indicating that the heat of adsorption of 206 kJ/mol is associated with NO adsorption. Over the examined temperature range the heat of adsorption of NO appeared nearly constant. A slight apparent decrease at only the highest temperature, 150 °C, was likely due to interference from side reactions (NO dissociation and N2 formation).
The catalyst was demonstrated to be active for NO oxidation, (NO + NO2) oxidation, and NO2 dissociation. A higher temperature was required for light-off of NO2 dissociation compared to NO oxidation, which is consistent with the observed high adsorption heats for oxygen since oxygen desorption has been suggested to be the rate-limiting step for NO2 dissociation.

Acknowledgments

The funding from the Swedish Foundation for Strategic Research (F06-0006) and Swedish Energy agency is acknowledged. This work was carried out at the Competence Centre for Catalysis and Chemical Engineering, Chalmers University of Technology.

Author Contributions

Oana Mihai. conducted all experiments and drafted the manuscript. Derek Creaser participated in the discussion and interpretation of the results and gave feedback regarding the paper. Louise Olsson coordinated the study and helped draft the manuscript. All authors gave final approval for publication.

Conflicts of Interest

The authors declare no conflict of interest.

References

  1. Brandenberger, S.; Kröcher, O.; Tissler, A.; Althoff, R. The state of the art in selective catalytic reduction of NOx by ammonia using metal-exchanged zeolite catalysts. Catal. Rev. Sci. Eng. 2008, 50, 492–531. [Google Scholar] [CrossRef]
  2. Matsumoto, S. Catalytic reduction of nitrogen oxides in automotive exhaust containing excess oxygen by NOx storage-reduction catalyst. CATTECH 2000, 4, 102–109. [Google Scholar] [CrossRef]
  3. Weiss, B.M.; Iglesia, E. NO oxidation catalysis on Pt clusters: Elementary steps, structural requirements, and synergistic effects of NO2 adsorption sites. J. Phys. Chem. C 2009, 113, 13331–13340. [Google Scholar] [CrossRef]
  4. Mulla, S.S.; Chen, N.; Delgass, W.N.; Epling, W.S.; Ribeiro, F.H. NO2 inhibits the catalytic reaction of NO and O2 over Pt. Catal. Lett. 2005, 100, 267–270. [Google Scholar] [CrossRef]
  5. Venderbosch, R.H.; Prins, W.; van Swaaij, W.P.M. Platinum catalyzed oxidation of carbon monoxide as a model reaction in mass transfer measurements. Chem. Eng. Sci. 1998, 53, 3355–3366. [Google Scholar] [CrossRef]
  6. Bourane, A.; Bianchi, D. Oxidation of CO on a Pt/Al2O3 catalyst: From the surface elementary steps to light-off tests: I. Kinetic study of the oxidation of the linear CO species. J. Catal. 2001, 202, 34–44. [Google Scholar] [CrossRef]
  7. Twigg, M.V. Progress and future challenges in controlling automotive exhaust gas emissions. Appl. Catal. B 2007, 70, 2–15. [Google Scholar] [CrossRef]
  8. Getman, R.B.; Schneider, W.F.; Smeltz, A.D.; Delgass, W.N.; Ribeiro, F.H. Oxygen-coverage effects on molecular dissociations at a Pt metal surface. Phys. Rev. Lett. 2009, 102, 076101. [Google Scholar] [CrossRef] [PubMed]
  9. Hwang, C.P.; Yeh, C.T. Platinum-oxide species formed by oxidation of platinum crystallites supported on alumina. J. Mol. Catal. A Chem. 1996, 112, 295–302. [Google Scholar] [CrossRef]
  10. Wang, C.B.; Yeh, C.T. Effects of particle size on the progressive oxidation of nanometer platinum by dioxygen. J. Catal. 1998, 178, 450–456. [Google Scholar] [CrossRef]
  11. Wang, C.B.; Yeh, C.T. Oxidation behavior of alumina-supported platinum metal catalysts. Appl. Catal. A 2001, 209, 1–9. [Google Scholar] [CrossRef]
  12. Mukerji, R.J.; Bolina, A.S.; Brown, W.A. An investigation of the effect of pre-dosed O atoms on the adsorption of NO on Pt{211}. Surf. Sci. 2003, 547, 27–44. [Google Scholar] [CrossRef]
  13. Rienks, E.D.L.; Bakker, J.W.; Baraldi, A.; Carabineiro, S.A.C.; Lizzit, S.; Weststrate, C.J.; Nieuwenhuys, B.E. Interaction of nitric oxide with Pt(100). A fast X-ray photoelectron spectroscopy study. Surf. Sci. 2002, 516, 109–117. [Google Scholar] [CrossRef]
  14. Weststrate, C.J.; Bakker, J.W.; Rienks, E.D.L.; Vinod, C.P.; Lizzit, S.; Petaccia, L.; Baraldi, A.; Nieuwenhuys, B.E. Synchrotron XPS and desorption study of the NO chemistry on a stepped Pt surface. Surf. Sci. 2006, 600, 1991–2001. [Google Scholar] [CrossRef]
  15. Cardona-Martinez, N.; Dumesic, J.A. Applications of adsorption microcalorimetry to the study of heterogeneous catalysis. In Advances in Catalysis; Eley, D.D., Pines, H., Weisz, P.B., Eds.; Academic Press Inc.: Amsterdam, The Netherlands, 1992; ISBN 978-0-12-007838-7. Volume 38, pp. 149–244. [Google Scholar]
  16. Spiewak, B.E.; Dumesic, J.A. Applications of adsorption microcalorimetry for the characterization of metal-based catalysts. Thermochim. Acta 1998, 312, 95–104. [Google Scholar] [CrossRef]
  17. Wartnaby, C.E.; Stuck, A.; Yeo, Y.Y.; King, D.A. Microcalorimetric heats of adsorption for CO, NO, and oxygen on Pt{110}. J. Phys. Chem. 1996, 100, 12483–12488. [Google Scholar] [CrossRef]
  18. Brown, W.A.; Kose, R.; King, D.A. Femtomole adsorption calorimetry on single-crystal surfaces. Chem. Rev. 1998, 98, 797–832. [Google Scholar] [CrossRef] [PubMed]
  19. Fiorin, V.; Borthwick, D.; King, D.A. Microcalorimetry of O2 and NO on flat and stepped platinum surfaces. Surf. Sci. 2009, 603, 1360–1364. [Google Scholar] [CrossRef]
  20. Dawody, J.; Eurenius, L.; Abdulhamid, H.; Skoglundh, M.; Olsson, E.; Fridell, E. Platinum dispersion measurements for Pt/BaO/Al2O3, NOx storage catalysts. Appl. Catal. A 2005, 296, 157–168. [Google Scholar] [CrossRef]
  21. Wilken, N.; Kamasamudram, K.; Currier, N.W.; Li, J.; Yezerets, A.; Olsson, L. Heat of adsorption for NH3, NO2 and NO on Cu-Beta zeolite using microcalorimeter for NH3 SCR applications. Catal. Today 2010, 151, 237–243. [Google Scholar] [CrossRef]
  22. Olsson, L.; Fridell, E. The influence of Pt oxide formation and Pt dispersion on the reactions NO2 ⇄ NO + 1/2 O2 over Pt/Al2O3 and Pt/BaO/Al2O3. J. Catal. 2002, 210, 340–353. [Google Scholar] [CrossRef]
  23. Olsson, L.; Wijayanti, K.; Leistner, K.; Kumar, A.; Joshi, S.Y.; Kamasamudram, K.; Currier, N.W.; Yezerets, A. A multi-site kinetic model for NH3-SCR over Cu/SSZ-13. Appl. Catal. B Environ. 2015, 174–175, 212–224. [Google Scholar] [CrossRef]
  24. Olsson, L.; Persson, H.; Fridell, E.; Skoglundh, M.; Andersson, B. A kinetic study of NO oxidation and NOx storage on Pt/Al2O3 and Pt/BaO/Al2O3. J. Phys. Chem B 2001, 105, 6895–6906. [Google Scholar] [CrossRef]
  25. Olsson, L.; Westerberg, B.; Persson, H.; Fridell, E.; Skoglundh, M.; Andersson, B. A kinetic study of oxygen adsorption/desorption and NO oxidation over Pt/Al2O3 catalysts. J. Phys. Chem. B. 1999, 103, 10433–10439. [Google Scholar] [CrossRef]
  26. Auvray, X.P.; Olsson, L. Effect of enhanced support acidity on the sulfate storage and the activity of Pt/γ-Al2O3 for NO oxidation and propylene oxidation. Catal. Lett. 2014, 144, 22–31. [Google Scholar] [CrossRef]
  27. Andonova, S.; Marchionni, V.; Borelli, M.; Nedyalkova, R.; Lietti, L.; Olsson, L. Mechanistic investigations of the promoting role of Rh on the NSR performance of NOx storage bao-based catalysts. Appl. Catal. B Environ. 2013, 132–133, 266–281. [Google Scholar] [CrossRef]
Figure 1. (a). NO concentration and temperature as function of the time, (b) resulting N2, NO2, and N2O concentrations, (c) corresponding heat flow during NO TPD at 100 °C for 2 wt. % Pt/Al2O3. Experimental details are described in Section 3.
Catalysts 06 00073 g001
Figure 2. Desorbed (a) NO, (b) N2, and (c) N2O during temperature ramp from 100 °C to 500 °C for NO TPD experiments at adsorption temperatures of 50 °C, 100 °C, and 150 °C for 2 wt. % Pt/Al2O3. Experimental details are described in Section 3.
Catalysts 06 00073 g002
Figure 3. Details for the integrated area of adsorption heat during the first 30 min of the first NO exposure for NO TPD at 100 °C for 2 wt. % Pt/Al2O3 catalyst.
Catalysts 06 00073 g003
Figure 4. Averaged adsorption heats of NO at adsorption temperatures of 50 °C, 100 °C, and 150 °C over 2% Pt/Al2O3 catalyst. Experimental details are described in Section 3.
Catalysts 06 00073 g004
Figure 5. (a) Oxygen concentration and temperature as a function of the time and (b) the corresponding heat flow during O2 TPD at 300 °C for 2 wt. % Pt/Al2O3. Experimental details are described in Section 3.
Catalysts 06 00073 g005
Figure 6. Averaged adsorption heats of oxygen for adsorption temperatures of 200 °C, 300 °C, and 400 °C over 2% Pt/Al2O3 catalyst. Experimental procedures are described in Section 3.
Catalysts 06 00073 g006
Figure 7. The amounts of the oxygen desorbed during temperature ramp for O2 TPD at adsorption temperatures (a) 200 °C, (b) 300 °C, and (c) 400 °C. Experimental details are described in Section 3.
Catalysts 06 00073 g007
Figure 8. Evolution of NO and NO2 concentrations as function of the time during (a) NO oxidation and (b) (NO + NO2) oxidation over 2 wt. % Pt/Al2O3. Experimental procedures are described in Section 3.
Catalysts 06 00073 g008
Figure 9. The NO and NO2 profiles as function of the time during NO2 dissociation over 2 wt. % Pt/Al2O3 catalyst. Experimental procedures are described in Section 3.
Catalysts 06 00073 g009
Figure 10. Series of conditions for the degreening procedure carried out for 2 wt. % Pt/Al2O3 catalyst.
Catalysts 06 00073 g010

