Article

Methanol Reforming over Cobalt Catalysts Prepared from Fumarate Precursors: TPD Investigation

by
Eftichia Papadopoulou
and
Theophilos Ioannides
*
Foundation for Research and Technology-Hellas (FORTH), Institute of Chemical Engineering Sciences (ICE-HT), Stadiou str., Platani, GR-26504 Patras, Greece
*
Author to whom correspondence should be addressed.
Catalysts 2016, 6(3), 33; https://doi.org/10.3390/catal6030033
Submission received: 30 November 2015 / Revised: 2 February 2016 / Accepted: 16 February 2016 / Published: 24 February 2016
(This article belongs to the Special Issue Surface Chemistry and Catalysis)

Abstract

:
Temperature-programmed desorption (TPD) was employed to investigate adsorption characteristics of CH3OH, H2O, H2, CO2 and CO on cobalt-manganese oxide catalysts prepared through mixed Co-Mn fumarate precursors either by pyrolysis or oxidation and oxidation/reduction pretreatment. Pyrolysis temperature and Co/Mn ratio were the variable synthesis parameters. Adsorption of methanol, water and CO2 was carried out at room temperature. Adsorption of H2 and H2O was carried out at 25 and 300 °C. Adsorption of CO was carried out at 25 and 150 °C. The goal of the work was to gain insight on the observed differences in the performance of the aforementioned catalysts in methanol steam reforming. TPD results indicated that activity differences are mostly related to variation in the number density of active sites, which are able to adsorb and decompose methanol.

Graphical Abstract

1. Introduction

Mixed cobalt-manganese fumarate salts are useful precursors leading to catalysts with different structure depending on the type of surrounding atmosphere during activation [1]. Thus, activation in air leads to burn-off of the fumarate group and concomitant formation of mixed CoxMn1−xOy spinel oxides, while activation in inert gas leads to pyrolysis of the fumarate group and formation of species with lower oxidation state, such as metallic cobalt, mixed oxides of Co2+ and Mn2+ and residual carbon. Combination of in-situ XRD, H2-TPR and methanol-TPR has shown that catalysts produced by pyrolysis are almost fully reduced [1]. Thus, catalysts derived from pyrolysis do not need prereduction and are more active than those with an initial spinel structure in the reaction of steam reforming of ethanol or methanol [2]. State-of-the-art catalysts for steam reforming of methanol are copper-based and operate at 250–300 °C, while ethanol reforming requires higher temperatures of the order of 600 °C [3,4,5,6,7,8,9]. Cobalt is a less efficient catalyst than copper in the steam reforming of methanol operating at temperatures around 400 °C [2].
From a mechanistic point of view, adsorption is a key step in catalytic reactions. Hence, study of adsorption and desorption of relevant molecules on catalytic surfaces can provide insight on the population and intrinsic properties of active sites. TPD, in particular, is a standard technique via which one can obtain information concerning: (i) adsorption site homogeneity, as reflected in the presence of one or more desorption peaks; (ii) strength of the adsorbate-surface bond, as reflected in the peak temperature of desorbed species; and (iii) number density of adsorption sites, as reflected in the amount of desorbed species. It is especially useful in comparative parametric studies of a catalyst family.
Adsorption of methanol on a Co(0001) surface takes place as methoxide via OH bond scission. During heating, a small amount of methanol desorbs molecularly, while the majority of methoxide decomposes to CO and hydrogen [10]. Infrared spectra produced by adsorbed species formed during the exposure of silica-supported Co to methanol have been obtained by Bliholder et al. [11]. Methanol was found to adsorb to a small extent on the silica support -probably as a methoxide, while varying mixtures of methoxide, acyl, and chemisorbed CO species were produced on Co. The interaction between Co3O4 or CoO with methanol under either atmospheric or high vacuum conditions was examined by Natile et al. [12]. Methanol was found to chemisorb mainly molecularly on cobalt oxide surfaces, while its dissociation became evident at higher temperatures. In the case of Co3O4, the presence of formate and formaldehyde species was evident in the temperature range 200–350 °C, whereas under high vacuum conditions, formaldehyde and several decomposition and fragmentation products were observed along with carbon oxides.
Adsorption of water on a hexagonal Co(1120) surface was studied by means of photoelectron spectroscopies (XPS, UPS) by Grellner et al. [13]. Molecular adsorption of water at 100 K was accompanied by the formation of small amounts of OH in the submonolayer range. When the temperature is increased, desorption of the multilayer occurs first at 150 K and OH remains on the surface. Disproportionation of OH takes place at 270 K leaving oxygen on the surface. A systematic study of the adsorption and dissociation of water on transition and noble metal dimers was presented by Heras et al. [14].
Activated hydrogen chemisorption on unsupported and supported (silica, alumina, titania, magnesia, and carbon supports) cobalt catalysts prepared by a variety of techniques has been reported by Bartholomew et al. [15,16,17]. The surface interaction of CO, CO2 and H2 with the perovskite-type oxide LaCoOx has been studied as a function of reduction temperature using XPS and TPD by Tejuca et al. [18]. Hydrogen was found to adsorb on cobalt both weakly and strongly (desorption peaks at 70 °C and above 200 °C). Dissociative adsorption yielding hydroxyl groups was also detected. Narayanan et al. [19] studied Η2 adsorption at 100 °C on Co/Al2O3 catalysts with varying cobalt content (10%–50%). The amount of adsorbed Η2 was 15 μmol·g−1 at 20% cobalt loading and increased to 67 μmol·g−1 for 50% cobalt loading. Hydrogen adsorption/desorption characteristics on Co-TiN nanocomposite particles have been studied using TPD by Sakka et al. [20]. Hydrogen desorption was observed in the temperature range 100–320 °C. Activated chemisorption of hydrogen on prereduced MnFe2O4 spinel oxides was reported by Soong et al. [21]. Hydrogen desorption at 570–630 °C was attributed to chemisorbed species on MnO.
Gauthier et al. [22] investigated CO adsorption on PtCo(111) surfaces by scanning tunneling microscopy. It was found that CO molecules reside exclusively on top of Pt sites and never on Co. High-pressure, in-situ diffuse reflectance, Fourier Transform Infrared Spectroscopy was employed by Jiang et al. [23] to study CO adsorption on samples derived from precipitated cobalt-manganese oxides of different Co/Mn ratios reduced by H2. According to their results the adsorption features of the samples vary significantly with manganese loading. CO linearly adsorbed, bridged and multiple-bridged on Co° sites was identified. Mohana et al. [24] found that CO adsorption at room temperature on cobalt particles supported on MgO leads mainly to the formation of linearly adsorbed species, while the disproportionation reaction accompanied by carbon deposition already takes place at room temperature. Carbon deposition on cobalt catalysts in Fischer-Tropsch and steam reforming reactions is well-documented [25,26,27,28,29,30,31]. Regarding methanol reforming, the pathway of carbon deposition on cobalt catalysts appears to be the Boudouard reaction since CO is the main reaction product. The structure of carbon deposits originating from CO depends on reaction temperature with amorphous and filamentous carbon prevailing at low temperatures (350–600 °C), which are relevant to methanol steam reforming [31]. Formation of filamentous carbon does not lead to catalyst deactivation but rather to reactor plugging leading to excessive pressure drop.
In the present study, TPD experiments of pre-adsorbed CH3OH, H2O, H2, CO2 and CO were employed in order to examine the adsorptive properties of cobalt catalysts prepared through mixed cobalt-manganese fumarate precursors by activation under oxidative or reducing conditions. The objective of this study was to investigate the effect of catalyst synthesis parameters on the corresponding adsorptive properties. More specifically, the examined catalyst synthesis parameters were: (i) the activation type, pyrolysis or calcination; (ii) the Co/Mn ratio; and (iii) the pyrolysis temperature. These are the main parameters influencing the structure [1] and activity [2] of the specific catalysts in methanol steam reforming. To our knowledge, an extensive investigation of the adsorption of a variety of catalysis relevant molecules on Co-Mn based catalysts has not been reported previously.

2. Results and Discussion

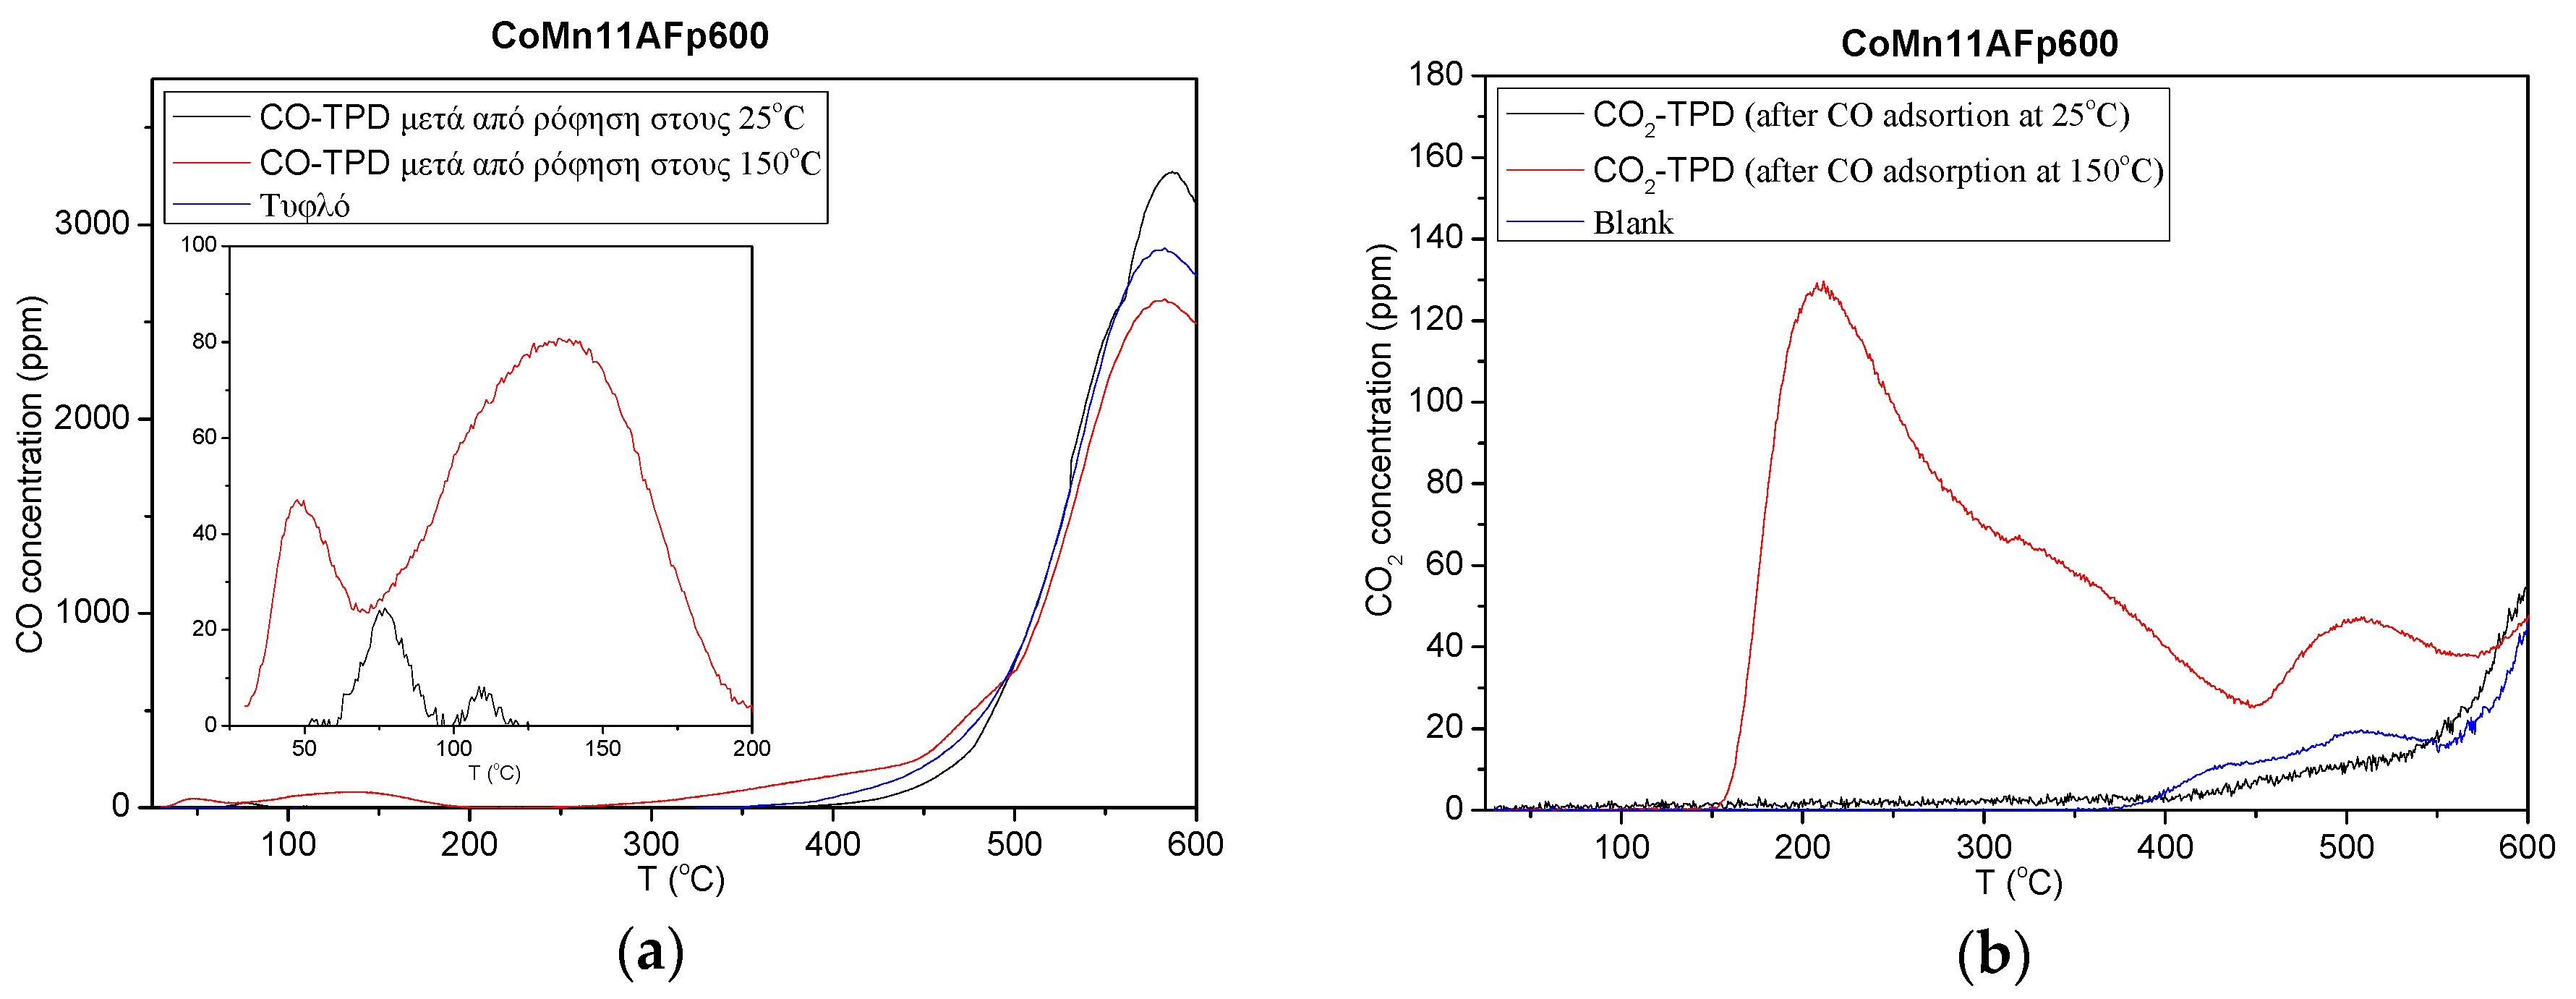
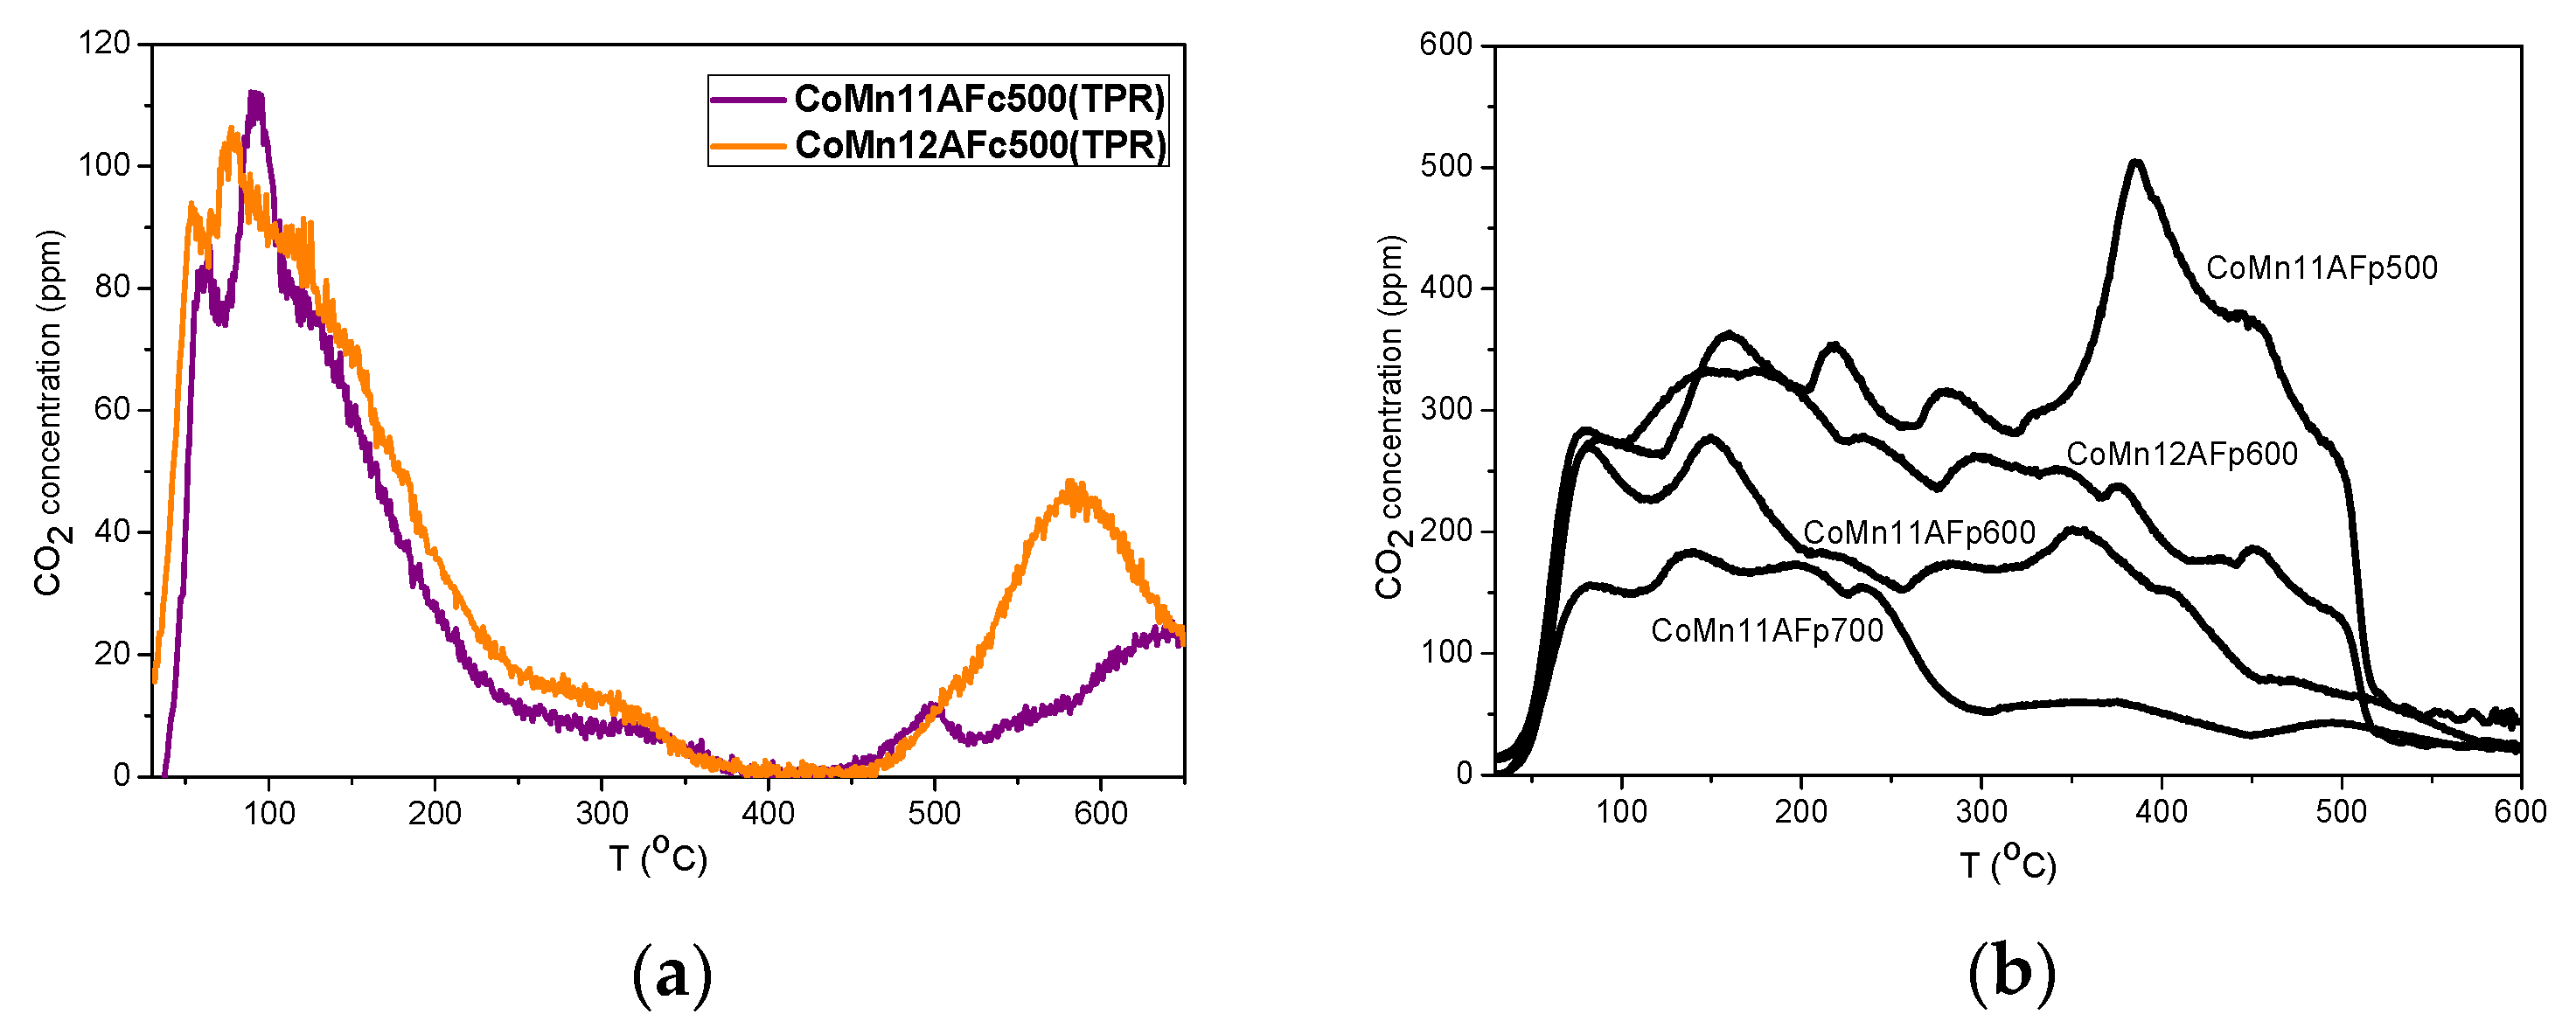
2.1. TPD of Adsorbed CO or CO2

No significant CO adsorption was found on the catalysts (both pyrolyzed and preoxidized ones) following exposure to CO at room temperature. As an example, TPD results following CO adsorption on the CoMn11AFp600 catalyst at 25 and 150 °C are presented in Figure 1a,b. The curve called “blank” corresponds to the amounts of CO and CO2 observed during TPD without any prior CO adsorption. CO and CO2 production in the blank experiment is due to residual decomposition of organic species originating from the fumarate precursor. It can be observed that after adsorption of CO at room temperature, there is minimal desorption of CO during TPD (less than 20 ppm of CO in the gaseous stream) and no CO2 desorption. Following CO adsorption at 150 °C, both CO and CO2 were found in the TPD profile. CO desorbs in the form of two peaks at 50 °C and 140 °C, while CO2 appears with a main peak at 200 °C followed by a shoulder at 350 °C and a smaller peak at 500 °C. The origin of CO2 could be either the Boudouard reaction or oxidation of adsorbed CO by surface oxygen. Based on literature findings, the occurrence of the Boudouard reaction is highly probable. For example, formation of carbon on a Co/Al2O3 catalyst by CO disproportionation at 230 °C has been reported by Nakamura et al. [32]. This temperature is in the same range as the one shown in Figure 1b regarding CO2 formation. CO disproportionation on Co/MgO catalysts has been found to take place already at room temperature [24]. Since the catalyst samples of this work, however, contain carbon in their composition (residual carbon from fumarate pyrolysis), it is not possible to measure any carbon formed on the catalysts from CO disproportionation via subsequent temperature-programmed oxidation.
The corresponding results of TPD following CO2 adsorption at 25 °C on catalysts prepared via oxidation and oxidation/reduction or pyrolysis are given in Figure 2a,b, respectively. CO2 profiles from oxidized/reduced catalysts (Figure 2a) show a main peak at ~100 °C and a smaller high temperature peak above 500 °C. CO2 profiles from pyrolyzed catalysts are quite complicated and broad from 30 to 600 °C with multiple desorption peaks. The population of sites that adsorb CO2 strongly appears to decrease with increase of pyrolysis temperature and this leads to concomitant decrease of the amount of desorbed CO2 with increase of pyrolysis temperature. More specifically, the amount of desorbed CO2 is 240 μmol·g−1 for CoMn11AFp500 and decreases to 100 and 57 μmol·g−1 for catalysts prepared by pyrolysis at 600 and 700 °C, respectively. At the same time, the specific surface area of pyrolyzed samples is more or less independent of pyrolysis temperature in the range of 200–220 m2·g−1, as measured by the BET method. This indicates that pyrolysis temperature affects mostly active sites for adsorption of CO2 and not the exposed surface area in general. The amount of adsorbed CO2 on catalysts prepared by oxidation/reduction is 17–19 μmol·g−1, i.e., considerably smaller than the one found over the pyrolyzed catalysts. This is in line with the smaller specific surface area of these samples by one order of magnitude.

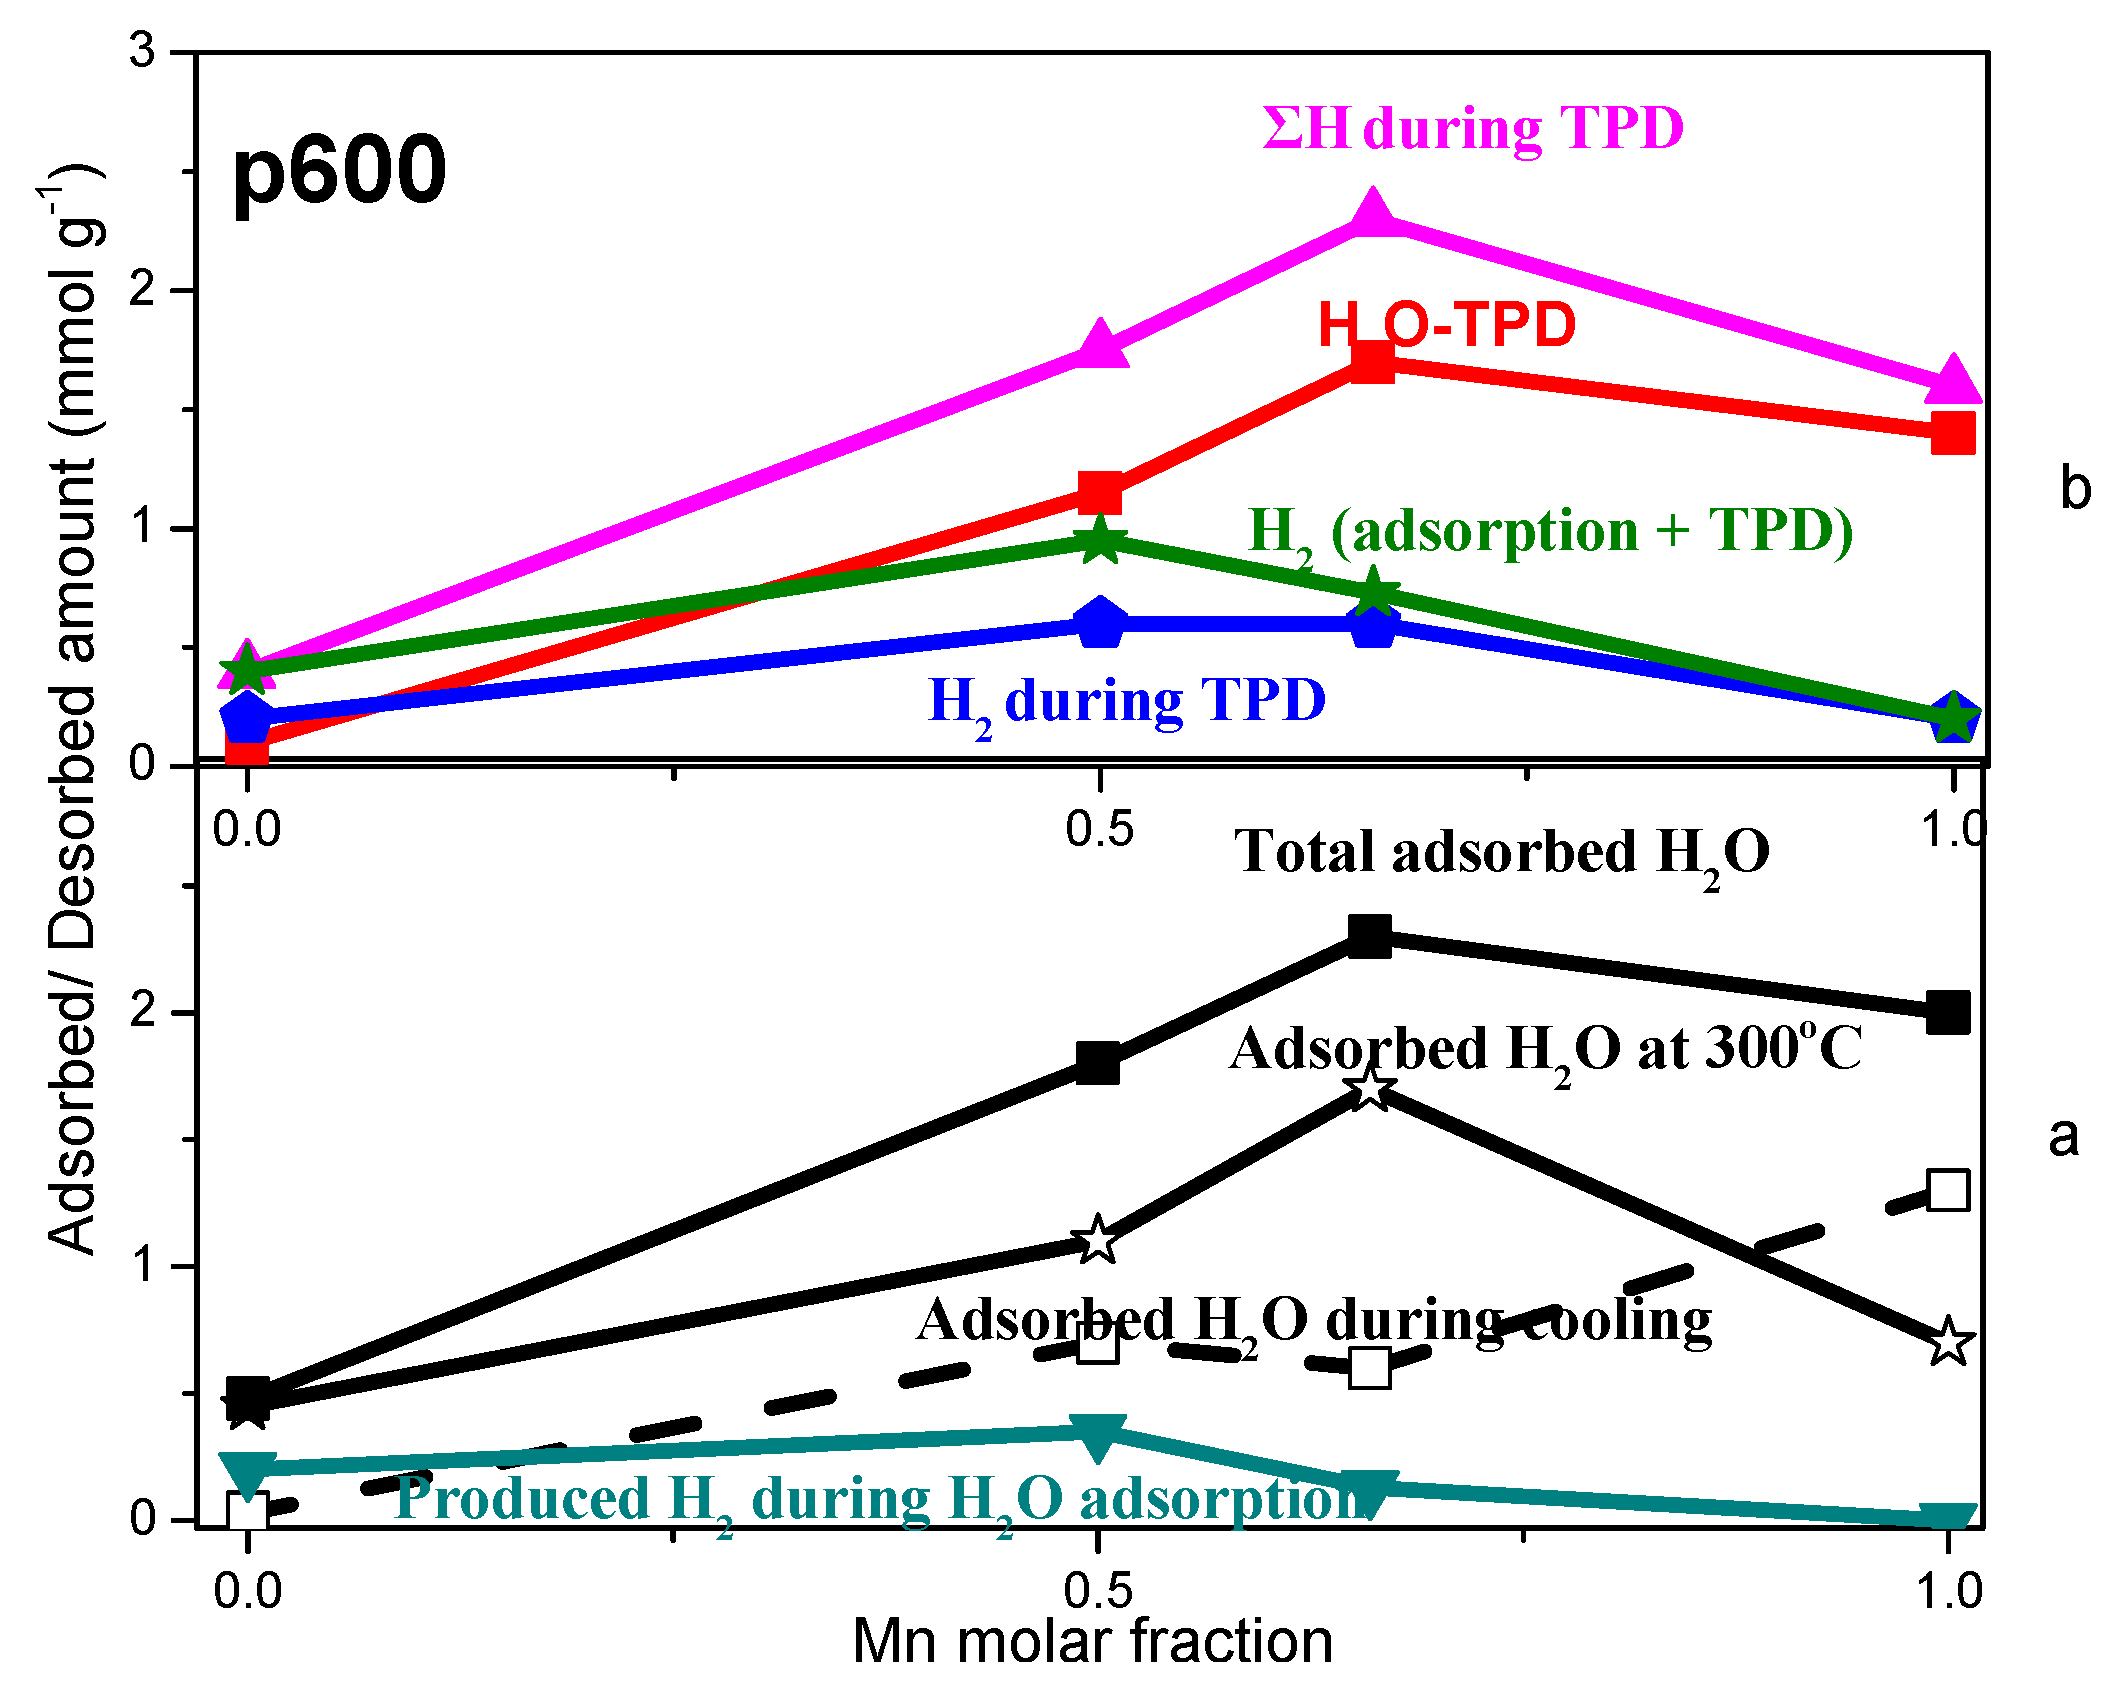
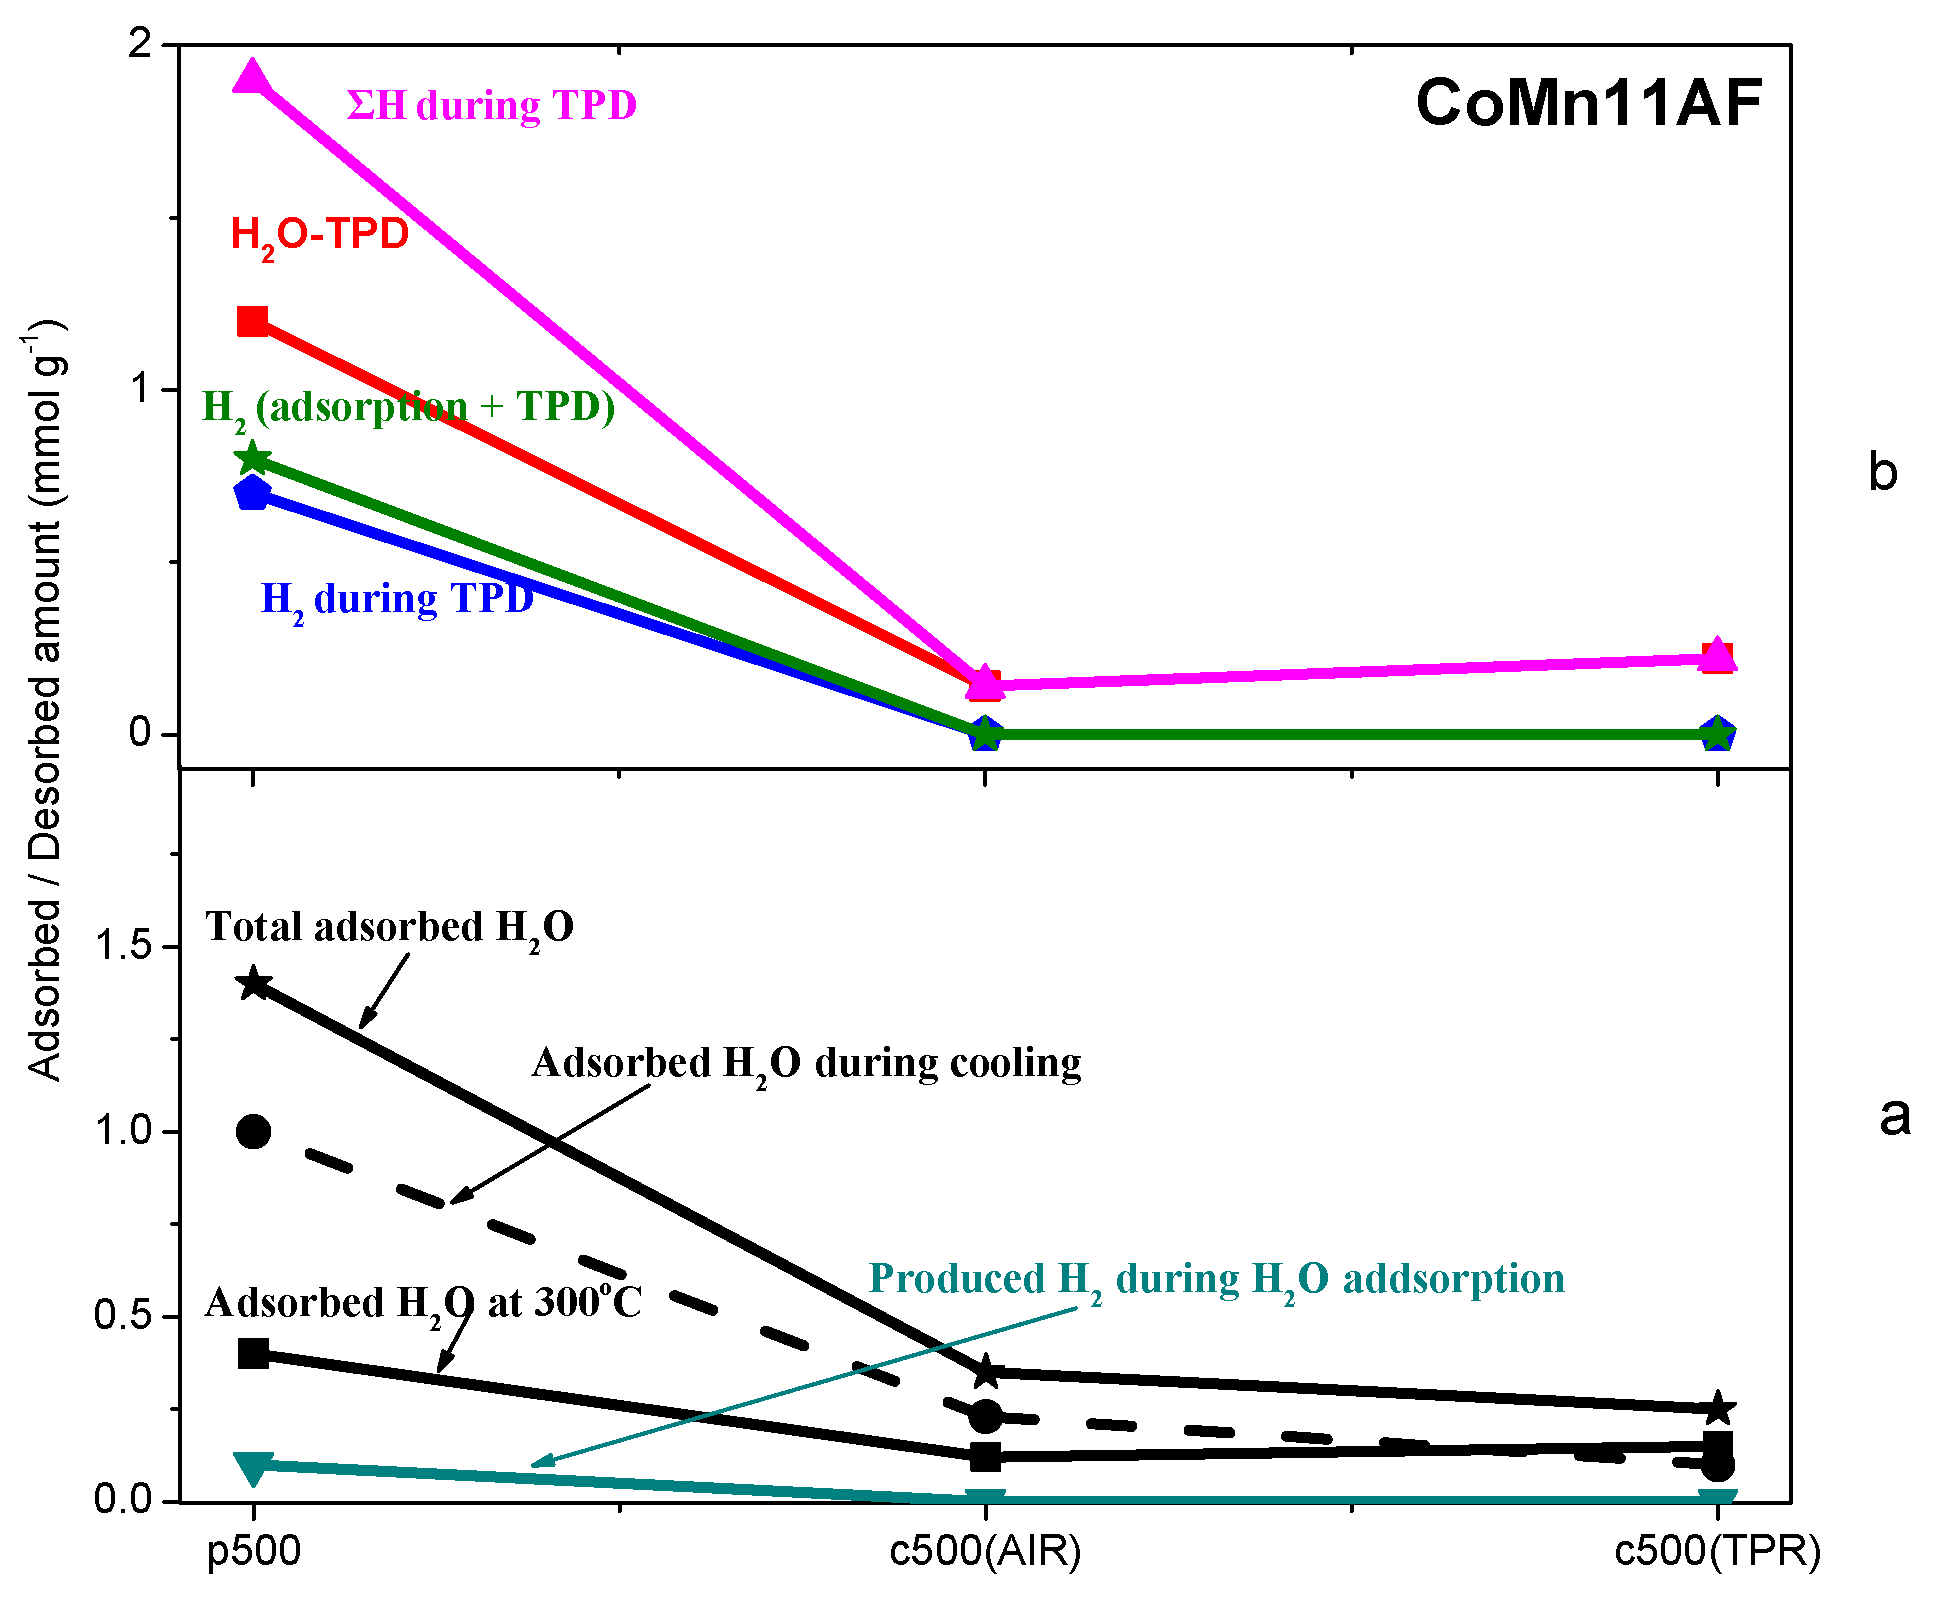
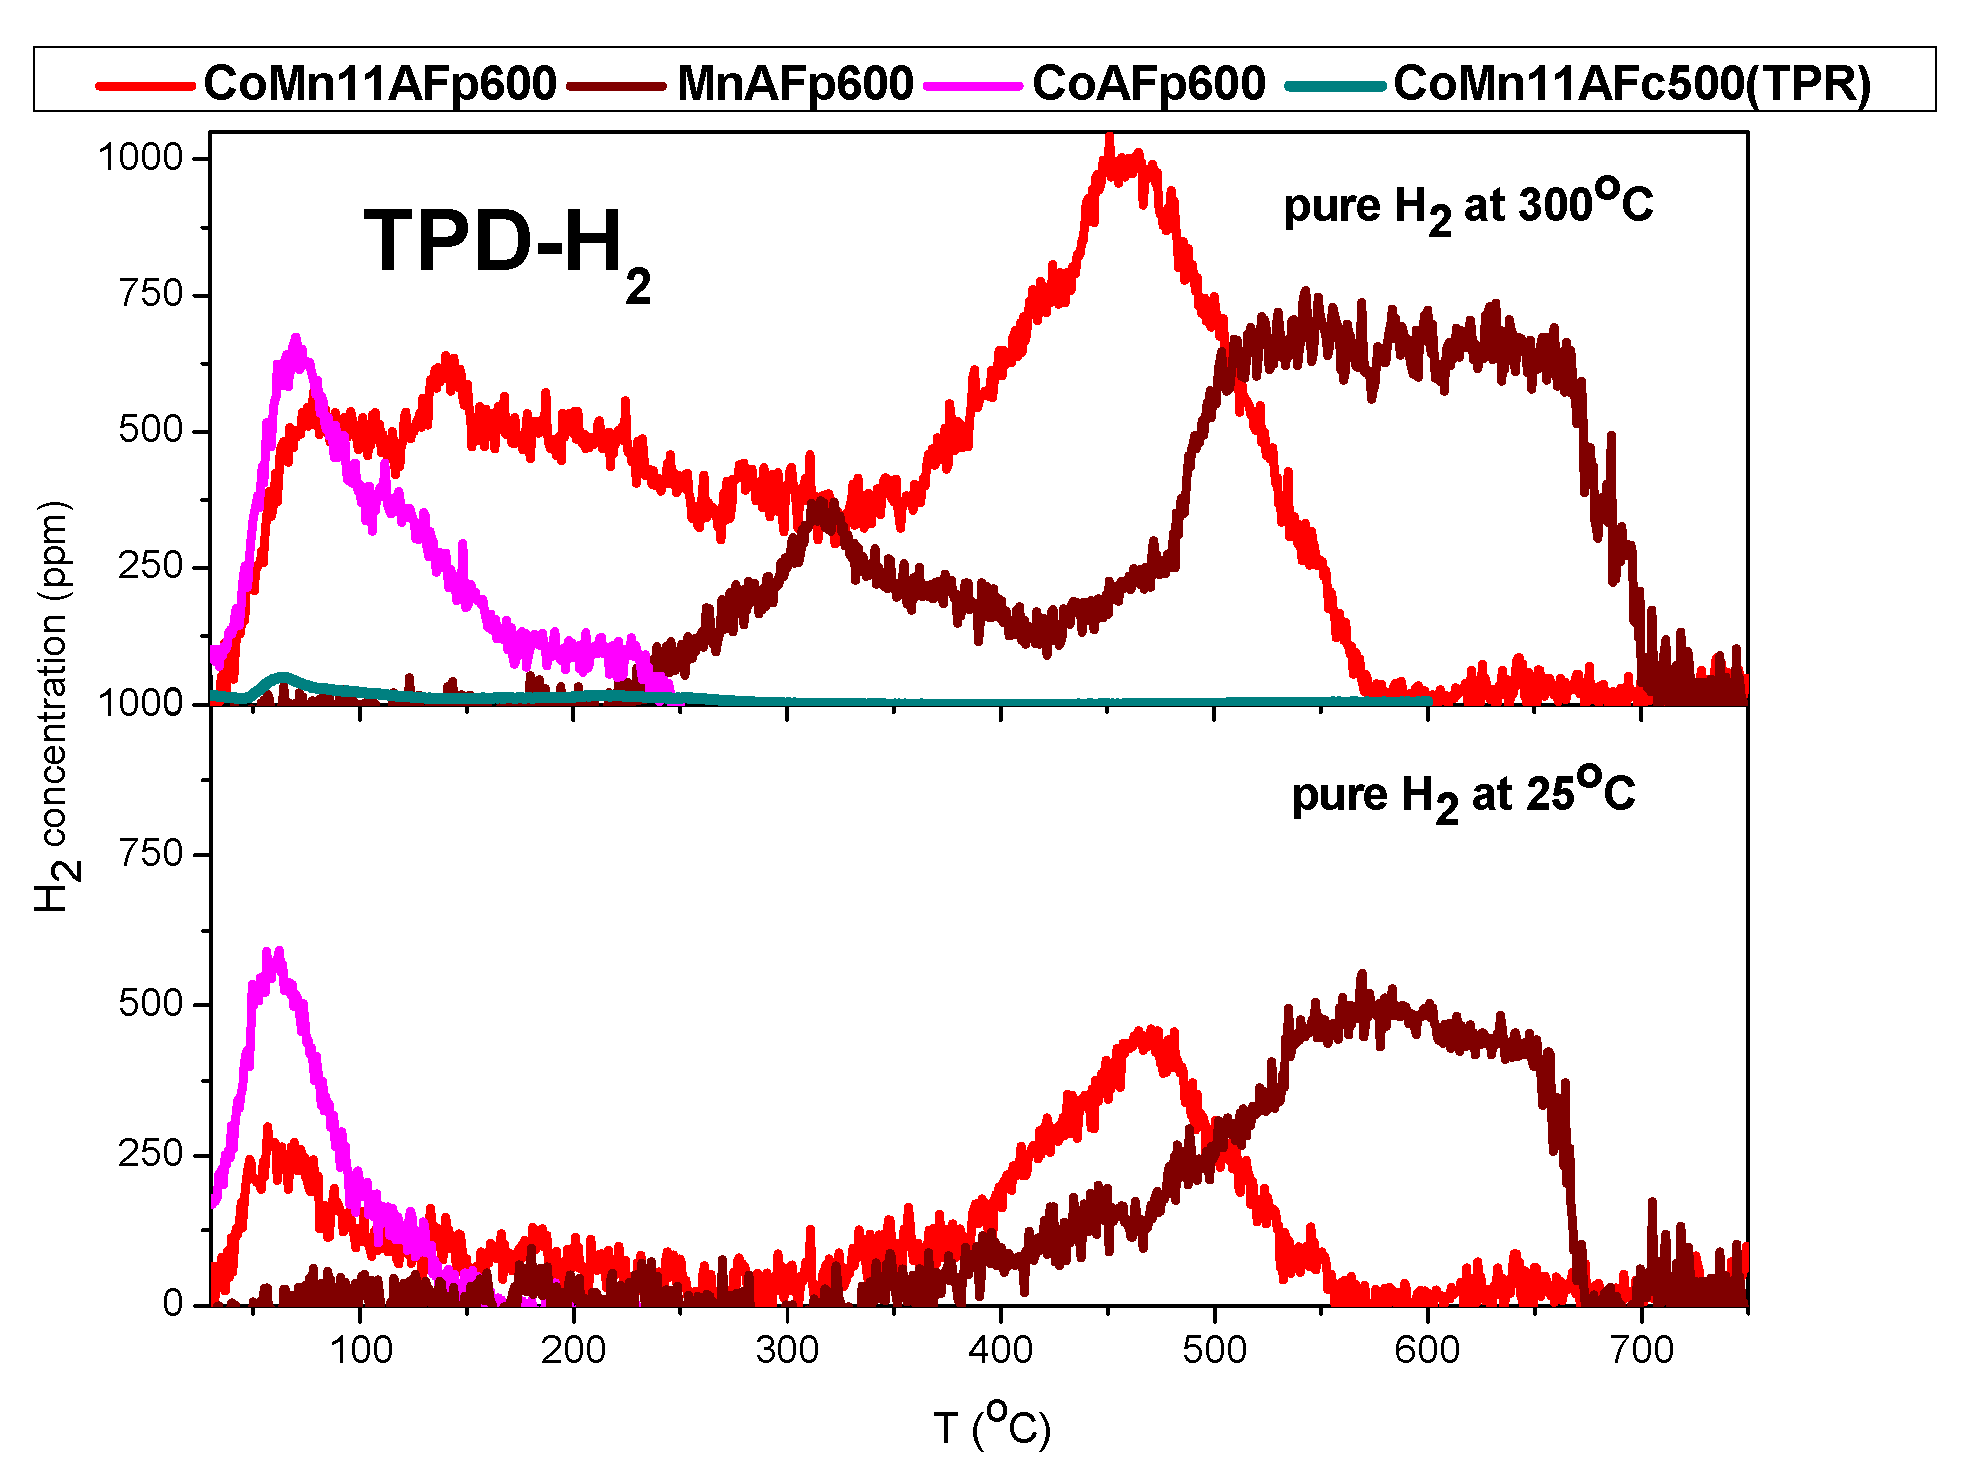
2.2. TPD of Adsorbed H2

H2-TPD studies were carried out following H2 adsorption at 25 or 300 °C under a flow of pure hydrogen. Representative TPD profiles of hydrogen are presented in Figure 3. The oxidized/reduced sample (CoMn11AFc500(TPR)) adsorbed no measurable amount of hydrogen at room temperature and trace amounts at 300 °C. The pyrolyzed cobalt-only sample indicates the presence of rather weakly bound hydrogen desorbing with peak at ~70 °C. Increase of adsorption temperature to 300 °C leads to population of more strongly-bound adsorbed hydrogen, as evidenced by the appearance of a shoulder at 100–200 °C. TPD profiles from the manganese-only sample show the presence of strongly-bound hydrogen desorbing in the range of 400–650 °C after adsorption at room temperature. Increase of adsorption temperature to 300 °C leads to the appearance of an intermediate-strength state with desorption at ~300 °C. The TPD profile from the CoMn11AFp600 sample, which contains both cobalt and manganese, incorporates features that are attributable to the presence of both cobalt crystallites and MnO. Strongly-bound hydrogen desorbs at 460 °C and is larger in quantity compared to the manganese-only sample. Therefore, the observed profile is not just the sum of isolated contributions of cobalt and MnO species, but is influenced by mutual interactions. Table 1 presents the amounts of desorbed hydrogen during TPD after adsorption at 25 and 300 °C. The oxidized catalyst which had been reduced prior to H2 adsorption adsorbs no H2 at room temperature and 10 μmol·g−1 at 300 °C, which is one to two orders of magnitude smaller than the corresponding values of catalysts from the same precursor prepared by pyrolysis. Concerning the effect of adsorption temperature, it is observed that the amount of desorbed hydrogen increases by up to 350% with increase of adsorption temperature from 25 to 300 °C. The smallest increase is found for the sample adsorbing the largest amount of hydrogen at room temperature, i.e., CoMn11AFp600. The amounts of desorbed hydrogen in samples containing both cobalt and manganese are considerably larger than the ones found over single-component samples, indicating the presence of synergy and creation of additional adsorption sites. Contrary to what was found in the case of CO2 adsorption, the amount of adsorbed hydrogen does not decrease with increase of pyrolysis temperature, indicating that at least some of the adsorption sites for hydrogen and CO2 are not identical. Using the data in Table 1, estimates of the maximum dispersion of cobalt in the various catalysts can be provided assuming that no adsorption takes place on MnO sites in the case of Co-Mn catalysts. Taking that the stoichiometry of hydrogen adsorption is one hydrogen atom per one surface cobalt atom, the dispersion (H/Co) ratio is ~2% for the cobalt-only catalyst and becomes even higher than 20% for Co-Mn catalysts pyrolyzed at 600 °C.
H2-TPD results for the cobalt-only catalysts are in agreement to those reported by Popova and Babenkova for thermal desorption of preadsorbed hydrogen on a-Co and b-Co prepared by formate decomposition in a hydrogen flow at 300, 350 and 600 °C, whereas hydrogen desorption was completed at 300 °C [24].

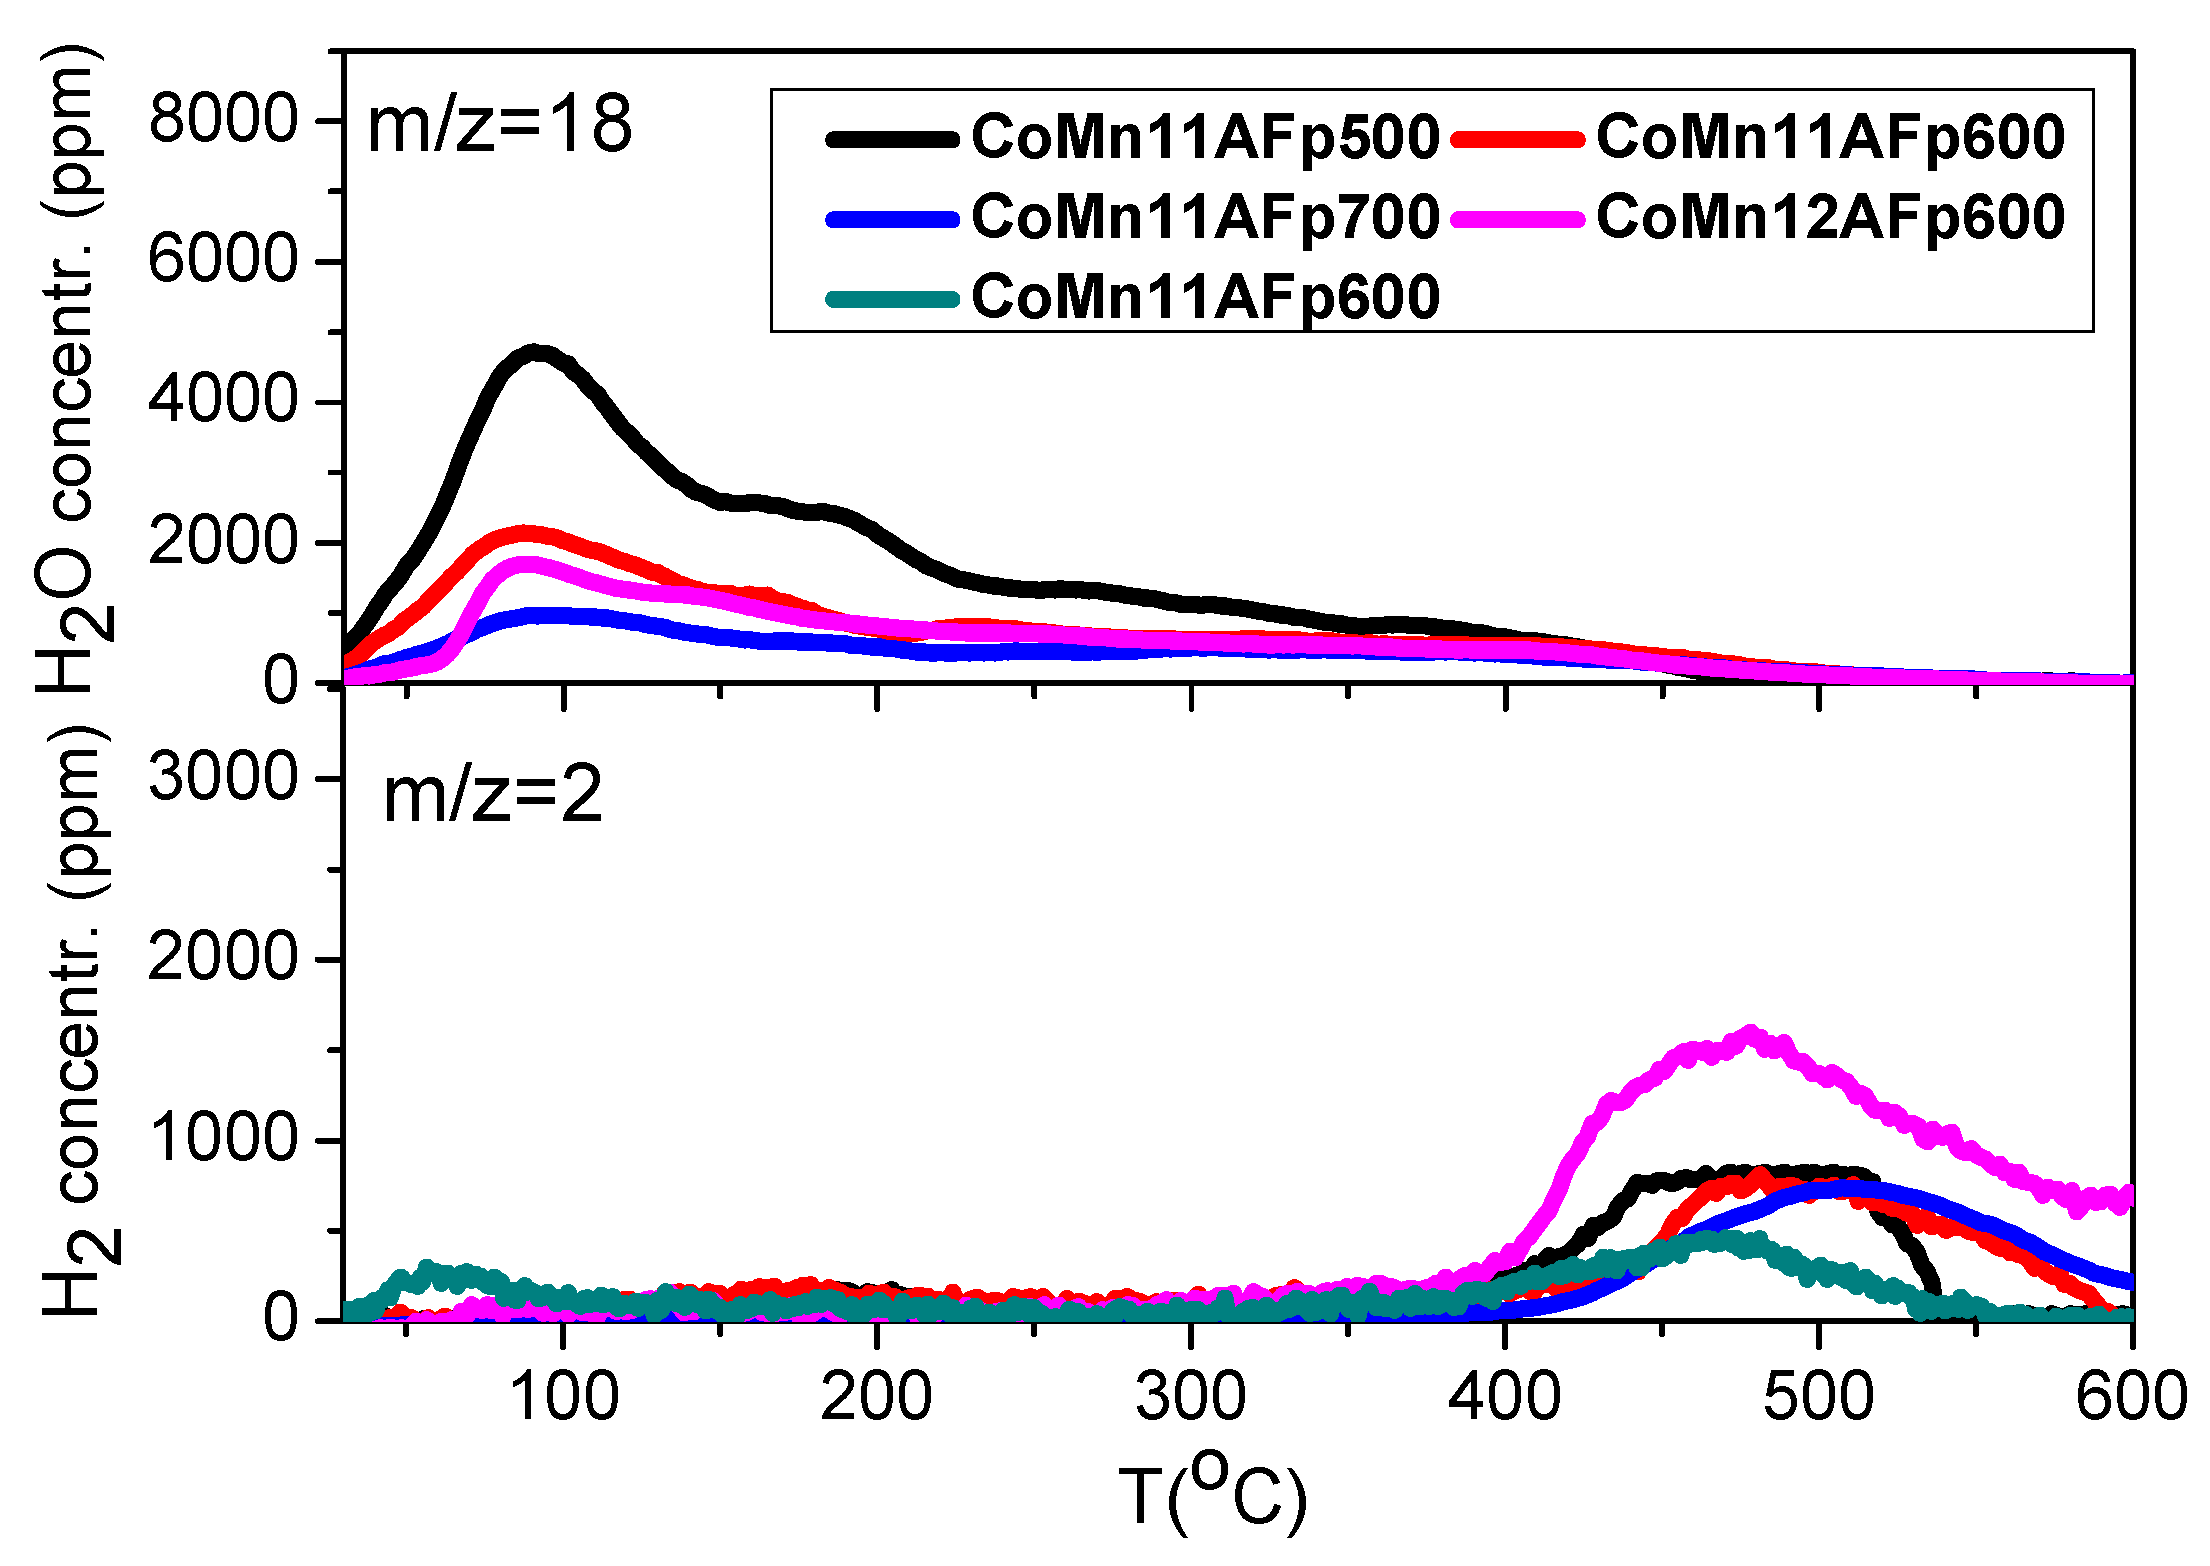
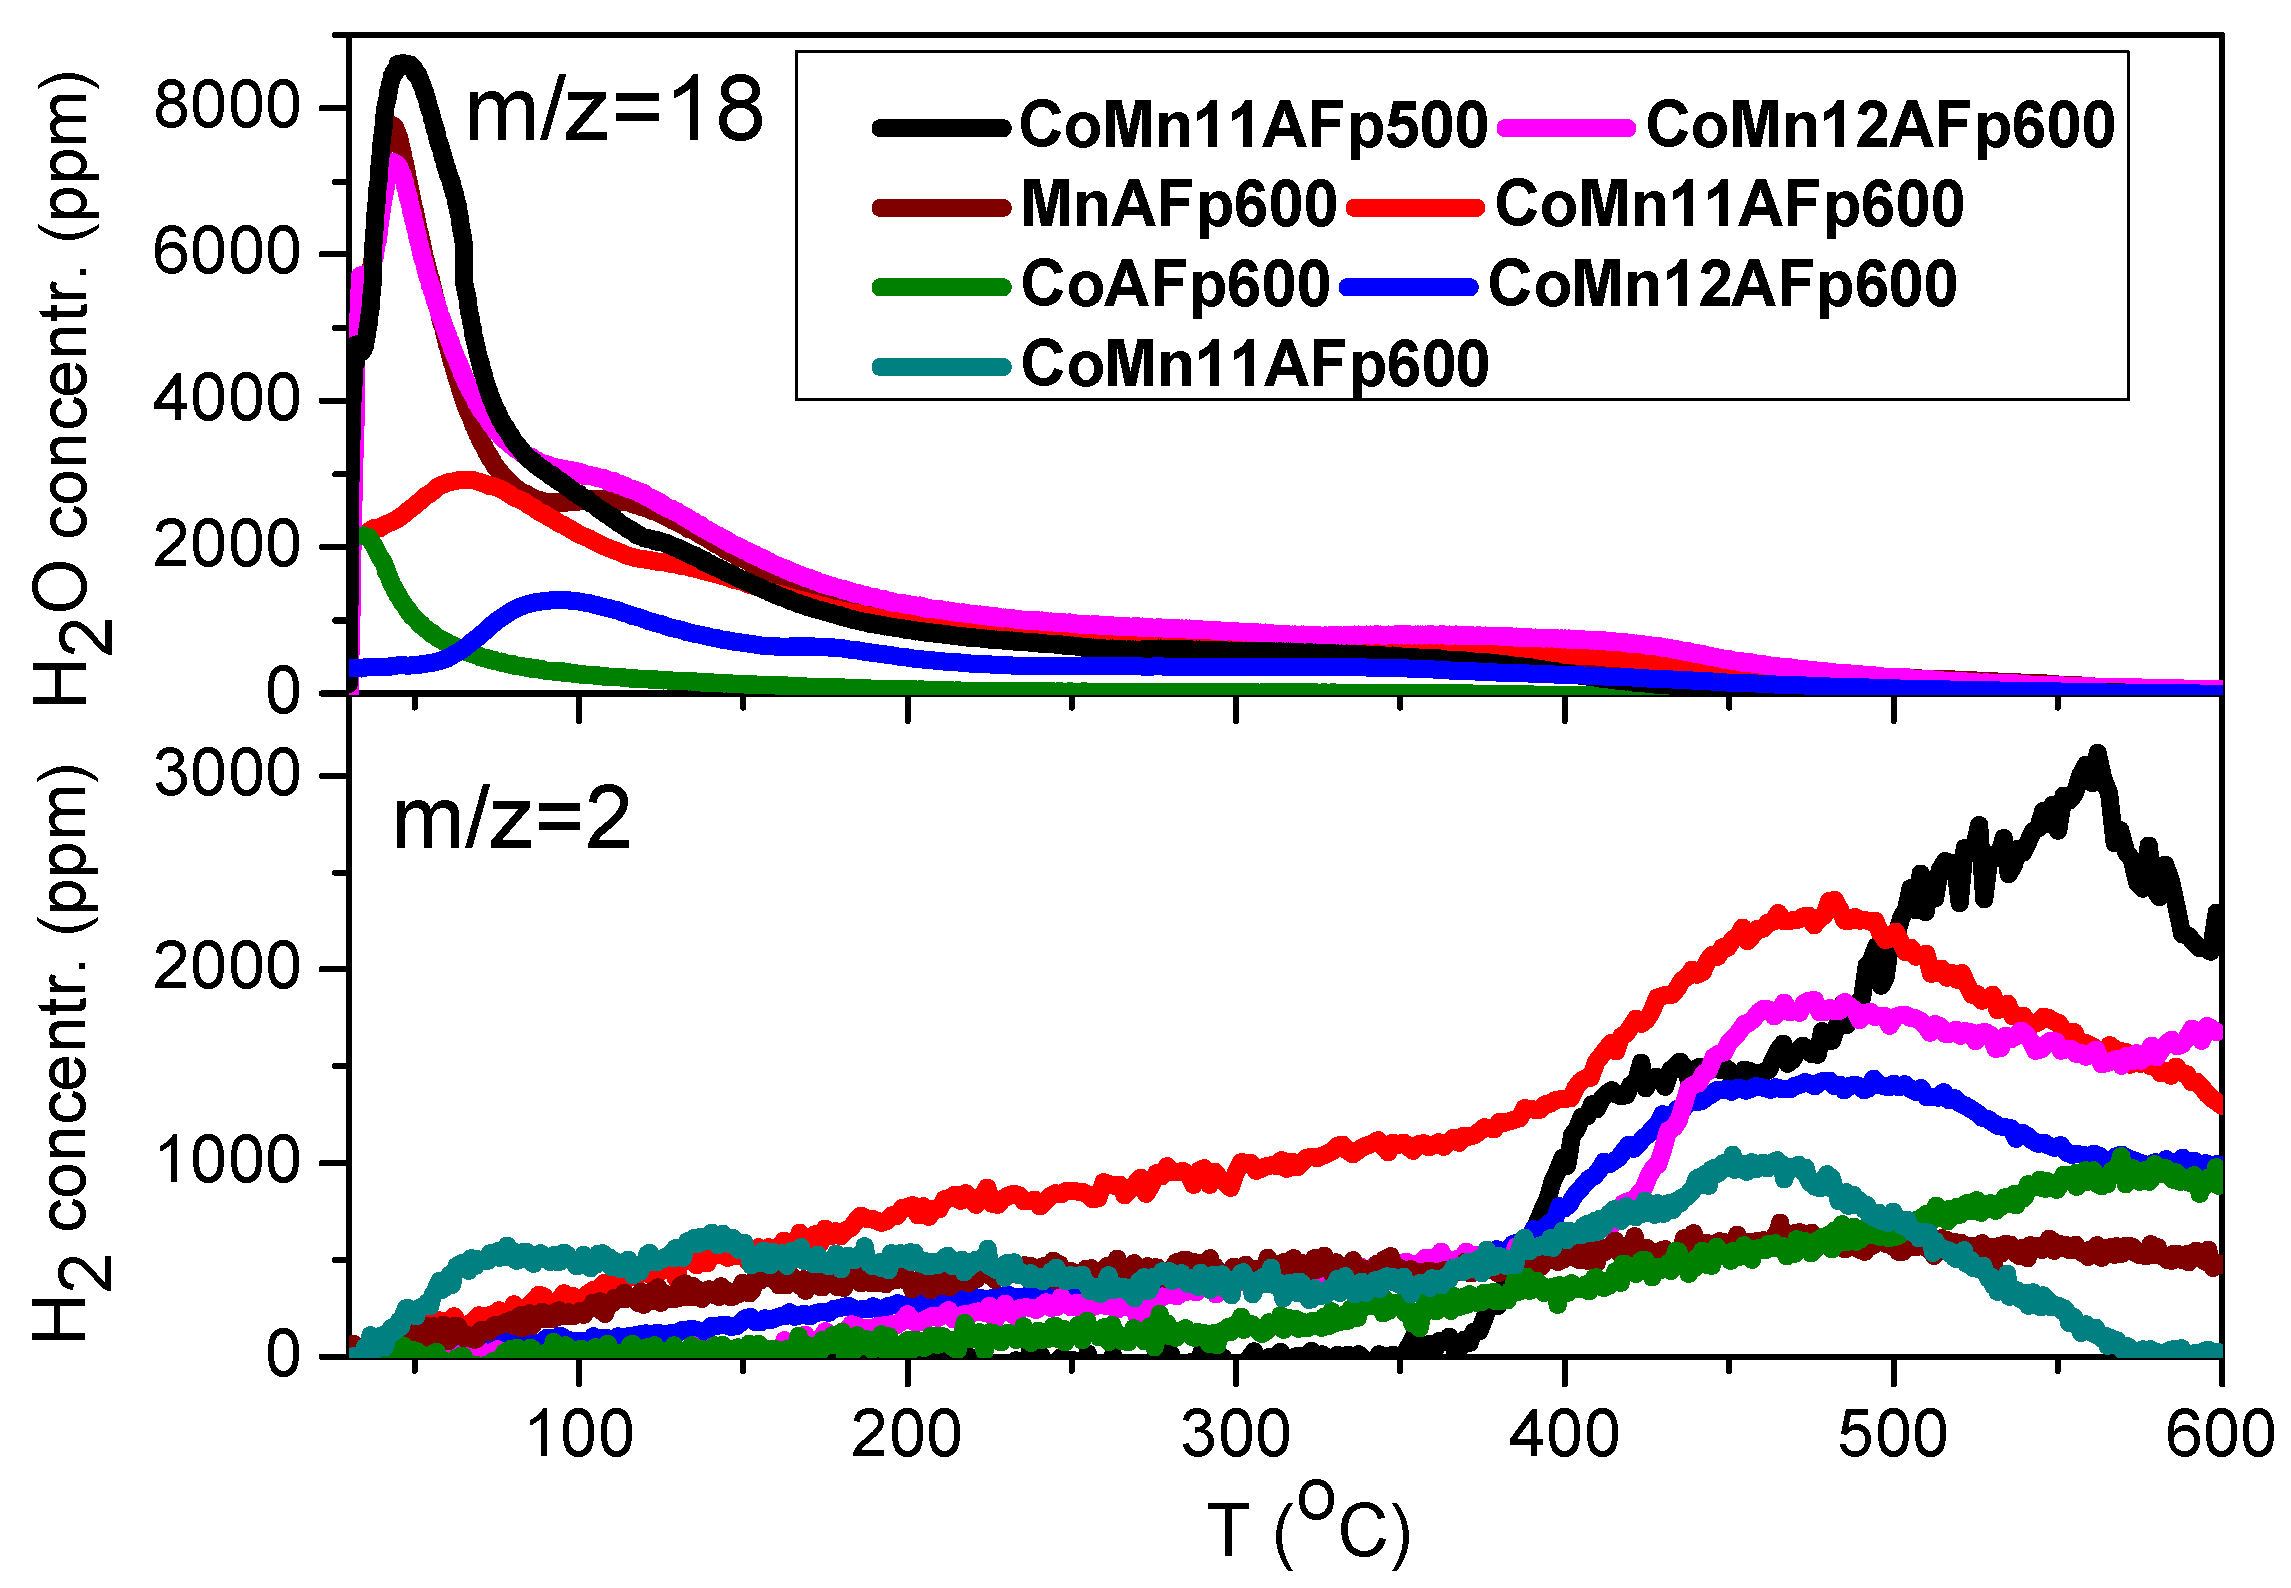
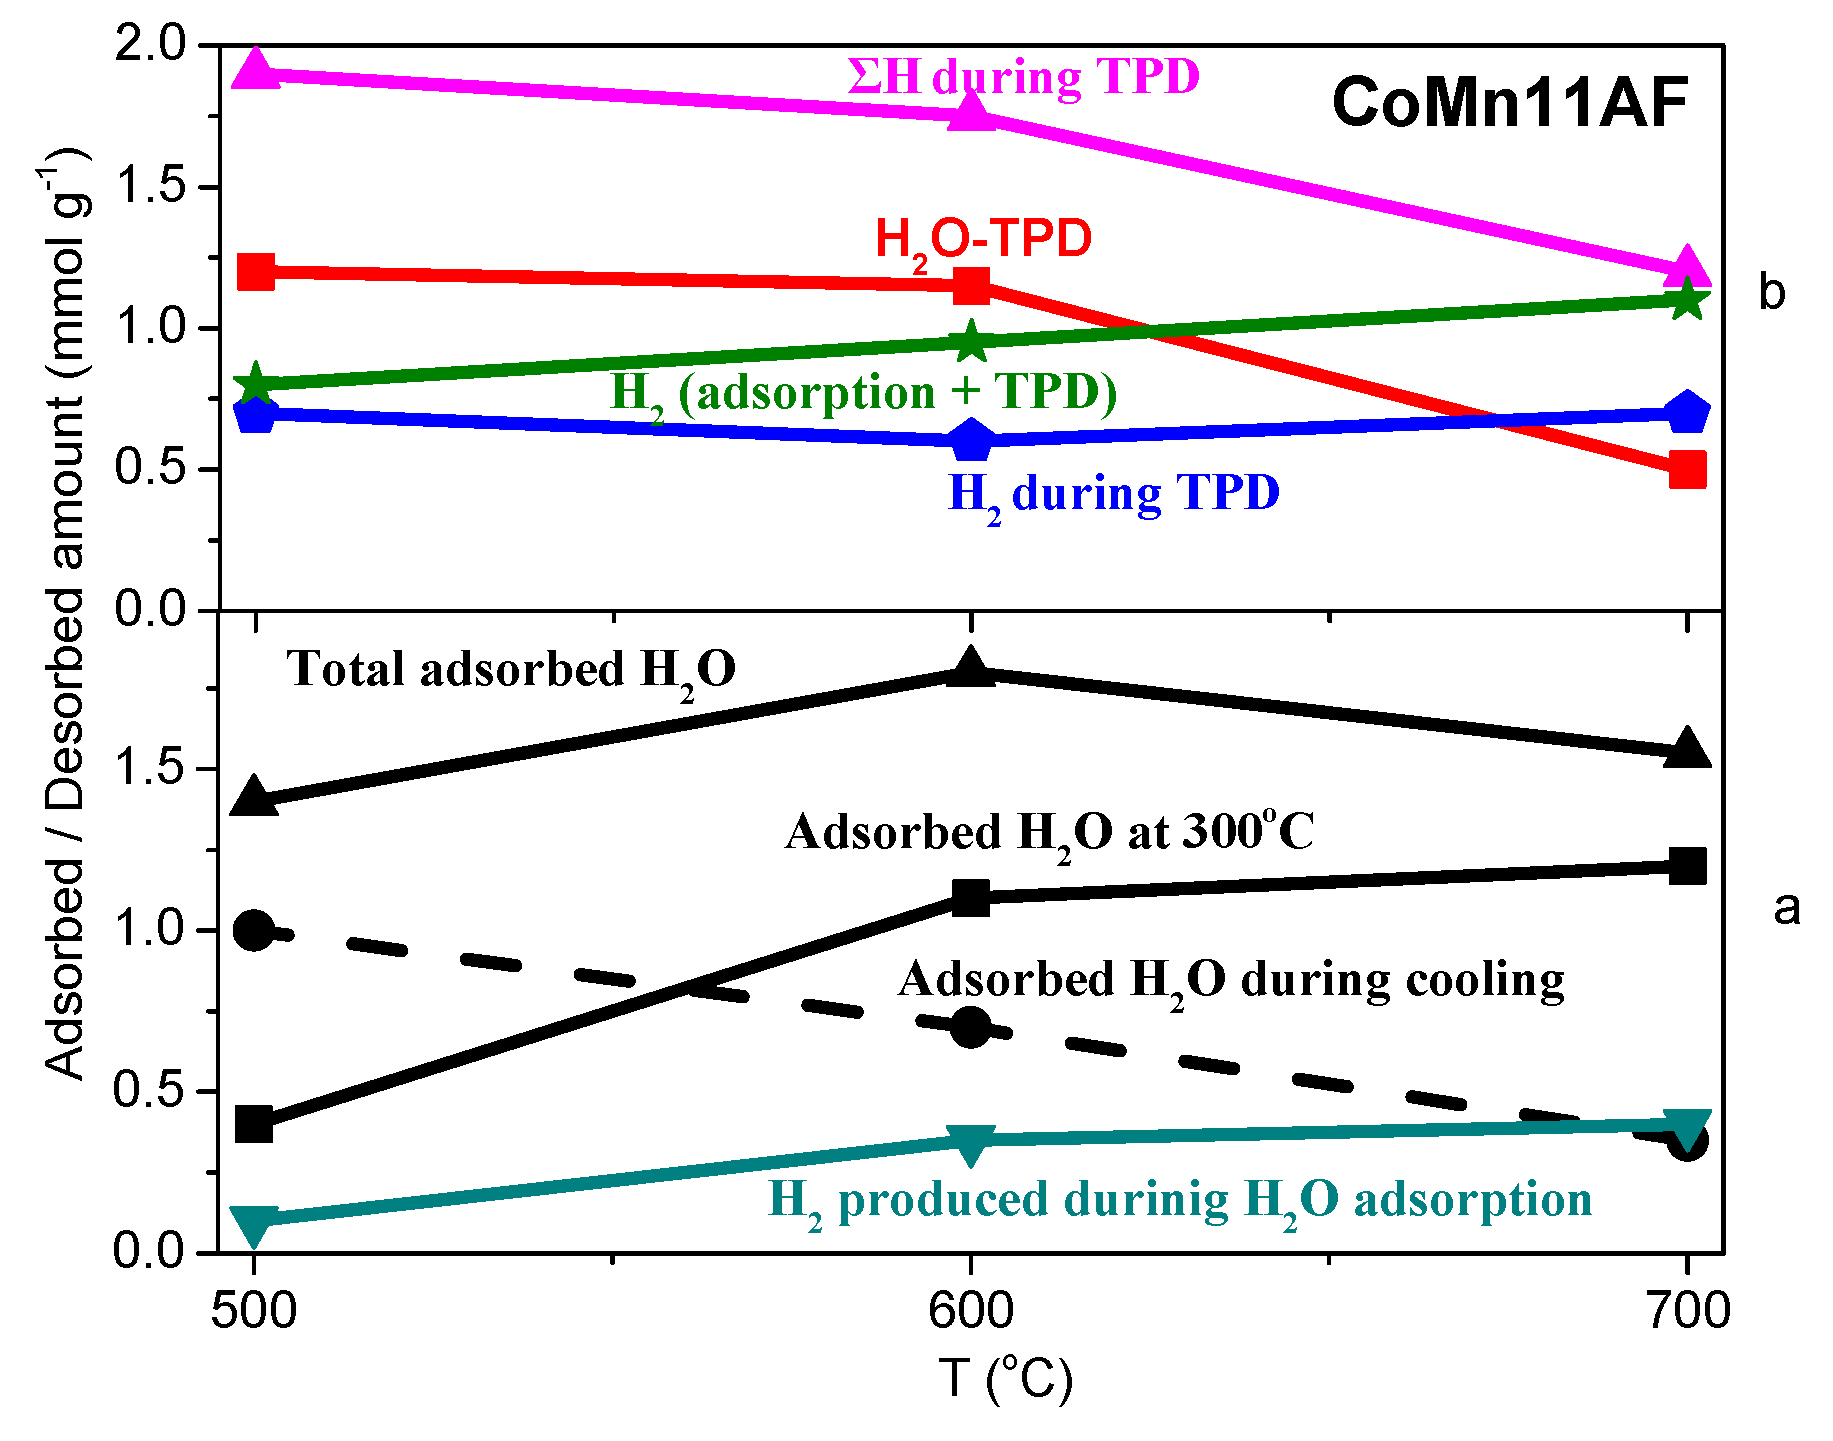
2.3. TPD of Adsorbed H2O

Water adsorption was carried out at 25 and 300 °C. A characteristic feature of water adsorption at 300 °C over catalysts prepared by pyrolysis is the accompanying appearance of hydrogen in the gas phase indicative of reactive adsorption according to:
Co + H2O → Co–(O) + H2
TPD profiles of H2O and H2 after water adsorption at room temperature over pyrolyzed catalysts are shown in Figure 4. H2O profiles are characterized by a main peak with maximum at 90–100 °C followed by a broad descending feature up to 450 °C. Increase of pyrolysis temperature leads to decrease of the amount of adsorbed water. This trend is analogous to what was found for CO2 adsorption (Section 2.1). The profiles of H2 during TPD after water adsorption at room temperature over pyrolyzed catalysts are also presented in Figure 4. Hydrogen desorption is observed mostly above 400 °C with CoMn11AFp600 catalyst showing also minor hydrogen desorption at 60 °C. Since TPD profiles following H2 adsorption are characterized by hydrogen peaks in the 400–600 °C range, it is not clear whether appearance of hydrogen in the gas phase is desorption or reaction limited. However, taking into account that water decomposition does take place at 300 °C, it is most probable that the profile of hydrogen is desorption limited. In addition, the absence of hydrogen in the low-temperature range implies that adsorbed water decomposition takes place at temperatures higher than ~150 °C. The amount of produced hydrogen during H2O-TPD was 0.2–0.3 mmol·g−1 while the amount of desorbed hydrogen after its adsorption at room temperature was 0.17–0.33 mmol·g−1. This implies that the extent of adsorbed water decomposition is related to the number of surface centers available for adsorption of produced H2.
Water adsorption at 300 °C was accompanied by gaseous H2 production for all pyrolyzed catalysts with the exception of MnAFp600. TPD profiles of H2O and H2 after water adsorption at 300 °C over pyrolyzed catalysts are shown in Figure 5. TPD profiles of water consist of a main peak at 60–100 °C followed by a tail up to 500 °C. The profiles of hydrogen during TPD are quite broad and they show measurable desorption of hydrogen at the whole temperature range from 30 to 600 °C. These are in general agreement to TPD profiles obtained following adsorption of hydrogen at 300 °C.
Quantitative results of the total adsorbed water (mmol·g−1) at 300 °C (sum of water absorbed at 300 °C and during cooling to RT), hydrogen produced during H2O adsorption, and subsequent TPD as a function of catalyst content in Mn are given in Figure 6a,b. The total adsorbed water is four times higher on MnAFp600 than on CoAF600, although this difference is mostly due to water adsorbed during cooling. The highest amount of water adsorption is, however, observed over the Co-Mn catalysts. In an analogous manner, the amount of formed H2, i.e., the sum of hydrogen produced during adsorption and desorbed during TPD, is considerably higher over the Co-Mn catalysts compared to the cobalt-only catalyst and especially to the Mn-only sample.
The CoAFp600 catalyst contains 11.6 mmol Co·g−1 and produced 0.4 mmol H2·g−1 during water adsorption and TPD. Assuming one adsorbed hydrogen atom per surface cobalt atom, the resulting H/Co ratio is 0.069. The corresponding H/Co ratio for hydrogen adsorption at 300 °C is 0.021 (Table 1). In the case of the CoMn11AFp600 catalyst, the total amount of hydrogen was 0.8 mmol·g−1, which compares well with the amount of hydrogen adsorbed during hydrogen adsorption (0.66 mmol·g−1).
The effect of pyrolysis temperature of the CoMn11AF catalyst on adsorbed/desorbed water and H2 amounts is presented in Figure 7a,b, respectively. It can be observed that although the amount of total adsorbed water does not change appreciably with variation of pyrolysis temperature, there are changes in the “strength” of water adsorption. Thus, the amount of water desorbed during TPD decreases, because there is an increase in the amount of weakly adsorbed water, which desorbs already at room temperature before initiation of the TPD run. Similarly, the amount of water adsorbing during cooling decreases and the amount of water adsorbing at 300 °C increases with increase of pyrolysis temperature. This also relates to the fact that the extent of cobalt reduction increases with increase of pyrolysis temperature.
The effect of catalyst activation procedure on quantitative behavior of water adsorption is presented in Figure 8. Three catalysts are compared, all activated at 500 °C: CoMn11AFp500 prepared by pyrolysis, CoMn11AFc500(AIR) prepared by oxidation of the precursor and CoMn11AFc500(TPR) prepared from CoMn11AFc500(AIR) by subsequent reduction by H2 up to 600 °C. The two latter catalysts adsorb significantly less water than CoMn11AFp500 and, in addition, they produce almost no hydrogen during exposure to water at 300 °C.

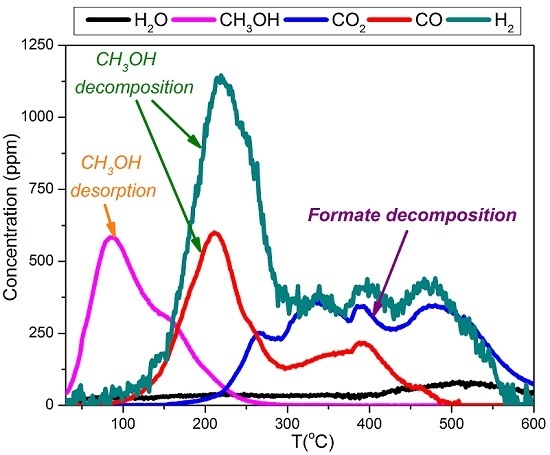
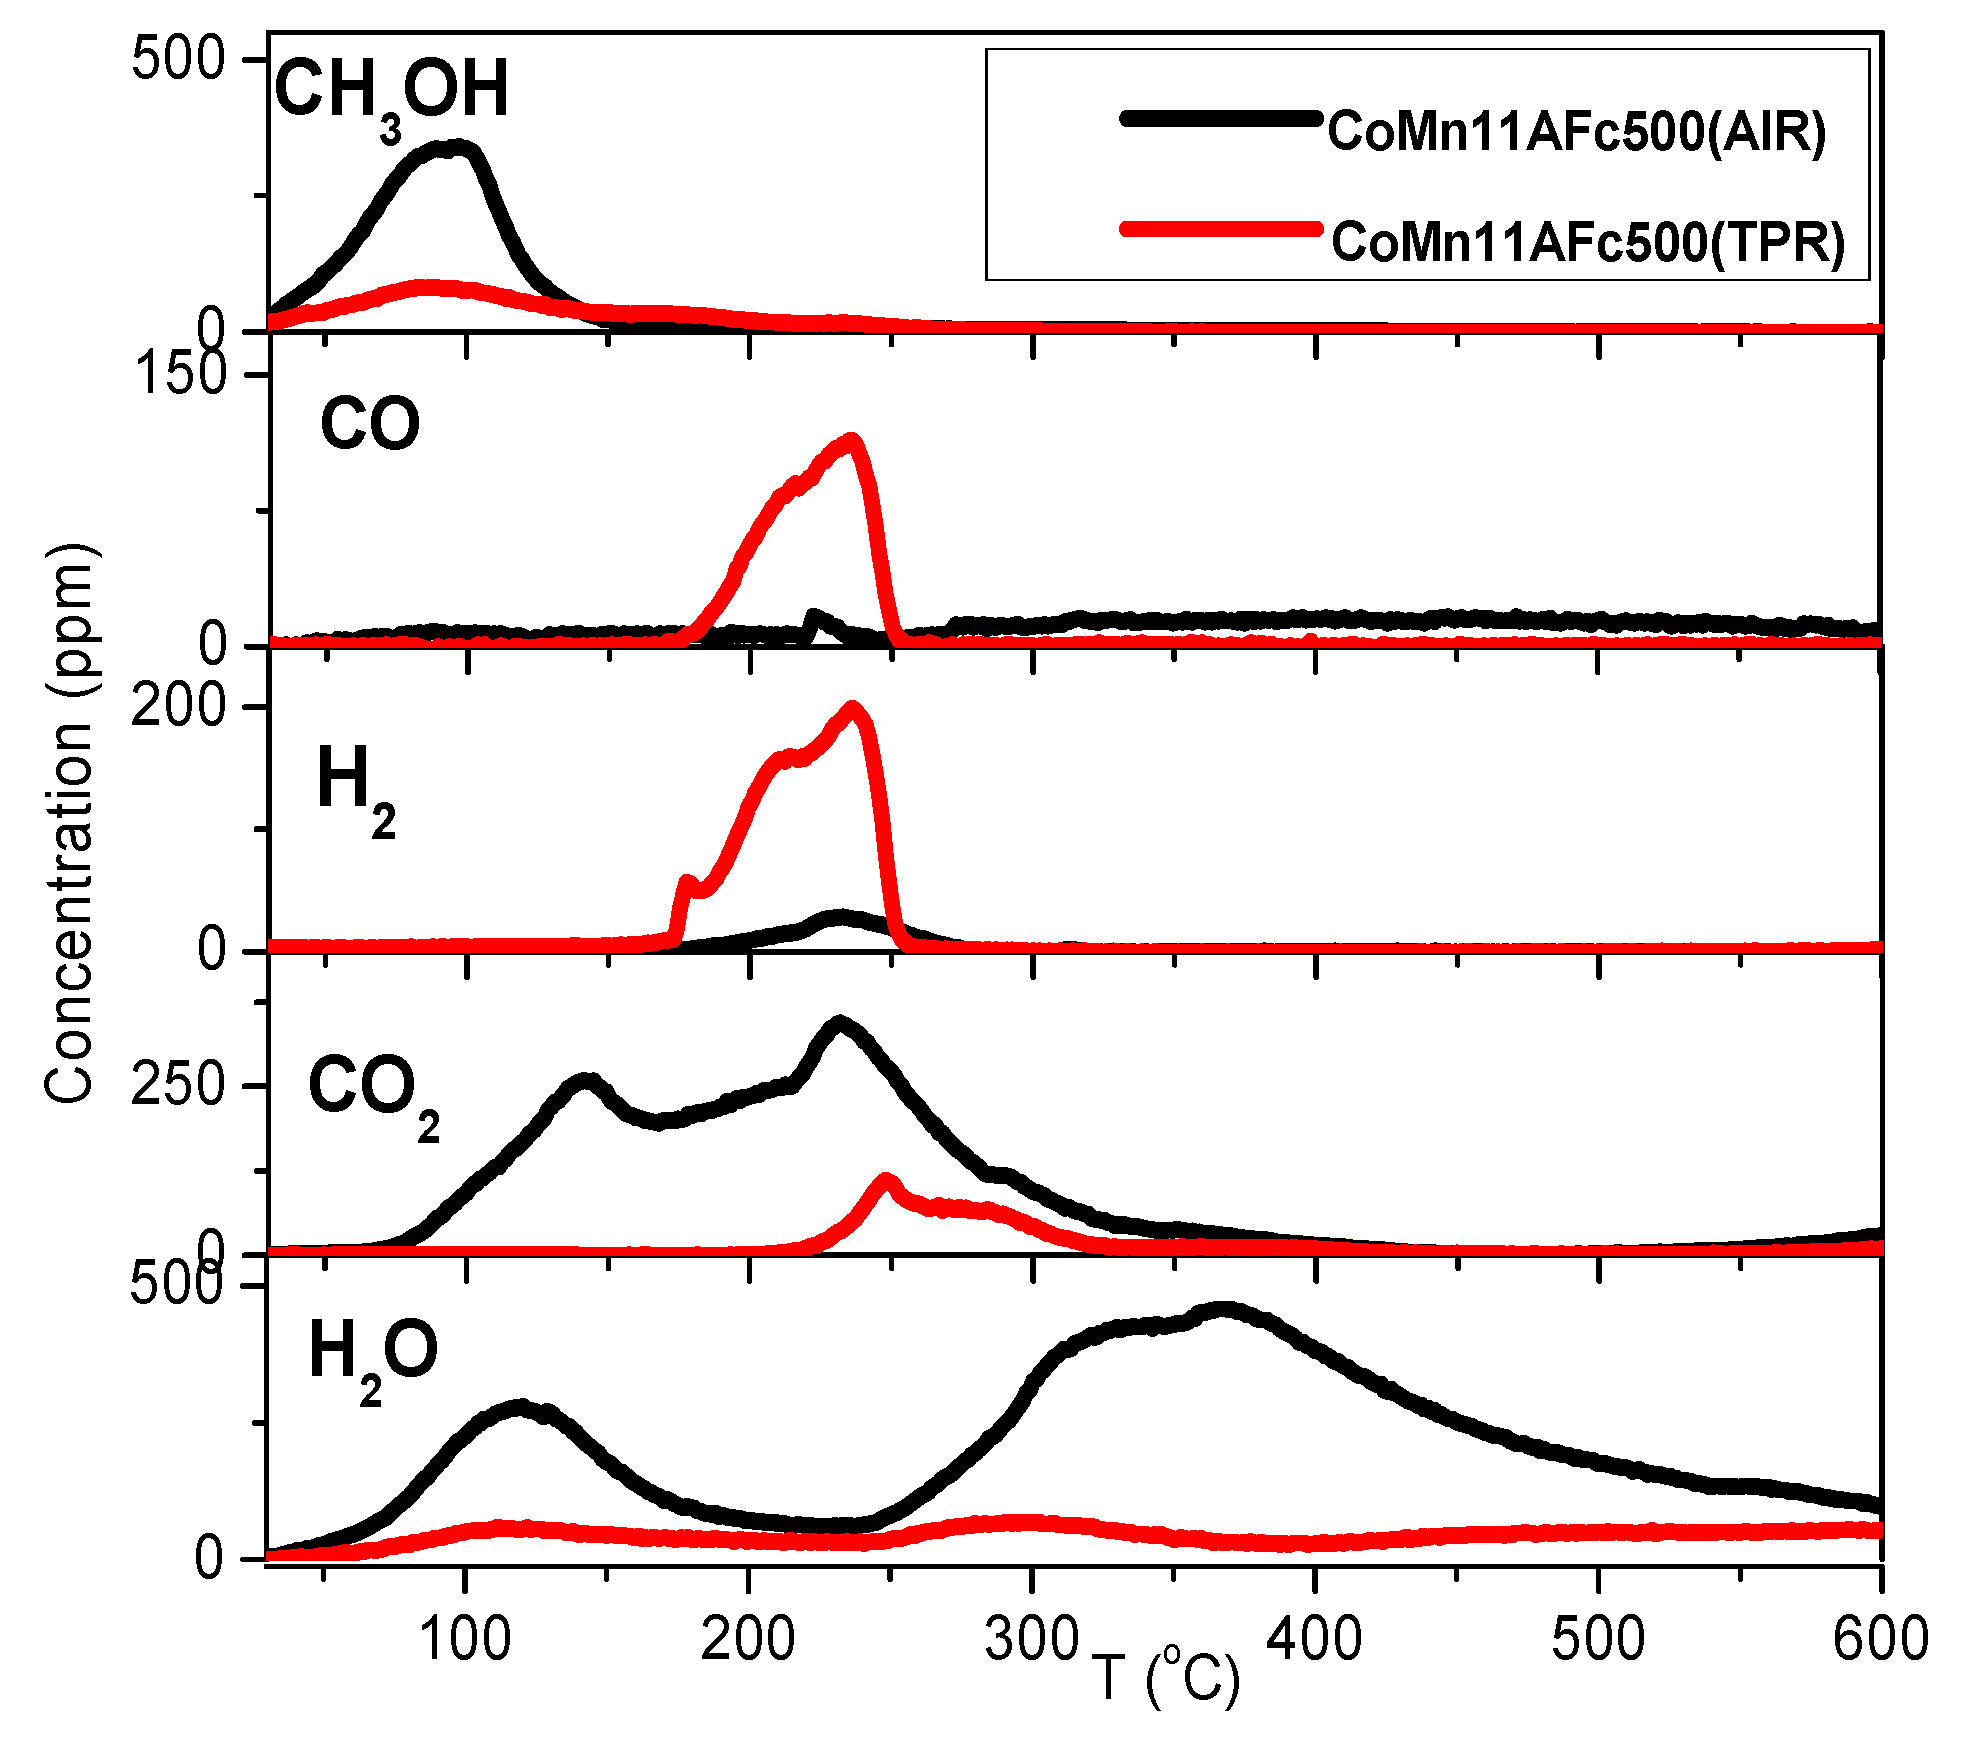
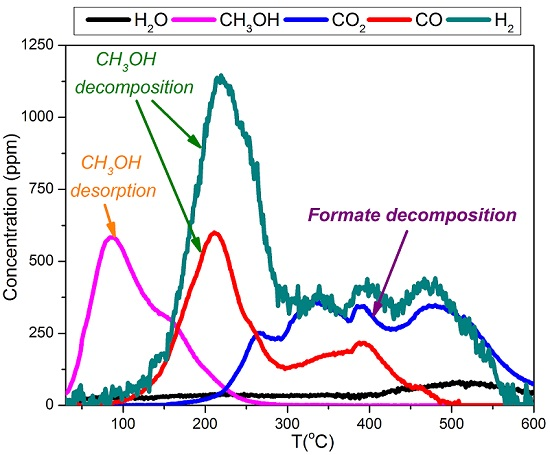
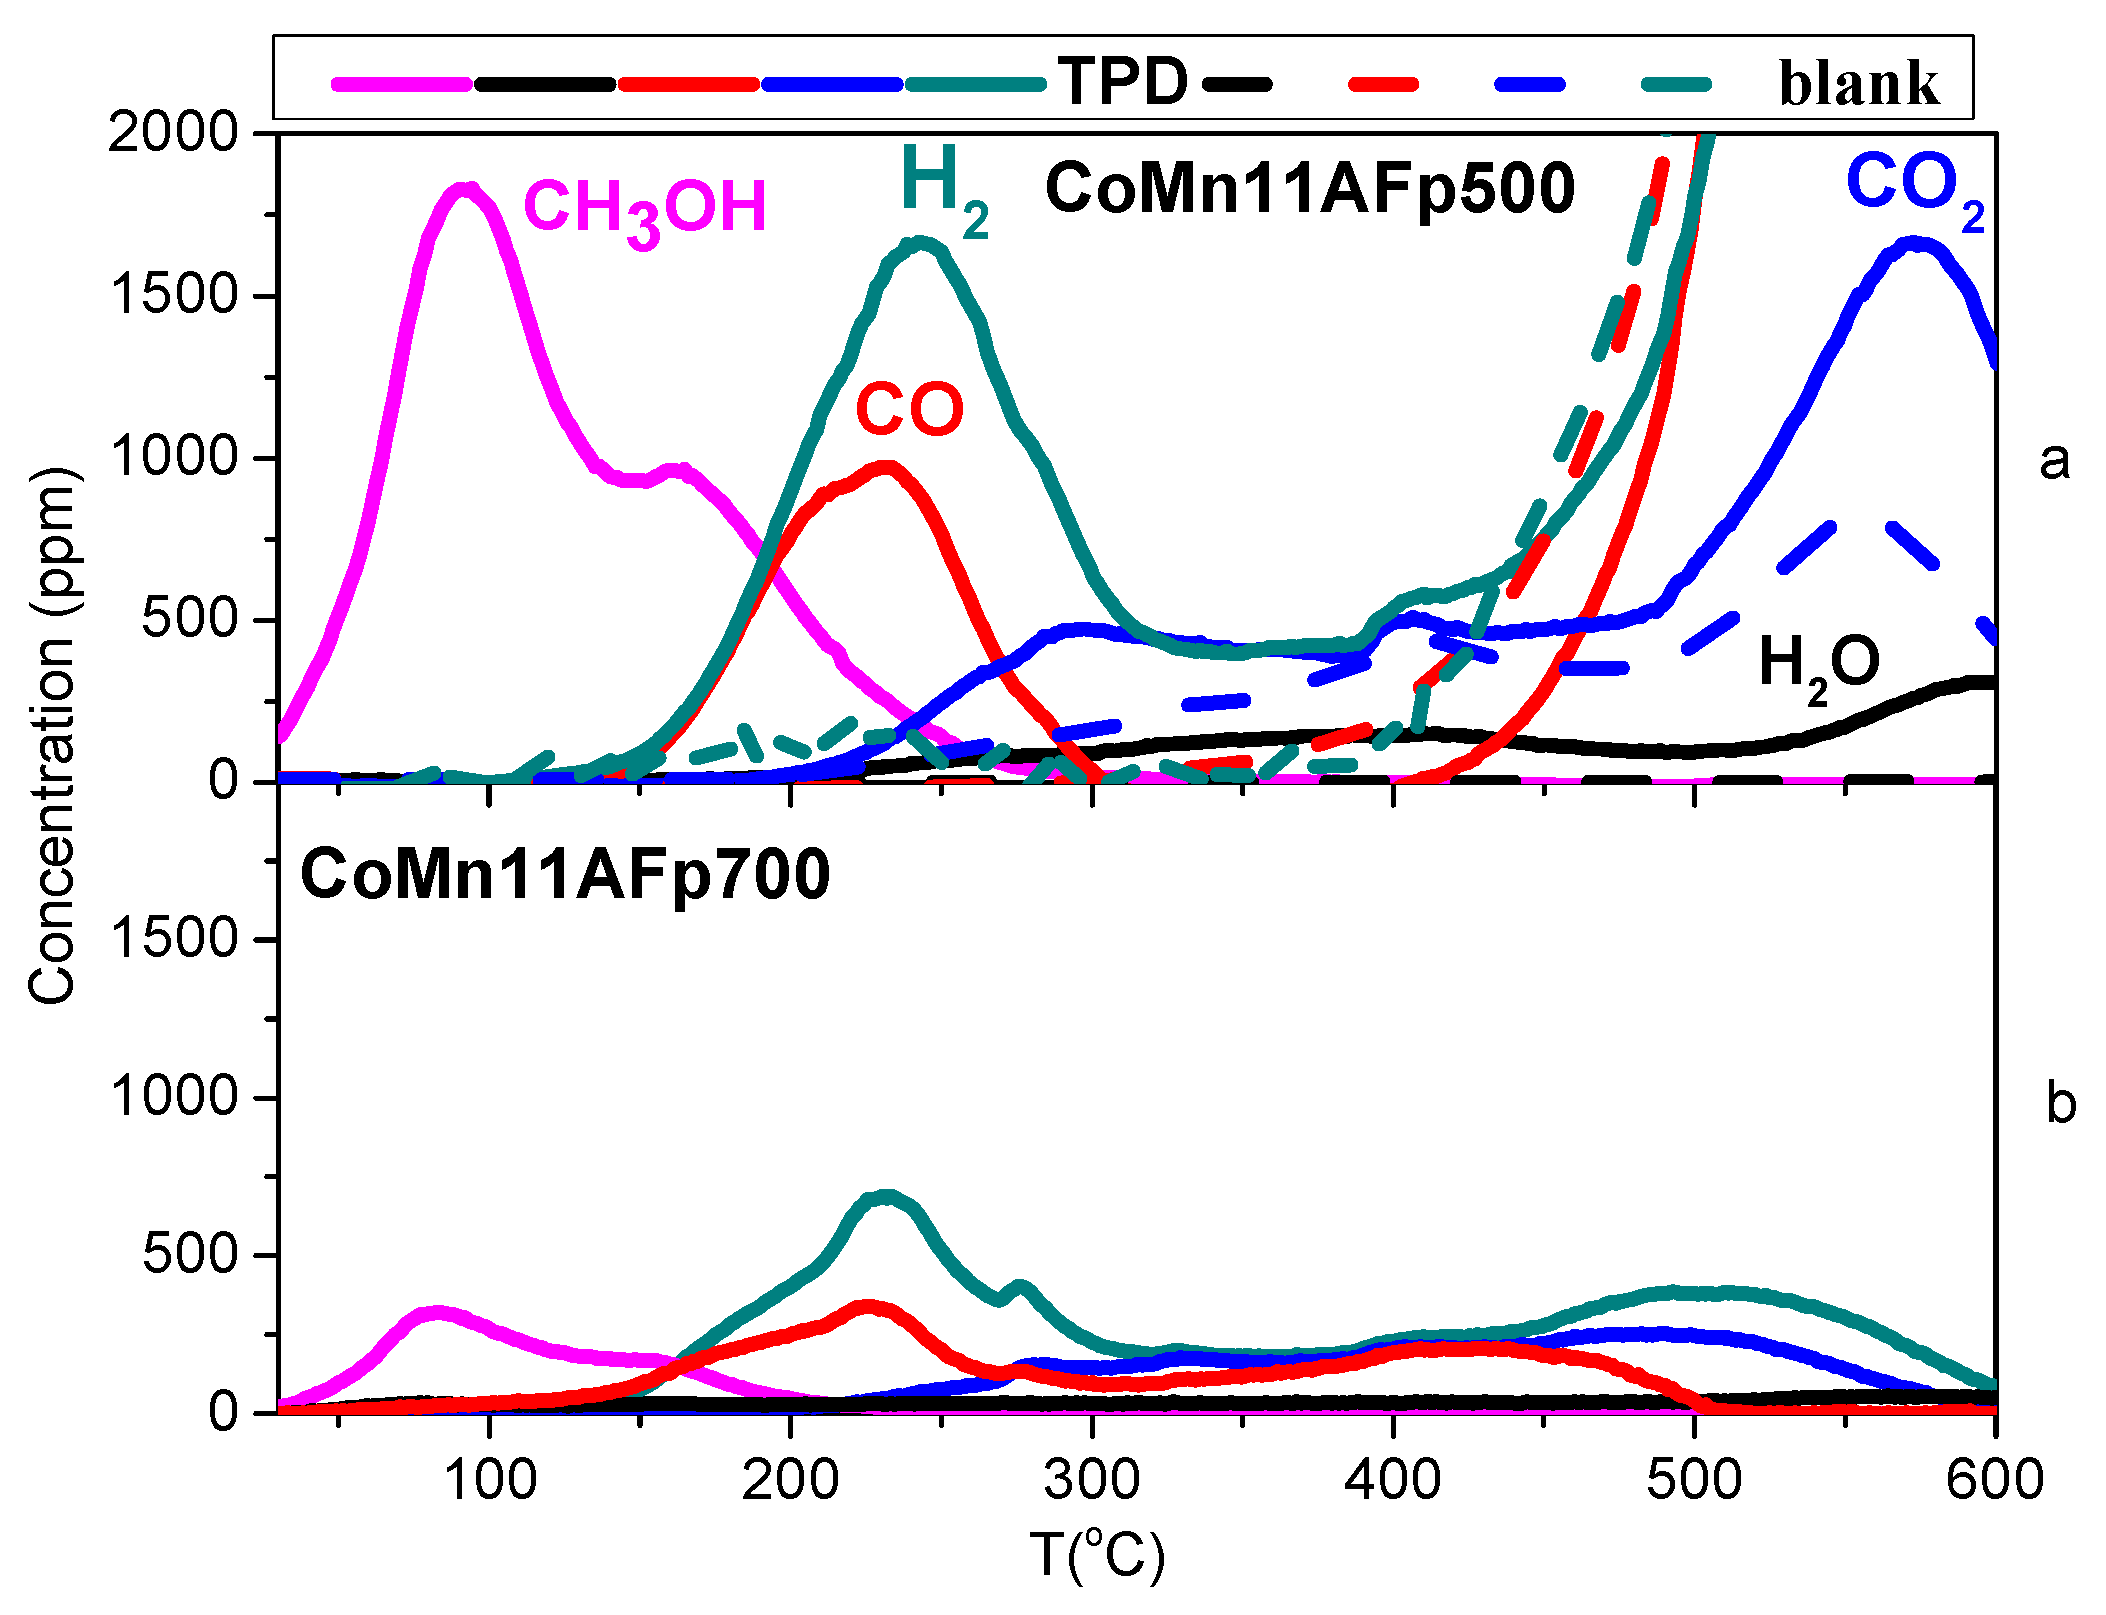
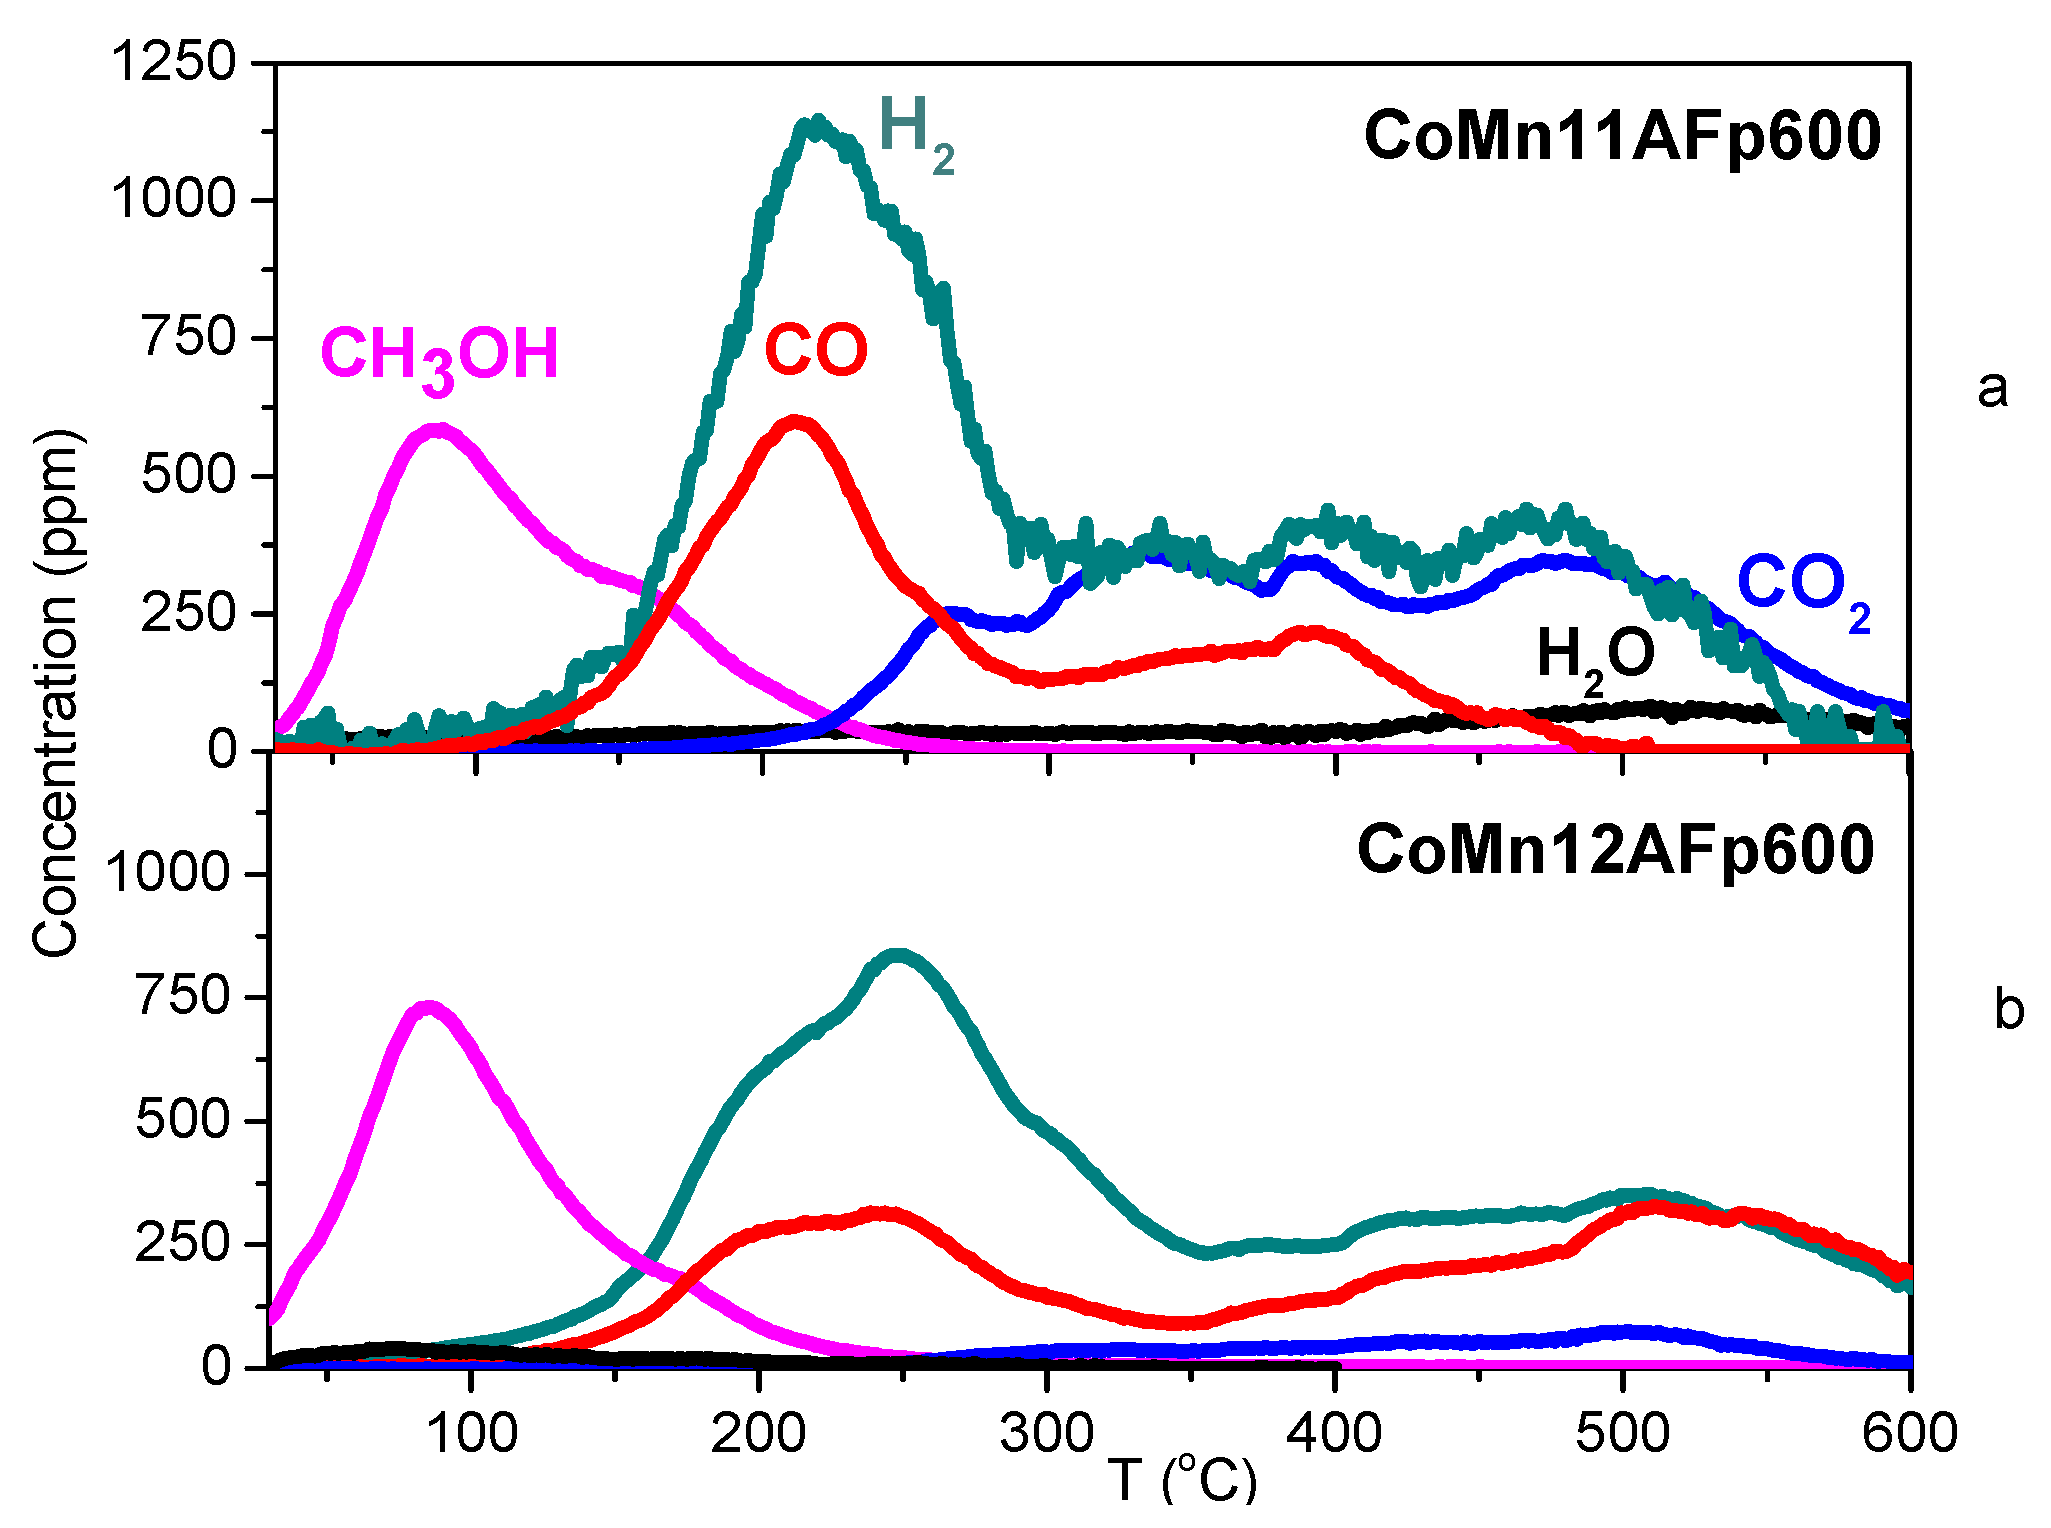
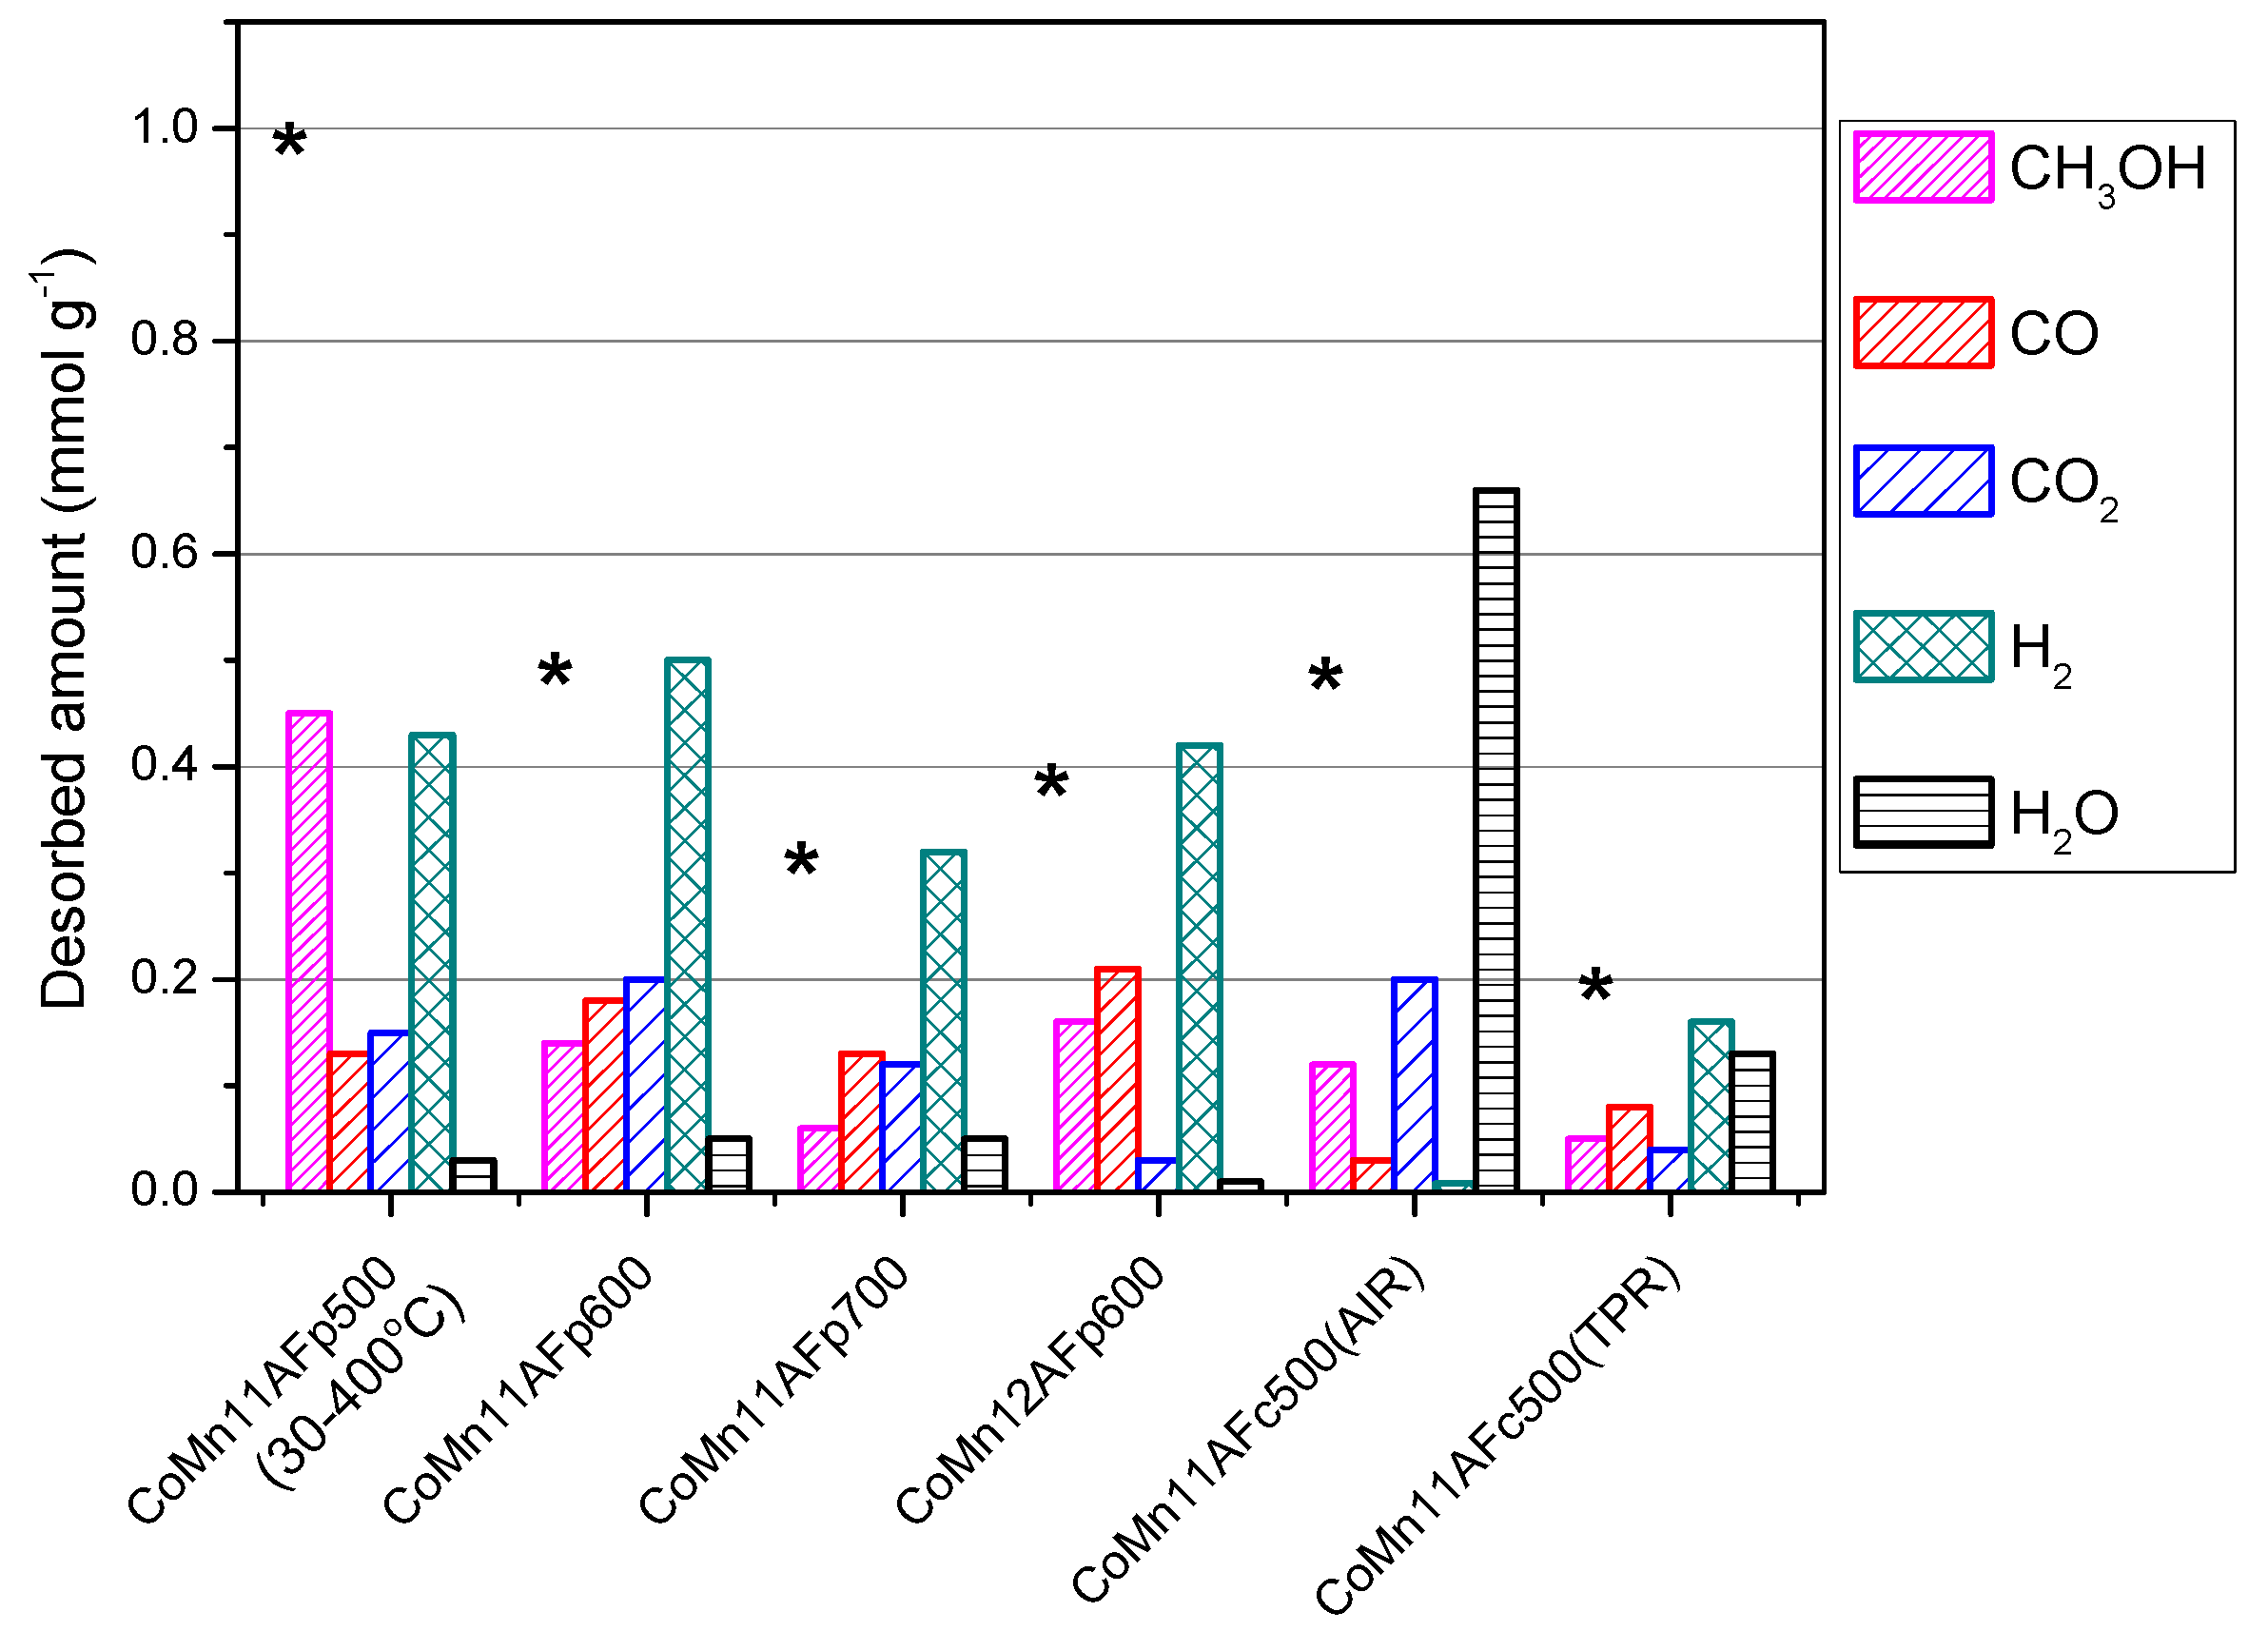
2.4. TPD of Adsorbed CH3OH

CH3OH, CO, H2, CO2 and H2O profiles during CH3OH-TPD for CoMn11F samples pyrolyzed at 500 or 700 °C are shown in Figure 9a,b, respectively. Dashed lines in Figure 9a represent CO2, H2, CO and H2O production during the blank experiment (without prior methanol adsorption). The appearance of these molecules is due to residual pyrolysis of the fumarate precursor. TPD profiles following adsorption of methanol at room temperature indicated the presence of CO, CO2, H2 and H2O in addition to methanol. Methanol desorption profiles are composed of a main peak at 90 °C and a less intense second peak in the form of a shoulder at 160 °C. Methanol desorption is completed at 300 °C for CoMn11AFp500 and at 210 °C for CoMn11AFp700. At the same time, methanol decomposition to CO and H2 takes place above 150 °C for both catalysts. The hydrogen peak is shifted by ~10 °C to the right compared to CO peak, probably due to readsorption effects. At the maximum CO production temperature (230 °C), CO2 starts also appearing in the gas phase. One possible explanation for the production of CO2 is reaction of CO with catalyst surface oxygen. This hypothesis is supported by the fact that less CO2 is produced over the CoMn11AFp700 catalyst, which is in a more reduced state due to its activation at higher temperature. In addition, CO2 production is accompanied by water production (at least for CoMn11p500), which also indicates oxidation of hydrogen by surface oxygen. Another possibility is that (part of) CO2 is produced via the Boudouard reaction. This hypothesis cannot be checked by oxidation of surface carbon (also produced during Boudouard), since pyrolyzed catalysts already contain residual carbon in their structure. Judging from the fact that water production is minimal over the CoMn11AFp700, the occurrence of the Boudouard reaction cannot be disregarded.
CH3OH, CO, H2, CO2 and H2O profiles during CH3OH-TPD from CoMn11AF and CoMn12AF catalysts prepared from pyrolysis at 600 °C are shown in Figure 10a,b, respectively. For both catalysts methanol is desorbed with a main peak at 90 °C and a tail extending up to 250 °C. The CO profile of CoMn11AFp600 includes two main peaks at 210 and 390 °C and is completed at 500 °C. Decrease of cobalt content leads to CO production with a similar profile, but in this case its production extends even above 600 °C. The hydrogen profile follows generally the CO profile. For both catalysts, CO2 production is also detected and is more intense on CoMn11AFp600. Overall, the profiles indicate the presence of more than one adsorbed species of methanol and have interference by CO2 readsorption effects (Figure 2b).
CH3OH, CO, H2, CO2 and H2O profiles during CH3OH-TPD for the catalyst prepared by oxidative pretreatment (CoMn11AFc500(AIR)) or oxidation/reduction (CoMn11c500(TPR)) are shown in Figure 11. Methanol adsorbed on the oxidized catalyst mainly acts as a reducing agent during TPD. Hence, CO2 and H2O are produced from the oxidation of adsorbed methanol by surface oxygen. Oxidation of methanol takes place in the form of two peaks, indicative either of the presence of two different modes of adsorbed methanol or of stepwise reduction of the surface. The peaks of oxidation products, CO2 and H2O, do not coincide evidently due to readsorption effects. The high temperature CO2 peak is accompanied by production of small quantities of CO and H2, which implies that active sites for methanol decomposition have been created only at that point (and not after the first CO2 peak). On the contrary, the TPD profile of CoMn11AFc500 (TPR) corresponds to decomposition of adsorbed methanol towards CO and H2 in the range of 150–250 °C. The production of small amounts of CO2 can be attributed to additional surface reduction of the catalyst. Comparison of Figure 9, Figure 10 and Figure 11 shows that the onset and the main peak of methanol decomposition to CO and H2 take place in the same temperature range for both the oxidized/reduced catalyst and all pyrolyzed catalysts. One important difference is that pyrolyzed catalysts contain additional states of adsorbed methanol which decompose at higher temperatures up to 500–600 °C.
The quantitative analysis of methanol adsorption and TPD experiments is presented in Figure 12. The amounts of adsorbed methanol are indicated with asterisks, while the amounts of desorbed CH3OH, CO, CO2, H2 and H2O during TPD are given in column form. The following observations can be made concerning Figure 12:
  • With the exception of catalyst CoMn11AFp500, which adsorbs 1 mmol·g−1, all catalysts adsorb methanol in the range of 0.2–0.5 mmol·g−1. The lowest quantity is found over the oxidized/reduced sample.
  • Less than half of adsorbed methanol desorbs molecularly.
  • Increase of pyrolysis temperature and decrease of cobalt content lead to decrease of adsorbed methanol.
  • The amounts of CO and CO2 produced during methanol TPD are 2–4 times higher over the pyrolyzed catalysts compared to those prepared via oxidation or oxidation/reduction.
  • The oxygen mass balance between output and input shows a surplus indicating that adsorbed methanol acts as a reducing agent scavenging lattice oxygen from the catalysts. The amount of adsorbed methanol that gets oxidized towards CO2 and H2O depends on the oxidation state of the catalyst surface.
  • The carbon mass balance is overall satisfied (error <10%) with the exception of the CoMn11AFp500 catalyst, because its reported values correspond to temperatures below 400 °C (at higher temperatures interference from residual pyrolysis does not allow for reliable measurement).

2.5. Discussion

Application of the catalysts examined in the present work in methanol steam reforming has shown that the catalysts obtained via pyrolysis are more active than those prepared via oxidative pretreatment [1,2]. The former are already in reduced state exemplified by the presence of metallic cobalt and a mixed CoxMn1−xO phase, while the latter consist initially of a mixed Co-Mn spinel oxide phase. When exposed to the reforming reaction mixture, however, the spinel oxide phase gets gradually reduced and the catalyst becomes activated. It is understandable that surface reduction of the spinel phase is a prerequisite for switching on the catalytic function. The findings of the present work during TPD of methanol indicate that adsorbed methanol acts as the reduction agent and the preoxidized catalyst is indeed initially inactive in methanol decomposition (Figure 11). On the other hand, all pyrolyzed catalysts, as well as the oxidized/reduced catalyst, are active in the decomposition of preadsorbed methanol towards CO as well as CO2. The appearance of CO2 takes place at higher temperatures than CO and its profile is matched well by the profile of coproduced H2 (Figure 9 and Figure 10). This implies that both CO2 and H2 originate from a common surface species, which is most probably formate. At this point, it would be interesting to compare the observed behavior of cobalt catalysts in methanol-TPD with the one of copper catalysts and, more specifically, CuO/Al2O3 [33]. The TPD profile from CuO/Al2O3 contains minor amounts of methanol (170 °C) and production of CO2 and H2 with peak at 200–250 °C. Small amounts of HCOOH are also produced in the same temperature range. CO is observed at higher temperatures with peak at 350 °C. Therefore, the main difference in the function of cobalt and copper catalysts is that CuO forms surface formate from adsorbed methanol, which decomposes at relatively low temperature to CO2 and hydrogen. The observed CO at higher temperatures may be attributed to the reverse water-gas shift reaction. The cobalt catalysts of the present work, on the other hand, produce CO and H2 at 200–250 °C, while CO2 and H2 production from formate decomposition is observed at much higher temperatures. These results exemplify nicely the superiority of copper versus cobalt in steam reforming of methanol: copper creates formate species which decompose at low temperatures to CO2 and H2, while cobalt decomposes methanol to CO and H2 and the created formate species are stable so that they act rather as spectators occupying a fraction of the active sites [34].
The higher activity of pyrolyzed catalysts can be attributed mainly to their higher number density of active sites since peak temperatures of CO during TPD after methanol adsorption are similar in pyrolyzed and oxidized/reduced catalysts. During pyrolysis of the fumarate precursors, residual carbon is left behind and helps stabilize cobalt and MnO crystallites against extensive sintering. The resulting specific surface area of pyrolyzed catalysts is thus approximately one order of magnitude higher than the one of spinel oxide samples [1]. The higher available area for adsorption has been confirmed for water (Figure 8) and CO2 (Figure 2) adsorption, whereas pyrolyzed samples adsorb up to one order of magnitude more water or CO2 per unit weight. This applies to a lesser extent for methanol adsorption, whereas pyrolyzed samples adsorb up to 5 times more methanol. It is understandable that a certain fraction of these adsorbed molecules on pyrolyzed catalysts may reside on the carbonaceous support, whose surface composition in terms of oxygen content is strongly dependent on pyrolysis temperature. This may explain the observed variations in the adsorbed amounts of water, methanol and CO2 as a function of pyrolysis temperature, which causes no change in the BET surface area otherwise. Comparison of relative amounts of adsorbed hydrogen and methanol on pyrolyzed and oxidized/reduced catalysts shows considerable discrepancies. Using hydrogen adsorption as a measure of cobalt dispersion and hence of active sites would lead to a wrong conclusion regarding differences among the various samples as related to activity in methanol reforming. In this respect, methanol is a more suitable probe, since it is the molecule of interest in the target reaction. Following this train of thought, one should further consider not the total amount of adsorbed methanol, but rather the amount of irreversibly adsorbed methanol that decomposes during heating. In this respect, the concentration of active sites in pyrolyzed catalysts is smaller than the one expected if one takes BET surface area or the amount of adsorbed hydrogen as indicators.
Concerning the role of water, it has been found in the present work that the catalysts are effective in dissociating the water molecule at temperatures of interest for the reforming reaction getting themselves oxidized in the process. The extent of water adsorption and dissociation is directly related to available sites responding to hydrogen adsorption (H2-TPD experiments). Although one could envisage, based on this finding, methanol reforming taking place through a surface reduction-oxidation mechanism, i.e., surface reduction by methanol leading to CO2 and H2O production followed by surface reoxidation by water leading to hydrogen production, this does not appear to be the case. Indeed, the product distribution during methanol reforming over all cobalt catalysts examined indicates a mechanism comprising methanol decomposition and the water–gas shift reaction and CO selectivity is higher or at best equal to the one predicted by thermodynamic equilibrium.

3. Experimental Section

3.1. Catalyst Preparation

The precursor compounds for catalyst synthesis were mixed fumarate salts of cobalt and manganese, which were prepared by mixing aqueous solutions of cobalt and manganese acetate with a solution of fumaric acid in ethanol followed by drying at 120 °C. The corresponding catalysts were prepared by pyrolysis of the salts under inert gas with a linear heating rate of 5 °C/min to the target temperature, 500, 600 or 700 °C, soak for 5 min and cooling down to adsorption temperature. The pyrolyzed catalysts are named CoMn1xAFpTTT, with TTT being the pyrolysis temperature and 1x (x = 1 or 2) being the Co/Mn atomic ratio. For example, the CoMn11AFp600 catalyst has a Co/Mn atomic ratio of 1/1 and has been prepared by pyrolysis at 600 °C. Samples were also prepared via oxidative treatment of the salts at 500 °C for 2 h for comparison purposes (named CoMn11AFc500). Calcined catalysts that had been reduced before adsorption are named CoMn11AFc500 (TPR).

3.2. Catalyst Characterization

Catalysts were characterized by nitrogen physisorption (BET), H2-TPR, CH3OH-TPR and in-situ XRD. Characterization results have been reported in [1,2].

3.3. TPD Experiments

Temperature-programmed desorption (TPD) of pre-adsorbed CH3OH, H2O, H2, CO2 and CO at room temperature were performed. TPD of pre-adsorbed H2O and H2 at 300 °C were performed also. Temperature Programmed Desorption (TPD) experiments were carried out at atmospheric pressure in a fixed-bed reactor system with two independent gas lines equipped with mass flow controllers (Aera GmbH, Kirchheim, Germany). A mass spectrometer (Omnistar/Pfeiffer Vacuum, Asslar, Germany) was used for on-line monitoring of effluent gases. Prior to each CO or CO2 adsorption experiment, the calcined catalysts were reduced by 3% H2/He mixture at 400 °C for 20 min with a linear heating rate of 5 °C·min−1. For all the other molecules examined reduction of calcined catalysts was performed by 3% H2/He mixture at 600 °C for 30 min. For all molecules whose adsorption was studied at room temperature following completion of the adsorption, indicated by stable signals in the mass spectrometer, the reactor was purged with pure He until all signals met their baselines. Then, the TPD run was started under a helium flow of 50 cm3·min−1 with a heating rate of 10 °C·min−1. For all molecules whose adsorption was studied at 300 °C, cooling from adsorption temperature to 30 °C was performed in the presence of the same gaseous flow. After cooling, the reactor was purged with 50 cm3·min−1 He and TPD was started as soon as the signals had been stabilized. For all catalysts, blank experiments were also performed. Adsorption of CO and CO2 was carried out under a flow of 1.1% CO/He (50 cm3·min−1) or 1.1% CO2/He (50 cm3·min−1) mixture, respectively. Hydrogen adsorption was performed under pure hydrogen flow of 20 cm3·min−1 for 10 min. Water adsorption was carried out using a 5400 ppm H2O/He mixture (50 cm3·min−1). Methanol adsorption was carried out using a 17,000 ppm CH3OH/He mixture. The following masses were recorded in the mass spectrometer during all TPD experiments: 18 (H2O), 28 (CO), 44 (CO2), 31 and 32 (CH3OH), 15 (CH4), 29 and 30 (HCHO), 45 (CH3OCH3) and 49 (HCOOH).

4. Conclusions

The employment of TPD in order to investigate the interaction of CO, CO2, H2, H2O and CH3OH with cobalt catalysts prepared from cobalt-manganese fumarate precursors via pyrolysis or oxidation has led to the following findings:
  • Adsorption of CO and H2 is activated. Although activated hydrogen adsorption on cobalt is well established, activated adsorption of CO has not been reported previously.
  • Hydrogen appears to adsorb both on cobalt and MnO components. Taking into account literature results concerning cobalt and MnO and results of the present work concerning cobalt, MnO and Co-MnO samples, it is inferred that hydrogen desorbing below 250 °C originates from cobalt crystallites, hydrogen desorbing above 500 °C originates from MnO, while hydrogen desorbing in the intermediate temperature range (250–500 °C) probably originates from sites created at the interface of Co and MnO or from a mixed reduced oxide phase.
  • Water adsorption is dissociative at an adsorption temperature of 300 °C, but not at 25 °C, leading to surface oxidation of the catalyst. Hydrogen produced from water dissociation remains partially adsorbed on the catalyst surface confirming that part of hydrogen is quite strongly bound on the catalysts.
  • Reaction paths of adsorbed methanol during TPD include decomposition to CO and H2, as well as creation of rather stable surface formates, which decompose at higher temperatures to CO2 and H2. Adsorbed methanol acts as a reducing agent during TPD leading to catalyst reduction.
  • Differences of the pyrolyzed and oxidized/reduced catalysts appear to be mainly in the number density of active sites, which, however, is not directly analogous to differences in specific surface area.

Acknowledgments

This work was carried out in the frame of the ACENET project “Hydrogen from bio-alcohols: An efficient route for hydrogen production via novel reforming catalysts” (ACE.07.009). The authors acknowledge funding from the General Secretariat for Research and Technology of the Ministry of Education, Lifelong Learning and Religious Affairs (Greece).

Author Contributions

E.P. and T.I. conceived and designed the experiments; E.P. performed the experiments; E.P. and T.I. analyzed the data; T.I. wrote the paper.

Conflicts of Interest

The authors declare no conflict of interest.

References

  1. Papadopoulou, E.; Ioannides, T. Steam reforming of methanol over cobalt catalysts: effect of cobalt oxidation state. Int. J. Hydrogen Energy 2015, 40, 5251–5255. [Google Scholar] [CrossRef]
  2. Papadopoulou, E.; Delimaris, D.; Denis, A.; Machocki, A.; Ioannides, T. Alcohol reforming on cobalt-based catalysts prepared from organic salt precursors. Int. J. Hydrogen Energy 2012, 37, 16375–16381. [Google Scholar] [CrossRef]
  3. Yong, S.T.; Ooi, C.W.; Chai, S.P.; Wu, X.S. Review of methanol reforming-Cu-based catalysts, surface reaction mechanisms, and reaction schemes. Int. J. Hydrogen Energy 2013, 38, 9541–9552. [Google Scholar] [CrossRef]
  4. Sá, S.; Silva, H.; Brandão, L.; Sousa, J.M.; Mendes, A. Catalysts for methanol steam reforming-A review. Appl. Catal. B 2010, 99, 43–57. [Google Scholar] [CrossRef]
  5. Palo, D.R.; Dagle, R.A.; Holladay, J.D. Methanol Steam Reforming for Hydrogen Production. Chem. Rev. 2007, 107, 3992–4021. [Google Scholar] [CrossRef] [PubMed]
  6. Agrell, J.; Birgersson, H.; Boutonnet, M.; Melián-Cabrera, I.; Navarro, R.M.; Fierro, J.L.G. Production of hydrogen from methanol over Cu/ZnO catalysts promoted by ZrO2 and Al2O3. J. Catal. 2003, 219, 389–403. [Google Scholar] [CrossRef]
  7. De Wild, P.J.; Verhaak, M.J.F.M. Catalytic production of hydrogen from methanol. Catal. Today 2000, 60, 3–10. [Google Scholar] [CrossRef]
  8. Matter, P.H.; Braden, D.J.; Ozkan, U.S. Steam reforming of methanol to H2 over nonreduced Zr-containing CuO/ZnO catalysts. J. Catal. 2004, 223, 340–351. [Google Scholar] [CrossRef]
  9. Tartakovsky, L.; Baibikov, V.; Veinblat, M. Comparative Performance Analysis of SI Engine Fed by Ethanol and Methanol Reforming Products. SAE Tech. Pap. 2013. [Google Scholar] [CrossRef]
  10. Habermehl-Cwirzen, K. An Insight: Studies of Atomic and Molecular Adsorption on Co(0001); Helsinki University of Technology: Helsinki, Finland, 2006. [Google Scholar]
  11. Blyholder, G.; Wyatt, W.V. Infrared spectra and structures of some C,H,O compounds adsorbed on silica-supported iron, cobalt, and nickel. J. Phys. Chem. 1966, 70, 1745–1750. [Google Scholar] [CrossRef]
  12. Natile, M.M.; Glisenti, A. Study of surface reactivity of cobalt oxides: interaction with methanol. Chem. Mater. 2002, 14, 3090–3099. [Google Scholar] [CrossRef]
  13. Grellner, F.; Klingenberg, B.; Borgmann, D.; Wedler, G. Electron spectroscopic study of the interaction of oxygen with Co(1120) and of coadsorption with water. J. Electron Spectrosc. 1995, 71, 107–115. [Google Scholar] [CrossRef]
  14. Heras, J.M.; Papp, H.; Spiess, W. Face specificity of the H2O adsorption and decomposition on Co surfaces: A LEED, UPS, sp and TPD study. Surf. Sci. 1982, 117, 590–604. [Google Scholar] [CrossRef]
  15. Reuel, R.C.; Bartholomew, C.H. The stoichiometries of H2 and CO adsorptions on cobalt: Effects of support and preparation. J. Catal. 1984, 85, 63–77. [Google Scholar] [CrossRef]
  16. Bartholomew, C.H.; Reuel, R.C. Cobalt-support interactions: Their effects on adsorption and CO hydrogenation activity and selectivity properties. Ind. Eng. Chem. Prod. Res. Dev. 1985, 24, 56–61. [Google Scholar] [CrossRef]
  17. Zowtiak, J.M.; Bartholomew, C.H. The kinetics of H2 adsorption on and desorption from cobalt and the effects of support thereon. J. Catal. 1983, 83, 107–120. [Google Scholar] [CrossRef]
  18. Tejuca, L.G.; Bell, A.T.; Fierro, J.L.G.; Pena, M.A. Surface behavior of reduced LaCoO3 as studied by TPD of CO, CO2 and H2 probes and by XPS. Appl. Surf. Sci. 1988, 31, 301–316. [Google Scholar] [CrossRef]
  19. Narayanan, S.; Unnikrishnan, R.P. Comparison of hydrogen adsorption and aniline hydrogenation over co-precipitated Co/Al2O3 and Ni/Al2O3 catalysts. J. Chem. Soc. Faraday Trans. 1997, 93, 2009–2013. [Google Scholar] [CrossRef]
  20. Sakka, Y.; Ohno, S. Hydrogen desorption characteristics of composite Co-TiN nanoparticles. Appl. Surf. Sci. 1996, 100/101, 232–237. [Google Scholar] [CrossRef]
  21. Soonq, Y.; Rao, V.U.S.; Zarochak, M.F.; Gormley, R.J.; Zhang, B. Temperature-programmed desorption study on manganese-iron catalysts. Appl. Catal. 1991, 78, 97–108. [Google Scholar] [CrossRef]
  22. Gauthier, Y.; Schmidt, M.; Padovani, S.; Lundgren, E.; Bus, V.; Kresse, G.; Redinger, J.; Vagra, P. Adsorption sites and ligand effect for CO on an alloy surface: A direct view. Phys. Rev. Lett. 2001, 87, 036103. [Google Scholar] [CrossRef] [PubMed]
  23. Jiang, M.; Koizumi, N.; Ozaki, T.; Yamada, M. Adsorption properties of cobalt and cobalt-manganese catalysts studied by in situ diffuse reflectance FTIR using CO and CO+H2 as probes. Appl. Catal. A 2001, 209, 59–70. [Google Scholar] [CrossRef]
  24. Mohana Rao, K.; Scarano, D.; Spoto, G.; Zecchina, A. CO adsorption on cobalt particles supported on MgO: An IR investigation. Surf. Sci. 1988, 204, 319–330. [Google Scholar] [CrossRef]
  25. Rostrup-Nielsen, J.R. Catalytic Steam Reforming. Catalysis 1984, 5, 1–117. [Google Scholar]
  26. Baker, R.T.K.; Kim, M.S.; Chambers, A.; Park, C.; Rodriguez, N.M. The relationship between metal particle morphology and the structural characteristics of carbon deposits. Stud. Surf. Sci. Catal. 1997, 111, 99–109. [Google Scholar]
  27. Ōya, A.; Ōtani, S. Catalytic graphitization of carbons by various metals. Carbon 1979, 17, 131–137. [Google Scholar] [CrossRef]
  28. Budiman, A.W.; Song, S.A.; Chang, T.S.; Shin, C.H.; Choi, M.J. Dry Reforming of Methane Over Cobalt Catalysts: A Literature Review of Catalyst Development. Catal. Surv. Asia 2012, 16, 183–197. [Google Scholar] [CrossRef]
  29. Tsakoumis, M.; Ronning, M.; Qyvind, B. Deactivation of cobalt based Fischer-Tropsch catalysts: A review. Catal. Today 2010, 154, 162–182. [Google Scholar] [CrossRef]
  30. Bartholomew, C.H. Mechanisms of catalyst deactivation. Appl. Catal. A 2001, 21, 17–60. [Google Scholar] [CrossRef]
  31. Bartholomew, C.H. Carbon Deposition in Steam Reforming and Methanation. Catal. Rev. Sci. Eng. 1982, 24, 67–112. [Google Scholar] [CrossRef]
  32. Nakamura, J.; Tanaka, K.; Toyoshima, I. Reactivity of deposited carbon on Co-Al2O3 catalyst. J. Catal. 1987, 108, 55–62. [Google Scholar] [CrossRef]
  33. Tagawa, T.; Pleizier, G.; Amenomiya, Y. Methanol synthesis from CO2+H2: Characterization of catalysts by TPD. Appl. Catal. 1985, 18, 285–293. [Google Scholar] [CrossRef]
  34. Meunier, F.C.; Reid, D.; Goguet, A.; Shekhtman, S.; Hardacre, C.; Burch, R.; Deng, W.; Flytzani-Stephanopoulos, M. Quantitative analysis of the reactivity of formate species seen by DRIFTS over a Au/Ce(La)O2 water-gas shift catalyst: First unambiguous evidence of the minority role of formates as reaction intermediates. J. Catal. 2007, 247, 269–279. [Google Scholar]
Figure 1. TPD following CO adsorption at 25 °C or 150 °C on CoMn11AFp600 catalyst: (a) CO desorption; and (b) CO2 desorption.
Catalysts 06 00033 g001
Figure 2. TPD of CO2 following its adsorption at 25 °C on (a) CoMn1xAFc500 (TPR), x = 1, 2; and (b) CoMn11AFpi, i = 500, 600, 700 °C and CoMn12AFp600.
Catalysts 06 00033 g002
Figure 3. H2-TPD profiles following its adsorption at 25 °C and 300 °C on CoMn11AFp600, CoAFp600, MnAFp600 and CoMn11AFc500 (TPR) samples.
Catalysts 06 00033 g003
Figure 4. TPD profiles of H2O and H2 after water adsorption at 25 °C over pyrolyzed catalysts.
Catalysts 06 00033 g004
Figure 5. TPD profiles of H2O and H2 after water adsorption at 300 °C over pyrolyzed catalysts.
Catalysts 06 00033 g005
Figure 6. (a) Total adsorbed Η2Ο at 300 °C and Η2 produced during water adsorption; and (b) H2O and H2 desorbed during TPD from CoΑF, MnAF, CoMn11AF and CoMn12AF pyrolyzed at 600 °C.
Catalysts 06 00033 g006
Figure 7. (a) Total adsorbed Η2Ο at 300 °C and Η2 produced during water adsorption; and (b) H2O desorbed and H2 produced during TPD. CoMn11AFpi with i = 500, 600, 700 °C.
Catalysts 06 00033 g007
Figure 8. (a) Total adsorbed Η2Ο at 300 °C and Η2 produced during water adsorption; and (b) H2O desorbed and H2 produced during TPD from CoMn11AFp500, CoMn11AFc500(AIR) and CoMn11AFc500(TPR).
Catalysts 06 00033 g008
Figure 9. CH3OH-TPD on CoMn11AFp500 and CoMn11AFp700.
Catalysts 06 00033 g009
Figure 10. CH3OH-TPD on CoMn11AFp600 and CoMn12AFp600.
Catalysts 06 00033 g010
Figure 11. CH3OH-TPD on CoMn11AFc500(AIR) and CoMn11AFc500(TPR).
Catalysts 06 00033 g011
Figure 12. Desorbed amounts of CH3OH, CO, CO2, H2 and H2O during TPD after CH3OH adsorption. Adsorbed amount of methanol is shown with asterisks (*).
Catalysts 06 00033 g012
Table 1. Amounts of hydrogen desorbed during TPD after adsorption at 25 and 300 °C.
CatalystH2-TPD Adsorption at 25 °CH2-TPD Adsorption at 300 °C
μmol H2 g−1H/Coμmol H2 g−1H/Co
CoMn11AFp5001740.0584920.164
CoMn11AFp6001890.0606610.210
CoMn11AFp7003280.1043710.118
CoMn12AFp6001950.0964780.236
CoMn11AFc500(TPR)00100.0034
CoAFp600340.00116610.0212
MnAFp6001000.034 *1950.066 *
* H/Mn.

