Article

Application of a Coated Film Catalyst Layer Model to a High Temperature Polymer Electrolyte Membrane Fuel Cell with Low Catalyst Loading Produced by Reactive Spray Deposition Technology

1
Center for Clean Energy Engineering, University of Connecticut, Storrs, CT 06269, USA
2
Department of Material Science and Engineering, University of Connecticut, Storrs, CT 06269, USA
3
Department of Chemical & Biomolecular Engineering, University of Connecticut, Storrs, CT 06269, USA
*
Author to whom correspondence should be addressed.
Catalysts 2015, 5(4), 1673-1691; https://doi.org/10.3390/catal5041673
Submission received: 15 May 2015 / Accepted: 23 September 2015 / Published: 10 October 2015
(This article belongs to the Special Issue Electrocatalysis in Fuel Cells)

Abstract

:
In this study, a semi-empirical model is presented that correlates to previously obtained experimental overpotential data for a high temperature polymer electrolyte membrane fuel cell (HT-PEMFC). The goal is to reinforce the understanding of the performance of the cell from a modeling perspective. The HT-PEMFC membrane electrode assemblies (MEAs) were constructed utilizing an 85 wt. % phosphoric acid doped Advent TPS® membranes for the electrolyte and gas diffusion electrodes (GDEs) manufactured by Reactive Spray Deposition Technology (RSDT). MEAs with varying ratios of PTFE binder to carbon support material (I/C ratio) were manufactured and their performance at various operating temperatures was recorded. The semi-empirical model derivation was based on the coated film catalyst layer approach and was calibrated to the experimental data by a least squares method. The behavior of important physical parameters as a function of I/C ratio and operating temperature were explored.

Graphical Abstract

1. Introduction

Three of the most significant challenges facing the wide commercialization of proton exchange membrane fuel cells (PEMFCs) are: (1) improving catalyst tolerance to impurities [1,2,3,4,5,6]; (2) simplifying water and thermal management schemes [1,2,3,4,6]; and (3) enhancing the kinetics of the oxygen reduction reaction (ORR) at the cathode [1,2,6,7,8]. Recent research has focused on mitigating the above challenges by increasing the operating temperature of PEMFCs from ~80 °C to ≥ 120 °C, resulting in so-called high temperature PEMFCs (HT-PEMFCs). At high operating temperatures, carbon monoxide adsorption onto the catalyst surface, which greatly reduces cell performance, is not favored. It was found for temperatures above 160 °C that upwards of 3% carbon monoxide in the feed stream could be tolerated [9,10]. The elevated temperature of the HT-PEMFC also means that there is a greater thermal gradient between the cell and the environment. This simplifies the balance of plant related to thermal management due to faster heat rejection [2]. Operating at elevated temperature does introduce new difficulties in maintaining adequate hydration of proton exchange membranes such as Nafion®, though this issue has been addressed with the use of phosphoric acid doped membranes which do not require external humidification [1,11,12]. Operating without external humidification not only simplifies balance of plant but also implies single phase, gaseous, transport in the gas diffusion layers (GDL) and flow channels, which makes reactant diffusion processes more facile [3,4]. To date, phosphoric acid-doped polybenzimidazole (PBI) membranes have been among the most successful acid doped membranes for HT-PEMFC applications [11,12,13,14,15,16,17,18,19,20]. PBI outperforms conventional membranes (i.e., Nafion®) by self-solvating protons to allow charge migration, hence minimizing the reliance on water for proton transport.
Despite their advantages, widespread implementation of HT-PEMFCs still has significant roadblocks. Material performance and durability can be compromised at elevated temperature [6]. The use of phosphoric acid doped membranes to combat dehydration issues results in a highly acidic environment that can increase component degradation [2]. Several authors have noted a rapid degradation of cell performance for PBI-based HT-PEMFCs [21,22,23,24,25]. Two key processes related to this rapid degradation have been identified: catalyst agglomeration in the cathode due the presence of phosphoric acid and oxygen coupled with the high potential, and the direct degradation of the polymer. In addition, as with their low temperature counterpart, cost of production is a major concern for HT-PEMFCs [26]. As such, Reactive Spray Deposition Technology (RSDT) has been examined in recent publications as a low cost method for producing HT-PEMFC MEAs [27,28]. RSDT is a flame-based method suitable for nanoscale particle production and deposition in a single step process. RSDT relies on combustion of a fuel and solvent as a thermal energy source that drives particle nucleation. Annealing occurs either by reaction of precursor gases (gas-to-particle conversion) or by evaporation and/or reaction of suspended precursor particles or droplets (particle-to-particle conversion) in gas streams. The RSDT system avoids the wet chemistry byproducts and the associated nanoparticle separation/purification steps necessary for separate catalyst formation and deposition. It also combines catalyst production and electrode fabrication in one step.
Previous work with RSDT in HT-PEMFCs explored the proof of concept in manufacturing catalyst-coated membranes (CCMs) using PBI based membranes [27], as well as investigating the manufacturing of gas diffusion electrodes (GDEs) using the more recently developed TPS® membrane produced by Advent Technologies [28]. The TPS® membrane was chosen in the more recent study due to its similar behavior to pure phosphoric acid at elevated temperatures [29].
It is important to correlate the resulting performance of the HT-PEMFC to physical properties of the RSDT electrode such as the binder to carbon support ratio (I/C), catalyst loading, pore size distribution, catalyst roughness, and critical pore radius. For this reason a semi-empirical model was developed in this work. There are several commonly used approaches to modeling the behavior of the catalyst layer in a PEMFC. The simplest approach is the interface approximation, which treats the catalyst layer as an ultra-thin reactive boundary between the membrane electrolyte and the GDL [30,31]. The issue with this approach is that it does not glean any relevant structural information about the catalyst layer and, additionally, it generally over predicts the performance since mass transport limitations are not taken into account [32]. A second approach involves a few different scenarios that can be collectively referred to as thin film modeling [33,34,35,36,37,38,39,40,41]. These models are more complex than the interface approach, but still relatively simple and easy to implement. In this approach, the catalyst layer is treated as a thin film where the porous structure contains either water (in the case of a polymer electrolyte) or phosphoric acid (in the case a phosphoric acid doped membrane is used). The nature of how the liquid occupies the catalyst layer is where the distinction is made between approaches. Several works have assumed the liquid floods the catalyst layer and reactant transport takes place through the flooded porous media [33,34,35]. Others have assumed there are large, gas phase pores that exist due to hydrophobic binders such as PTFE coupled with smaller hydrophilic pores [36,37,38,39]. Many of these works focus on gas phase diffusion through the catalyst layer as the primary mass transport resistance. A further subtlety may be applied when the larger, gas filled pores are characterized as having a thin coating of liquid on the walls [40,41]. Reactants must then dissolve into and diffuse through this coating to reach the catalyst embedded in the pore walls. This type of model will be referred to as a coated film model in this work. In the case of phosphoric acid fuel cells, it was argued by Scott et al., that the gas phase diffusion resistance was negligible compared to the diffusion through the coated film [41,42]. The final approach is the catalyst agglomerate model [32,40,41,43,44,45,46,47,48]. This approach is the most complex and generally considered to be the most complete for most catalyst layer structures. It considers the catalyst layer to be composed of spherical agglomerates of catalyst material where the space between the agglomerates is filled with a mixture of the electrolyte and reactant gases. Gas dissolves and diffuses to the center of the agglomerates while continuously reacting.
The coated film model was selected in this work for modeling the transport in the catalyst layer of the HT-PEMFC produced by RSDT for several reasons: (1) the balance of simplicity and detail makes it a good candidate to capture the behavior of the performance data; (2) it has been stated that it is appropriate for catalyst layer thicknesses ≤5 μm [45]. The typical catalyst layer thickness produced by RSDT ranges from 500 nm up to 5 μm; and (3) RSDT provides excellent dispersion and particle size distributions when I/C ratios are optimized, so the agglomerate model may not be geometrically appropriate for catalyst layers produced via RSDT. Experimental data for the Advent TPS® membrane MEAs reported in [28] exposed to pure oxygen have been correlated with the developed model. The resulting calibrated parameters were examined as a function of varying ionomer(PTFE)/carbon(Vulcan XC-72R) (I/C) ratio and as a function of operating temperature of the cell. The effect of varying I/C ratio for HT-PEMFCs has been shown to be important in previous studies by Lobato et al. for (PBI)-H3PO4/Vulcan XC-72R in the catalyst layer and PTFE/Vulcan XC-72R in the microporous layers [49,50]. It was observed that the optimum performance of the RSDT produced HT-PEMFC was obtained for I/C = 0.9 and T = 190 °C (determined by the current density achieved at a cell voltage of 0.6 V) [28]. This work seeks to build upon the previous experimental study by applying a physical model to reinforce the understanding of the cell performance as a function of temperature and I/C ratio. Interpretations of the trends in the model parameters calculated in this study have been provided to explain the observed behavior of the experimental polarization results with specific focus on how the distribution of phosphoric acid within the catalyst layer relates to cell performance.

2. Results and Discussion

2.1. Correlation of Model and Experimental Data

Figure 1 shows the comparison between the model and the experimental data collected in our group’s previous work [28]. The model compares to the data very well over the full range of current densities regardless of the I/C ratio (average normalized root mean square deviation (NRMSD) was 0.020 with a standard deviation of 0.004). Detailed discussions of these trends are available in [28] from an experimental point of view and will be briefly summarized here for convenience. It appears that increasing the I/C ratio, up to 0.9, results in an improvement in the overall performance relating to activation overpotential, ohmic losses, and mass transport limiting behavior. The best performance was obtained for I/C = 0.9 [28]. This was due, in part, to the excellent dispersion of the platinum nanoparticles achieved at that ratio. The TEM images in Figure 2 show increased platinum agglomeration and poor coverage of some of the binder for the less optimal I/C ratios, particularly at the low I/C (I/C = 0.1). Increasing I/C to 1.0 resulted in a decrease in the resulting performance. This trend persisted for all operating temperatures studied. The effect of temperature is somewhat more obscure with what appears to be an initial increase in performance across all I/C ratios followed by a decrease at the higher temperatures of 190 and 200 °C depending on the I/C ratio considered. These trends will be further elucidated in the discussion of the modeling results below.
Figure 1. Correlation between experimental data and the coated film model developed in this work (curves are modeling results and points are experimental data from [28], reproduced with permission, with I/C ratios indicated in the figure legends). Cell operating temperatures are (a) 160 °C, (b) 180 °C, (c) 180 °C, and (d) 200 °C.
Catalysts 05 01673 g001
Figure 2. TEM images showing evolution of platinum distribution as a function of varying ratios of PTFE binder to carbon support material (I/C). Red arrows indicate areas where platinum has the grouped whereas blue arrows indicate areas where platinum is absent from the support.
Catalysts 05 01673 g002

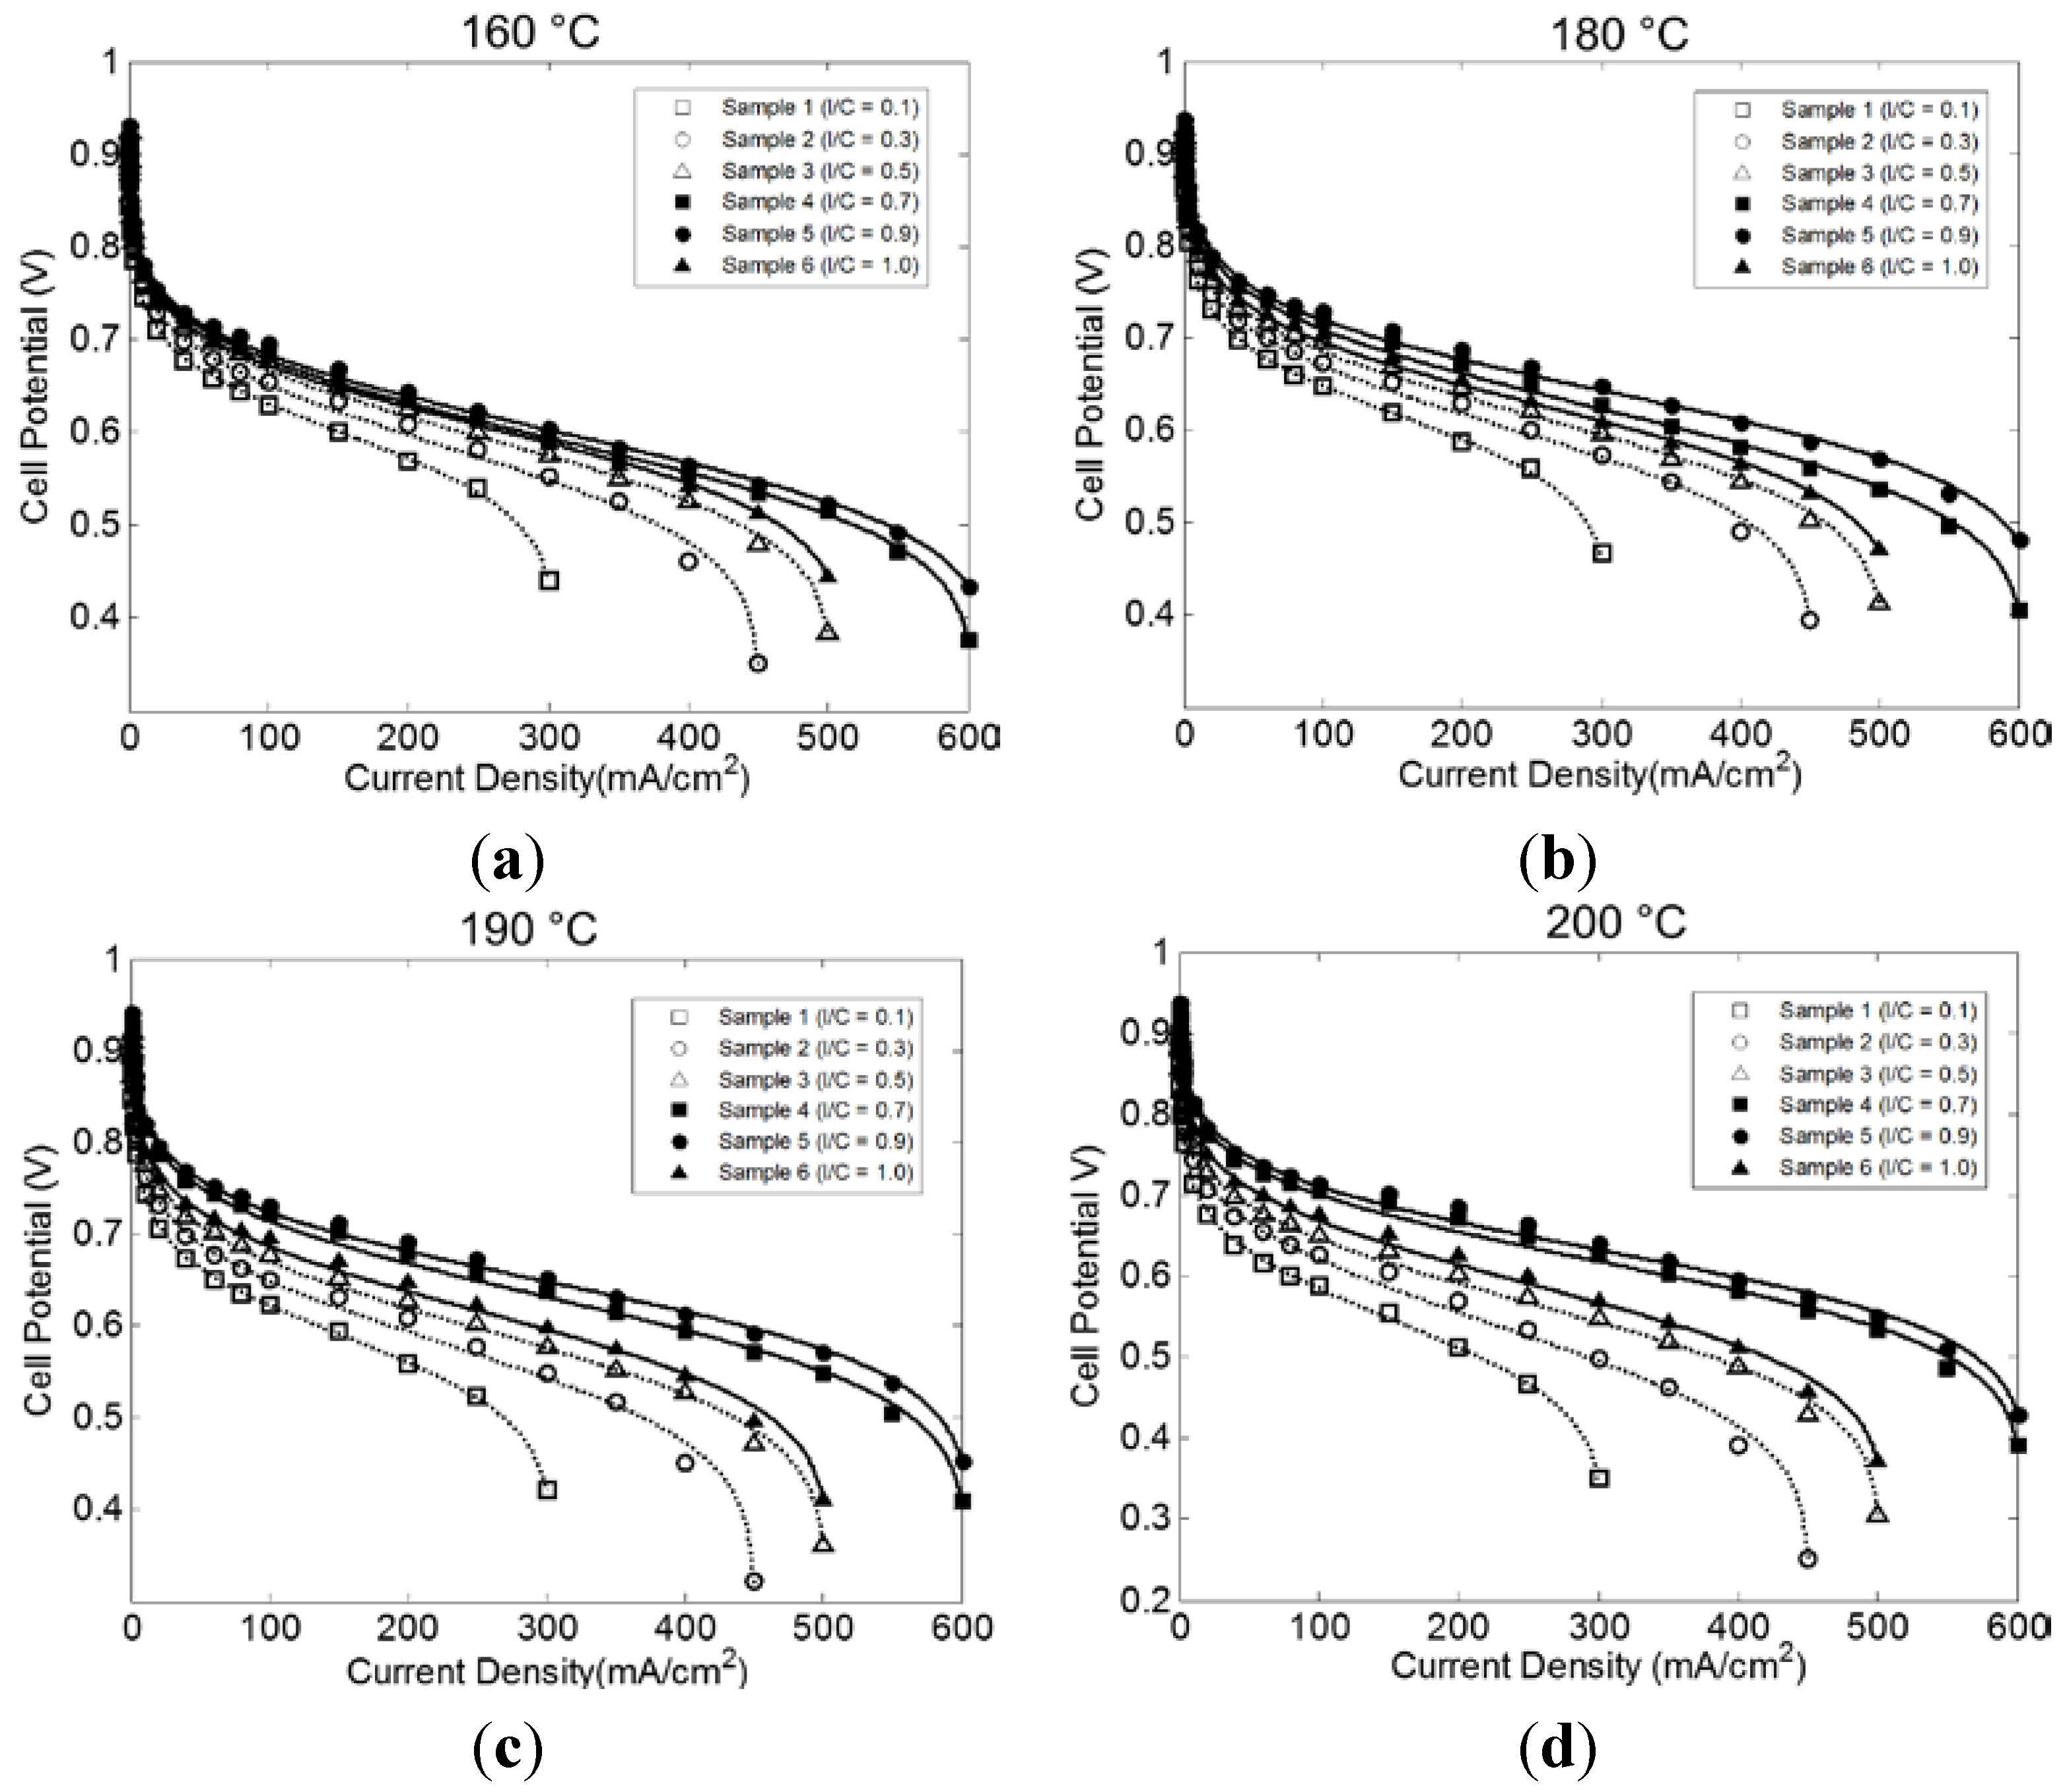
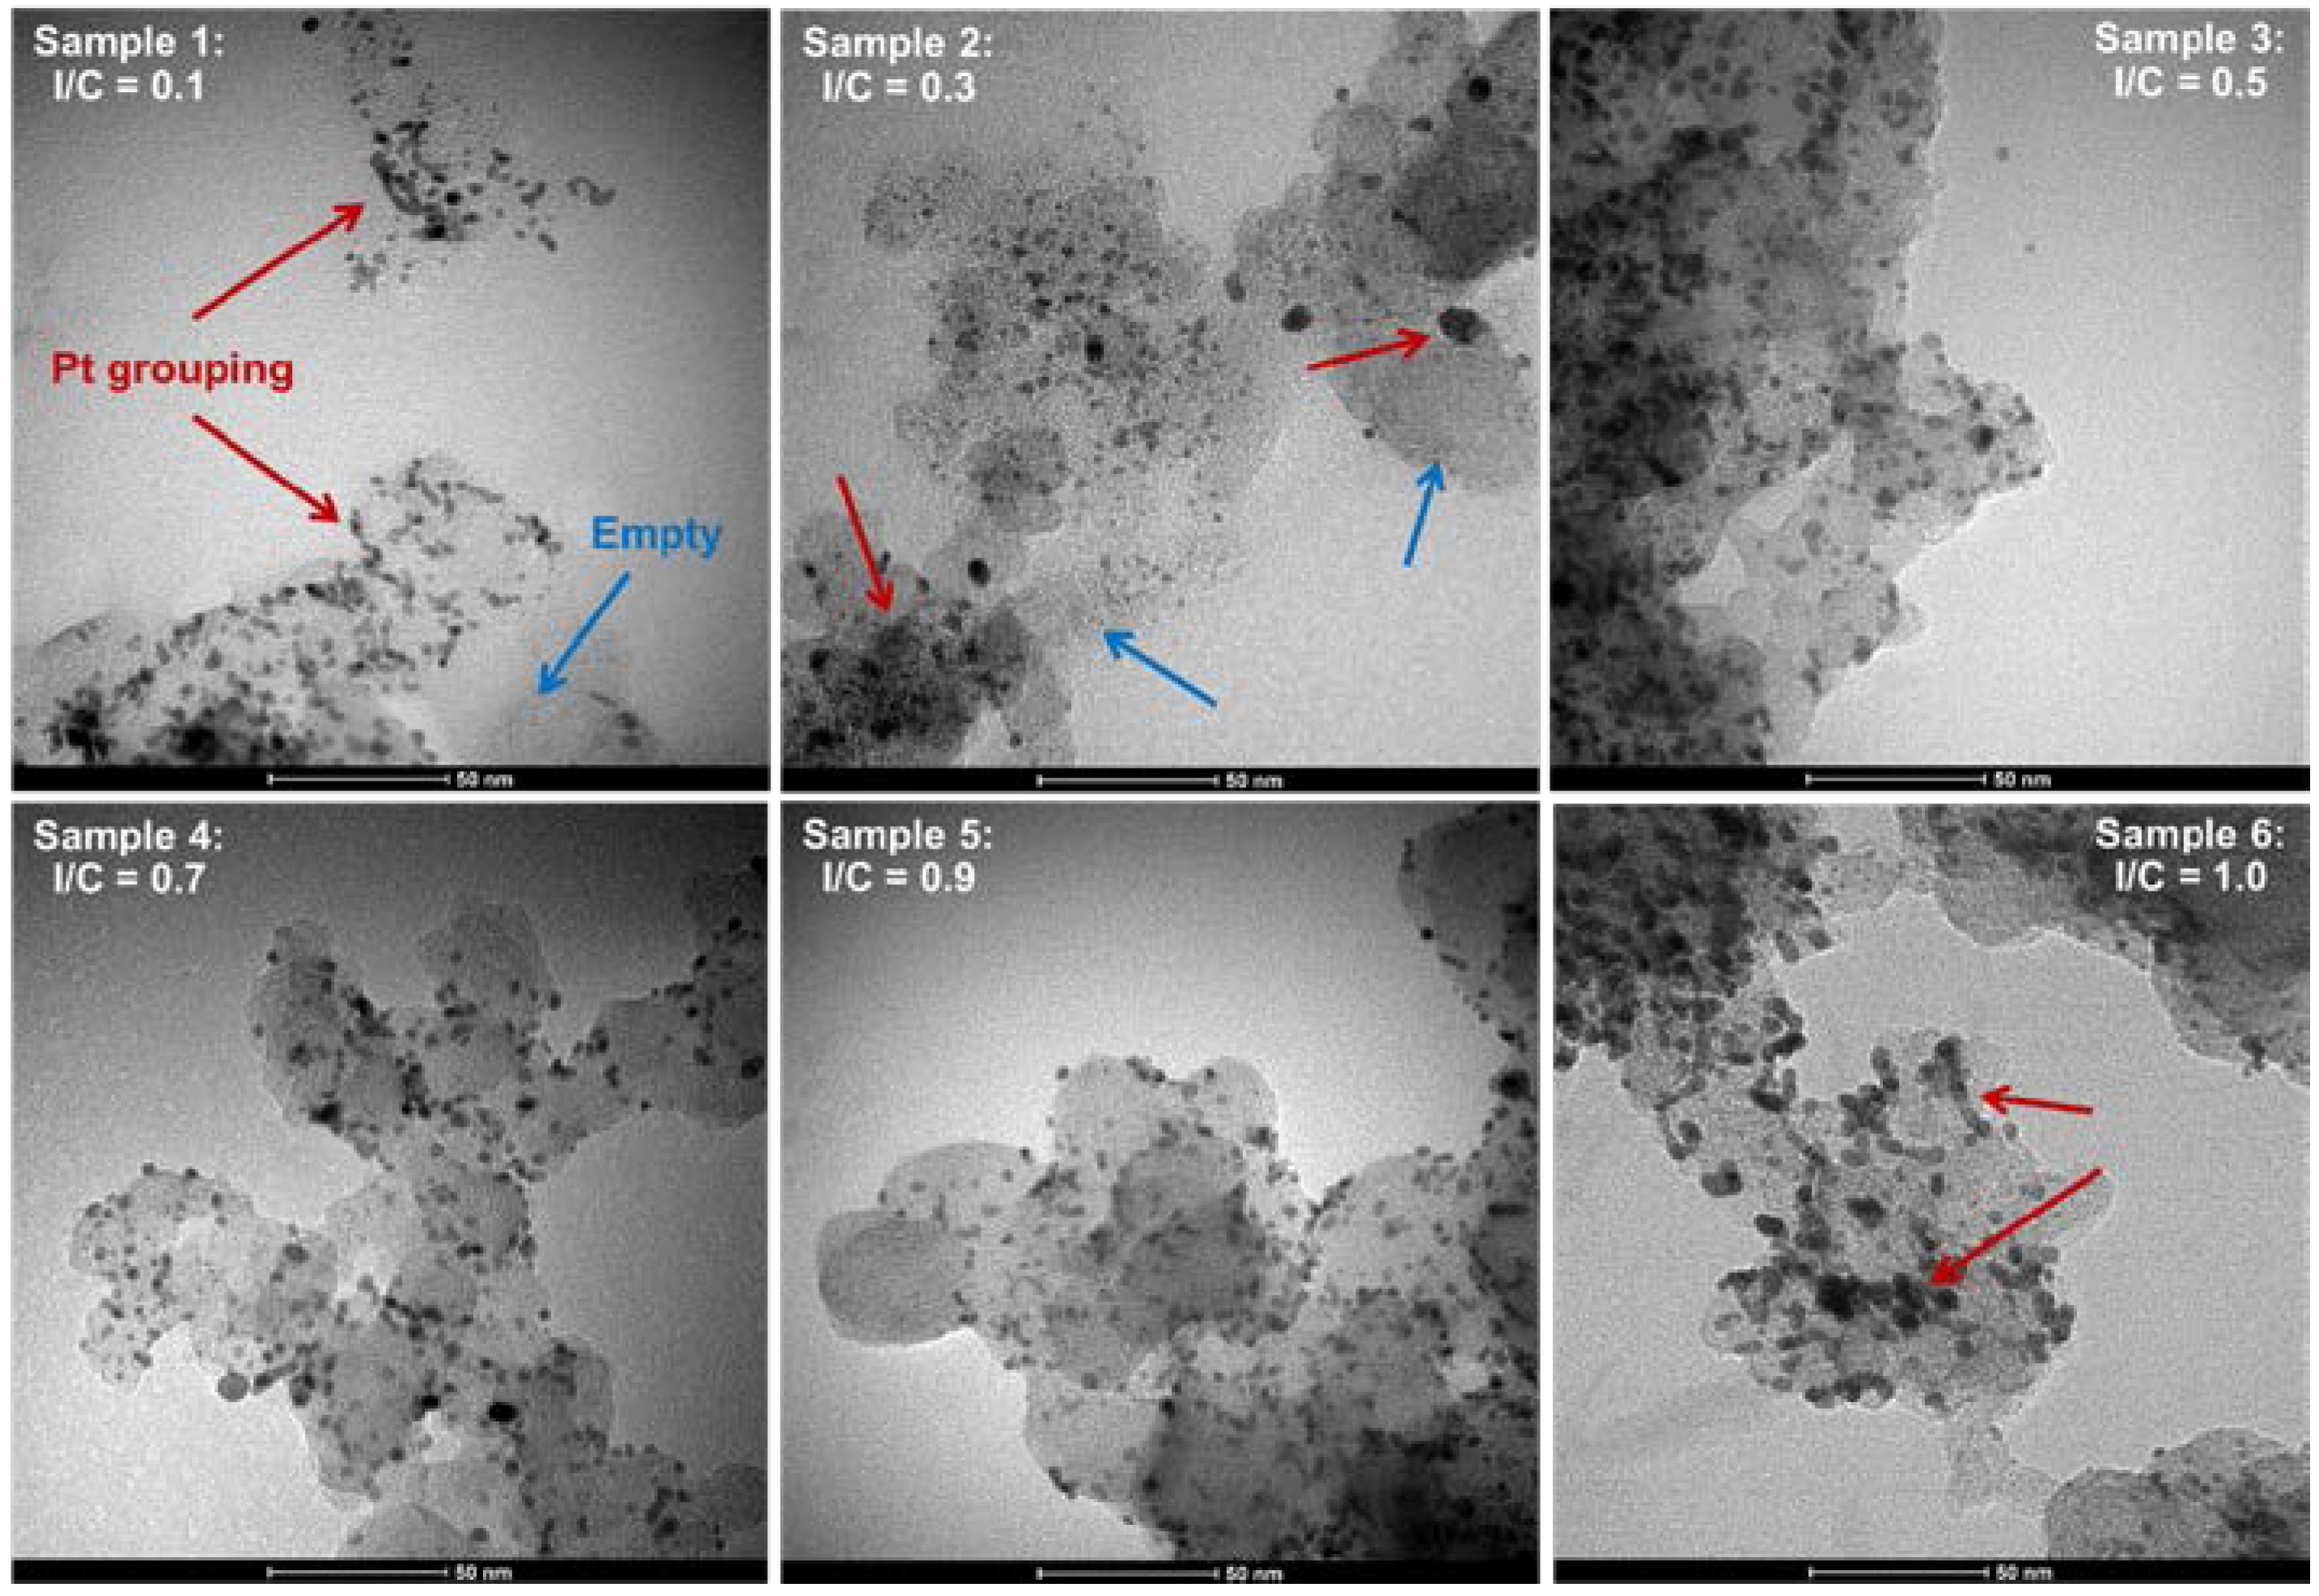
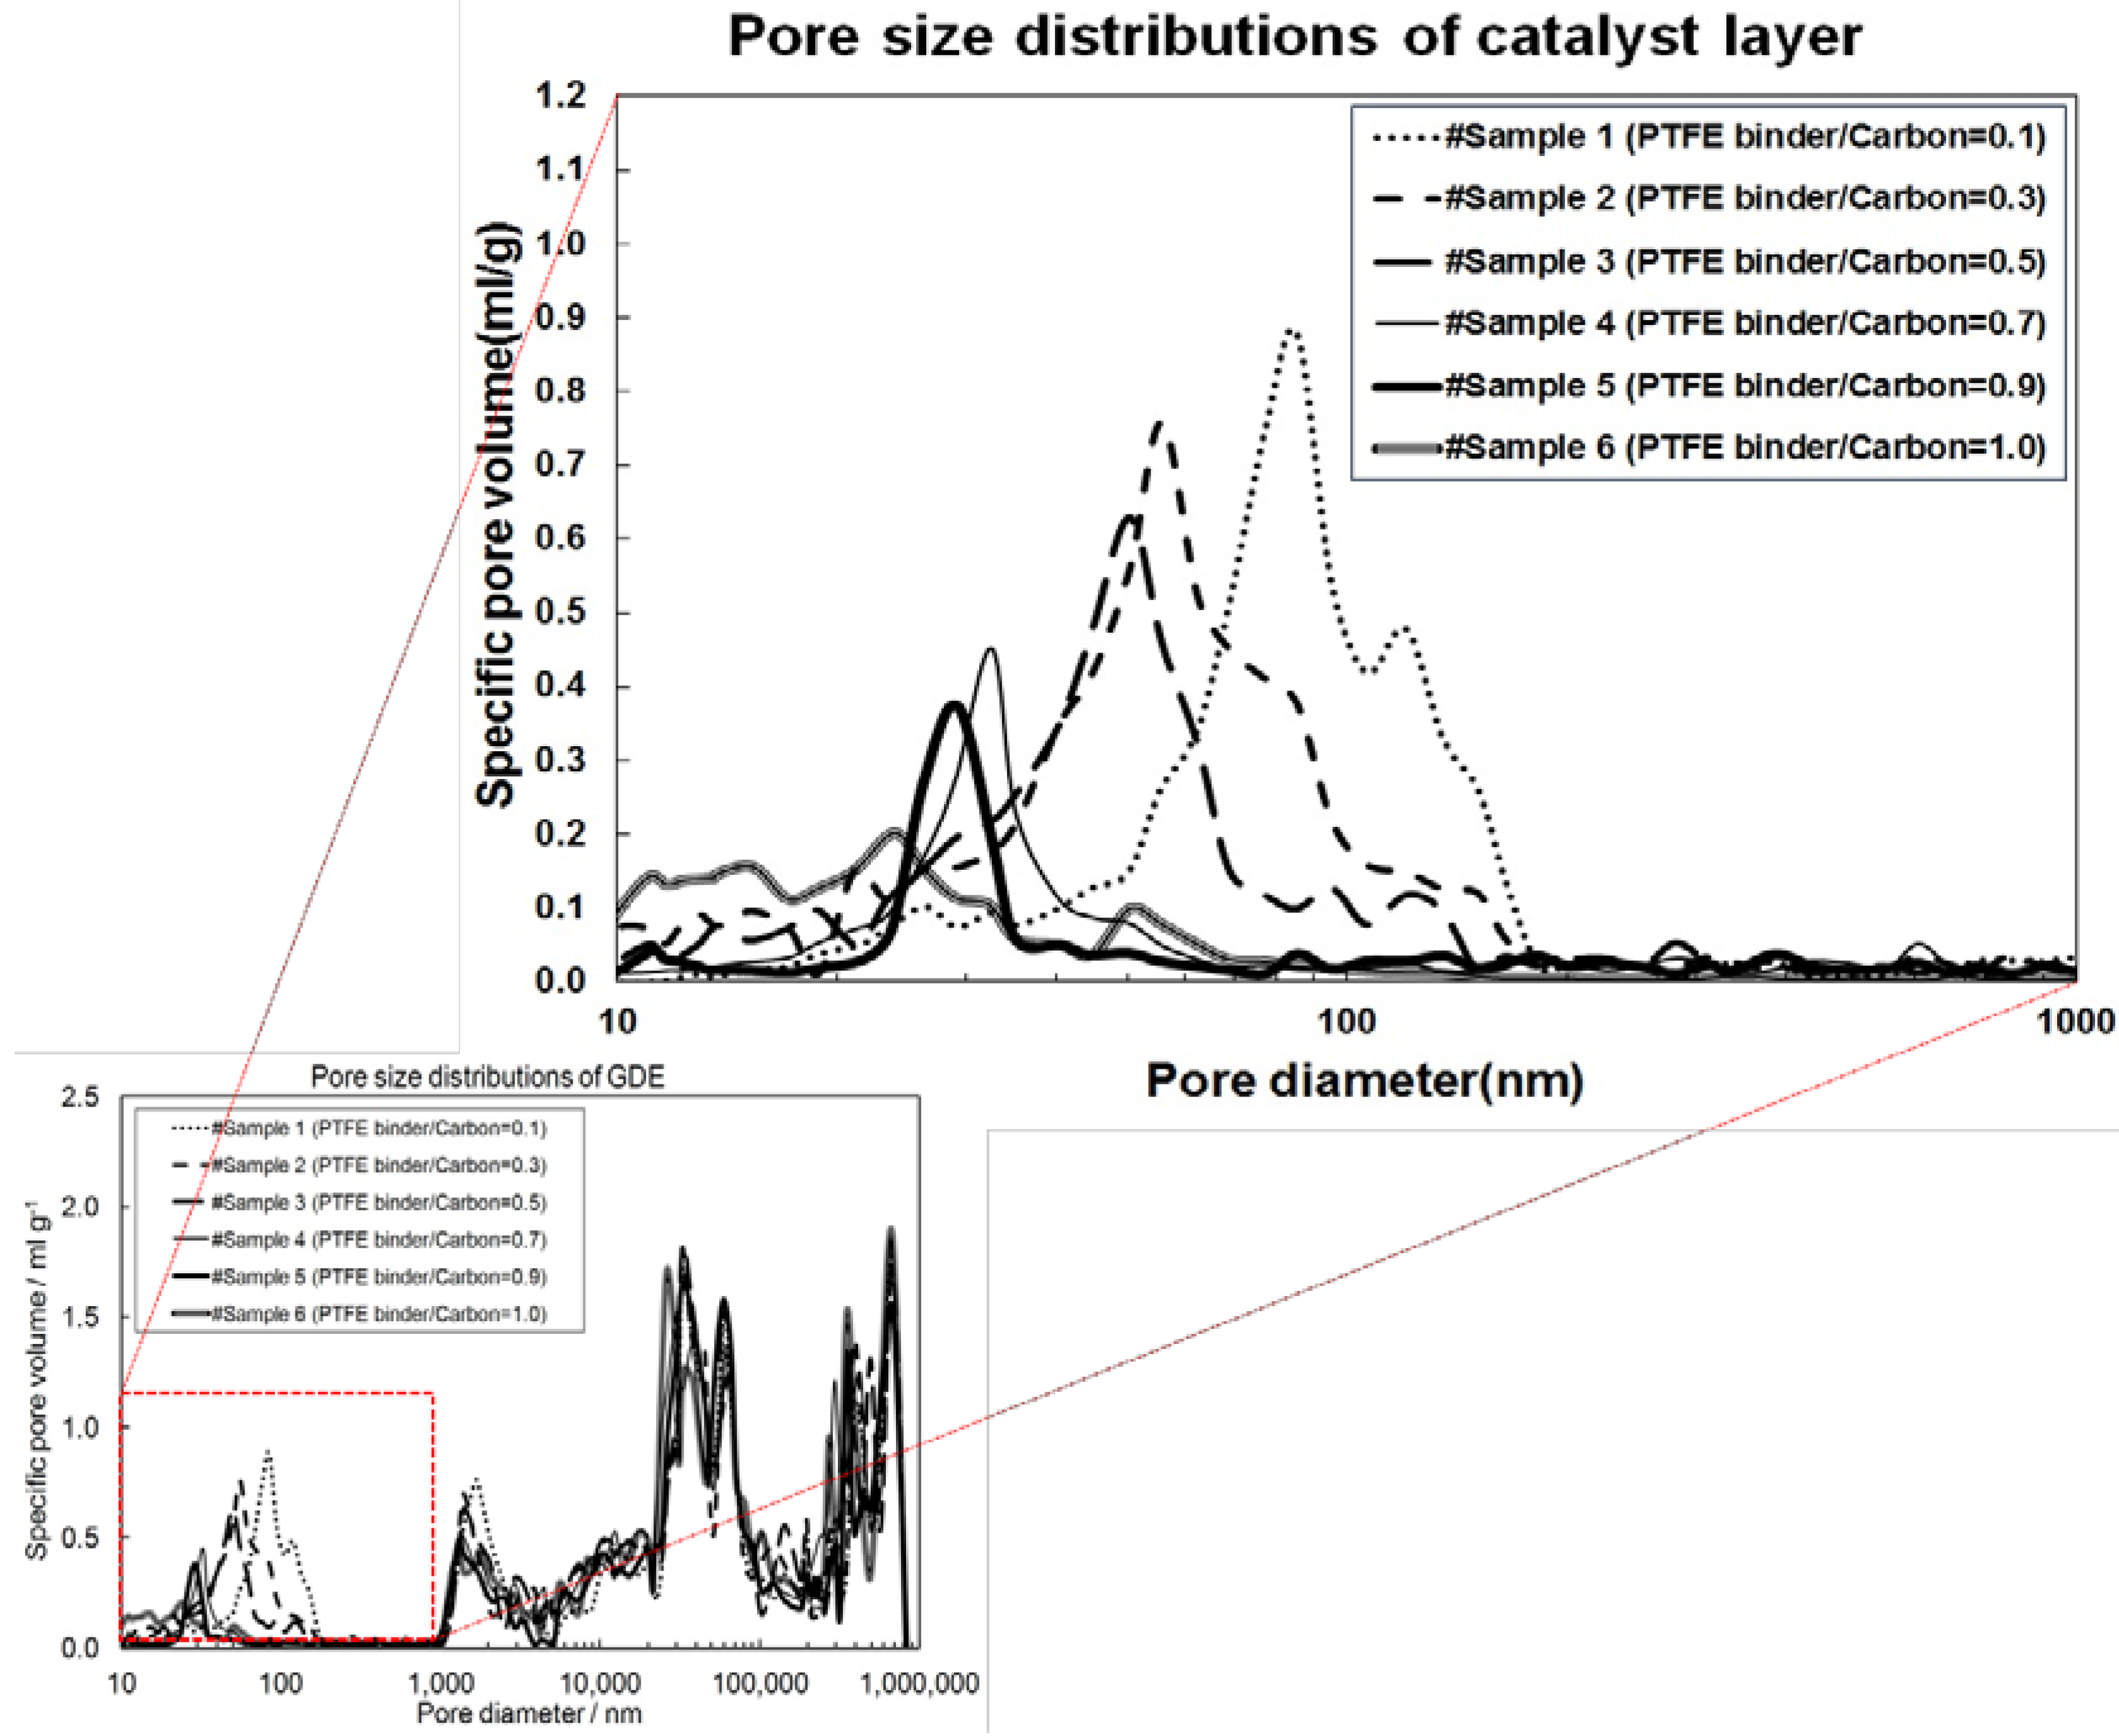
2.2. Effect of I/C Ratio

Three parameters were used to describe the experimental data: j 0 , c , κ, and Γ. More details on the modeling approach are provided in Section 3.2. Each of the parameters is representative of one of the characteristic regions of a typical fuel cell polarization curve: the activation loss region, the ohmic loss region, and the mass transport limiting region, respectively. Figure 3 shows the results for each parameter as a function of I/C at various temperatures.
Figure 3. Correlation parameters as a function of I/C for different temperatures. Inset (a) represents the exchange current density parameter, j 0 , c , (b) represents the area specific resistance parameter, κ, and (c) represents the geometric parameter, Γ.
Catalysts 05 01673 g003
When examining the behavior of the parameters in Figure 3, it is observed that j 0 , c and Γ have similar trends towards increasing performance with increasing I/C up to 0.9 at which point the trend starts to invert. However, κ has a slightly different behavior where there is an initial increase between I/C = 0.1 and 0.3. At elevated temperatures, there is a steady decrease between I/C = 0.3 and 0.9 followed by an increase again at I/C = 1.0. At lower temperatures, however, this trend is obscured. The observed behavior can be understood by considering the pore size distribution (obtained via mercury intrusion porosimetry using a Micromeritics AutoPore IV 9500) reported in our previous work [28]. As the I/C ratio was increased, there was a shift in the average pore size towards smaller pores in the 0–1000 nm range (the relevant range for the catalyst layer). Figure 4 shows this shift in the pore size distribution.
Figure 4. Pore size distribution of the gas diffusion electrode (GDE) (adapted from [28] with permission). Blow up shows the range from 0–1000 nm which is attributed to the catalyst layer.
Catalysts 05 01673 g004
Li et al. showed that a critical radius exists within a porous catalyst layer below which the pores are completely flooded with acid and above which they are gas filled with a coating of acid on the pore walls [40]. Due to the shift in the pore size distribution towards smaller pore radii, the number of acid flooded pores can be expected to increase. This behavior can be used to explain the observed trends in the three correlation parameters shown in Figure 3. Furthermore, as discussed in Section 3.2, it is assumed that the gas phase mass transport resistance has a negligible effect on cell performance for this particular HT-PEMFC configuration. The fact that an increase in cell performance occurs despite a decrease in overall pore size and porosity with increasing I/C ratio is supportive of this assumption since a reduction in porosity would tend to negatively impact gas phase transport.
Beginning with the exchange current density parameter, j 0 , c , there is a general upward trend in its value until a maximum is obtained between I/C = 0.7 and 0.9 at which point the trend starts to decrease. This behavior can be rationalized by considering the catalyst roughness, ac, (Equation (3) in Section 3.2). As the I/C ratio increases and smaller pores are favored, causing increased flooding of those pores in the catalyst layer with phosphoric acid, there will be less catalyst surface area exposed directly to the reactants since it is assumed that reactions occur primarily in the acid films coating the walls of the larger, gas filled pores. As pointed out by Li et al. [40], the coated film approach assumes that only the catalyst material within these larger pores are electrochemically active while the catalyst material in the depths of the completely flooded pores is unutilized. Simultaneously, the ionic interconnectivity between the larger gas filled pores will likely be improved, which will activate otherwise isolated catalyst material. The net effect is an initial increase in the effective surface area of the catalyst until the pores become too small and the catalyst layer begins to flood completely causing a drop in the surface roughness, and consequently, the exchange current density at I/C ratios above 0.9. It is also possible that excessive PTFE binder begins to cover the catalyst sites at high I/C ratios creating the same effect.
The behavior of the area specific resistance parameter, κ, is more complicated than the others. As mentioned above, there is an initial increase in κ between I/C = 0.1 and 0.3, followed by a general decrease with increasing I/C up to I/C = 0.9. At elevated temperatures, 190 °C and 200 °C, there is a second increase between I/C = 0.9 and 1.0. As explained in Section 3.2, it is believed that the ohmic resistance parameter is a combined effect of the catalyst layer ionic resistance, the contact resistance between the membrane and the GDE, and the electrolyte resistance. When the I/C ratio is changed at constant temperature it is not expected that the electrolyte resistance should change and thus the behavior of κ should be related to changes in contact resistance and catalyst layer resistance. The initial increase in the cell resistance can likely be explained by the very low I/C ratio. For such a low ratio, there is an abundance of hydrophilic carbon present in the catalyst layer. This, coupled with the greater porosity as evident in Figure 4, will lead to a much greater level of phosphoric acid in the electrodes. There will be large scale flooding of the cathode, which will have a negative impact on the other cell parameters, but will lead to excellent ionic conductivity of the catalyst layer. When the I/C ratio is increased, this high level of flooding will be reduced causing the increased cell resistance observed in Figure 3. The resistance is then observed to decrease with increasing I/C between 0.3 and 0.9 most likely for similar reasons discussed in relation to the exchange current density. As the shift towards smaller pore sizes continues, more pores will be sized below the critical pore radius and there will be an improvement in the phosphoric acid percolation network. As the I/C ratio increases beyond 0.9, Figure 4 indicates a breakdown in the uniformity of the pores, which may cause increased contact resistance. It is also possible that excessive levels of hydrophobic binder can begin to impede capillary action. These two scenarios would then seem to be exacerbated by increased temperature explaining the strong increase in resistance for higher temperatures at I/C = 1.0.
The behavior of Γ can be explained similarly to the exchange current density in terms of the effect on the active catalyst surface area. However, it is conceivable that increased flooding begins to cause an increase in the thickness of the phosphoric acid film in the larger gas pores. This would tend to hinder the transport of the reactants. The trend observed in Figure 3 would then be the result of a balancing of the two opposing effects.
It is worth mentioning that the improvement to the catalyst roughness can also be attributed to improved distribution of the platinum nanoparticles as discussed in Section 2.1 and [28]. The optimum I/C ratio gives the most uniform platinum distribution in the catalyst layer, which helps maximize utilization. However, this improved distribution would not directly affect the behavior of κ indicating there is an effect of changing phosphoric acid distribution in the catalyst layer.

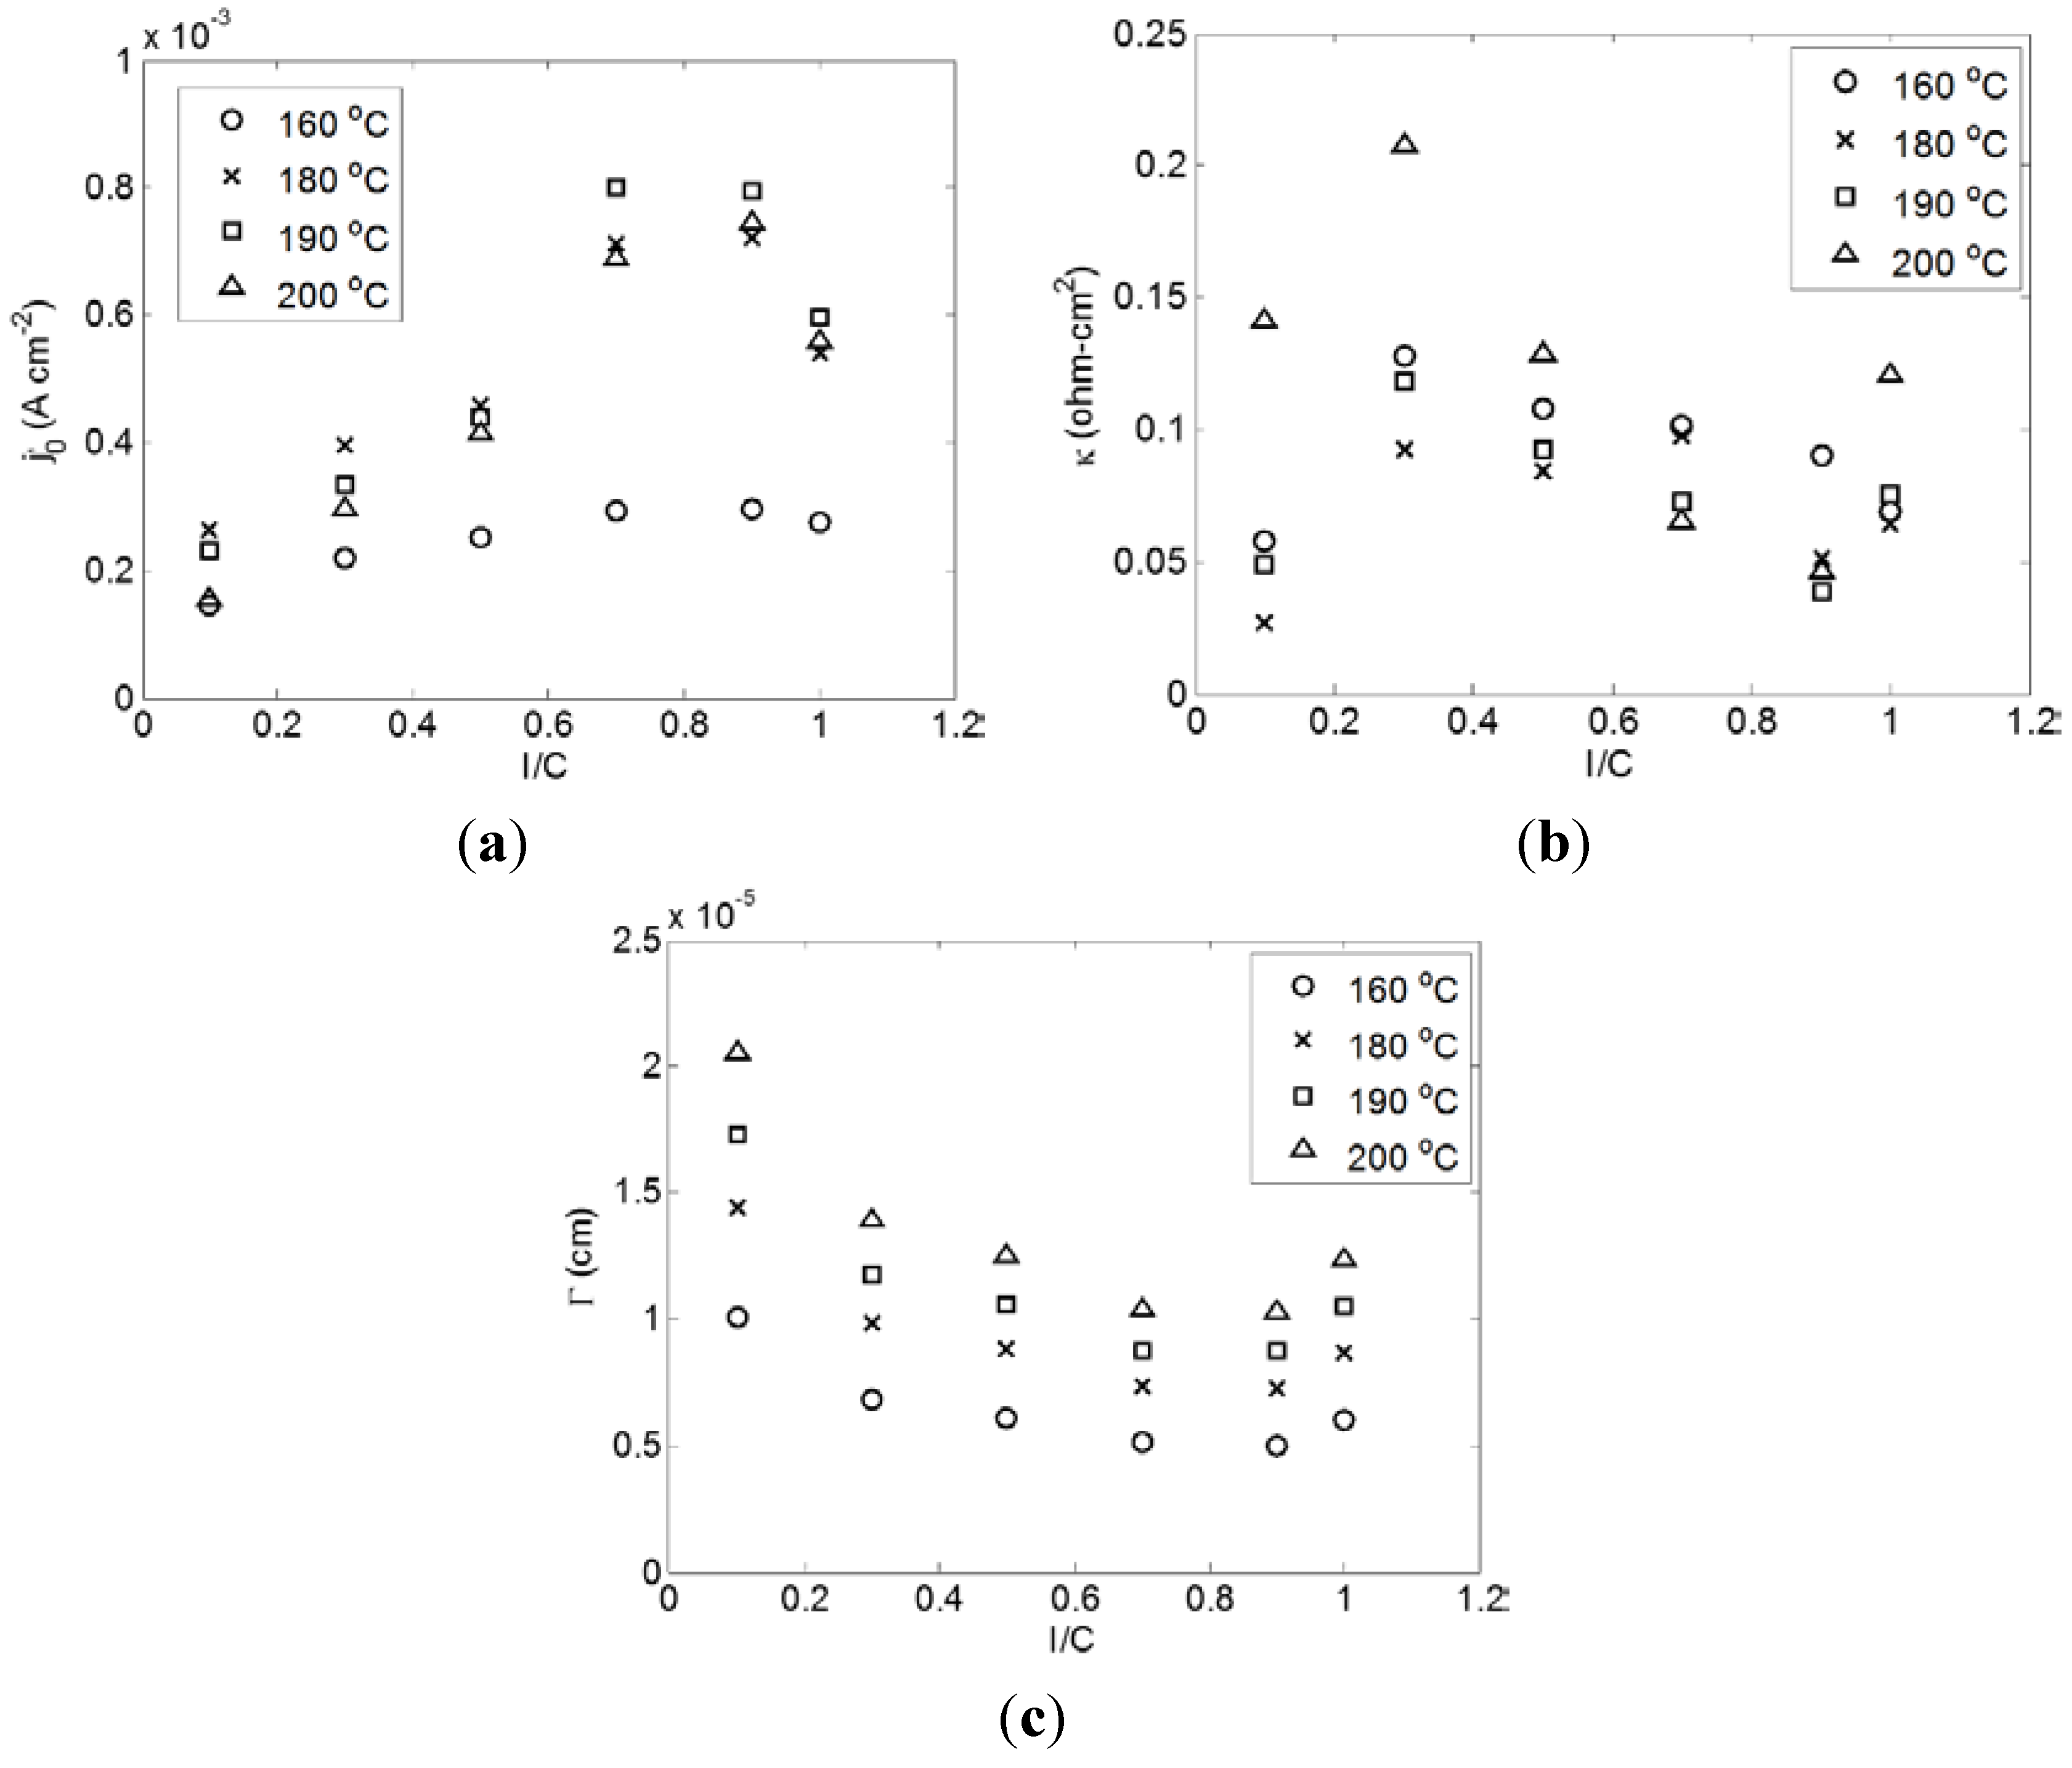
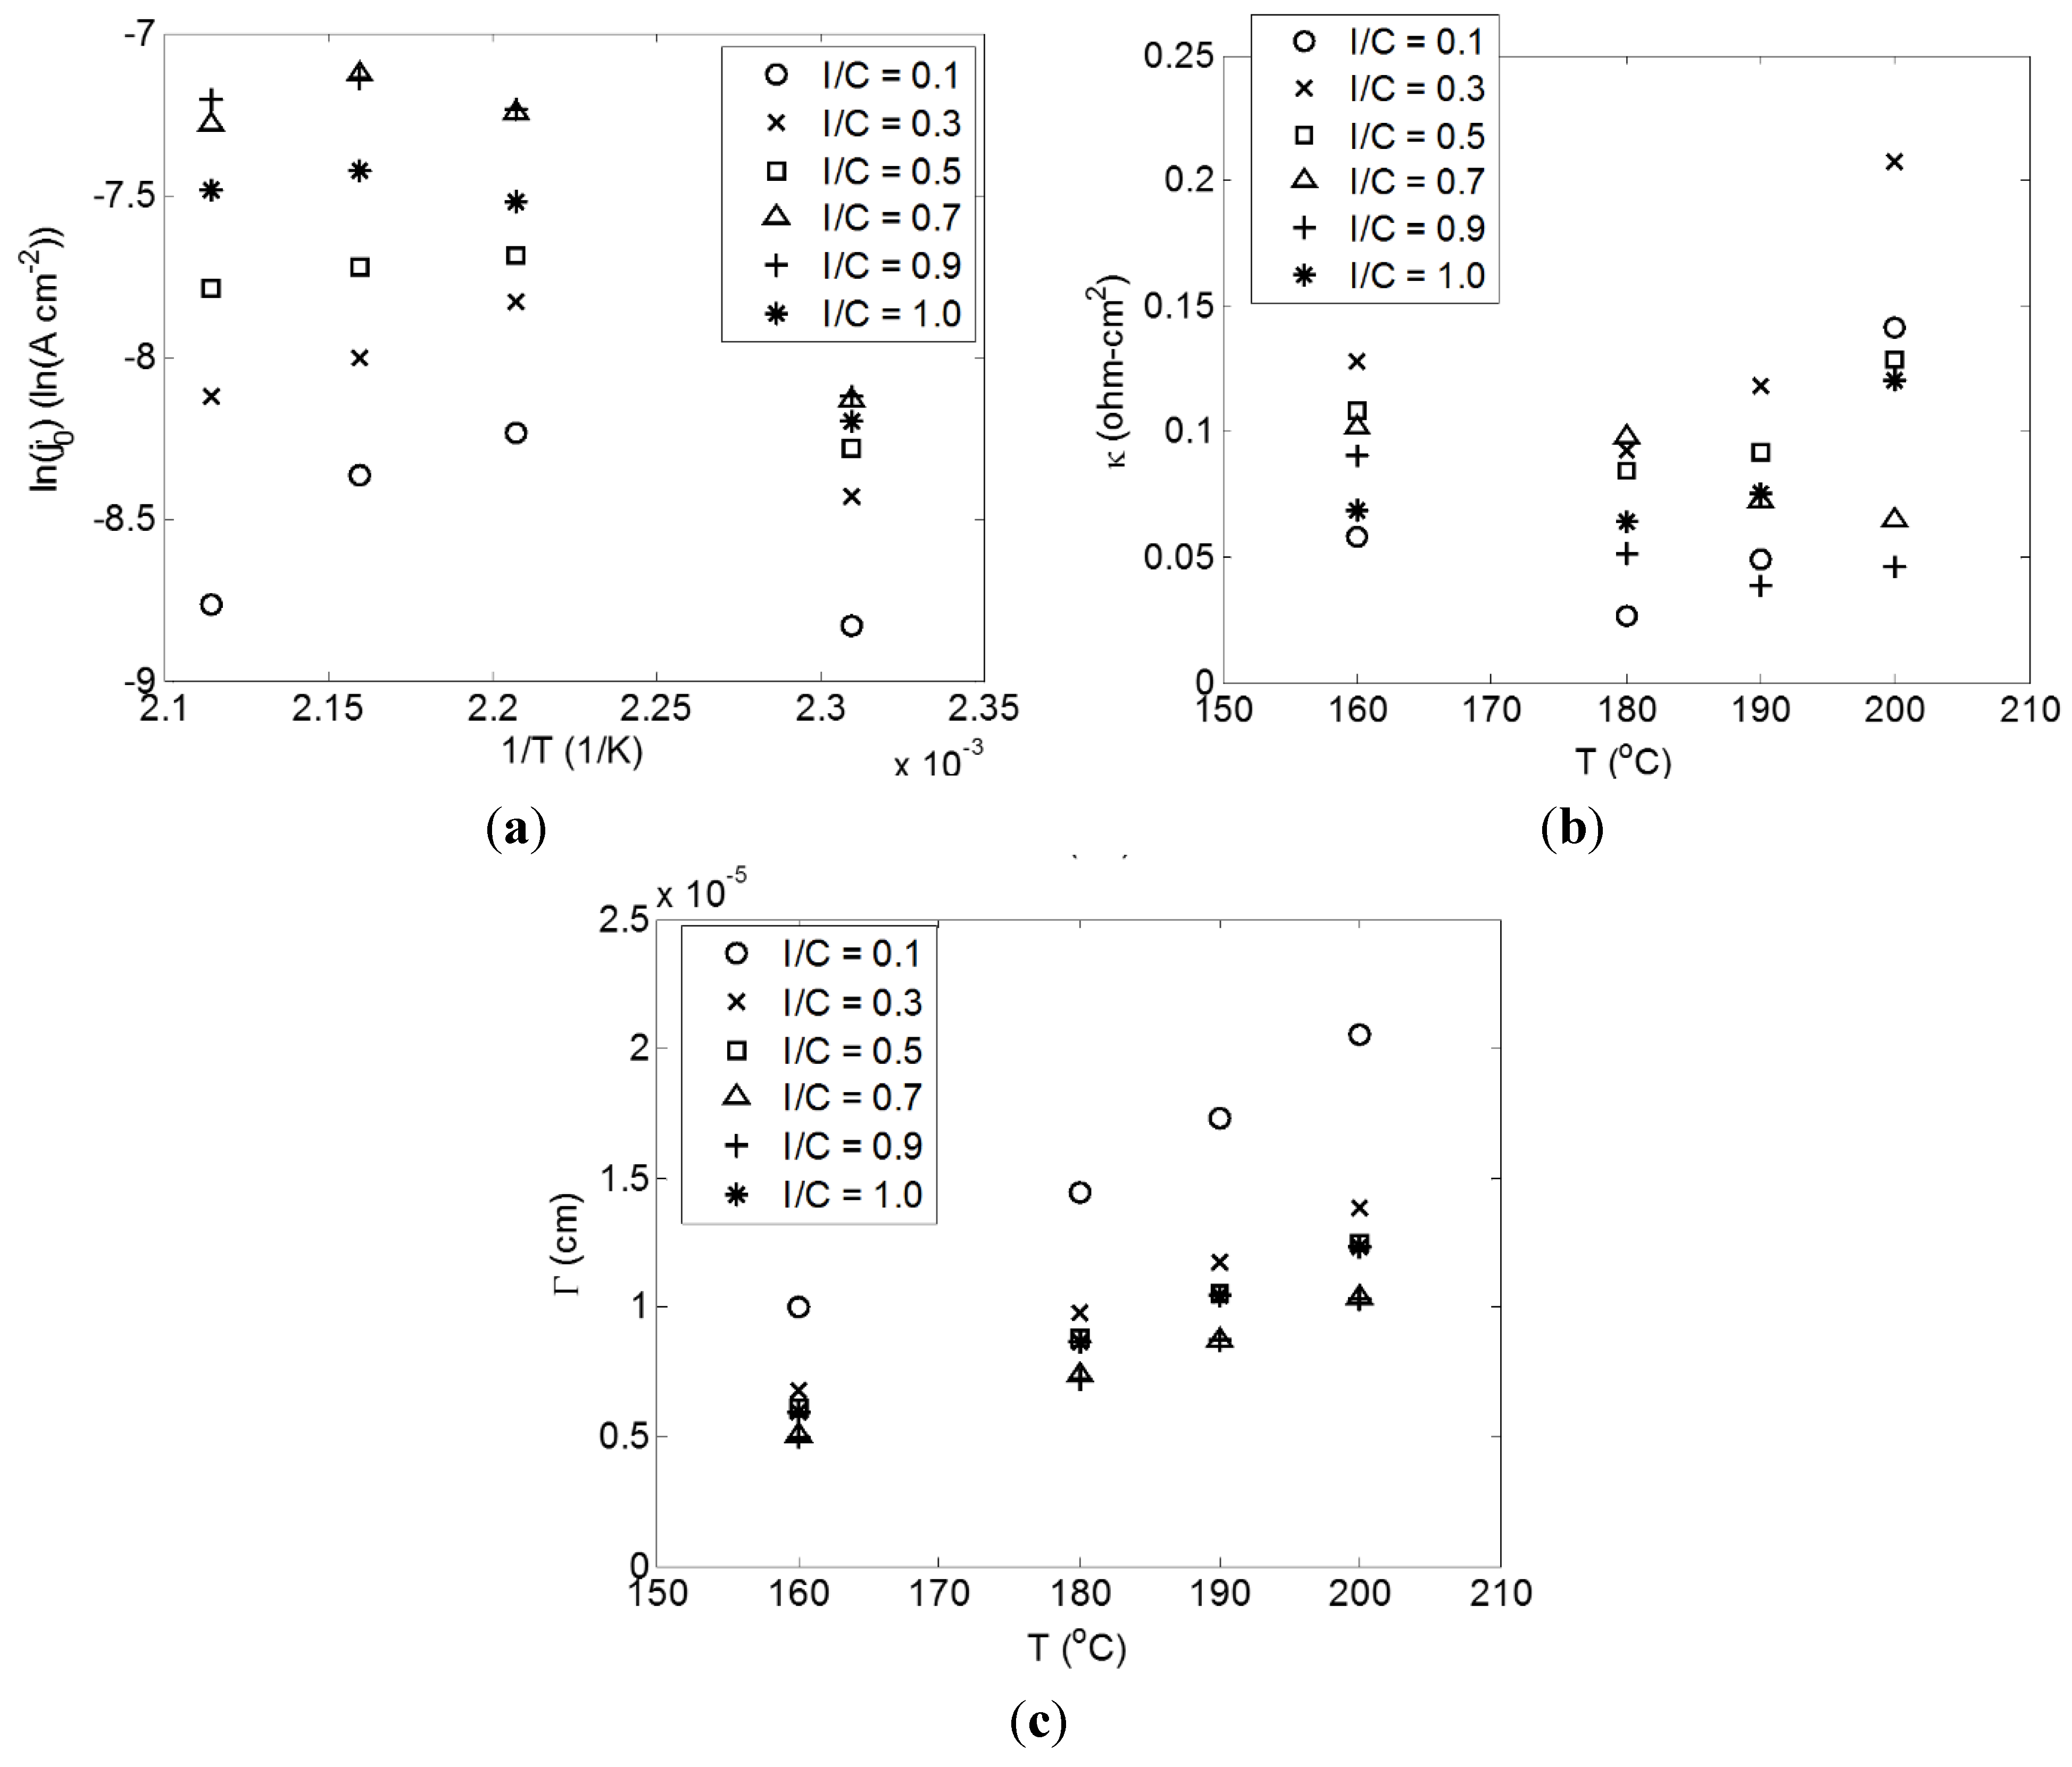
2.3. Effect of Temperature

Aside from the effect of the I/C ratio, there is an interesting behavior of the three parameters with operating temperature, which are shown in Figure 5.
Figure 5. Correlation parameters as a function of temperature for I/C ratios. Inset (a) represents the exchange current density parameter, j 0 , c , (b) represents the area specific resistance parameter, κ, and (c) represents the geometric parameter, Γ.
Catalysts 05 01673 g005
The exchange current density parameter, j 0 , c , does not display the Arrhenius relationship one might initially expect. This departure from linear behavior is caused by the catalyst roughness, which decreases with increasing temperature. Similarly, the parameter Γ increases with temperature since the surface roughness influences it as well. As discussed in Section 2.2, an increase in the phosphoric acid content of the catalyst layer, to a point, increased the catalyst electrochemically active surface area. The trend observed in Figure 5 seems to indicate a reduction of phosphoric acid saturation within the catalyst layer with increasing temperature. The reason for this phenomenon requires further exploration, but it may be possible that there is a shift to a lower critical radius with increasing temperature or the TPS® membrane has a higher phosphoric acid retention at elevated temperatures leading to decreased migration into the catalyst layer. It is interesting to note that the negative influence on j 0 , c is enhanced at the less optimum I/C ratios (i.e., there is a maximum influence for I/C = 0.1 and a minimum for I/C = 0.9). The reason for this behavior can be attributed to better interconnectivity of the pores at the optimum I/C ratio. Even as the phosphoric acid content decreases, the remaining phosphoric acid has better percolation, which leads to a higher active catalyst surface area. The effect of the reduced surface roughness appears to be less pronounced for the Γ parameter, which can be explained by a simultaneous reduction in film thickness as the overall phosphoric acid content in the electrodes decreases.
Regarding κ, there are unique behaviors with temperature depending on the I/C ratio. For I/C = 0.1, 0.3, and 0.5, there is an observed initial decrease in the resistance with increasing temperature followed by an increase at the higher temperatures. For I/C = 0.7 and 0.9, the resistance tends to more or less decrease with increasing temperature. Finally, for I/C = 1.0, the resistance increases as temperature increases. It is important to keep in mind here that there are several competing effects at play. The membrane conductivity, which was unchanged with respect to I/C, should be expected to have increased ionic conductivity as temperature increases. This will be partly responsible for any observed decreases in resistance with increasing temperature. The hypothesized reduction of phosphoric acid migration into the catalyst layer will reduce the effective conductivity of the catalyst layer with increasing temperature. Lastly, the contact resistance may be expected to change depending on the relative thermal expansion rates of the fluorinated ethylene propylene (FEP) gasket and the TPS® membrane as illustrated in Figure 6. The different trends observed for different I/C ratios are then a product of the porous structures unique to each I/C ratio and how those influence phosphoric acid distribution. For the more optimum structures, I/C = 0.7 and 0.9, the negative influences are reduced and increasing phosphoric acid conductivity outweighs reduced migration or potential increased contact resistance. For less optimum structures, the decreased migration of phosphoric acid into catalyst layer overtakes increasing acid conductivity to result in a net increase in cell resistance.
Figure 6. Schematic of the single cell cross section. Measurements in parenthesis indicate thicknesses on the specified component.
Catalysts 05 01673 g006

3. Methods

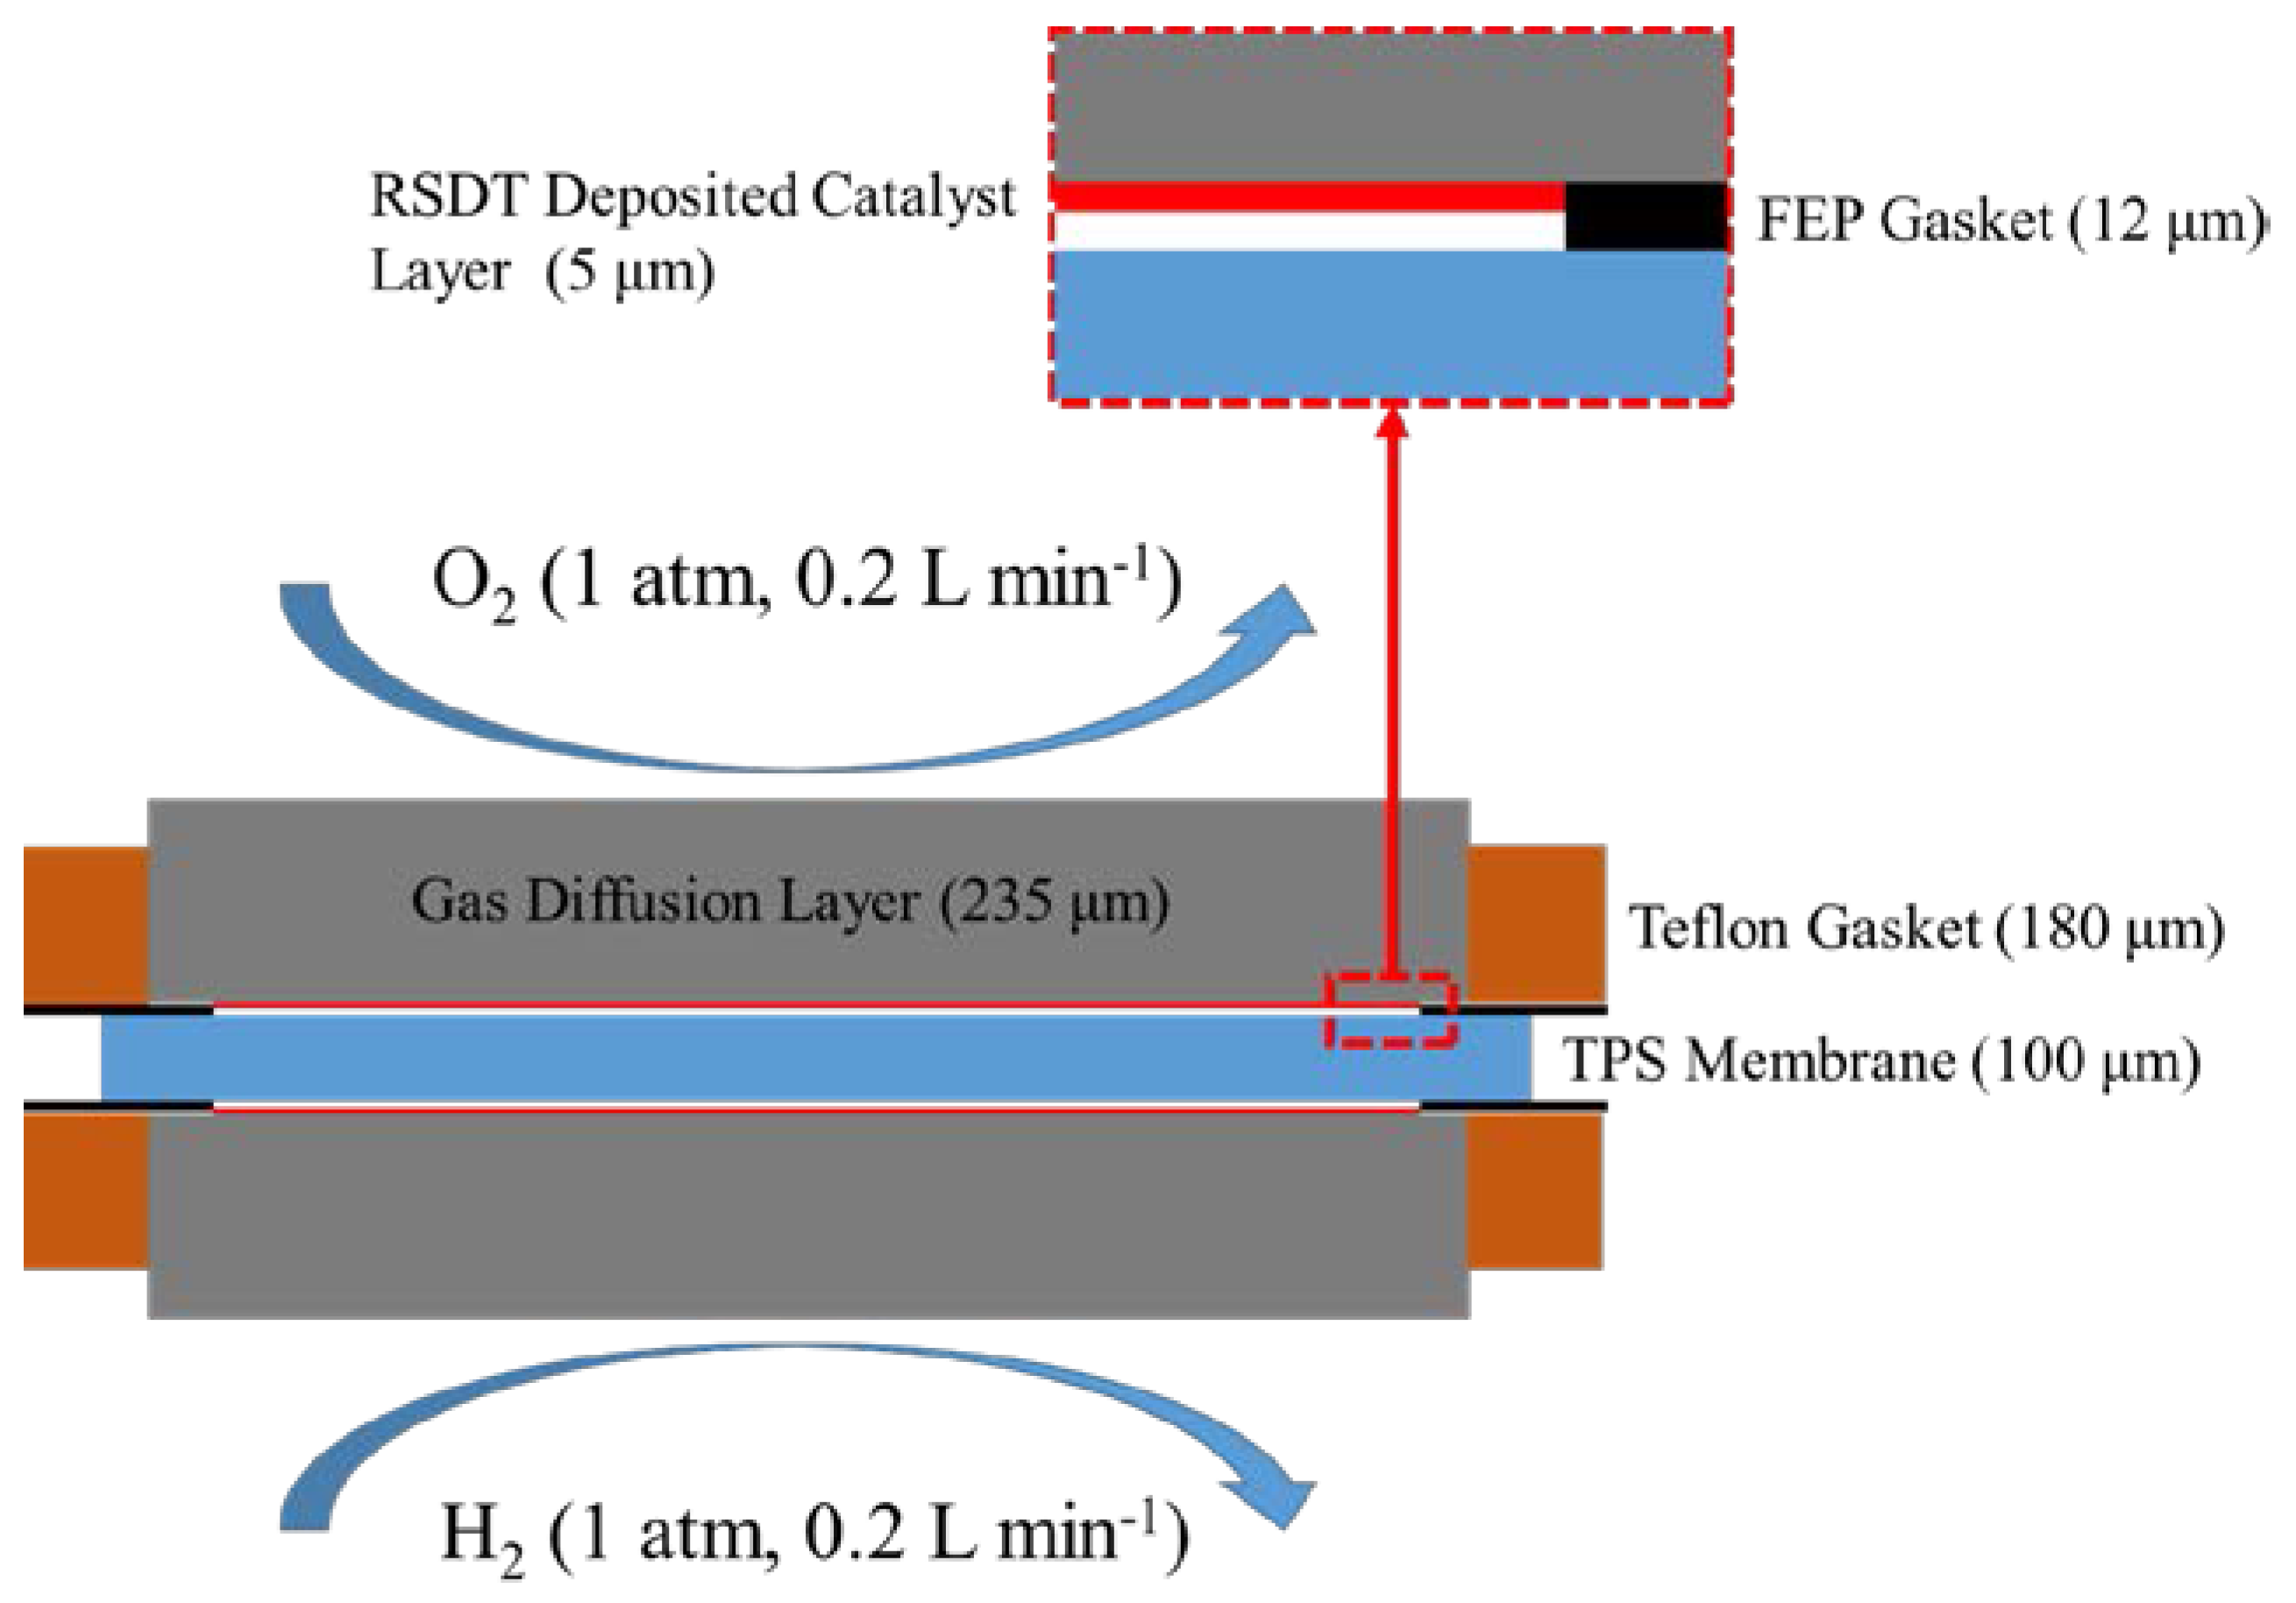
3.1. Experimental Section

The experimental details related to the HT-PEMFC assembly and testing are available in detail in [28]. Additional RSDT publications provide further details on the device and effects of process parameters [51,52]. A brief summary of conditions follows. GDEs were fabricated by RSDT. RSDT is an open atmosphere, flame based, deposition process that utilizes the enthalpy of combustion of highly flammable solvents to decompose metal-organic precursors. In this work, platinum(II) acetylacetonate (Pt(acac)2, Colonial Metals, Elkton, MD, USA) was the Pt precursor, which was dissolved directly into the solvent. The solvent was a mixture of xylene, acetone (Sigma Aldrich, St. Louis, MO, USA), and thiol-free propane (Airgas East Inc., Cheshire, CT, USA). The precursor solution was then pumped through an atomizing nozzle and the resulting droplets were continuously ignited with a pilot flame, facilitating the decomposition of the precursor metal in the high temperature reaction zone of the flame (1000–2000 °C). The support material was introduced post-combustion by a set of two secondary nozzles that sprayed a slurry consisting of carbon (Vulcan XC-72R, Cabot Corp., Boston, MA, USA) and various concentrations of polytetrafluoroethylene (PTFE) binder dissolved in dimethylformamide (DMF, Sigma Aldrich, St. Louis, MO, USA). These secondary nozzles were placed on either side of the primary nozzle and angled such that the resulting spray intersected within the post luminous zone of the flame. The resulting spray (consisting of the platinum, carbon, and PTFE) was directed at the GDL substrate (SIGRACET® GDL25BC) to manufacture the GDE in a single step process. The nominal platinum loading for each electrode was kept constant at 0.05 mg·cm−2 giving a combined loading of 0.1 mg·cm−2, which achieves the DoE 2017 target of 0.125 mg·cm−2. The I/C ratios were 0.1, 0.3, 0.5, 0.7, 0.9, and 1.0 for Samples 1–6, respectively.
As mentioned above, Advent TPS® membranes were utilized as the polymer electrolyte material for the MEA. The membranes were doped with 85 wt. % phosphoric acid (the remaining 15 wt. % being water). The doping process involved immersing the membrane for 16 h (open to air) in acid heated to 120 °C. The membranes were weighed before and after doping and an average mass increase of 218% was observed (standard dev., σ = 6.24%). Assembly of the MEA was done with a Carver hot press where the procedure consisted of: 60 °C, 10 min, 2500 lbs. loading; 75 °C, 10 min, 2500 lbs. loading; 90 °C, 20 min, 2500 lbs. loading; 110 °C, 15 min, 2500 lbs. loading; 150 °C, 10 min, 2500 lbs. loading; 150 °C, 15 min, 5000 lbs. loading; Cool down rapidly at 45 °C.
The assembled MEAs (active area 5 × 5 cm2) were tested in a single cell configuration. FEP gaskets were used to seal the edges of the cell to prevent leakage of the phosphoric acid (Figure 6). While the use of these gaskets is necessary, it is believed this may create some elevated contact resistance between the GDE and the membrane. The contact resistance was explicitly accounted for in the model.
Prior to performing fuel cell polarization tests, the cell was held at 0.6 V for 3 h for performance break-in. Typically, around 24 h is necessary for a break-in period for PEMFC technology but it was found that stable voltages were achieved after 3 h in this case. This may be due to the lack of external humidification, which is required to hydrate a low temperature PEMFC that requires long periods of time to reach steady state. The cell operating temperature was varied between 160 and 200 °C. The anode was exposed to 1 atm of hydrogen gas at a flow rate of 0.2 L·min−1 while the cathode was exposed to 1 atm of oxygen at a flow rate of 0.2 L·min−2. Again, no external humidification was provided.

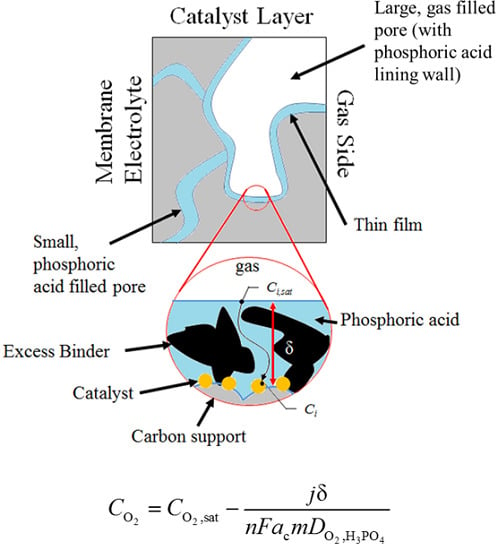
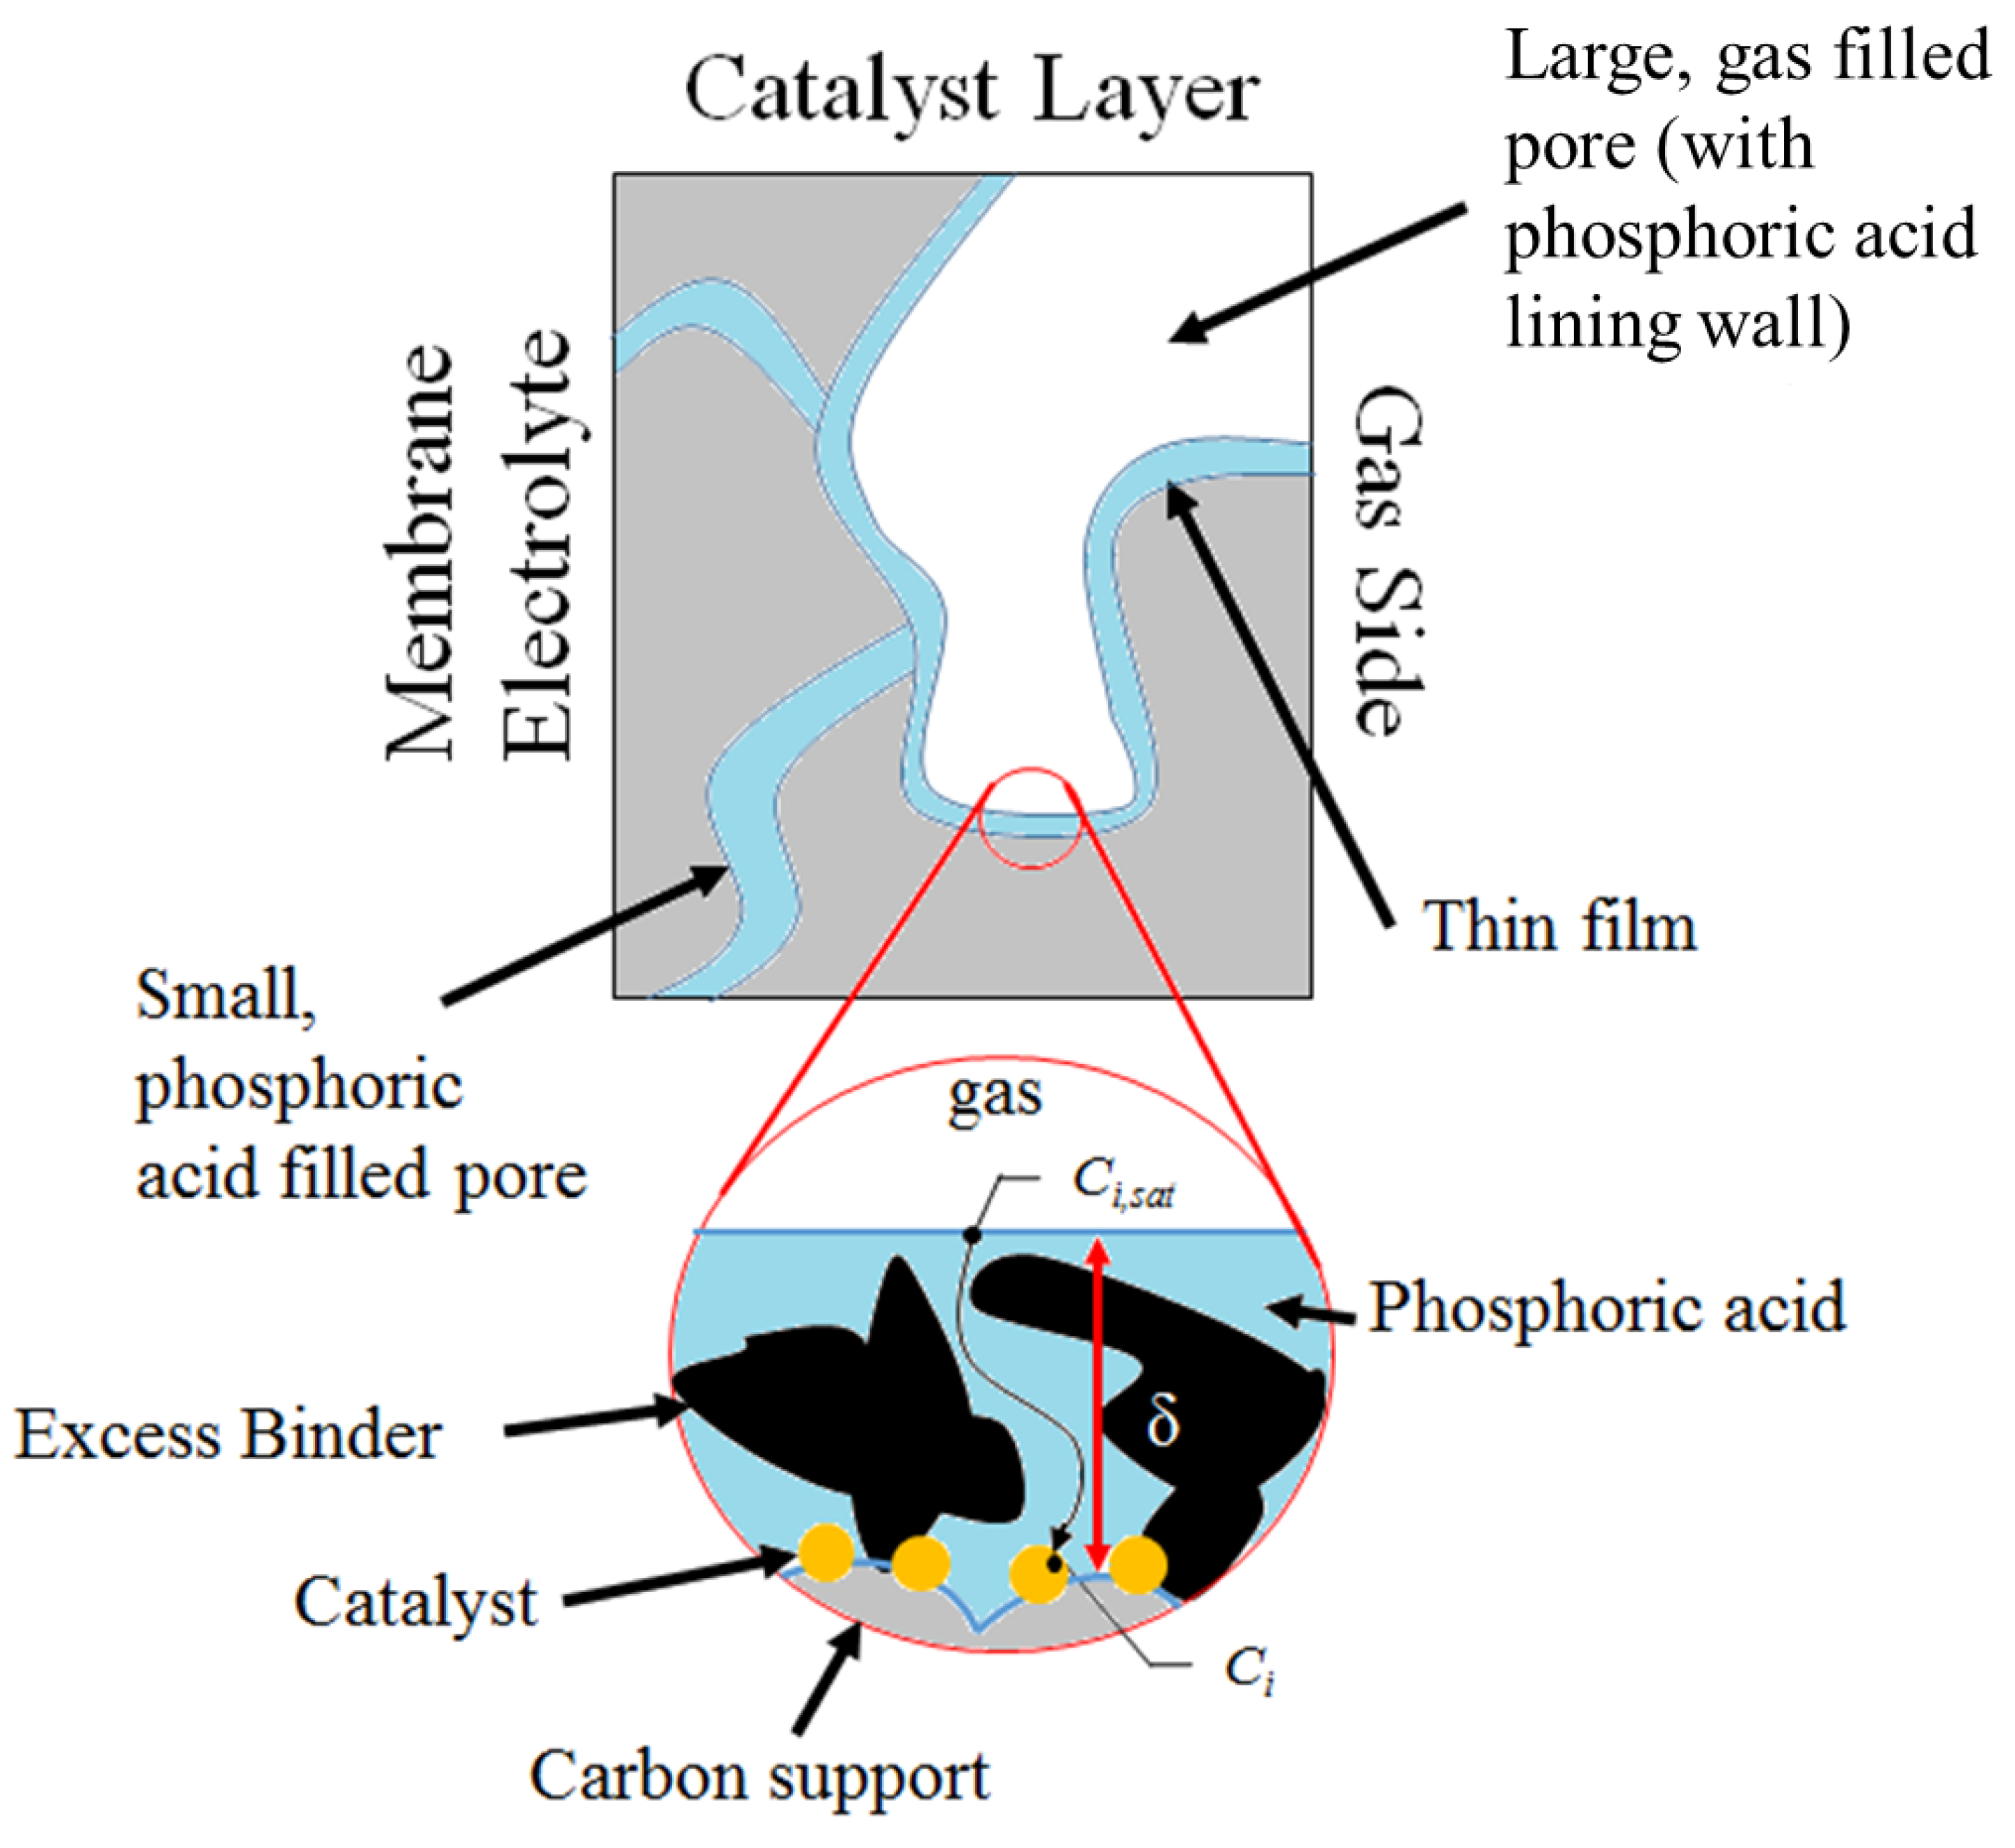
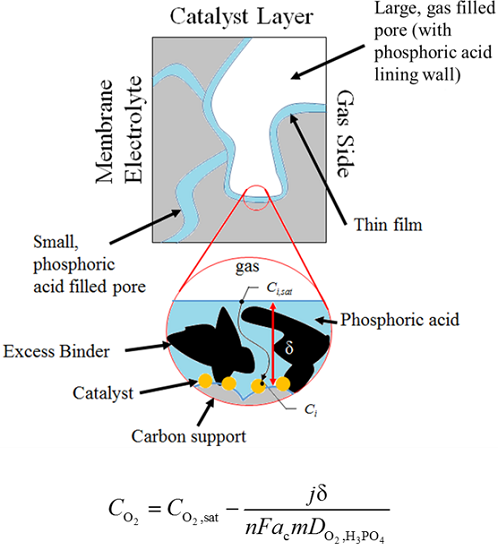
3.2. Performance Model

In order to predict the performance of the single cell, a semi-empirical model was developed. The derivation begins with a modified expression for the overall cell voltage.
Δ E = E OCV E cell = | η a,act | + | η c,act | + j κ
Due to the difficulty of predicting the OCV of the cell and to avoid a miscalculation of the exchange current density, the cell overpotential defined by ΔE in Equation (1) was used to calibrate the model to the experimental data. The OCV can typically be theoretically calculated using the Nernst equation and a crossover current term to account for fuel permeation through the electrolyte, but it was found that this approach did not yield satisfactory comparisons. This may be due to additional factors such as carbon corrosion and surface structure, as well as effects of locally varying acidity making it difficult to predict the true activity of the constituents. The terms on the right hand side of Equation (1) represent the activation overpotential of the anode and cathode, and the ohmic resistance losses of the cell, respectively. For the HT-PEMFC, the activation overpotential of the anode is assumed to be negligible due to the relatively facile reaction kinetics for hydrogen oxidation [53]. The cathode overpotential can be determined using Tafel approximation.
η c,act = R T α F ln ( j j 0,c )
The cathodic exchange current density, j0,c, can be expanded where the parameter j 0 , c groups the reference exchange current density, Arrhenius effect, and surface roughness together.
j 0 ,c = j 0,c ref a c ( C O 2 C O 2 ,sat ) γ exp [ E act R T ( 1 T T ref ) ] = ( C O 2 C O 2 ,sat ) γ j 0,c
For the ohmic overpotential, it is assumed that the major contributors to the overall cell resistance are the membrane electrolyte, the ionic resistance of the catalyst layers, and the contact resistance between the GDE and the polymer electrolyte. This implies all electronic resistance contributions from the cell are negligible.
κ = l m σ m + 2 l cl σ cl + R C
In this study, the overall area specific resistance, κ, is treated as an adjustable parameter. Combining the above expressions gives the relatively simple result:
Δ E = | R T α c F ln [ j ( C O 2 / C O 2 ,sat ) γ j 0,c ] | + j κ
At this point, it is necessary to introduce the physical description of the catalyst layer in order to calculate the oxygen concentrations in Equation (5). For this work, the coated film model has been adopted as schematically presented in Figure 7.
Figure 7. Depiction of the coated film model for the porous electrode (not drawn to scale).
Catalysts 05 01673 g007
This model describes a porous catalyst layer consisting of a mix of small phosphoric acid filled pores and larger gas filled pores. The smaller pores create a capillary action that draws phosphoric acid to the larger pores while also serving as a pathway for ion conduction to and from the membrane electrolyte. Due to the capillary effect feeding the larger pores, the pores become coated with a film of phosphoric acid. The walls of the pores are assumed to be lined with the catalyst material and the reactant gases must first diffuse through this coated film before reacting. It is assumed in this case that gas phase transport is negligible compared to the transport through the coated film. This assumption was validated previously by Scott et al. for HT-PEMFCs [41,42]. Additionally, the current experimental setup considered in this work utilizes pure oxygen in the reactant feed stream meaning there is no interdiffusion with other gases such as nitrogen, and no external humidification is applied, which can lead to complex multiphase transport in the GDL. Taking this into consideration concentrations in Equation (7) are calculated assuming 1-D Fickian diffusion through the coated film where the saturation concentrations are assumed to correlate with the Henry’s law saturation behavior.
C O 2 = C O 2 ,sat j δ n F a c m D O 2 ,H 3 PO 4 = C O 2 ,sat Γ j n F D O 2 ,H 3 PO 4
The parameter m in Equation (6) corrects for the effective diffusivity of the coated film and accounts for any obstructions through the coated film. Additionally, the experimental current density, j, must be corrected in Equation (6) to account for the active surface area of the catalyst rather than the MEA active area (5 × 5 cm2). This is the reason for the appearance of the roughness factor, ac. For increasing surface roughness the local molar flux of reactants through the coated film would be expected to decrease for the same experimental current density, which is measured relative to the planform area of the cell. Without the addition of the roughness factor, the calculation of the local concentration of reactants near the catalyst surface through the coated film would be lower than expected. This same correction has also been employed by Mamlouk et al. [54]. The geometric parameters in Equation (6) are grouped together as the parameter Γ.
Using the coated film model, Equation (5) can be solved for comparison to the experimental data. Equations (5) and (6) contain three adjustable parameters: j 0 , c , κ, and Γ. The necessary physical parameters used to solve the governing equations are contained in Table 1. The mathematical model was correlated to the experimental data using Matlab’s least squares routine (lsqcurvefit).
Table 1. Parameters used in Equations (5) and (6).
Parameter (Units)Value
αc [55]0.94
γ [15]1
C O 2 ,sat (mol·cm−3) [56] 1.7410 × 10 8 exp [ 9.4866 × 10 3 R T ]
D O 2 ,H 2 PO 4 (cm2·s−1) [56] 2.0402 exp [ 3.9729 × 10 4 R T ]

4. Conclusions

The focus of this study was the development of a simple, yet accurate, semi-empirical model to calibrate against performance data from a HT-PEMFC with GDEs manufactured by RSDT. The model used the coated film approach to approximate transport in the catalyst layer. The effects of I/C ratio of the GDEs as well as operating temperature were explored. The evidence suggested that increasing the I/C ratio increased performance to a point due to the decreasing average pore size and the more uniform pores. This caused increased phosphoric acid migration into the electrodes, which improved the effective catalyst utilization and improved effective ionic conductivity. If the I/C ratio was too high or extremely low, this caused electrode flooding and decreased performance. Based on the trends of the correlation parameters, the increased temperature led to a decrease in phosphoric acid content of the electrodes, which led to greater ohmic resistance and reduced active catalyst surface area. These effects were partly counteracted by Arrhenius behavior of the exchange current density and enhanced ionic conductivity of phosphoric acid in the electrodes. As expected, the general conclusions reached in the previous experimental study have not changed; however, the modeling approach has provided some new insight into the nature of the performance variations as a function of I/C and temperature. The model provides new theories regarding cell performance behavior, which will be the subject of continuing work. Future work will seek to improve the fidelity of the model and begin to explore the influence of the higher temperature on the reduced acid migration. Further theory will be developed in an attempt to predict the adjustable parameters utilized in this study. Additionally, studies of the durability of the manufactured cells will be investigated.

Acknowledgments

The authors would like to acknowledge the financial support of National Science Foundation, NSF-GOALI (contract No. CCM1-1265893). The authors also express their gratitude to Advent Technologies Inc. for the supply of the membranes used in this study.

Author Contributions

T.D.M and W.E.M. developed the model presented and carried out the correlation to experimental data. S.K. performed the RSDT experiments and single cell tests. T.D.M, S.K., W.E.M., and R.M. participated in the design of the study and assisted in drafting the manuscript. All authors read and approved the manuscript prior to submission.

Conflicts of Interest

The authors declare no conflict of interest.

Nomenclature

a c Catalyst surface roughness factor (catalyst surface area/electrode geometric area)
C i Molar concentration of species i at the catalyst surface (mol·cm−3)
C i , sat Saturation concentration of species i (mol·cm−3)
D i , H 3 PO 4 Diffusivity of species i in phosphoric acid (cm2·s−1)
E act Activation energy (kJ·mol−1)
E cell Cell potential (V)
E OCV Open circuit potential (V)
F Faraday’s constant (C·mol−1)
j Current density (A·cm−2)
j 0 , c Exchange current density (A·cm−2)
j 0,c ref Reference exchange current density (A·cm−2)
j 0,c Parameter defined by Equation (3) (A·cm−2)
l cl Thickness of catalyst layer (cm)
l m Thickness of membrane electrolyte (cm)
m Diffusivity correction factor
n Number of transfer electrons
R Ideal gas constant (kJ·mol−1·K−1)
R C Contact resistance (Ω·cm2)
T Operating temperature (K)
T ref Reference temperature (K)
Greek
α c Transfer coefficient
γ Pressure coefficient
Γ Parameter defined by Equation (6) (cm)
δ Film thickness (cm)
Δ E Cell potential drop (V)
Δ E Nernst Change in Nernst potential (V)
η a,act Anode activation overpotential (V)
η c,act Cathode activation overpotential (V)
κ Parameter defined by Equation (4) (Ω·cm2)
σ cl Conductivity of the catalyst layer (S·cm−1)
σ m Conductivity of the membrane electrolyte (S·cm−1)

References

  1. Asensio, J.A.; Sanchez, E.M.; Gomez-Romero, P. Proton-conducting Membranes Based on Benzimidazole Polymers for High-temperature PEM Fuel Cells. A Chemical Quest. Chem. Soc. Rev. 2010, 39, 3210–3239. [Google Scholar] [CrossRef] [PubMed]
  2. Chandan, A.; Hattenberger, M.; El-kharouf, A.; Du, S.; Dhir, A.; Self, V.; Pollet, B.G.; Ingram, A.; Bujalski, W. High Temperature (HT) Polymer Electrolyte Membrane Fuel Cells (PEMFC)—A Review. J. Power Sources 2013, 231, 264–278. [Google Scholar] [CrossRef]
  3. Costamagna, P.; Yang, C.; Bocarsly, A.B.; Srinivasan, S. Nafion® 115/Zirconium Phosphate Composite Membranes for Operation of PEMFCs above 100 °C. Electrochim. Acta 2002, 47, 1023–1033. [Google Scholar] [CrossRef]
  4. Reichman, S.; Ulus, A.; Peled, E. PTFE-Based Solid Polymer Electrolyte Membrane for High-Temperature Fuel Cell Applications. J. Electrochem. Soc. 2007, 154, B327–B333. [Google Scholar] [CrossRef]
  5. Rikukawa, M.; Sanui, K. Proton-Conducting Polymer Electrolyte Membranes Based on Hydrocarbon Polymers. Prog. Polym. Sci. 2000, 25, 1463–1502. [Google Scholar] [CrossRef]
  6. Zhang, J.; Xie, Z.; Zhang, J.; Tang, Y.; Song, C.; Navessin, T.; Shi, Z.; Song, D.; Wang, H.; Wilkinson, D.P.; et al. High Temperature PEM Fuel Cells. J. Power Sources 2006, 160, 872–891. [Google Scholar] [CrossRef]
  7. Ahluwalia, R.K.; Doss, E.D.; Kumar, R. Performance of High Temperature Polymer Electrolyte Fuel Cell Systems. J. Power Sources 2003, 117, 45–60. [Google Scholar] [CrossRef]
  8. Parthasarathy, A.; Srinivasan, A.; Appleby, A.J.; Martin, C.R. Temperature Dependence of the Electrode Kinetics of Oxygen Reduction at the Platinum/Nafion® Interface—A Microelectrode Investigation. J. Electrochem. Soc. 1992, 139, 2530–2537. [Google Scholar] [CrossRef]
  9. Pan, C.; He, R.; Li, Q.; Jensen, J.O.; Bjerrum, N.J.; Hjulmand, H.A.; Jensen, A.B. Integration of High Temperature PEM Fuel Cells with a Methanol Reformer. J. Power Sources 2005, 145, 392–398. [Google Scholar] [CrossRef]
  10. Li, Q.; He, R.; Gao, J.-A.; Jensen, J.O.; Bjerrum, N.J. The CO Poisoning Effect in PEMFCs Operational at Temperatures up to 200 °C. J. Electrochem. Soc. 2003, 150, A1599–A1605. [Google Scholar] [CrossRef]
  11. Li, Q.; He, R.; Jensen, J.O.; Bjerrum, N.J. PBI-Based Polymer Membranes for High Temperature Fuel Cells—Preparation, Characterization and Fuel Cell Demonstration. Fuel Cells 2004, 4, 147–159. [Google Scholar] [CrossRef]
  12. Li, Q.; Hjuler, H.A.; Bjerrum, N.J. Phosphoric Acid Doped Polybenzimidazole Membranes: Physiochemical Characterization and Fuel Cell Applications. J. Appl. Electrochem. 2001, 31, 773–779. [Google Scholar] [CrossRef]
  13. Hasiotis, C.; Li, Q.; Deimede, V.; Kallistis, J.K.; Kontoyannis, C.G.; Bjerrum, N.J. Development and Characterization of Acid-Doped Polybenzimidazole/Sulfonated Polysulfone Blend Polymer Electrolytes for Fuel Cells. J. Electrochem. Soc. 2001, 148, A513–A519. [Google Scholar] [CrossRef]
  14. Kim, H.-J.; An, S.J.; Kim, J.-Y.; Moon, J.K.; Cho, S.Y.; Eun, Y.C.; Yoon, H.-K.; Park, Y.; Kweon, H.-J.; Shin, E.-M. Polybenzimidazoles for High Temperature Fuel Cell Applications. Macromol. Rapid Commun. 2004, 25, 1410–1413. [Google Scholar] [CrossRef]
  15. Liu, Z.Y.; Wainright, J.S.; Litt, M.H.; Savinell, R.F. Study of the Oxygen Reduction Reaction (ORR) at Pt Interfaced with Phosphoric Acid Doped Polybenzimidazole at Elevated Temperature and Low Relative Humidity. Electrochim. Acta 2006, 51, 3914–3923. [Google Scholar] [CrossRef]
  16. Lobato, J.; Cañizares, P.; Rodrigo, M.A.; Linares, J.J. Study of Different Bimetallic Anodic Catalysts Supported on Carbon for a High Temperature Polybenzimidazole-Based Direct Ethanol Fuel Cell. Appl. Catal. B 2009, 91, 269–274. [Google Scholar] [CrossRef]
  17. Savadogo, O.; Varela, F.J.R. Low-Temperature Direct Propane Polymer Electrolyte Membranes Fuel Cell (DPFC). J. New Mater. Electrochem. Syst. 2001, 4, 93–97. [Google Scholar]
  18. Wainright, J.S.; Wang, J.-T.; Weng, D.; Savinell, R.F.; Litt, M. Acid Doped Polybenzimidazoles, A New Polymer Electrolyte. J. Electrochem. Soc. 1995, 142, L121–L123. [Google Scholar] [CrossRef]
  19. Wang, J.T.; Lin, W.F.; Weber, M.; Wasmus, S.; Savinell, R.F. Trimethoxymethane as an Alternative Fuel for a Direct Oxidation PBI Polymer Electrolyte Fuel Cell. Electrochim. Acta 1998, 43, 3821–3828. [Google Scholar] [CrossRef]
  20. Wang, J.T.; Savinell, R.F.; Wainright, J.S.; Litt, M.; Yu, H. A H2/O2 Fuel Cell using Acid Doped Polybenzimidazoles as a Polymer Electrolyte. Electrochim. Acta 1996, 41, 193–197. [Google Scholar] [CrossRef]
  21. Hu, J.; Zhang, H.; Zhai, Y.; Liu, G.; Hu, J.; Yi, B. Performance Degradation studies on PBI/H3PO4 High Temperature PEMFC and One-dimensional numerical analysis. Electrochim. Acta 2006, 52, 394–401. [Google Scholar] [CrossRef]
  22. Liao, J.H.; Li, Q.F.; Rudbeck, H.C.; Jensen, J.O.; Chromik, A.; Bjerrum, N.J.; Kerres, J.; Xing, W. Oxidative Degradation of Polybenzimidazole Membranes as Electrolytes for High Temperature Proton Exchange Membrane Fuel Cells. Fuel Cells 2011, 11, 745–755. [Google Scholar] [CrossRef]
  23. Liu, G.; Zhang, H.; Hu, J.; Zhai, Y.; Xu, D.; Shao, Z.G. Studies of Performance Degradation of a High Temperature PEMFC Based on H3PO4-doped PBI. J. Power Sources 2006, 162, 547–552. [Google Scholar] [CrossRef]
  24. Modestov, A.D.; Tarasevich, M.R.; Filimonov, V.Y.; Zagudaeva, N.M. Degradation of High Temperature MEA with PBI-H3PO4 Membrane in a Life Test. Electrochim. Acta 2009, 54, 7121–7127. [Google Scholar] [CrossRef]
  25. Ubeda, D.; Canizares, P.; Rodrigo, M.A.; Pinar, F.J.; Lobato, J. Durability Study of HTPEMFC Through Current Distribution Measurements and the Application of a Model. Int. J. Hydrogen Energy 2014, 39, 21678–21687. [Google Scholar] [CrossRef]
  26. Mench, M.M. Other Fuel Cells. In Fuel Cell Engines; John Wiley & Sons Inc.: Hoboken, NJ, USA, 2008; p. 410. [Google Scholar]
  27. Yu, H.; Roller, J.; Kim, S.; Wang, Y.; Kwak, D.; Maric, R. One-Step Deposition of Catalyst Layers for High Temperature Proton Exchange Membrane Fuel Cells (PEMFC). J. Electrochem. Soc. 2014, 161, F622–F627. [Google Scholar] [CrossRef]
  28. Kim, S.; Myles, T.D.; Kunz, H.R.; Kwak, D.; Wang, Y.; Maric, R. The Effect of Binder Content on the Performance of a High Temperature Polymer Electrolyte Membrane Fuel Cell Produced with Reactive Spray Deposition Technology. Electrochim. Acta 2015, 177, 190–200. [Google Scholar] [CrossRef]
  29. Dale, M.K.; Geomezi, M.; Vogli, E.; Voyiatzis, G.A.; Neophytides, S.G. The Interaction of H3PO4 and Steam with PBI and TPS Polymeric Membranes. A TGA and Raman Study. J. Mater. Chem. A 2014, 2, 1117–1127. [Google Scholar]
  30. Berning, T.; Lu, D.M.; Djilali, N. Three-Dimensional Computational Analysis of Transport Phenomena in a PEM Fuel Cell. J. Power Sources 2002, 106, 284–294. [Google Scholar] [CrossRef]
  31. Harvey, D.; Pharoah, J.G.; Karen, K. A Comparison of Different Approaches to Modelling the PEMFC Catalyst Layer. J. Power Sources 2008, 179, 209–219. [Google Scholar] [CrossRef]
  32. Sousa, T.; Mamlouk, M.; Scott, K. An Isothermal Model of a Laboratory Intermediate Temperature Fuel Cell Using PBI Doped Phosphoric Acid Membranes. Chem. Eng. Sci. 2010, 65, 2513–2530. [Google Scholar] [CrossRef]
  33. Bernardi, D.M.; Verbrugge, M.W. Mathematical Model of a Gas Diffusion Electrode Bonded to a Polymer Electrolyte. AIChE J. 1991, 37, 1151–1163. [Google Scholar] [CrossRef]
  34. Marr, C.; Li, X. Composition and Performance Modelling of Catalyst Layer in a Proton Exchange Membrane Fuel Cell. J. Power Sources 1999, 77, 17–27. [Google Scholar] [CrossRef]
  35. Song, D.; Wang, Q.; Liu, Z.; Navessin, T.; Eikerling, M.; Holdcraft, S. Numerical Optimization Study of the Catalyst Layer of PEM Fuel Cell Cathode. J. Power Sources 2004, 126, 104–111. [Google Scholar] [CrossRef]
  36. Eikerling, M.; Kornyshev, A.A. Modelling the Performance of the Cathode Catalyst Layer of Polymer Electrolyte Fuel Cells. J. Electroanal. Chem. 1998, 453, 89–106. [Google Scholar] [CrossRef]
  37. Bevers, D.; Wohr, M.; Yasuda, K.; Oguro, K. Simulation of Polymer Electrolyte Fuel Cell Electrode. J. Appl. Electrochem. 1997, 27, 1254–1264. [Google Scholar]
  38. Kulikovsky, A.A.; Divisek, J.; Kornyshev, A.A. Modeling Cathode Compartment of Polymer Electrolyte Fuel Cells: Dead and Active Reaction Zones. J. Electrochem. Soc. 1999, 146, 3981–3991. [Google Scholar] [CrossRef]
  39. You, L.; Liu, H. A Parametric Study of the Cathode Catalyst Layer of PEM Fuel Cells using a Pseudo-homogeneous Model. Int. J. Hydrogen Energy 2001, 26, 991–999. [Google Scholar] [CrossRef]
  40. Li, Q.; Xiao, G.; Hjuler, H.A.; Berg, R.W.; Bjerrum, N.J. Limiting Current of Oxygen Reduction on Gas-Diffusion Electrodes for Phosphoric Acid Fuel Cells. J. Electrochem. Soc. 1994, 141, 3114–3119. [Google Scholar]
  41. Scott, K.; Mamlouk, M. A Cell Voltage Equation for an Intermediate Temperature Proton Exchange Membrane Fuel Cell. Int. J. Hydrogen Energy 2009, 34, 9195–9202. [Google Scholar] [CrossRef]
  42. Scott, K.; Pilditch, S.; Mamlouk, M. Modelling and Experimental Validation of a High Temperature Polymer Electrolyte Fuel Cell. J. Appl. Electrochem. 2007, 37, 1245–1259. [Google Scholar] [CrossRef]
  43. Broka, K.; Ekdunge, P. Modelling the PEM Fuel Cell Cathode. J. Appl. Electrochem. 1997, 27, 281–289. [Google Scholar] [CrossRef]
  44. Cetinbas, F.C.; Advani, S.G.; Prasad, A.K. A Modified Agglomerate Model with Discrete Catalyst Particles for the PEM Fuel Cell Catalyst Layer. J. Electrochem. Soc. 2013, 160, F750–F756. [Google Scholar] [CrossRef]
  45. Sun, W.; Peppley, B.A.; Karan, K. An Improved Two-Dimensional Agglomerate Cathode Model to Study the Influence of Catalyst Layer Structural Parameters. Electrochim. Acta 2005, 50, 3359–3374. [Google Scholar] [CrossRef]
  46. Moein-Jahromi, M.; Kermani, M.J. Performance Prediction of PEM Fuel Cell Cathode Catalyst Layer Using Agglomerate Model. Int. J. Hydrogen Energy 2012, 37, 17954–17966. [Google Scholar] [CrossRef]
  47. Roa, R.M.; Rengaswamy, R. Optimization Study of an Agglomerate Model for Platinum Reduction and Performance in PEM Fuel Cell Cathode. Chem. Eng. Res. Des. 2006, 84, 952–964. [Google Scholar]
  48. Wang, Q.; Eikerling, M.; Song, D.; Liu, Z. Structure and Performance of Different Types of Agglomerates in Cathode Catalyst Layers of PEM Fuel Cells. J. Electroanal. Chem. 2004, 573, 61–69. [Google Scholar] [CrossRef]
  49. Lobato, J.; Cañizares, P.; Rodrigo, M.A.; Linares, J.J.; Pinar, F.J. Study of the Influence of the Amount of PBI-H3PO4 in the Catalytic Layer of a High Temperature PEMFC. Int. J. Hydrogen Energy 2010, 35, 1347–1355. [Google Scholar] [CrossRef]
  50. Lobato, J.; Cañizares, P.; Rodrigo, M.A.; Úbeda, D.; Pinar, F.J.; Linares, J.J. Optimisation of the Microporous Layer for a Polybenzimidazole-Based High Temperature PEMFC—Effect of Carbon Content. Fuel Cells 2010, 10, 770–777. [Google Scholar] [CrossRef]
  51. Roller, J.M.; Arellano-Jiménez, M.J.; Jain, R.; Yu, H.; Carter, C.B.; Maric, R. Oxygen Evolution duringWater Electrolysis from Thin Films Using Bimetallic Oxides of Ir–Pt and Ir–Ru. J. Electrochem. Soc. 2013, 160, F716–F730. [Google Scholar] [CrossRef]
  52. Roller, J.M.; Renner, J.; Yu, H.; Capuano, C.; Kwak, T.; Wang, Y.; Carter, C.B.; Ayers, K.; Mustain, W.E.; Maric, R. Flame-Based Processing as a Practical Approach for Manufacturing Hydrogen Evolution Electrodes. J. Power Sources 2014, 271, 366–376. [Google Scholar] [CrossRef]
  53. Korsgaard, A.R.; Refshauge, R.; Nielsen, M.P.; Bang, M.; Kaer, S.K. Experimental Characterization and Modeling of Commercial Polybenzimidazole-Based MEA Performance. J. Power Sources 2006, 162, 239–245. [Google Scholar] [CrossRef]
  54. Mamlouk, M.; Sousa, T.; Scott, K. A High Temperature Polymer Electrolyte Membrane Fuel Cell Model for Reformate Gas. Int. J. Electrochem. 2011, 2011, 1–18. [Google Scholar] [CrossRef]
  55. Kunz, H.R.; Gruver, G.A. The Catalytic Activity of Platinum Supported on Carbon for Electrochemical Oxygen Reduction in Phosphoric Acid. J. Electrochem. Soc. 1975, 122, 1279–1287. [Google Scholar] [CrossRef]
  56. Klinedinst, K.; Bett, J.A.S.; Macdonald, J.; Stonehart, P. Oxygen Solubility and Diffusivity in Hot Concentrated H3PO4. J. Electroanal. Chem. Interfacial Electrochem. 1974, 57, 281–289. [Google Scholar] [CrossRef]

