
Improving the Ethanol Oxidation Activity of Pt-Mn Alloys through the Use of Additives during Deposition

Abstract
:1. Introduction
2. Results and Discussion
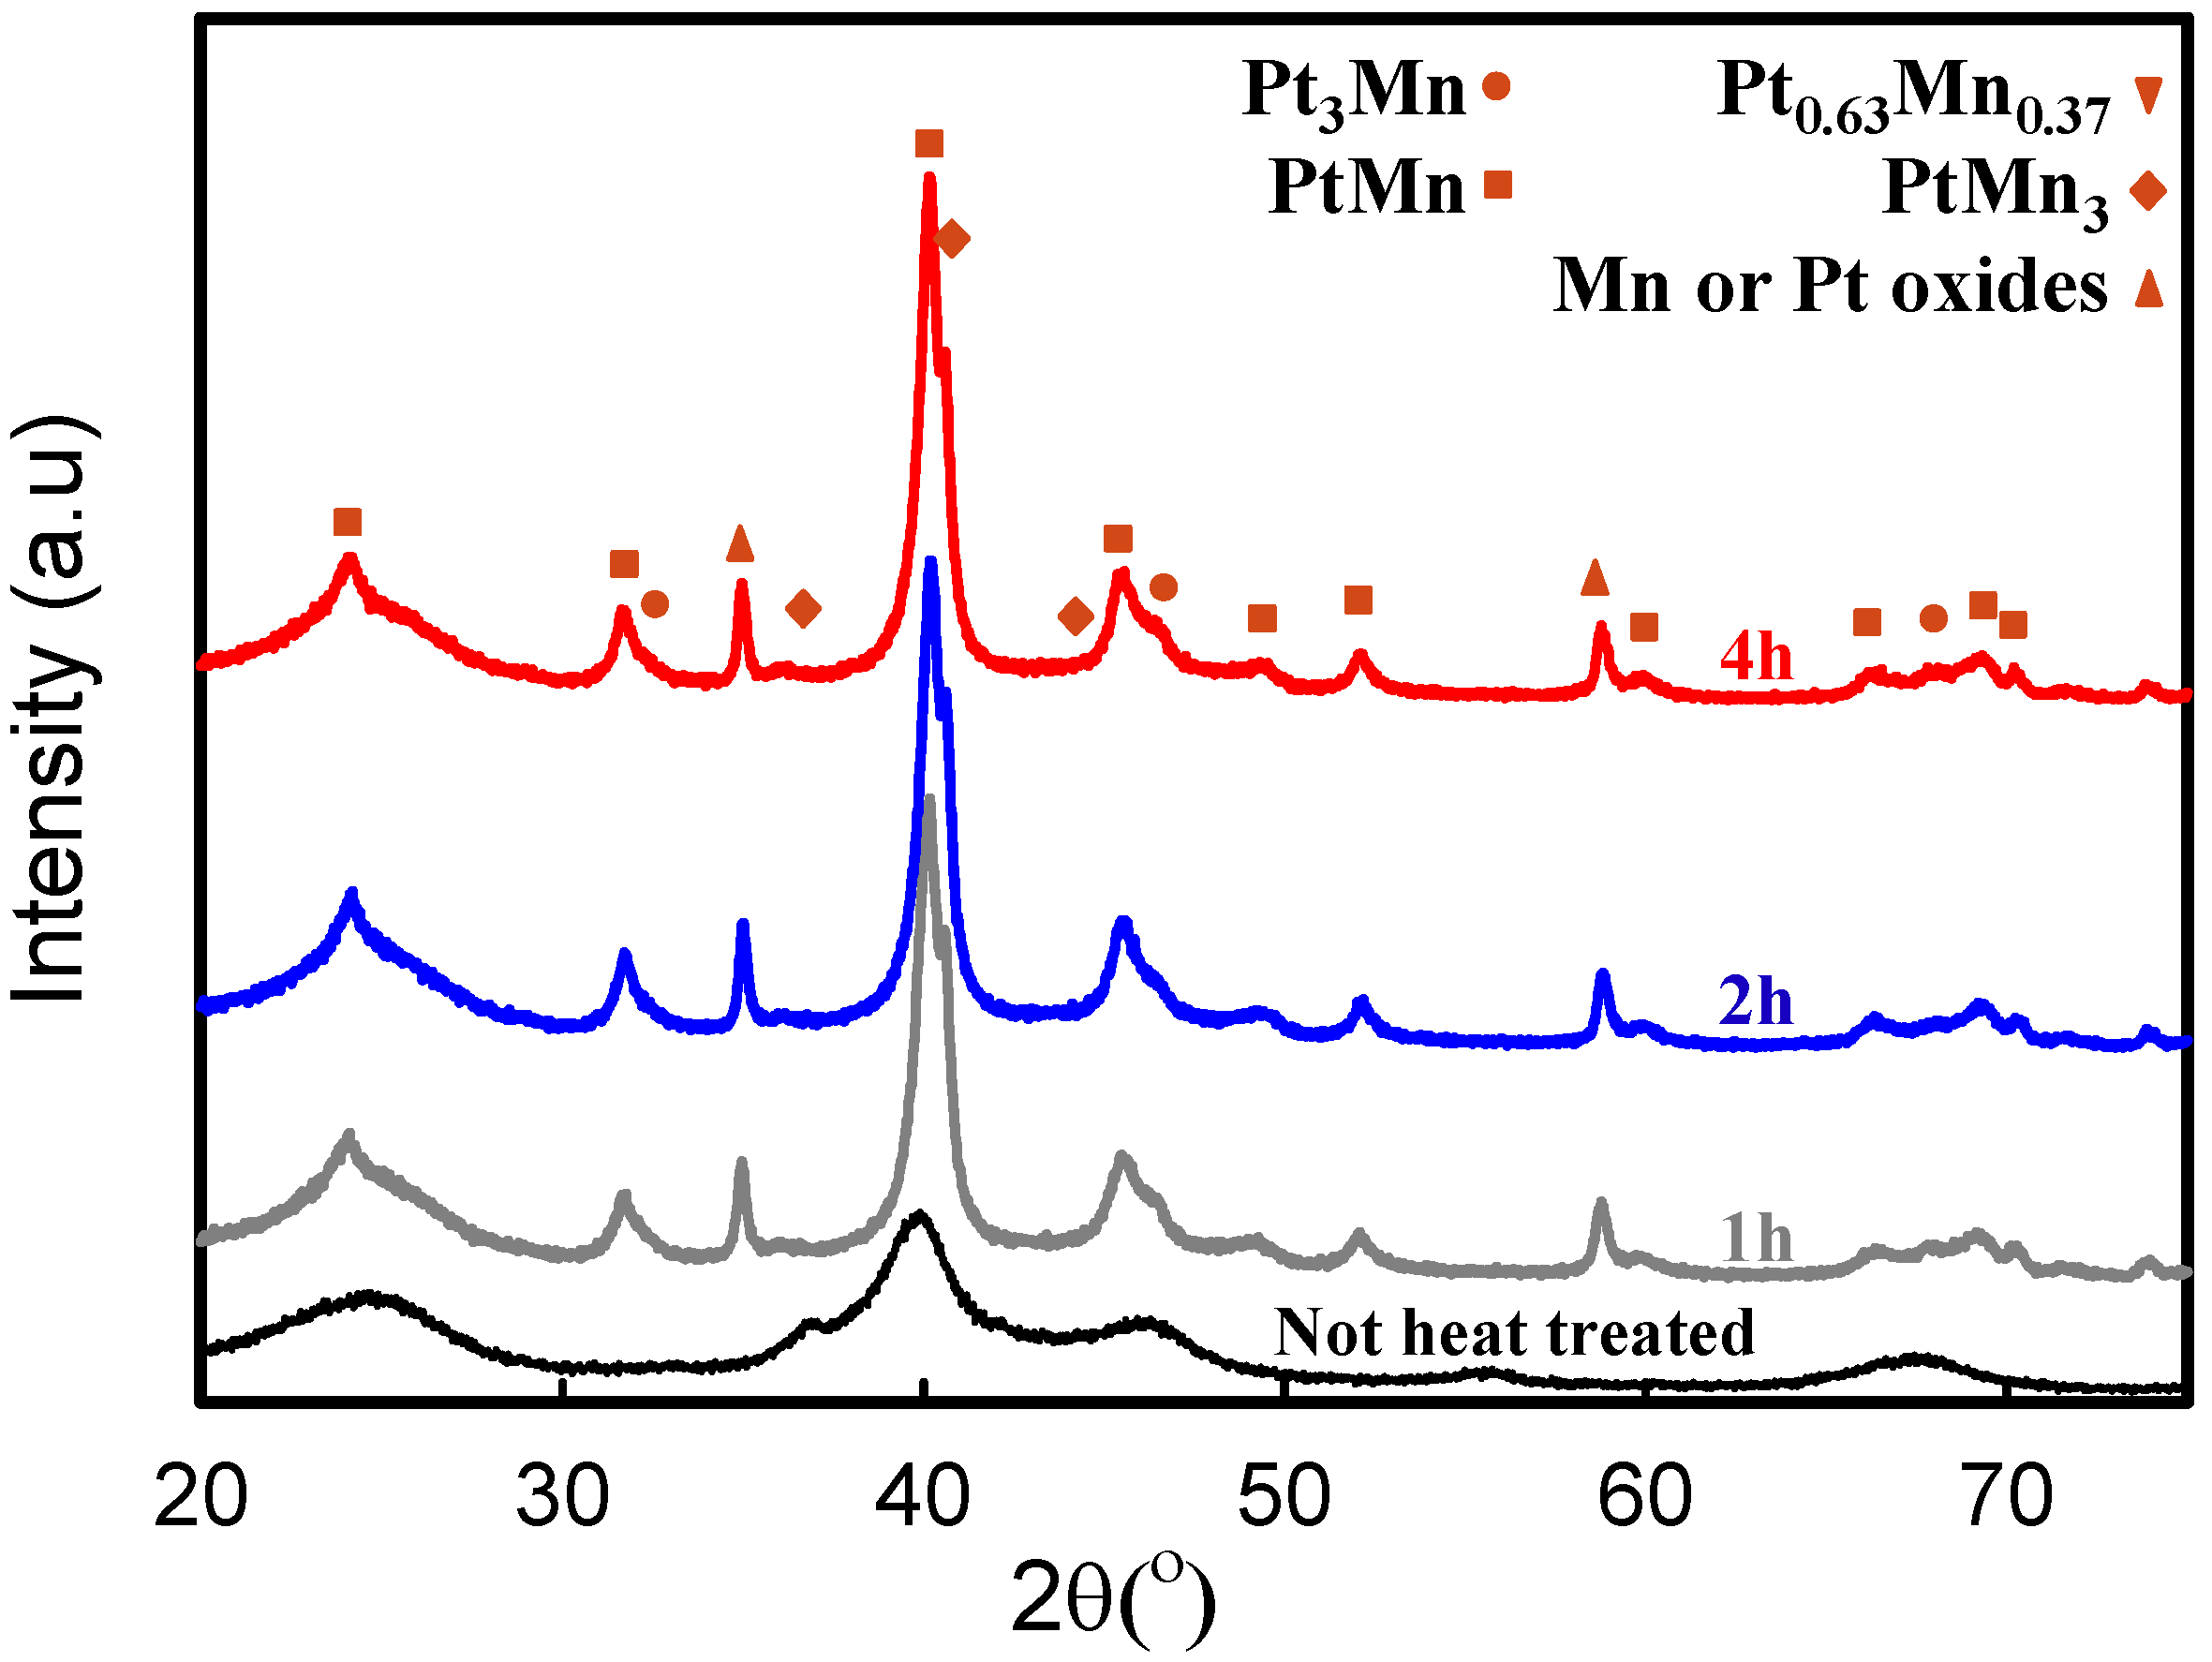
2.1. Material Characterization

| Samples | Alloy molar ratios measured by ICP | Ions concentration in filtered solution by ICP | Grain size measured by TEM (nm) | ||
|---|---|---|---|---|---|
| Pt (%) | Mn (%) | Pt (ppm) | Mn (ppm) | ||
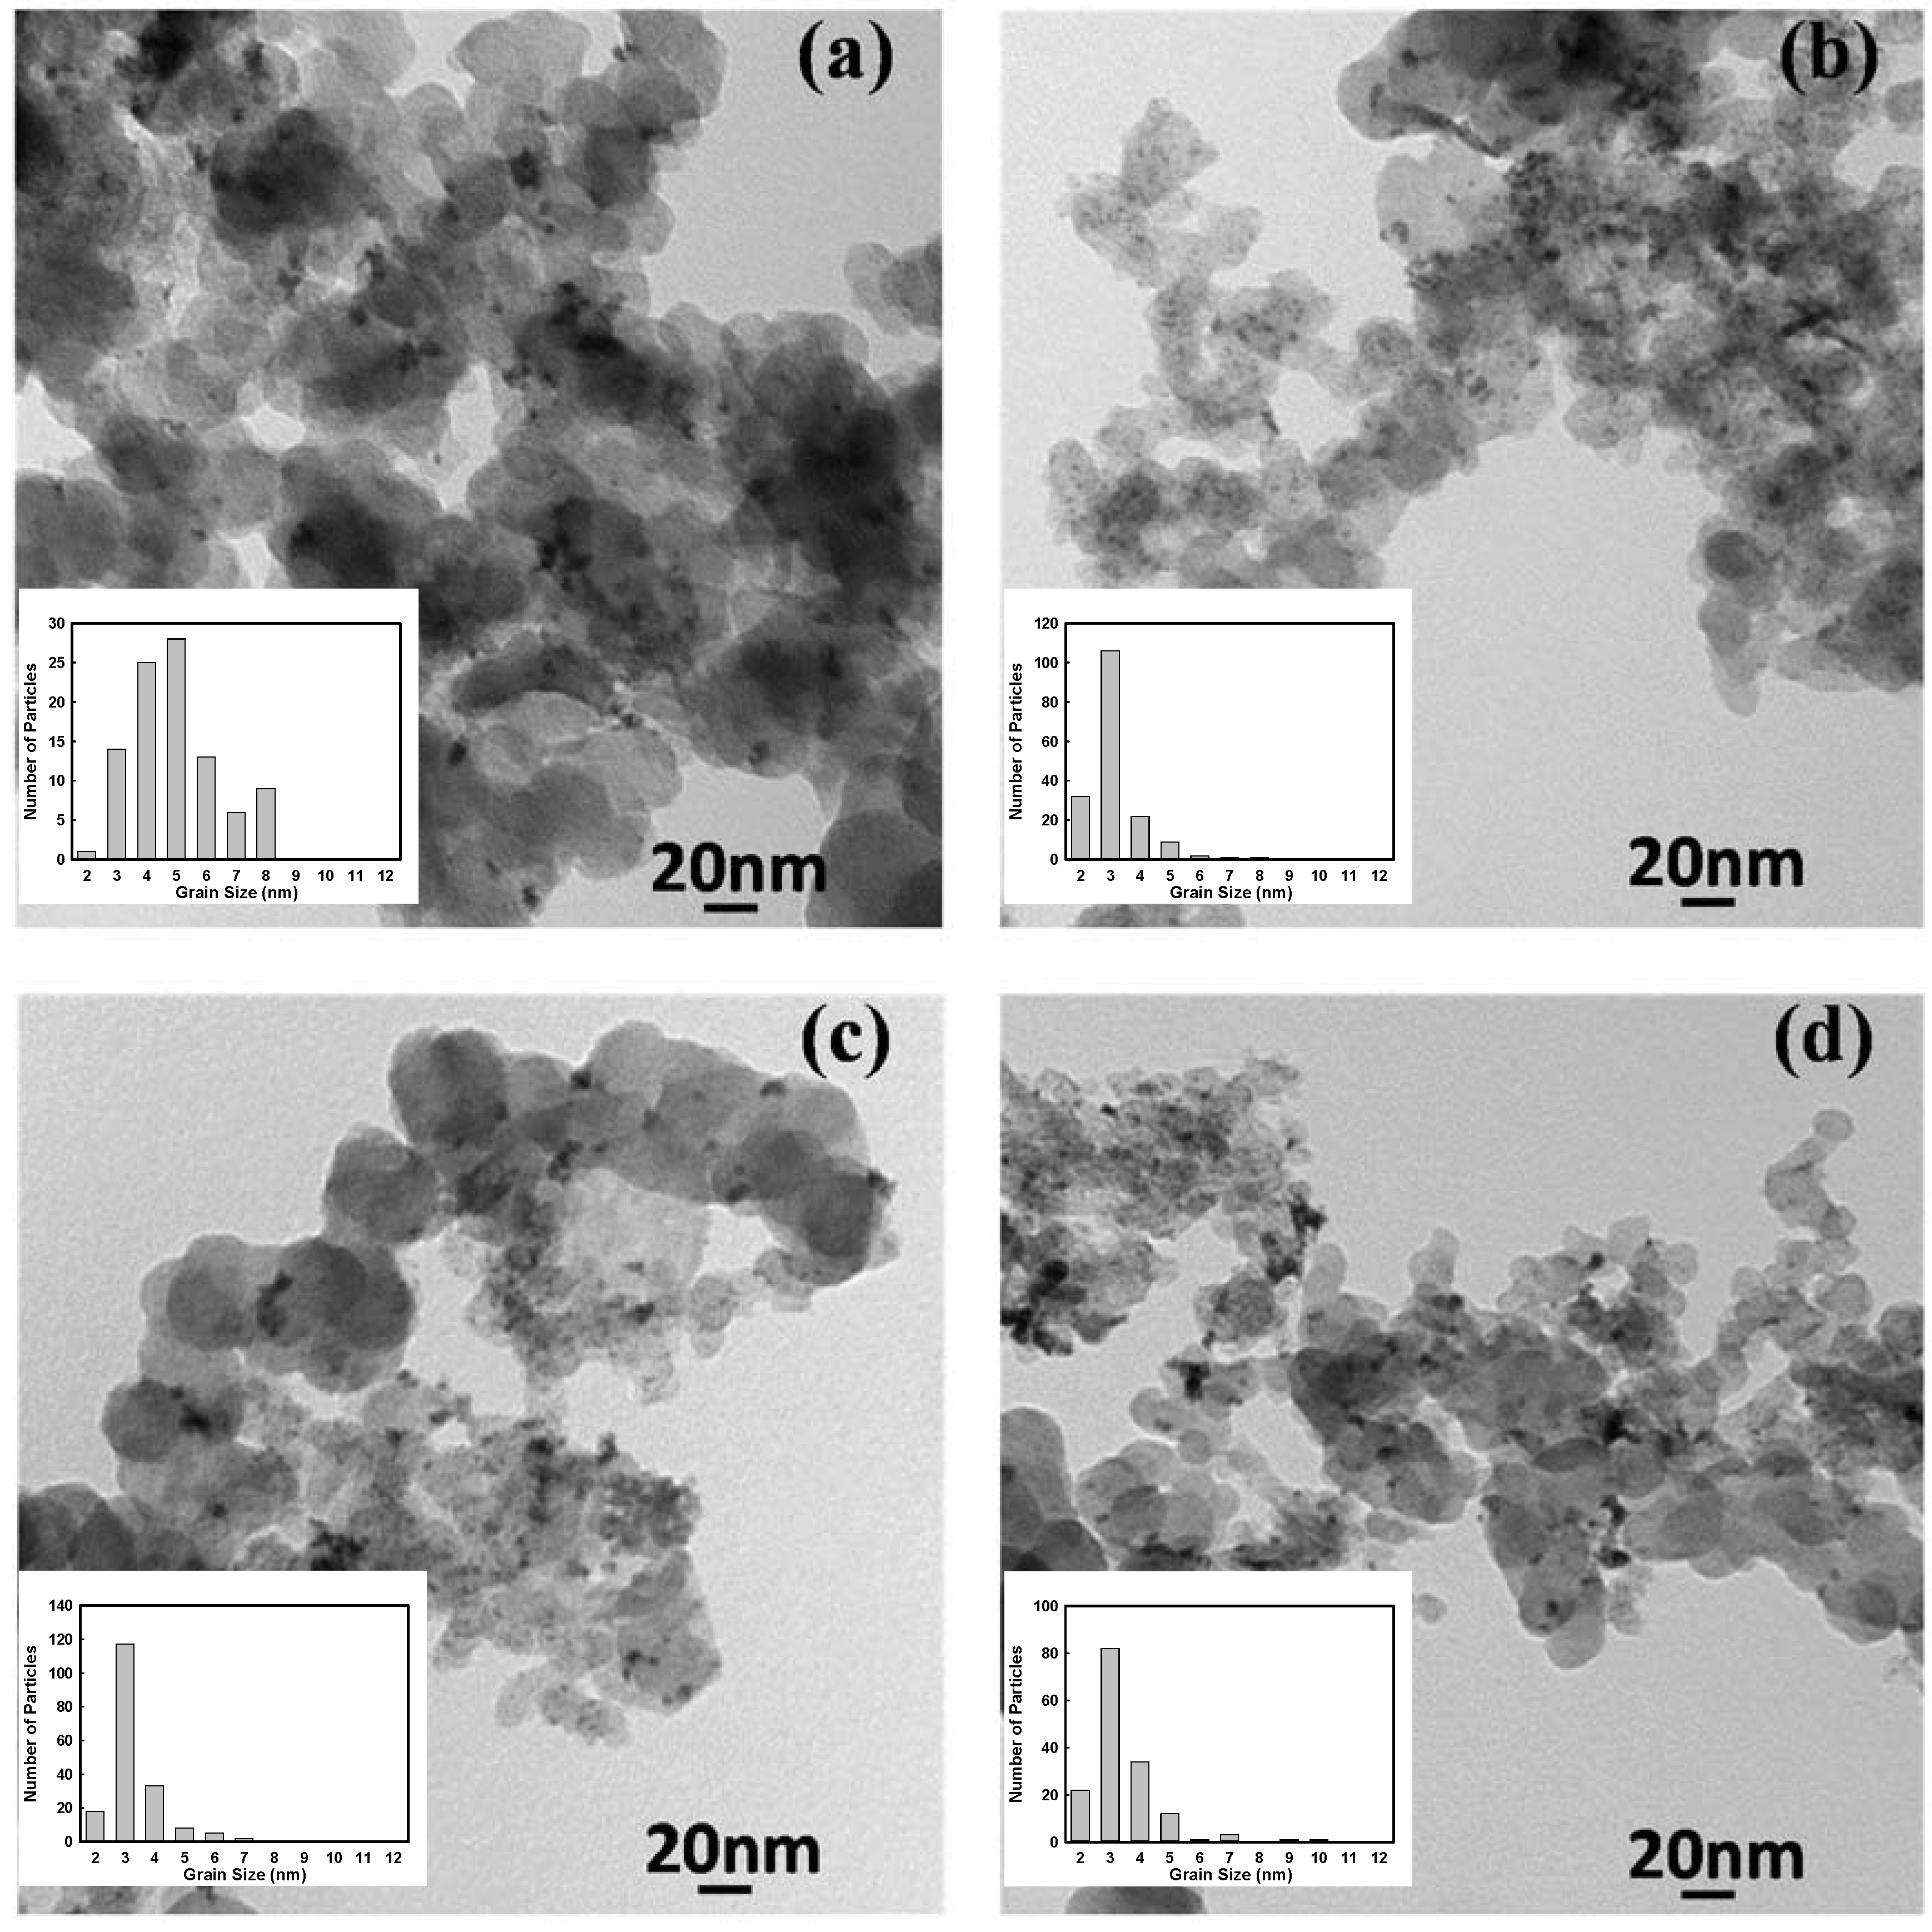
| Pt0.25Mn0.75 | 22.18 | 77.82 | nil | nil | 4.5 |
| Pt0.25Mn0.75-1X | 20.30 | 79.70 | 0.49 | nil | 2.6 |
| Pt0.25Mn0.75-2X | 20.56 | 79.44 | 8.23 | nil | 2.8 |
| Pt0.25Mn0.75-3X | 21.94 | 78.06 | 11.70 | 0.20 | 2.9 |
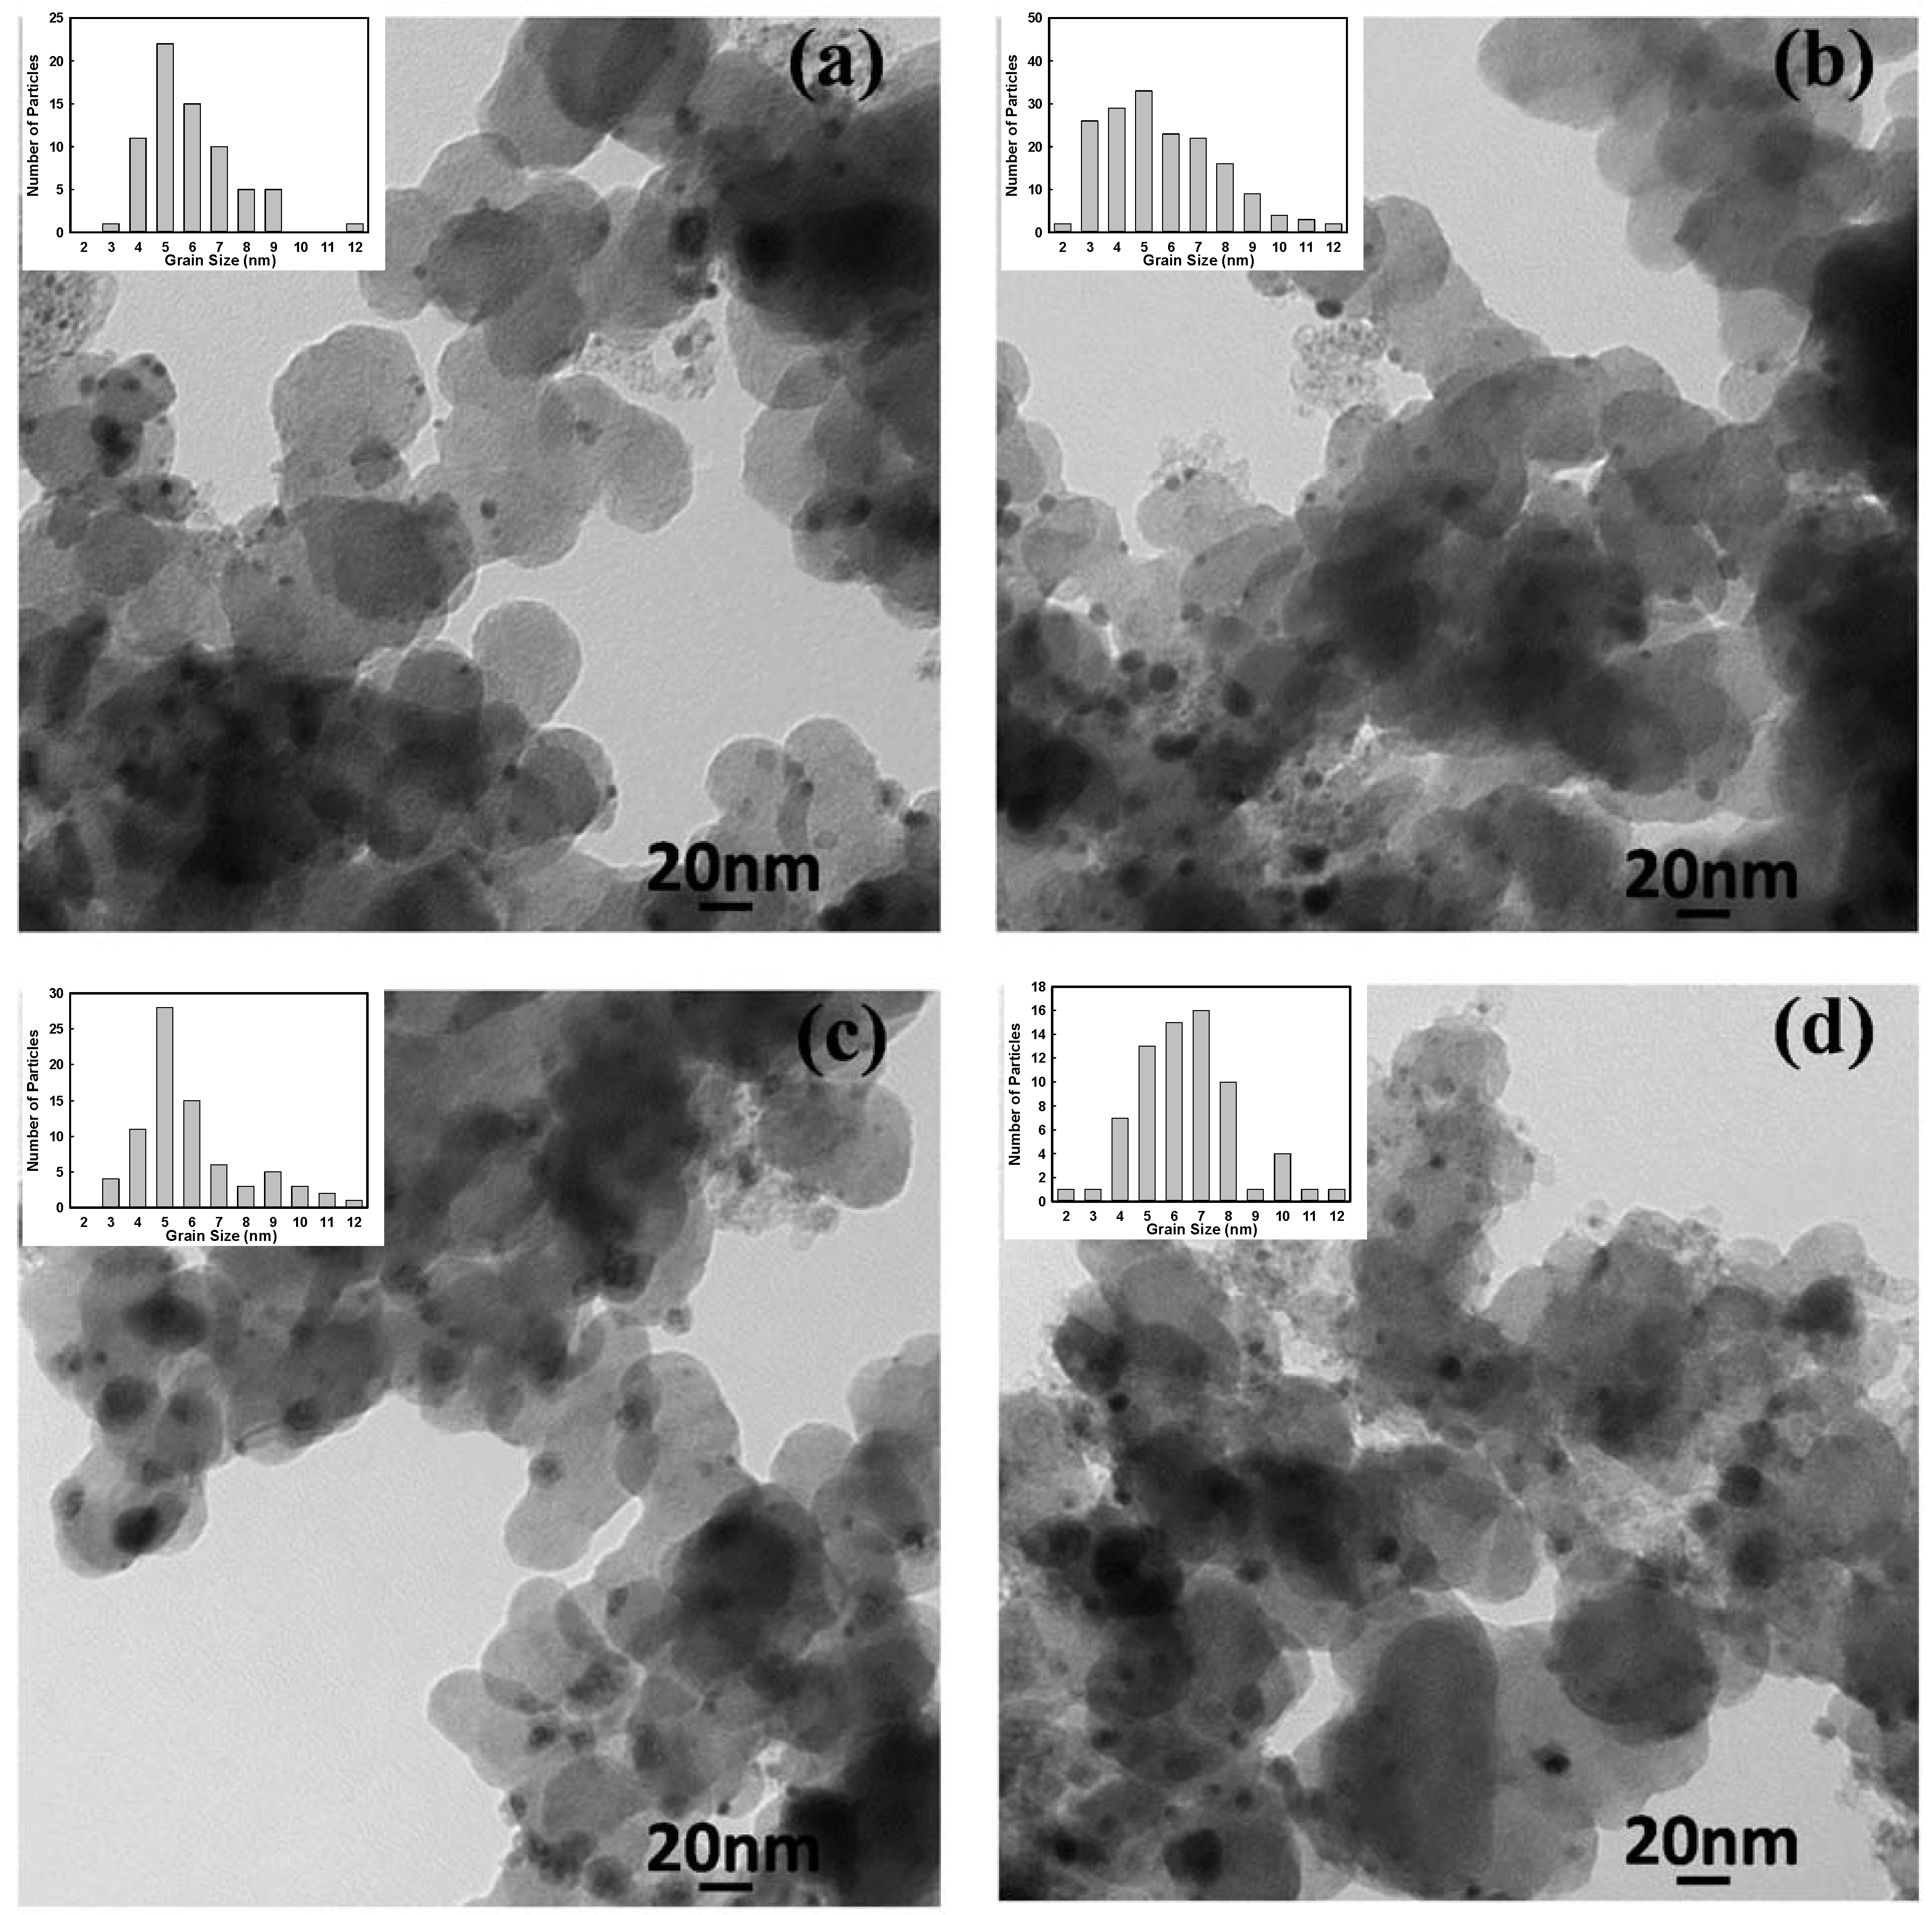
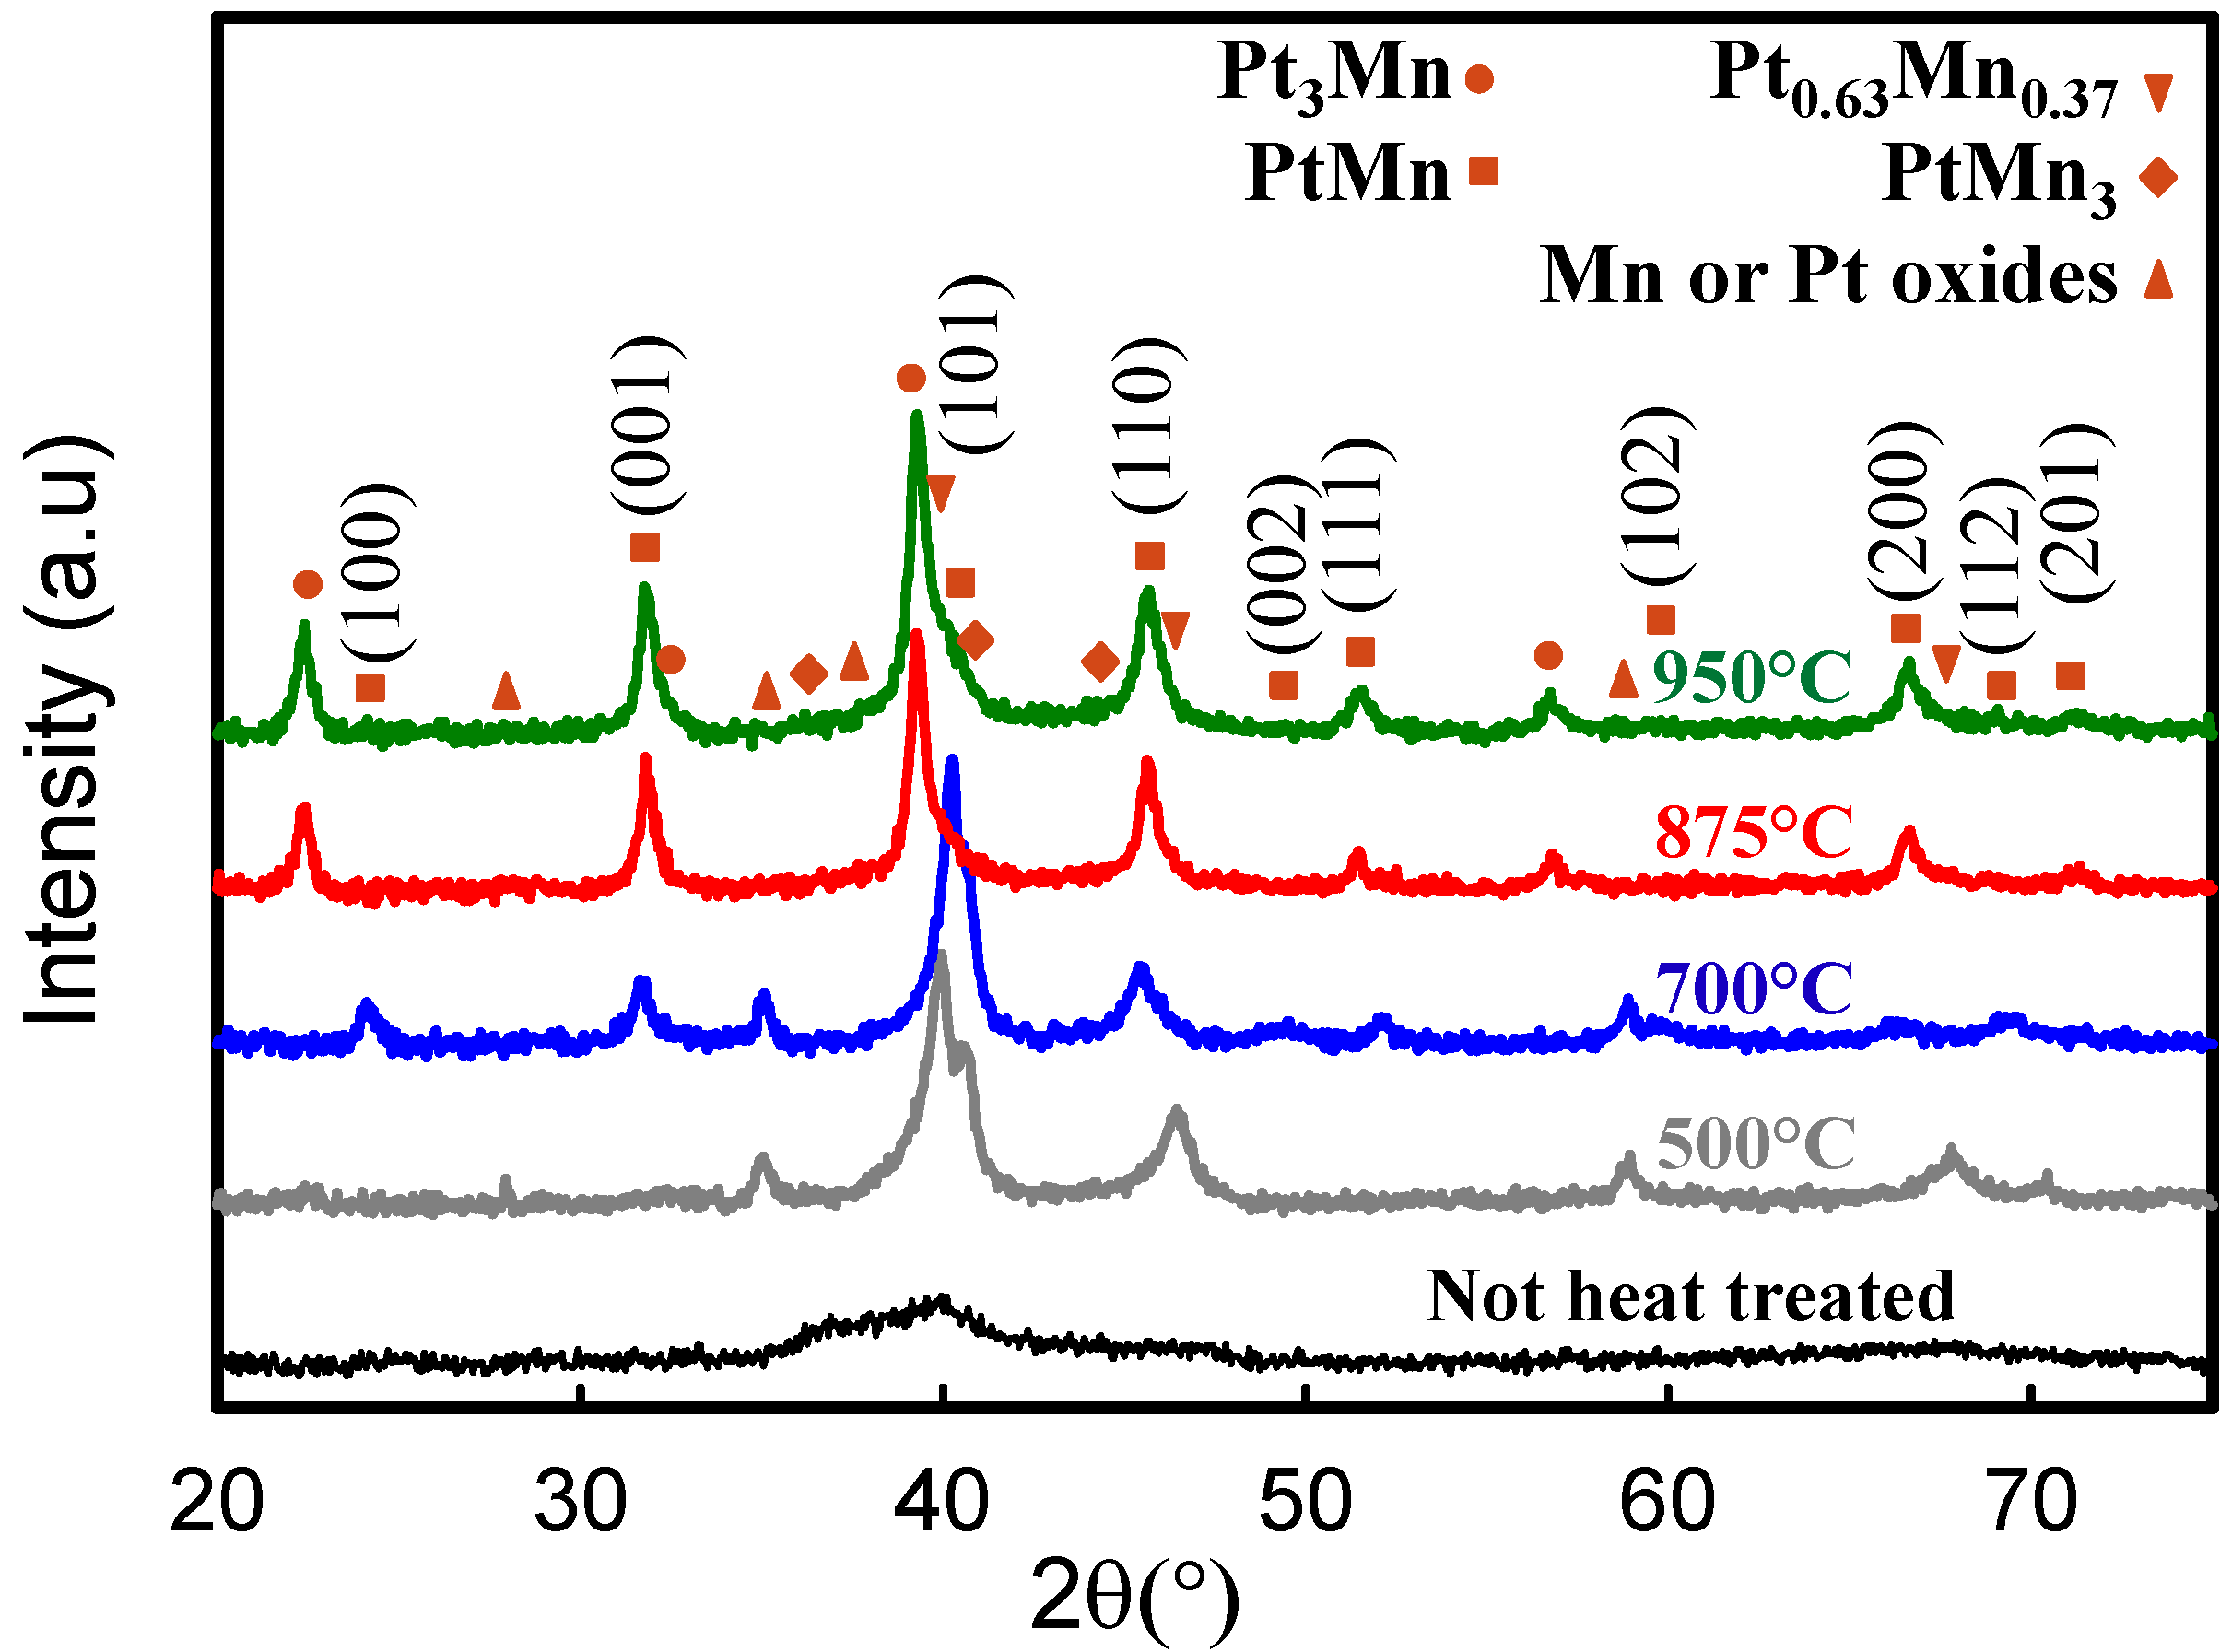
| Pt0.25Mn0.75-2X-500-1 h | - | - | - | - | 5.7 |
| Pt0.25Mn0.75-2X-700-1 h | - | - | - | - | 5.8 |
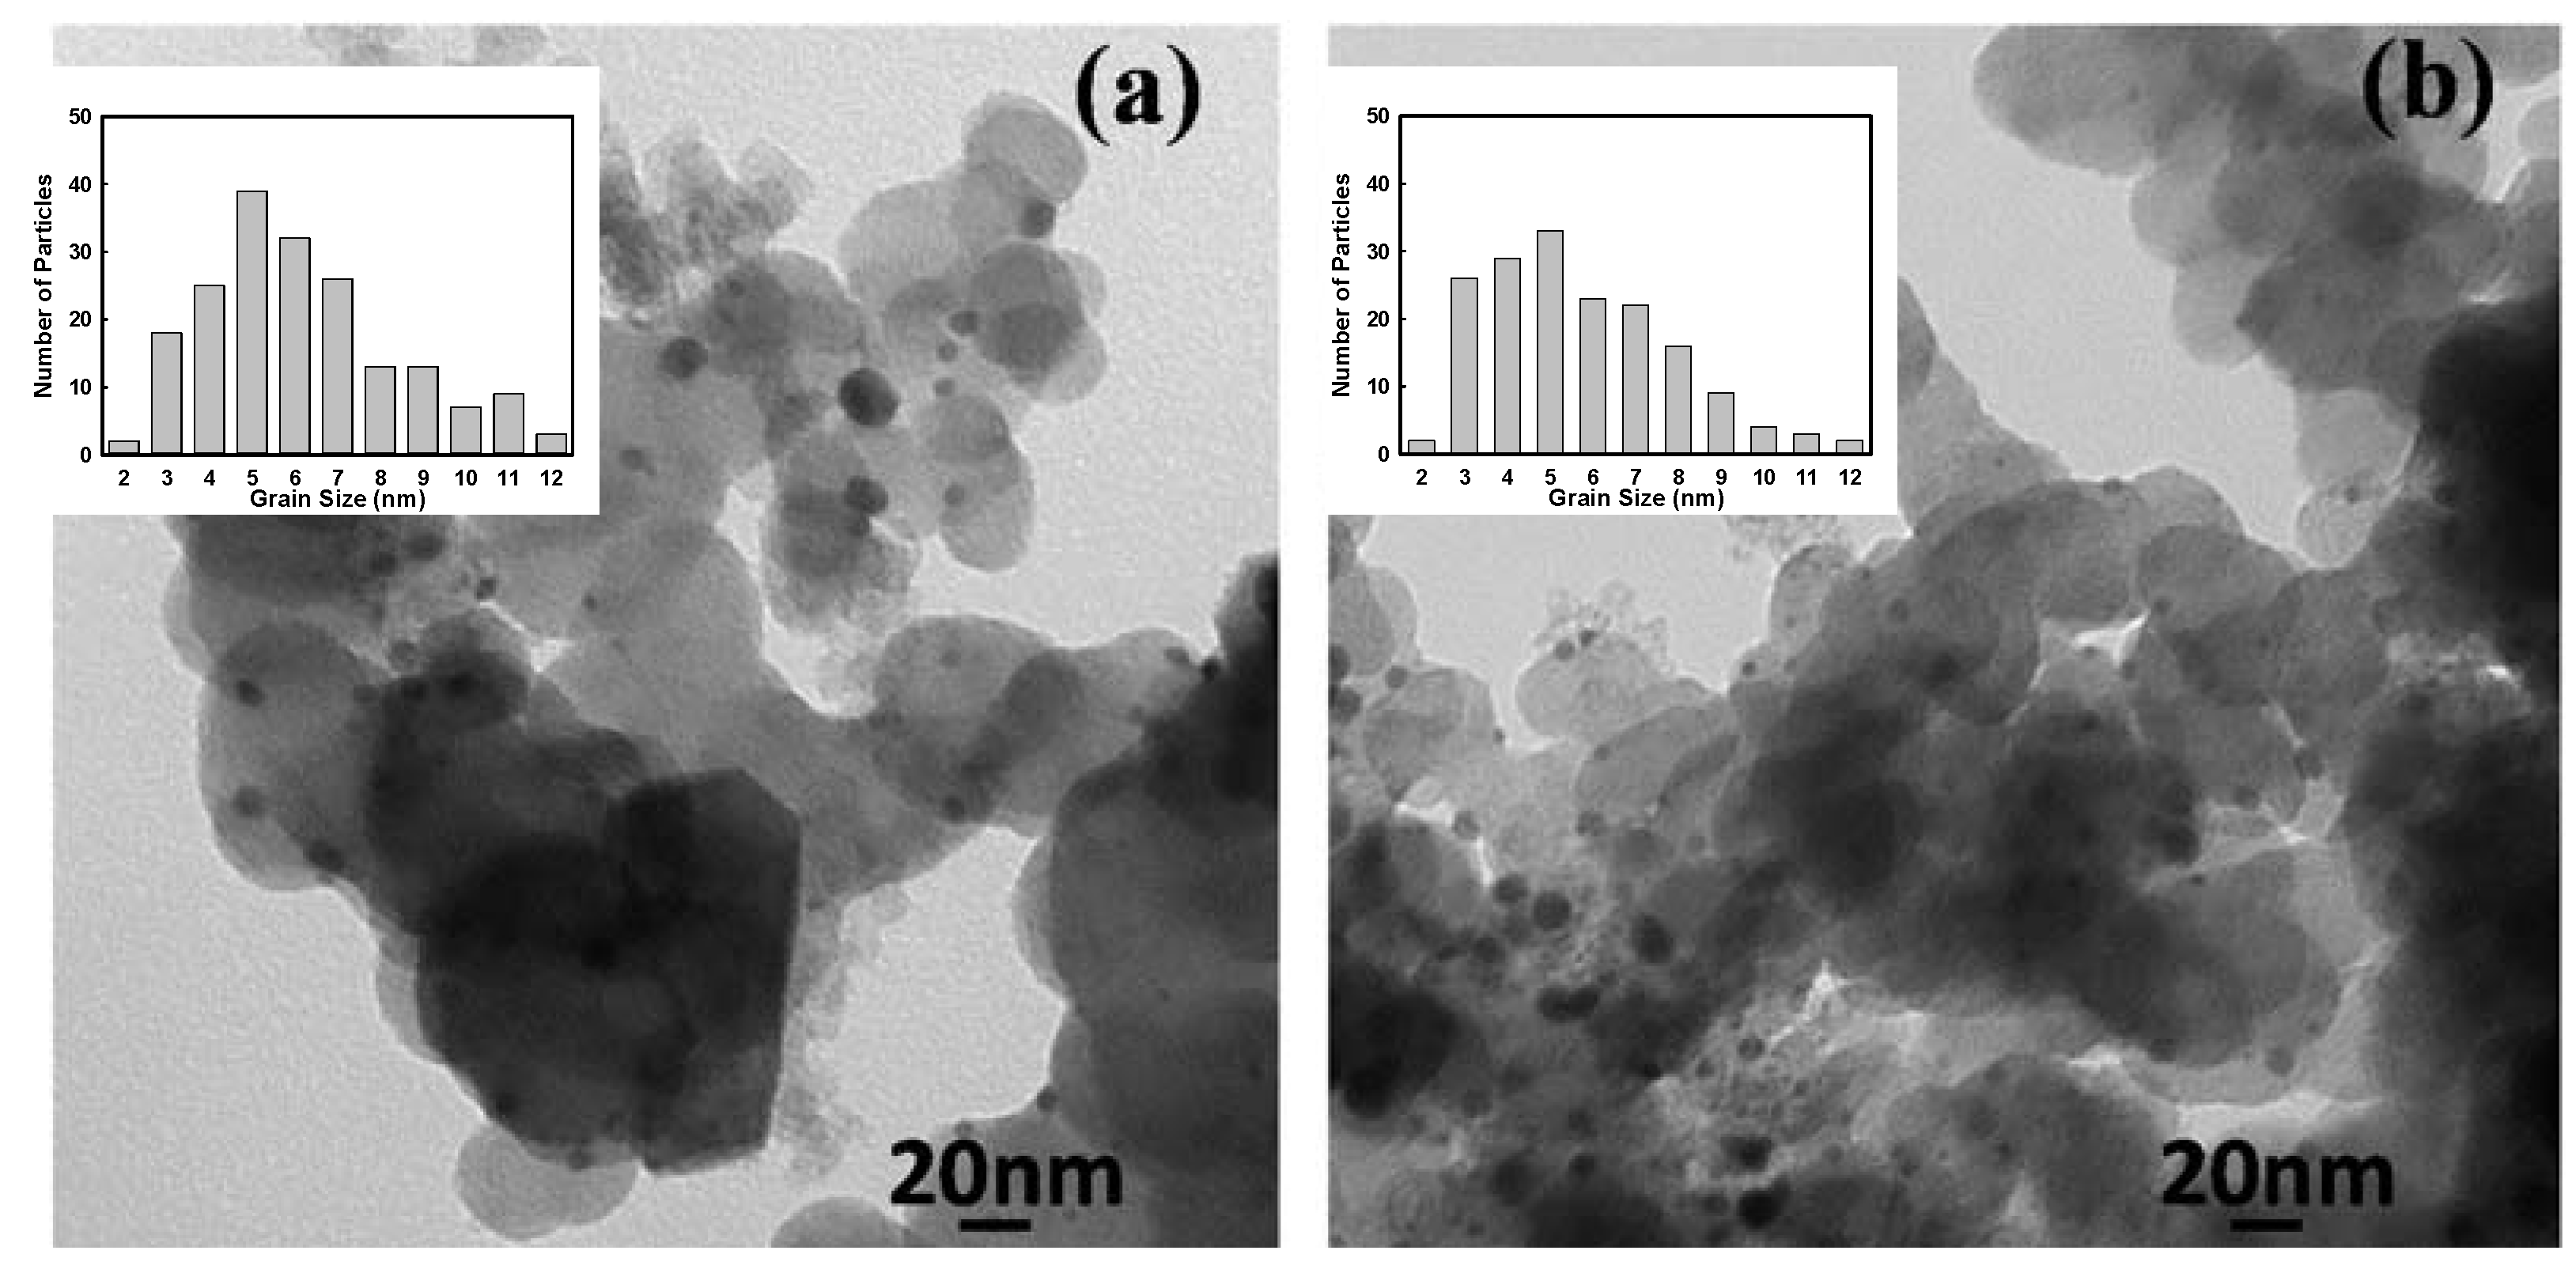
| Pt0.25Mn0.75-2X-875-1 h | - | - | - | - | 6.0 |
| Pt0.25Mn0.75-2X-950-1 h | - | - | - | - | 6.6 |
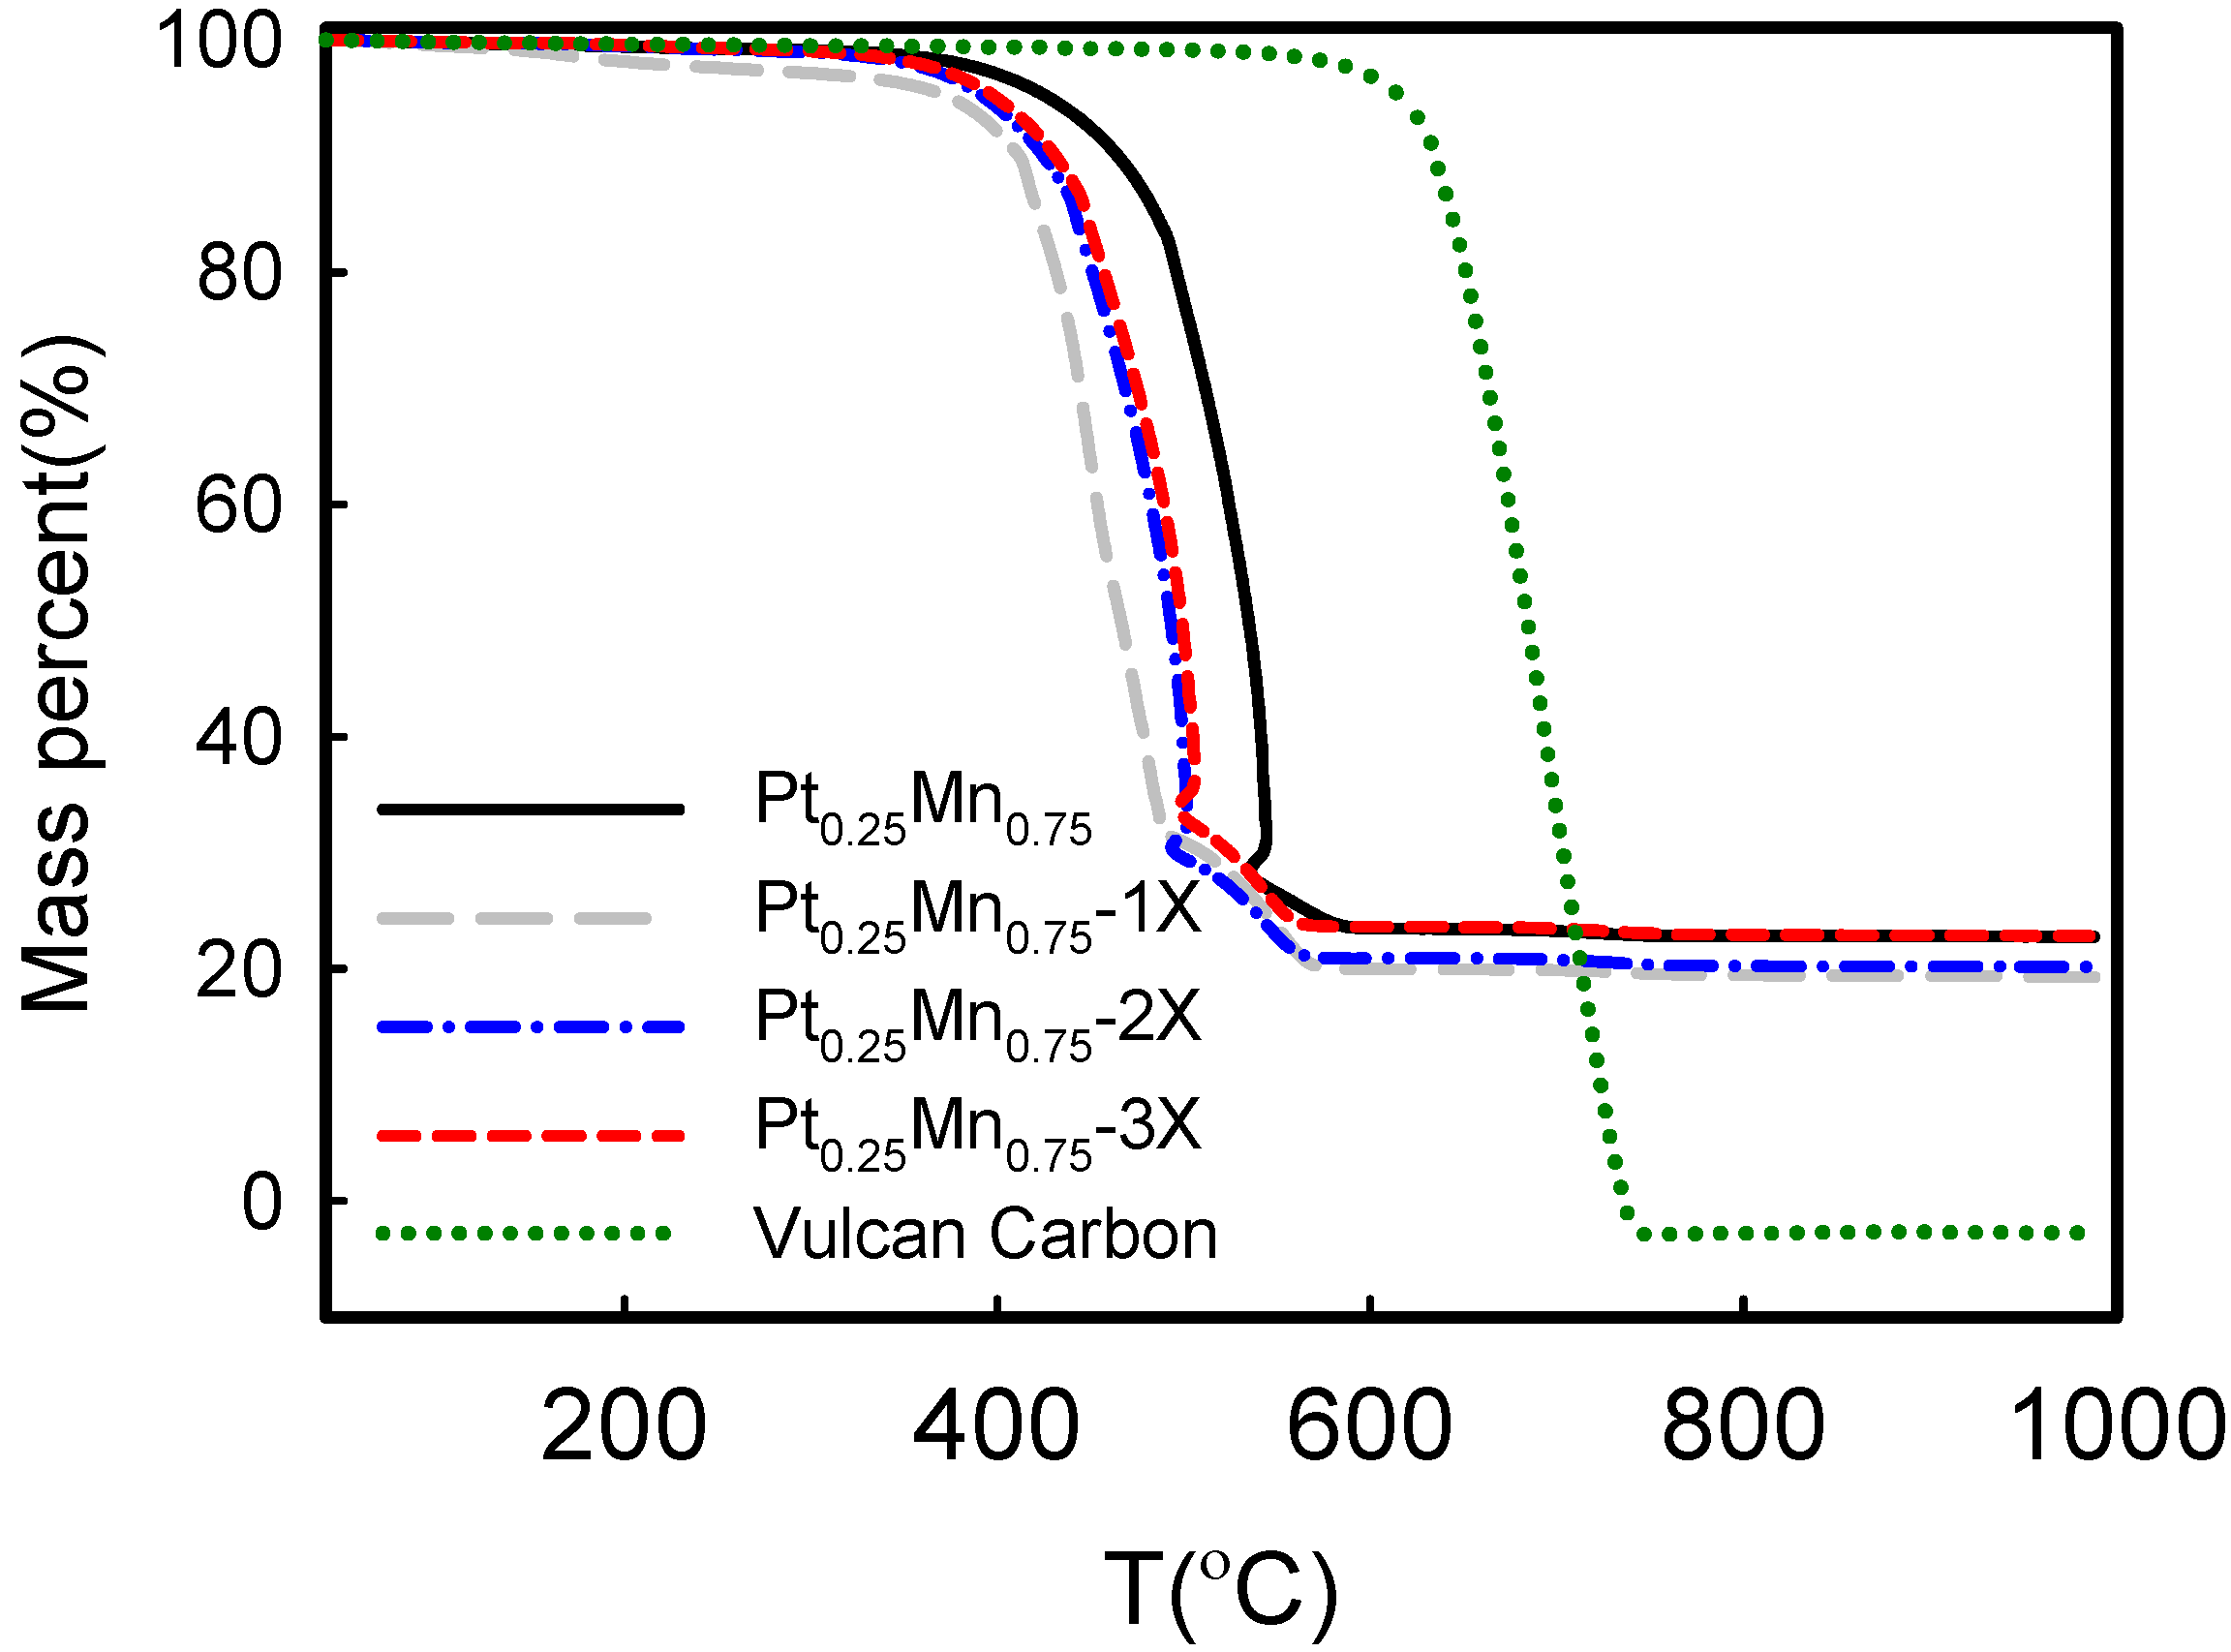
| Samples | Carbon black combustion Temperature (°C) | Metal loading (wt. %) |
|---|---|---|
| Pt0.25Mn0.75 | 429.2 | 22.6 |
| Pt0.25Mn0.75-1X | 348.4 | 19 |
| Pt0.25Mn0.75-2X | 350.7 | 20.1 |
| Pt0.25Mn0.75-3X | 359.5 | 22.8 |
| Vulcan carbon | 633.4 | - |


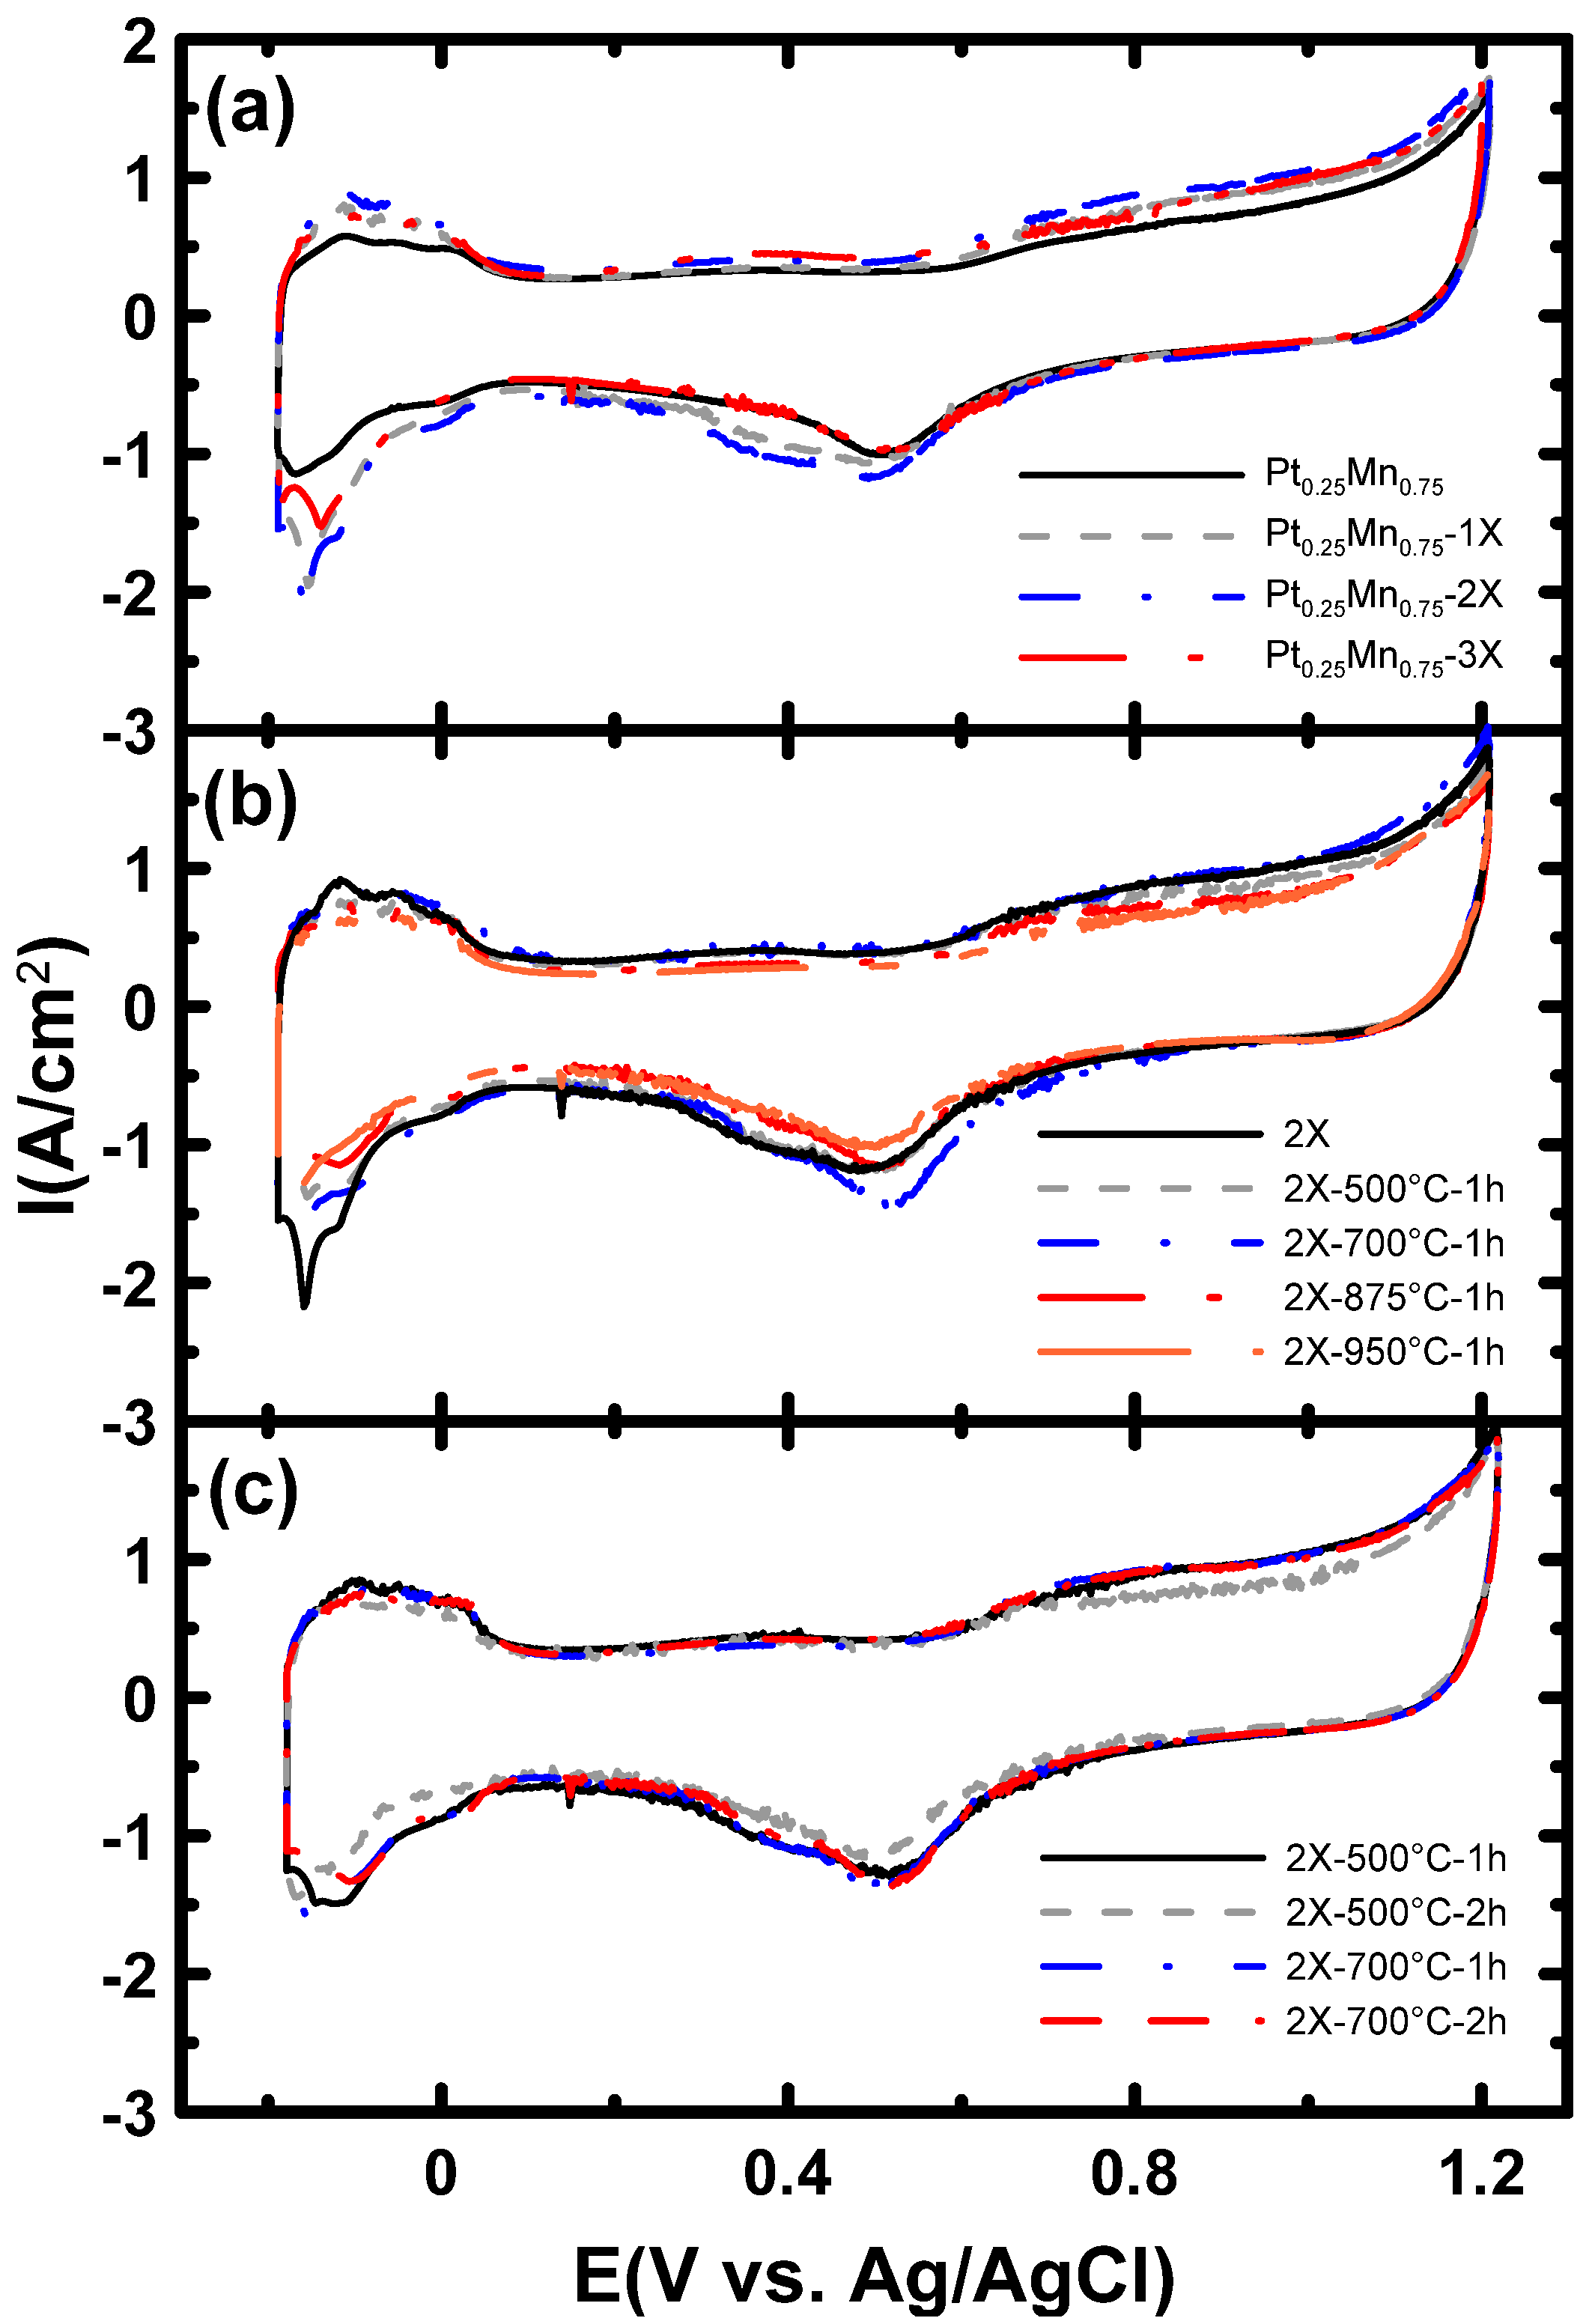
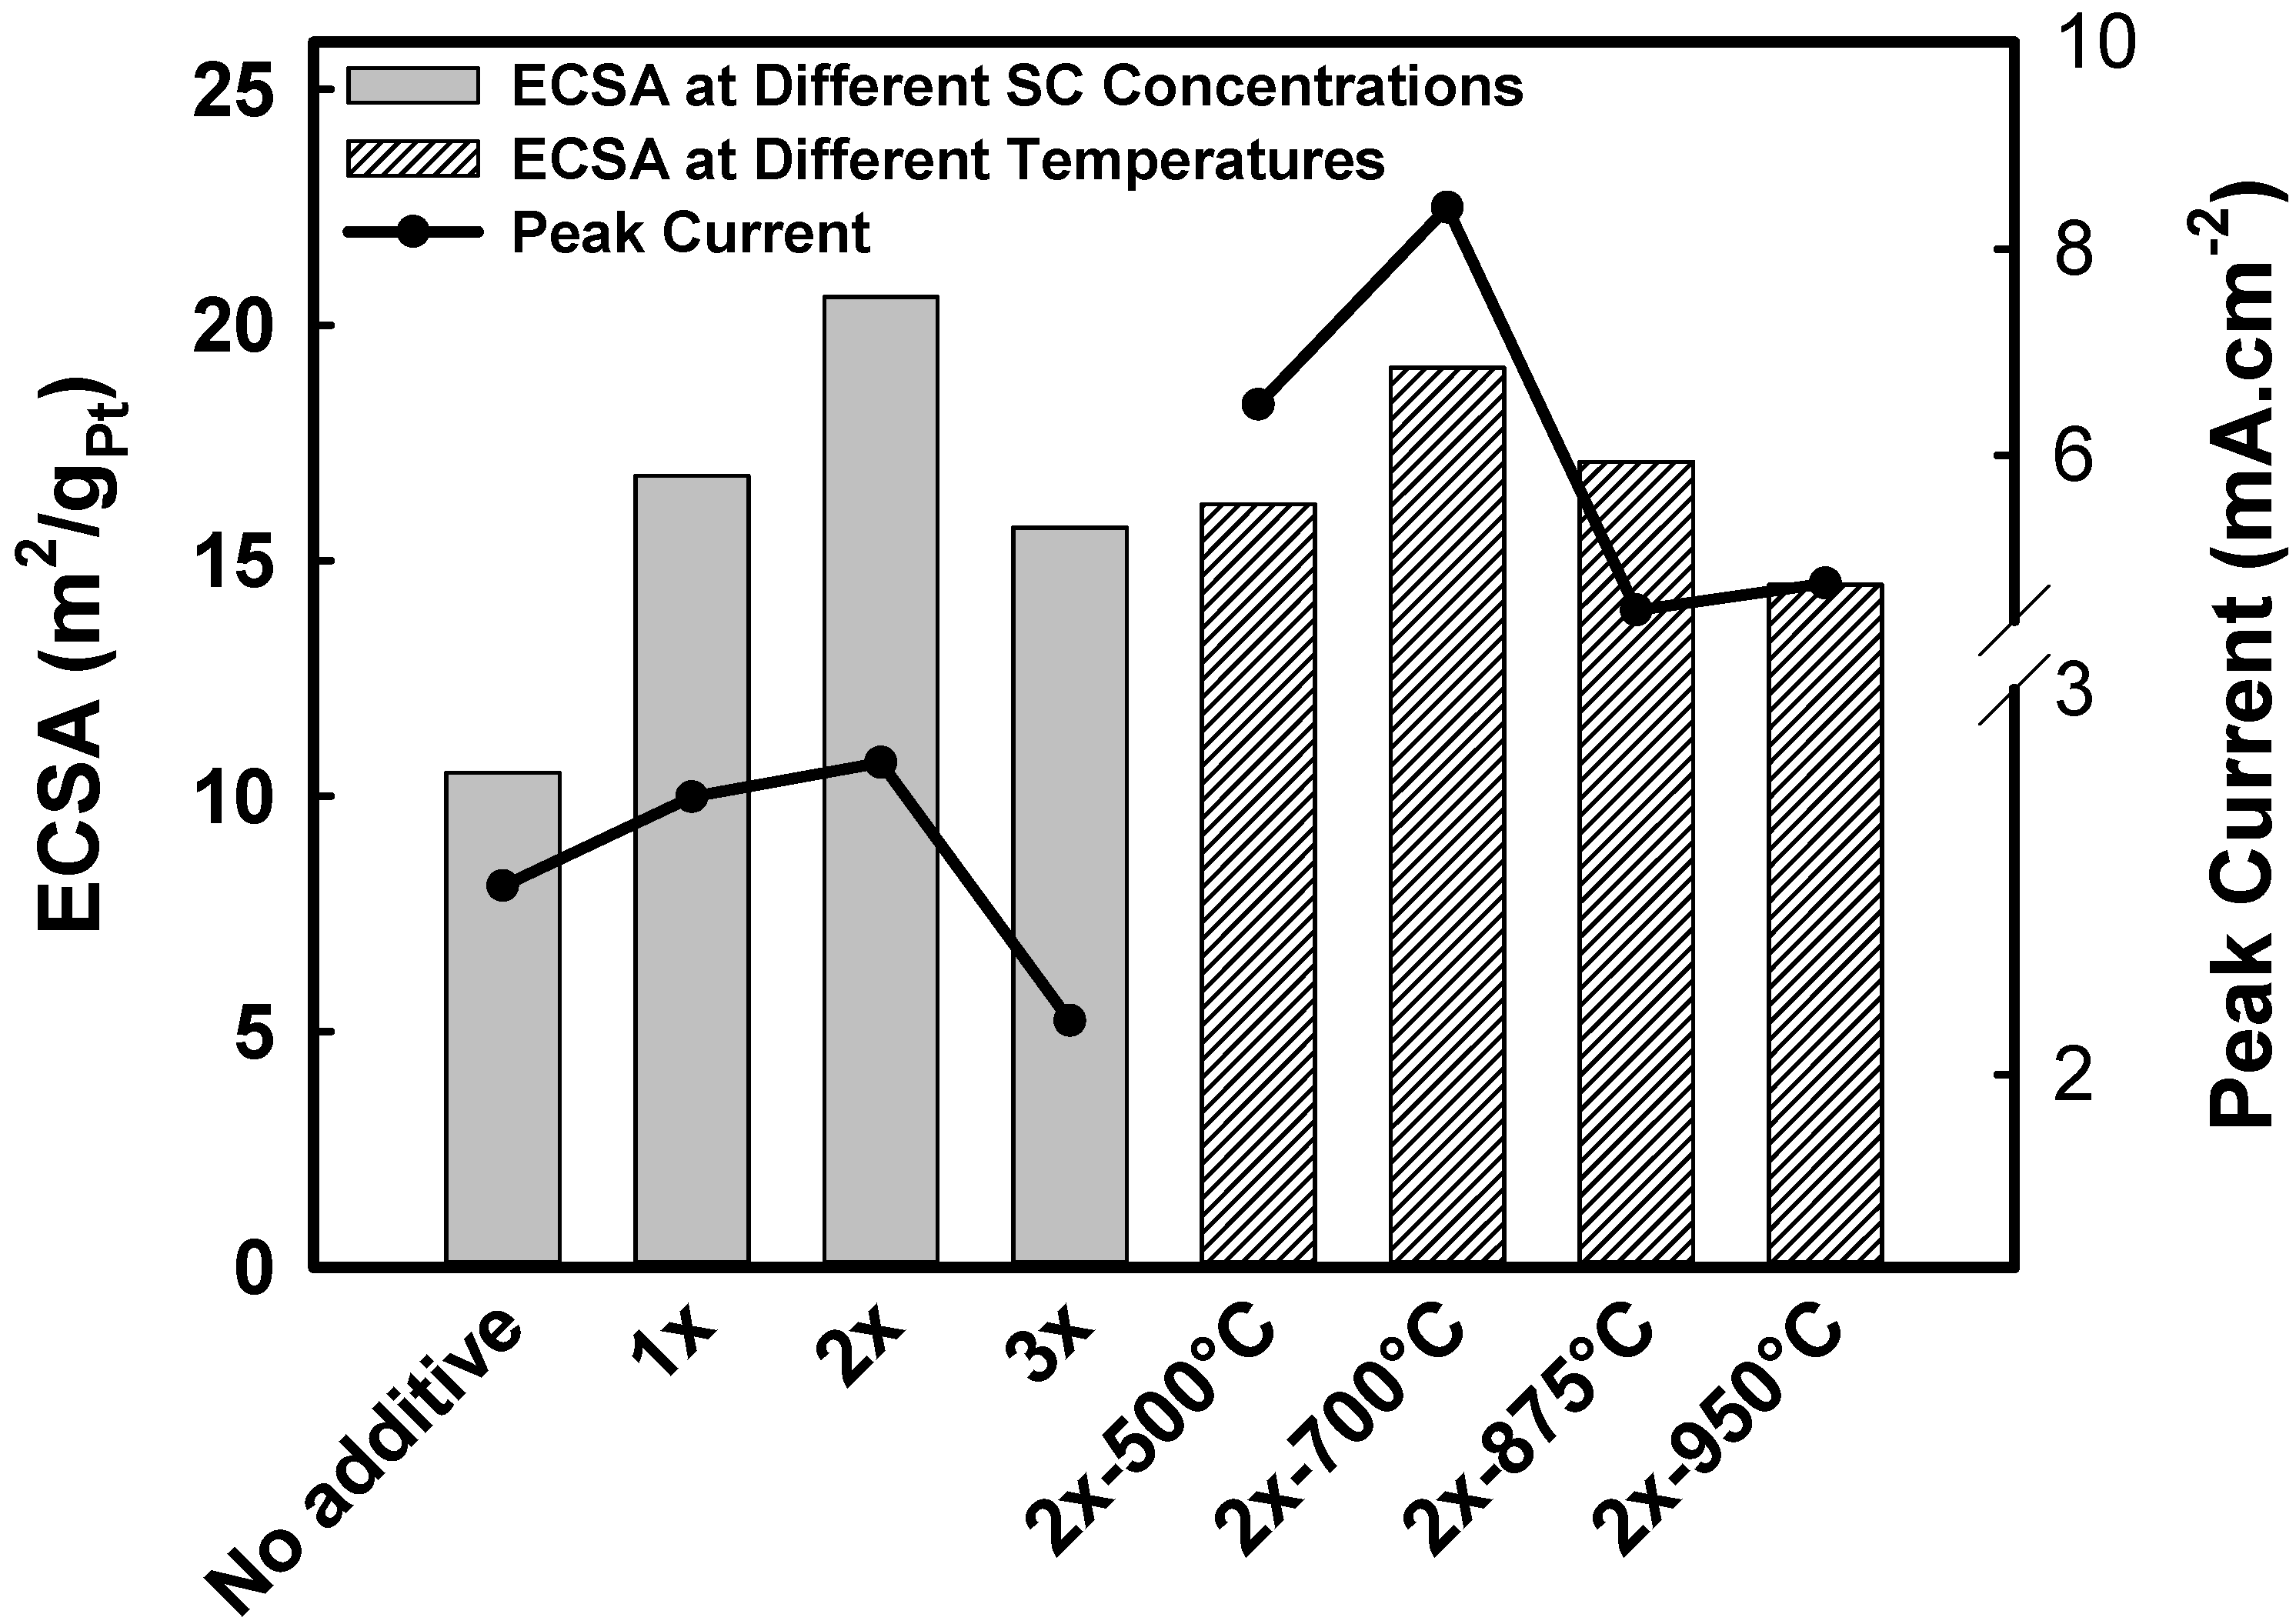
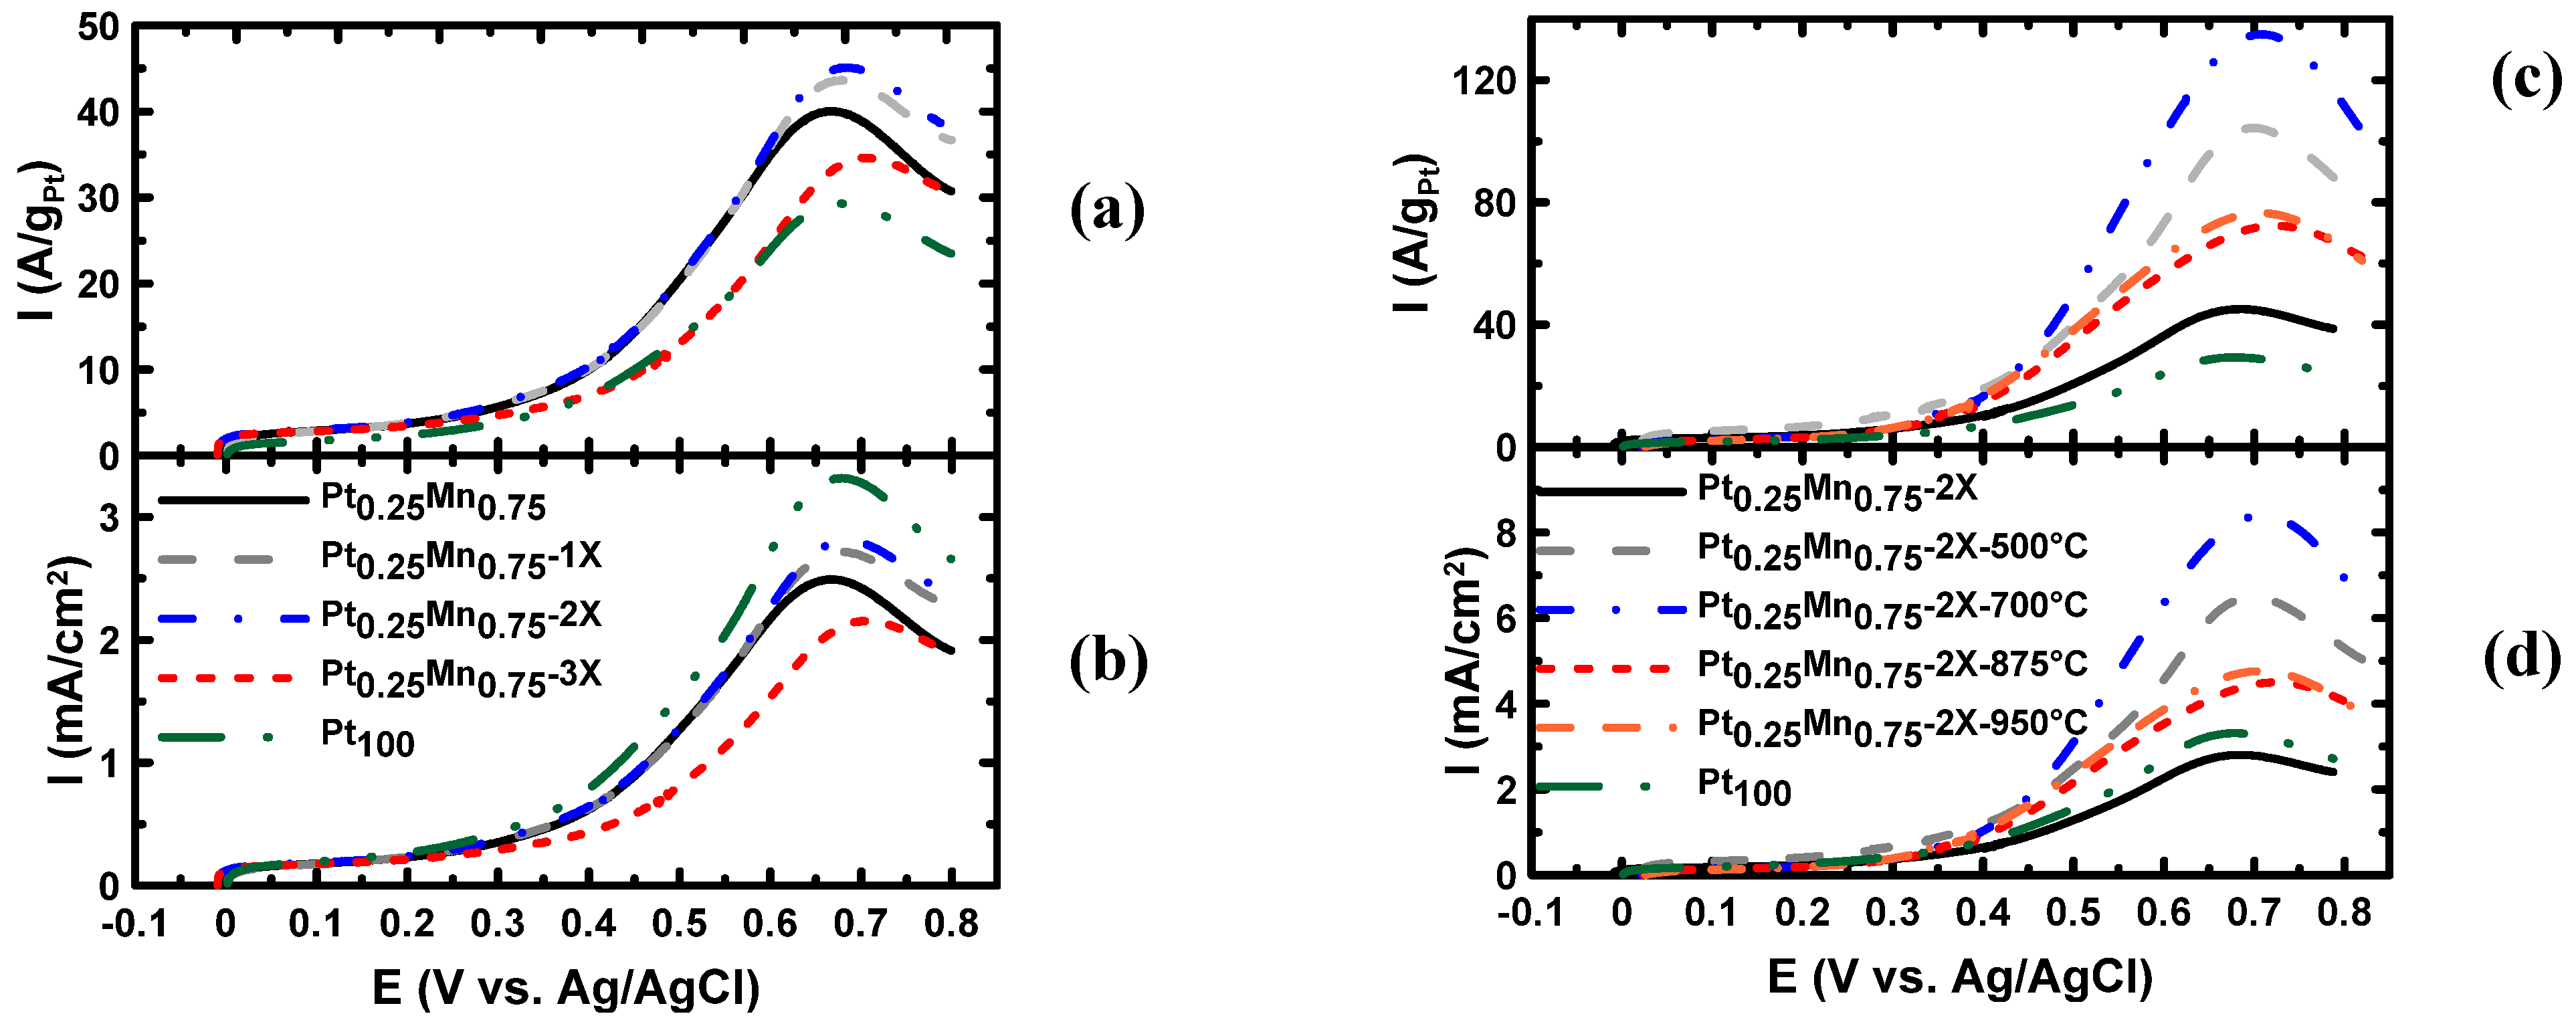
2.2. Electrochemical Characterization
| Samples | Onset potential (mV) | Current (mA.cm−2) at 350 mV | Peak potential (mV) | Peak current (mA.cm−2) | ECSA (m2/gPt) |
|---|---|---|---|---|---|
| Pt0.25Mn0.75 | 248 | 0.461 | 665 | 2.49 | 10.5 |
| Pt0.25Mn0.75-1x | 247 | 0.472 | 678 | 2.72 | 16.8 |
| Pt0.25Mn0.75-2x | 249 | 0.489 | 690 | 2.81 | 20.6 |
| Pt0.25Mn0.75-3x | 266 | 0.355 | 695 | 2.14 | 15.7 |
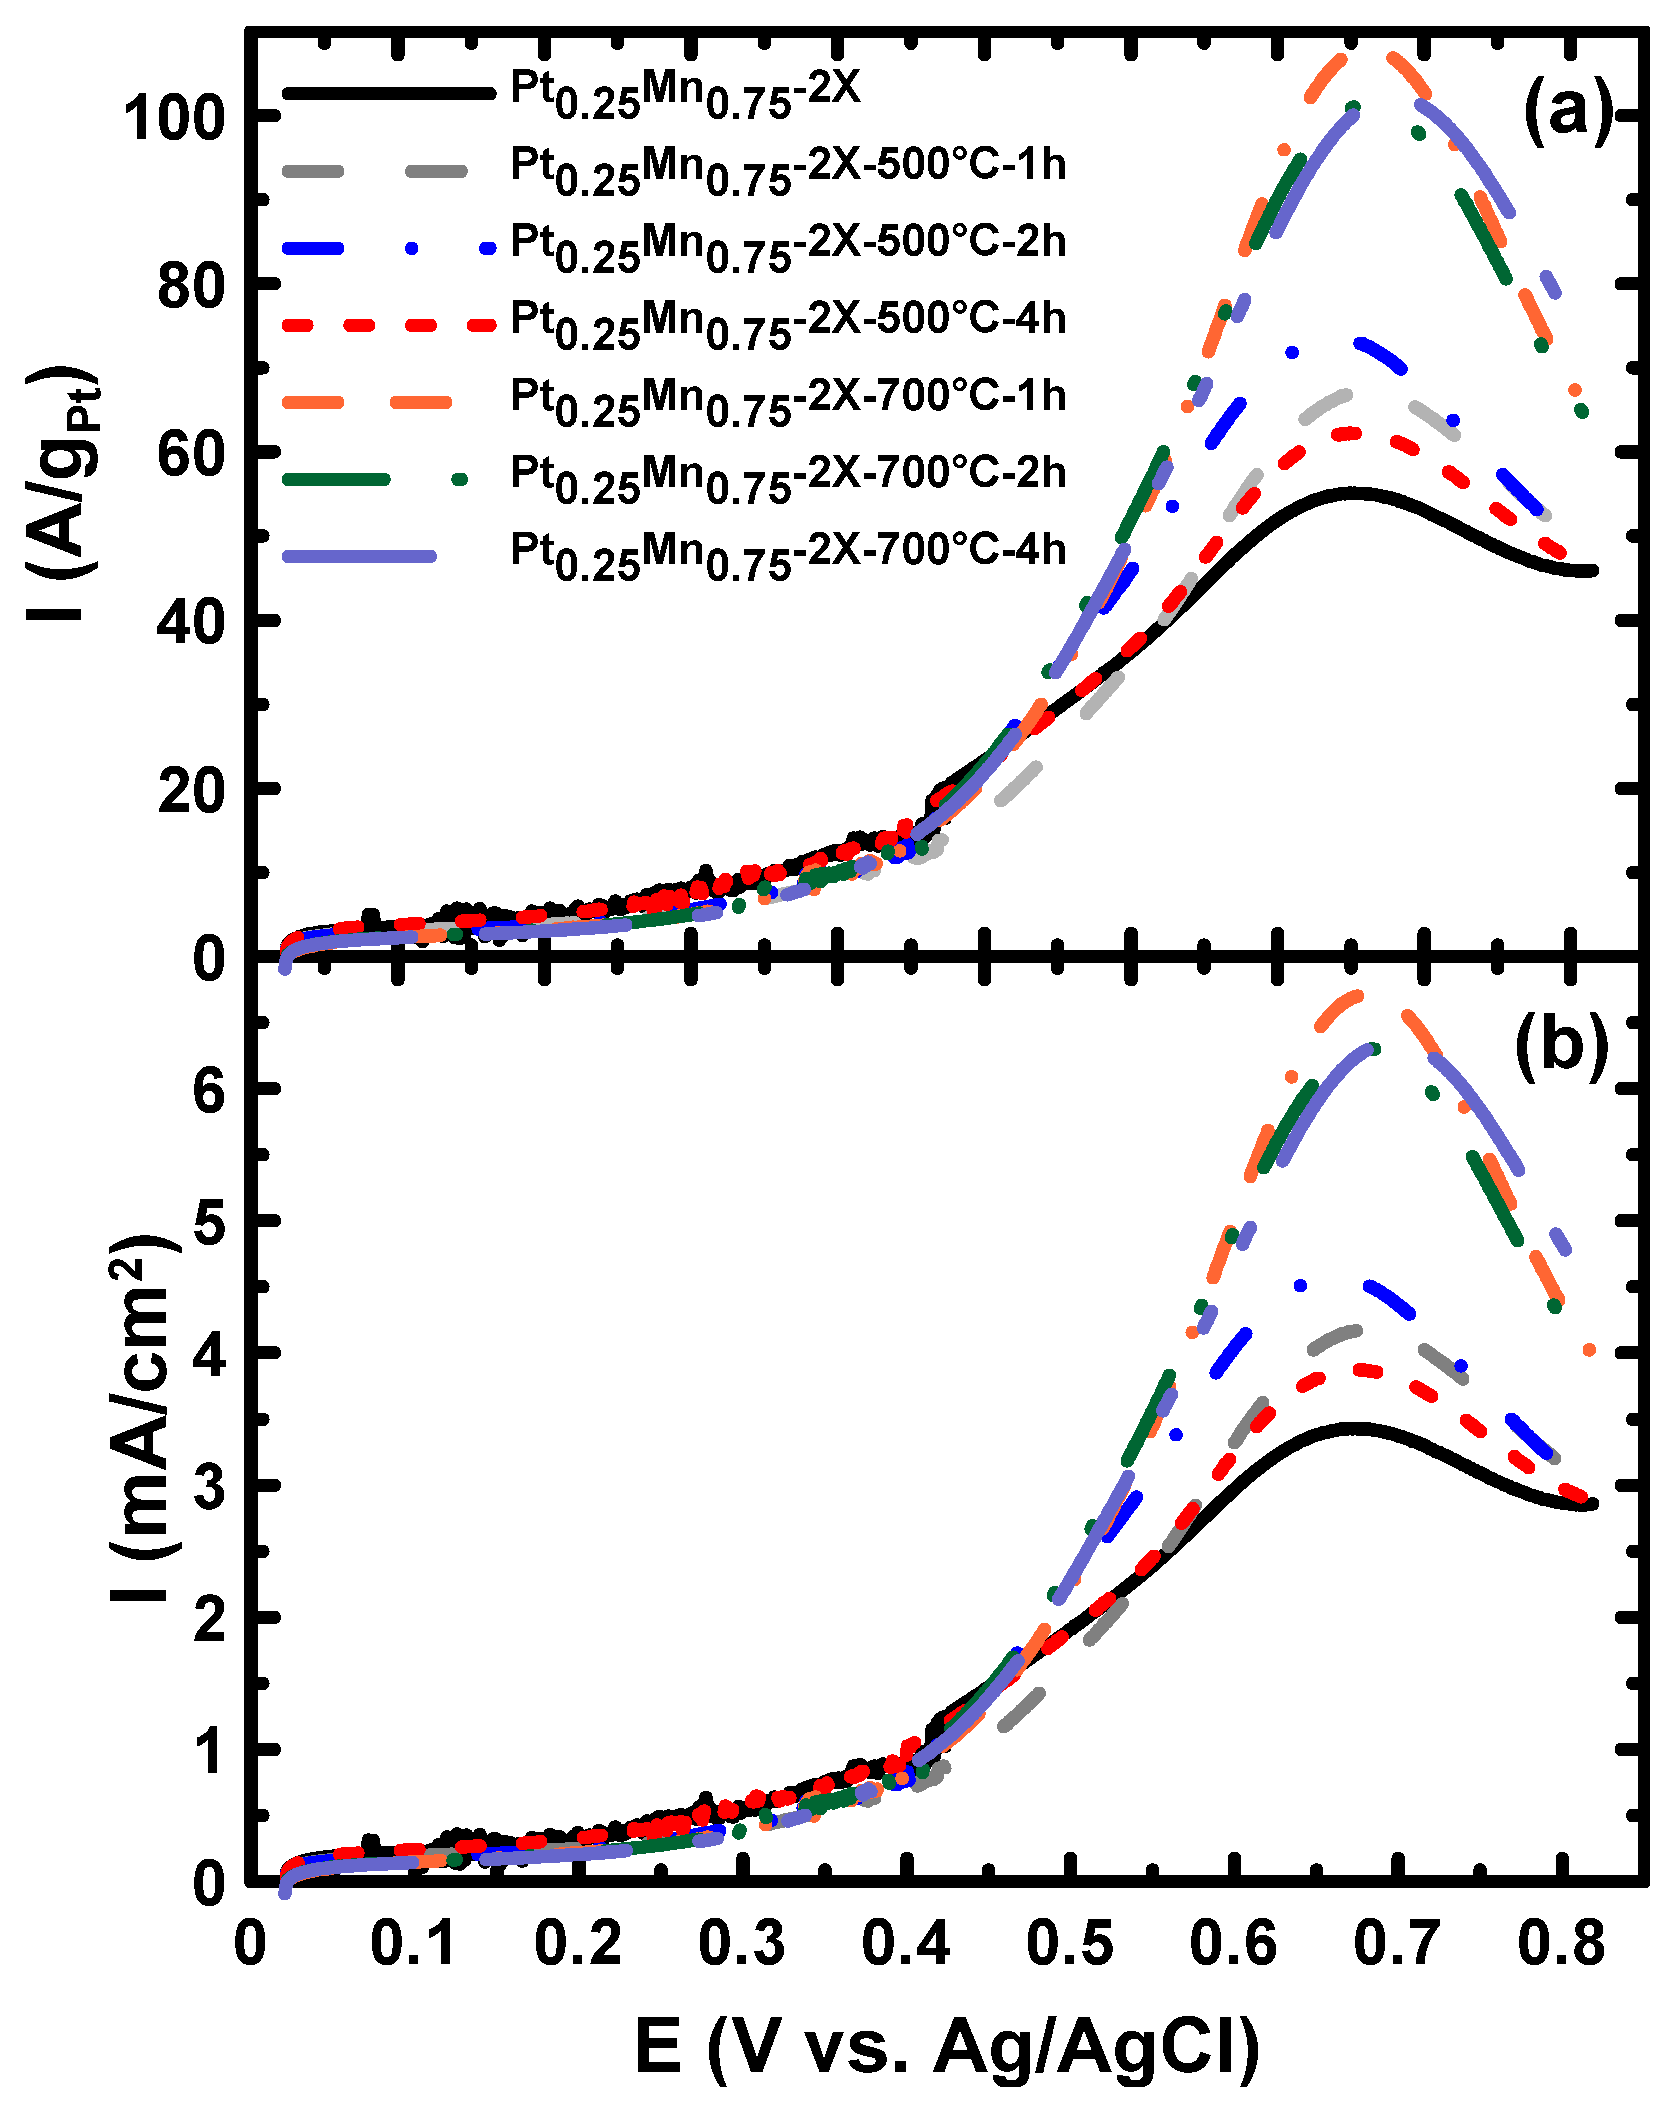
| Pt0.25Mn0.75-2X-500°C-1 h | 248 | 0.880 | 703 | 6.49 | 16.2 |
| Pt0.25Mn0.75-2X-700°C-1 h | 240 | 0.628 | 710 | 8.40 | 19.1 |
| Pt0.25Mn0.75-2X-875°C-1 h | 237 | 0.602 | 729 | 4.50 | 17.1 |
| Pt0.25Mn0.75-2X-950°C-1 h | 233 | 0.638 | 703 | 4.76 | 14.5 |
| Pt0.25Mn0.75-2X-500°C-2 h | 245 | 0.655 | 662 | 4.58 | 13.8 |
| Pt0.25Mn0.75-2X-500°C-4 h | 241 | 0.709 | 671 | 3.87 | 15.4 |
| Pt0.25Mn0.75-2X-700°C-2 h | 240 | 0.588 | 682 | 6.30 | 17.1 |
| Pt0.25Mn0.75-2X-700°C-4 h | 241 | 0.556 | 698 | 6.35 | 15.7 |

3. Experimental Section
3.1. Catalyst Synthesis
3.2. Materials Characterization
3.3. Electrochemical Characterization
4. Conclusions
Supplementary Files
Supplementary File 1Acknowledgments
Author Contributions
Conflicts of Interest
References
- Antolini, E. Formation of carbon-supported PtM alloys for low temperature fuel cells: A review. Mater. Chem. Phys. 2003, 78, 563–573. [Google Scholar] [CrossRef]
- Watanabe, A.; Uchida, H. Catalysts for the Electro-Oxidation of Small Molecules. In Handbook of Fuel Cells—Fundamentals, Technology and Applications; Vielstich, W., Lamm, A., Gasteiger, H., Eds.; John Wiley & Sons, Ltd.: Chichester, UK, 2010. [Google Scholar]
- Liu, H.; Song, C.; Zhang, L.; Zhang, J.; Wang, H.; Wilkinson, D.P. A review of anode catalysis in the direct methanol fuel cell. J. Power Sources 2006, 155, 95–110. [Google Scholar] [CrossRef]
- Ammam, M.; Prest, L.E.; Pauric, A.D.; Easton, E.B. Synthesis, Characterization and Catalytic Activity of Binary PtMn/C Alloy Catalysts towards Ethanol Oxidation. J. Electrochem. Soc. 2012, 159, B195–B200. [Google Scholar] [CrossRef]
- Castro Luna, A.M.; Camara, G.A.; Paganin, V.A.; Ticianelli, E.A.; Gonzalez, E.R. Effect of thermal treatment on the performance of CO-tolerant anodes for polymer electrolyte fuel cells. Electrochem. Communs. 2000, 2, 222–225. [Google Scholar] [CrossRef]
- Cherstiouk, O.V.; Gavrilov, A.N.; Plyasova, L.M.; Molina, I.Y.; Tsirlina, G.A.; Savinova, E.R. Influence of structural defects on the electrocatalytic activity of platinum. J. Solid State Electrochem. 2008, 12, 497–509. [Google Scholar] [CrossRef]
- Vigier, F.; Rousseau, S.; Coutanceau, C.; Leger, J.; Lamy, C. Electrocatalysis for the direct alcohol fuel cell. Topics Catal. 2006, 40, 111–121. [Google Scholar] [CrossRef]
- Ammam, M.; Easton, E.B. Ternary PtMnX/C (X = Fe, Co, Ni, Cu, Mo and, Sn) Alloy Catalysts for Ethanol Electrooxidation. J. Electrochem. Soc. 2012, 159, B635–B640. [Google Scholar] [CrossRef]
- Ammam, M.; Easton, E.B. Quaternary PtMnCuX/C (X = Fe, Co, Ni, and Sn) and PtMnMoX/C (X = Fe, Co, Ni, Cu and Sn) alloys catalysts: Synthesis, characterization and activity towards ethanol electrooxidation. J. Power Sources 2012, 215, 188–198. [Google Scholar] [CrossRef]
- Zamanzad Ghavidel, M.R.; Easton, E.B. Thermally induced changes in the structure and ethanol oxidation activity of Pt0.25Mn0.75/C. Appl. Catal. B 2015, 176-177, 150–159. [Google Scholar] [CrossRef]
- Bezerra, C.W.B.; Zhang, L.; Liu, H.; Lee, K.; Marques, A.A.L.B.; Marques, E.P.; Wang, H.; Zhang, J. A review of heat-treatment effects on activity and stability of PEM fuel cell catalysts for oxygen reduction reaction. J. Power Sources 2007, 173, 891–908. [Google Scholar] [CrossRef]
- Lee, K.; Zhang, J.; Wang, H.; Wilkinson, D.P. Progress in the synthesis of carbon nanotube- and nanofiber-supported Pt electrocatalysts for PEM fuel cell catalysis. J. Appl. Electrochem. 2006, 36, 507–522. [Google Scholar] [CrossRef]
- Liu, Z.; Lee, J.Y.; Chen, W.; Han, M.; Gan, L.M. Physical and Electrochemical Characterizations of Microwave-Assisted Polyol Preparation of Carbon-Supported PtRu Nanoparticles. Langmuir 2003, 20, 181–187. [Google Scholar] [CrossRef]
- Bonnemann, H.; Richards, R.-M. Nanoscopic Metal Particles- Synthetic Methods and Potential Applications. Eur. J. Inorg. Chem. 2001, 2001, 2455–2480. [Google Scholar] [CrossRef]
- Xiong, L.; Manthiram, A. Nanostructured Pt-M/C (M = Fe and Co) catalysts prepared by a microemulsion method for oxygen reduction in proton exchange membrane fuel cells. Electrochim. Acta 2005, 50, 2323–2329. [Google Scholar] [CrossRef]
- Antonucci, P.L.; Alderucci, V.; Giordano, N.; Cocke, D.L.; Kim, H. On the role of surface functional groups in Pt carbon interaction. J. Appl. Electrochem. 1994, 24, 58–65. [Google Scholar] [CrossRef]
- Hui, C.L.; Li, X.G.; Hsing, I.M. Well-dispersed surfactant-stabilized Pt/C nanocatalysts for fuel cell application: Dispersion control and surfactant removal. Electrochim. Acta 2005, 51, 711–719. [Google Scholar] [CrossRef]
- Moghaddam, R.B.; Pickup, P.G. Support effects on the oxidation of ethanol at Pt nanoparticles. Electrochim. Acta 2012, 65, 210–215. [Google Scholar] [CrossRef]
- Tian, J.H.; Wang, F.B.; Shan, Z.H.Q.; Wang, R.J.; Zhang, J.Y. Effect of Preparation Conditions of Pt/C Catalysts on Oxygen Electrode Performance in Proton Exchange Membrane Fuel Cells. J. Appl. Electrochem. 2004, 34, 461–467. [Google Scholar] [CrossRef]
- Di Noto, V.; Negro, E. Pt-Fe and Pt-Ni Carbon Nitride-Based “Core-Shell” ORR Electrocatalysts for Polymer Electrolyte Membrane Fuel Cells. Fuel Cells 2010, 10, 234–244. [Google Scholar] [CrossRef]
- Di Noto, V.; Negro, E. Development of nano-electrocatalysts based on carbon nitride supports for the ORR processes in PEM fuel cells. Electrochim. Acta 2010, 55, 7564–7574. [Google Scholar] [CrossRef]
- Easton, E.B.; Zamanzad Ghavidel, M.R.; Reid, O.R.; Ammam, M.; Prest, L.E. Limiting the Amount of Oxides in Pt-Mn Alloy Catalysts for Ethanol Oxidation. In Proceedings of the 223rd ECS Meeting, Toronto, ON, Canada, 12–16 May 2013; MA2013–01(39). p. 1366.
- Wang, X.; Hsing, I.M. Surfactant stabilized Pt and Pt alloy electrocatalyst for polymer electrolyte fuel cells. Electrochim. Acta 2002, 47, 2981–2987. [Google Scholar] [CrossRef]
- Yang, J.; Lee, J.Y.; Too, H.P. Size effect in thiol and amine binding to small Pt nanoparticles. Analytica. Chimica. Acta 2006, 571, 206–210. [Google Scholar] [CrossRef] [PubMed]
- Gasteiger, H.A.; Kocha, S.S.; Sompalli, B.; Wagner, F.T. Activity benchmarks and requirements for Pt, Pt-alloy, and non-Pt oxygen reduction catalysts for PEMFCs. Appl. Catal. B 2005, 56, 9–35. [Google Scholar] [CrossRef]
- Zeng, J.; Yang, J.; Lee, J.Y.; Zhou, W. Preparation of Carbon-Supported Core-Shell Au-Pt Nanoparticles for Methanol Oxidation Reaction: The Promotional Effect of the Au Core. J. Phys. Chem. B 2006, 110, 24606–24611. [Google Scholar] [CrossRef] [PubMed]
- Liao, S.; Holmes, K.A.; Tsaprailis, H.; Birss, V.I. High Performance PtRuIr Catalysts Supported on Carbon Nanotubes for the Anodic Oxidation of Methanol. J. Am. Chem. Soc. 2006, 128, 3504–3505. [Google Scholar] [CrossRef] [PubMed]
- Zeng, J.; Lee, J.Y. Effects of preparation conditions on performance of carbon-supported nanosize Pt-Co catalysts for methanol electro-oxidation under acidic conditions. J. Power Sources 2005, 140, 268–273. [Google Scholar] [CrossRef]
- Kangasniemi, K.H.; Condit, D.A.; Jarvi, T.D. Characterization of Vulcan Electrochemically Oxidized under Simulated PEM Fuel Cell Conditions. J. Electrochem. Soc. 2004, 151, E125–E132. [Google Scholar] [CrossRef]
- Baturina, O.A.; Aubuchon, S.R.; Wynne, K.J. Thermal Stability in Air of Pt/C Catalysts and PEM Fuel Cell Catalyst Layers. Chem. Mater. 2006, 18, 1498–1504. [Google Scholar] [CrossRef]
- Stobbe, E.R.; de Boer, B.A.; Geus, J.W. The reduction and oxidation behaviour of manganese oxides. Catal. Today 1999, 47, 161–167. [Google Scholar] [CrossRef]
- Ji, C.X.; Ladwig, P.; Ott, R.; Yang, Y.; Yang, J.; Chang, Y.A.; Linville, E.; Gao, J.; Pant, B. An investigation of phase transformation behavior in sputter-deposited PtMn thin films. JOM 2006, 58, 50–54. [Google Scholar] [CrossRef]
- Easton, E.B.; Yang, R.; Bonakdarpour, A.; Dahn, J.R. Thermal Evolution of the Structure and Activity of Magnetron-Sputtered TM-C-N (TM = Fe, Co) Oxygen Reduction Catalysts. Electrochem. Solid-State Lett. 2007, 10, B6–B10. [Google Scholar] [CrossRef]
- Ghosh, T.; Leonard, B.M.; Zhou, Q.; DiSalvo, F.J. Pt Alloy and Intermetallic Phases with V, Cr, Mn, Ni, and Cu: Synthesis As Nanomaterials and Possible Applications As Fuel Cell Catalysts. Chem. Mater. 2010, 22, 2190–2202. [Google Scholar] [CrossRef]
- Antolini, E. Formation, microstructural characteristics and stability of carbon supported platinum catalysts for low temperature fuel cells. J. Mater. Sci. 2003, 38, 2995–3005. [Google Scholar] [CrossRef]
- Watanabe, M.; Tsurumi, K.; Mizukami, T.; Nakamura, T.; Stonehart, P. Activity and Stability of Ordered and Disordered Co-Pt Alloys for Phosphoric Acid Fuel Cells. J. Electrochem. Soc. 1994, 141, 2659–2668. [Google Scholar] [CrossRef]
- Harlow, J.E.; Stevens, D.A.; Sanderson, R.J.; Liu, G.C.K.; Lohstreter, L.B.; Vernstrom, G.D.; Atanasoski, R.T.; Debe, M.K.; Dahn, J.R. Structural Changes Induced by Mn Mobility in a Pt1-xMnx Binary Composition-Spread Catalyst. J. Electrochem. Soc. 2012, 159, B670–B676. [Google Scholar] [CrossRef]
- Stevens, D.A.; Mehrotra, R.; Sanderson, R.J.; Vernstrom, G.D.; Atanasoski, R.T.; Debe, M.K.; Dahn, J.R. Dissolution of Ni from High Ni Content Pt1−xNix Alloys. J. Electrochem. Soc. 2011, 158, B905–B909. [Google Scholar] [CrossRef]
- Chen, C.; Kang, Y.; Huo, Z.; Zhu, Z.; Huang, W.; Xin, H. L.; Snyder, J.D.; Li, D.; Herron, J.A.; Mavrikakis, M.; Chi, M.; More, K.L.; Li, Y.; Markovic, N.M.; Somorjai, G.A.; Yang, P.; Stamenkovic, V.R. Highly Crystalline Multimetallic Nanoframes with Three-Dimensional Electrocatalytic Surfaces. Science 2014, 343, 1339–1343. [Google Scholar] [CrossRef] [PubMed]
© 2015 by the authors; licensee MDPI, Basel, Switzerland. This article is an open access article distributed under the terms and conditions of the Creative Commons Attribution license (http://creativecommons.org/licenses/by/4.0/).
Share and Cite
Ghavidel, M.Z.; Easton, E.B. Improving the Ethanol Oxidation Activity of Pt-Mn Alloys through the Use of Additives during Deposition. Catalysts 2015, 5, 1016-1033. https://doi.org/10.3390/catal5031016
Ghavidel MZ, Easton EB. Improving the Ethanol Oxidation Activity of Pt-Mn Alloys through the Use of Additives during Deposition. Catalysts. 2015; 5(3):1016-1033. https://doi.org/10.3390/catal5031016
Chicago/Turabian StyleGhavidel, Mohammadreza Zamanzad, and E. Bradley Easton. 2015. "Improving the Ethanol Oxidation Activity of Pt-Mn Alloys through the Use of Additives during Deposition" Catalysts 5, no. 3: 1016-1033. https://doi.org/10.3390/catal5031016
APA StyleGhavidel, M. Z., & Easton, E. B. (2015). Improving the Ethanol Oxidation Activity of Pt-Mn Alloys through the Use of Additives during Deposition. Catalysts, 5(3), 1016-1033. https://doi.org/10.3390/catal5031016