Article

In Situ XANES/XPS Investigation of Doped Manganese Perovskite Catalysts

1
Institut für Materialphysik, Georg-August-Universität Göttingen, Friedrich-Hund-Platz 1, 37077 Göttingen, Germany
2
Fritz-Haber-Institut der Max-Planck-Gesellschaft, Faradayweg 4-6, 14195 Berlin, Germany
*
Author to whom correspondence should be addressed.
Catalysts 2014, 4(2), 129-145; https://doi.org/10.3390/catal4020129
Submission received: 14 February 2014 / Revised: 26 March 2014 / Accepted: 1 April 2014 / Published: 23 April 2014
(This article belongs to the Special Issue Perovskite Catalysts)

Abstract

:
Studying catalysts in situ is of high interest for understanding their surface structure and electronic states in operation. Herein, we present a study of epitaxial manganite perovskite thin films (Pr1−xCaxMnO3) active for the oxygen evolution reaction (OER) from electro-catalytic water splitting. X-ray absorption near-edge spectroscopy (XANES) at the Mn L- and O K-edges, as well as X-ray photoemission spectroscopy (XPS) of the O 1s and Ca 2p states have been performed in ultra-high vacuum and in water vapor under positive applied bias at room temperature. It is shown that under the oxidizing conditions of the OER a reduced Mn2+ species is generated at the catalyst surface. The Mn valence shift is accompanied by the formation of surface oxygen vacancies. Annealing of the catalysts in O2 atmosphere at 120 °C restores the virgin surfaces.

Graphical Abstract

1. Introduction

The search for new energy storage technologies has sparked interest in electro-catalytic water splitting. Its overall efficiency is limited by the oxygen evolution reaction (OER). This half reaction can currently only be driven at high overpotentials because of limiting high potential steps in the multi-electron transfer reaction, where the formation of one O2 molecule requires the cooperative transfer of four electrons to the catalyst. To facilitate this multi-electron transfer at low overpotential, a catalyst needs to adjust its acceptor states to the oxidation potentials of all involved intermediates. This ability requires a sufficiently complex atomic and electronic structure. Mn–O compounds represent a promising material class due to the flexible Mn valence [1]. Possible shifts in the Mn valence between 2+ and 4+ during the reaction steps may allow the catalyst to adjust the bonding characteristics between an active Mn site and oxygen intermediates.
At present, theoretical works on the catalytic activity of perovskites (ABO3) are based on strong approximations, such as a frozen, defect free surface [2,3]. Those consider the bonding strength of the B-site cation to oxygen as a universal descriptor for oxygen evolution activity of perovskites. Systematic experimental studies of oxygen evolution activity of various transition metal oxide perovskites show a trend of activity with occupation of antibonding eg states of the B-site d subshell [4], i.e., a volcano type relation with maximum activity at an eg occupation of about one electron per B-cation. However, manganites seem not to follow this dependence. The activity may strongly depend on factors such as pH value influencing the geometric and electronic structure of the catalyst surface [5].
We present the investigation of the surface electronic structure of Pr1−xCaxMnO3 (0 < xCa < 0.8) by means of X-ray absorption near-edge spectroscopy (XANES) and X-ray photo-emission spectroscopy (XPS). The heterovalent Ca-doping results in a Mn valence shift with a bulk average value varying from 3.0+ (xCa = 0.0) to 3.8+ (xCa = 0.8). To what extent the average valence Mn(3+x)+ is comprised of a mixture of Mn3+ and Mn4+ species, or formed by an intermediate valence state is controversially discussed in the literature [6,7]. A formation of intermediate Mn valences would be consistent with a more “covalent-like” electron density distribution within the Mn 3d–O 2p conduction band. By studying the thresholds and line shapes of the Mn L- and O K-edges, we give evidence for the presence of an intermediate Mn valence.
The central question addressed in this work is the surface electronic structure including the valence of the Mn surface sites during catalytic activity. In the presence of water vapor the surface valence may differ from the bulk value due to the bonding of various adsorbates and the formation of surface defects such as oxygen vacancies. The presented spectra have either been recorded in ultra-high vacuum (UHV), or in contact with water vapor at the crystalline catalyst surface with an applied positive electric potential, nominally corresponding to OER conditions. It is shown, that upon in situ activation of the catalyst surface Mn2+ coexists with the mean bulk valence of Mn(3+x)+. This is consistent with the reversible formation of surface oxygen vacancies as well as surface hydroxide adsorbates. It is furthermore shown that the virgin surface measured under UHV conditions can be restored by annealing at about 120 °C in 0.1 mbar O2. The formation of surface oxygen vacancies contradicts the expectations from the oxidizing electro-chemical conditions during oxygen evolution and, thus, sheds light onto possible reaction mechanisms.

2. Results and Discussion

2.1. Doping Dependence of Virgin Samples
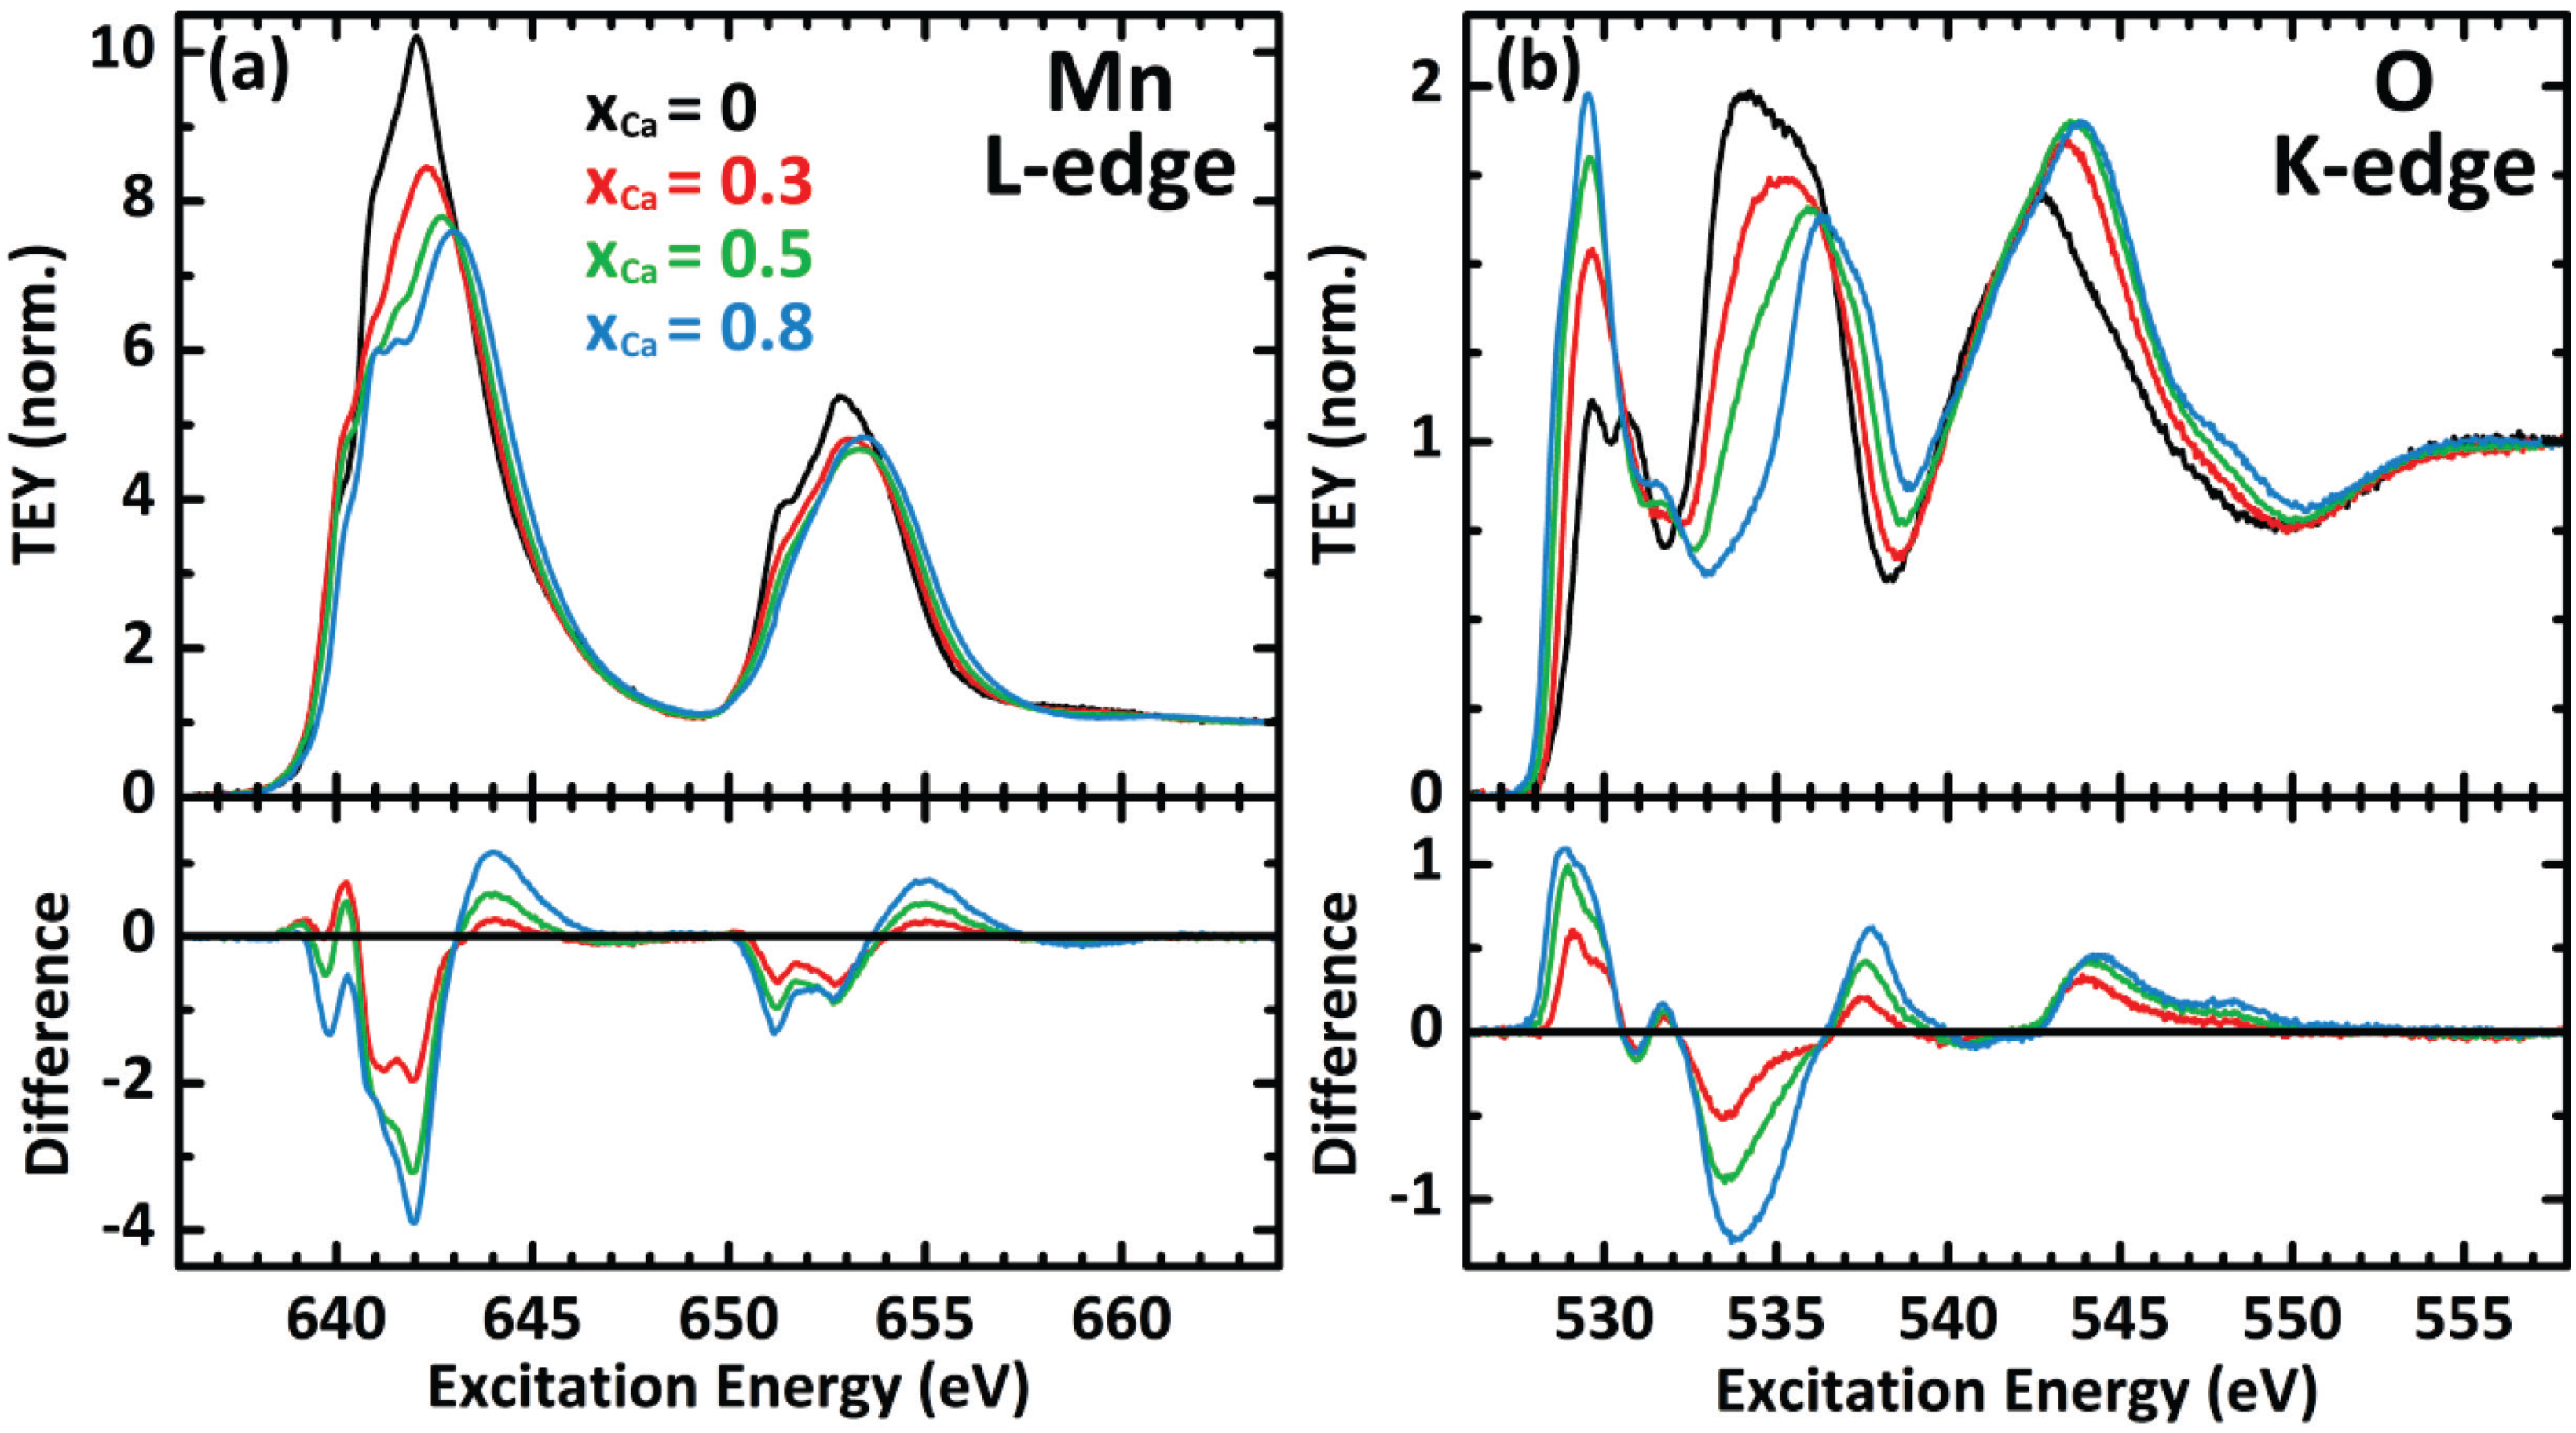
Mn L-edge and O K-edge spectra of the virgin samples under UHV conditions are shown in Figure 1. The Mn L-edge is split into two separate multiplets L3 (at 642 eV) and L2 (at 653 eV) due to spin-orbit interaction of the Mn 2p3/2 and 2p1/2 core states. The complex structure of these edges can be attributed to the Mn 3d states due to the octahedral ligand field including hybridization with O 2p states as well as Coulomb and exchange interactions within the 3d states [8,9,10]. Compared to simple Mn oxides, further complexity of the L3 edge is produced by the lower local symmetry due to octahedral tilting in the orthorhombic PCMO phase [11]. Linear superposition (Appendix Figure A1) of the spectra at xCa = 0 and 0.8 resulted in poor agreement with the spectra at intermediate doping of xCa = 0.3 and 0.5, which indicates an intermediate valence state of Mn(3+x)+ instead of coexisting Mn3+ and Mn4+ species [12]. This observation clearly supports the statement of a high covalence of the Mn-O bond.
Figure 1. Normalized (see experimental section) X-ray absorption of virgin samples in UHV. (a) The Mn L-edge shows the systematic increase in Mn valence with increasing xCa; (b) Intensity of the pre-edge feature of the O K-edge (530 eV) increases with xCa.
Catalysts 04 00129 g001
The L3 peak shifts to higher energies and its area decreases systematically with increasing xCa and therefore increasing formal Mn valence of (3 + xCa)+. A similar trend can be seen for the L2 edge. This chemical shift is in good agreement with reported results on various manganite perovskites [13,14] and other Mn compounds [9]. According to studies of Mn oxide compounds by means of Electron Energy Loss Spectroscopy (EELS) [15] the decreasing energetic distance ΔEL between the maxima of the Mn L2 and L3 edges (Figure 1a and Table 1) due to increasing xCa corresponds to an increase in Mn valence. Despite the systematic error resulting from only taking into account the maximum position of the complex L3 edge structure, our data represent a systematic valence shift as expected from sample stoichiometry (formal bulk valence from 3.0+ to 3.8+). Moreover, the integral intensity ratio of the L3 and L2 edges decreases systematically with increasing xCa (Table 1, for details see Appendix). According to Riedl et al. [16] our data quantitatively represent the expectation of a systematic Mn valence increase between 3+ and 4+.
Table 1. Mn valence indicators obtained from the Mn L- and O K-edge spectra of virgin samples under ultra-high vacuum (UHV) conditions. The energetic distance between the Mn L3 and L2 edges (∆EL), their intensity ratio (I3/I2) after subtraction of a constant L2 background (BG1) or linear backgrounds for each edge (BG2, see Appendix) as well as the distance between the pre-edge feature and the first main resonance of the O K-edge (ΔEK) are summarized.
xCaformal bulk valenceΔEL (eV)I3/I2 (BG1)I3/I2 (BG2)ΔEK (eV)
03.0+10.82.892.543.8
0.33.3+10.82.882.535.8
0.53.5+10.62.852.466.3
0.83.8+10.42.752.326.8
The pre-edge region of the O K-edge at roughly 530 eV (Figure 1b) represents excitation into hybridized states containing O 2p and Mn 3d states [17,18]. It is thus a direct expression of the degree of covalence of the Mn–O bond near the Fermi level. Our results show splitting of the pre-edge feature for the undoped PrMnO3 (formal Mn valence of 3+), which can be explained by ligand field interaction and high-spin Hund’s coupling resulting in O 2p states hybridized with majority spin Mn eg states at 529.6 eV and with minority spin Mn t2g states at 530.8 eV [19]. Heterovalent Ca-doping leads to a decreased Mn 3d occupation, which is reflected by the systematic intensity increase at the low energy flank of the pre-edge region. Furthermore, the first main resonance, which results from excitation into hybridized states containing Pr 5d and Ca 3d contributions [20], shifts from 534 eV (xCa = 0) to 536.4 eV (xCa = 0.8), which is in good agreement with data reported on various Sr- and Ca-doped rare-earth manganites [11,13]. These trends can be expressed as an increasing energetic distance ΔEK between the pre-edge feature and the first main resonance (Table 1), which reflects the effects of the hole doping [16].

2.2. In Situ Investigation

In previous work, oxygen evolution at Pr1−xCaxMnO3 has been detected in two electrode configurations at sample bias above +1.6 V. These experiments have been performed in liquid water by differential electrochemical mass spectrometry (DEMS) and by mass spectrometry in environmental transmission electron microscopy (ETEM) in water vapor [5]. We here present in situ studies of the same catalyst in 0.1 mbar H2O at sample bias of +2.5 V, where oxygen evolution is expected.
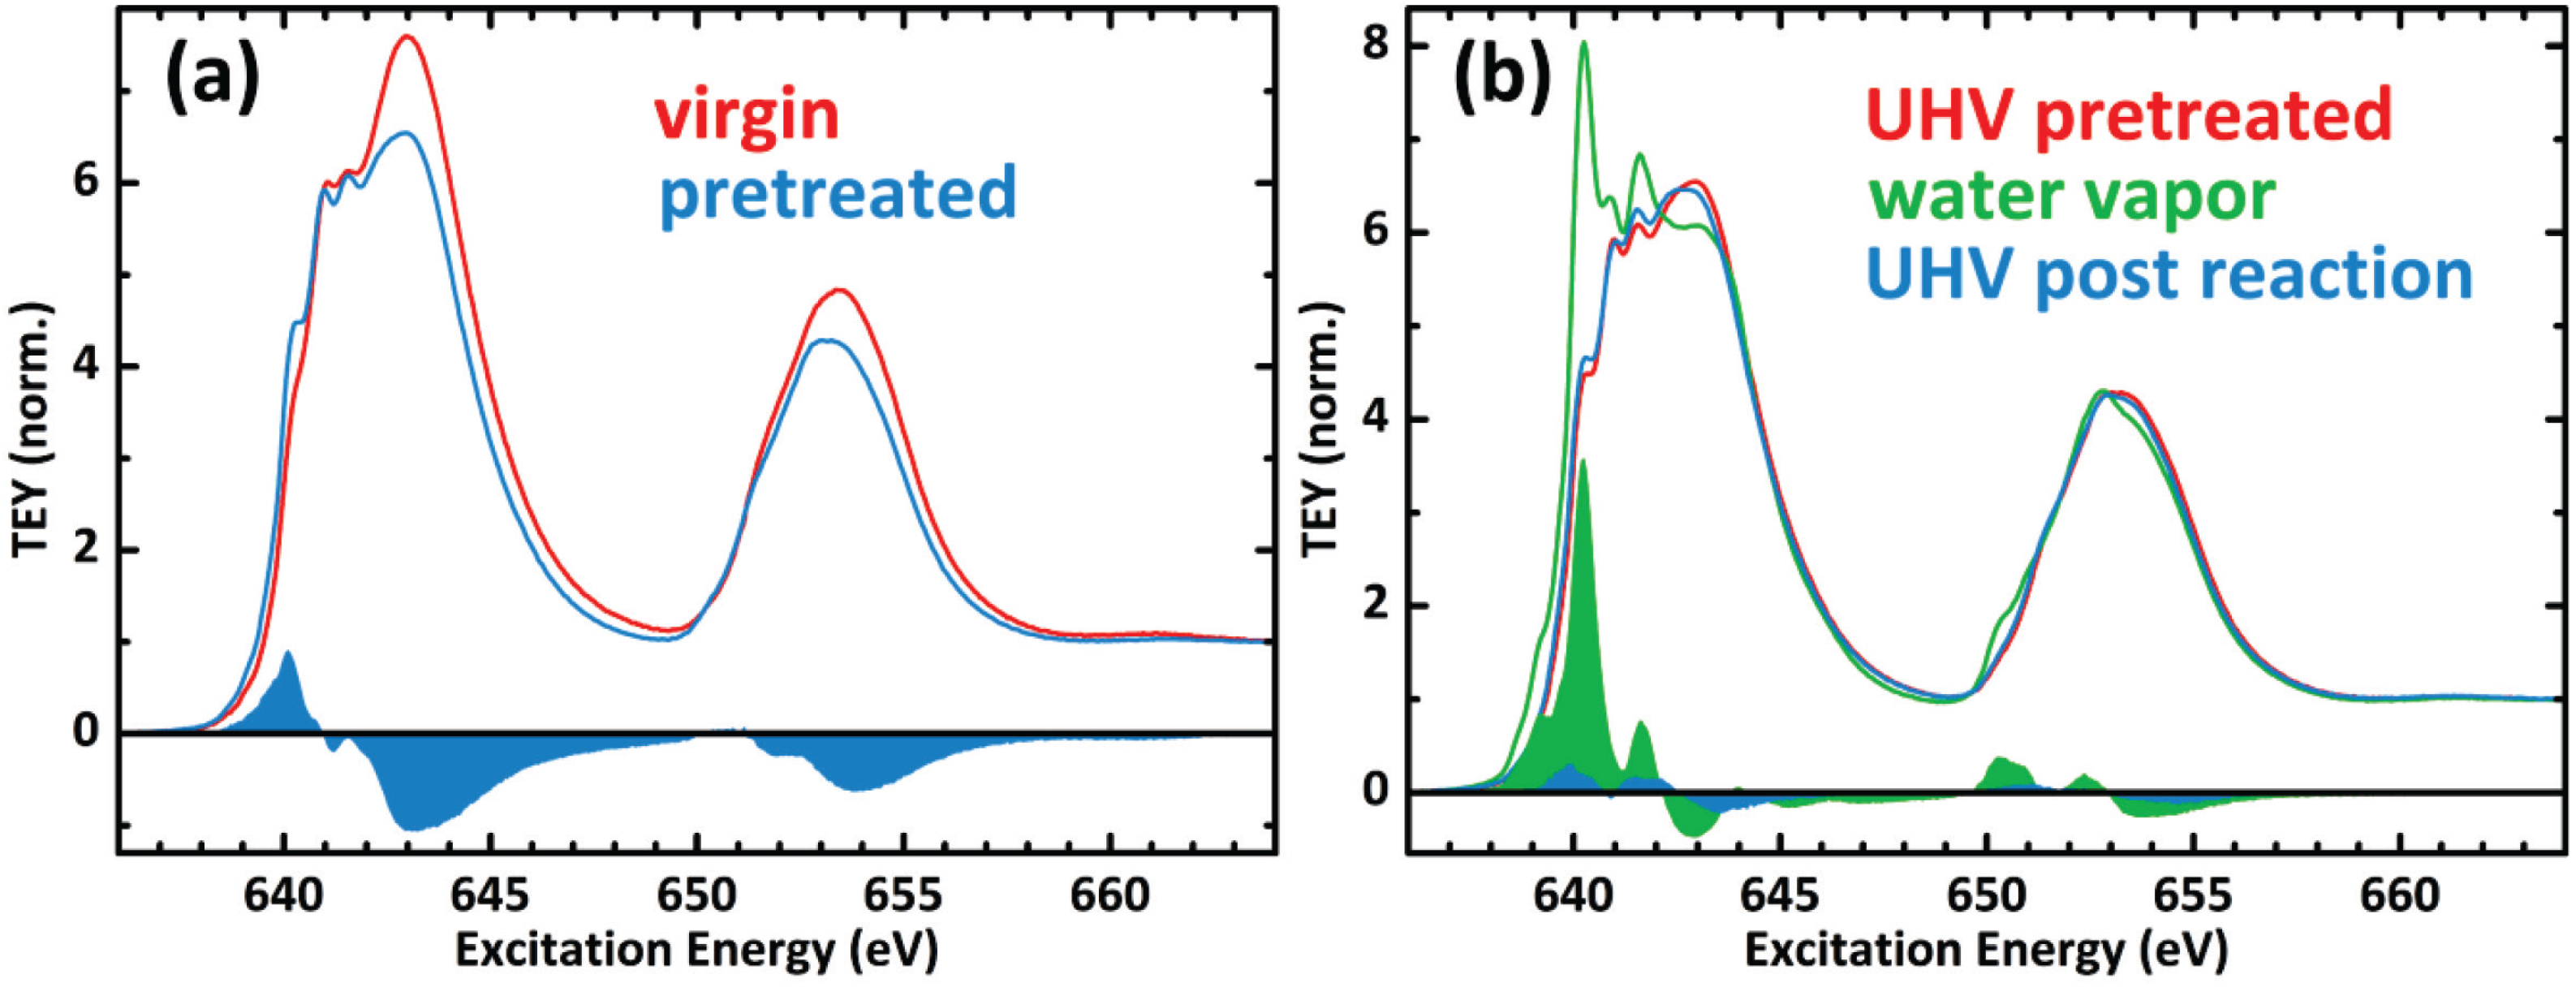
Figure 2 presents the change of the Mn L-edge during catalyst activation. In contact with the water vapor an increase in L3 and L2 intensity was observed. To analyze the changes in the Mn valence states, the difference spectra between the UHV virgin spectra and the spectra in water vapor at positive bias have been generated and are shown as filled green curves. With peaks at 640.2, 641.6, and 643.9 eV, they bear a resemblance to a pure Mn2+ spectrum, as will be shown in the following section. After heating the samples for 10 min to about 120 °C in 0.1 mbar O2 the post reaction analysis was done under UHV conditions. For xCa = 0.3 and 0.5 the original surface oxidation state was entirely restored, while minor changes remain for xCa = 0 and 0.8 (filled blue curves).
Figure 2. Normalized Mn L-edge spectra (Total Electron Yield) before (red) and during insertion of 0.1 mbar H2O with sample bias of +2.5 V against chamber ground (green), as well as in UHV after reoxidation in 0.1 mbar O2 (blue). Samples with xCa = 0 (a), xCa = 0.3 (b), xCa = 0.5 (c), and xCa = 0.8 (d). Filled curves represent the change from virgin to activated (green) and from virgin to post reaction (blue).
Catalysts 04 00129 g002
In order to get insight into the changes of the catalyst surface upon contact with liquid water with respect to the effects of water vapor, we compare in Figure 3 the Mn L-edges of a virgin sample at xCa = 0.8 with a sample which has been pretreated in liquid water without bias application. After keeping the sample in distilled water at room temperature for 60 min, it was directly dried and transferred into the UHV chamber. The pretreatment results in formation of some Mn2+ species in addition to the bulk Mn3.8+. We observe a slight general decrease of the intensity to background ratio, which may be due to surface adsorbates such as hydroxides.
This pretreated sample has then been investigated by the same in situ procedure as the virgin samples, which is shown in Figure 3b. The arising Mn2+ spectrum in response to water vapor under positive bias is more pronounced than the one of the virgin sample (Figure 2d), with its two main peaks at 640.2 and 641.6 eV dominating the L3 edge. After heating the sample for 10 min in 0.1 mbar O2 and returning to UHV the post reaction analysis shows the recovery of the pretreated state.
Figure 3. Normalized Mn L-edge of pretreated sample (xCa = 0.8). (a) Comparison to virgin sample with xCa = 0.8 in UHV; (b) Pretreated state in UHV (red), in 0.1 mbar H2O at a bias of +2.5 V against chamber ground (green), and post reaction in UHV (blue).
Catalysts 04 00129 g003

2.3. Mn Surface Species

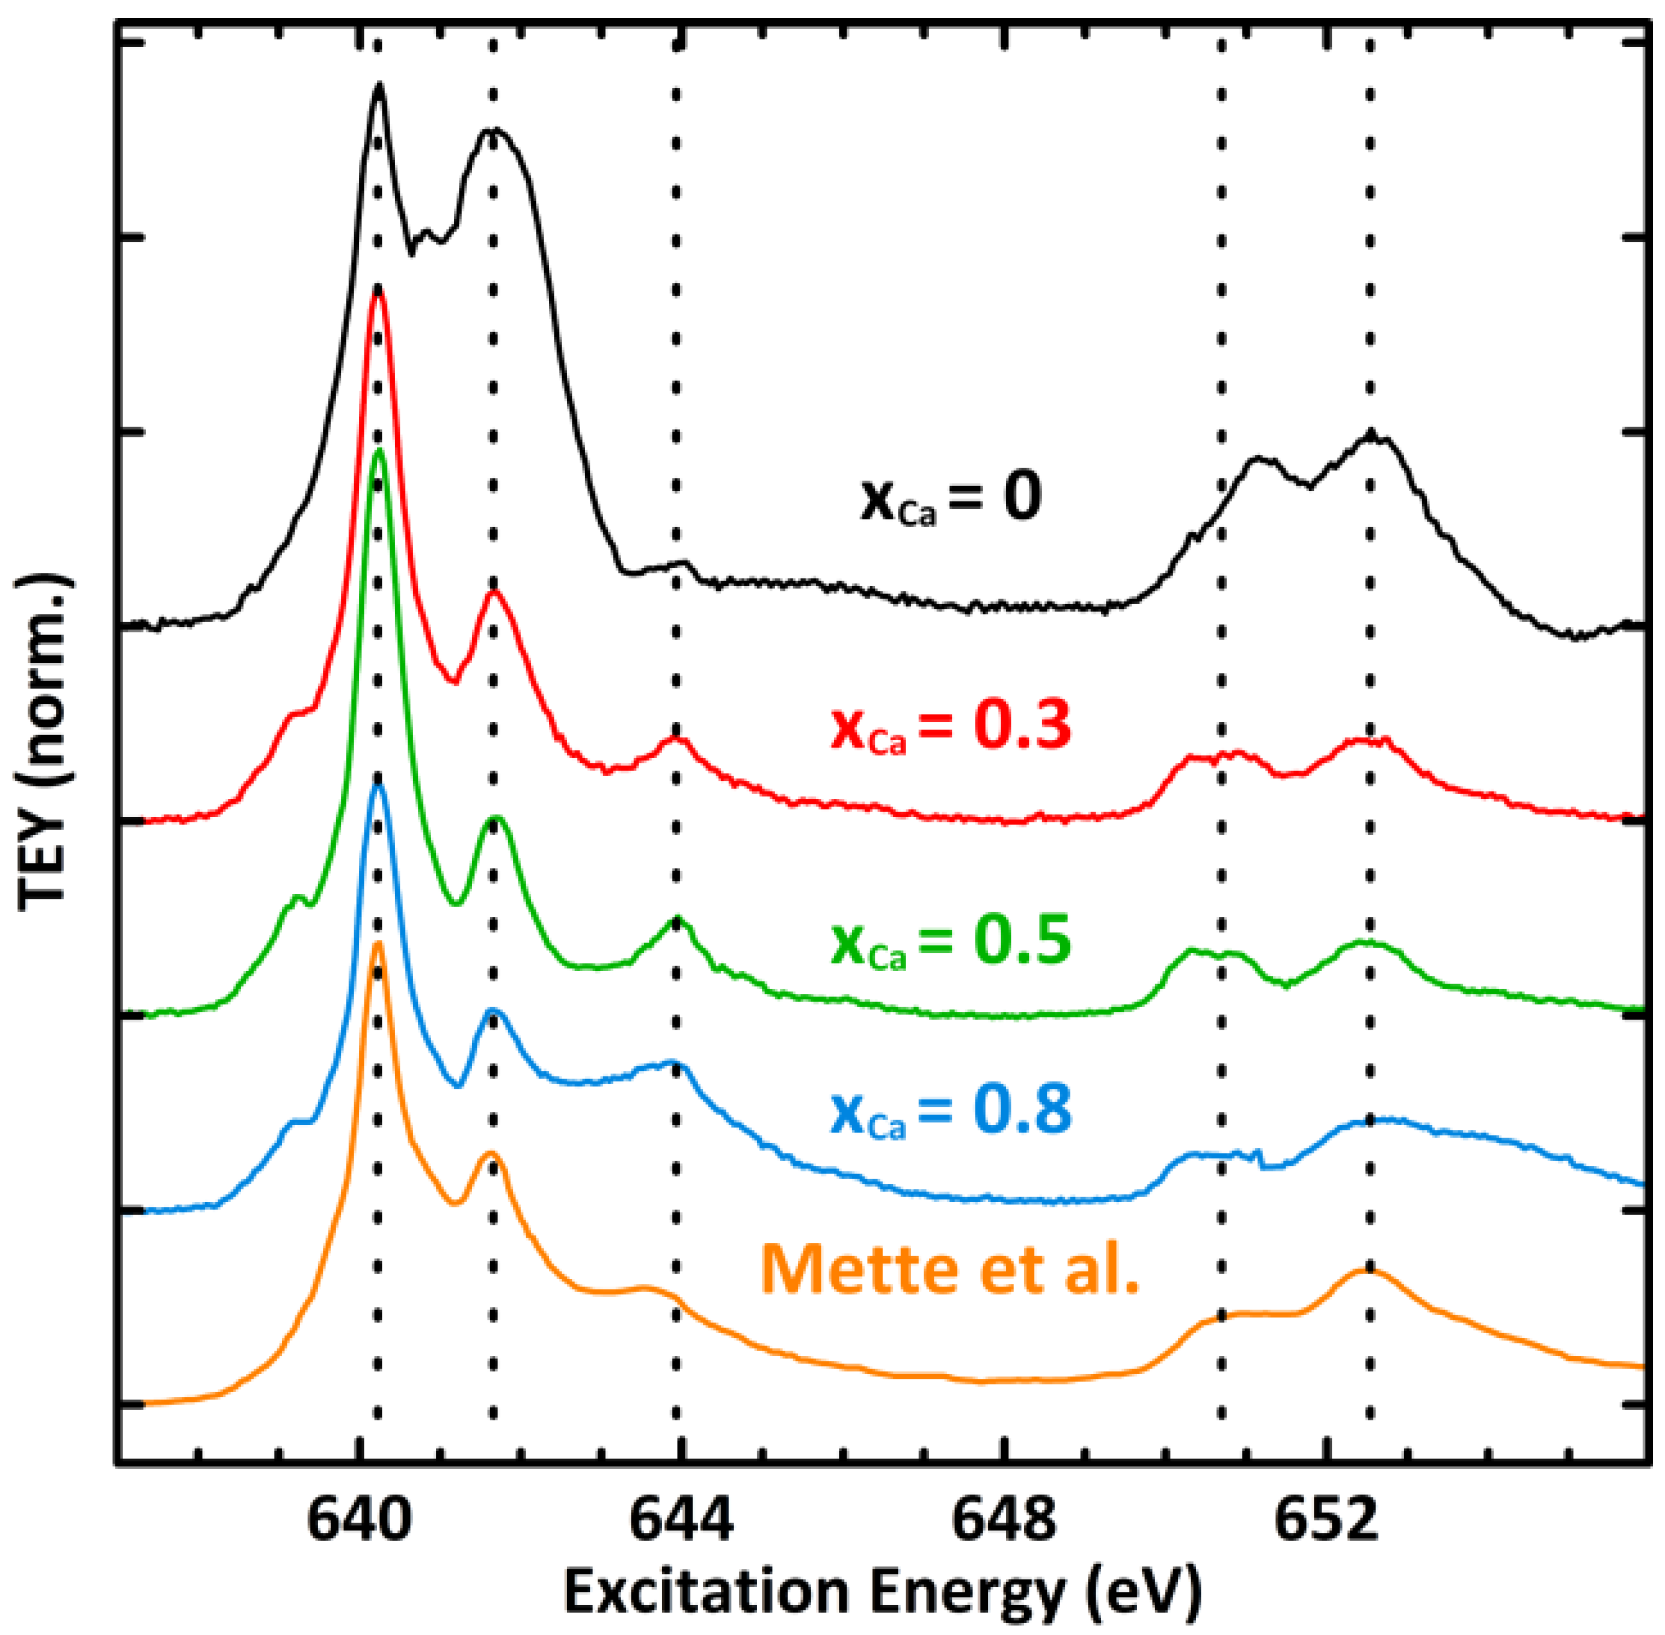
Except for a small additional feature at 639 eV, the difference spectra of the Mn L3 edge between virgin and activated state (filled green curves in Figure 2) correspond to a pure Mn2+ spectrum (Figure 4), showing good agreement with calculated spectra based on atomic multiplet theory in a cubic crystal field [8] as well as with spectra measured at Mn(II)Ox nanoparticles [21], commercial Mn(II)SO4[9], Mn(II)CO3[22,23], Mn(II)O [24], and complex Mn(II) compounds [25].
Figure 4. Difference spectra at Mn L-edge between in situ activated and virgin state compared with Mn2+ spectrum taken from Mette et al. [21].
Catalysts 04 00129 g004
The information depth of XANES TEY spectra is determined by the escape depth of the photoelectrons, which are composed of electrons of quite different energies, namely primary photoelectrons, Auger electrons and secondary electrons. Contributions of the different types of emitted electrons depend on the material, the photon energy and the electron energy dependent transmission function of the detector. Exact values are presently not known. According to a study by Frazer et al. [26] on the escape depth of electrons through a Cr layer (ZCr = 24 compares to the average Z = 21.5 of PrMnO3) we expect that 50% of the signal originates from the topmost 0.6 nm (O K-edge) and 0.7 nm (Mn L-edge) and 99.9% from the first 6 nm (O K-edge) and 7 nm (Mn L-edge), respectively.
The high reversibility after removing the water vapor by heating samples in oxygen and the nm range information depth of the TEY spectra suggest that the formation of Mn2+ species results from surface and/or subsurface O vacancy formation during oxygen evolution [23]. At first sight this fundamentally contradicts the expectations from a “frozen surface—No surface defects” picture, since the Mn valence should increase under the nominally oxidizing conditions with an applied sample bias of +2.5 V vs. the grounded chamber. Under such conditions, no overall reduction via pure vacancy formation should take place in the catalyst. Our observations thus indicate that surface oxygen vacancies are directly involved in the reaction mechanism during water oxidation. In such a scenario, the (sub)surface oxygen may represent an exchange site for oxygen based intermediates, which is affected by the state of neighboring Mn sites. Alternatively, a Mn valence decrease may be induced by surface adsorbates such as OH and OOH, which exhibit a lower formal valence compared to O2−. However, the integral L3 intensity increase due to Mn2+ formation of 8.5% to 13.9% is quite strong considering the information depth of the order of several nm. We therefore conclude that the changes are not mainly due to surface adsorbates, but rather to formation of surface-near oxygen vacancies. The corresponding redox process is visible in cyclic voltammetry as a reversible surface process centered at U0 ≈ +1 V vs. SHE (see experimental section). It can be interpreted according to:
Catalysts 04 00129 i001
Although the chemical equilibrium at reduced oxygen partial pressure is generally shifted towards oxygen vacancy formation, our finding that reoxidation by healing of vacancies can take place at a similar partial pressure (0.1 mbar O2) as their formation seems to exclude this effect as the main driving force. We rather assume that surface oxygen formation is a non-equilibrium property of the active catalyst during OER.
This assumption is supported by the observed doping dependence of the Mn2+ formation. Our in situ results show that the accordance of the differential spectra with the pure Mn2+ reference is best for intermediate doping of xCa = 0.3 and 0.5, while only minor deviations are observed for xCa = 0.8, namely an increased intensity around the 644 eV peak of the L3 edge and at the high energy tail of the L2 edge (Figure 4). Additionally, the changes of integral intensity (from 630 to 665 eV) due to Mn2+ formation are relatively small for xCa = 0.3 (+8.7%) and 0.5 (+8.5%) compared to the values at xCa = 0 (+13.9%) and 0.8 (+10.6%) (Figure 2). Finally, samples at xCa = 0.3 and 0.5 show a higher reversibility in UHV post reaction analysis. These findings thus indicate a higher (electro) chemical stability at intermediate xCa, which is in contrast to the monotonic decrease of the formation energy of manganite perovskites from the metal elements and O2 with increasing Ca-doping [2]. The hereby observed maximum stability at intermediate xCa is in good agreement with environmental transmission electron microscopy results comparing low/intermediate xCa to high Ca-doping [5], as well as stability analysis in the whole doping range by ex situ cyclic voltammetry (see supplementary information in [5]).
In contrast to oxygen evolution in water vapor, the pretreatment of the catalyst in liquid water may facilitate the formation of an A-cation deficient surface layer, i.e., the irreversible dissolution of Ca2+. Evidence for the irreversibility of the pretreatment is given by post reaction reoxidation in O2 atmosphere, which results in restoration of the pretreated instead of the virgin state (Figure 3b, blue curve). In addition to Ca2+ dissolution, formation of O vacancies and interstitial hydrogen can take place to some extent in the absence of external bias. Our data, thus, suggest that these processes overcompensate the effect of the oxidative Ca2+ dissolution. We cannot entirely exclude that also diffusion of vacancies or hydrogen into deeper subsurface regions during liquid water exposure contribute to the changes in the pretreated sample.

2.4. XPS

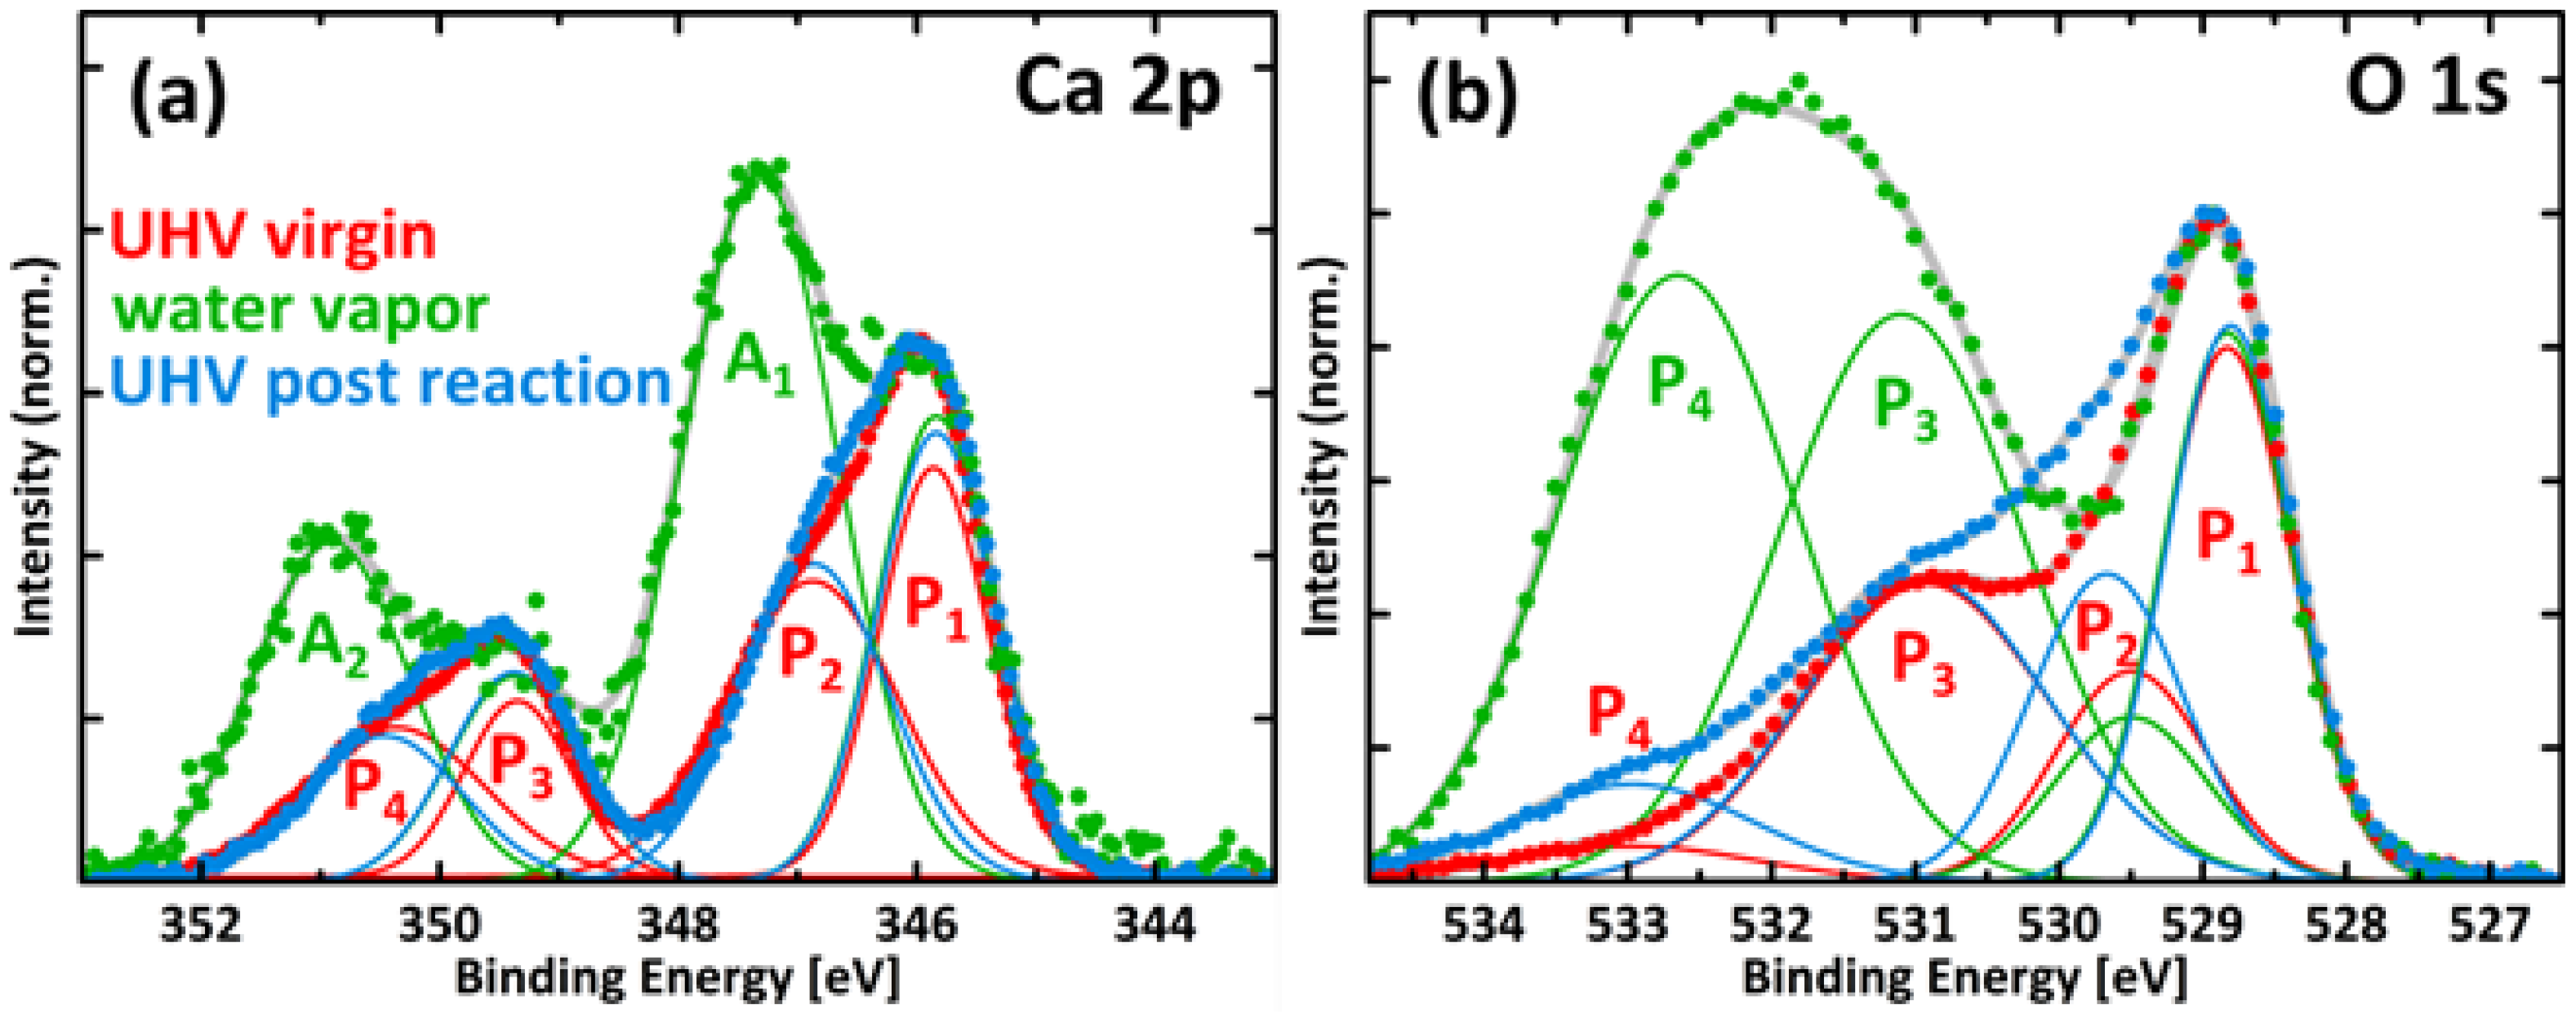
Due to in situ activation in water vapor intense additional peaks emerge in the X-ray photoelectron spectra of the Ca 2p3/2 and Ca 2p1/2 states respectively (347.5 and 351 eV), as well as of the O 1s states (532 eV) shown for the sample at xCa = 0.5 in Figure 5a and b. According to studies on La0.6Ca0.4CoO3[27,28], the changed structure of the Ca 2p spectra is consistent with the formation of surficial Ca(OH)2 and CaO species. The broad additional O 1s peak indicates the formation of various weakly bound O species on the surface including hydroxide adsorbates and point defects in the perovskite lattice. This has been found by studies on La1−xSrxMnO3[29], La0.6Ca0.4CoO3[27], La1−xCexMnO3[30], La1−xCaxMnO3[31], CaO/Ca(OH)2[32] and LaMO3 (M = Rh, Ni, Co, Fe, Mn, Cr) [33]. For a more detailed peak analysis see Appendix.
Figure 5. X-ray photoemission spectra of a PCMO film with xCa = 0.5. (a) Ca 2p states before (red) and during insertion of 0.1 mbar H2O with sample bias of +2.5 V against chamber ground (green), as well as in UHV after reoxidation in 0.1 mbar O2 (blue); (b) O 1s states; (c) Depth profiling of Ca 2p states in active catalyst, ranging from 1 nm (Eexc = 568 eV) to 1.5 nm (Eexc = 1168 eV); (d) Depth profiling of O 1s states with the same information depths.
Catalysts 04 00129 g005
The spectra presented in Figure 5a,b have been recorded at photon energies of 568 and 750 eV respectively, resulting in kinetic energies of the photoelectrons of about 220 eV. This corresponds to an information depth of roughly 1 nm [34]. To investigate the nature of the additional Ca and O species due to in situ activation the excitation energies were increased by 300 and 600 eV. Increasing the kinetic energy of the photoelectrons to 820 eV results in an information depth of about 1.5 nm. The decreasing intensity of the active species with increasing photon energy (Figure 5c,d), thus, indicates near surface changes.

3. Experimental Section

3.1. Sample Preparation and Characterization

Pr1−xCaxMnO3 (PCMO) thin films at doping levels of xCa = 0, 0.3, 0.5 and 0.8 have been deposited by reactive ion beam sputtering from stoichiometric targets. The Xe working gas partial pressure amounted to 1 × 10⁻⁴ mbar and the O2 partial pressure was 1.4 × 10⁻⁴ mbar. The films have a thickness of about 300 nm and have been deposited on 200 nm Pt layers, which provide the electric back contact. These Pt films have previously been deposited on commercial MgO (001) single crystal substrates.
Figure 6. XRD scans in θ–2θ geometry. The intense substrate peaks correspond to Pt (111) and MgO (001). PrMnO3 (black) exhibits a (001)/(110) twin structure, while samples with xCa = 0.3 (red) and 0.5 (green), as well as the two samples with xCa = 0.8 (blue and cyan) show a (100)/(010)/(112) texture.
Catalysts 04 00129 g006
The films have been characterized by means of X-ray diffraction (XRD) in θ–2θ geometry using an X'Pert MRD diffractometer (Philips B.V., Almelo, Netherlands) with Co Kα radiation from a tube operated at 40 kV and 30 mA. Figure 6 summarizes the XRD results of the five investigated samples. Note that the spectra of two different samples at xCa = 0.8 are shown in Figure 6; the sample shown in cyan was used for pretreatment in liquid water. The two intense peaks at 46.5° and 50.3° can be attributed to the Pt (111) layer and the MgO (001) substrate respectively. The PrMnO3 film (black curve) shows a (001) orientation with (110) twins, represented by the broadened peak at 54.2°. The Ca-doped samples (colored curves) exhibit two peaks at 38.2°–39.4° and 81.8°–84.7° respectively, revealing a texture containing (100), (010), and (112) orientations, which cannot be further distinguished due to overlap of the (200), (020) and (112) peaks. The systematic shift of these two peaks to higher angles with increasing xCa represents the reduction in lattice parameter due to different octahedral tilts and Mn–O bonding length [35]. For the sample with xCa = 0.5 (green curve) (001) misorientations (<33 vol-%) are observed, represented by the (004) peak at 55.7°. Additional small peaks from 53° to 56° result from artifacts due to other X-ray wavelengths.
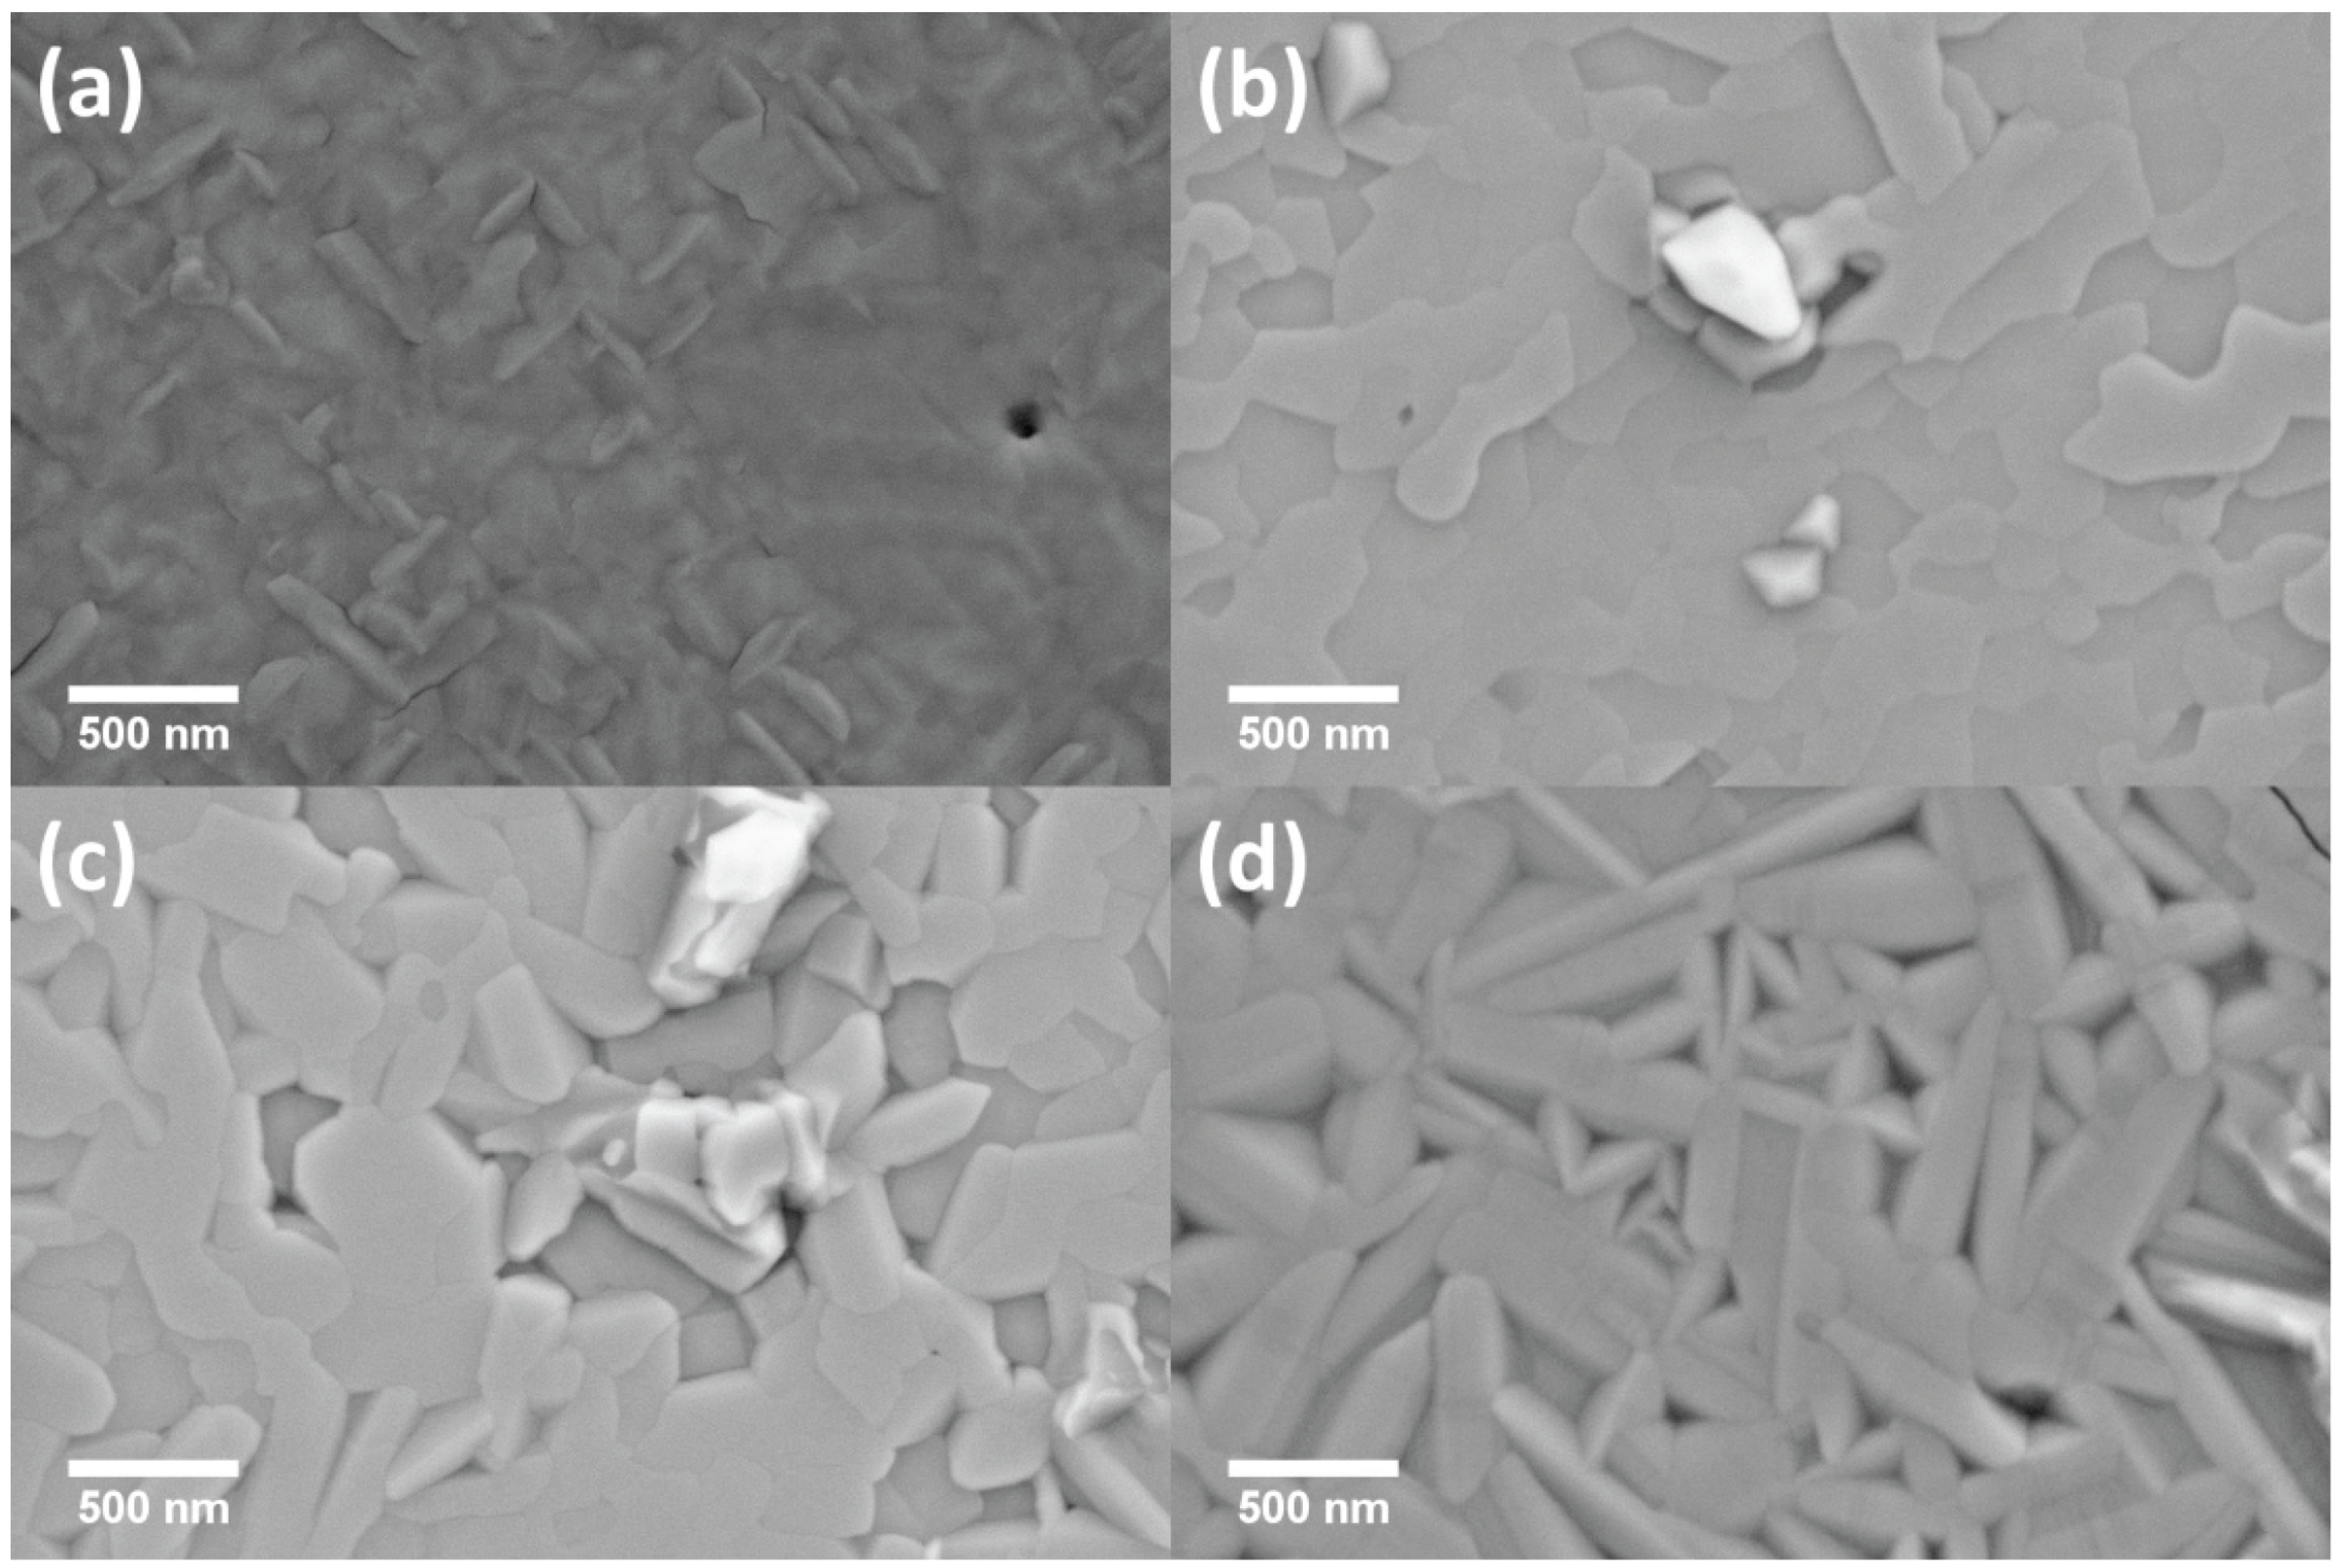
The surface morphology has been investigated by scanning electron microscopy (SEM) using a LEO Supra 35 (Carl Zeiss NTS GmbH, Oberkochen, Germany). A representative SEM image for each doping level xCa is shown in Figure 7, revealing compact films. The sample with xCa = 0 exhibits a rod-like surface morphology due to the (110) twins (Figure 7a), while the samples with xCa = 0.3 and 0.5 show a plate-like morphology (Figure 7b,c) which most probably corresponds to the [100]/[010] orientations. The sample with xCa = 0.8 shows a morphology of higher complexity which may indicate a non-unique in-plane epitaxy (Figure 7d). Additionally, it is revealed that the sample surfaces with xCa = 0.3 and 0.5 contain MnOx precipitates, which however cover only <2% of the surface.
Figure 7. SEM images of samples with xCa = 0 (a), 0.3 (b), 0.5 (c), and 0.8 (d) after XANES/XPS investigation. Shown is the secondary electron contrast.
Catalysts 04 00129 g007
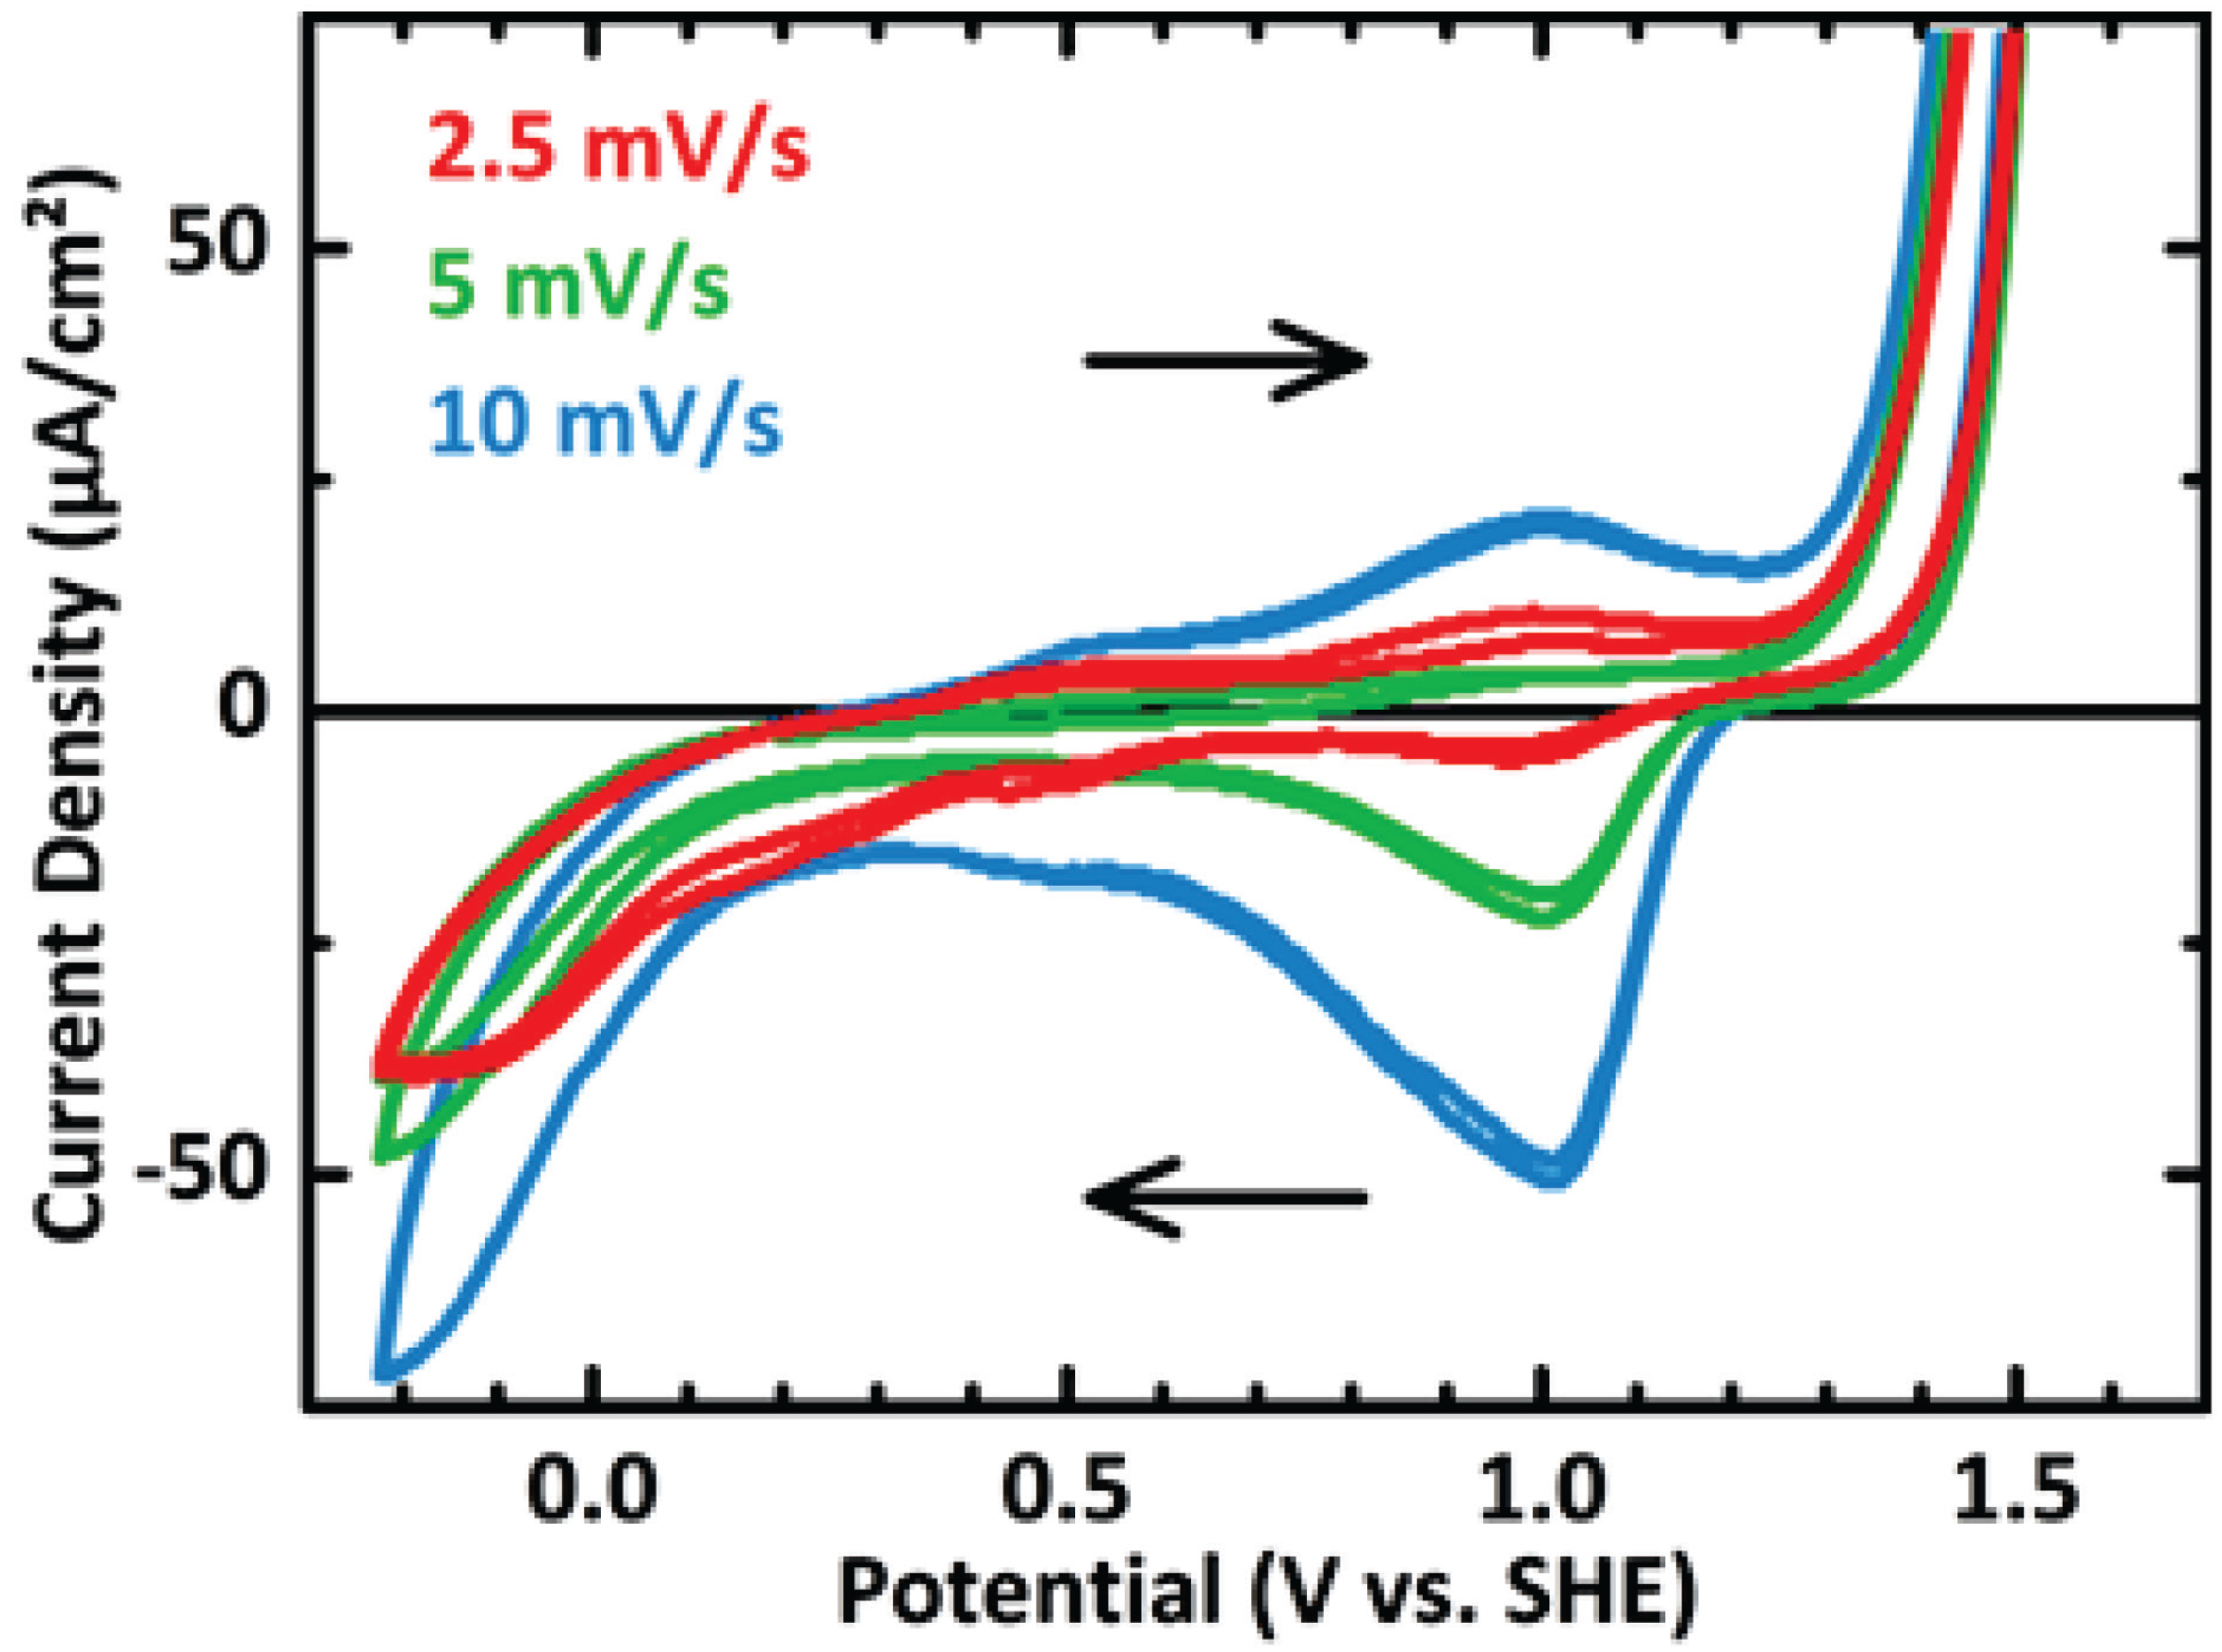
The catalytic activity for oxygen evolution from water splitting has been investigated at comparable samples with xCa = 0.3 by cyclic voltammetry (CV). Figure 8 shows CV curves measured at a PCMO thin film at sweep rates of 2.5, 5, and 10 mV/s. A Pt counter electrode and commercial Ag/AgCl reference electrode have been used in aqueous 0.1 m Na2SO4 (pH 7). In addition to oxygen evolution above +1.2 V vs. SHE a reversible surface redox process is observed, which is centered at E0 ≈ +1 V vs. SHE. A more detailed CV investigation of different PCMO stoichiometries has been published elsewhere [5], where this process has been interpreted as oxygen vacancy formation according to Equation (1). No changes in surface morphology have been observed by post reaction SEM investigation.
Figure 8. CV curves of a PCMO sample with xCa = 0.3 showing oxygen evolution above +1.2 V vs. SHE and a reversible redox process centered at +1.0 V vs. SHE (pH 7).
Catalysts 04 00129 g008

3.2. In Situ XANES/XPS Measurements

X-ray absorption near edge spectroscopy (XANES) as well as X-ray photo-emission spectroscopy (XPS) of various edges and states has been performed at the BESSY II synchrotron facility of the Helmholtz-Zentrum Berlin, Germany (HZB), using the near ambient-pressure XPS endstation of the Fritz-Haber-Institut of the Max-Planck-Gesellschaft (FHI-MPG) at the ISISS beamline. The instrumental setup by Knop-Gericke and co-workers is described in detail elsewhere [36].
For XANES at the Mn L-edge the excitation energy was swept from 630 to 665 eV, while the O K-edge was measured from 520 to 565 eV. The scan rate was 0.5 eV/s in continuous driving mode of the plane-grating monochromator. The fixed-focus constant was set to cff = 2.25 and the exit slit to 60 µm [37]. The presented spectra have been measured in total electron yield mode (TEY). Energy shifts have been corrected on the basis of the simultaneously measured characteristic absorption spectrum of a focusing mirror. Intensities have been normalized with respect to impinging photon flux. A linear background was subtracted and the spectra were intensity normalized to unity at 664 eV for the Mn L-edge and at 558 eV for the O K-edge to account for the increased signal in water vapor due to inelastic scattering of photoelectrons with gas molecules.
For collecting the photoemission spectra the monochromator was set to cff = 2.25 with an exit slit of 111 µm. Emission from the Ca 2p states has been recorded at an excitation energy of 568 eV, while emission from the O 1s states has been recorded at an excitation energy of 750 eV. For depth profiling each of the excitation energies was increased by 300 and 600 eV respectively. The step size was 50 meV for Ca 2p and 100 meV for O 1s spectra. All spectra were collected using a pass energy of 20 eV and a dwell time of 100 ms. Spectra have been intensity normalized with respect to impinging photon flux. A linear as well as a Shirley-type background were subtracted [38]. To account for loss of total signal intensity during water vapor exposure compared to UHV measurements due to inelastic scattering of photoelectrons at gas molecules, the spectra were then normalized with respect to the intensity of the bulk-like peaks of the Ca 2p3/2 states at 346 eV or the O 1s states at 529 eV respectively. These bulk-like peaks have also been used for energy alignment, e.g., for subtraction of sample bias.
Experiments have been conducted in ultra-high vacuum (UHV) and in 0.1 mbar H2O vapor with an applied sample bias of +2.5 V between the sample back contact and the chamber (ground). All measurements have been performed at room temperature. Before returning to UHV conditions the samples were heated to approximately 120 °C for 10 min and cooled for another 10 min in 0.1 mbar O2 to remove accumulated surface carbon and to reestablish a fully oxygenized sample surface.

4. Conclusions

Pr1−xCaxMnO3 thin films in the doping range between xCa = 0 and 0.8 have been studied with respect to electro-catalytic oxygen evolution. It is found that the doping dependent Mn valence cannot be described by a mixture of Mn3+ and Mn4+ species but rather by an intermediate Mn(3+x)+ state. This finding corroborates the picture of covalent-like contributions to the charge distribution in the antibonding Mn 3d eg–O 2p states, which are relevant for electron transfer from oxygen-based species to Mn sites during water oxidation. In situ studies under nominally oxidizing conditions for oxygen evolution reveal the coexistence of a Mn2+ surface species with the bulk Mn valence state. It is shown that the surface activation involves the reversible formation of surface oxygen vacancies. The observed changes are fully reversible with respect to annealing in O2 atmosphere at 120 °C.
We conclude that the Mn valence shift is mainly due to surface oxygen vacancy formation, which are formed by the reaction steps during water oxidation despite of the nominally oxidizing conditions. We propose that such oxygen vacancies are part of the active catalyst structure and are involved as a docking site for water molecules and reaction intermediates.
Since the occupation of antibonding eg states is changed in operation, the application of a rigid molecular orbital filling model to describe catalytic activity as a function of bulk bonding strength seems to be very limited. The bulk occupation of these states, which can be controlled by heterovalent doping, can be strongly modified at the activated surface.

Acknowledgments

The Helmholtz-Zentrum Berlin (HZB) is acknowledged for the allocation of synchrotron measurement time. We are grateful to Helge Stein who supported the XANES and XPS measurements. Financial support by the Deutsche Forschungsgemeinschaft through the CRC 1073 project C02 is gratefully acknowledged. We thank Robert Schlögl for fruitful discussions.

Conflicts of Interest

The authors declare no conflict of interest.

Appendix

A1. Linear Superposition of Experimental Mn L-Edges

To deal with the question whether the average Mn valence is comprised of a mixture of Mn3+ and Mn4+ species or formed by an intermediate valence state of Mn(3+x)+, we compared stoichiometric linear superposition of Mn L-edges at high and low xCa to measured spectra at intermediate xCa. As shown in Figure A1, the stoichiometric superpositions (blue curves) show significant systematic deviations from the corresponding measurements. Variations can be compared by the difference spectra which are shown as filled blue curves. They exhibit a minimum at 640.2 eV as well as two maxima at 641.0 and 642.0 eV respectively. According to Kanamori et al. [12] the bad compliance indicates an intermediate valence state instead of coexisting species. This result indicates significant covalent contributions to the Mn-O bond, i.e., a charge density distribution at the upper valence band edge which is more or less centered at the Mn–O bond instead of forming Mn3+/Mn4+ species.
Figure A1. Comparison of linear superpostition of Mn L-edges at high and low xCa to spectra at intermediate xCa. The superpositions (blue) are assembled according to the expected nominal concentrations of the Mn3+ and Mn4+ species as indicated by the formulas in blue color.
Catalysts 04 00129 g009

A2. Intensity Ratio of the Mn L3,2-Edges
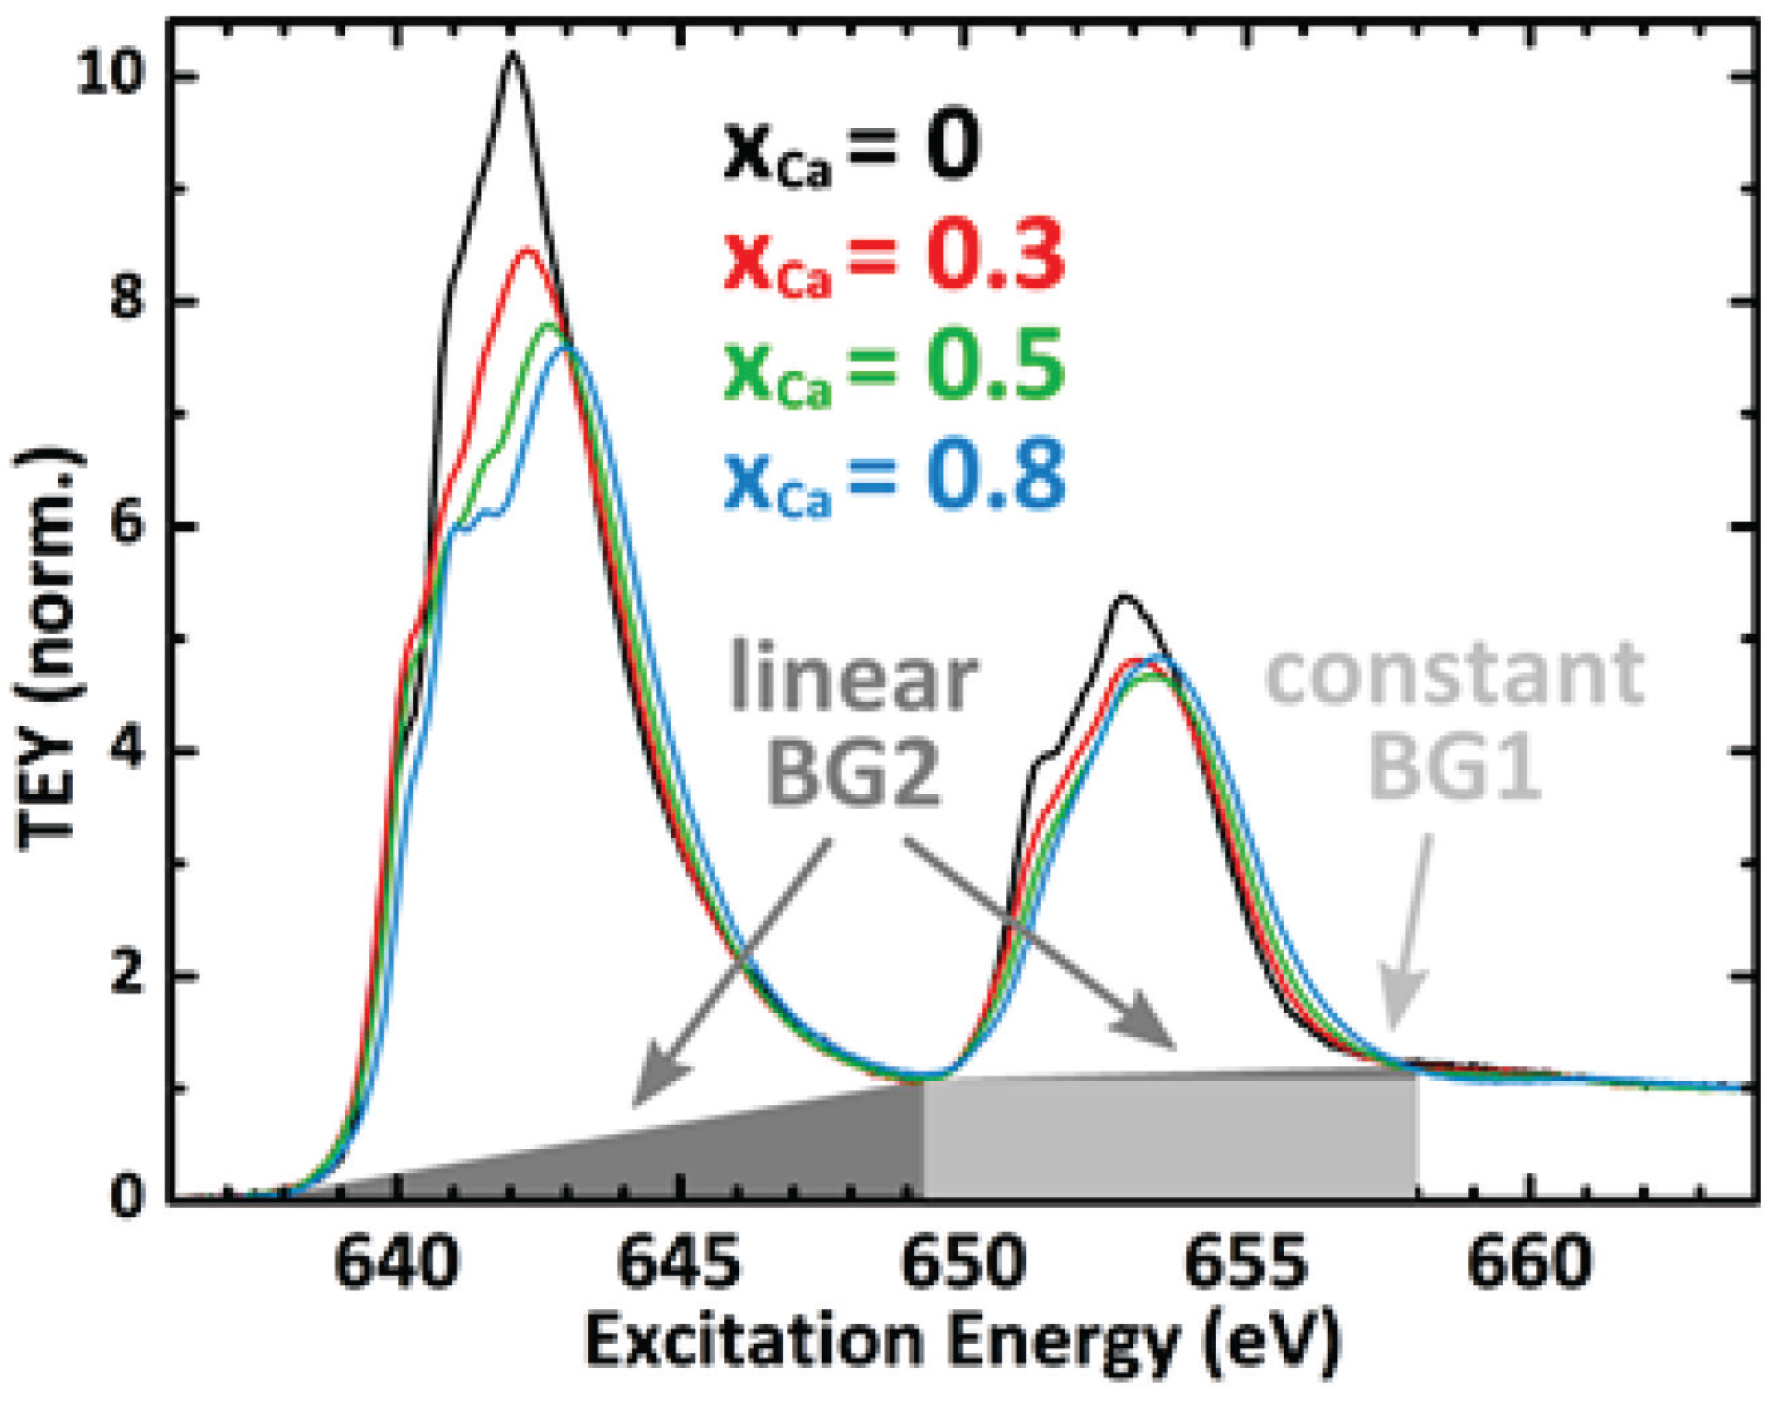
For Electron Energy Loss Spectroscopy (EELS) in transmission electron microscopy (TEM) of white lines like the Mn L-edge a Hartree-Slater-type background model has been established [15]. Since the physical processes in TEY-XANES experiments are quite different, we used a constant as well as a linear background model for quantification of the integral Mn L3,2 edge intensities of the virgin samples. The backgrounds are illustrated in Figure A2. A constant L2 background (BG1) was used from 649.3 to 658.0 eV, while two linear backgrounds (BG2) were used from 637.3 to 649.3 eV and from 649.3 to 658.0 eV respectively.
Figure A2. Simple background models used for quantification of Mn L3,2 intensities.
Catalysts 04 00129 g010

A3. XPS

Spin-orbit interaction splits the Ca 2p states into 2p1/2 and 2p3/2 substates at binding energies of roughly 350 and 346 eV respectively. The structure of the virgin perovskite lattice at xCa = 0.5 shown in Figure A3a reveals further splitting into a total of four peaks labeled P1 and P2 for the 2p3/2 as well as P3 and P4 for the 2p1/2 states. P2 and P4 represent surface sites exhibiting less chemical shift compared to the P1 and P3 subsurface sites. Upon in situ activation in 0.1 mbar water vapor at a sample bias of +2.5 V against the grounded chamber our data show the emergence of a second Ca species represented by the peaks labeled A1 and A2. According to studies on La0.6Ca0.4CoO3 [27,28] this could correspond to formation of surficial Ca(OH)2 and CaO. Reoxidation in 0.1 mbar O2 fully restores the virgin state of the surface (blue curves in Figure A3a).
The four peaks of the O 1s states are shown in Figure A3b. The O2− species of the perovskite lattice is represented by peak P1 (subsurface) and P2 (surface). P3 corresponds to various weakly bound Oand OH surface species, while P4 represents adsorbed H2O molecules. Upon in situ activation P3 and P4 increase significantly. Reoxidation of the sample leaves a slightly increased intensity of P2 and P4 compared to the virgin surface.
Figure A3. Peak analysis of XPS data before (red) and during insertion of 0.1 mbar H2O with sample bias of +2.5 V against grounded chamber (green), as well as in UHV after reoxidation in 0.1 mbar O2 (blue). (a) Ca 2p states; (b) O 1s states.
Catalysts 04 00129 g011

References

  1. Armstrong, F.A. Why did nature choose manganese to make oxygen? Philos. T. Roy. Soc. B 2008, 363, 1263–1270. [Google Scholar] [CrossRef]
  2. Calle-Vallejo, F.; Martínez, J.I.; García-Lastra, J.M.; Mogensen, M.; Rossmeisl, J. Trends in Stability of Perovskite Oxides. Angew. Chem. Int. Ed. 2010, 49, 7699–7701. [Google Scholar]
  3. Man, I.C.; Su, H.-Y.; Calle-Vallejo, F.; Hansen, H.A.; Martínez, J.I.; Inoglu, N.G.; Kitchin, J.; Jaramillo, T.F.; Nørskov, J.K.; Rossmeisl, J. Universality in Oxygen Evolution Electrocatalysis on Oxide Surfaces. ChemCatChem 2011, 3, 1159–1165. [Google Scholar] [CrossRef]
  4. Suntivich, J.; May, K.J.; Gasteiger, H.A.; Goodenough, J.B.; Shao-Horn, Y. A Perovskite Oxide Optimized for Oxygen Evolution Catalysis from Molecular Orbital Principles. Science 2011, 334, 1383–1385. [Google Scholar] [CrossRef]
  5. Raabe, S.; Mierwaldt, D.; Ciston, J.; Uijttewaal, M.; Stein, H.; Hoffmann, J.; Zhu, Y.; Blöchl, P.; Jooss, C. In Situ Electrochemical Electron Microscopy Study of Oxygen Evolution Activity of Doped Manganite Perovskites. Adv. Funct. Mater. 2012, 22, 3378–3388. [Google Scholar]
  6. Raveau, B. The crucial role of mixed valence in the magnetoresistance properties of manganites and cobaltites. Philos. T. Roy. Soc. A 2008, 366, 83–92. [Google Scholar] [CrossRef]
  7. Grenier, S.; Hill, J.P.; Gibbs, D.; Thomas, K.J.; von Zimmermann, M.; Nelson, C.S.; Kiryukhin, V.; Tokura, Y.; Tomioka, Y.; Casa, D.; et al. Resonant X-ray diffraction of the magnetoresistant perovskite Pr0.6Ca0.4MnO3. Phys. Rev. B 2004, 69, 134419. [Google Scholar] [CrossRef]
  8. De Groot, F.M.F.; Fuggle, J.C.; Thole, B.T.; Sawatzky, G.A. 2p X-ray absorption of 3d transition-metal compounds: An atomic multiplet description including the crystal field. Phys. Rev. B 1990, 42, 5459–5468. [Google Scholar]
  9. Grush, M.M.; Chen, J.; Stemmler, T.L.; George, S.J.; Ralston, C.Y.; Stibrany, R.T.; Gelasco, A.; Christou, G.; Gorun, S.M.; Penner-Hahn, J.E.; et al. Manganese L-Edge X-ray Absorption Spectroscopy of Manganese Catalase from Lactobacillus plantarum and Mixed Valence Manganese Complexes. J. Am. Chem. Soc. 1996, 118, 65–69. [Google Scholar] [CrossRef]
  10. Imada, S.; Suga, S.; Muro, T.; Ueda, S.; Jung, R.-J.; Kotsugi, M.; Saitoh, Y.; Matsushita, T.; Kuwahara, H.; Moritomo, H.; et al. Local magnetic states in La1−xSrxMnO3 and Nd1−xSrxMnO3. Physica B 2000, 281–282, 498–499. [Google Scholar]
  11. Subías, G.; García, J.; Sánchez, M.C.; Blasco, J.; Proietti, M.G. Soft X-Ray Absorption Spectroscopy (Mn L2,3 and O K) in Mixed Valence Manganites. Surf. Rev. Let. 2002, 9, 1071–1078. [Google Scholar] [CrossRef]
  12. Kanamori, H.; Yoshioka, T.; Hirose, K.; Yamamoto, T. Determination of valence state of Mn ions in Pr1−xAxMnO3−δ (A = Ca, Sr) by Mn-L3 X-ray absorption near-edge structure analysis. J. Electron. Spectrosc. 2012, 185, 129–132. [Google Scholar] [CrossRef]
  13. Abbate, M.; de Groot, F.M.F.; Fuggle, J.C.; Fujimori, A.; Strebel, O.; Lopez, F.; Domke, M.; Kaindl, G.; Sawatzky, G.A.; Takano, M.; et al. Controlled-valence properties of La1−xSrxFeO3 and La1−xSrxMnO3 studied by soft-X-ray absorption spectroscopy. Phys. Rev. B 1992, 46, 4511–4519. [Google Scholar] [CrossRef]
  14. Liu, R.S.; Wu, J.B.; Chang, C.Y.; Lin, J.G.; Huang, C.Y.; Chen, J.M.; Liu, R.G. Determination of Mn Valence from X-Ray Absorption Near Edge Structure and Study of Magnetic Behavior in Hole-Doped (Nd1−xCax)MnO3 System. J. Solid State Chem. 1996, 125, 112–115. [Google Scholar] [CrossRef]
  15. Schmid, H.K.; Mader, W. Oxidation states of Mn and Fe in various compound oxide systems. Micron 2006, 37, 426–432. [Google Scholar] [CrossRef]
  16. Riedl, T.; Gemming, T.; Gruner, W.; Acker, J.; Wetzig, K. Determination of manganese valency in La1−xSrxMnO3 using ELNES in the (S)TEM. Micron 2007, 38, 224–230. [Google Scholar] [CrossRef]
  17. De Groot, F.M.F.; Grioni, M.; Fuggle, J.C.; Ghijsen, J.; Sawatzky, G.A.; Petersen, H. Oxygen 1s X-ray-absorption edges of transition-metal oxides. Phys. Rev. B 1989, 40, 5715–5723. [Google Scholar] [CrossRef]
  18. Saucke, G.; Norpoth, J.; Jooss, C.; Su, D.; Zhu, Y. Polaron absorption for photovoltaic energy conversion in a manganite-titanate pn heterojunction. Phys. Rev. B 2012, 85, 165315. [Google Scholar] [CrossRef]
  19. Blöchl, P.; Institute for Theoretical Physics, Clausthal, Germany; Norpoth, J.; Institut für Materialphysik, Göttingen, Germany; Jooss, C.; Institut für Materialphysik, Göttingen, Germany. First-Principles Study of Pr1−xCaxMnO3 with a Local Hybrid Functional. the authors' affiliation, unpublished work. 2014. [Google Scholar]
  20. Jung, J.H.; Kim, K.H.; Eom, D.J.; Noh, T.W.; Choi, E.J.; Yu, J.; Kwon, Y.S.; Chung, Y. Determination of electronic band structures of CaMnO3 and LaMnO3 using optical-conductivity analyses. Phys. Rev. B 1997, 55, 15489–15493. [Google Scholar]
  21. Mette, K.; Bergmann, A.; Tessonnier, J.-P.; Hävecker, M.; Yao, L.; Ressler, T.; Schlögl, R.; Strasser, P.; Behrens, M. Nanostructured Manganese Oxide Supported on Carbon Nanotubes for Electrocatalytic Water Splitting. ChemCatChem 2012, 4, 851–862. [Google Scholar] [CrossRef]
  22. Cressey, G.; Henderson, C.M.B.; Laan, G. Use of L-edge X-ray absorption spectroscopy to characterize multiple valence states of 3d transition metals; a new probe for mineralogical and geochemical research. Phys. Chem. Miner. 1993, 20, 111–119. [Google Scholar]
  23. Alonso, J.M.; Cortés-Gil, R.; Ruiz-González, L.; González-Calbet, J.M.; Hernando, A.; Vallet-Regí, M.; Dávila, M.E.; Asensio, M.C. Influence of the Synthetic Pathway on the Properties of Oxygen-Deficient Manganese-Related Perovskites. Eur. J. Inorg. Chem. 2007, 2007, 3350–3355. [Google Scholar]
  24. Gilbert, B.; Frazer, B.H.; Belz, A.; Conrad, P.G.; Nealson, K.H.; Haskel, D.; Lang, J.C.; Srajer, G.; de Stasio, G. Multiple Scattering Calculations of Bonding and X-ray Absorption Spectroscopy of Manganese Oxides. J. Phys. Chem. A 2003, 107, 2839–2847. [Google Scholar] [CrossRef]
  25. Cramer, S.P.; de Groot, F.M.F.; Ma, Y.; Chen, C.T.; Sette, F.; Kipke, C.A.; Eichhorn, D.M.; Chan, M.K.; Armstrong, W.H. Ligand field strengths and oxidation states from manganese L-edge spectroscopy. J. Am. Chem. Soc. 1991, 113, 7937–7940. [Google Scholar] [CrossRef]
  26. Frazer, B.H.; Gilbert, B.; Sonderegger, B.R.; de Stasio, G. The probing depth of total electron yield in the sub-keV range: TEY-XAS and X-PEEM. Surf. Sci. 2003, 537, 161–167. [Google Scholar] [CrossRef]
  27. Montenegro, M.J.; Lippert, T.; Müller, S.; Weidenkaff, A.; Willmott, P.R.; Wokaun, A. Pulsed laser deposition of electrochemically active perovskite films. Appl. Surf. Sci. 2002, 197–198, 505–511. [Google Scholar]
  28. Montenegro, M.J.; Döbeli, M.; Lippert, T.; Müller, S.; Schnyder, B.; Weidenkaff, A.; Willmott, P.R.; Wokaun, A. Pulsed laser deposition of La0.6Ca0.4CoO3 (LCCO) films. A promising metal-oxide catalyst for air based batteries. Phys. Chem. Chem. Phys. 2002, 4, 2799–2805. [Google Scholar] [CrossRef]
  29. Niu, J.; Deng, J.; Liu, W.; Zhang, L.; Wang, G.; Dai, H.; He, H.; Zi, X. Nanosized perovskite-type oxides La1−xSrxMO3−δ (M = Co, Mn; x = 0, 0.4) for the catalytic removal of ethylacetate. Catal. Today 2007, 126, 420–429. [Google Scholar] [CrossRef]
  30. Zhang-Steenwinkel, Y.; Beckers, J.; Bliek, A. Surface properties and catalytic performance in CO oxidation of cerium substituted lanthanum-manganese oxides. Appl. Catal. A 2002, 235, 79–92. [Google Scholar] [CrossRef]
  31. Choi, J.; Zhang, J.; Liou, S.-H.; Dowben, P.A.; Plummer, E.W. Surfaces of the perovskite manganites La1−xCaxMnO3. Phys. Rev. B 1999, 59, 13453–13459. [Google Scholar] [CrossRef]
  32. Dupin, J.-C.; Gonbeau, D.; Vinatier, P.; Levasseur, A. Systematic XPS studies of metal oxides, hydroxides and peroxides. Phys. Chem. Chem. Phys. 2000, 2, 1319–1324. [Google Scholar] [CrossRef]
  33. Fierro, J.L.G.; Tejuca, L.G. Non-stoichiometric surface behaviour of LaMO3 oxides as evidenced by XPS. Appl. Surf. Sci. 1987, 27, 453–457. [Google Scholar] [CrossRef]
  34. Somorjai, G.A.; Li, Y. Introduction to Surface Chemistry and Catalysis; Wiley: New York, NY, USA, 1994; p. 383. [Google Scholar]
  35. Jirák, Z.; Krupička, S.; Šimša, Z.; Dlouhá, M.; Vratislav, S. Neutron diffraction study of Pr1−xCaxMnO3 perovskites. J. Magn. Magn. Mater. 1985, 53, 153–166. [Google Scholar] [CrossRef]
  36. Knop-Gericke, A.; Kleimenov, E.; Hävecker, M.; Blume, R.; Teschner, D.; Zafeiratos, S.; Schlögl, R.; Bukhtiyarov, V.I.; Kaichev, V.V.; Prosvirin, I.P.; et al. Chapter 4 X-ray Photoelectron Spectroscopy for Investigation of Heterogeneous Catalytic Processes. Adv. Catal. 2009, 52, 213–272. [Google Scholar] [CrossRef]
  37. Follath, R.; Senf, F.; Gudat, W. Plane-grating monochromator at BESSY II using collimated light. J. Synchrotron Rad. 1998, 5, 769–771. [Google Scholar] [CrossRef]
  38. Shirley, D.A. High-Resolution X-ray Photoemission Spectrum of the Valence Bands of Gold. Phys. Rev. B 1972, 5, 4709–4714. [Google Scholar] [CrossRef]