Co-Fe-Si Aerogel Catalytic Honeycombs for Low Temperature Ethanol Steam Reforming


Abstract
:1. Introduction


2. Results and Discussion
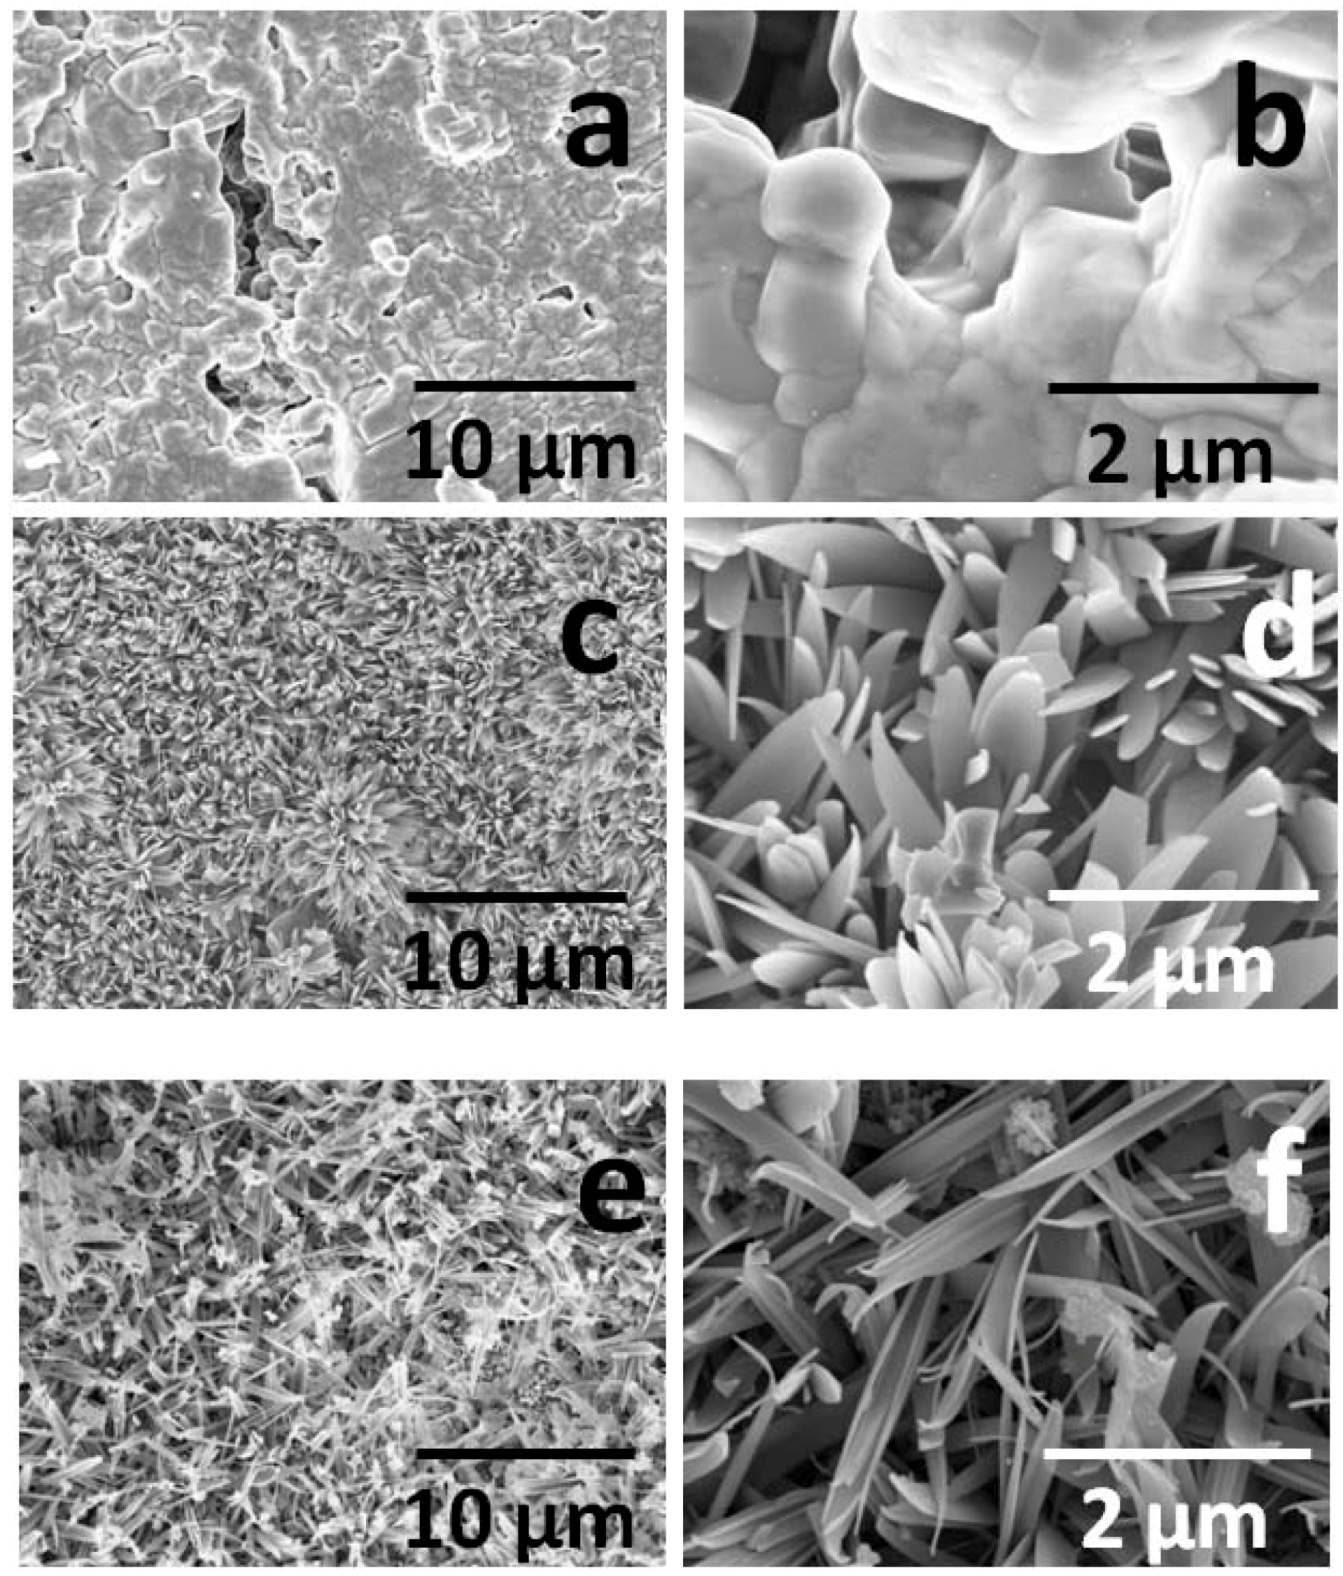
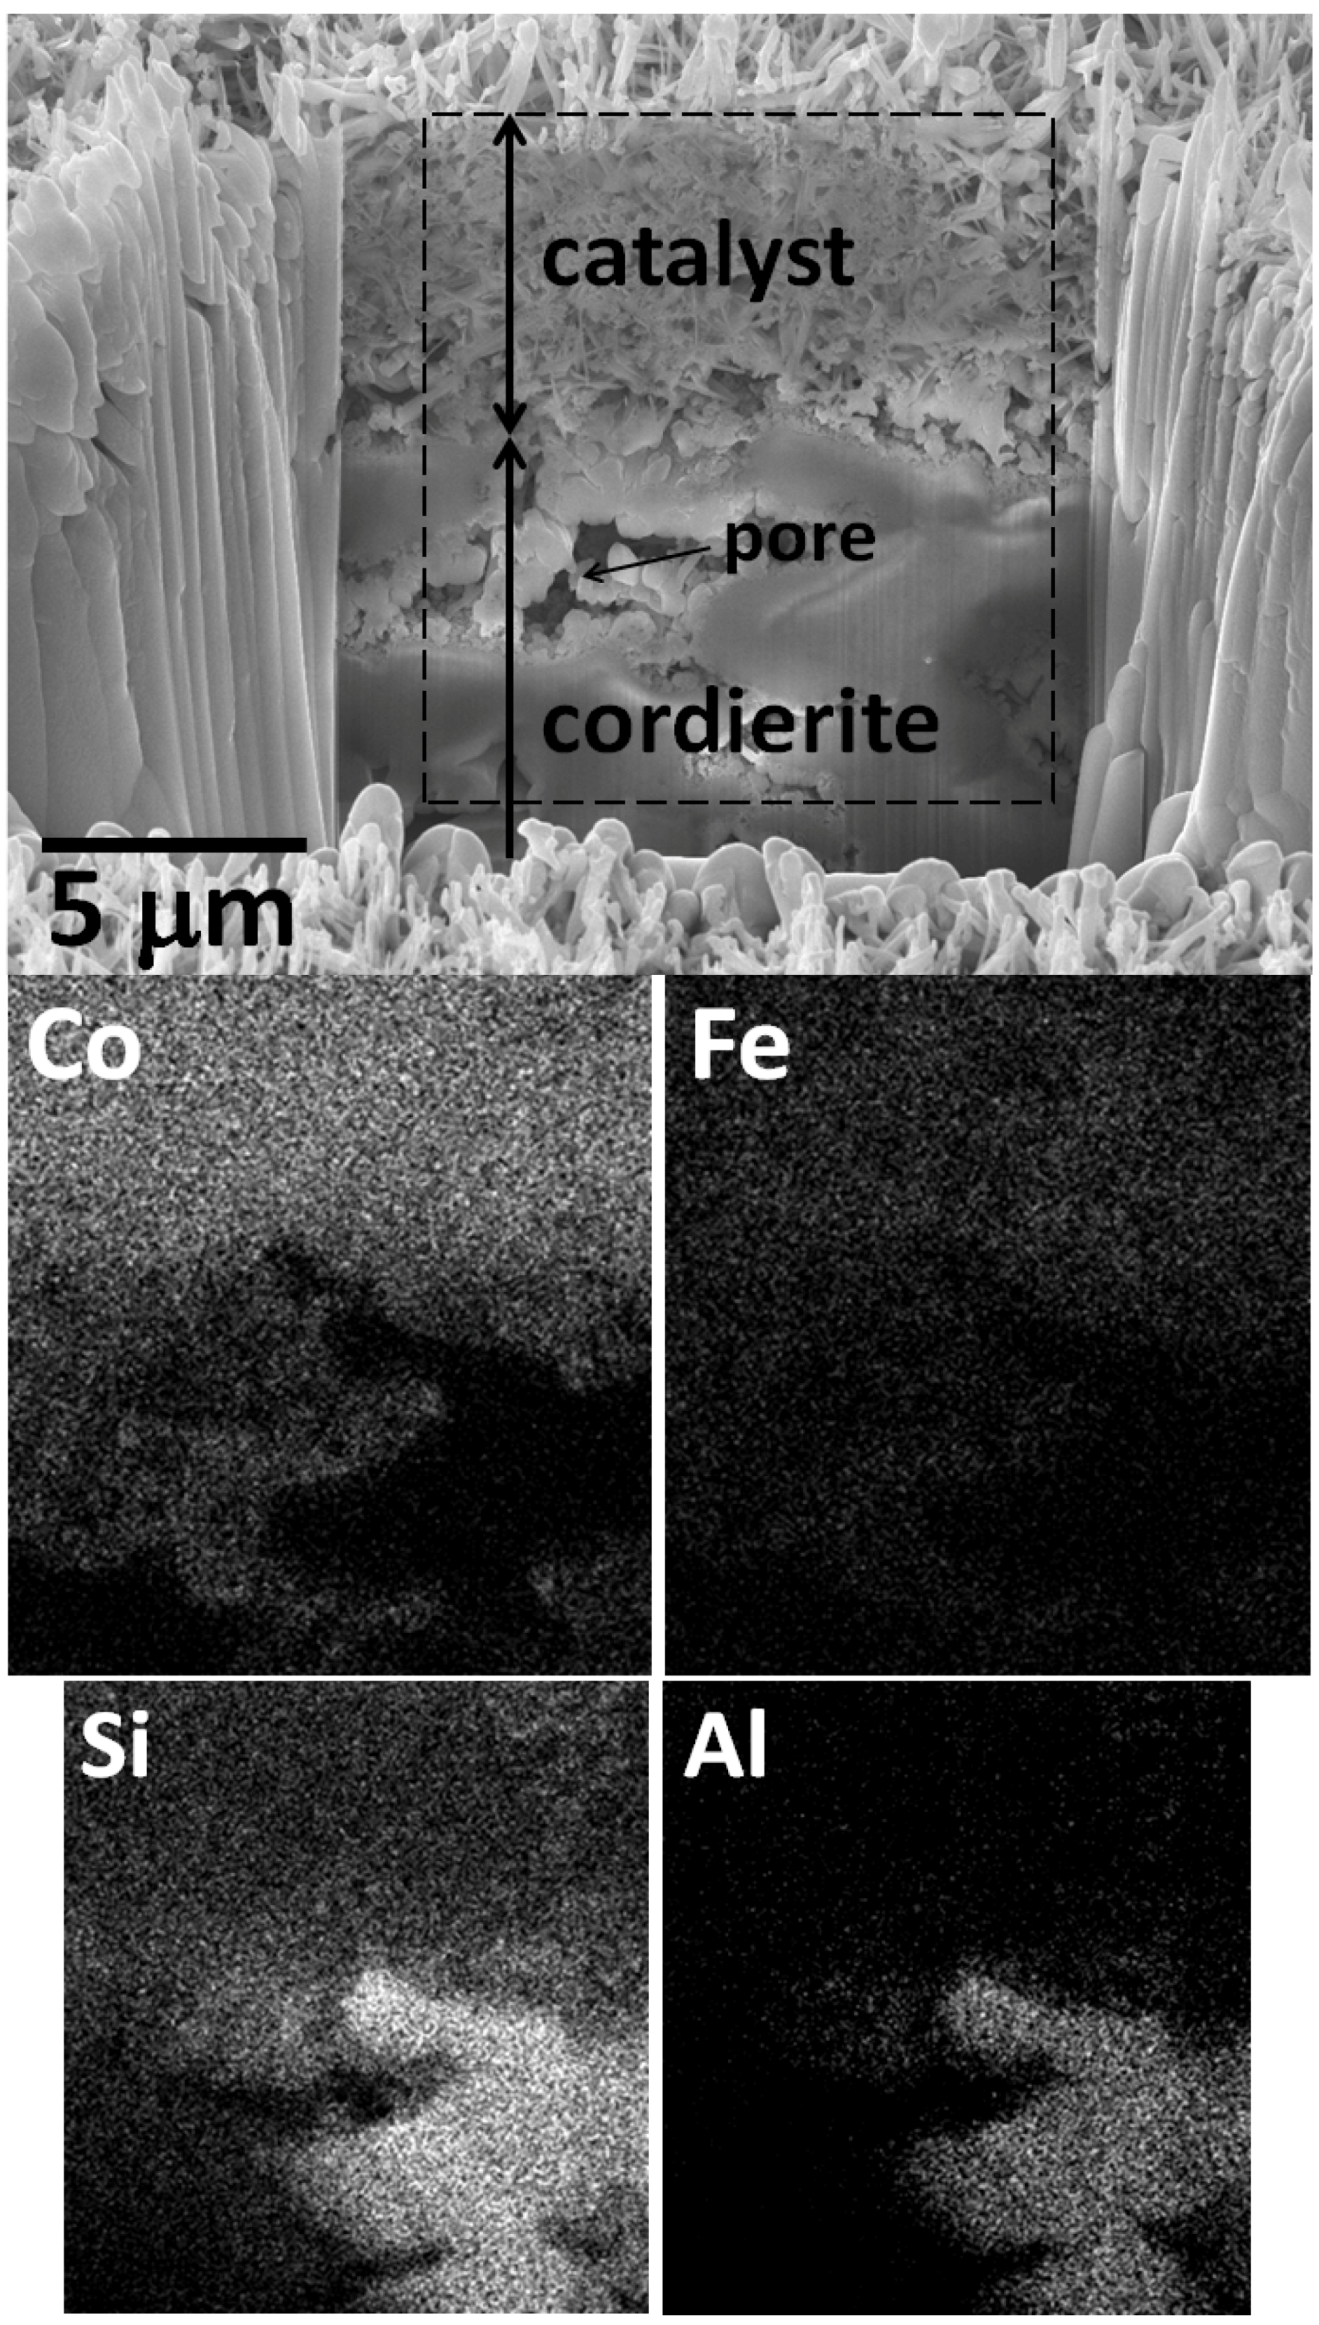
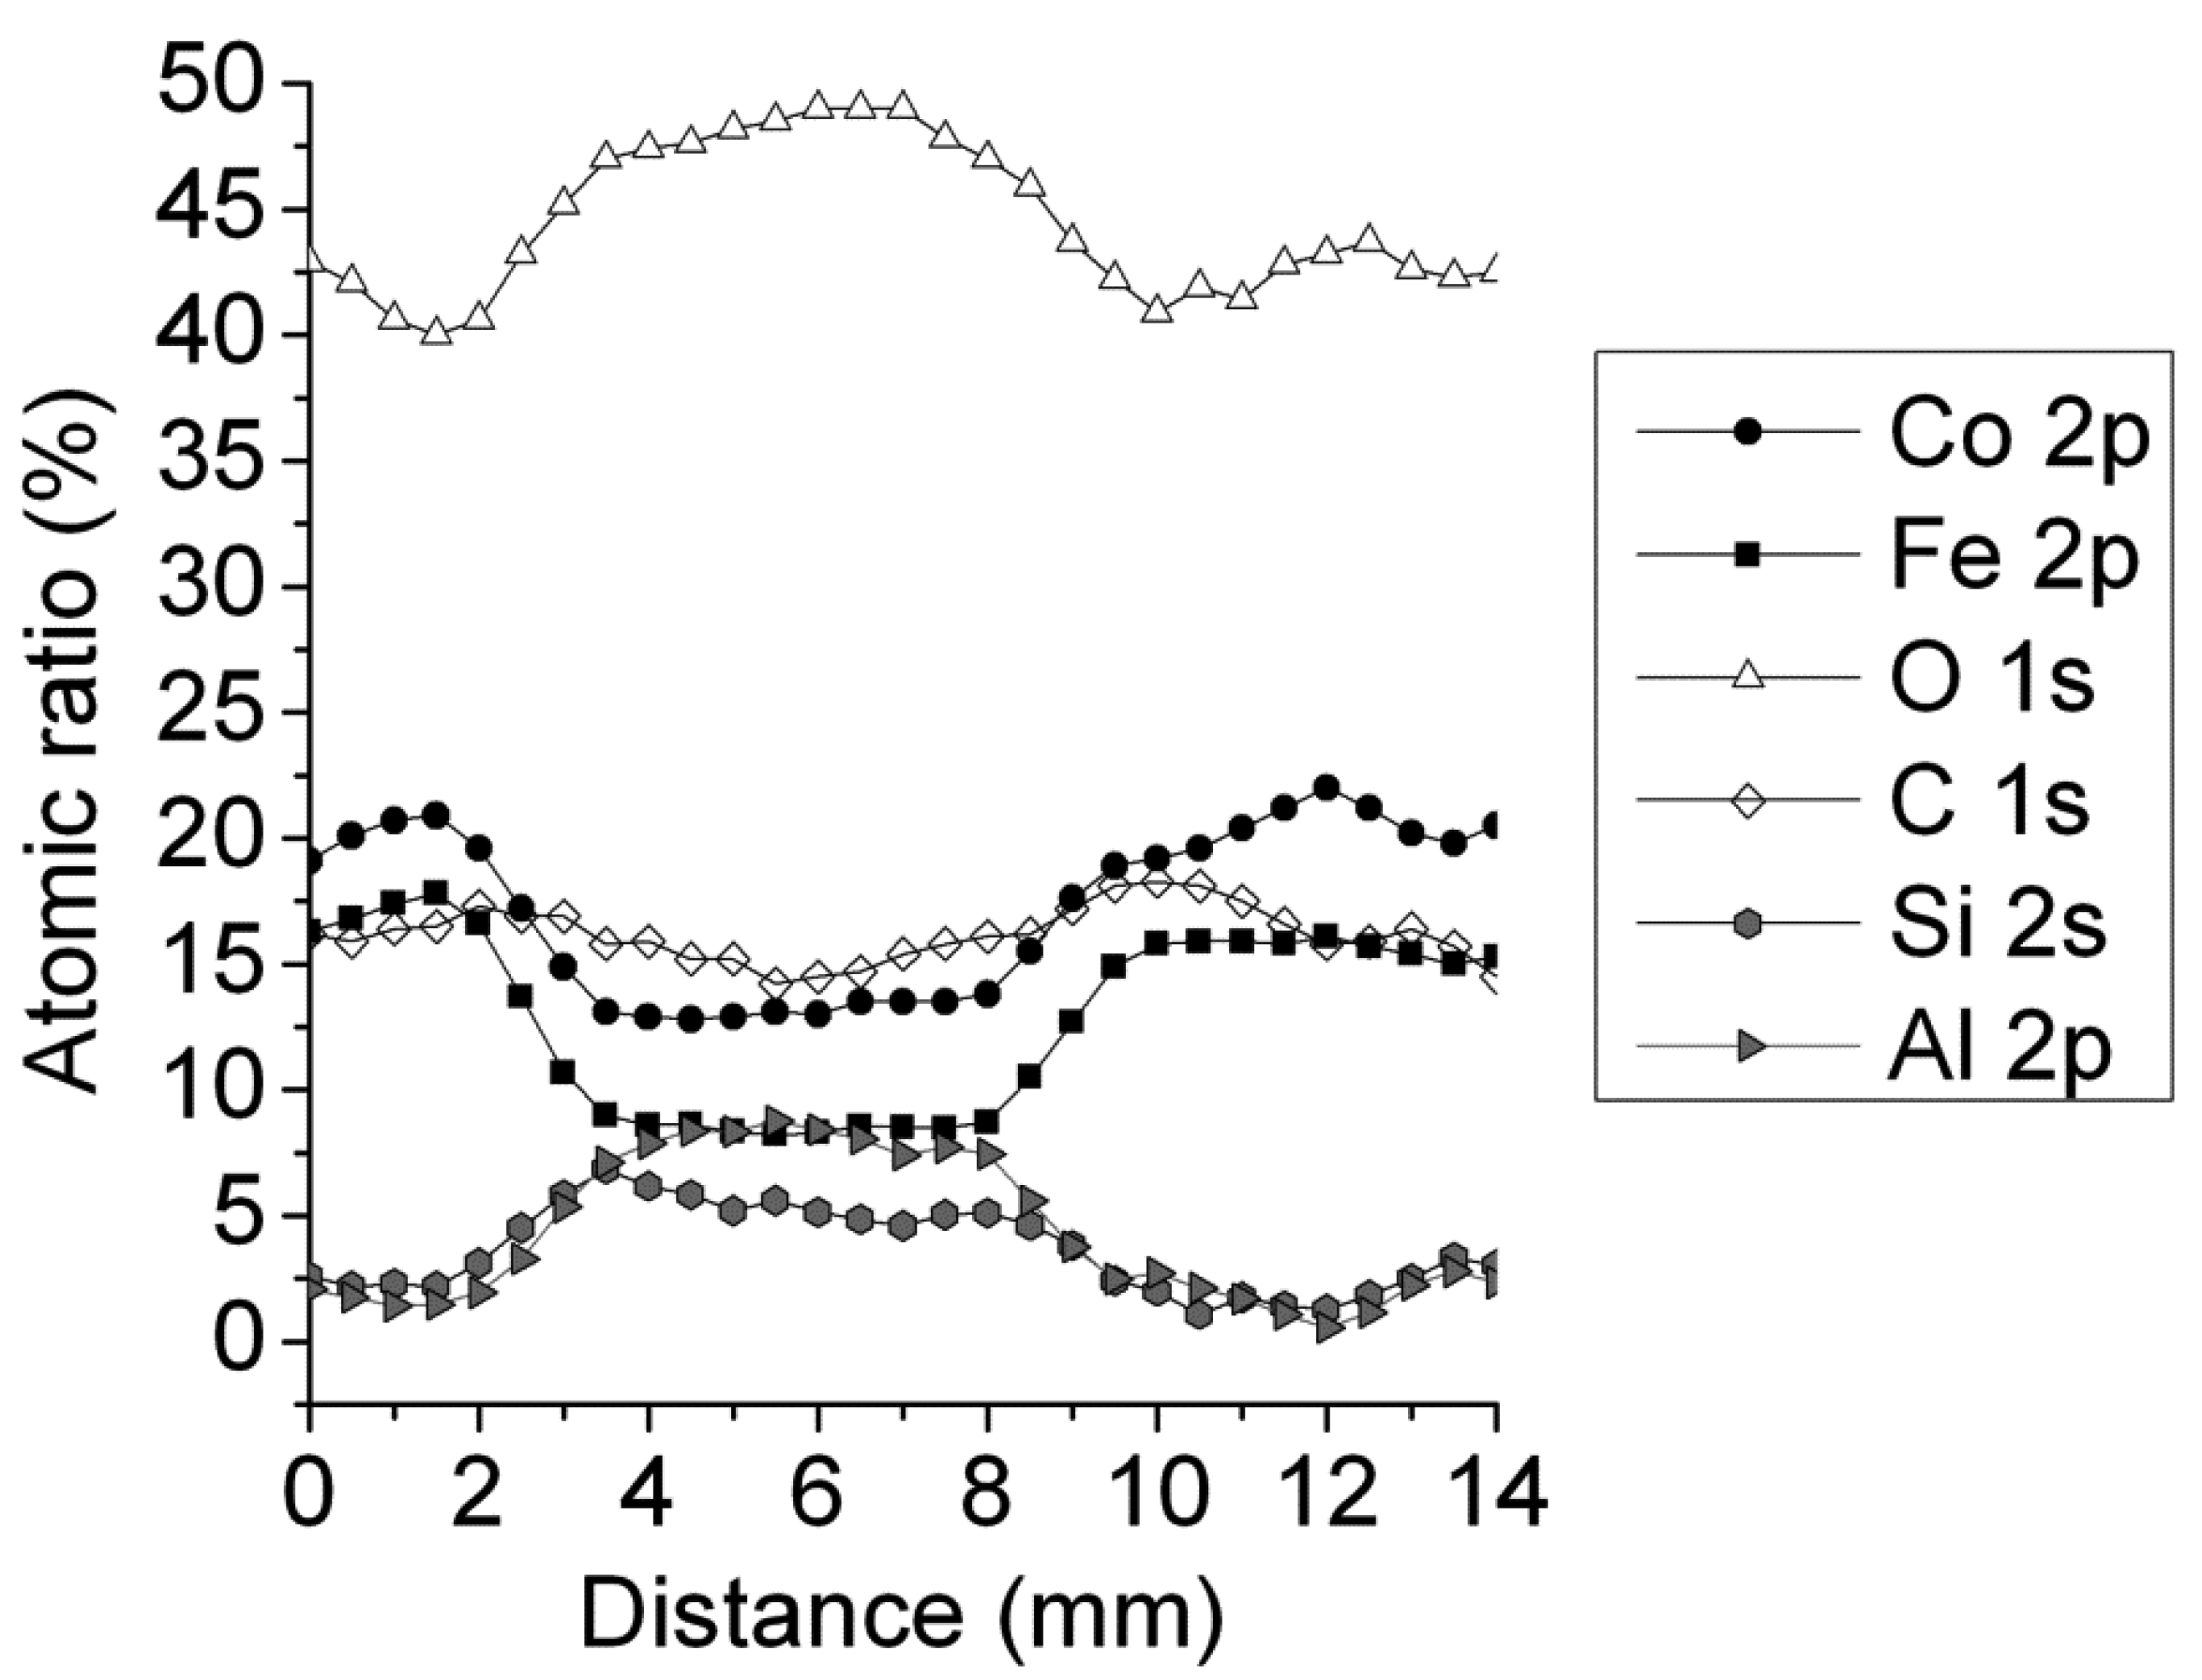
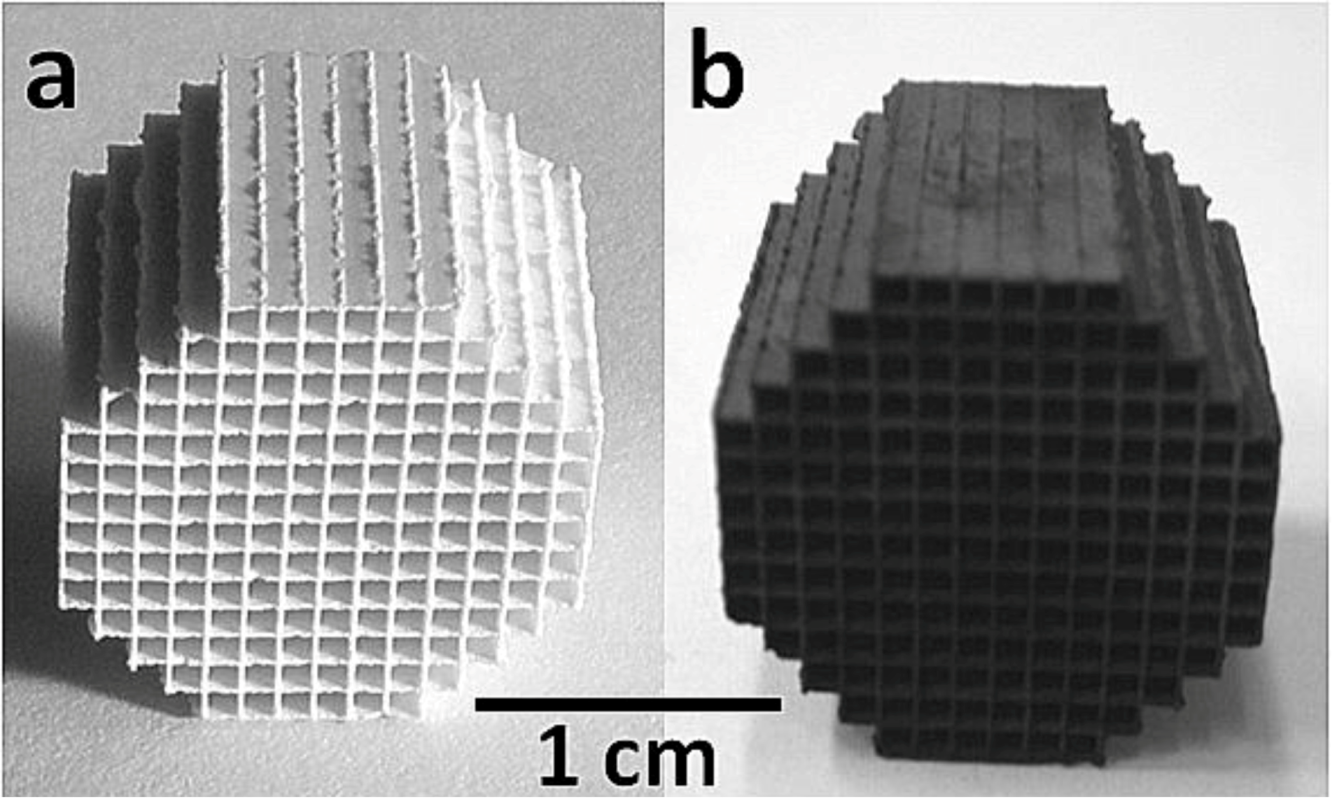
2.1. Catalysts Characterization
2.2. Catalytic Behavior

| Catalyst | T/K | EtOH conv./% | Selectivity/% | |||||
|---|---|---|---|---|---|---|---|---|
| H2 | CO2 | CO | CH4 | CH3CHO | (CH3)2CO | |||
| aer-CoFeSi | 573 | 86 | 49.7 | 3.1 | 3.4 | 3.2 | 40.6 | - |
| 598 | 93 | 57.8 | 6.5 | 2.0 | 3.9 | 28.6 | 1.2 | |
| 623 | 99 | 69.8 | 14.5 | 1.1 | 5.8 | 7.1 | 1.7 | |
| 673 | 100 | 72.8 | 23.0 | 0.9 | 3.3 | - | - | |
| aer-CoSi | 573 | 92 | 66.7 | 16.6 | 5.2 | 7.0 | 4.1 | 0.4 |
| 598 | 99 | 68.7 | 23.0 | 0.9 | 7.1 | 0.2 | 0.1 | |
| 623 | 100 | 68.7 | 23.2 | 1.0 | 7.1 | - | - | |
| 673 | 100 | 70.7 | 22.7 | 1.9 | 4.7 | - | - | |
 H2,
H2,  CO2,
CO2,  CO,
CO,  CH4,
CH4,  CH3CHO.
H2, CO2, CO, CH4, CH3CHO.
CH3CHO.
H2, CO2, CO, CH4, CH3CHO.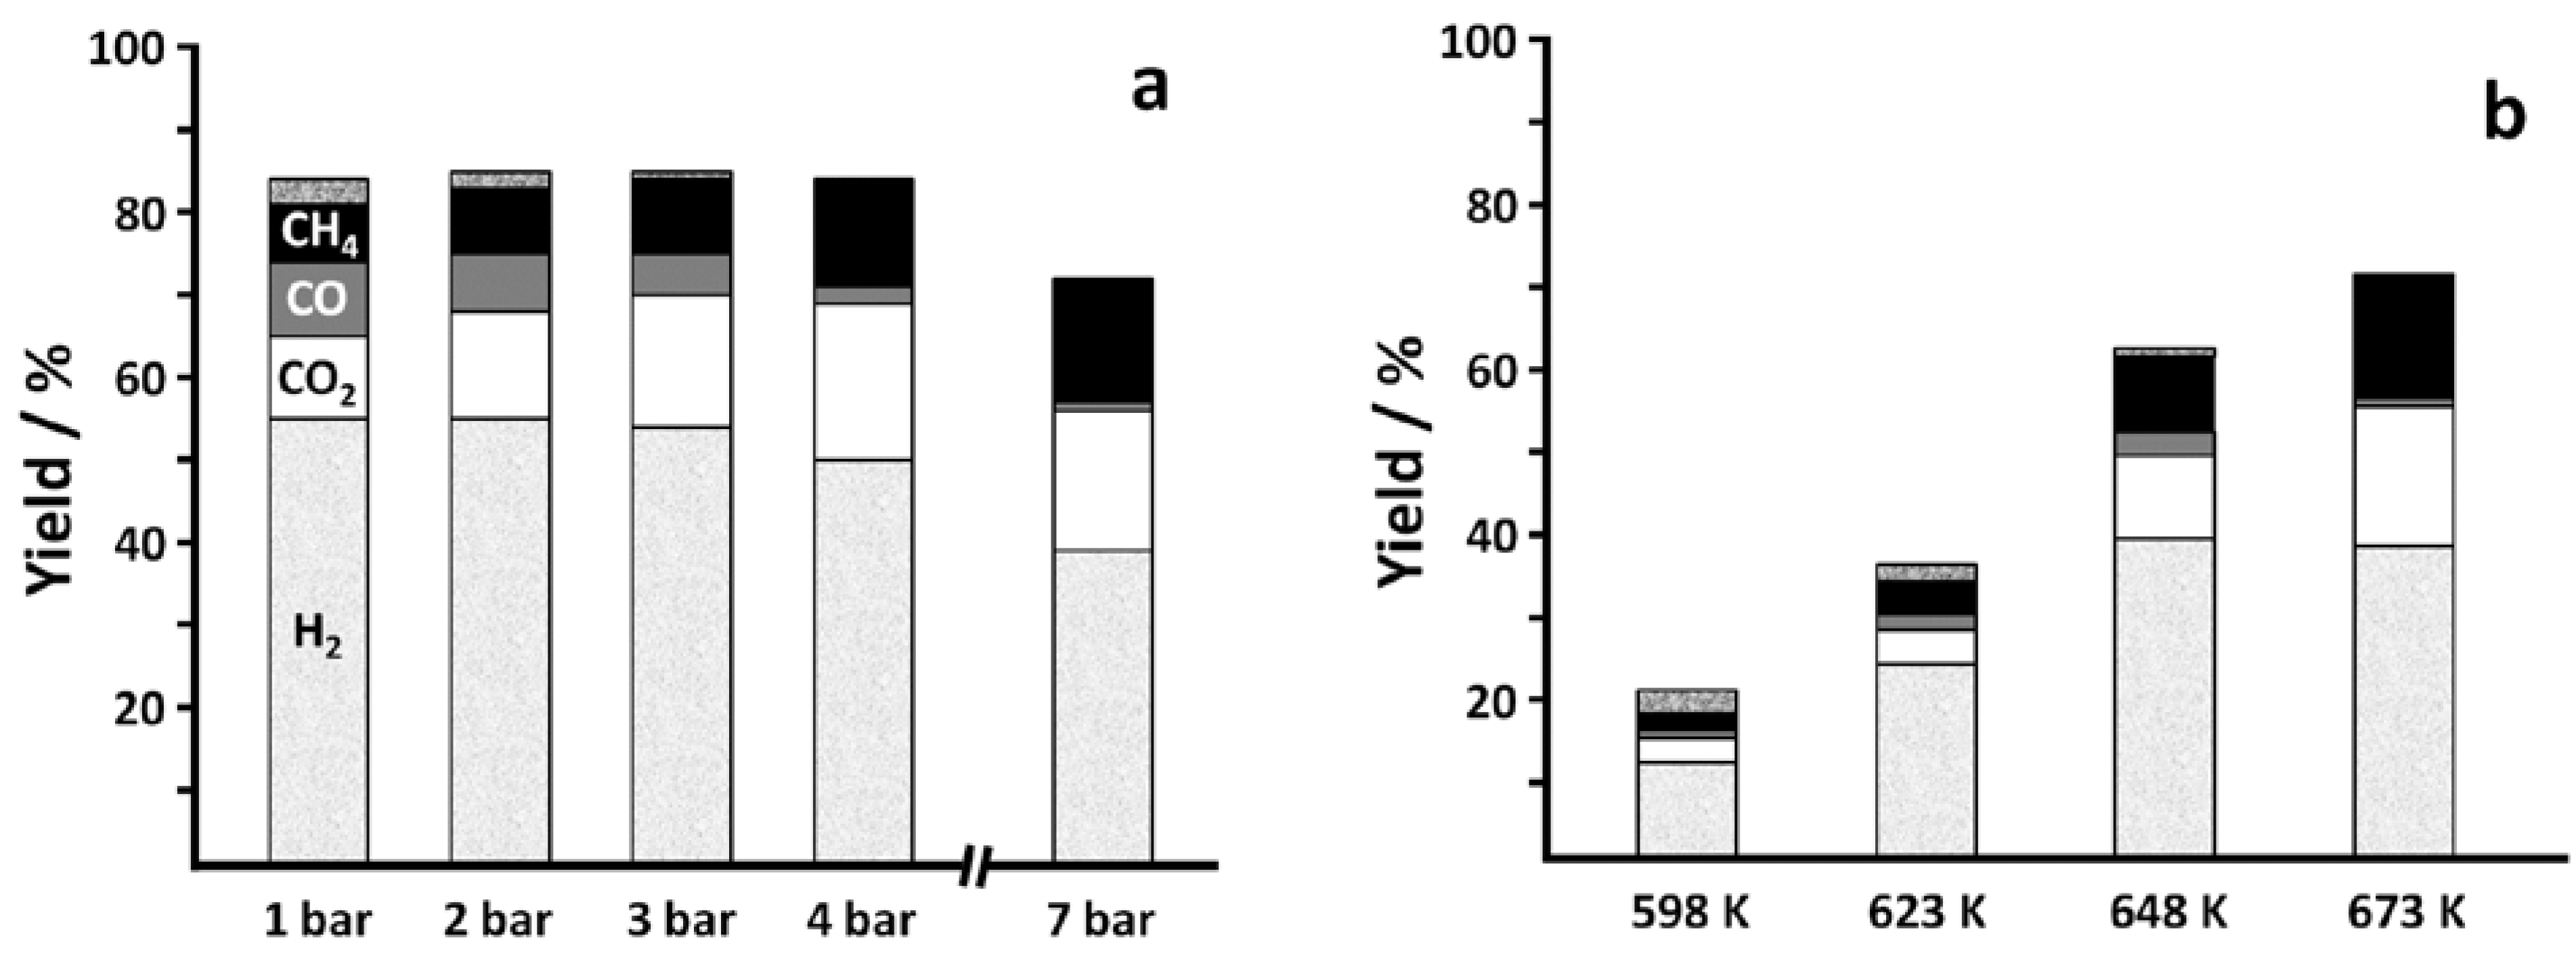
3. Experimental Section
3.1. Preparation of Catalysts
3.2. Characterization Techniques
3.3. Reaction Tests


4. Conclusions
Acknowledgments
Conflict of Interest
References
- Kolb, G. Fuel Processing for Fuel Cells; Wiley-VCH: Weinheim, Germany, 2008; pp. 1–434. [Google Scholar]
- Llorca, J. Microreactors for the Generation of Hydrogen from Ethanol. In Handbook of Sustainable Energy; Lee, W.H., Cho, V.G., Eds.; Nova Publishers: New York, NY, USA, 2010; pp. 693–699. [Google Scholar]
- Murdoch, M.; Waterhouse, G.I.N.; Nadeem, M.A.; Metson, J.B.; Keane, M.A.; Howe, R.F.; Llorca, J.; Idriss, H. The effect of gold loading and particle size on photocatalytic hydrogen production from ethanol over Au/TiO2 nanoparticles. Nat. Chem. 2011, 3, 489–492. [Google Scholar]
- Vaidya, P.D.; Rodrigues, A.E. Insight into steam reforming of ethanol to produce hydrogen for fuel cells. Chem. Eng. J. 2006, 117, 39–49. [Google Scholar] [CrossRef]
- Haryanto, A.; Fernando, S.; Murali, N.; Adhikari, S. Current status of hydrogen production techniques by steam reforming of ethanol: A review. Energy Fuels 2005, 19, 2098–2106. [Google Scholar] [CrossRef]
- Ni, M.; Leung, Y.C.; Leung, M.K.H. A review on reforming bio-ethanol for hydrogen production. Int. J. Hydrog. Energy 2007, 32, 3238–3247. [Google Scholar] [CrossRef]
- Deluga, G.A.; Salge, J.R.; Schmidt, L.D.; Verykios, X.E. Renewable hydrogen form Ethanol by autothermal reforming. Science 2004, 303, 993–997. [Google Scholar] [CrossRef]
- Frusteri, F.; Freni, S. Bio-ethanol, a suitable fuel to produce hydrogen for a molten carbonate fuel cell. J. Power Sources 2007, 173, 200–209. [Google Scholar] [CrossRef]
- Idriss, H.; Scott, M.; Llorca, J.; Chan, S.C.; Chiu, W.; Sheng, P.Y.; Yee, A.; Blackford, M.A.; Pas, S.J.; Hill, A.J.; et al. A phenomenological study of the metal-oxide interface: The role of catalysis in hydrogen production from renewable resources. ChemSusChem 2008, 1, 905–910. [Google Scholar] [CrossRef]
- Haga, F.; Nakajima, T.; Miya, H.; Mishima, S. Catalytic properties of supported cobalt catalysts for steam reforming of ethanol. Catal. Lett. 1997, 48, 223–227. [Google Scholar] [CrossRef]
- Llorca, J.; Homs, N.; Sales, J.; de la Piscina, P.R. Efficient production of hydrogen over supported cobalt catalysts from ethanol steam reforming. J. Catal. 2002, 209, 306–317. [Google Scholar] [CrossRef]
- Llorca, J.; de la Piscina, P.R.; Dalmon, J.A.; Sales, J.; Homs, N. CO-free hydrogen from steam-reforming of bioethanol over ZnO-supported cobalt catalysts: Effect of metallic precursor. Appl. Catal. B 2003, 43, 355–369. [Google Scholar] [CrossRef]
- Llorca, J.; Dalmon, J.A.; de la Piscina, P.R.; Homs, N. In situ magnetic characterisation of supported cobalt catalysts under steam-reforming of ethanol. Appl. Catal. A 2003, 243, 261–269. [Google Scholar] [CrossRef]
- Freni, S.; Cavallaro, S.; Mondello, N.; Spadaro, L.; Frustreri, F. Production of hydrogen for MC fuel cell by steam reforming of ethanol over MgO supported Ni and Co catalysts. Catal. Commun. 2003, 4, 259–268. [Google Scholar] [CrossRef]
- Mariño, F.; Baronetti, G.; Jobbagy, M.; Laborde, M. Cu-Ni-K/γ-Al2O3 supported catalysts for ethanol steam reforming: Formation of hydrotalcite-type compounds as a result of metal-support interaction. Appl. Catal. A 2003, 238, 41–54. [Google Scholar] [CrossRef]
- Llorca, J.; Homs, N.; Sales, J.; Fierro, J.L.G.; de la Piscina, P.R. Effect of sodium addition on the performance of Co-ZnO-based catalysts for hydrogen production from bioethanol. J. Catal. 2004, 222, 470–480. [Google Scholar] [CrossRef]
- Llorca, J.; de la Piscina, P.R.; Dalmon, J.A.; Homs, N. Transformation of Co3O4 during ethanol steam-re-forming. Activation process for hydrogen production. Chem. Mater. 2004, 16, 3573–3578. [Google Scholar] [CrossRef]
- Llorca, J.; Homs, N.; de la Piscina, P.R. In situ DRIFT-mass spectrometry study of the ethanol steam-reforming reaction over carbonyl-derived Co/ZnO catalysts. J. Catal. 2004, 227, 556–560. [Google Scholar] [CrossRef]
- Batista, M.S.; Santos, R.K.S.; Assaf, E.M.; Assaf, J.M.; Ticianelli, E.A. High efficiency steam reforming of ethanol by cobalt-based catalysts. J. Power Sources 2004, 134, 27–32. [Google Scholar] [CrossRef]
- Kaddouri, A.; Mazzocchia, C. A study of the influence of the synthesis conditions upon the catalytic properties of Co/SiO2 or Co/Al2O3 catalysts used for ethanol steam reforming. Catal. Commun. 2004, 5, 339–345. [Google Scholar] [CrossRef]
- Song, H.; Zhang, L.; Watson, R.B.; Braden, D.; Ozkan, U. Investigation of bio-ethanol steam reforming over cobalt-based catalysts. Catal. Today 2007, 129, 346–354. [Google Scholar] [CrossRef]
- Torres, J.A.; Llorca, J.; Casanovas, A.; Domínguez, M.; Salvadó, J.; Montané, D. Steam reforming of ethanol at moderate temperature: Multifactorial design analysis of Ni/La2O3-Al2O3, and Fe- and Mn-promoted Co/ZnO catalysts. J. Power Sources 2007, 169, 158–166. [Google Scholar] [CrossRef]
- Benito, M.; Padilla, R.; Rodríguez, L.; Sanz, J.L.; Daza, L. Zirconia supported catalysts for bioethanol steam reforming: Effect of active phase and zirconia structure. J. Power Sources 2007, 169, 167–176. [Google Scholar] [CrossRef]
- Tutti, S.; Pepe, F. On the catalytic activity of cobalt oxide for steam reforming of ethanol. Catal. Lett. 2008, 122, 196–203. [Google Scholar] [CrossRef]
- Song, H.; Ozkan, U. Ethanol steam reforming over Co-based catalysts: Role of oxygen mobility. J. Catal. 2009, 261, 66–74. [Google Scholar] [CrossRef]
- Casanovas, A.; de Leitenburg, C.; Trovarelli, A.; Llorca, J. Catalytic monoliths for ethanol steam reforming. Catal. Today 2008, 138, 187–192. [Google Scholar]
- Casanovas, A.; Saint-Gerons, M.; Griffon, F.; Llorca, J. Autothermal generation of hydrogen from ethanol in a microreactor. Int. J. Hydrog. Energy 2008, 33, 1827–1833. [Google Scholar] [CrossRef]
- Llorca, J.; Casanovas, A.; Trifonov, T.; Rodríguez, A.; Alcubilla, R. First use of macroporous silicon loaded with catalyst film for a chemical reaction: A microreformer for producing hydrogen from ethanol steam reforming. J. Catal. 2008, 255, 228–233. [Google Scholar]
- Wang, H.; Ye, J.L.; Liu, Y.; Li, Y.D.; Qin, Y.N. Steam reforming of ethanol over Co3O4/CeO2 catalysts prepared by different methods. Catal. Today 2007, 129, 305–312. [Google Scholar] [CrossRef]
- Sun, J.; Qiu, X.-P.; Wu, F.; Zhu, W.-T. H2 from steam reforming of ethanol at low temperature over Ni/Y2O3, Ni/La2O3 and Ni/Al2O3 catalysts for fuel-cell applications. Int. J. Hydrog. Energy 2005, 30, 437–445. [Google Scholar] [CrossRef]
- Galetti, A.E.; Gomez, M.F.; Arrua, L.A.; Marchi, A.J.; Abello, M.C. Study of CuCoZnAl oxide as catalyst for the hydrogen production from ethanol reforming. Catal. Commun. 2008, 9, 1201–1208. [Google Scholar] [CrossRef]
- Vargas, J.C.; Libs, S.; Roger, A.C.; Kiennemann, A. Study of Ce-Zr-Co fluorite-type oxide as catalysts for hydrogen production by steam reforming of bioethanol. Catal. Today 2005, 107, 417–425. [Google Scholar] [CrossRef]
- Casanovas, A.; Domínguez, M.; Ledesma, C.; López, E.; Llorca, J. Catalytic walls and micro-devices for generating hydrogen by low temperature steam reforming of ethanol. Catal. Today 2009, 143, 32–37. [Google Scholar] [CrossRef]
- Nedyalkova, R.; Casanovas, A.; Llorca, J.; Montané, D. Electrophoretic deposition of Co-Me/ZnO (Me = Mn, Fe) ethanol steam reforming catalysts on stainless steel plates. Int. J. Hydrog. Energy 2009, 34, 2591–2599. [Google Scholar] [CrossRef]
- Casanovas, A.; de Leitenburg, C.; Trovarelli, A.; Llorca, J. Ethanol steam reforming and water gas shift reacion over Co-Mn/ZnO catalysts. Chem. Eng. J. 2009, 154, 267–273. [Google Scholar] [CrossRef]
- López, E.; Irigoyen, A.; Trifonov, T.; Rodríguez, A.; Llorca, J. A milion-channel reformer on a fingertip: Moving down the scale in hydrogen production. Int. J. Hydrog. Energy 2010, 35, 3472–3479. [Google Scholar] [CrossRef]
- Casanovas, A.; Roig, M.; de Leitenburg, C.; Trovarelli, A.; Llorca, J. Ethanol steam reforming and water gas shift over Co/ZnO catalytic honeycombs doped with Fe, Ni, Cu, Cr and Na. Int. J. Hydrog. Energy 2010, 35, 7690–7698. [Google Scholar] [CrossRef]
- Bichon, P.; Haugom, G.; Venvik, H.J.; Colmen, A.E.; Blekkan, A. Steam reforming of ethanol over supported Co and Ni catalysts. Top. Catal. 2008, 49, 38–45. [Google Scholar]
- Domínguez, M.; Taboada, E.; Molins, E.; Llorca, J. Co-SiO2 aerogel-coated catalytic walls for the generation of hydrogen. Catal. Today 2008, 138, 193–197. [Google Scholar]
- Domínguez, M.; Cristiano, G.; López, E.; Llorca, J. Ethanol steam reforming over cobalt talc in a plate microreactor. Chem. Eng. J. 2011, 176–177, 280–285. [Google Scholar]
- Domínguez, M.; Taboada, E.; Idriss, H.; Molins, E.; Llorca, J. Fast and efficient hydrogen generation catalyzed by cobalt talc nanolayers dispersed in silica aerogel. J. Mater. Chem. 2010, 20, 4875–4883. [Google Scholar] [CrossRef]
- Domínguez, M.; Taboada, E.; Molins, E.; Llorca, J. Ethanol steam reforming at very low temperature over cobalt talc in a membrane reactor. Catal. Today 2012. [Google Scholar] [CrossRef]
- Sekine, Y.; Kazama, A.; Izutsu, Y.; Matsukata, M.; Kikuchi, E. Steam reforming of ethanol over cobalt catalysts modified with a small amount of iron. Catal. Lett. 2009, 132, 329–334. [Google Scholar] [CrossRef]
- Kazama, A.; Sekine, Y.; Oyama, K.; Matsukata, M.; Kikuchi, E. Promoting effect of small amount of Fe addition onto Co catalyst supported on α-Al2O3 for steam reforming of ethanol. Appl. Catal. A 2010, 383, 96–101. [Google Scholar] [CrossRef]
- Zhang, G.; Zhao, Y.; Tao, F.; Li, H.J. Electrochemical characteristics and impedance spectroscopy studies of nano-cobalt silicate hydroxide for supercapacitor. J. Power Sources 2006, 161, 723–729. [Google Scholar] [CrossRef]
- Chen, L.; Kai, C.; Zhong, Z.; Huang, L.; Peng, T.; Hong, L.; Lin, J. Carbon monoxide-free hydrogen production via low-temperature steam reforming of ethanol over iron-promoted Rh catalyst. J. Catal. 2010, 276, 197–200. [Google Scholar]
© 2012 by the authors; licensee MDPI, Basel, Switzerland. This article is an open-access article distributed under the terms and conditions of the Creative Commons Attribution license (http://creativecommons.org/licenses/by/3.0/).
Share and Cite
Domínguez, M.; Taboada, E.; Molins, E.; Llorca, J. Co-Fe-Si Aerogel Catalytic Honeycombs for Low Temperature Ethanol Steam Reforming. Catalysts 2012, 2, 386-399. https://doi.org/10.3390/catal2030386
Domínguez M, Taboada E, Molins E, Llorca J. Co-Fe-Si Aerogel Catalytic Honeycombs for Low Temperature Ethanol Steam Reforming. Catalysts. 2012; 2(3):386-399. https://doi.org/10.3390/catal2030386
Chicago/Turabian StyleDomínguez, Montserrat, Elena Taboada, Elies Molins, and Jordi Llorca. 2012. "Co-Fe-Si Aerogel Catalytic Honeycombs for Low Temperature Ethanol Steam Reforming" Catalysts 2, no. 3: 386-399. https://doi.org/10.3390/catal2030386
APA StyleDomínguez, M., Taboada, E., Molins, E., & Llorca, J. (2012). Co-Fe-Si Aerogel Catalytic Honeycombs for Low Temperature Ethanol Steam Reforming. Catalysts, 2(3), 386-399. https://doi.org/10.3390/catal2030386