1. Introduction
The main global source of olefins is the pyrolysis of hydrocarbon feedstocks ranging from ethane to gas oil. Leading licensors of technologies for the production of ethylene and propylene by the pyrolysis of various types of feedstocks include companies such as Kellogg (Millisecond Technology, Houston, Texas, USA), ABB Lummus Global (Bloomfield, New Jersey, USA), Brown and Root (Houston, Texas, USA), UOP (Oleflex, Des Plaines, Illinois, USA), Stone and Webster Engineering Corp. (Stoughton, Massachusetts, USA), and Technip (Paris, France). The observed global increase in the consumption of olefins such as ethylene and especially propylene is prompting oil-producing countries to seek alternative suppliers of olefins [
1,
2,
3,
4].
The problems of providing petrochemical complexes with raw materials can be solved by expanding the use of gaseous feedstocks, including associated petroleum gas and shale gas [
1,
2].
Associated petroleum gas (APG) is a complex mixture of lower alkanes (C
2–C
4), which includes ethane, propane, butane, and isobutane. In most cases, APG is flared, which leads to significant environmental problems and the loss of valuable chemical resources. For example, according to the International Energy Agency (IEA), about 140 billion m
3 of APG is flared annually, which is equivalent to the annual gas consumption of Germany [
5]. Unlike the traditional processes for the dehydrogenation of individual alkanes, APG processing requires the creation of universal catalysts, capable of working effectively with multicomponent mixtures. This significantly complicates the task, since it is necessary to take into account the mutual influence of the mixture components on the catalytic processes.
Such technologies as UOP Oleflex and CATOFIN are widely used for the dehydrogenation of individual alkanes, but they are not suitable for processing multicomponent mixtures such as APG. These technologies require expensive separation of feedstock and the use of synthetic catalysts, which makes them less cost-effective. For example, UOP Oleflex uses catalysts based on platinum, supported on an alumina carrier [
1,
2]. The process is carried out in the presence of hydrogen, which ensures the reduction of the catalyst and reduces its deactivation due to coking. However, this technology has the following limitations: it requires a preliminary separation of the feedstock (for example, separating propane from the mixture); it uses expensive materials (platinum) and complex process solutions; it is not intended for processing multicomponent mixtures such as APG.
In turn, CATOFIN is based on the oxidative dehydrogenation of isobutane to isobutylene, using catalysts based on chromium (CrO
x) [
2,
6,
7]. Although this process allows achieving high selectivity for the target products, it has the following disadvantages: high environmental hazard due to the use of toxic chromium compounds; loss of valuable hydrogen, which is oxidized to water; limited applicability for processing the alkane mixtures. In this work, effective methods and catalysts for processing of APG in a reducing environment have been developed based on a systematic study of the nature of noble metals and the presence of promoters in the catalytic systems based on rhodium and natural zeolites, as well as an analysis of the effect of diluents on the selectivity of light alkanes dehydrogenation and determination of the state of metals in the rhodium–zeolite composites (their dispersion, distribution on the zeolite, and chemical state). In the available literature [
1,
2,
3,
4,
8], attention is paid to the dehydrogenation of individual alkanes, using synthetic catalysts, while our work demonstrates the possibility of efficient processing of the multicomponent APG mixtures, using natural zeolite, which is a new direction of research.
Unlike the use of the traditional catalysts based on synthetic materials (for example, ZSM-5 or Al-SAPO-34) [
1,
3,
9,
10], in this work the use of natural clinoptilolite from the Shankanai field (Kazakhstan) as the catalyst support is investigated [
11,
12,
13] in order to reduce the cost of the catalyst and make the technology more accessible for upscaling.
Thus, the main aim of this work is to offer an original approach to APG processing which combines the following:
- -
Economic efficiency (use of natural zeolite),
- -
Environmental safety (elimination of APG combustion),
- -
High selectivity with respect to olefins,
- -
Multifunctionality of catalysts, allowing working with the multicomponent mixtures without the need for any preliminary separation.
Hence, in this paper, we develop functional and effective catalysts for the selective synthesis of olefins and hydrogen production.
2. Results and Discussions
2.1. Chemistry of the Process
For a better understanding of the complexity of the processes occurring during the catalytic processing of the APG and the role of the catalyst in controlling the direction of the reactions, a formal reaction scheme is proposed that covers the main types of transformations: dehydrogenation, isomerization, and condensation of alkanes.
These reactions can be represented as follows:
Dehydrogenation of alkanes:
Isomerization of alkanes:
The isomerization of butane can occur both at the initial stages of the process and as a result of the secondary reactions.
The formation of heavier hydrocarbons occurs due to the interaction of olefins with the acidic centers of the catalyst.
Cracking of heavy alkanes:
The cracking of butane or isobutane can lead to the formation of lighter alkanes and olefins.
Oxidation of carbon (if oxygen is present):
This process is undesirable, as it reduces the yield of the target products.
2.2. The Catalyst Based on Acid-Activated Natural Zeolite Rh/HCpt for the Dehydrogenation of the APG
The developed catalysts based on the acid-activated natural zeolite (1%Rh/HCpt, 1%Rh/10%SnO/HCpt and 1%Rh/10% SnO/5% K
2O/HCpt) are designed to demonstrate multifunctionality, which is a key advantage in processing the APG and carrying out (a) the conversion of alkanes to olefins (dehydrogenation), (b) the redistribution of structural isomers to optimize the yield of the target product (isomerization), and (c) the decomposition of heavy alkanes (for example, butane) to light alkanes and olefins (cracking). The modification of the natural zeolite with tin (SnO) and potassium (K
2O) oxides should ensure a decrease in surface acidity, which suppresses the side reactions (cracking and condensation) [
14,
15]. The acid activation of the natural zeolite involves treating clinoptilolite with a mineral acid solution (e.g., HCl) to remove impurities and increase surface acidity [
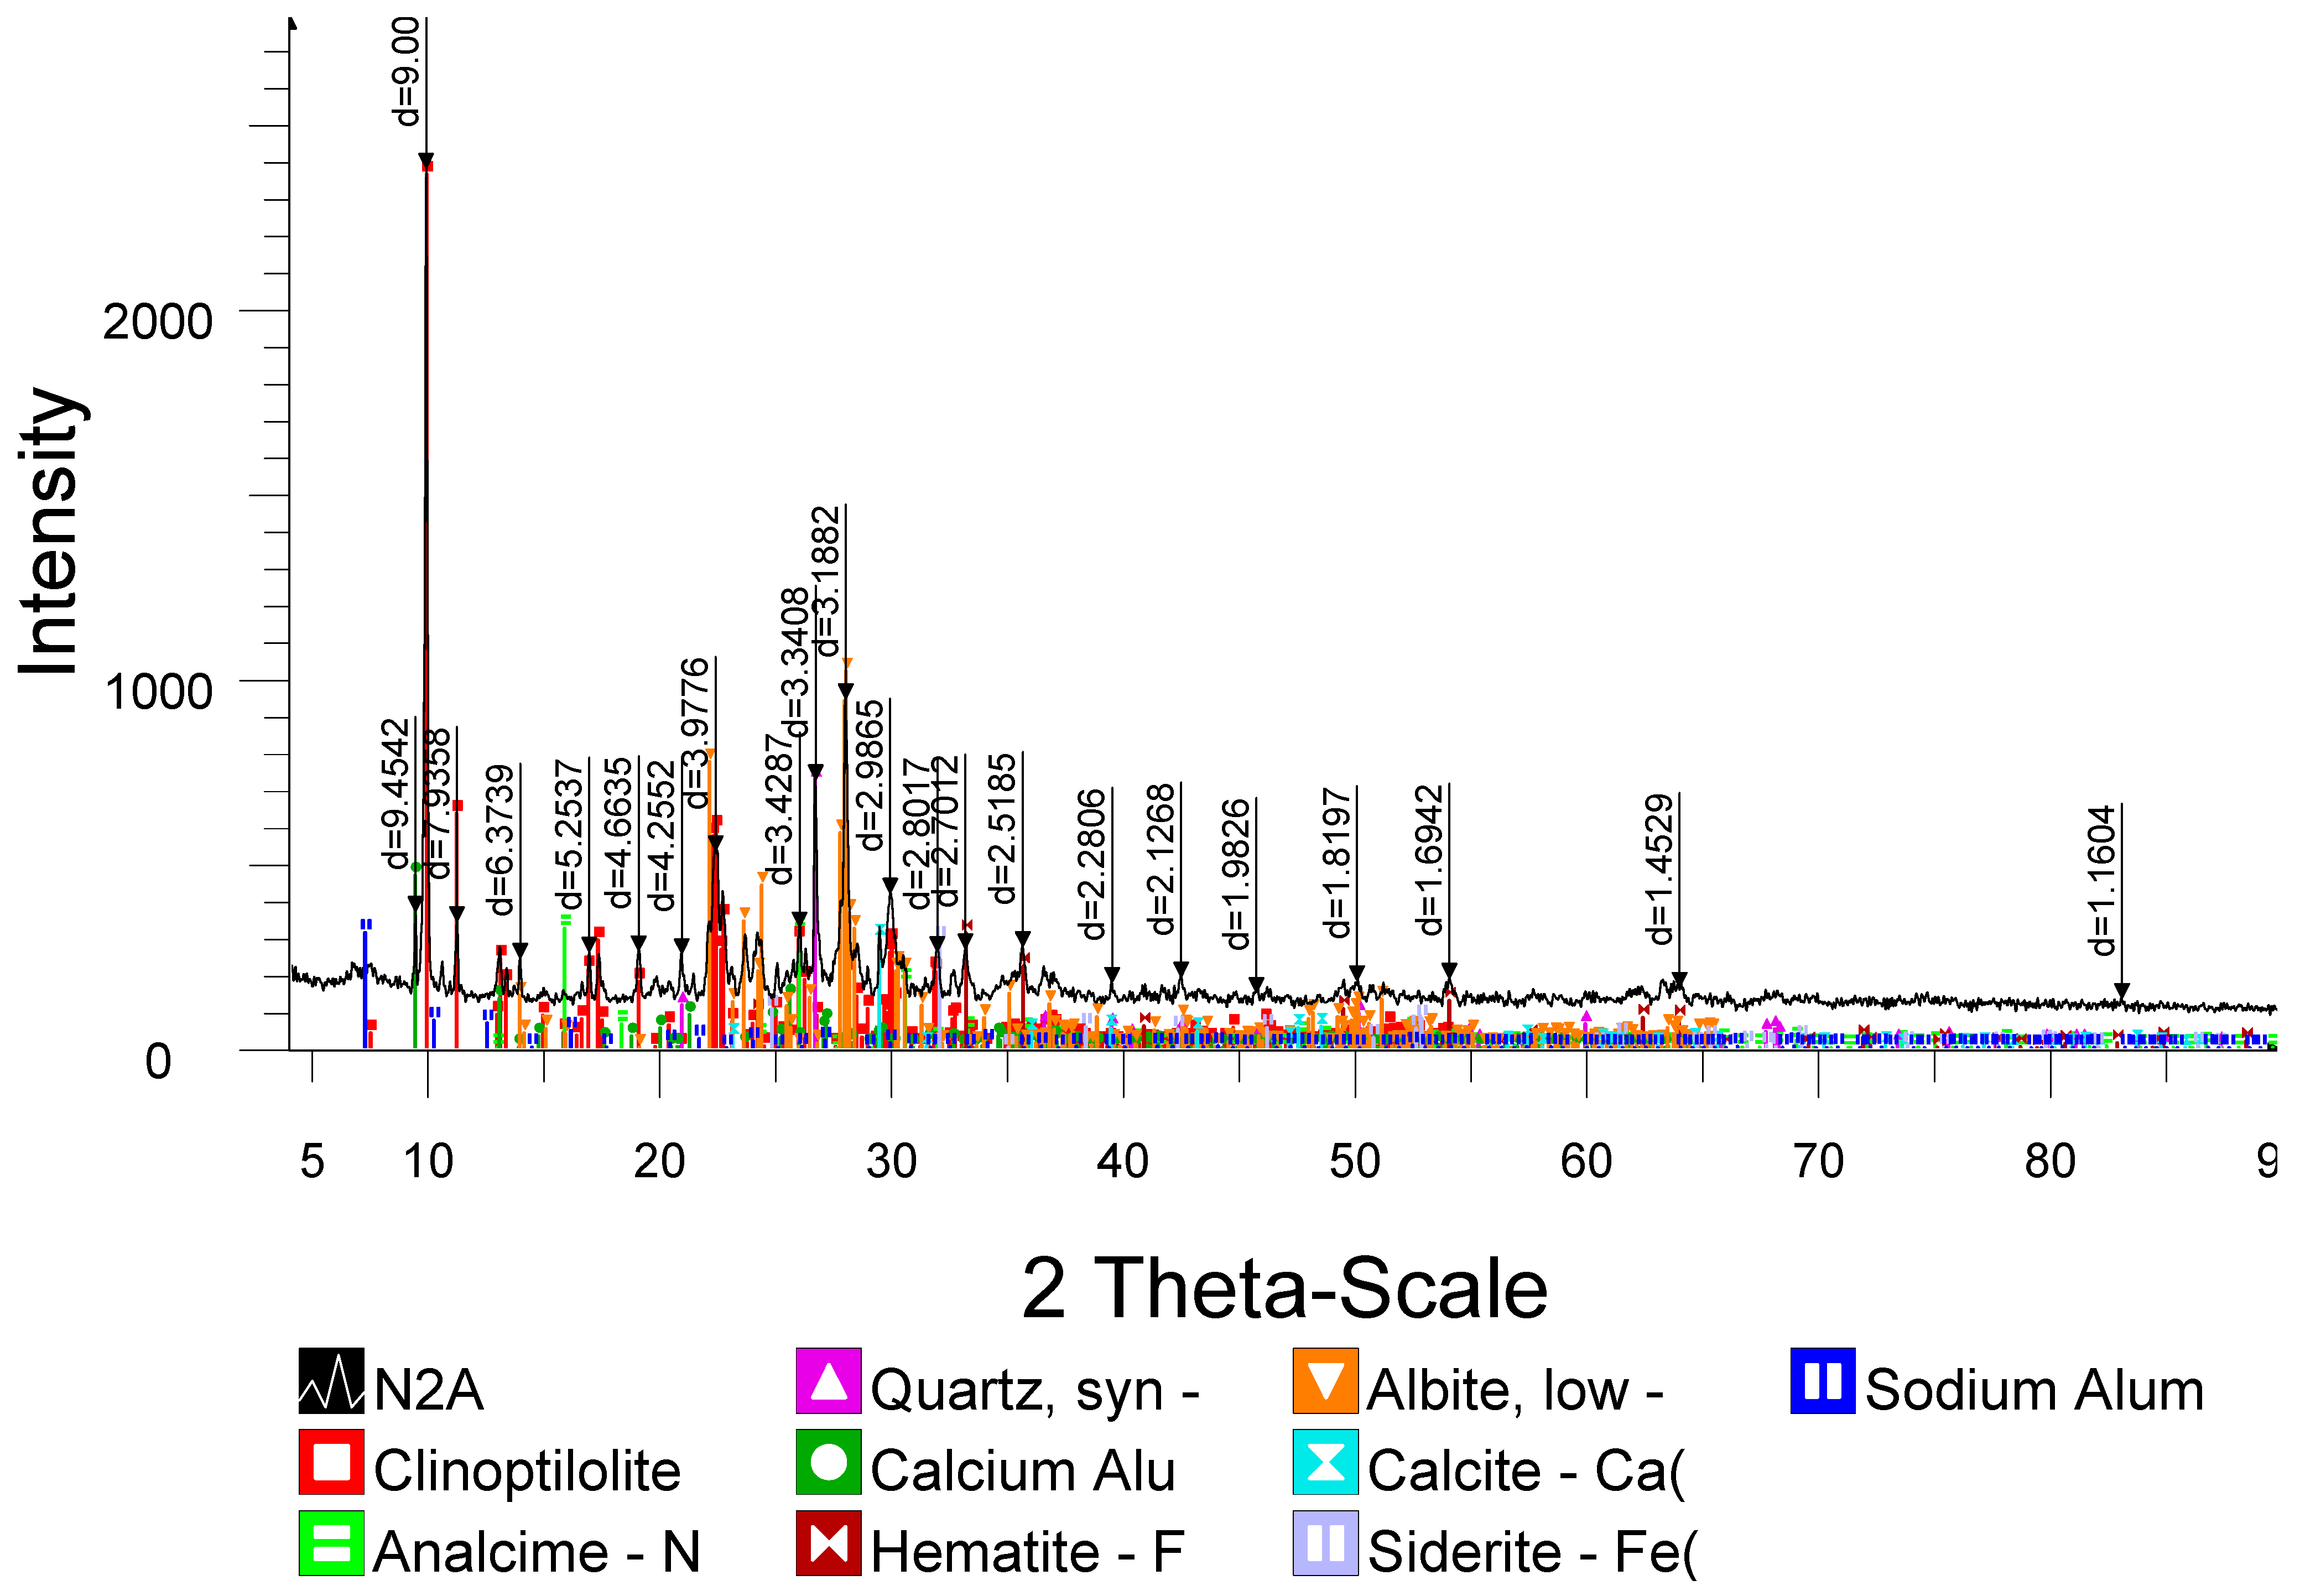
12]. The treatment was carried out, using the Kerr method in a Soxhlet apparatus. During heating, the acid cartridge was placed in an extractor, and the aqueous zeolite suspension was placed in a flask heated in a water bath. The acid modification conditions included: zeolite fraction: 1.6–2 mm particle size, solid-to-liquid ratio: 1:10 (mass). The treatment temperature: 94–98 °C. The contact time: up to 10 h. After the treatment, the samples were thoroughly washed to remove residual acid, dried to an air-dry state, and then calcined at 500 °C for 4 h in a muffle furnace. The X-ray diffraction pattern of the original zeolite sample indicates that the main mineral, forming the solid framework of the zeolite, is clinoptilolite with the formula of Na
8(Al
6Si
30O
72)(H
2O)
9 (
Figure 1 and
Table 1). The usual crystal chemical formula of clinoptilolite is (Na,K)
6[Al
6Si
300
72]*24H
2O. Along with clinoptilolite, there are associated minerals: analcite Na
16.24Al
16.00Si
32.00O
96 (H
2O)
16 (chemical formula Na[AlSi
2O
6]·H
2O), quartz (SiO
2), and feldspars. The feldspars are presented in the form of solid solutions of the ternary system of the isomorphic series K[AlSi
3O
8]—Na[AlSi
3O
8]—Ca[Al
2Si
2O
8] (or K-Na-, Ca-Na- feldspars), in particular in the form of albite Na[AlSi
3O
8] [
16,
17,
18]. Of the remaining minerals, the widespread iron minerals can be distinguished—hematite Fe
2O
3 and siderite FeCO
3 [
19,
20].
When zeolite is treated with hydrochloric acid, the content of oxides of mono- and divalent metals decreases. The amount of its iron oxide, compared to its amount in the original Cpt sample (10.2%), decreases to 2.7% with a single treatment of the zeolite sample with 1.75 N hydrochloric acid, and, with three treatments, its iron oxide content reaches 1.2%. The amount of aluminum oxide changes from 8.5 to 2.4%, i.e., decreases by 72%, while the content of SiO
2 in the zeolite samples increases from 65 up to 89.0%. This leads to an increase in the value of the silicate modulus (SiO
2/Al
2O
3 molar ratio), first from 13.5 (HCpt-1) to 23.75 (HCpt-2), then sharply to 63 (HCpt-3) (
Table 2).
The comparison of the X-ray patterns of the initial and acid-activated samples after the first (HCpt-1), second (HCpt-2), and third (HCpt-1) acid treatments in our previous study has shown the changes in the mineral structure during the acid activation [
12,
13].
It was found that after the treatment with 1.75 N acid, the mineral structure remains unchanged; however, compared to the diffraction pattern of the initial sample of the natural zeolite, a decrease in the intensity of one of the main reflection characteristic of the mineral (8.92 Ǻ), as well as an increase in the reflection characteristic of the amorphous phase (3.3 Ǻ) were observed [
12].
During the acid treatment of the Cpt sample with 1.75 N HCl, quartz and feldspar dissolve, and their amounts decrease by 20–25%. Moreover, in the HCpt samples, a decrease in mineral phases containing iron oxide is observed. This is due to the decrease in the content of hematite, and dissolution of the siderite mineral by mineral acid [
12].
As a result of the acid activation, an increase in the content of the rock-forming mineral, clinoptilolite, is observed. The clinoptilolite phase under the action of 1.75 N HCl in the HCpt samples compared to the original Cpt increases by 20%.
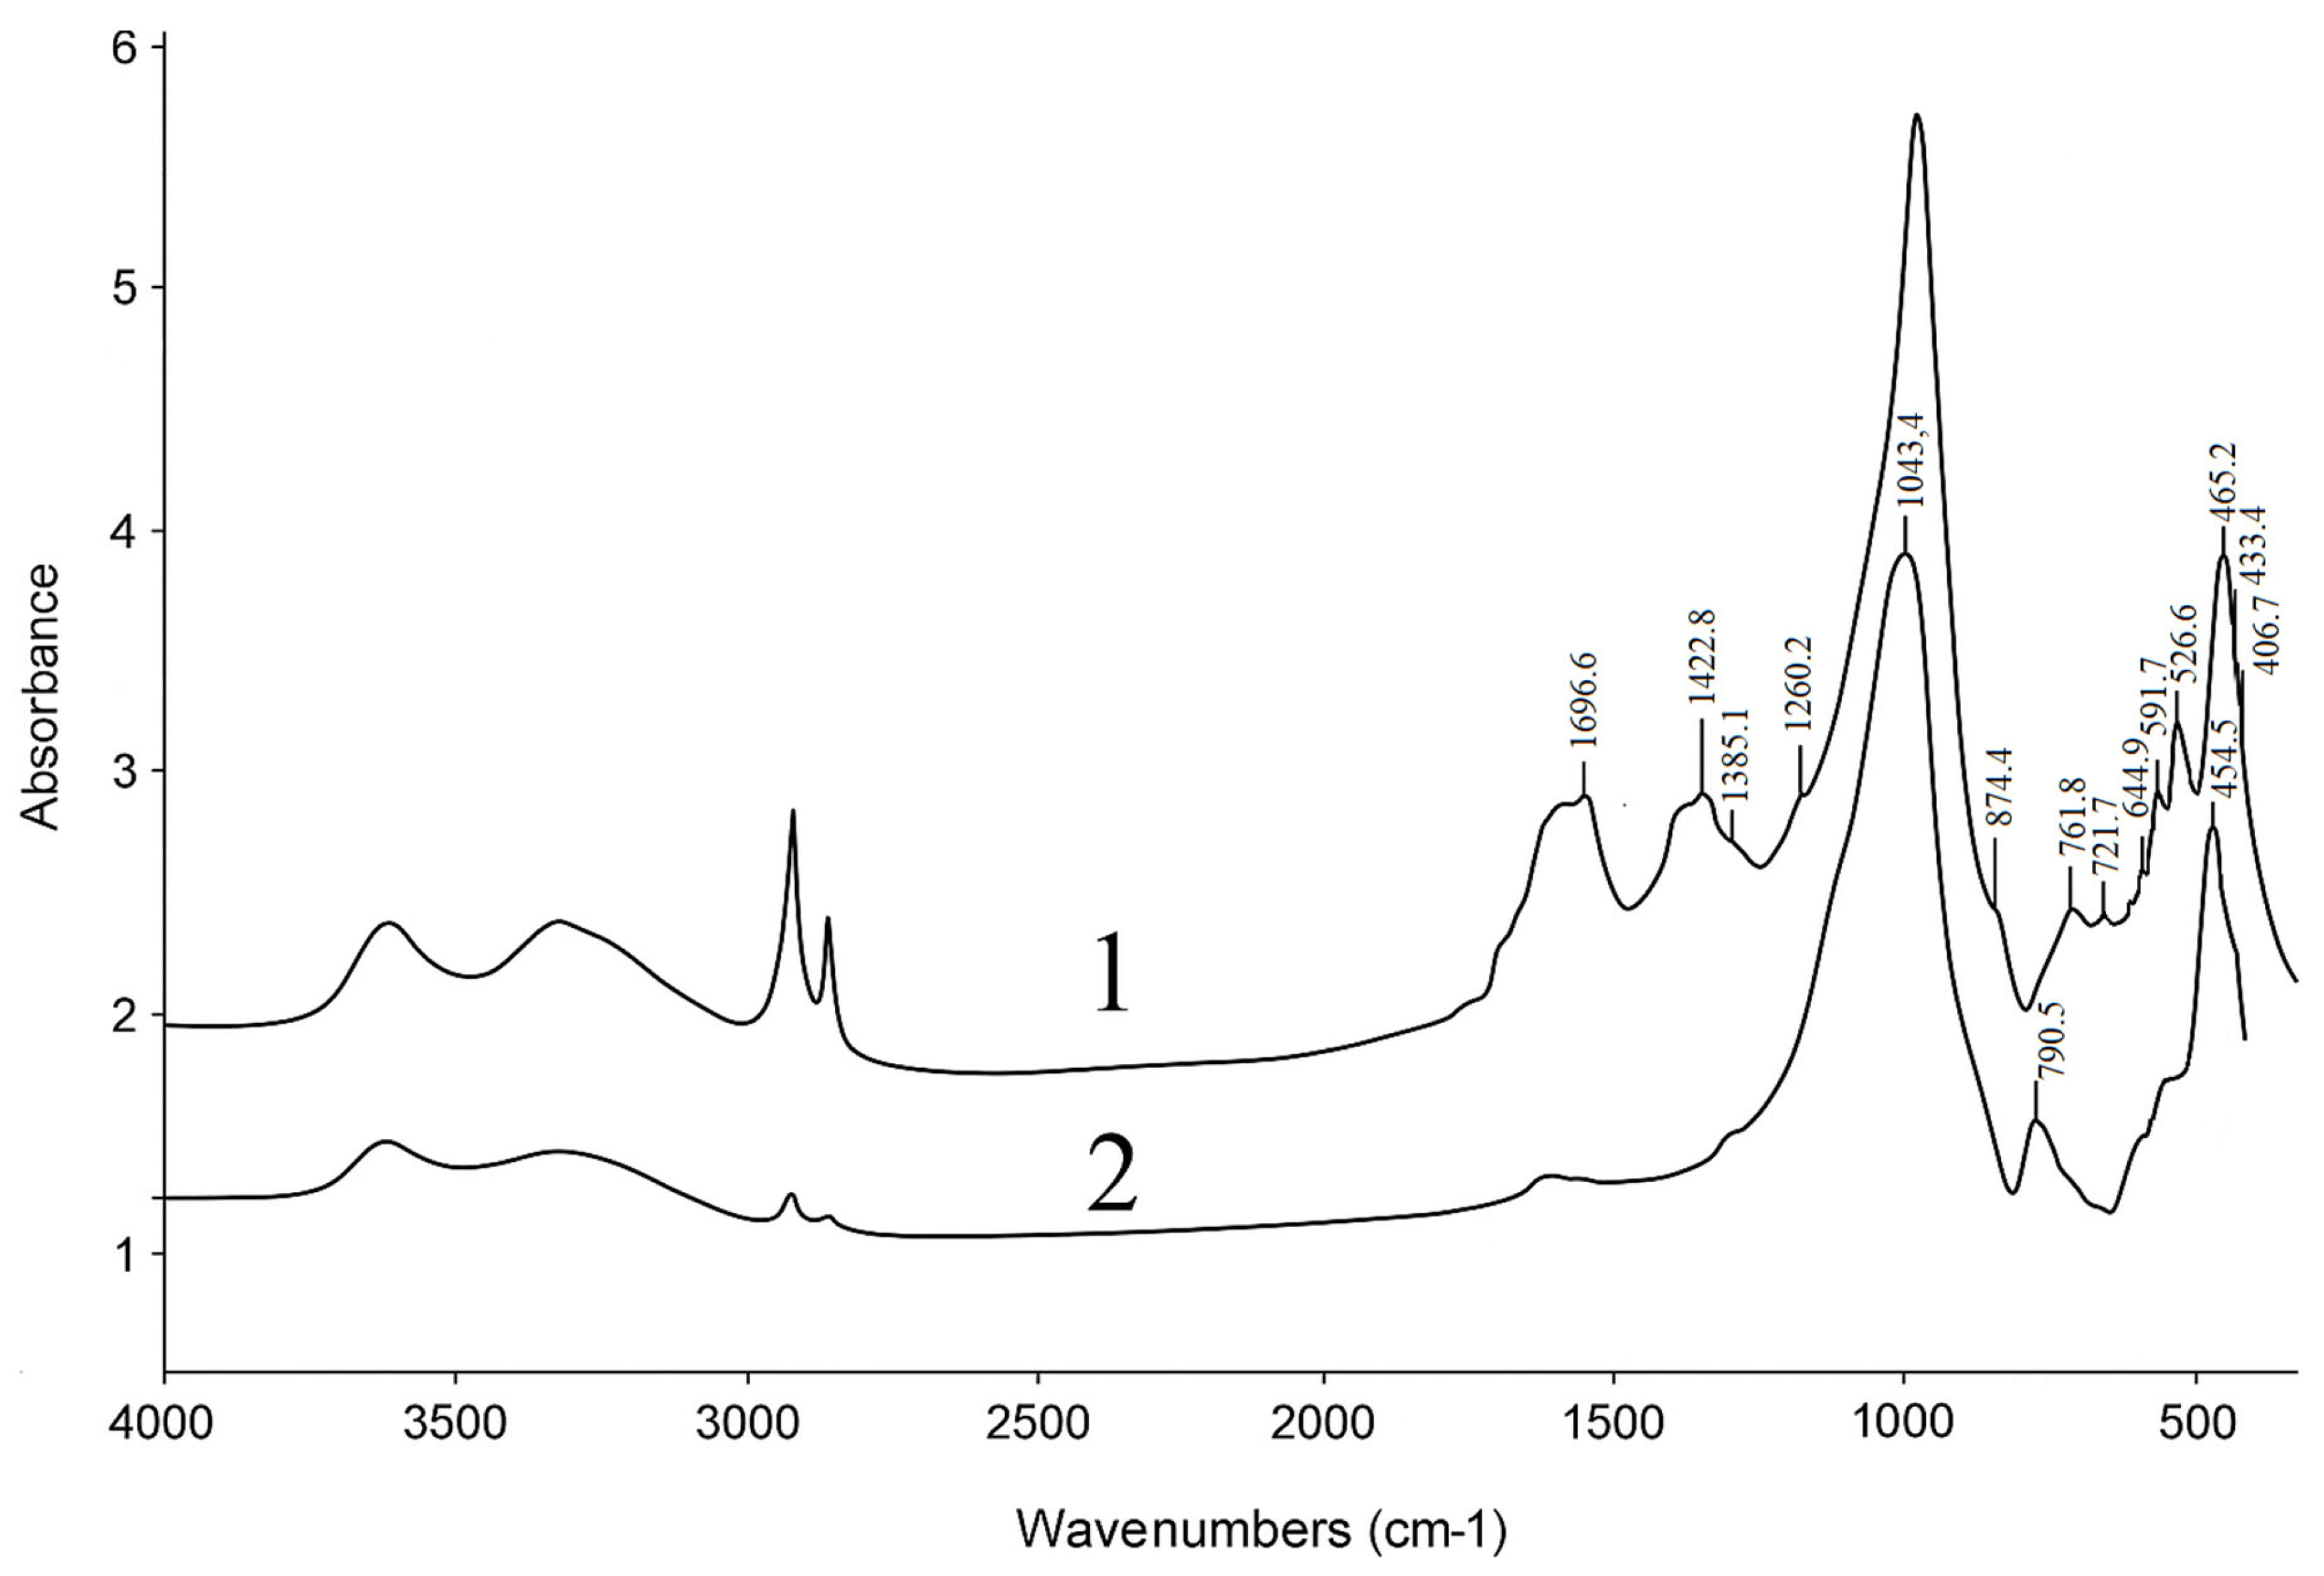
An analysis of the IR spectra has shown that the natural sample of the Shankanai clinoptilolite is characterized by the following absorption bands: 465, 615, 780, 1060, 1635, 3460 cm
−1 (
Figure 2, spectrum 1). These characteristic absorption bands are also present in the spectra of the acid-activated zeolite sample (
Figure 2, spectra 2). Here, the spectrum bands 465, 615, 780cm
−1 arise as a result of the internal and external vibrations of the aluminum-silicon-oxygen framework of the zeolite Si(Al). The highest intensity of the absorption band is observed in the frequency range of 1060–1080 cm
−1, which correspond to the stretching vibrations of the Al-O-Si and Si-O-Si bonds of the framework.
Table 3 presents the interpretation of the changes in the IR spectra of the natural zeolite samples. It is noted that in the spectra of the HCpt sample treated with 1.75 N HCl, the relative intensities of the absorption bands associated with the crystalline phases and their intra-tetrahedral vibrations, do not undergo any noticeable changes. These facts indicate the preservation of the original crystalline structure of the mineral. At the same time, a new absorption band appears in the region of 796 cm
−1, while an increase in the shoulder intensity in the region of 980 cm
−1 and a shift of the 1065 band to the region of 1095 cm
−1 are also visible. The appearance of a new absorption band at 796 cm
−1, corresponding to the stretching vibrations of the Si-O bond, indicates the formation of free silica and the release of aluminum into the exchange position [
7,
8,
9,
10,
11,
12,
13]. The absorption band in the region of 796 cm
−1 is attributed to the formation of the new Si-O-Si bonds upon the rupture of the Al-O-Si bonds. The observed shift of the band 1065 to 1095 cm
−1 is explained by the formation of the new Si-O-Si bonds due to the release of Al from the tetracoordinated position to the exchange positions [
9]. The relative intensities of the absorption bands at 440 and 1055 cm
−1, which are associated with intra-tetrahedral vibrations, do not undergo any changes, as they are characteristic of both crystalline and amorphous aluminosilicates.
Thus, the results of ICS support and confirm the conclusions of XRD regarding the preservation of the original crystal structure of the mineral after acid activation, despite some observed evidence of amorphization of the three-dimensional framework of clinoptilolite.
The total surface area of the original natural zeolite of the Shankanai field is 9.8 m
2/g (
Table 4). When decationizing the natural zeolite with 1.75 N hydrochloric acid, the specific surface area increases from 9.8 to 52.6 m
2/g. The pore volume increases during the modification from 1.76 × 10
−3 cm
3/g to 4.86 × 10
−3 cm
3/g. The distribution of pores on the surface of clinoptilolite shifts toward micropores—in other words, the micropores are predominantly found on the surface. With a general increase in the number and volume of pores of the modified natural zeolite, the average pore size decreases from 72.2 to 27.7 angstroms.
Thus, it is shown that acid treatment leads to an increase in the SiO2/Al2O3 ratio from 13.1 to 23.8 and an increase in the specific surface area from 9.8 to 52.6 m2/g while maintaining the crystallinity of the zeolite. This effect is explained by the preferential removal of extraframework aluminum and partial amorphization of surface layers, which is confirmed by a combination of XRD, IR spectroscopy, and BET methods. The obtained changes in the structure correlate with the change in the acidic properties of zeolite active centers.
In a sample of the acid-activated natural zeolite (HCpt), three types of acid centers are observed, differing in strength and concentration. The strength of the Brønsted acid centers (BC) can be determined from the magnitude of the shift in the valence vibrations of the OH groups (Δν
OHCO) in the presence of adsorbed CO. The greater the shift, the stronger the acid centers. The concentration of the BC and their strength, expressed through the magnitude of the absorption band shift are summarized in
Table 5.
The method for identifying acid centers on the surface of zeolite catalysts is based on the analysis of changes in the IR spectra during CO adsorption. Characteristic diagnostic absorption bands include a band at 3735 cm
−1 associated with silanol groups, a band at 3640 cm
−1 corresponding to CO complexes with silanol groups, and a range of 3260–3640 cm
−1 associated with hydrogen-bound CO complexes and OH groups. Characteristic changes are observed in the spectra: a decrease in the intensity of the initial absorption bands of OH groups, the appearance of new bands in the region of 3260–3640 cm
−1, and a shift in the position of existing absorption bands, which makes it possible to reliably identify various types of acid centers on the catalyst surface [
21,
22].
The high acidity of the HCpt-1 surface shown in
Table 5 is presumably due to its high value of silicate modulus (SiO
2/Al
2O
3 = 23.6). By modifying the surface of the natural zeolite by active components, highly effective catalysts for various hydrocarbon conversion processes can be developed. The choice of rhodium as an active component in this study is based on the results of our previous study, which showed that platinum metals deposited on the acid-activated natural zeolite exhibit the greatest activity in the process of APG dehydrogenation [
11].
2.3. Dehydrogenation of APG to Olefins on 1.0%Rh/HCpt-1 Catalyst
Table 6 presents the results of the conversion of APG to olefins over the base catalyst 1.0%Rh/HCpt-1 at different temperatures under various experimental modes.
The yields of olefins in the contact gas were estimated based on their total content, determined by bromine water [∑olefins by Br
2 (aq)], and determining the ethylene (C
2H
4) and propylene (C
3H
6) contents analyzed by gas chromatography.
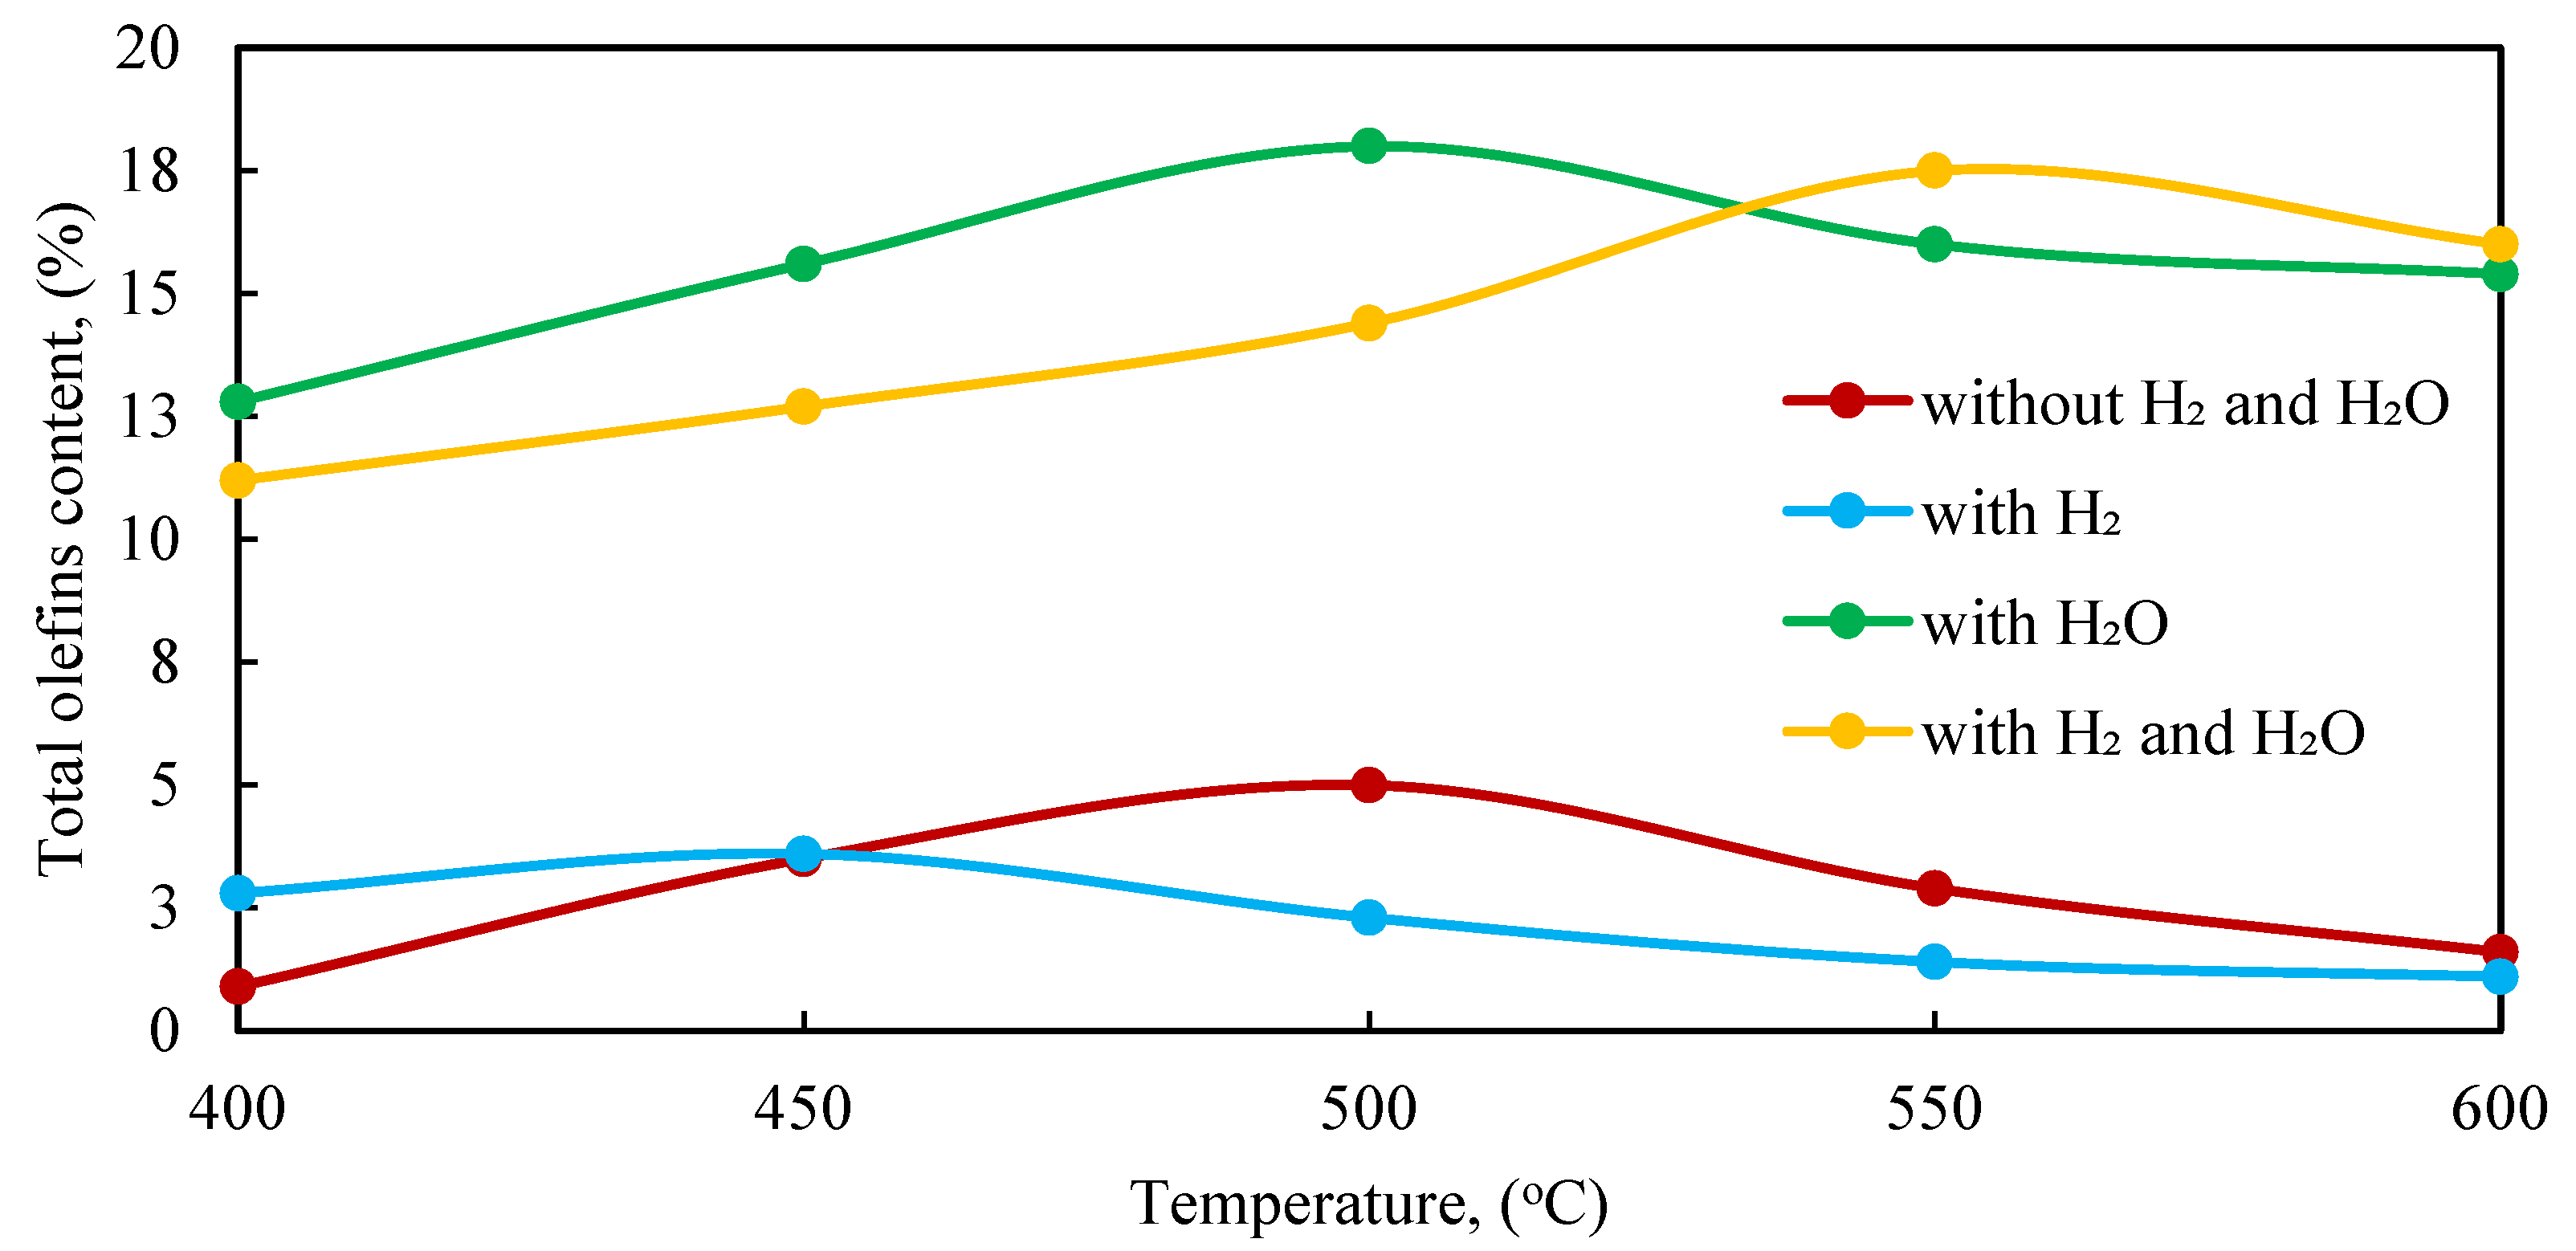
Figure 3 shows the effect of temperature on the catalytic conversion of APG to olefin hydrocarbons over the 1.0% Rh/HCpt-1 catalyst under different experimental conditions.
It can be seen that, in the absence of hydrogen and water vapor (no H2 and H2O), the yield of olefins remains low, reaching the maximum value of ≈5.0% at 450 °C, after which it decreases and stabilizes below 2.0% at temperatures above 600 °C. This may be due to the prevalence of the deep thermal destruction processes and secondary transformations, leading to the formation of saturated hydrocarbons and coke. The introduction of hydrogen (H2) significantly improves the formation of olefins, although, at temperatures above 450 °C, saturation with the formation of alkanes is observed. The addition of water vapor (H2O) significantly increases the olefin content in the contact gas. The maximum yield of 18.0% is recorded at a temperature of 500 °C, which can be explained by the intensification of the steam reforming processes and the suppression of undesirable side reactions. With a further increase in the temperature up to 600 °C, the olefin content decreases to 15.4%, which indicates the possibility of secondary transformation. The combined introduction of hydrogen and water vapor (H2, H2O) also results in a high yield of olefins, but the maximum values are achieved at a higher temperature (550 °C—17.5%). This confirms the hypothesis about the competitive effect of hydrogen, which promotes the hydrogenation of olefins.
The highest olefin content in the contact gas is observed at 500 °C in the mode with water vapor only, without hydrogen. This mode ensures a consistently high concentration of olefins due to the directed course of the steam-cracking reactions and the minimization of the saturation processes. At the temperatures above 550 °C, the intensity of the secondary reactions increases, which leads to a decrease in the proportion of olefin compounds, probably as a result of their hydrogenation or further decomposition.
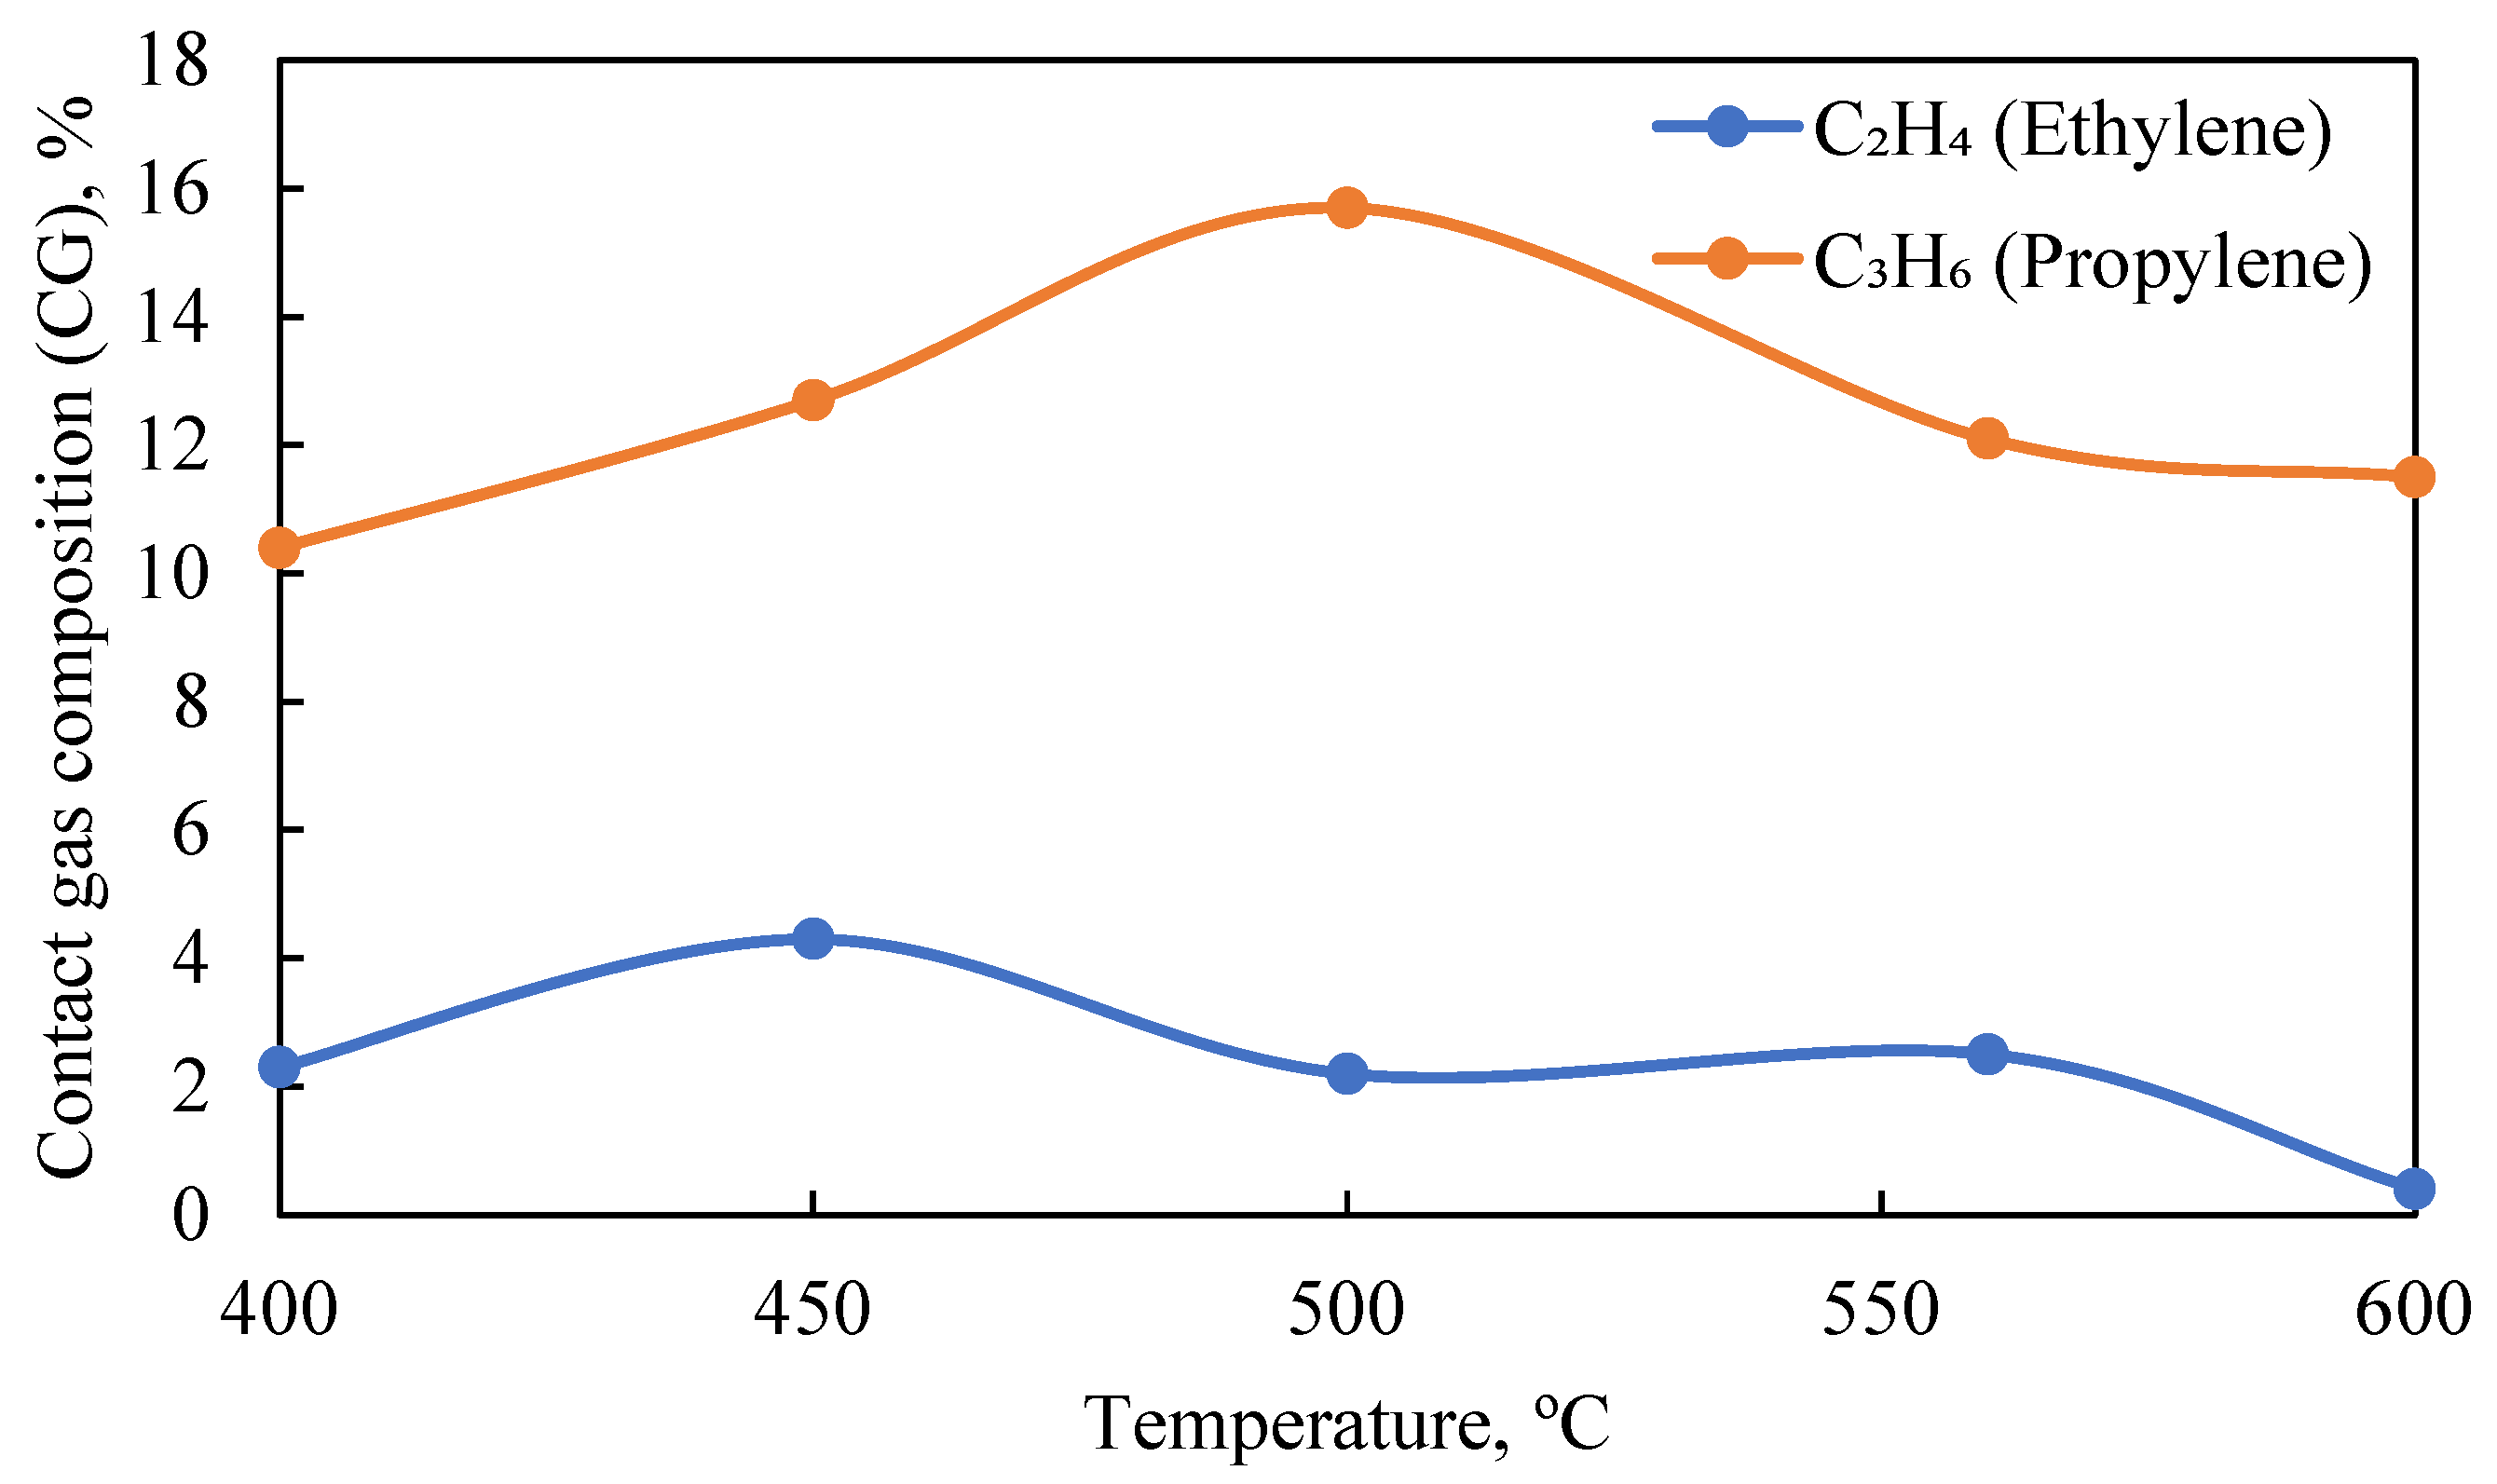
Thus, to increase the efficiency of olefin production from APG, it is advisable to use the conditions of supplying water vapor at 500–550 °C, which ensures the highest yield of the target products. This conclusion is confirmed by the results of the gas chromatography (GC) analysis of the content of ethylene (C
2H
4) and propylene (C
3H
6) in the contact gas, depending on the temperature as shown in
Figure 4.
In
Table 7 and
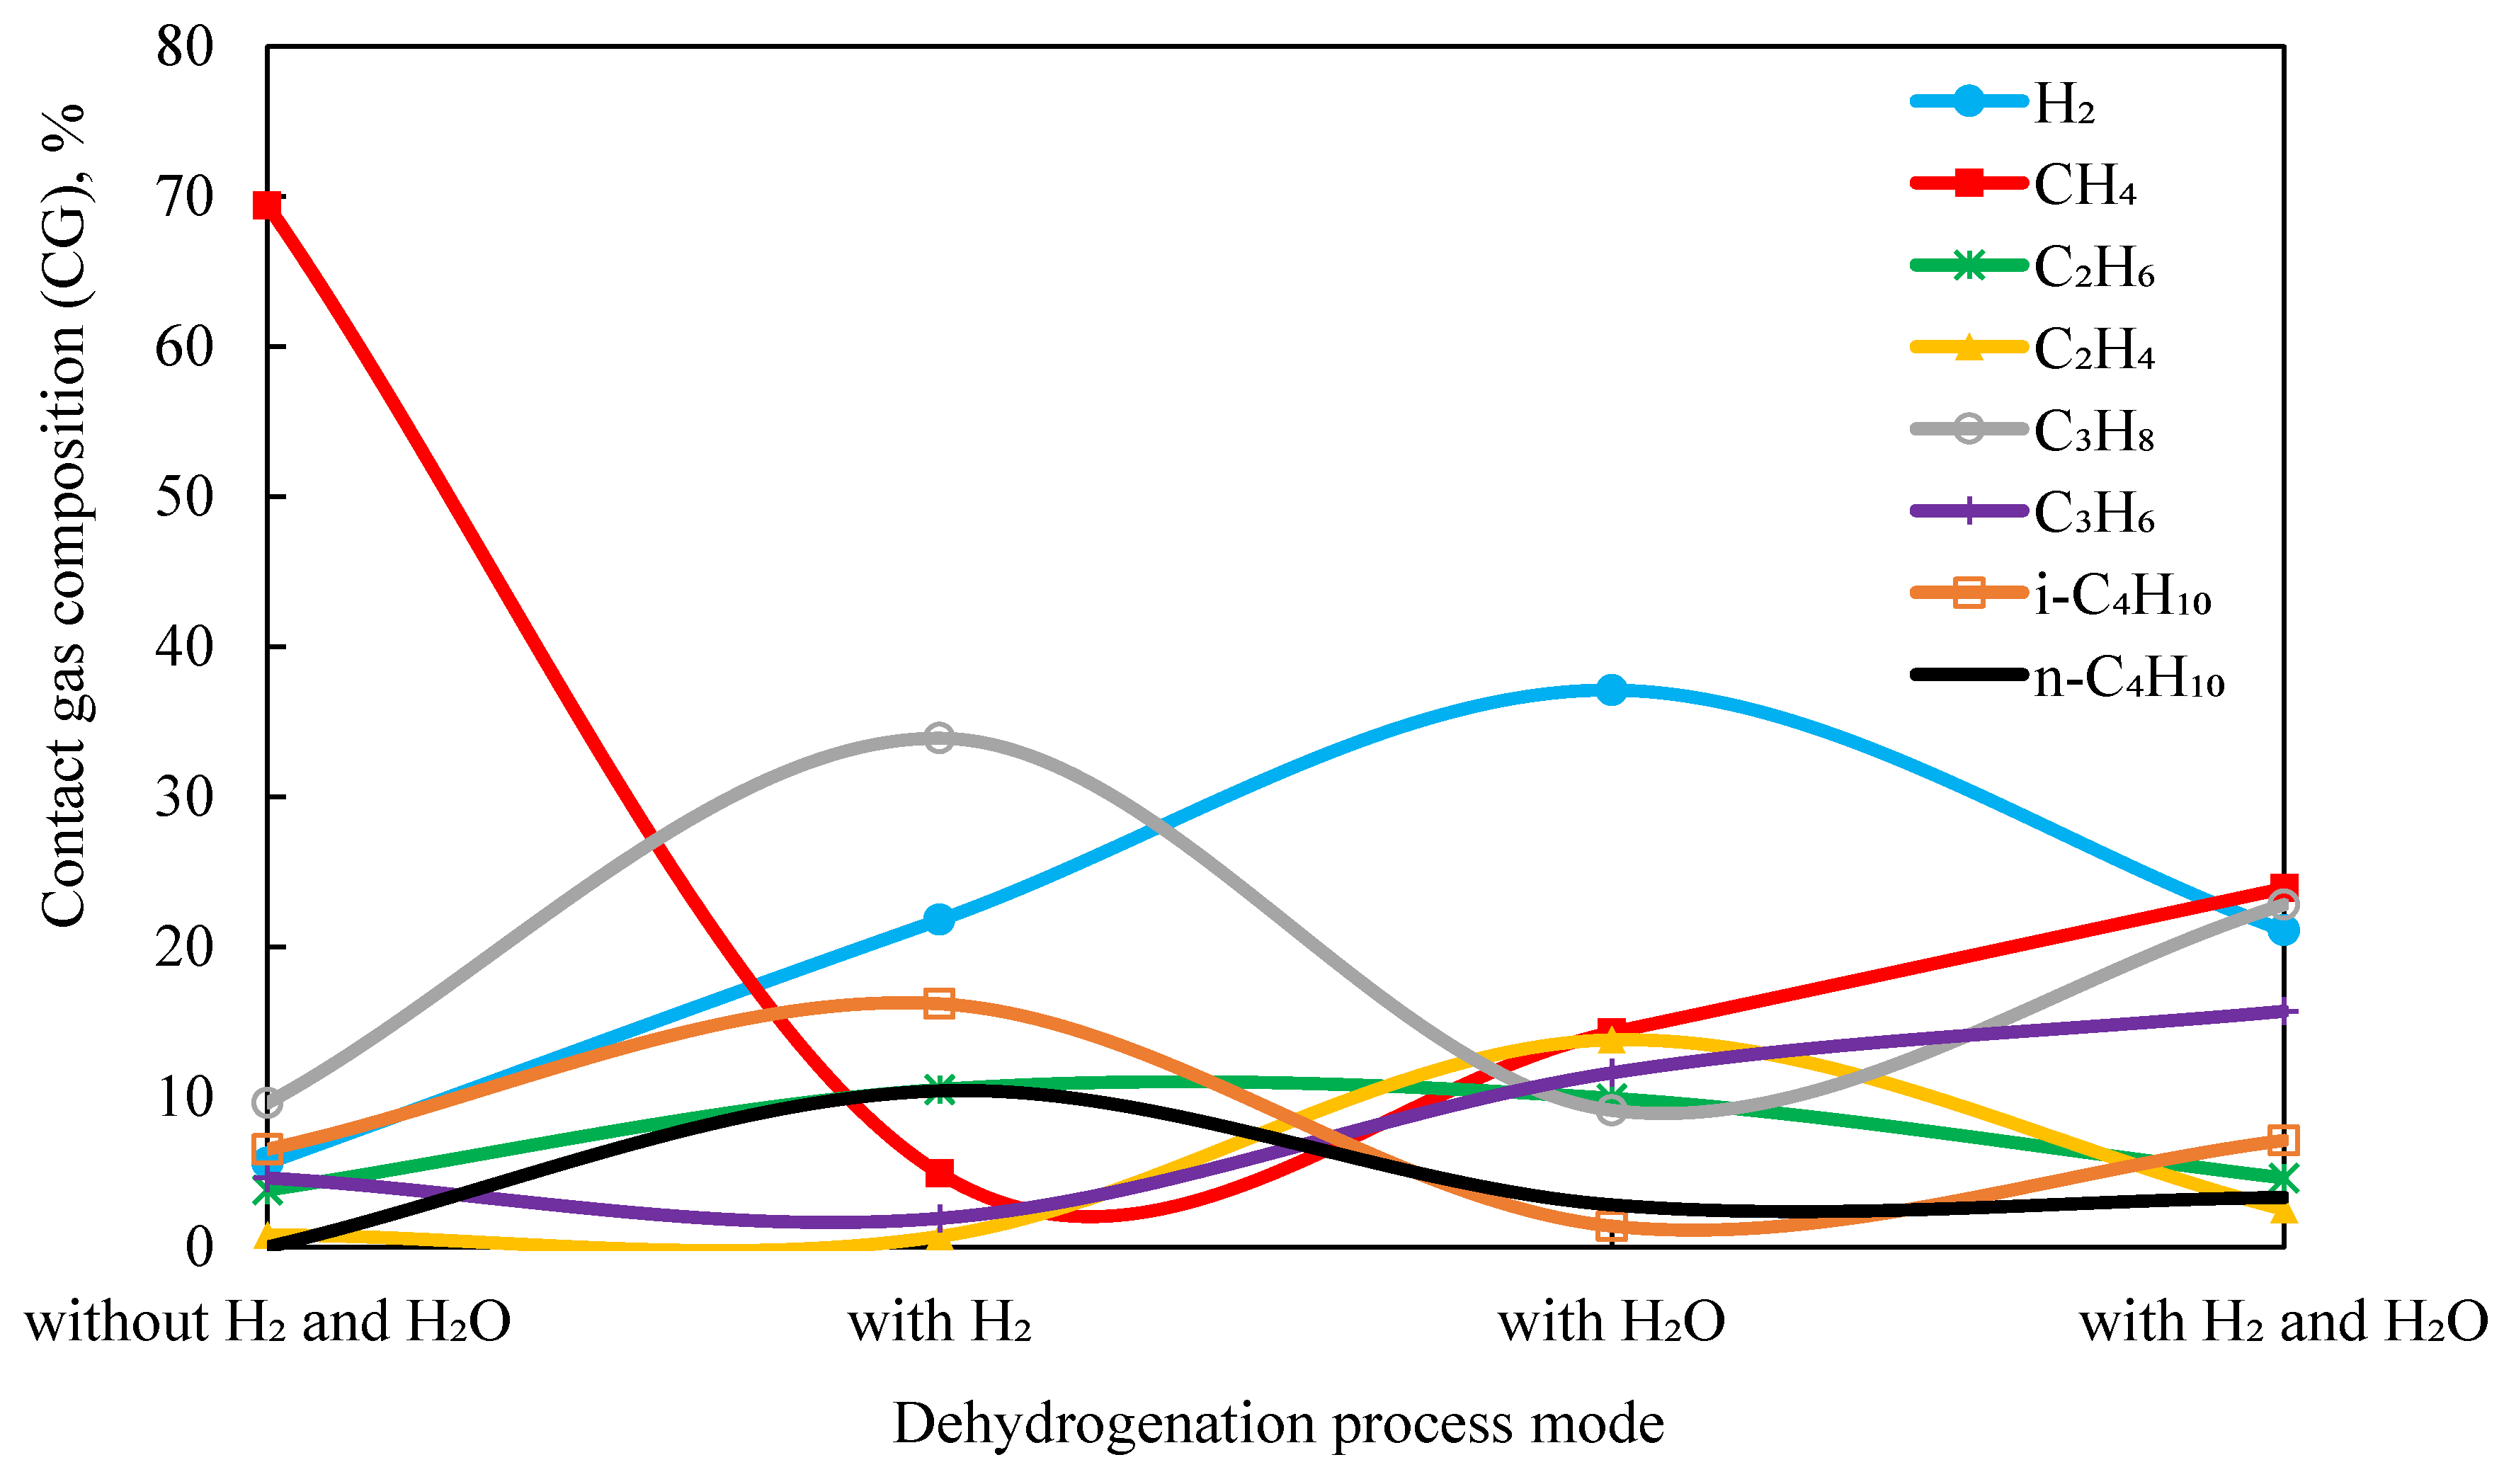
Figure 5, the changes in the composition of the contact gas (according to GC analysis) are shown for the dehydrogenation of APG over the 1.0%Rh/HCpt-1 catalyst at 500 °C, where the maximum olefin yield was recorded under different dehydrogenation modes.
By analyzing the graph of the change in the composition of the contact gas (CG) under different dehydrogenation modes, several trends in the composition of the APG can be identified during its conversion over the 1.0%Rh/HCpt-1 catalyst at 500 °C.
The main trend is the conversion of the saturated hydrocarbons (C2H6, C3H3, C4H10) into the corresponding olefins (C2H4, C3H6) with the release of hydrogen. Hydrogen is the main byproduct of the dehydrogenation process.
The introduction of hydrogen (H2) suppresses the dehydrogenation processes, increasing the content of the saturated hydrocarbons (C2H6, C3H8, C4H10), and reducing the number of olefins.
In the dehydrogenation of APG on the catalyst with 1.0% rhodium (Rh) on the acid-activated carrier (HCpt-1) at the temperature of 500 °C, a significant increase in the yield of olefins is observed when using water vapor or its combined presence with hydrogen. The results show that the addition of water vapor (H2O) promotes the dehydrogenation process, increasing the concentration of olefins (C2H4, C3H6). A significant increase in the concentration of olefins (C2H4—13.8%, C3H6—11.6%), as well as a significant decrease in saturated hydrocarbons (C2H6—9.9%, C3H8—9.1%) are observed in the composition of the contact gas.
The combined presence of H
2 and H
2O leads to the competing effects: some olefins are dehydrogenated, but hydrogen also promotes their hydrogenation back into alkanes. The olefin content (C
2H
4—2.5%, C
3H
6—15.7%) remains high, but slightly lower than their contents at the absence of H
2. The combined presence of H
2 and H
2O also promotes dehydrogenation, but due to the presence of H
2, the dehydrogenation process is partially inhibited (compared to pure H
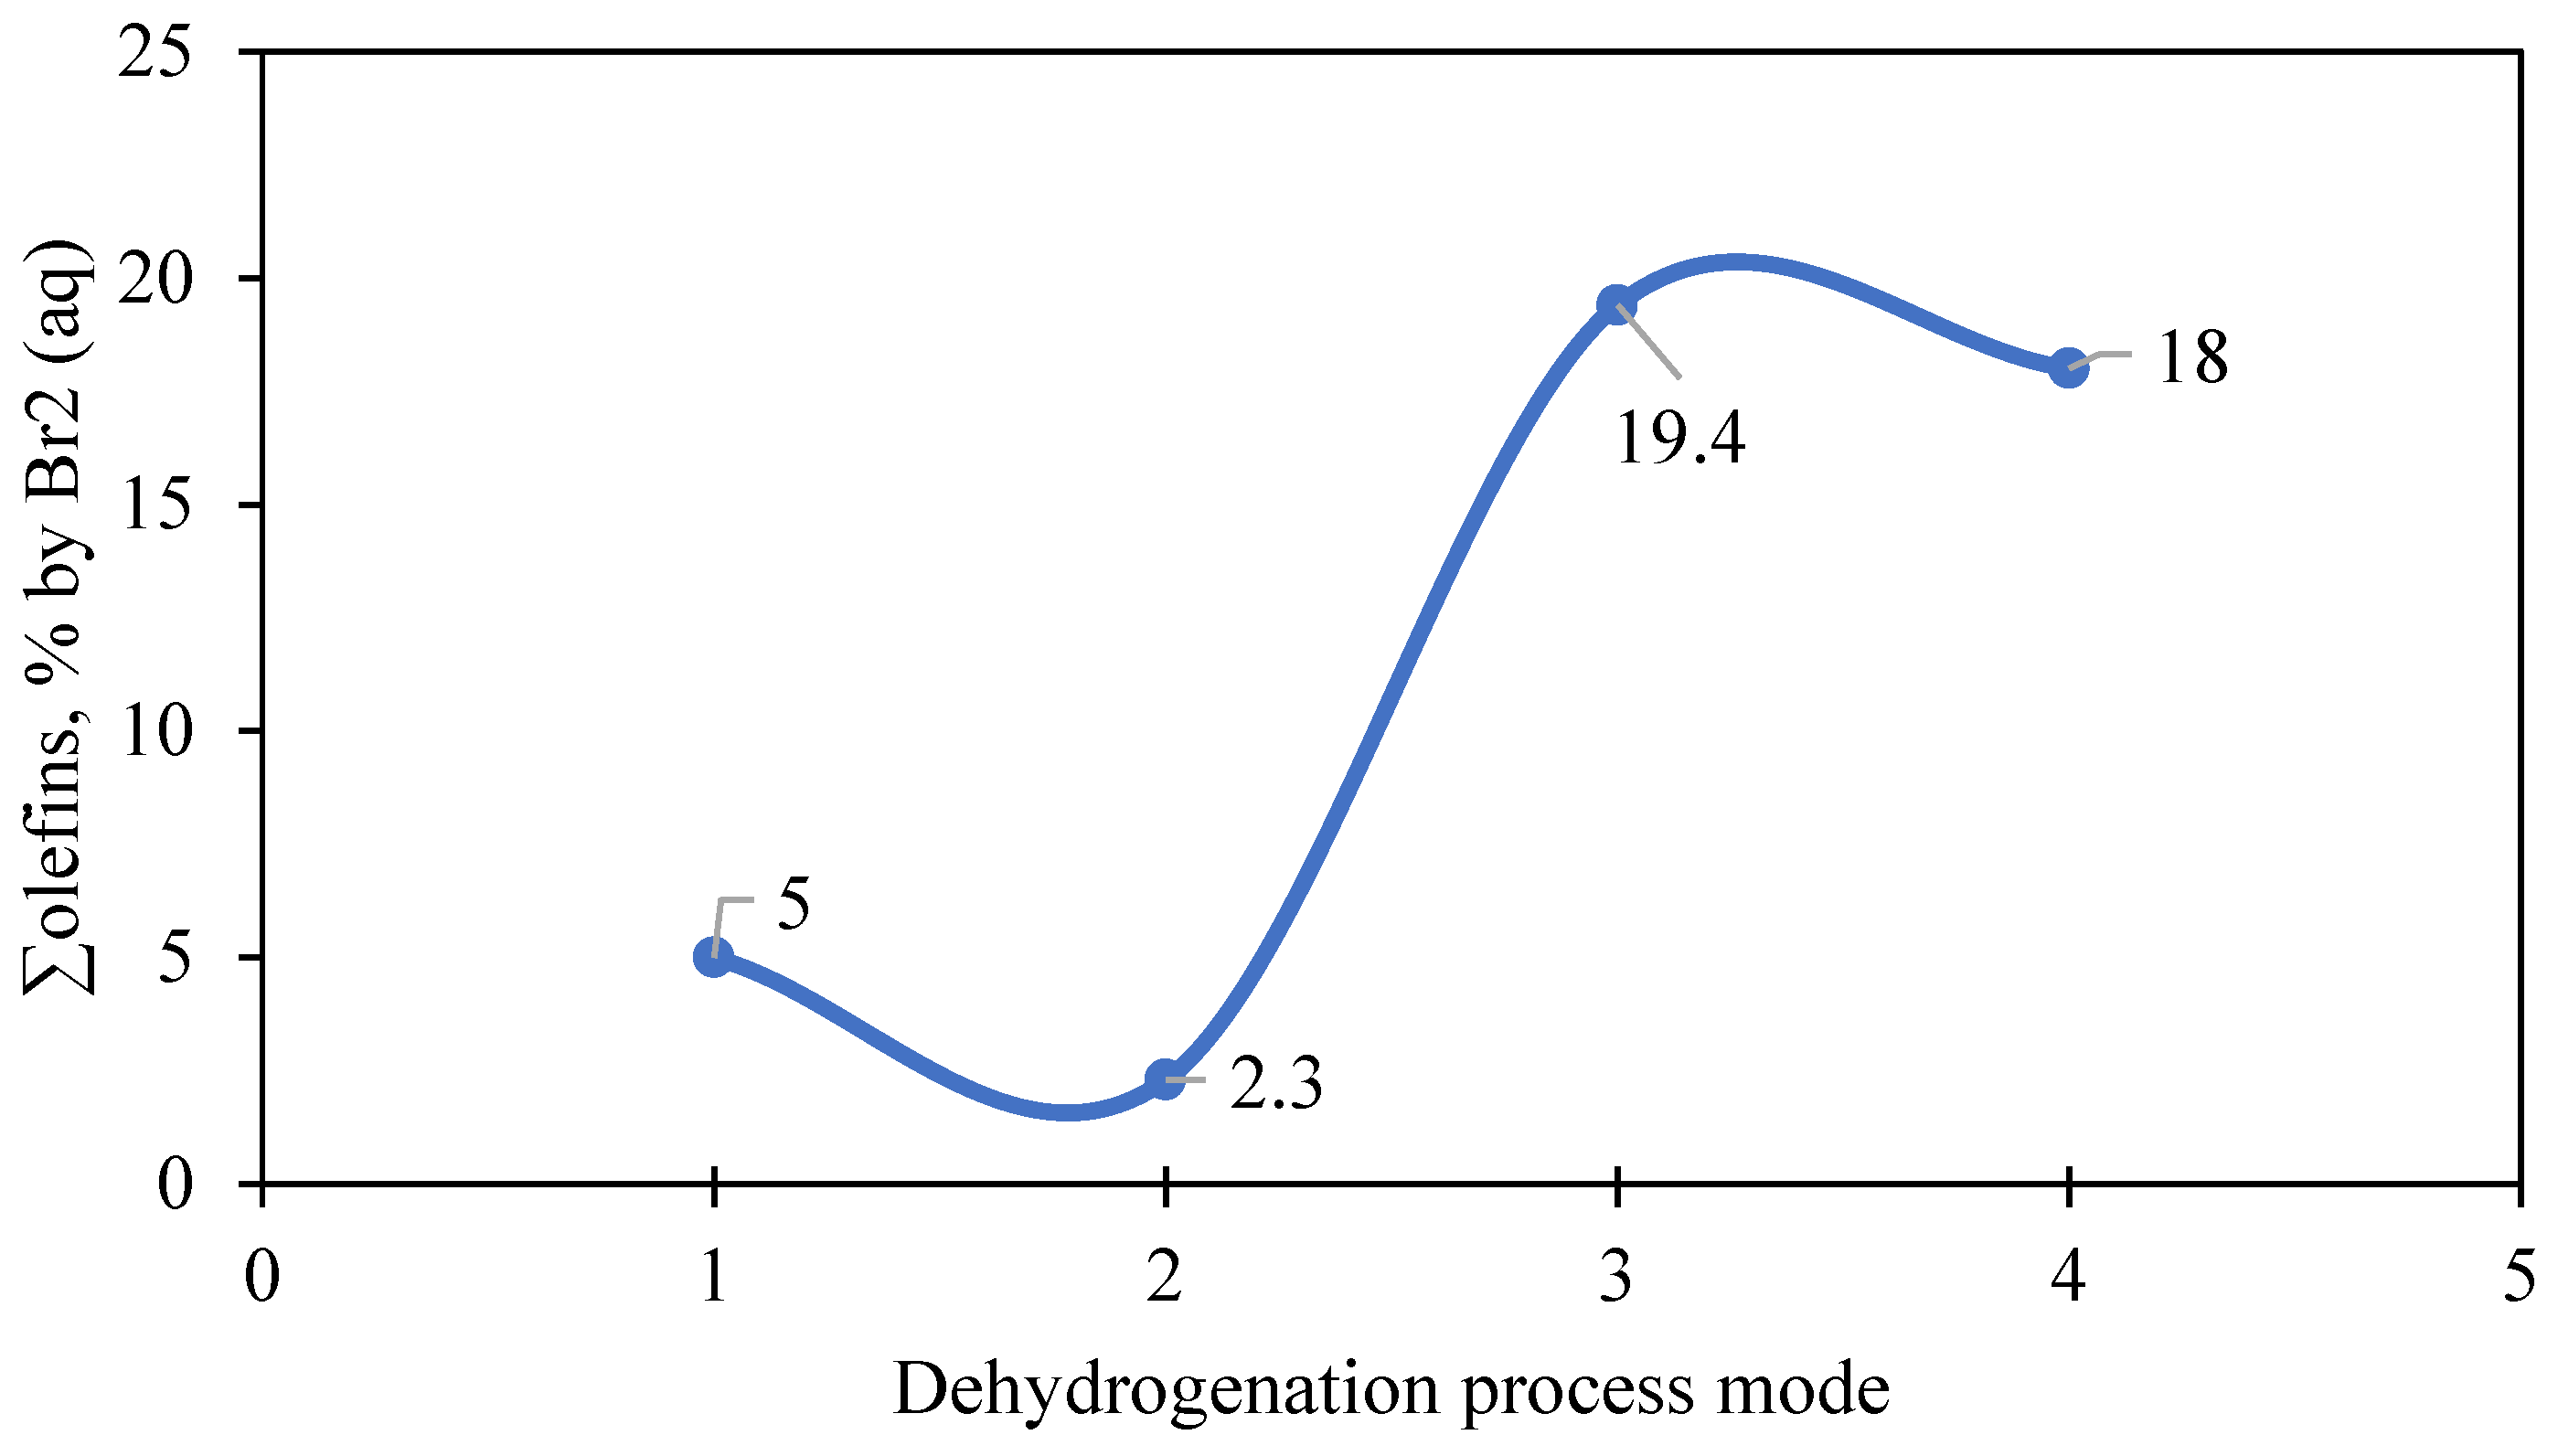
2O). Thus, the optimal conditions for obtaining olefins are a high concentration of water vapor and minimization of the presence of hydrogen. This is also evidenced by the analysis of the change in the total olefin content [∑olefins by Br
2 (aq)] of the contact gas under different dehydrogenation modes (
Figure 6) at 500 °C. It clearly confirms that (a) the lowest yield of olefins is observed in the presence of H
2 (2.3%); (b) the maximum yield is achieved in the presence of H
2O only (19.4%); (c) the combined presence of H
2 and H
2O slightly reduces the yield (18.0%), but remains close to optimal; and (d) without additives (H
2 and H
2O), the yield of olefins is minimal (5.0%).
Table 8 shows the results of a study on the effect of the APG feed rate on the yield of olefins during the dehydrogenation of APG to contact gas using the 1.0%Rh/HCpt-1 catalyst at 500 °C (maximum olefin yield) and a constant water vapor feed rate of 622 h
−1.
It should be noted that the dependence of the olefin yield on the feed volumetric velocity (GHSV) shows the change in olefin yield with a change in GHSV. The dependence of the olefin yield on the contact time (τ) reflects the effect of contact time on the yield of the target product. The dependence of the olefin yield on the specific contact velocity (W) demonstrates the effect of the feedstock feed rate. Plotting a graph of the total olefin yield versus the GHSV allows visualization of this dependence and determination of the optimal conditions for the process.
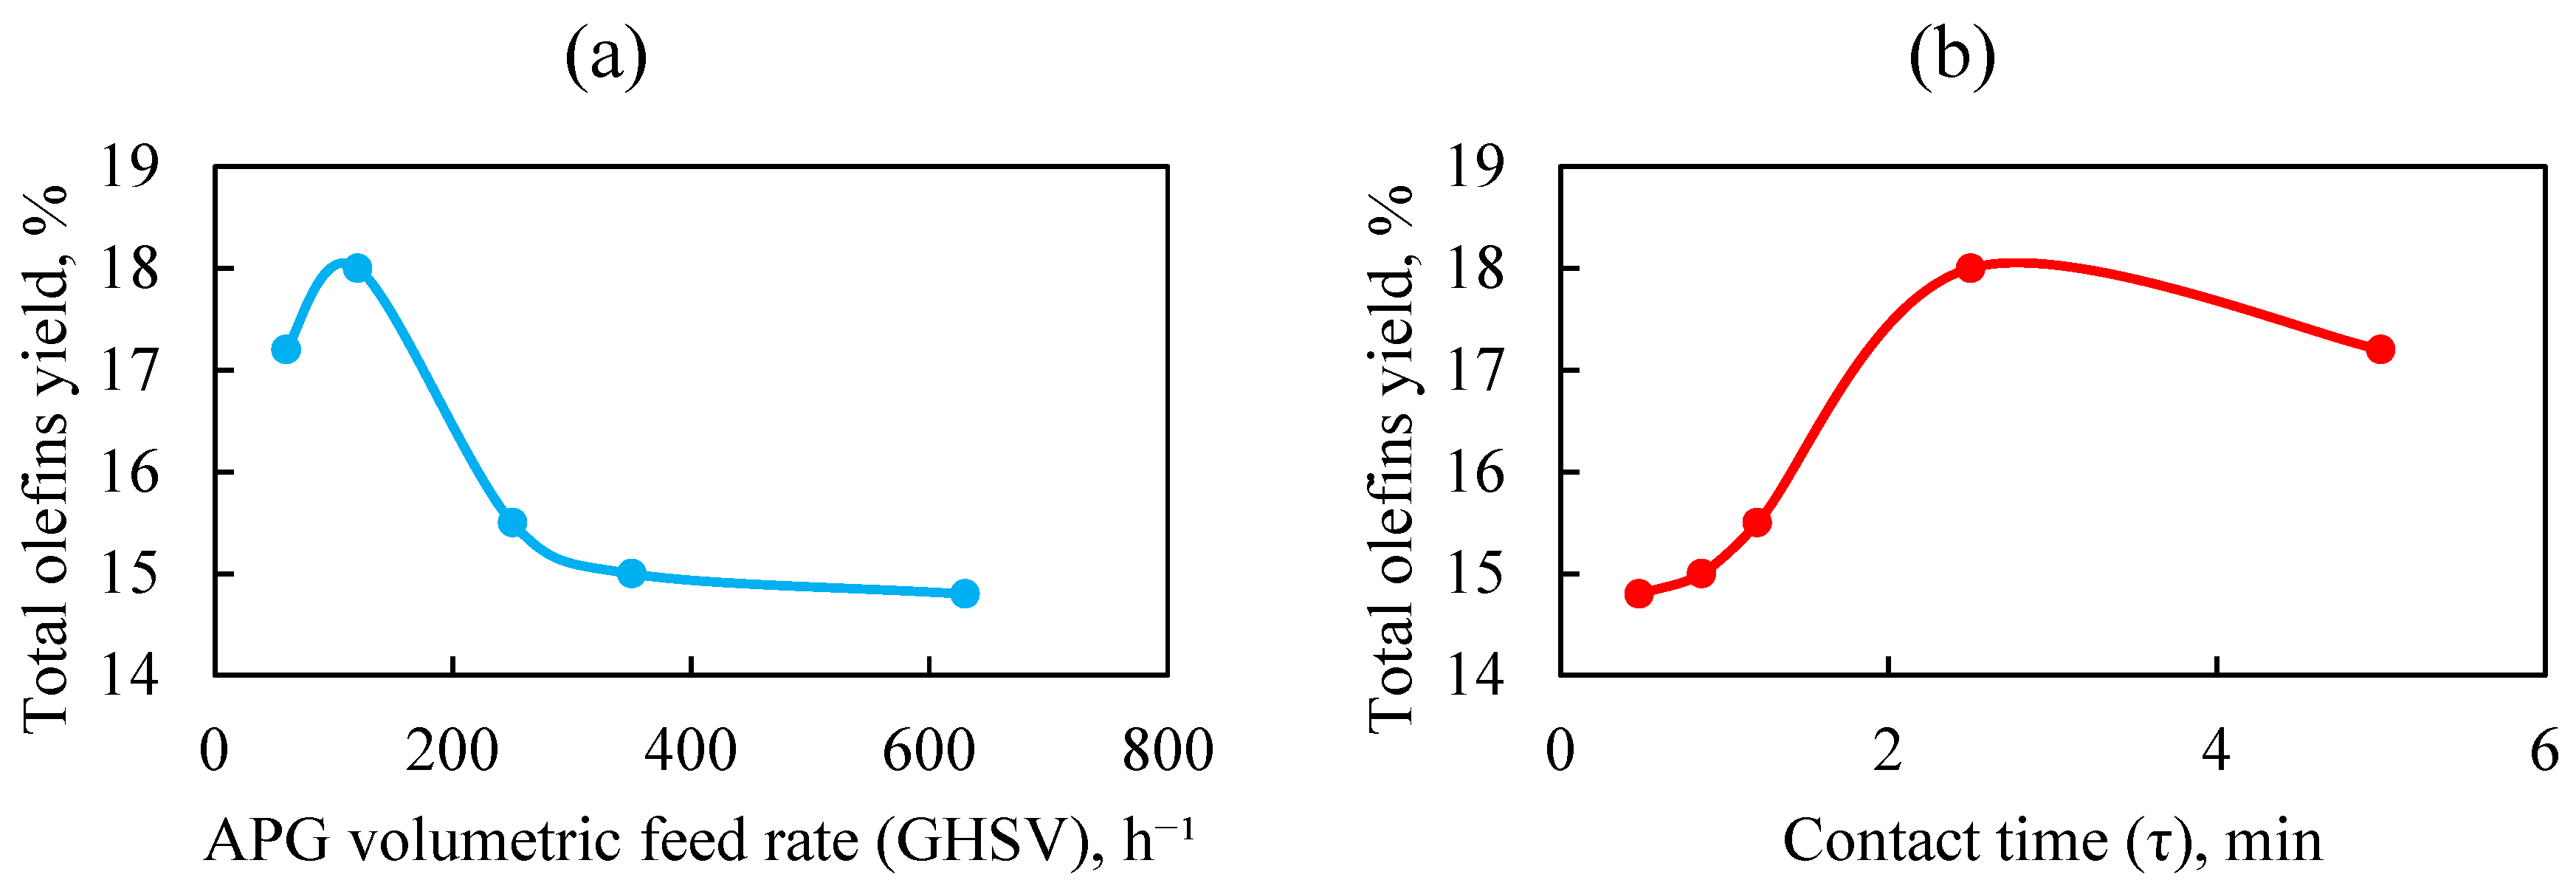
Figure 7 depicts the dependence of the total olefin yield on the associated petroleum gas (APG) feed volumetric velocity and on the contact time, for the dehydrogenation of APG to CG on a 1.0%Rh/HCpt catalyst at 500 °C and a steam feed volumetric velocity of 622 h
−1.
It is evident from
Figure 7 that with an increase in the space velocity of the APG feed (a decrease in contact time), a decrease in the total yield of olefins is observed. The maximum yield of olefins (18.0%) is achieved at GHSV = 120 h
−1 (τ = 2.5 min), which is the optimal contact time between the feedstock and the catalyst. At low feed rates (60 h
−1), the contact time is too long, leading to side reactions (cracking, condensation). At high feed rates (250–630 h
−1), the contact time decreases and reduces the efficiency of the dehydrogenation significantly. This is consistent with the principles of chemical kinetics, where the reaction rate depends on the interaction time between the reagents and the active centers of the catalyst. However, at GHSV ≥ 250 h
−1, stabilization of the olefin yield occurs and the olefin yield remains at the level of 14.8–15.5%. This indicates the catalyst’s resistance to deactivation even at high loads.
The high stability of the 1.0% Rh/HCpt-1 catalyst is confirmed by data on the effect of process duration on olefin yield during the dehydration of APG in the presence of water vapor at the optimum temperature (
Figure 8). It can be seen that, with an increase in reaction time from 10 to 150 min at the APG feed rate of 60–1200 h
−1, and without catalyst regeneration, its activity at a constant water vapor feed rate (622 h
–1) remains at the achieved level and the total olefin yield fluctuates only in the range of 15–19%.
An analysis of the dependence of the composition of the contact gas during the processing of APG in the presence of water vapor on the temperature, volumetric gas feed rate, contact time and duration of experiments demonstrates the complex but positive nature of the effect of water on the yield of olefins.
2.4. Effect of Water in the Dehydrogenation of APG
The effect of water on the dehydrogenation of APG to the contact gas can be explained by a complex of interrelated factors, which suppress side reactions (e.g., cracking, isomerization and condensation of olefins) and contribute to an increase in the yield of the target products, in particular:
Blocking of acid sites. Water actively participates in the adsorption processes on the catalyst surface, blocking the acid sites of the zeolite (e.g., the H+ protons or Al-O-Si aluminosilicate groups). This mechanism reduces the availability of the acid sites for the reagents, which significantly affects the course of the reactions, suppressing side reactions and promoting the reactions for the conversion of APG to olefins.
For example, olefin condensation,
Requires the activation of molecules at the acid sites to form carbocations (R+), which are the key intermediates. Blocking these sites effectively suppresses the condensation reaction, preventing the formation of heavy hydrocarbons. Besides, the isomerization of alkanes,
In addition, isomerization of alkanes,
Also depends on the acid sites. Water, by blocking these sites, reduces the probability of secondary isomerization reactions, which contributes to an increase in the yield of the target olefins.
Thus, blocking the acid sites with water simultaneously suppresses both the condensation and isomerization reactions, optimizing the reaction direction toward the dehydrogenation.
Shifting the equilibrium due to dilution of the reaction mixture. Adding water dilutes the reaction mixture, which reduces the local concentration of the reagents and reduces the frequency of collisions between the molecules. This phenomenon plays a key role in controlling the rate of side reactions (condensation and cracking), since the mutual influence of the components can significantly complicate the process control.
Dilution also reduces the probability of the isomerization of alkanes, since these reactions require a higher local concentration of the reagents. As a result, the main reaction, the dehydrogenation of alkanes to olefins, predominates.
Thermodynamic effect. According to the Le Chatelier’s principle, the addition of water reduces the partial pressure of the reactants in the system. This shifts the thermodynamic equilibrium of the endothermic reactions of ethane and propane dehydrogenation toward the formation of olefins.
The thermodynamic effect of water is manifested in an increase in the yield of the target products and the suppression of undesirable side reactions, such as cracking and condensation reactions, which makes the addition of water especially effective for increasing the selectivity of the process and minimizing the loss of the valuable raw materials.
Cracking suppression. Cracking of heavy alkanes (for example, butane or isobutane) can lead to the formation of light alkanes (methane, ethane) and olefins, which reduces the selectivity toward the target products. Introduction of water reduces the availability of the acid sites, which activate the alkane molecules for cracking, thereby suppressing this process. Reducing the number of cracking byproducts (e.g., methane and ethane) allows increasing the selectivity toward ethylene and propylene, which is the key task in developing efficient technologies for processing gas mixtures.
Isomerization suppression. The isomerization of alkanes, for example,
is a side process, which reduces the yield of the target olefins. The addition of water to the APG feed for its conversion to the contact gas on the catalyst, blocks the acid sites necessary for the isomerization, and dilutes the reaction mixture, reducing the likelihood of interaction between the molecules. The dual action of water significantly reduces the isomerization rate.
Isomerization suppression is particularly important for increasing the yields of ethylene and propylene, as these olefins are the main target products of the process. Optimization of olefin yields is achieved by minimizing side reactions, making the addition of water to the reaction mixture an important process control tool.
Catalyst stabilization. The presence of water in the system prevents coking of the catalyst surface, which extends its service life. Water is adsorbed on the catalyst surface, preventing the deposition of carbon compounds which can block the active centers and reduce the catalytic activity.
The catalyst stabilization is especially important during a long-term operation at the high temperatures and complex multicomponent mixtures. Maintaining the catalyst activity even after a long period of operation allows minimizing the costs of regeneration or replacement of the catalyst, which makes the process economically viable and advantageous.
It is important to note that water also does not participate in the reaction of the conversion of light alkanes, as evidenced by the absence of the oxygen-containing compounds in the reaction products. However, it actively participates in the adsorption process which leads to a nonequilibrium process. Considering the problems of adsorption and catalysis from a coordination position, then during adsorption, water can cause a “ligand effect”, exerting a modifying effect on the coordination center (active center). Thus, the combination of all the above factors demonstrates the complex positive effect of water on the process of alkane dehydrogenation. Blocking of the acid sites, equilibrium shift, thermodynamic effect, suppression of cracking and isomerization, as well as stabilization of the catalyst create the conditions for achieving a high yield of the target olefins.
2.5. The Effect of the Tin and Potassium Modified Forms of 1%Rh/HCpt-1 Catalyst on the Yield of Olefins in APG Processing
Studies have shown that the use of 1%Rh/HCpt-1 catalyst in the process of dehydrogenation of light alkanes of associated petroleum gas (APG) in a reducing medium provides moderate selectivity for olefins [
9,
10,
11,
12,
13,
14,
15,
16,
17,
18,
19,
20,
21,
22,
23]. The presence of water partially suppresses side reactions, but the decrease in catalytic activity and stability of the catalyst during operation indicates the need for its modification.
Based on the analysis of our own data on the dehydrogenation of a mixture of light alkanes on the basic catalyst 1%Rh/HCpt-1, as well as modern scientific and patent literature, new catalysts were developed: 1%Rh/10%SnO/HCpt-1 and 1%Rh/10%SnO/5%K
2O/HCpt-1 [
13,
24,
25,
26,
27,
28,
29].
The introduction of tin into the catalyst composition (1%Rh/10%SnO/HCpt-1) is aimed at increasing the dispersibility of rhodium particles and reducing the coking rate. Tin acts as a structural activator, preventing the aggregation of active centers and increasing the stability of the catalyst at high temperatures [
11,
25,
26,
30]. The local interaction between Sn and Rh changes the electronic properties of rhodium, which contributes to the selectivity of olefin formation [
25,
26,
30].
The additional introduction of potassium to the already existing Rh-Sn bimetallic system (1%Rh/10%SnO/5%K
2O/HCpt-1) enhances this effect by neutralizing acid centers on the zeolite surface, which reduces side reactions such as cracking and hydrocarbon polymerization [
27,
28,
29,
30,
31]. K
+ cations modify the surface properties of the carrier, reducing the strength of acid centers and promoting the formation of more selective active centers [
7,
25,
26,
27,
29].
Thus, modification of the 1%Rh/HCpt-1 catalyst with tin and potassium compounds represents a targeted approach to optimize the catalytic system. This is intended to increase the selectivity of the dehydrogenation process, reduce the intensity of side reactions and improve the stability of the catalyst during long-term operation. It should be noted that despite significant progress in studying the mechanisms of action of promoters, further studies are required for a detailed understanding of their effect on reaction kinetics [
30].
Experimental studies on olefin yields during APG dehydrogenation over the catalysts 1%Rh/HCpt-1, 1%Rh/10%SnO/HCpt-1, and 1%Rh/10%SnO/5%K
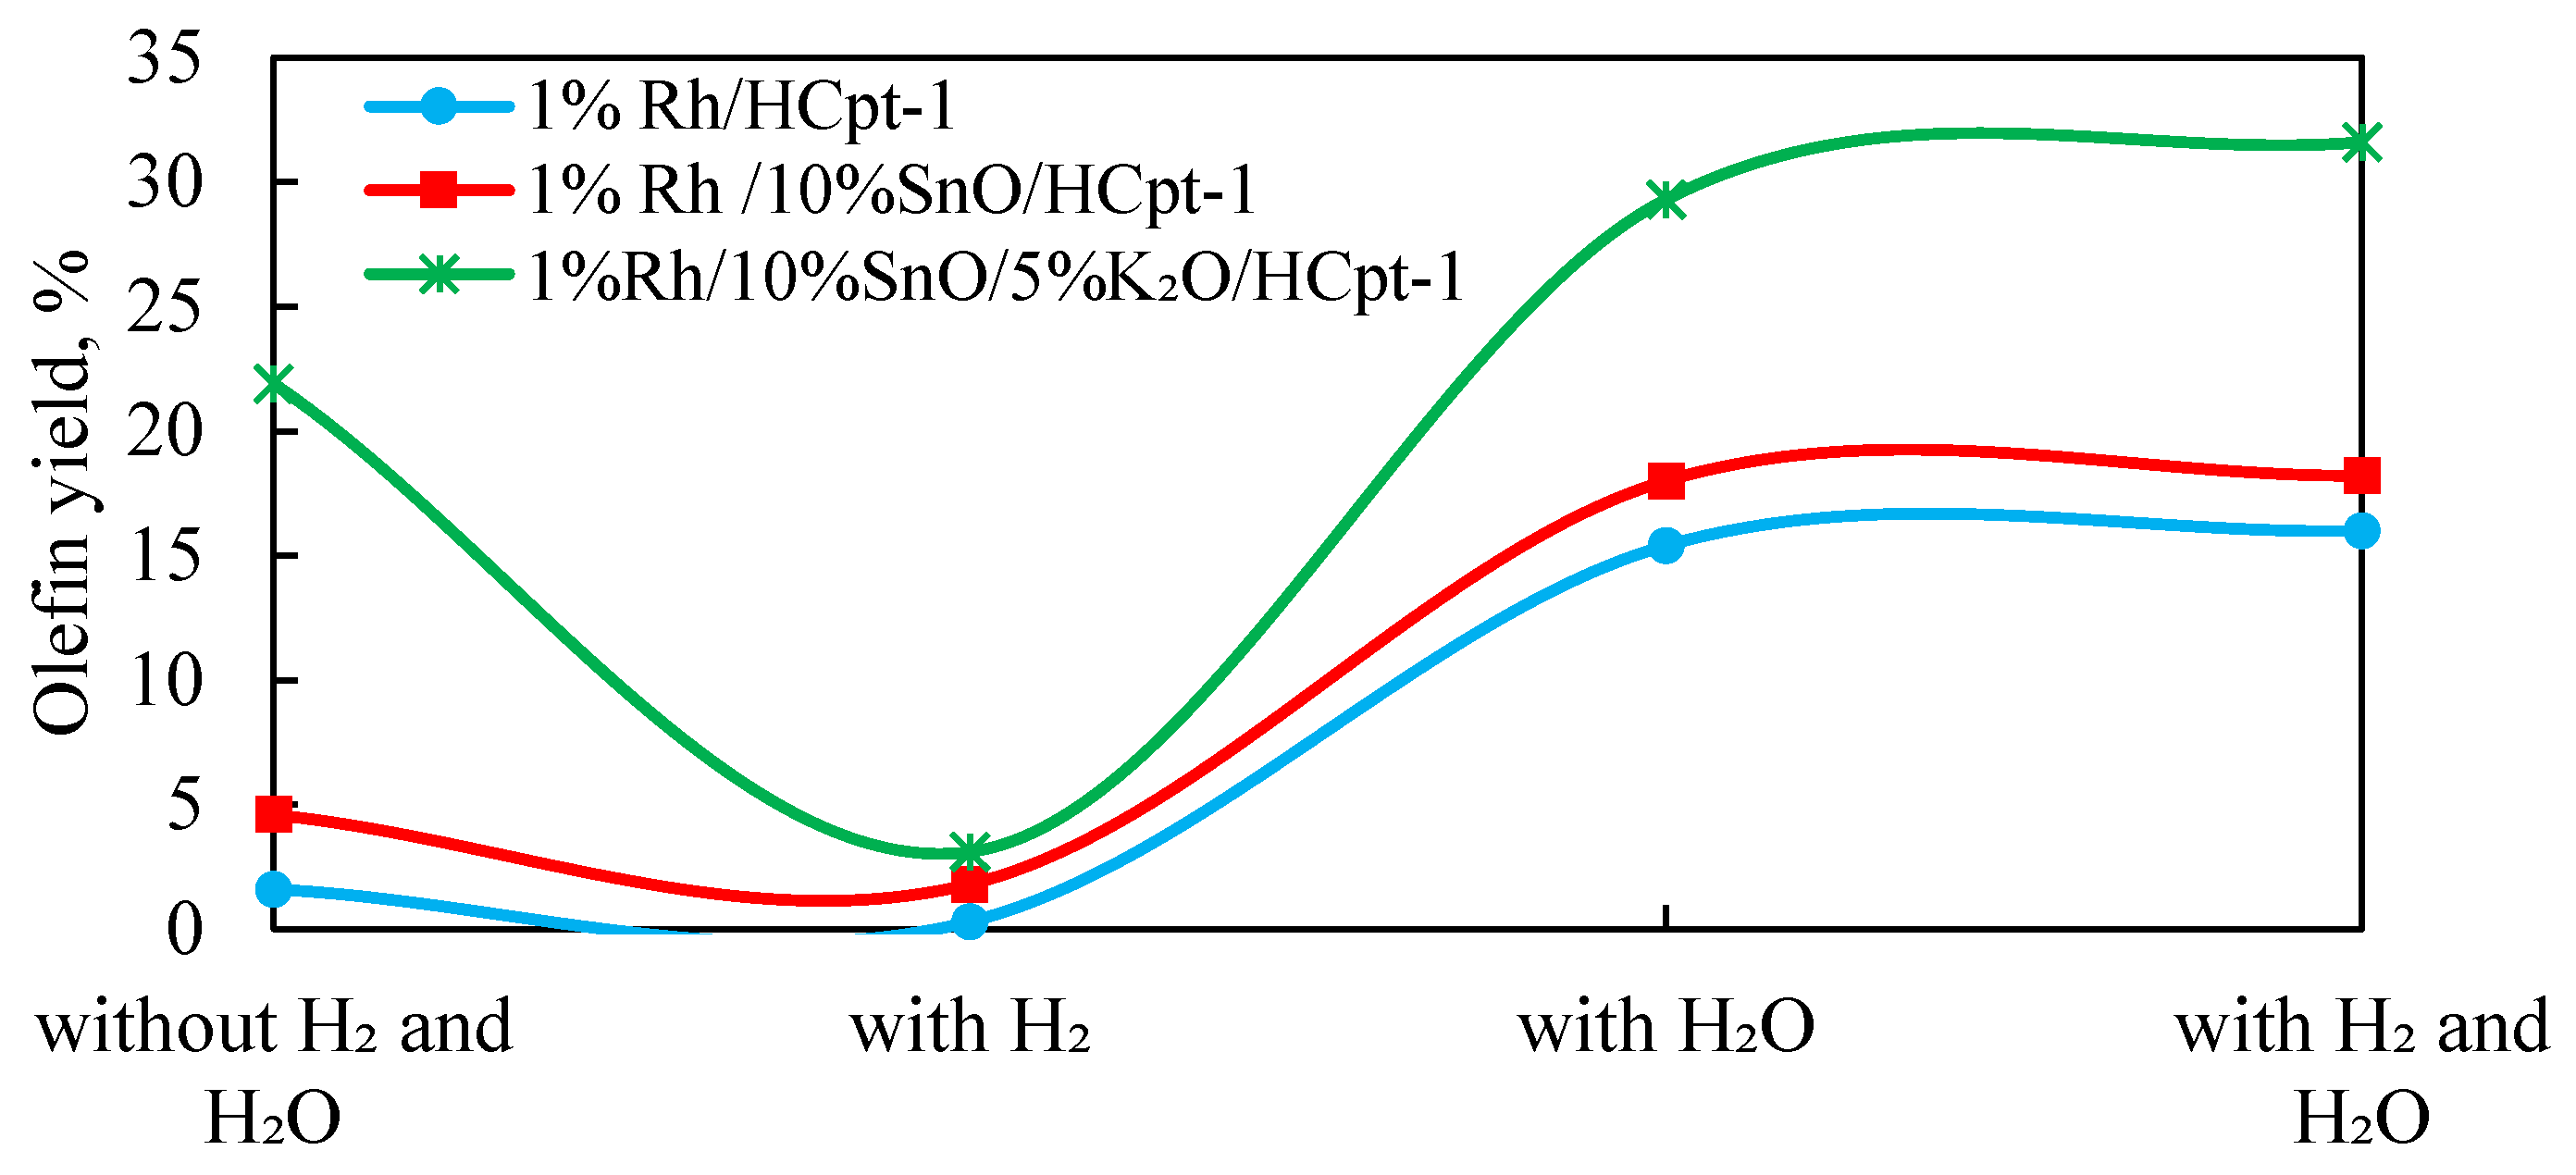
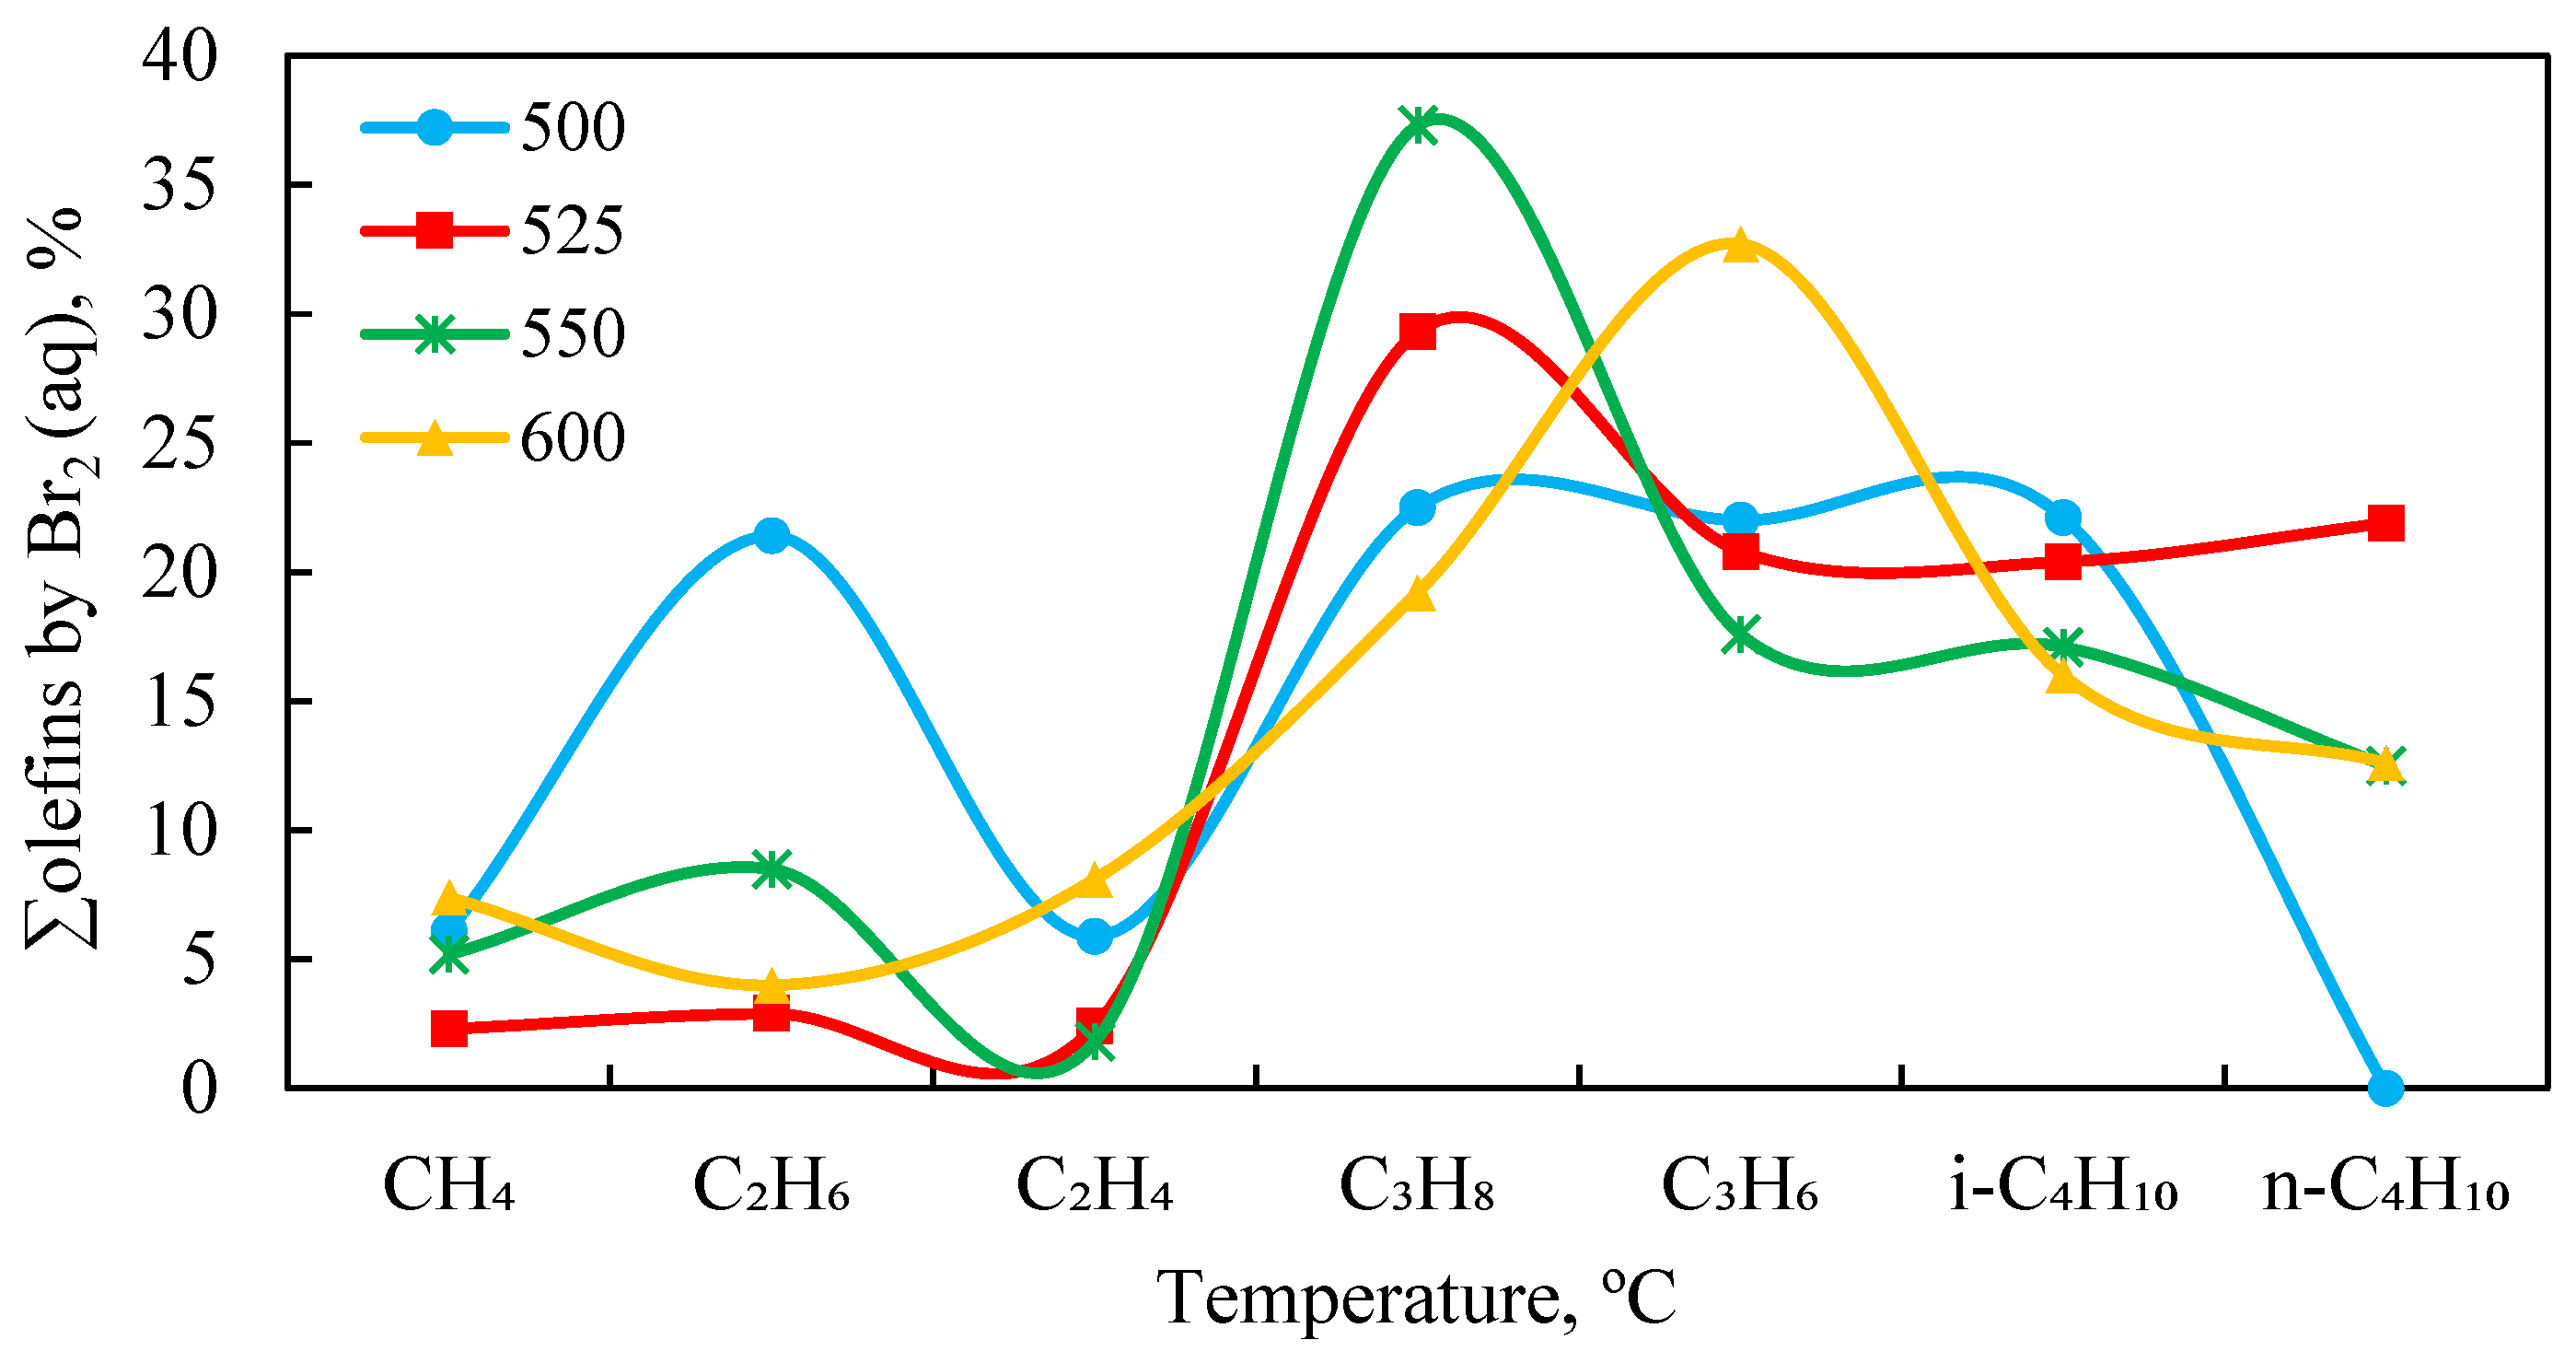
2O/HCpt-1 allowed us to establish the regularities of the influence of the composition of the catalytic system and reaction medium on the selectivity of the process. The results obtained at 600 °C are presented in
Figure 9.
An analysis of the presented data shows that the modification of the initial 1%Rh/HCpt-1 catalyst to the tin-modified 1%Rh/10%SnO/HCpt-1 catalyst, and then to the tin- and potassium-modified 1%Rh/10%SnO/5%K2O/HCpt-1catalyst, results in a consistent increase in olefin yield.
The initial 1%Rh/HCpt-1 catalyst demonstrated the minimal activity under the conditions without any additives (1.6%). The addition of water vapor has contributed to a significant increase in the olefin yield up to 15.4%, and the presence of hydrogen has further increased this up to 16.0%. This effect is explained by the blocking of the acidic sites of water, which reduces the rate of side reactions (isomerization, cracking) and promotes the selective dehydrogenation of light alkanes. The 1%Rh/10%SnO/HCpt-1 catalyst containing tin additive demonstrated improved characteristics: in the absence of water and hydrogen, the olefin yield increased almost threefold (4.6% versus 1.6% on the base catalyst). This is presumably due to the high dispersion of the active centers and a decrease in the coking rate. Adding water to the reaction medium increased the olefin yield up to 18.0%, which confirms the synergistic effect of Sn and water vapor. Adding hydrogen only slightly affected the selectivity (18.2%), which indicates sufficient activity of the system under the steam treatment conditions. The highest activity was observed on 1%Rh/10%SnO/5%K2O/HCpt-1 containing tin and potassium: even without water and hydrogen, the olefin yield reached 21.9%, which indicates a significant decrease in the acidity of the catalyst surface and suppression of side reactions. In the presence of water vapor, the yield increased to 29.3%, confirming the effect of water on the stabilization of the active centers. The addition of hydrogen to the mixture resulted in achieving the maximum yield of olefins (31.6%), which indicates an additional stabilization of the catalyst in the reducing environment.
It should be noted that during the APG dehydrogenation in the presence of water vapor on the 1%Rh/10%SnO/HCpt-1catalyst, the main components of the feed gas, which undergo the conversion at the low temperatures are ethane and propane, and at the higher reaction temperatures they are isobutane and butane. Increasing the experiment temperature up to 600 °C will lead to the complete conversion of propane, while simultaneously increasing the selectivity for propylene (
Figure 10).
The results obtained demonstrate that the sequential modification of the catalyst by introducing Sn and K2O significantly increases the selectivity and yield of the target products. The most effective system has been 1%Rh/10%SnO/5%K2O/HCpt-1, which has provided the maximum yield of olefins (31.6%) under the optimal conditions.
2.6. Investigation of Morphology and Structural Characteristics of the Catalysts
The results of catalytic conversion of the APG to olefins on different catalysts demonstrate that the sequential modification of the catalyst by introducing Sn and K2O can significantly increase its catalytic activity, selectivity, and resistance to the deactivation, where the 1%Rh/10%SnO/5%K2O/HCpt-1 catalyst provides the maximum olefin yield of 31.6% under the optimal conditions as the most effective catalyst.
The addition of tin helps to increase the thermal stability of the catalyst, and the introduction of potassium suppresses side reactions (isomerization and cracking), which leads to a significant increase in the yield of the target olefins. This effect is explained by a decrease in the acidity of the surface of the natural HCpt-1 zeolite due to the interaction of the alkaline promoter (K2O) with its acid sites.
Thus, the modification of the catalyst with Sn and K2O leads to a decrease in the strength of the acid sites, inhibition of undesirable secondary reactions and an increase in the selectivity of the dehydrogenation process. In addition, the active metal (Rh) demonstrates a more uniform distribution on the zeolite surface in the presence of tin and potassium, contributing to its increased accessibility to the reagents.
The study of the catalysts, using the scanning (SEM) and transmission (HR-TEM) electron microscopy, as well as X-ray photoelectron spectroscopy (XPS) has revealed significant changes in the morphology and state of the active components.
2.7. The Changes in the Active State of Rhodium During Its Reduction and Their Effect on the Catalytic Properties of 1%Rh/HCpt-1 Catalyst
Metallic rhodium plays a key role in the dehydrogenation of the APG, acting as an active center of the 1%Rh/HCpt-1 catalytic system. The spectroscopic studies, using the X-ray photoelectron spectroscopy (XPS) have shown that the efficiency of the catalyst directly depends on the degree of the rhodium reduction: the higher the proportion of the metallic state Rh0, the higher its catalytic activity.
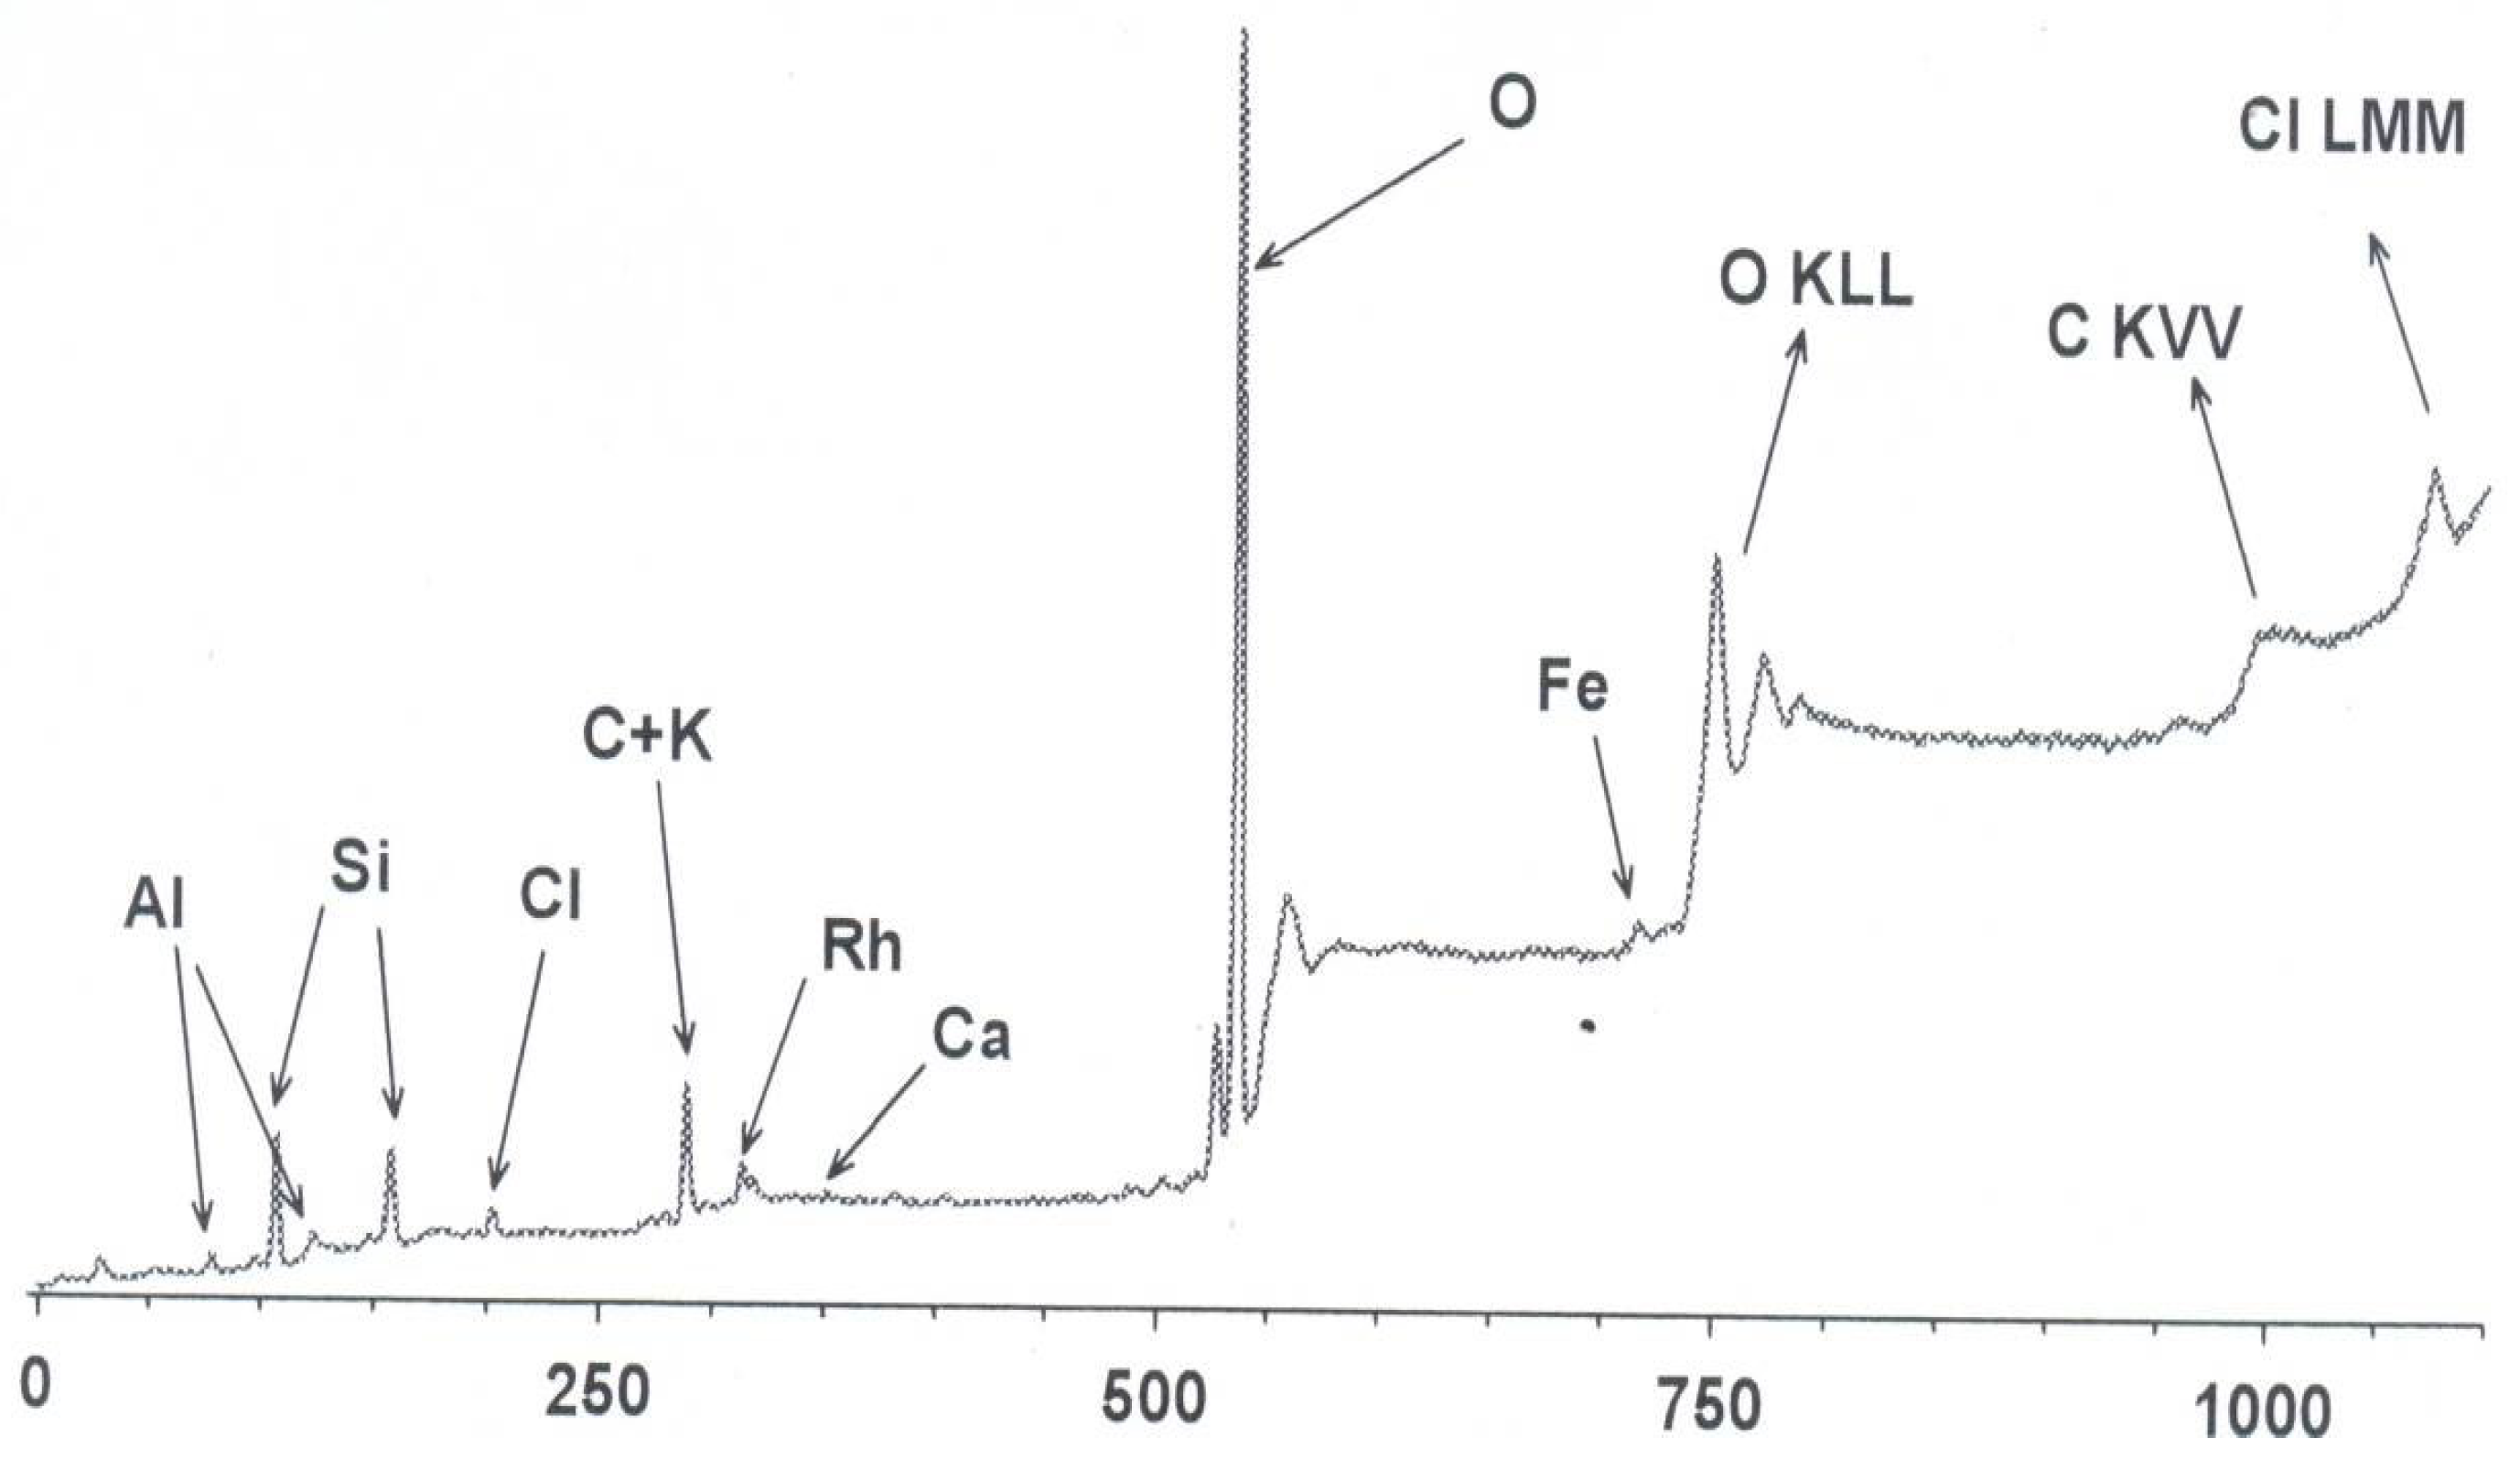
Figure 11 shows the overview XPS spectrum of sample #1 (original Rh/HCpt-1) with the main elements indicated. The spectrum demonstrates the presence of the following elements with their respective atomic contents (normalized to aluminum): Al (1.0), Si (3.6), C (5.3), Rh (0.13), O (17.1), K (0.06), Ca (0.06), Fe (0.15), Cl (0.4). The signals in the range 750–1100 eV are due to Auger electrons and correspond to O, C and Cl.
A comparative analysis of photoelectron spectra was carried out for a series of samples: initial, reduced, spent Rh/HCpt-1, as well as a sample after dehydrogenation of the hydrocarbon mixture with water vapor.
Analysis of the totality of the obtained spectra shows that the studied samples are natural aluminosilicates, which agrees with the previously obtained XRF data. The main structure-forming elements are Al, Si, and O, the additional presence of other elements confirms their natural origin.
Comparison of the surface chemical composition (XPS) with the bulk composition (XRD) revealed segregation effects and migration of elements. It was found that heat treatment, especially long-term high-temperature operation, causes diffusion of iron oxides and other elements from the pores and channels of zeolite to the outer surface. This process significantly affects the formation of active centers of the catalyst.
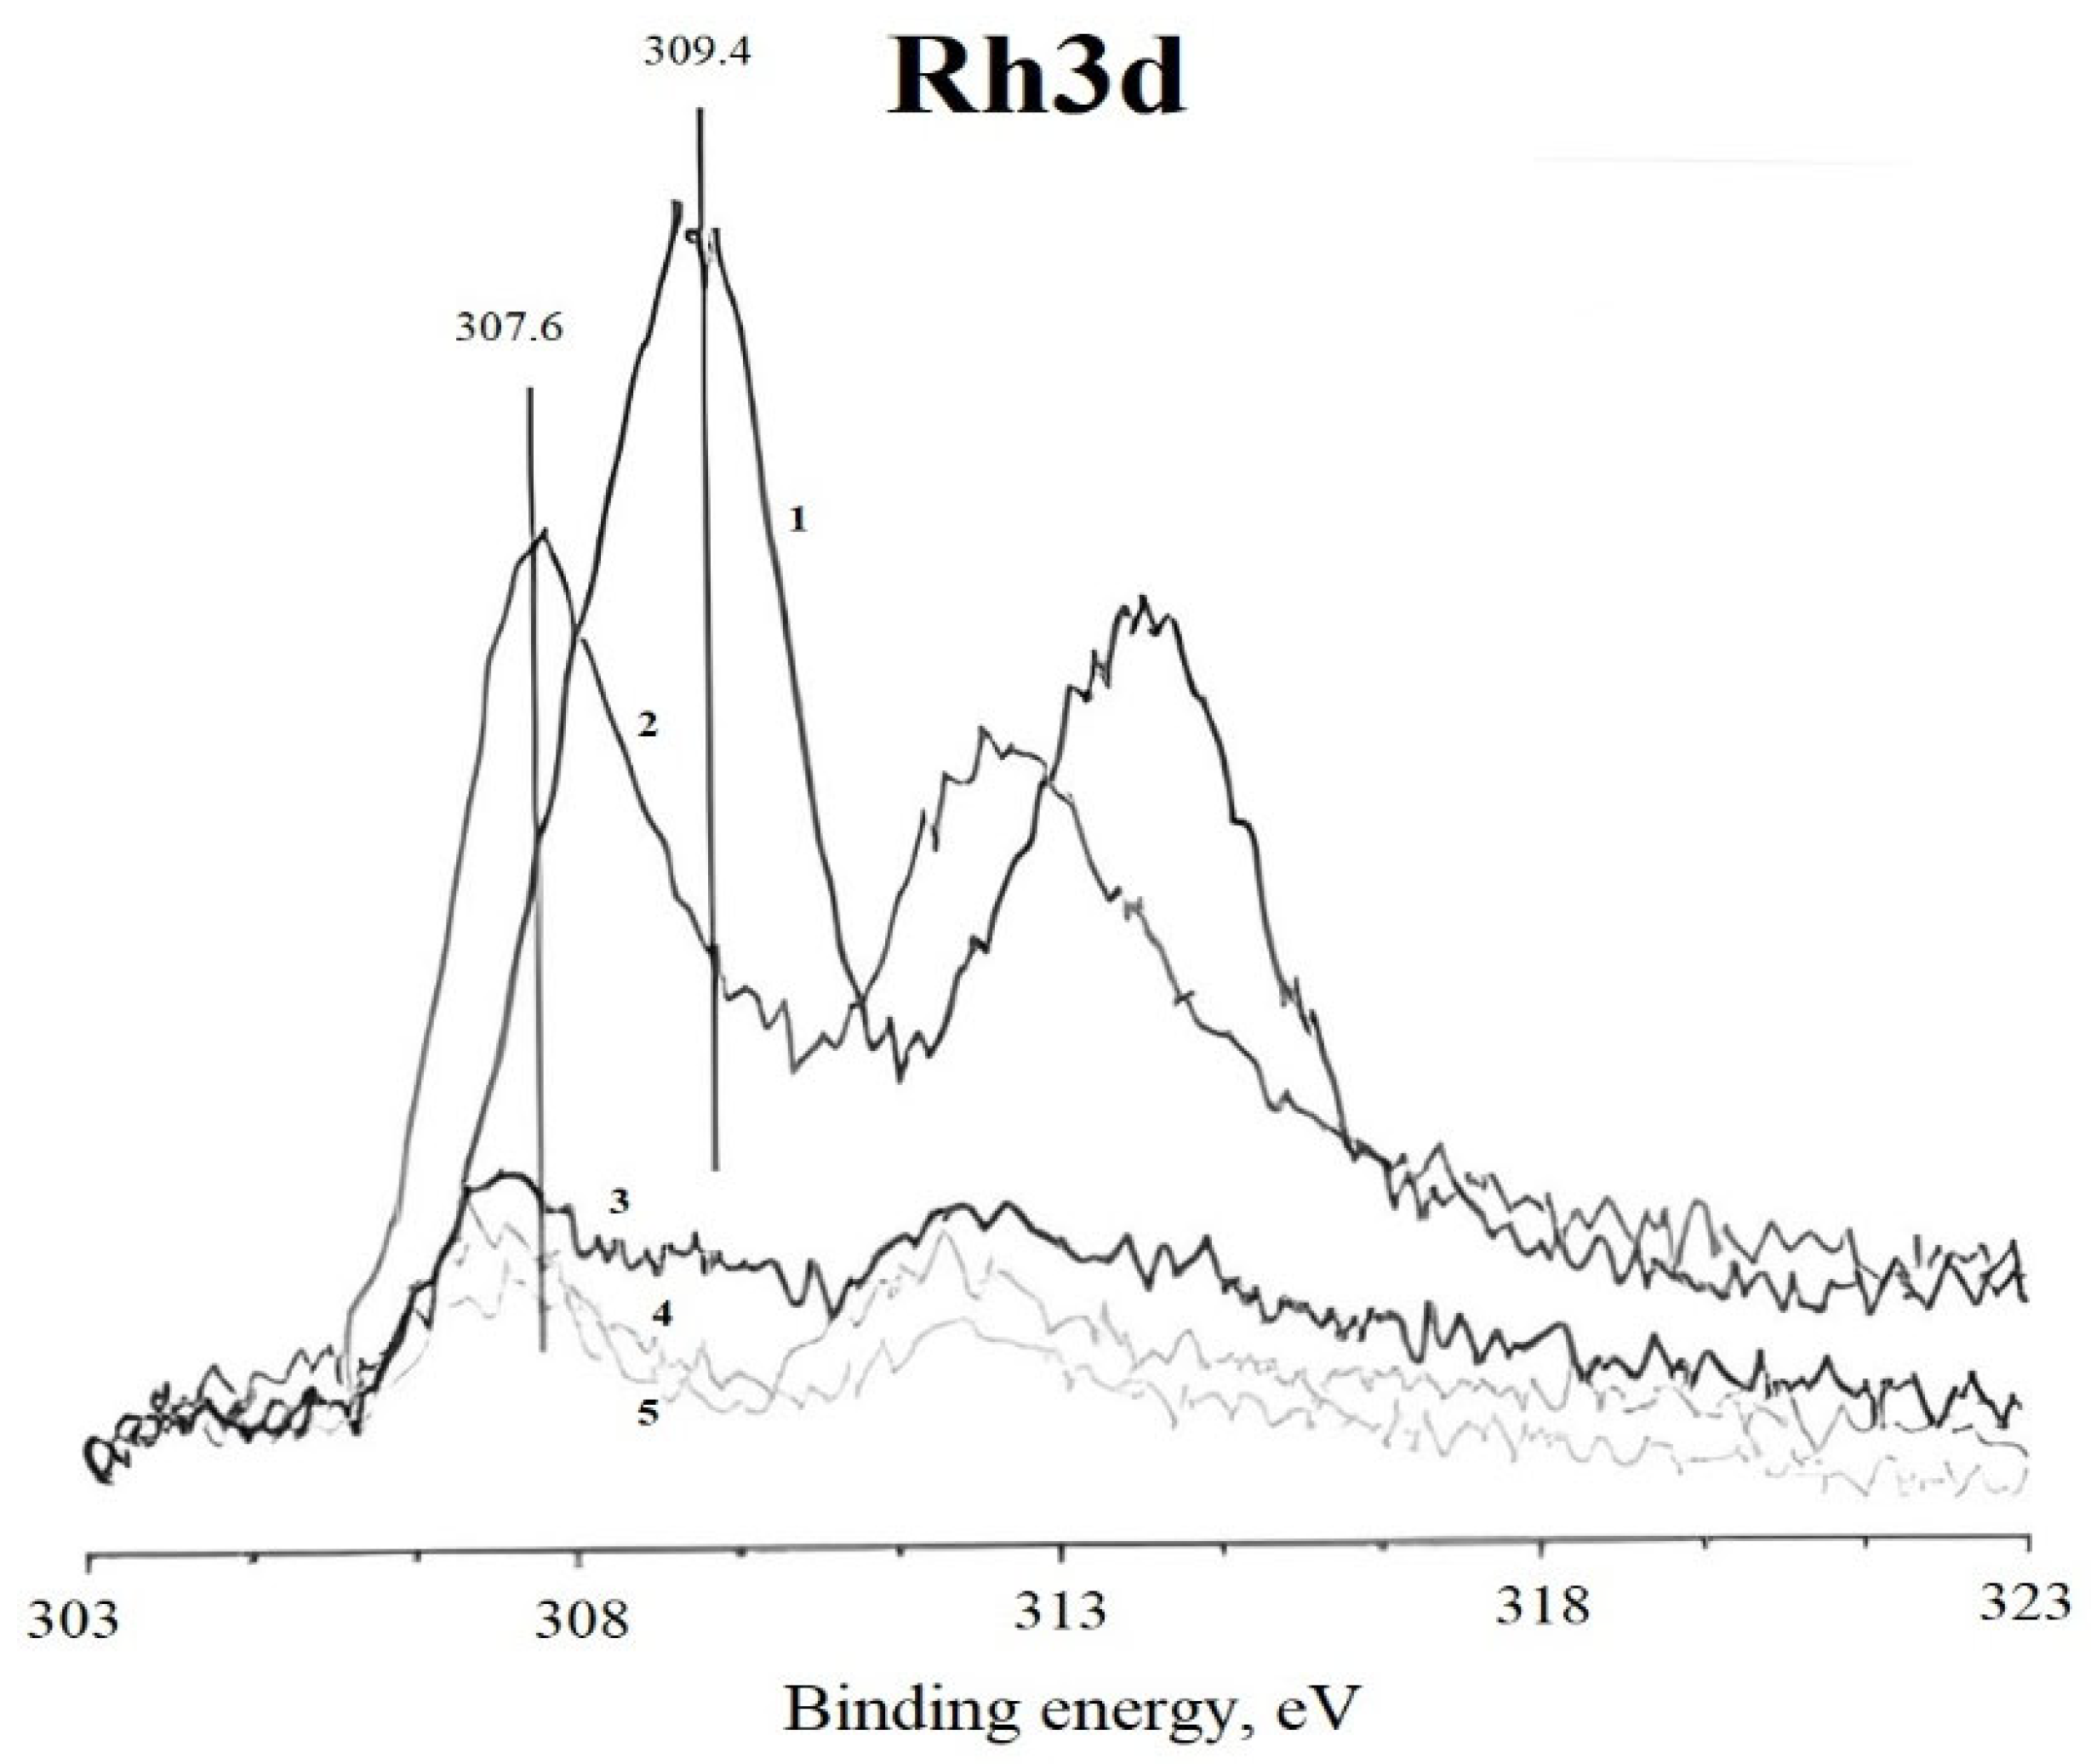
Figure 12 shows a set of XPS spectra of rhodium for different samples, calibrated with respect to the value of the binding energy of the C 1s line at 284.8 eV.
It follows from
Figure 12 that when passing from the original sample (No. 1) to the reduced sample (No. 2) there is a shift of the peak toward lower binding energies, which indicates a change in the charge state of rhodium from oxidized to reduced. Also, for the spent samples (with and without water), the intensity of the rhodium peak decreases sharply. This decrease in intensity may be due to three processes separately or together. The first is probably the penetration of rhodium particles into the pores of the carrier volume and thus they disappear from the analyzed area. The second reason may be related to sintering or agglomeration of rhodium particles, e.g., during thermal treatment, so that there is a self-shielding effect of the electron photovoltage from the rhodium level. Finally, a third reason may be due to the simple flushing of the substance, if any solution treatment has been carried out [
28,
32]. Note that the decrease in signal intensity from rhodium is due to its simultaneous reduction to the metallic state. Most likely, the treatments with and without water are characterized by a reducing environment.
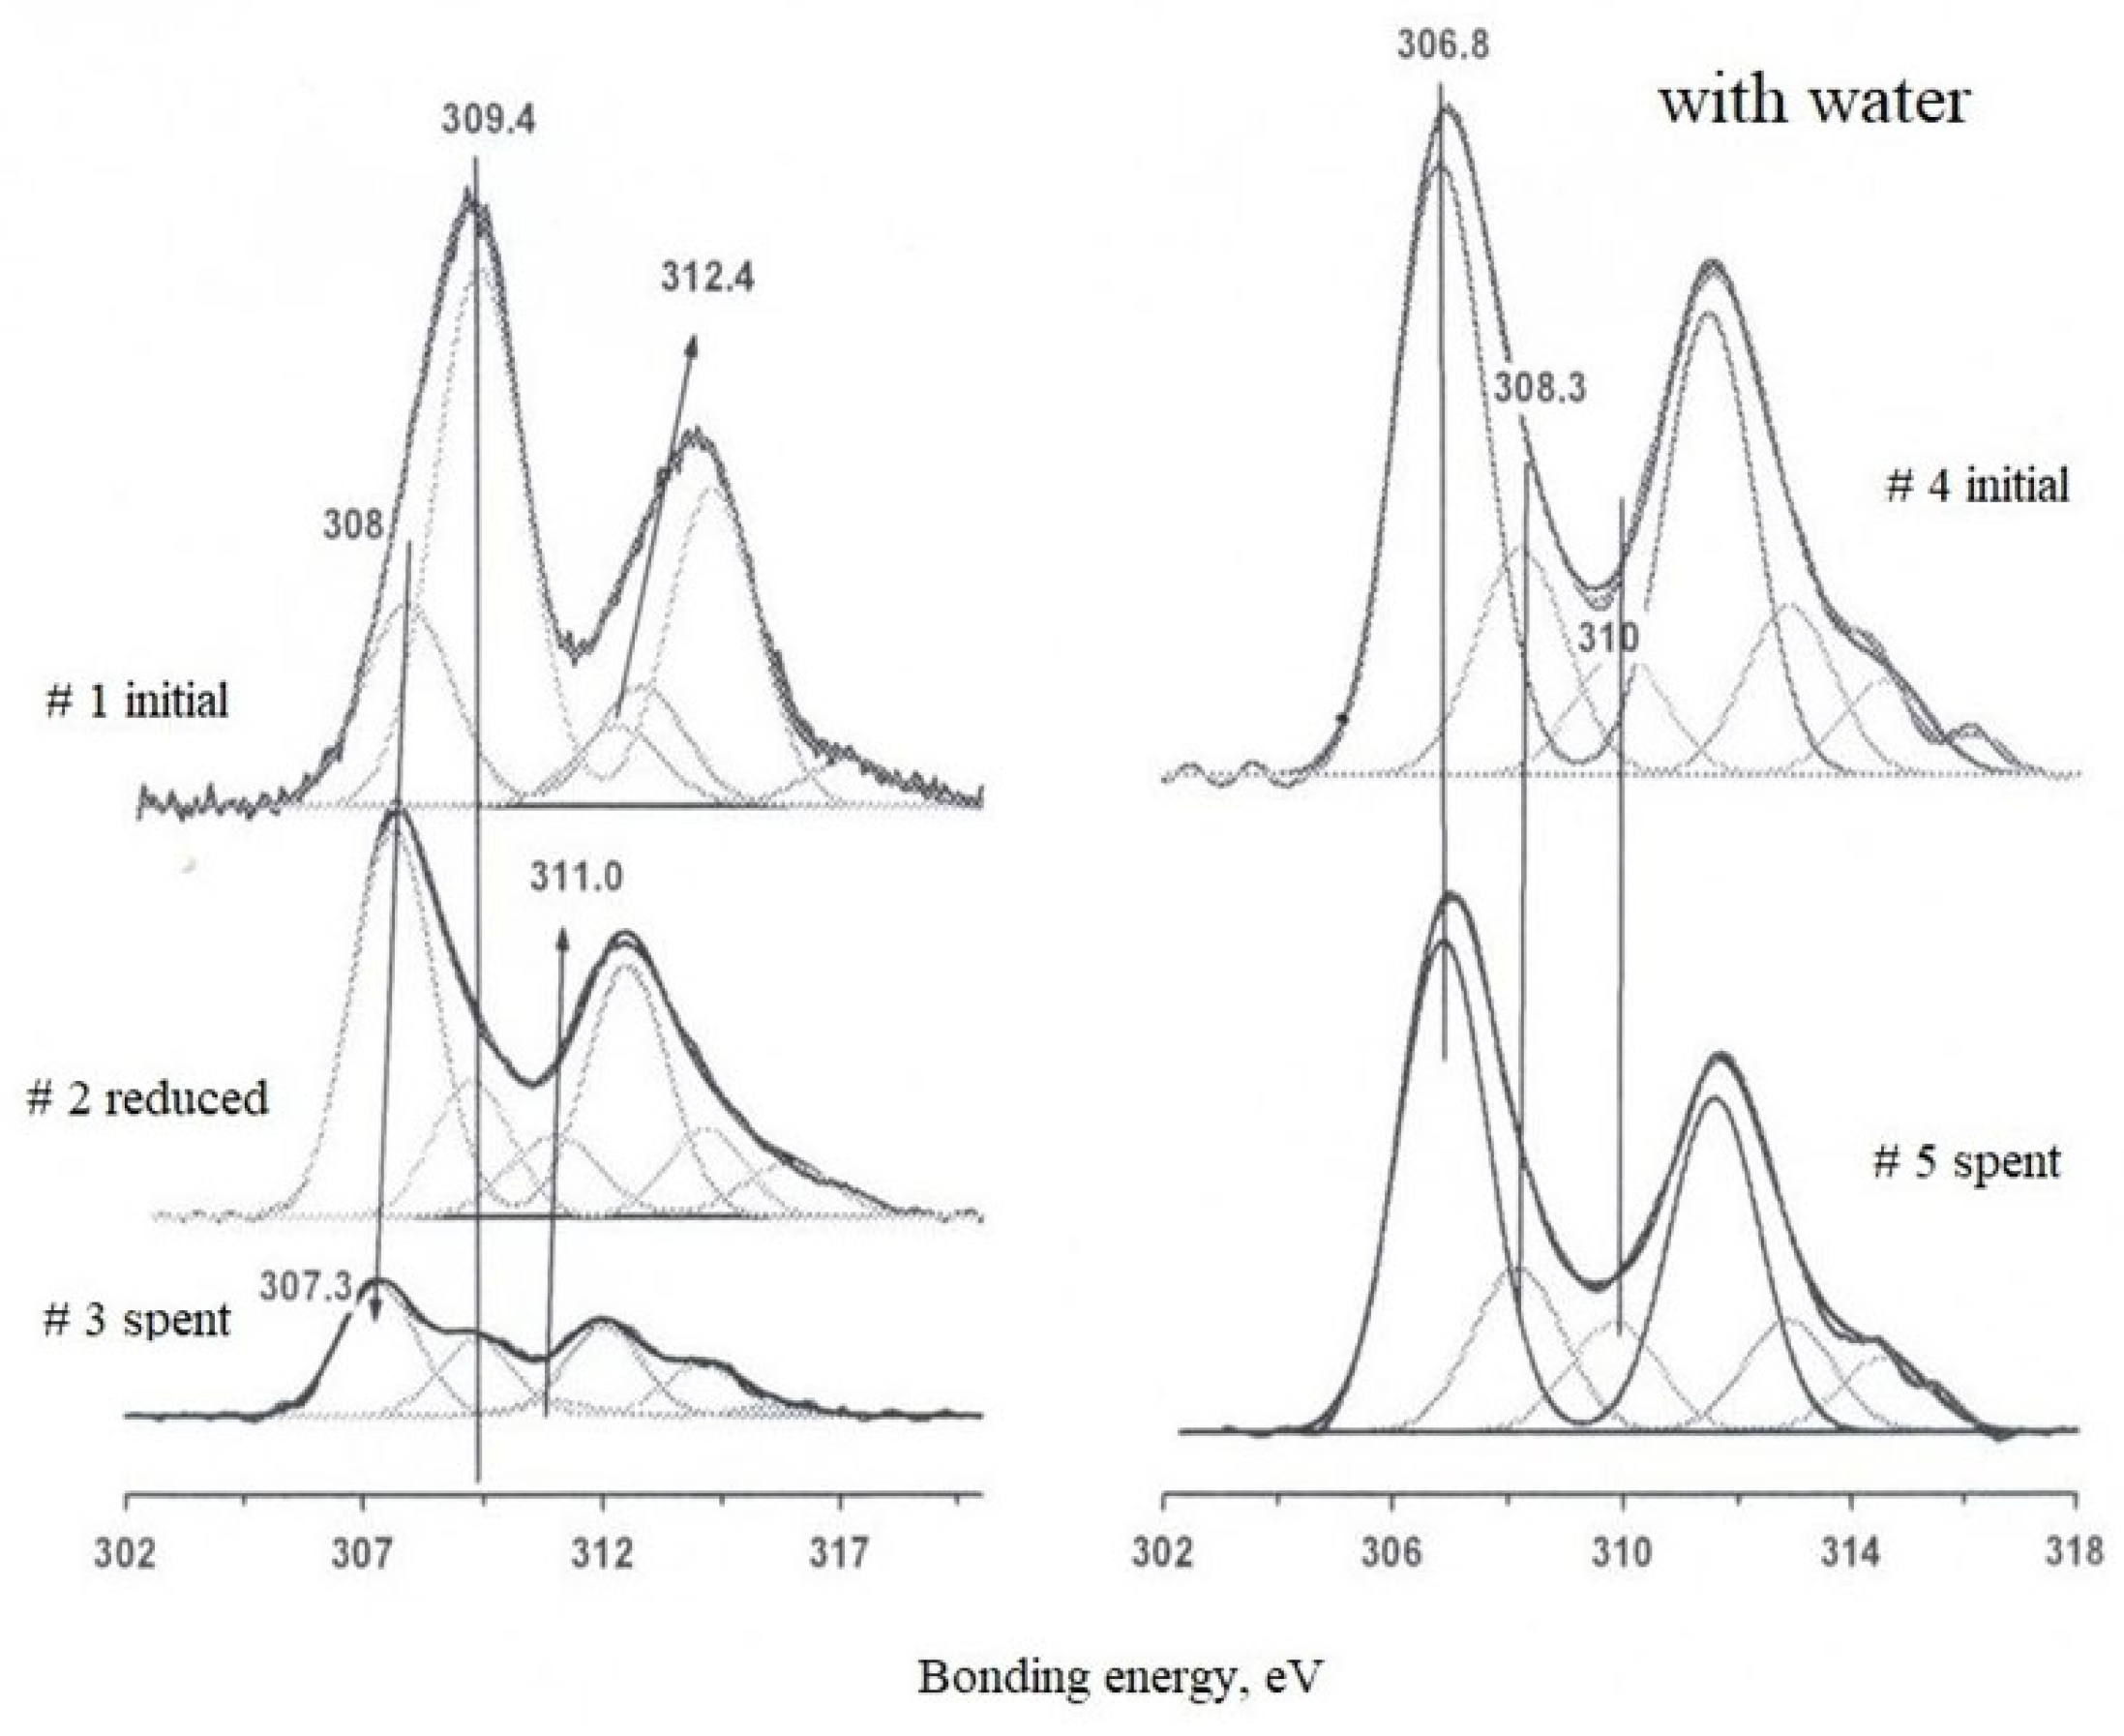
For detailed characterization of the valence states of rhodium, the Rh3d spectra of all samples were analyzed by deconvolution using the WinCalc program (
Figure 13). The spectra were calibrated and normalized to the background.
Analysis of the spectrum of sample #1 revealed two ground states of rhodium with binding energies of 308–309.5 eV, characteristic of Rh3+. The component at 308 eV corresponds to the oxide form of rhodium, probably Rh2O3, although the observed value is slightly lower than typical values for a structured oxide. The main peak at 309.4 eV is consistent with the presence of rhodium in the halide composition, which is supported by the high chlorine content of the sample. Alternatively, this state may be due to the formation of complex compounds such as rhodates or aluminates, indicating the interaction of rhodium with the zeolite surface. The higher values of binding energy compared to the reference values may indicate an enhanced metal-carrier interaction.
The nature of the doublet at 312.4 eV remains controversial. Such high binding energies are characteristic of complex organic compounds of rhodium [
32,
33] or chlorates [
32]. However, the absence of corresponding features in the chlorine spectrum suggests a satellite origin of this component.
After reduction (sample #2), a decrease in the intensity of the oxidized forms and an increase in the signal from the intermediate state (307.8 eV) are observed. The shift of the third doublet to lower energies indicates partial rhodium reduction without significant morphological changes.
Treatment in a reaction medium with water vapor leads to further reduction, which is confirmed by the shift of XPS peaks toward lower binding energies (sample #4). The spent samples contain metallic rhodium, its oxide form, and a component associated with the carrier surface. This indicates a partial transformation of the original crystal structures and redistribution of rhodium over the surface of HCpt-1 zeolite.
The results of interpretation of the valence states of rhodium are systematized in
Table 9. The identification of chemical forms was carried out using the reference data of Moulder et al. (1992) [
34].
Analysis of the Al 2p and Si 2p XPS spectra showed partial dealumination of mixed oxide phases on the catalyst surface with the formation of separate aluminum- and silicon-containing compounds [
13]. This change affects the acid-base properties and resistance of the catalyst to deactivation.
In the Al 2p spectrum, the main peak is observed in the binding energy range of 74.0–75.0 eV which is characteristic of aluminum hydroxides, as well as of Al coordination environments in the structures of zeolites and aluminosilicates [
35,
36]. The slight shifts in peak position are due to changes in the local coordination of Al
3+ cations and their transition into different chemical forms, including oxide-hydroxide modifications on the surface. These changes are closely related to the Al/Si ratio, which ranges from 2.9 to 3.6 for the Rh/HCpt-1 samples.
Peaks with lower binding energy values (~74 eV) indicate dealumination processes and partial amorphization of the surface [
35,
36]. Such changes may be associated with the removal of aluminum from the zeolite framework and the formation of additional mesoporous structures, which is consistent with the results of textural analysis. Thus, the XPS data confirm the rearrangement of the local aluminum structure while maintaining the general crystallinity of the zeolite framework.
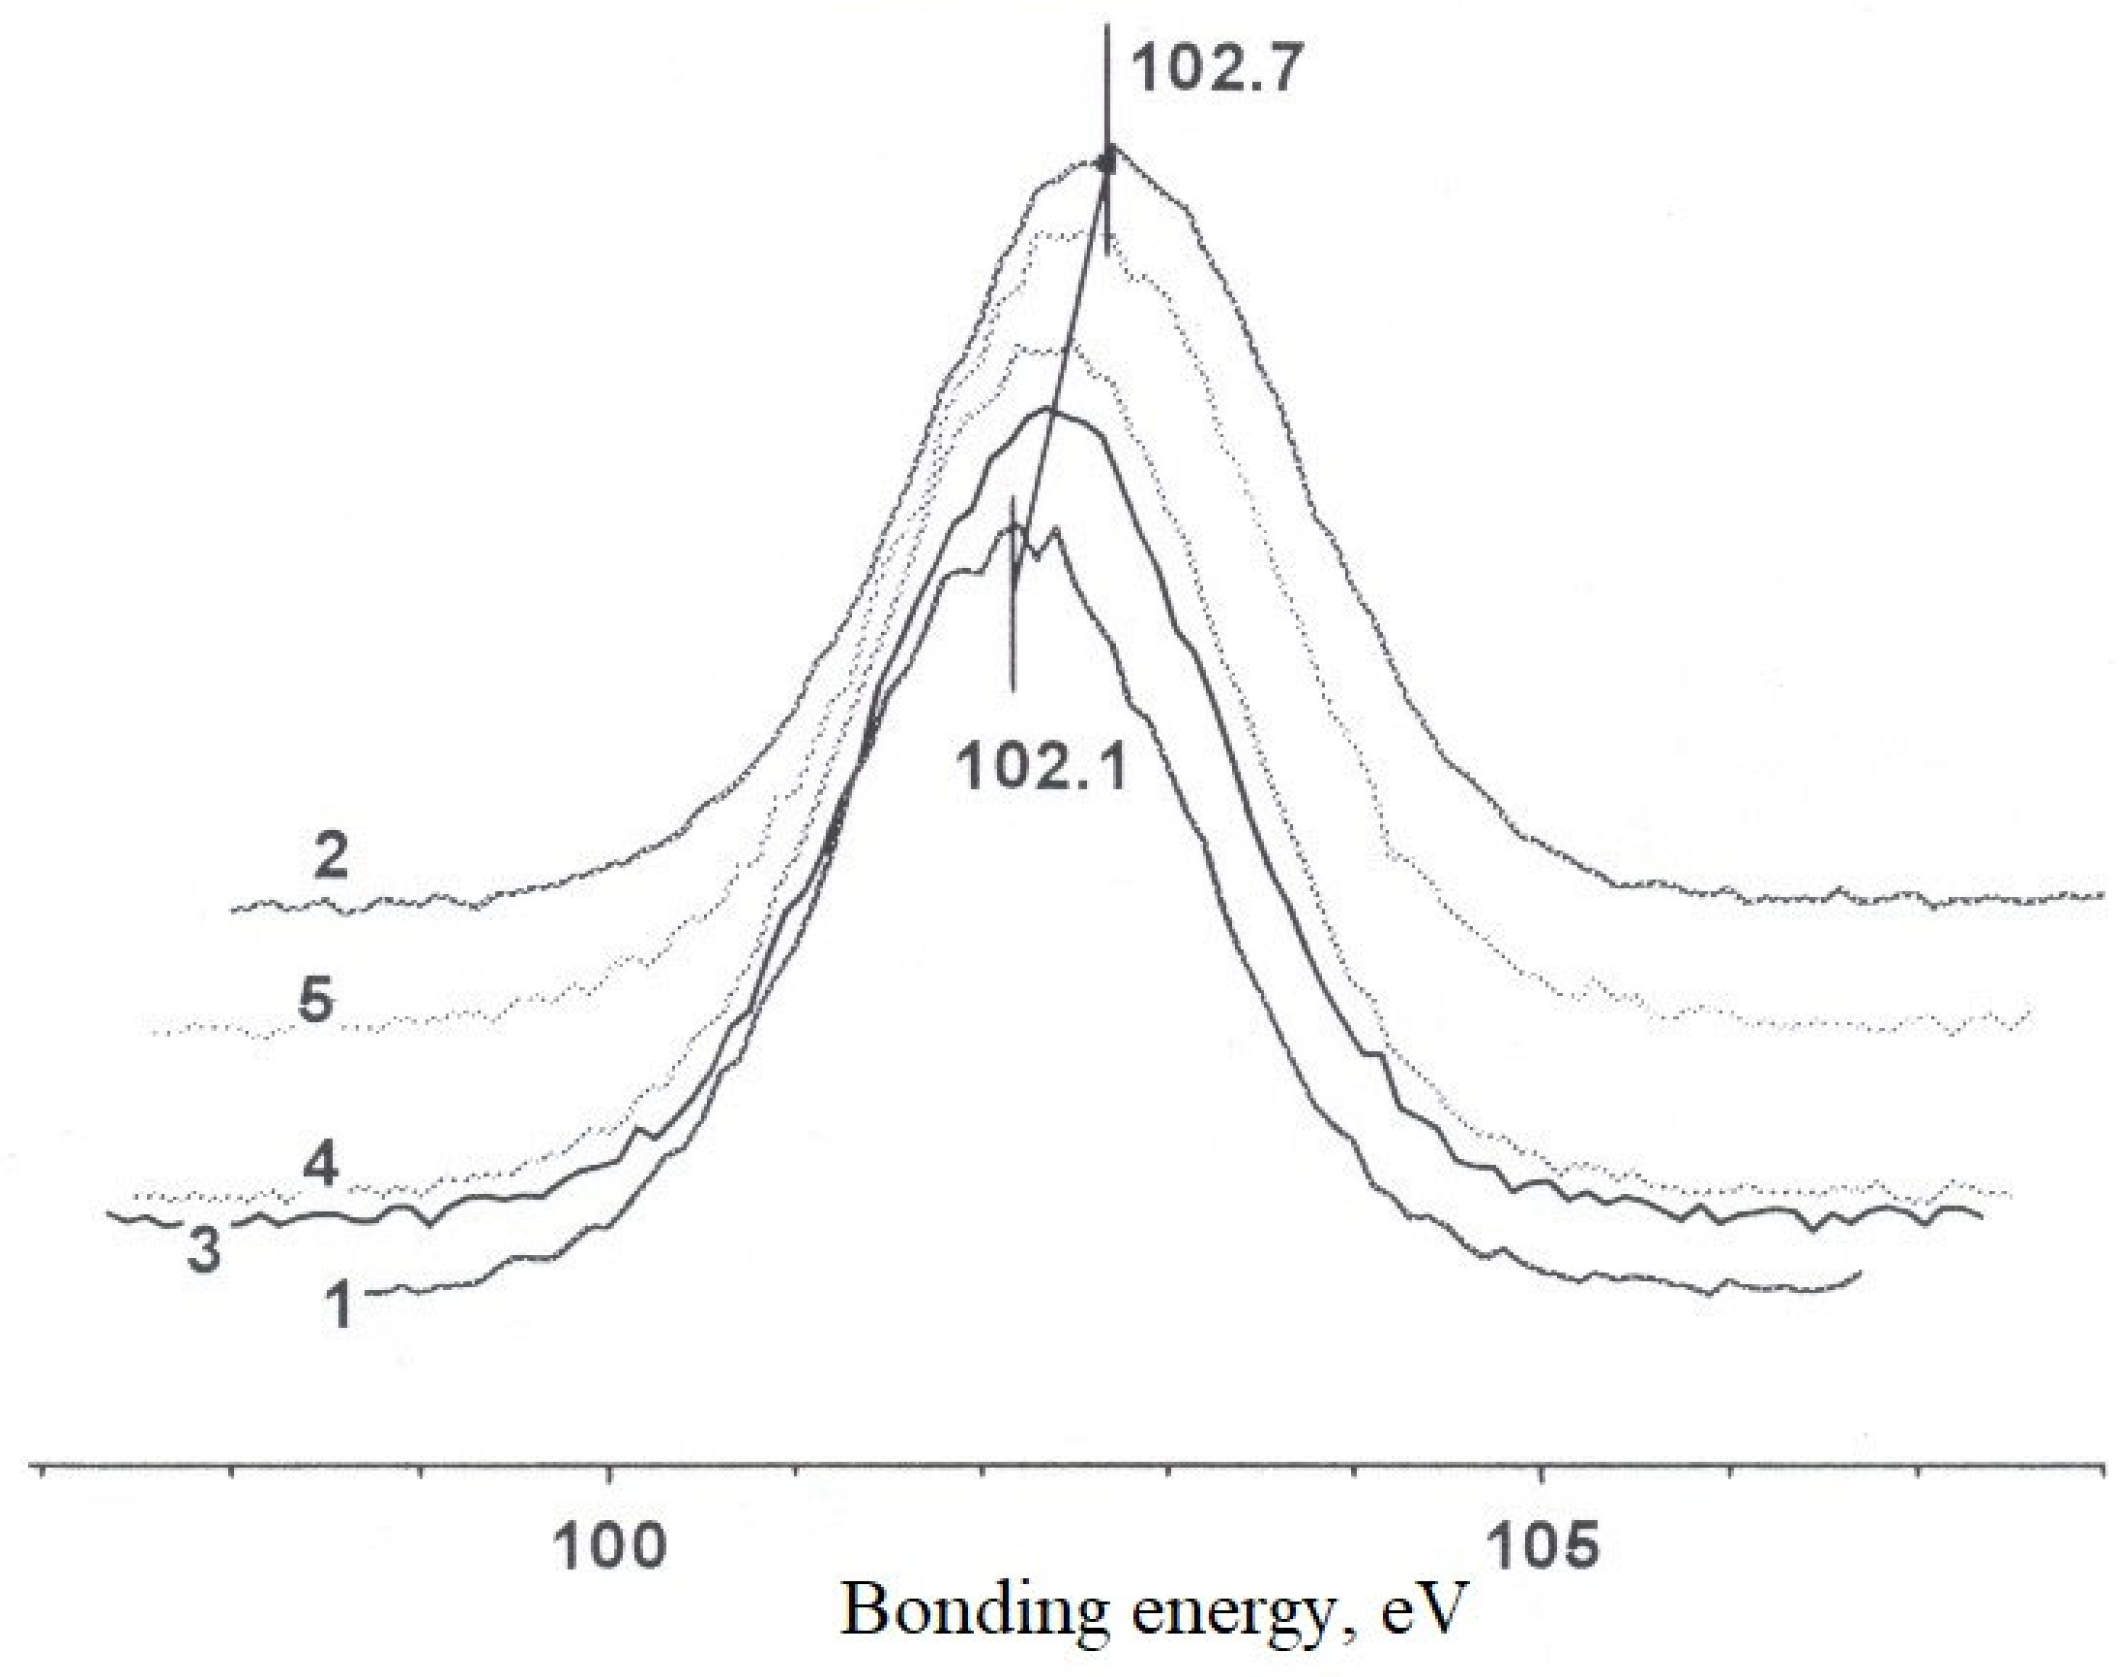
The Si 2p spectrum is characterized by a single line with a binding energy of ~102–103 eV, typical for SiO
2. The shift of the Si 2p line toward higher binding energy values indicates a transition from a more ionic character of the bond in aluminosilicates to a more covalent one in structures with an increased silicon content, up to pure SiO
2 (E
bond = 103.5 eV) (
Figure 14).
Acid treatment of the catalyst leads to a change in the Si/Al ratio due to the destruction of the original mixed crystal structures and the formation of separate aluminum- and silicon-containing phases.
Thus, the complex analysis of Rh/HCpt-1 samples by XRD, IR spectroscopy, BET and XPS methods showed:
Acid treatment leads to an increase in the SiO2/Al2O3 ratio from 13.1 to 23.8. It also increases the specific surface area from 9.8 to 52.6 m2/g, while maintaining the crystallinity of the zeolite. The dealumination process occurs mainly due to the removal of extra-framework aluminum and partial amorphization of the surface layers. Modification with tin (Sn) and potassium (K) optimizes the acid-base properties of the surface and the distribution of active centers. A correlation between structural changes and catalytic activity in the APG dehydrogenation reaction is observed. The obtained results confirm the efficiency of the proposed approach to modification of natural clinoptilolite for the creation of active dehydrogenation catalysts.
2.8. Studies of the Surface Morphology of the 1.0%Rh/HCpt Catalyst and Its Modified Forms
The electron microscopic studies of the surface morphologies of the 1.0% Rh/HCpt-1 catalyst samples, obtained by the HR TEM method, are presented in
Figure 15.
The analysis of the HR TEM images of the 1.0%Rh/HCpt catalyst samples shows that the rhodium particles (dark spots) have nanometer sizes, which contribute to the efficient operation of the 1.0% Rh/HCpt catalyst (
Figure 15a). An uneven distribution of the rhodium particles on the catalyst surface was observed.
During the long-term operation of the catalyst, a certain deactivation of its surface is observed, reflected in a decrease in the yield of olefins during APG dehydrogenation. The HRTEM images of the spent sample of the catalyst 1.0% Rh/HCpt show the formation of carbon deposits (
Figure 15b).
The noticeable accumulation of carbon on the surface indicates its active participation in the process, which includes not only the hydrocarbons of the associated petroleum gas, but also the residual iron ions, which may have not been completely removed during the acid activation of the natural clinoptilolite. This conclusion is confirmed by the results of the microanalytical studies of the 1%Rh/HCpt-1catalyst, where the chemical shifts in the spectra indicate the presence of iron in various charge states (
Figure 15c). The electron microscopic studies, using the HRTEM method, have also revealed the formation of carbon threads, which are nanotubes (
Figure 15d). The wall thickness of these nanotubes is about 5 nm, and their structure consists of atomic layers of graphite. The tubes with almost parallel atomic layers are predominantly observed on the catalyst surface.
Thus, it can be concluded that the nature of the support has a significant effect on the catalyst deactivation process during hydrocarbon processing. During the long-term high-temperature operation of the 1%Rh/HCpt-1 catalyst, iron oxides diffuse from the inner surface of the zeolite pores and channels to its surface. These iron oxides are the main factor contributing to the formation of carbon filaments, causing the observed partial deactivation of the catalyst.
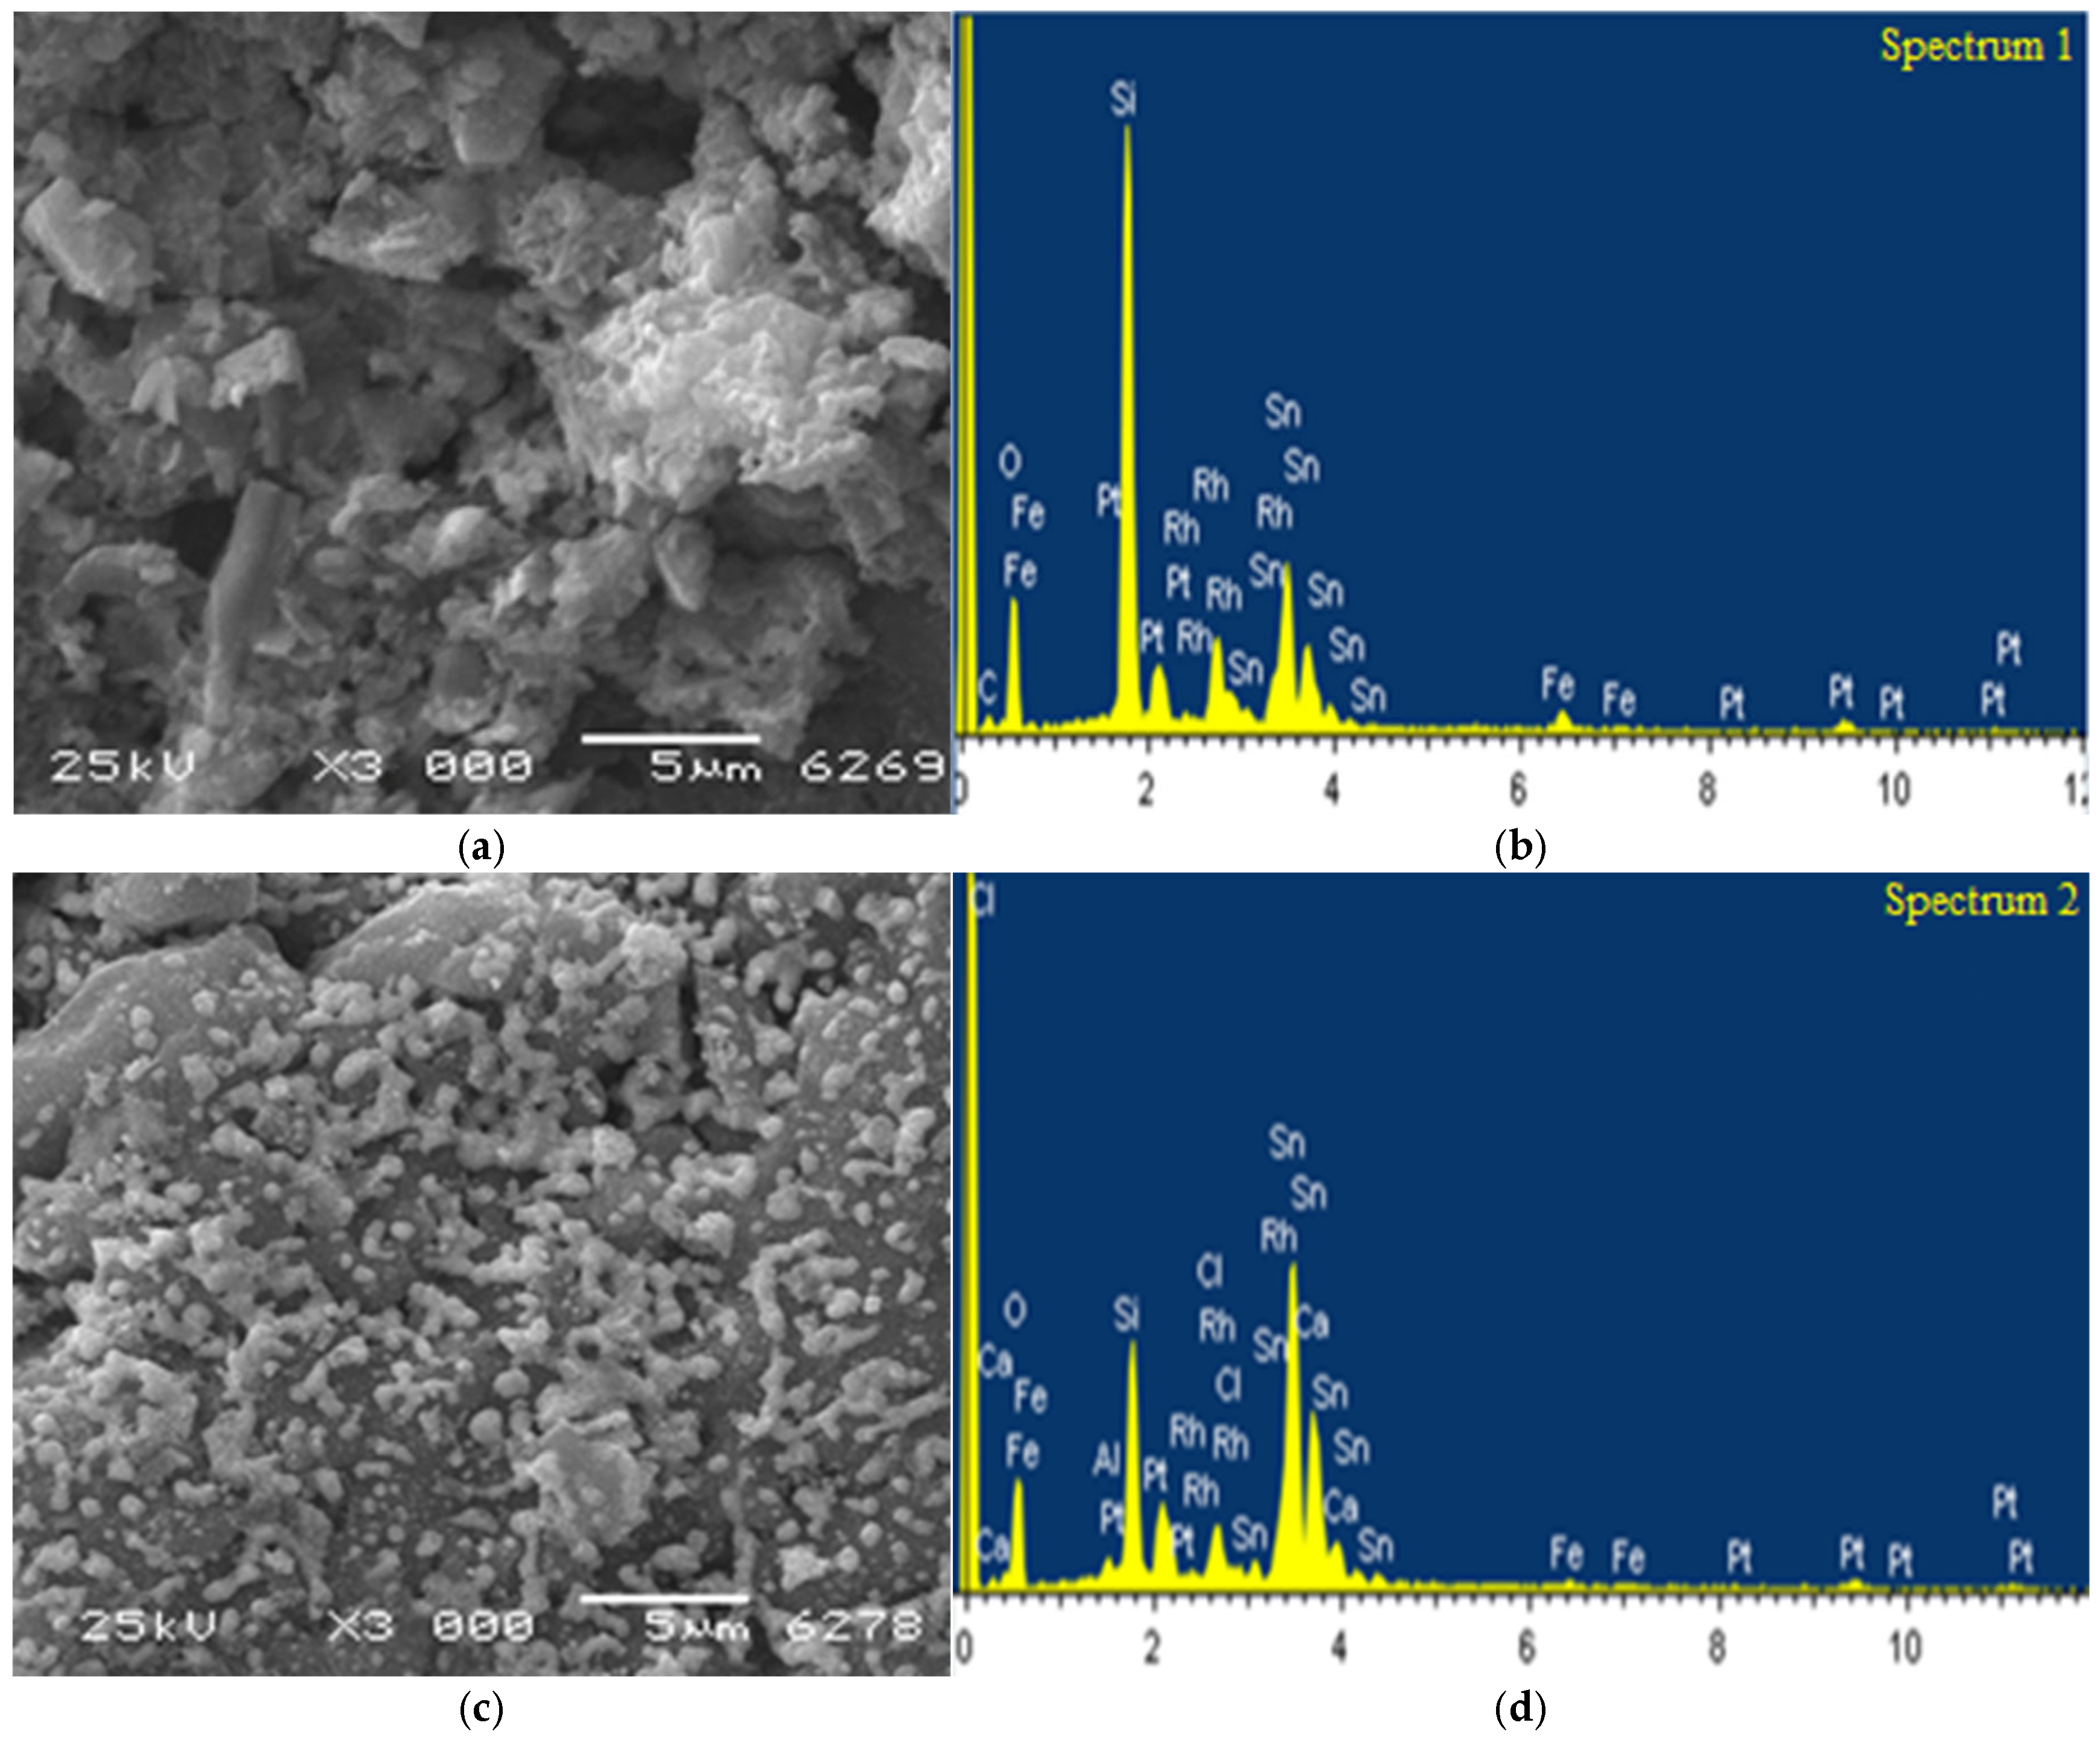
In this work, the scanning electron microscopy (SEM) is also used to study the morphology and microreliefs of the surface, determine the elemental composition at the observed surface point, and obtain the element distribution patterns over the surface of the initial and spent samples of the tin-modified 1%Rh/10%SnO/HCpt catalyst.
Using the SEM method, it has been found that in the initial, unreduced sample of the 1%Rh/10%SnO/HCpt-1 catalyst, tin and rhodium are present in the form of large, dense particles, ranging in size from 1 to 10 μm (
Figure 16a). The particles are distributed unevenly on the zeolite surface, with some areas of the surface covered with the clusters of particles. The elemental analysis of the sample shows that the composition of the observed point of the surface corresponds to the composition of the original catalyst (
Figure 16b).
In the image of the spent catalyst sample, a tendency toward an increase in the dispersion of the tin-containing particles is observed: the particle size decreases from 5–10 μm down to 1–2 μm, and their distribution becomes more ordered (
Figure 16c). According to the microanalysis data, the elemental composition at the observed points of the surface changes insignificantly, but significant quantitative changes occur: the tin content decreases, while the rhodium content increases (
Figure 16d).
It follows from the analysis of
Figure 16 that the addition of tin helps to stabilize the rhodium particles and prevents their agglomeration on the surface of the natural zeolite. This allows maintaining a high specific surface area of the active metal and increasing the number of the active centers, which directly improves the catalytic activity.
Thus, the introduction of tin into the catalyst (1%Rh/10%SnO/HCpt-1) leads to a significant increase in the dispersion of rhodium and an improvement in its distribution over the surface of the zeolite, which helps maintain the activity of the catalyst for a long time. Moreover, a decrease in the intensity of coke formation on a sample of 1%Rh/10%SnO/HCpt-1 is confirmed by microscopic analysis, demonstrating a decrease in the amount of carbonaceous deposits. An even more pronounced decrease in the degree of coking was recorded on the 1%Rh/10%SnO/5%K2O/HCpt-1 catalyst, which is explained by the additional influence of potassium. Potassium, being an alkaline element, reduces the concentration of acid centers, preventing the formation of carbocations and subsequent polymerization of hydrocarbons, leading to the accumulation of coke. The conducted studies confirm that modification of 1%Rh/HCpt-1 catalysts by introducing Sn and K2O significantly increases their efficiency in processing associated petroleum gas.
The introduction of tin helps to increase the thermal stability of the catalyst, reduce its deactivation rate and improve the distribution of rhodium over the surface of the carrier.
The addition of potassium suppresses side processes such as cracking and isomerization, which leads to an increase in the yield of olefins.
The electron microscopic analysis demonstrated a decrease in the amount of the coke formation on the catalysts with the Sn and K2O additives, helping increase their stability during the operation.
Thus, the 1%Rh/10%SnO/5%K2O/HCpt-1 system is a promising catalytic material for APG processing with high olefin selectivity and an extended service life.
3. Experimental Part
3.1. Materials and Methods
A mixture of the C1–C4 alkanes, simulating the composition of APG, was used as a feedstock for the dehydrogenation. The composition of the feed gas was determined by gas chromatography, using an Agilent 6890N chromatograph with a 5975C mass-selective detector (Agilent Technologies, Santa Clara, California, USA), which included the following components: methane (~3.7%), ethane (~17.9%), propane (~46.2%), butane (~10.8%), and isobutane (~18.6%). The method for determining olefins using the MKhTI-8 gas analyzer is based on the chemical interaction of unsaturated hydrocarbons (olefins) with bromine water. During the analysis, olefins containing double bonds react with bromine by adding it across the multiple bonds. This leads to the discoloration of the bromine water solution, which serves as a key indicator for the quantitative assessment of olefin content.
The MKhTI-8 gas analyzer is equipped with a special cell where the tested gas flow comes into contact with the bromine water solution. The gas stream containing olefins is passed through the solution under specified conditions, such as contact time and temperature. The degree of discoloration of the solution is directly related to the concentration of olefins in the gas mixture: the higher the olefin content, the more pronounced the change in the solution’s color.
To accurately measure the olefin content, the instrument records changes in the intensity of the solution’s color. The quantitative evaluation of the total olefin content is performed based on the degree of discoloration, and the result is expressed as a percentage (%), corresponding to the volumetric fraction of olefins in the contact gas. To ensure high measurement accuracy, the gas analyzer is pre-calibrated using standard gas mixtures with known olefin concentrations. Calibration data allow for establishing a clear relationship between the degree of discoloration and the concentration of olefins.
The study involved developing a base catalyst, rhodium supported on natural zeolite—1%Rh/HCpt, as well as its tin-modified forms 1%Rh/10%SnO/HCpt and 1% Rh/10% SnO/5% K
2O/HCpt. Natural zeolite from the Shankanai field (Kazakhstan) was used as a support, the main phase of which is clinoptilolite (Cpt), which is characterized by an increased content of iron oxides (up to 10%), compared to other clinoptilolites [
12].
The oxide and elemental composition of the natural zeolite from the Shankanai field was determined by the emission-spectral analysis on a DFS-13 diffractometer and an ICAP PRO XP Duo inductively coupled plasma atomic emission spectrometer, Thermo Fisher Scientific (Waltham, Massachusetts, USA). The X-ray phase analysis of natural and modified zeolite was performed on D8 Advance (Bruker, Billerica, Massachusetts, USA) with Cu-α radiation (40 kV, 40 mA). The data processing was performed in the EVA program, and phase decoding was performed in the Search/Match with PDF-2 Rel. 2012 (ICDD) database. The IR spectra were recorded on a NICCOLET-2700 spectrometer in the range of 400–4400 cm−1. The catalyst was formed in the form of tablets with a thickness of 60–100 mg/cm2. The adsorption of the test gases was studied at different temperatures with vacuuming to 10−5 Torr. The porous characteristics of the catalytic systems were determined using a Gemini VII, 2390a specific surface area and porosity analyzer. Rhodium (Rh), tin (Sn) and potassium (K) were deposited on the zeolite surface by impregnation from solutions of their salts. The concentration of the solutions was selected so as to provide a given content of components in the catalyst (1%Rh/10%SnO/5%K2O/HCpt), where the loading values are given in mass percent (% weight). For impregnation, a solution of rhodium chloride of the composition RhCl3-6H2O (ω (Rh, %) = 36.01), tin chloride SnCl2-2H2O (ω (Sn, %) = 52.59) and potassium carbonate K2CO3 (ω (K, %) = 56.52) was used. After application of the active components, the samples were dried at 120 °C for 4 h and then calcined at 500 °C for 4 h to fix the active components on the zeolite surface.
3.2. Methods of Studying the Catalysts
The morphology and microrelief of the surface, the elemental composition and the distribution of elements over the surface of the initial, reduced and spent samples of the base catalyst 1.0% Rh/HCpt and both of its tin-modified forms were studied, using a JSM-6X80 series scanning electron microscope (SEM)( JEOL Ltd., Tokyo, Japan) with a spatial resolution of 1 and 10 Å and a JEM-2010 high-resolution transmission electron microscope (BP TEM)( JEOL Ltd., Tokyo, Japan) with an accelerating voltage of 200 kV and a resolution of 1.4 Å (0.14 nm). The microanalytical studies were carried out using a Philips CM–20 electron microscope (FEI Company, Eindhoven, The Netherlands) equipped with an energy-dispersive X-ray spectroscopy (EDAX) spectrometer) (EDAX, Pleasanton, California, USA). Changes in the active states of rhodium in the samples were evaluated by analyzing X-ray photoelectron spectroscopy (XPS) data obtained on a KRATOS spectrometer) (Kratos Analytical Ltd., Manchester, United Kingdom). An X-ray source without monochromator was used for imaging. The radiation energy of Mg Ka—was 1486.6 Eu. The energy scale calibration was carried out using the Au4f7/2 binding energy of 84.0 eV. The sample was applied to the prismatic holder using double-sided adhesive tape after preliminary rubbing in a jasper mortar. Qualitative control of the chemical composition of the surface was carried out by overview spectra with a range of 0–1100 eV.
To analyze the quantitative composition and chemical state of elements, narrow regions were surveyed, and the mode was used: transmission energy of the spectrometer HV-25 eV, sweep step—0.1 eV. To obtain the final figures and data, the standard graphic package ‘EasyPlot’ (for Windows) was used, which allows calibration and normalisation of spectra, their smoothing and calculation of the area under the curve, besides, it is possible to construct difference spectra. The influence of all interaction effects was taken into account: change of absorption characteristics of the sample; selective excitation of secondary and absorption of primary radiation; superposition of characteristic radiation lines on analytical ones; change of background, consisting mainly of primary radiation scattered on the sample and spectrometer parts, with change of chemical composition and structure of the sample. Calculation of element binding energies was carried out using C1s lines as an internal standard, the value of which was taken as 284.8 eV. The surface content of elements was calculated on the basis of empirical elemental sensitivity factors given by Briggs for analyzers with constant transmission energy [
30]. The program “WinCalc” was used to perform peak decomposition into components.
Concentrations of elements were determined from the ratio of intensities of experimentally obtained corresponding XPS peaks:
where I is the intensity of the element spectra, S is a constant coefficient for each level of each atom, the so-called atomic sensitivity factor. The values of S are determined empirically for all stable elements. These values for all the most intense lines of each element are given in the reference tables.
The structural and phase characteristics of the catalysts were studied, using the X-ray phase analysis (XPA) and IR spectroscopy. It was found that acid activation and subsequent application of the active components lead to the formation of new acid sites, which significantly increases the catalytic activity [
13].
For the acid-activated sample of natural zeolite, the strength and concentration of acid sites were determined, using the IR method for the CO adsorption. The infrared spectra of the HCpt-1 sample in the region of the OH-group stretching vibrations were recorded on a Shimadzu FTIR-8300 IR Fourier spectrometer in the region of 700–6000 cm−1 with a resolution of 4 cm−1 and a number of scans equal to 100.
3.3. The Catalytic Experiments
The experiments were conducted in a flow-type setup, using a fixed catalyst bed at the atmospheric pressure. This allowed the gas and liquid flow rates to be varied over a wide range, as well as the temperature to be changed over the range from 450 to 600 °C. The feed rate of the feed mixture was varied in the range of 60–1200 h−1.
The catalytic dehydrogenation of the C1–C4 alkane mixtures was carried out under various conditions: (1) in the presence of hydrogen, (2) without hydrogen, (3) in the presence of water vapor and hydrogen, and (4) in the presence of water vapor only. The volume ratio of feedstock to hydrogen varied in the range of 1–20:1, and the ratio of feedstock to water vapor in the range of 1:10
−1. The dilution of the dehydrated alkane with hydrogen or water vapor is an important technological technique that allows one to shift the equilibrium and achieve a high yield of olefins [
13]. In this work, dilution is due to the fact that these substances, without entering into the reaction, actively participate in the adsorption processes, contributing to the achievement of a nonequilibrium state and influencing the reaction mechanisms.
