Article

Production of Sustainable Synthetic Natural Gas from Carbon Dioxide and Renewable Energy Catalyzed by Carbon-Nanotube-Supported Ni and ZrO2 Nanoparticles

by
João Pedro Bueno de Oliveira
1,
Mariana Tiemi Iwasaki
1,
Henrique Carvalhais Milanezi
1,
João Lucas Marques Barros
1,
Arnaldo Agostinho Simionato
1,
Bruno da Silva Marques
2,
Carlos Alberto Franchini
2,
Ernesto Antonio Urquieta-González
1,
Ricardo José Chimentão
3,
José Maria Corrêa Bueno
1,
Adriana Maria da Silva
2,* and
João Batista Oliveira dos Santos
1,*
1
Departamento de Engenharia Química, Universidade Federal de São Carlos, São Carlos 13565-905, Brazil
2
Instituto Nacional de Metrologia, Qualidade e Tecnologia (INMETRO), Rio de Janeiro 25250-020, Brazil
3
Laboratorio de Investigación de Procesos Catalíticos y Adsorción (LIPROCAD), Departamento de Fisicoquímica, Facultad de Ciencias Químicas, Universidad de Concepción, Casilla 160-C, Concepción 4070409, Chile
*
Authors to whom correspondence should be addressed.
Catalysts 2025, 15(7), 675; https://doi.org/10.3390/catal15070675
Submission received: 30 May 2025 / Revised: 7 July 2025 / Accepted: 9 July 2025 / Published: 11 July 2025

Abstract

The production of synthetic natural gas in the context of power-to-gas is a promising technology for the utilization of CO2. Ni-based catalysts supported on carbon nanotubes (CNTs) were prepared through incipient wetness impregnation and characterized using N2 adsorption, X-ray diffraction (XRD), transmission electron microscopy (TEM), thermogravimetric analysis (TGA), and temperature-programmed reduction (TPR). The catalysts were tested for CO2 methanation in the 200–400 °C temperature range and at atmospheric pressure. The results demonstrated that the catalytic activity increased with the addition of the CNTs and Ni loading. The selectivity towards CH4 was close to 100% for the Ni/ZrO2/CNT catalysts. Reduction of the calcined catalyst at 500 °C using H2 modified the surface chemistry of the catalyst, leading to an increase in the Ni particles. The CO2 conversion was dependent on the Ni loading and the temperature reduction in the NiO species. The 10Ni/ZrO2/CNT catalyst was highly stable in CO2 methanation at 350 °C for 24 h. Thus, CNTs combined with Ni and ZrO2 were considered promising for use as catalysts in CO2 methanation at low temperatures.

Graphical Abstract

1. Introduction

It is known that the use of fossil fuels leads to CO2 emissions and consequently to an increase in global temperatures [1,2,3]. CO2 emissions have increased in recent years, and several climate changes issues have been documented, such as rising sea levels, flooding, melting polar ice, and catastrophic storms. An additional consequence of climate change is related to human health issues, which can lead to an increase in death rates. The quality, diversity, and quantity of food produced are also affected by climate change. CO2 emissions thus need to be reduced in order to minimize climate change. Several technologies have been developed to reduce CO2 emissions via carbon storage and capture, which has been used mainly in chemical industries by capturing CO2 through absorption using amine. Other approaches to reducing CO2 emissions are in development, such as the conversion of CO2 into high-value products including methanol, methane, carbonates, dimethyl ether, and gasoline, among others [4]. However, the economic viability of the conversion of CO2 into these products is still inferior to that of traditional processes based on raw fossil fuel materials. In the future, processes based on CO2 hydrogenation may tend to become more competitive due to technological advances in process development, mainly water electrolysis, and due to the development of efficient, highly selective, and stable catalysts.
The production of hydrogen, biomethane, and synthetic natural gas has been pointed out as a transition for the decarbonization of fossil fuels, decreasing CO2 emissions and reaching climate neutrality in the near future. The industrial production of hydrogen is based on steam and autothermal reforming of CH4, while green hydrogen can be produced through water electrolysis using renewable energy. Synthetic natural gas is synthesized through the reaction between captured CO2 and H2. In this way, power-to-gas (PtG) technology has emerged in recent years as a sustainable solution in the renewable energy sector [5,6,7,8,9,10,11,12,13,14]. The PtG process converts surplus power into a grid-compatible gas (H2 and CH4) by using water electrolysis to produce H2, and then captured CO2 reacts with H2 to form CH4 via a methanation reaction (Reaction (1)). The produced CH4, called synthetic natural gas, which can be used as a replacement for natural gas, can be injected into the existing gas distribution grid and then used in several applications on demand. Although H2 is produced through PtG, its injection into the gas distribution network is limited due to technical restrictions and regulations, while synthetic natural gas is compatible with natural gas and therefore can be injected into the gas distribution network following the regulations for natural gas. Thus, electricity produced using renewable energy sources can be stored using CH4 from the PtG process. In addition, other energy systems can be coupled with the PtG process, such as the heating and transportation sectors. In the reverse direction, cycle gas turbine power plants can convert CH4 into electricity. Industrial, pilot, and demonstration plants based on PtG technology are in operation in Europe, Canada, Japan, and other countries [9,13].
CO2 + 4H2   CH4 + 2H2O     ΔH298K = −164 kJ mol−1 Reaction (1)
The CO2 methanation reaction was first studied by Paul Sabatier in 1902, and recently, this reaction has received special attention due to it being an effective method for decreasing our carbon footprint while producing CH4 [15,16,17]. This reaction is catalyzed using noble and non-noble metals, and it is carried out at 150–600 °C and low pressures. Several catalysts such as Pd, Rh, Ru, Pt, Ni, and Co have been studied for producing CH4. It is known that noble metals present higher catalytic activity and stability than non-noble metals. However, non-noble metals are generally chosen for industrial applications due to their low cost compared to that of noble metals. Additionally, using non-noble Ni-based catalysts for CO2 methanation has been reported more often. In addition to the role of the metal, the support is essential for the design of an efficient catalyst for CO2 methanation—for example, supports like Al2O3, ZrO2, SiO2, TiO2, La2O3, CeO2, Y2O3, Sm2O3, and combinations such as ZrO2-Al2O3, Al2O3-La2O3, and CeO2 [18,19,20,21,22]. For CO2 methanation, CO2 adsorption and activation occur preferably in the support, and properties such as its basic sites, oxygen vacancies, and metal–support interaction are critical to obtaining high activity and CH4 selectivity [19,23,24,25,26]. Regarding the support, several works have reported that Ni/ZrO2 catalysts show higher activity and CH4 selectivity during CO2 methanation reactions than Ni supported on other supports does [27,28]. The higher activity of Ni/ZrO2 is associated with the improved interaction of CO2 with ZrO2 increasing its reactivity and facilitating CO2 adsorption and activation [25,29,30,31]. A beneficial role has been associated with the presence of oxygen vacancies in supports such as CeO2, ZrO2, and TiO2, to mention a few, enhancing the CO2 adsorption and activation during CO2 methanation, as reported in studies like [32,33]. These vacancies, consisting of defects and faults on the oxide’s surface, alter the oxide’s stoichiometry, thereby modifying its electronic properties and chemical reactivity [34]. During CO2 hydrogenation, oxygen vacancies form through the adsorption of hydrogen atoms (reducing species) onto the oxide’s surface, followed by electron transfer to a surface oxygen atom, which is subsequently removed, creating the vacancy. The relationship between oxygen vacancies and catalytic activity in CO2 methanation has been explored for Ni supported on various oxides [33]. Furthermore, it has been reported that the interaction between Ni and reducible oxides stabilizes nanoparticles at the nanoscale [33]. In this regard, CO2 hydrogenation is a size-dependent reaction, where the reaction mechanism changes according to the particle size [34,35]. Larger particles enhance H2 dissociation, favoring CH4 production over CO production [36]. Additionally, the synergy between metal nanoparticles and their support not only stabilizes the particle size but also influences the reaction mechanism. This metal–support interaction is often associated with the strong metal–support interaction (SMSI) phenomenon, first described by Tauster et al. [37], for reducible oxides like TiO2. SMSI involves the encapsulation of metal by reduced oxide species or electron transfer from the support to the metal following high-temperature reduction. Combined theorical and experimental studies of Pt/CeO2 have revealed two coexisting interaction mechanisms: an electronic effect involving electron transfer from Pt to CeO2 and oxygen reverse spillover, where activated oxygen migrates from CeO2 to Pt. The oxygen reverse spillover is a nanoscale phenomenon, occurring only on nanostructured ceria supports and not on ordered bulk ceria surfaces [38]. As a matter of the fact, it has been observed a clear relation between nanosized reducible oxides on the metallic nanoparticle stabilization [39].
While bulk ZrO2 is often classified as non-reducible, nanosized ZrO2 (0.9–1.9 nm) is reducible, forming Zr3+ sites [40,41]. Density Functional Theory (DFT) calculations indicate that ZrO2 nanoparticles undergo reductive homolytic splitting of H2, forming two OH bonds and transferring two electrons to Zr3+ sites, which is the preferred adsorption mechanism in an exothermic reaction. The presence of metal, such as Ni, further promotes the reduction of ZrO2 and enhances the catalytic performance. Espino et al. [42] compared Ni/ZrO2 and Ni/Mg(Al)O catalysts, finding that oxygen vacancies, created through the incorporation of Ni into the ZrO2 lattice and intrinsic lattice defects, enhanced CO adsorption and dissociation at lower temperatures (<400 °C), whereas Ni/Mg(Al)O only exhibited a comparable performance at >400 °C. Despite the good performance of Ni/ZrO2 catalysts, a more efficient catalyst is required. Numerous studies have demonstrated progress in CO2 methanation through the development of novel Ni catalysts, employing various preparation methods and combinations of supports and promoters. Nevertheless, these catalysts exhibit limited activity within the 200–400 °C temperature range.
A strategy to improve the activity of hydrogenation reactions has been developed by using carbon nanotube (CNT)-supported catalysts [43,44,45]. Other reactions have also been studied using CNTs, and the results indicated better activity, selectivity, and stability when CNTs were employed as the support [46,47,48,49,50,51,52,53]. CNTs exhibit the proper mechanical strength and thermal conductivity, as well as high mobility and electronic conductivity, which can increase the electron transfer rate during reaction [43,44,54,55]. Also, CNTs have the capacity to store and activate H2, promoting the reduction of nickel oxide species within the 300–500 °C temperature range [56,57,58]. In addition, sintering of the nickel nanoparticles can be avoided by using CNTs in the hydrogenation of both CO and CO2 [43,44,45]. As an example, during a 100 h stability test, the size of the active particles on the exterior surface increased, whereas the particle size inside the CNTs remained the same [45]. This feature indicates the potential of CNTs for use in catalyst preparation.
Ni catalysts supported on CNTs have been reported to be active for CO2 methanation reactions [45,59,60,61]. Wang et al. [45] studied CO2 methanation at 350 °C using Ni supported on CNTs and modified with CeO2. The authors reported that a conversion of approximately 84% of CO2 and a selectivity for CH4 close to 100% were obtained using Ni/CNTs promoted using 4.5 wt.% Ce. This behavior was associated with the availability of the active sites for CO2 methanation due to the properties of Ni/Ce/CNT [45]. The addition of CeO2 into Ni/CNT modified the catalytic properties, increasing the CO2 conversion from 61% on Ni/CNT to 84% on Ni/Ce/CNT. In addition, the CO2 conversion for the Ni/Ce/Al2O3 catalyst was close to 64%, and the CH4 selectivity was 98%. This indicates that the CNTs made a positive contribution to the catalytic activity in CO2 methanation [45].
Romero-Sáez et al. [61] prepared a Ni-ZrO2 catalyst supported on CNTs containing 5 wt.% Ni and 20 wt.% ZrO2 using sequential impregnation and co-impregnation methods. These catalysts were tested for CO2 methanation between 200 and 500 °C. The catalyst prepared through sequential impregnation led to an H value ≈ 55% in CO2 conversion and 98% selectivity for CH4 at 400 °C. In contrast, for the catalyst prepared through the co-impregnation method, the conversion and selectivity were 30 and 35%, respectively.
The results from the co-impregnated catalyst were due to the coverage of the Ni species by ZrO2, which inhibited the active sites for CO2 methanation, while the highest activity in the catalyst prepared through sequential impregnation was linked to the largest Ni-ZrO2 interface available to the reactants [61].
Although carbon nanotubes (CNTs) possess excellent properties as catalyst supports, their application depends on the reaction conditions, including temperature and feed composition. In fact, CNTs can decompose at high temperatures and in streams containing oxidizing and reducing species. For example, Hu and Ruckenstein [62] reported a weight loss of approximately 52% and 30% after treatment of single-walled carbon nanotubes (SWCNTs) with CO2 and H2 at 800 °C for 2 h, respectively. Duong et al. [63] studied the behavior of vertically aligned single-walled carbon nanotubes (VA-SWCNTs) as a function of temperature in a thermobalance using an air stream. The authors observed high decomposition of the VA-SWCNTs above 500 °C and almost total decomposition above 600 °C. The thermogravimetric analysis of the raw MWCNTs under the air stream indicated total decomposition above 600 °C [64,65].
As few publications have been reported on the impact of CNT decomposition during the reduction of catalysts and reactions on the catalysts’ structure and activity, we have prepared Ni/ZrO2 supported on CNTs in order to investigate the role of the catalyst reduction temperature (300, 400, and 500 °C) in the hydrogenation of CO2 into CH4. In addition, the effect of Ni loading on the methanation reaction was evaluated. The main objective was to gain insight into the use of CNTs as a support in CO2 methanation.
Ni-ZrO2 supported on CNTs were synthesized through incipient wetness impregnation and tested for CO2 methanation. The catalysts were characterized using N2 adsorption-desorption, XRF, XRD, in situ XRD, Raman spectroscopy, N2 physisorption, TGA, H2-TPR, and TEM-EDS. These findings aim to advance the development of efficient catalysts for sustainable CH4 production and provide a knowledge base for progressing CO2 conversion technologies within the power-to-gas framework.

2. Results and Discussion

2.1. Catalyst Characterization

2.1.1. Elemental Composition

XRF and TGA were employed to quantify the actual amount of NiO and ZrO2 on the CNTs. The amounts of NiO and ZrO2 in each sample obtained through the XRF measurements are shown in Table 1. It is interesting to note that the total amount of NiO, ZrO2, and NiO plus ZrO2 was 100% for all samples because the carbon was not analyzed using XRF, as detailed in the experimental section. The TGA results for the CNT samples during heating under the air flow (Figure S1a) show that the weight loss was about 15% wt.% at up to 550 °C, which may have been due to the release of adsorbed species and the decomposition of some functional groups of the CNTs. Above 550 °C, the weight of the CNTs drops drastically to zero, indicating total degradation of the CNTs at 700 °C. The behavior of the 10Ni/CNT sample was similar to that observed for the CNT sample, but total degradation of the CNTs present in the 10Ni/CNT samples occurred at 500 °C, and the residual weight was attributed to about 13.1 wt.% of NiO. The behavior for the other samples used in this work (Figure S1b) was similar to that observed for the 10Ni/CNT sample, and the residual weight observed in the samples containing ZrO2/CNT and Ni-ZrO2/CNT can be attributed to the presence of ZrO2 and NiO/ZrO2, respectively. The addition of Ni to the CNT-based samples shifted the temperature of total CNT decomposition from 700 °C to 500 °C, suggesting a promoting effect of NiO on the CNT decomposition. Similar behavior was observed in other studies when heating CNT-based catalysts in air [66]. Finally, the amount of NiO and ZrO2 in the samples was determined using both XRF and TGA experiments. Thus, the results shown in Table 1 reveal that the amounts of metallic Ni and ZrO2 were consistent with the nominal values, indicating that the impregnation method was successfully applied in the preparation of the catalysts.

2.1.2. The Textural Properties of the Samples

The nitrogen adsorption–desorption isotherms and pore size distributions of the samples are shown in Figure S2. The analysis of the pore size distribution indicates the presence of mesopores in the 2 to 5 nm and 5 to 90 nm ranges for all samples. The pores between 2 and 5 nm can be attributed to the CNTs’ porous structure, and the pores above the inner diameter of the CNTs can be attributed to inter-bundle pores, which are formed between CNT bundles [67,68,69,70]. The specific surface area (SBET), pore volume (VP), and pore diameter (DP) for the calcined and reduced samples are shown in Table 2. All samples show type IV isotherms and type H1 hysteresis, typical of solids with medium interactions between the adsorbate and the adsorbent, featuring mesopores that consist mostly of nearly cylindrical channels [67].
It can be seen in Table 2 for the calcined and reduced samples that the specific surface area decreased after Ni and ZrO2 impregnation, suggesting that some pores were filled during the impregnation step, slightly decreasing the pore volume. Other studies have also reported a reduction in the specific surface area after the impregnation of CNTs [31,46,50]. The specific surface area and pore volume increased after the reduction of the calcined sample at 500 °C for 1 h in the H2 stream. However, for the reduced CNT-based samples, there was little influence on the average pore size. The method used to prepare the CNTs and the chemical or physical treatment for purifying or changing the CNTs can modify the specific surface area and pore volume. For example, Fujiwara et al. [71] observed an increase in SBET from 240 to 501 m2g−1 after oxidative treatment of CNTs at 350 °C for 1 h. Kocabas et al. [72] reported that treatment of CNTs in air at 575 °C increased SBET from 230 to 2230 m2g−1, but SBET decreased to 351 m2g−1 after the addition of Pd into the treated CNTs. According to the literature [71,72], oxidative treatment of CNTs removes their caps, opening the tubes and consequently increasing their adsorption capacity and SBET. Thus, the reduction of the calcined samples modified the textural properties by opening some of the closed CNTs and introducing defects into the CNT-based samples after H2 treatment at 500 °C.

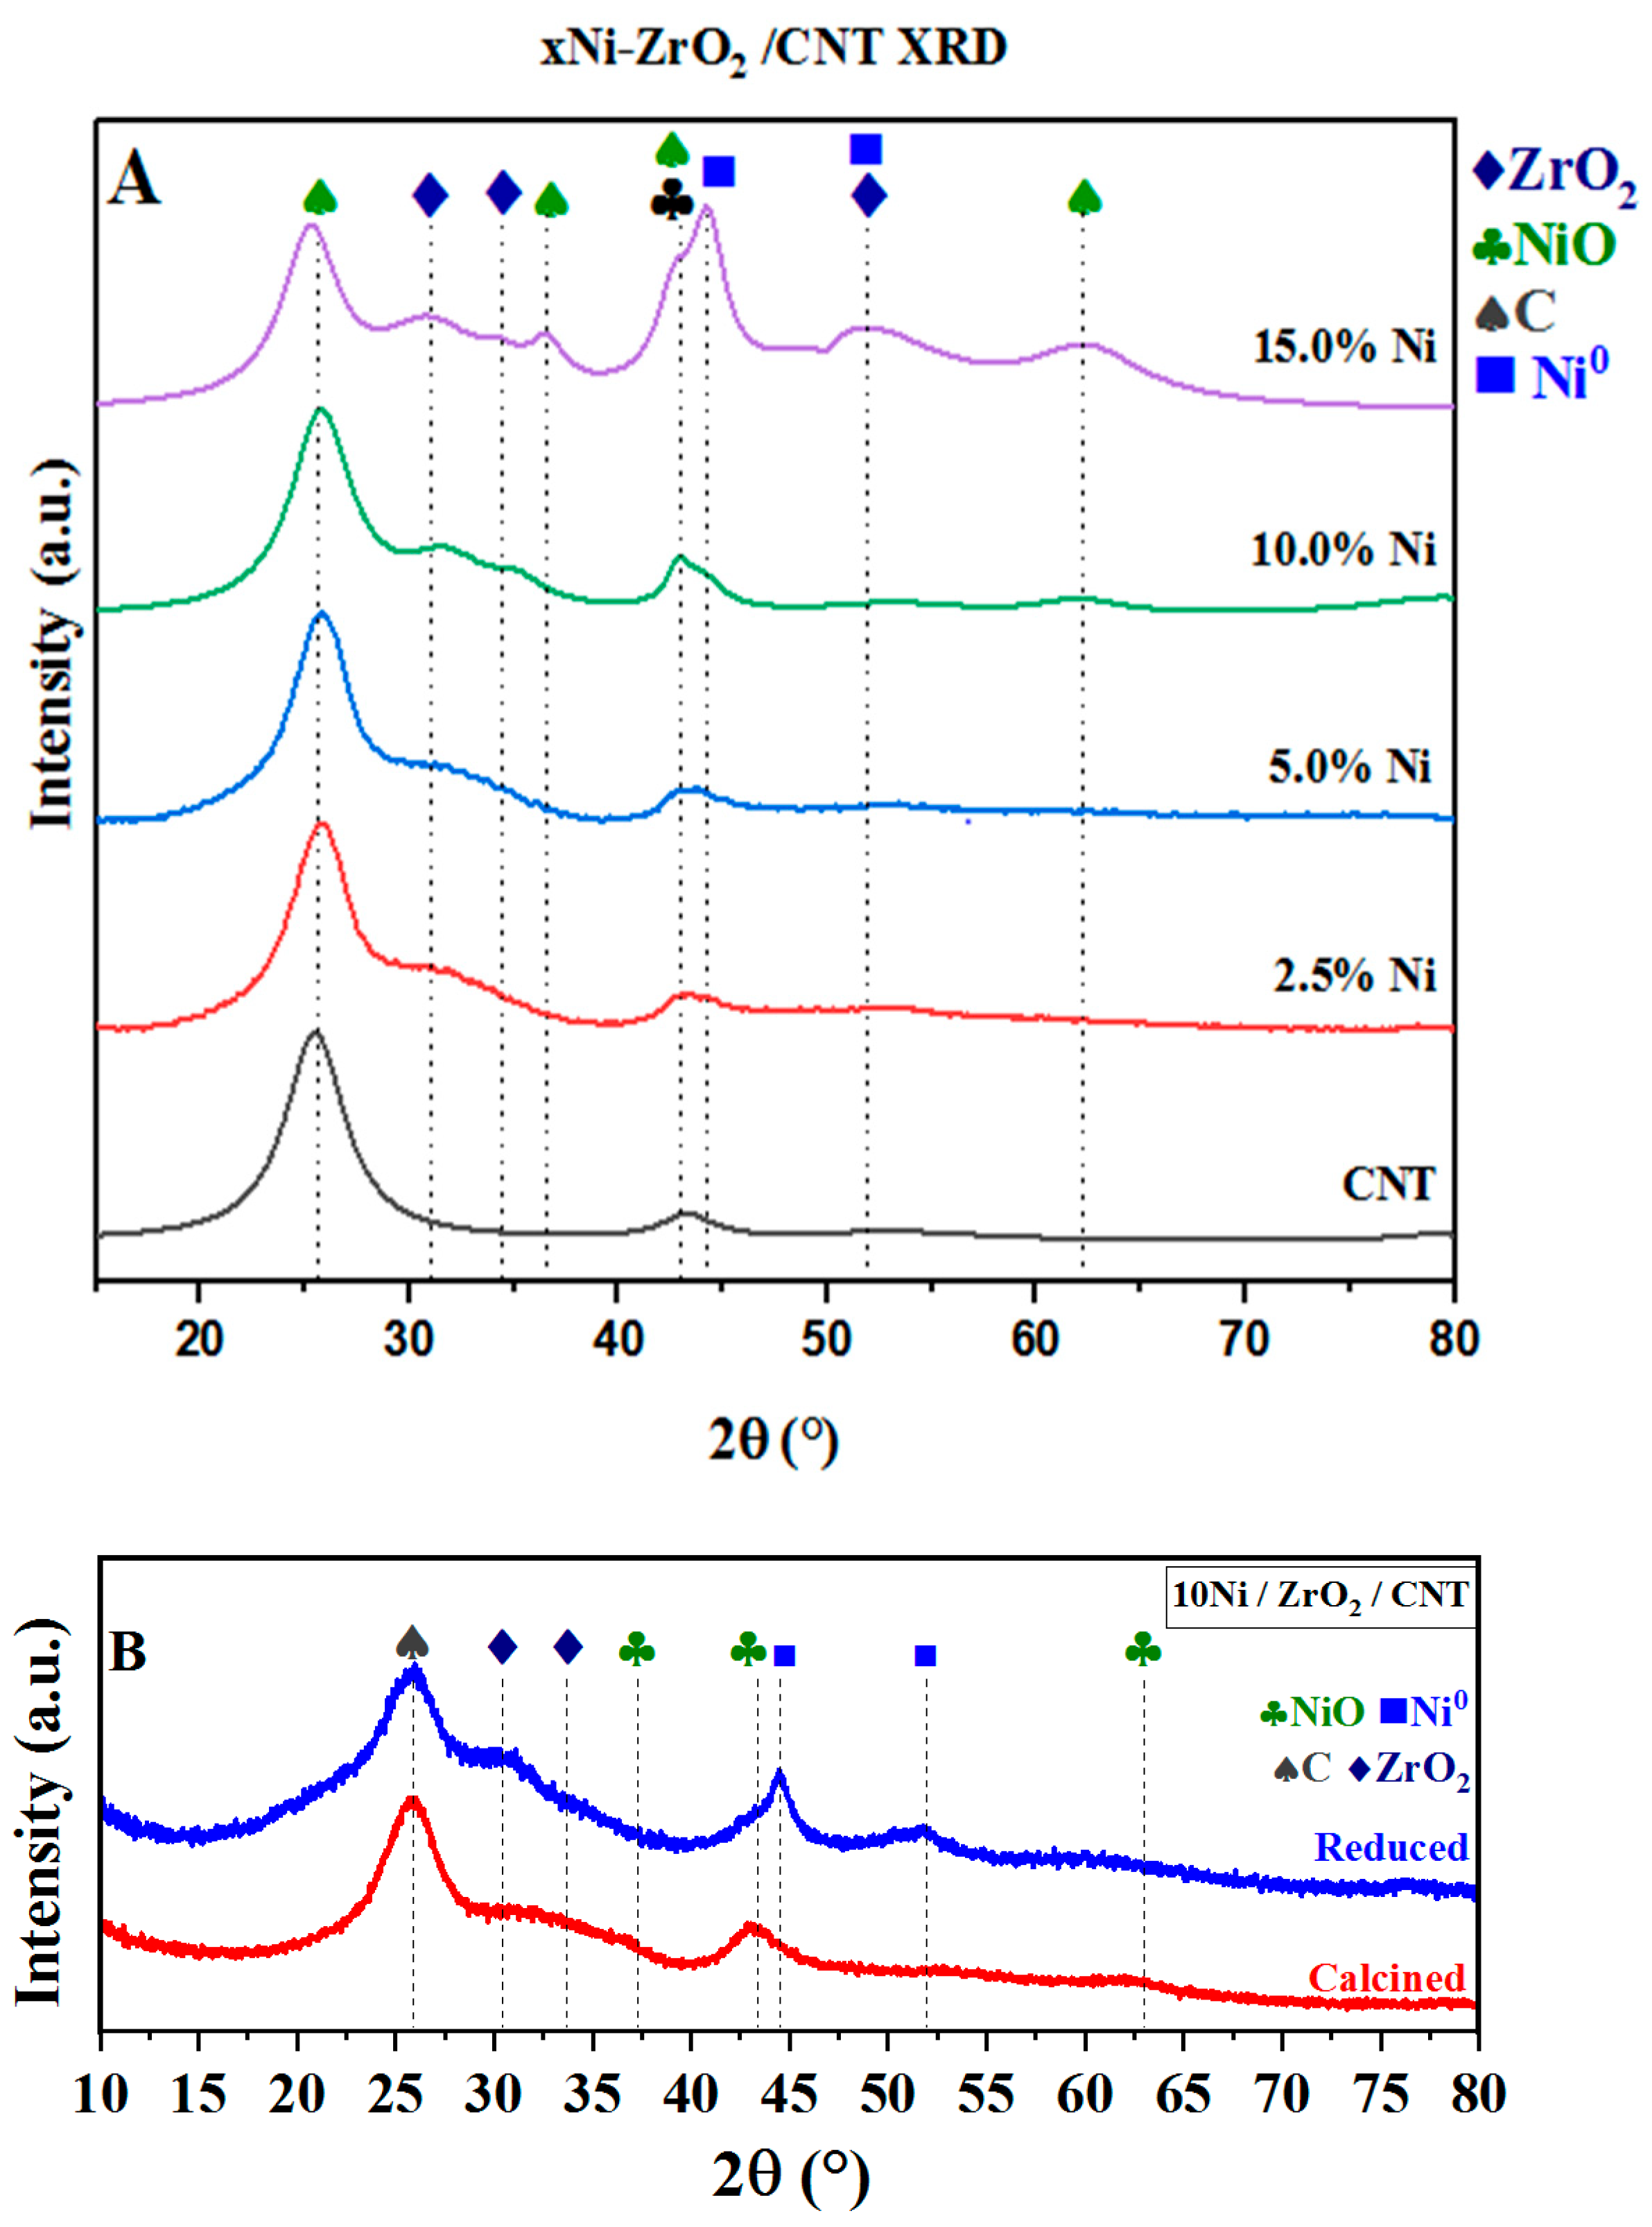
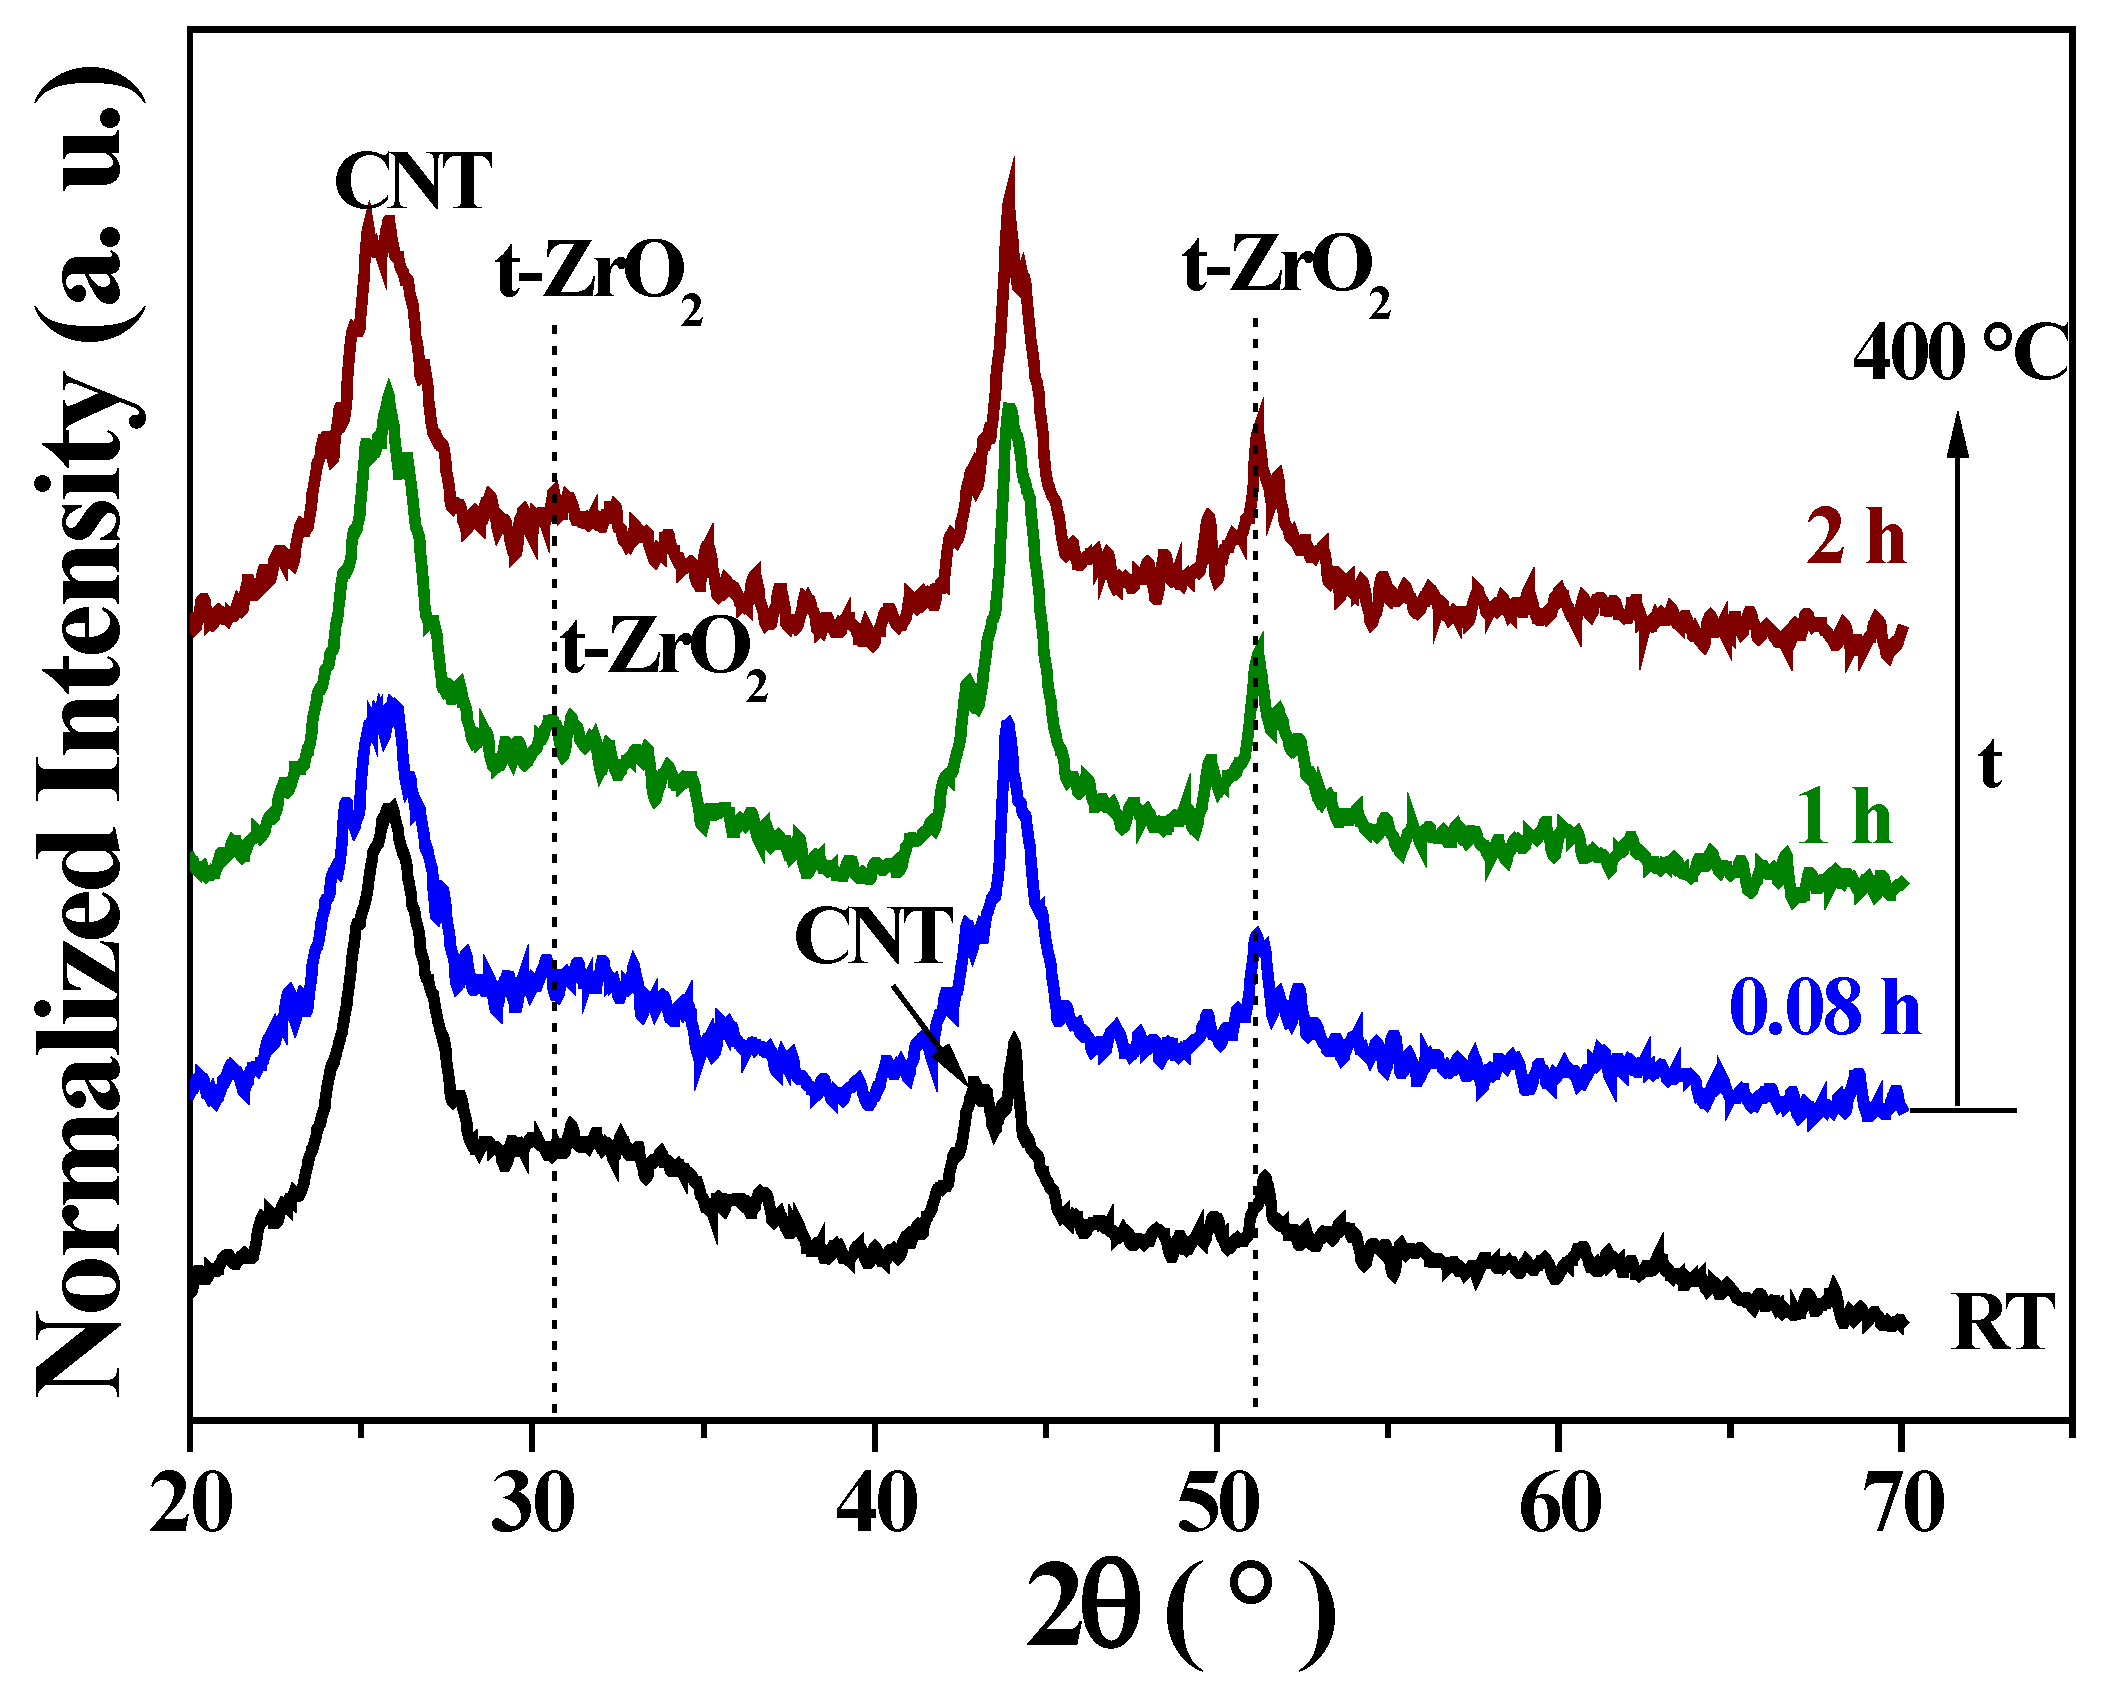
2.1.3. X-Ray Diffraction

The catalysts’ microstructural behavior was analyzed through powder X-ray diffractometry. The CNT diffractogram (Figure 1) presented diffraction peaks characteristic of graphite at 26.1° and 43.5° relative to basal planes (100) and (002), respectively (ICDD 00-041-1487) [59,62,63,64]. The expected diffraction pattern for commercial ZrO2 presents peaks at 30.3° and 52.5°, corresponding to the (111) and (311) planes of tetragonal ZrO2. It is well-known that the transition from amorphous to metastable tetragonal ZrO2 crystallization under heating (from 445 to 480 °C) can lead to a monoclinic phase (600 to 1000 °C), as reported in the literature [73,74]. In this work, the ZrO2 samples were calcined at 350 °C under an Ar flow for 2 h, and the XRD results confirmed poor ZrO2 crystallization on all samples [73,74,75,76,77,78,79].
The X-ray diffraction (XRD) results for 2.5, 5, 10, and 15Ni/ZrO2/CNT are presented in Figure 1. With a low Ni content, NiO also appears to be well dispersed in small crystallites (Figure 1A), as signals are barely visible in the samples with a Ni content between 2.5 and 10%. By increasing the Ni loading, the main NiO peak at 43.8°, from (100)-plane reflection of the face-centered cubic structure (ICDD 01-075-0269), becomes more expressive, indicating the formation of larger Ni crystallites, as observed in the diffractograms of the samples containing 15 wt.%. The overall diffraction pattern for 15 wt.% Ni denotes a more organized structure, with a more intense carbon/NiO peak (2θ = 43.1°). Furthermore, the metallic Ni peak appears around 44°, suggesting the reduction of nickel over the CNTs during the calcination process.
The appearance of NiO diffraction peaks and a new ZrO2 feature at 51.9° unveils that a higher Ni content enhances the crystallization of the ZrO2 phase. The overlapping of the CNT and NiO peaks in the 43° 2θ region makes it almost impossible to manually distinguish both signals and estimate the crystallite sizes precisely. Furthermore, NiO and ZrO2 are well dispersed over the nanotubes, as is confirmed by the low intensity and broad peaks, attributed mainly to nanostructure formation, homogeneous dispersion, and poor crystallization, besides possible lattice microstrains and defects.
Figure 1B depicts the changes in the diffractogram of the 10Ni/ZrO2/CNT catalyst after calcination and after reduction at 500 °C for 2 h under a H2 flow. In the calcined sample, the peaks characteristic of NiO are observed to have a very low intensity. After reducing the 10Ni/ZrO2/CNT sample, very low-intensity ZrO2 signals appeared, suggesting growth in the crystallites’ size to some extent under a high temperature and a H2 flow or a zirconium phase transition due to heating. In addition, the reduction of NiO into metallic Ni was confirmed by characteristic peaks at 51.6° and 54° (ICDD 00-004-085). Although larger crystallites are observed, the XRD peak profiles, characterized by a wide base and a broad peak width, suggest the existence of smaller crystallites, indicating that Ni and NiO are primarily present at a smaller scale. This finding is further corroborated by the TEM analysis and elemental mapping.
The reduction of the sample 10Ni/ZrO2/CNT was performed in situ, as depicted in Figure 2 and Figure 3, covering 2θ ranges of 20–70° and 35–55°, respectively. The room-temperature diffractogram recorded before the reduction aligns with the prior results presented here. The diffraction pattern for the fresh sample reveals broad peaks at approximately 2θ of 26° and 43.5°, indicative of CNTs. The enhanced detector resolution in the in situ measurements indicates a peak split in the CNT and NiO region, with peaks at 43.4° and 43.9°, the latter corresponding to the NiO’s primary diffraction. Diffraction lines associated with ZrO2 are also evident. The shape of the NiO peak denotes that NiO species are highly dispersed on the support.
During reduction at 400 °C, a gradual redshift in the spectral features was observed with prolonged exposure, indicating increased crystallization and an expansion of the lattice parameter in the sample. Nevertheless, the peak shapes, characterized by a broad base and low intensity, suggest that the sample remains predominantly amorphous. Figure 3 highlights the 2θ range of 35–55°, where features emerge at 2θ = 51.8 °C and a new peak around 44.5 °C intensifies, corresponding to the (111) and (200) Ni reflections, respectively. However, due to the significant overlap between the main NiO and Ni peaks, it is not possible to confirm the complete reduction of NiO at this temperature.

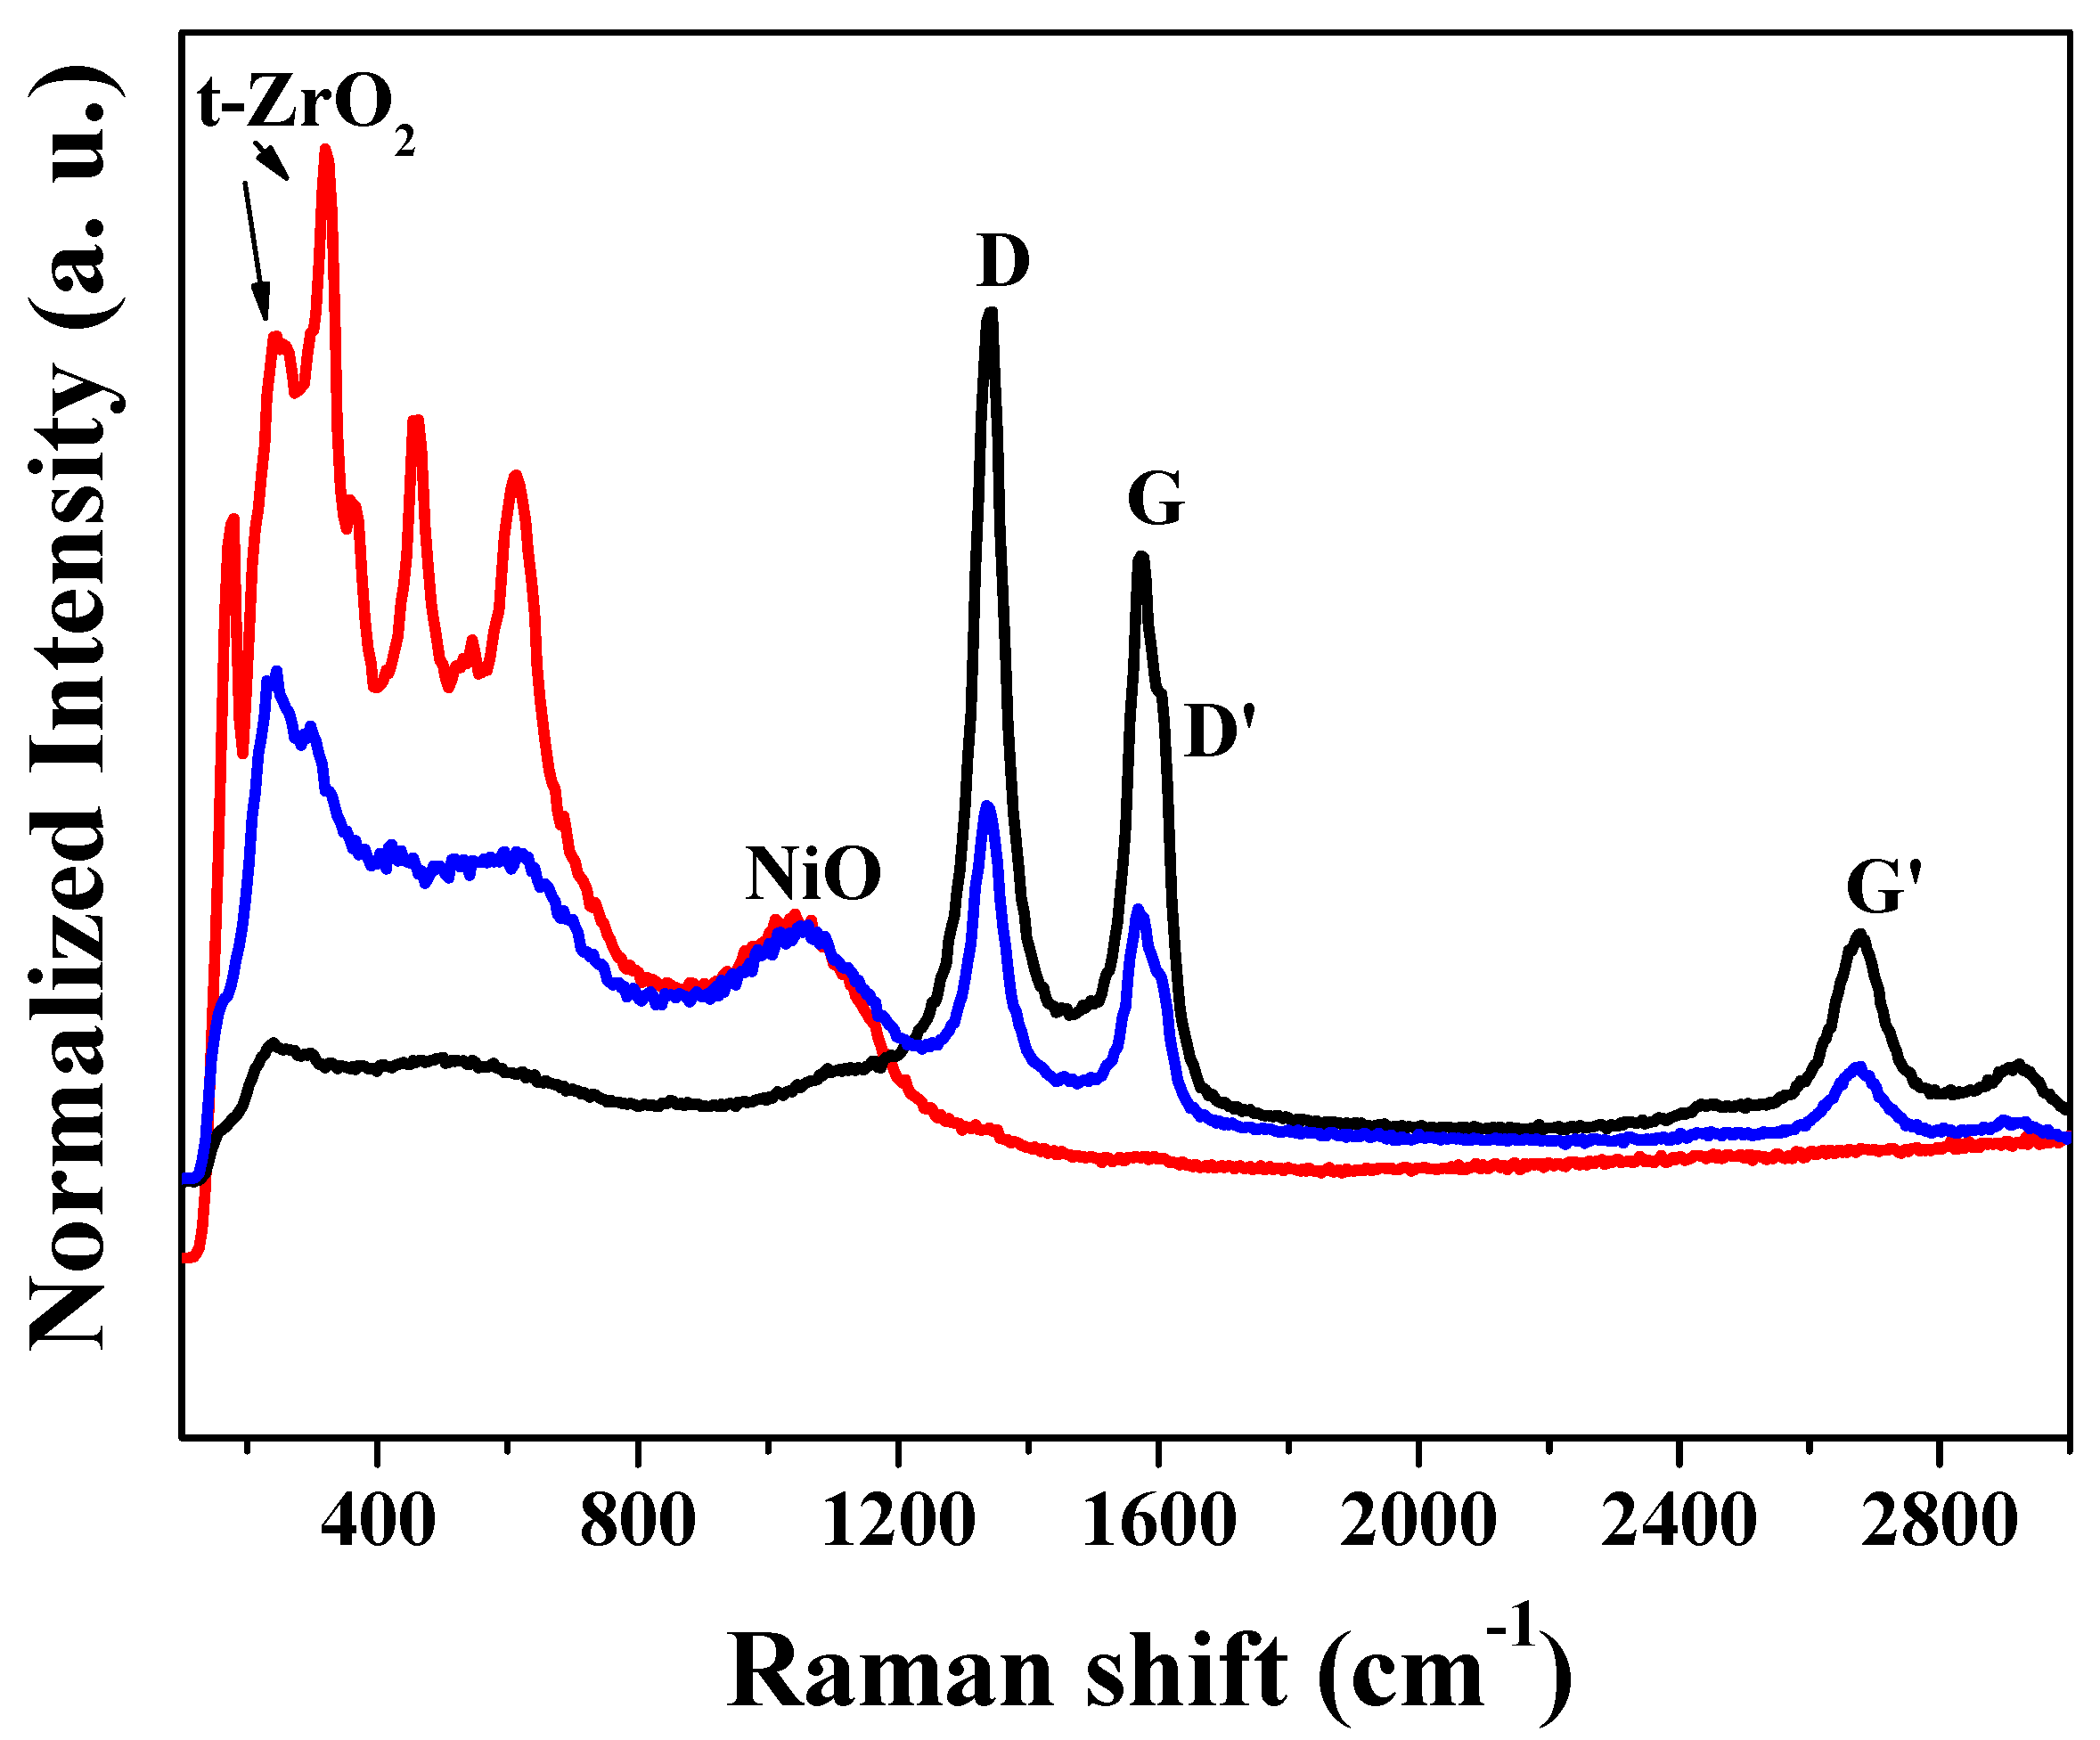
2.1.4. Raman Spectroscopy

The Raman spectra of the fresh 10Ni/ZrO2/CNT sample and the sample after in situ reduction at 400 °C for 2 h are shown in Figure 4. For the calcined samples, Raman spectra from two different regions of the same sample were collected and are depicted using red and black lines, whereas the Raman spectrum of the reduced sample is displayed in blue.
The low-frequency bands at 236 and 324 cm−1 can be assigned to tetragonal ZrO2 (t-ZrO2) [79], while the feature at ~1079 cm−1 is attributed to NiO. The bands in the intermediate region (~470–560 cm−1) result from overlapping contributions of ZrO2 and NiO. Additionally, a band at 164 cm−1 is observed, associated with monoclinic ZrO2 (m-ZrO2), which was not detected in the XRD patterns. This observation is consistent with the higher sensitivity of Raman spectroscopy for detecting minority phases. Thus, although t-ZrO2 is the predominant phase, the presence of m-ZrO2 cannot be ruled out. After reduction, a decrease in the intensity of the low-frequency bands (~236 and 324 cm−1) is observed, indicating a partial transformation or loss of the t-ZrO2 phase. In contrast, the NiO band at ~1079 cm−1 remains unchanged, consistent with the XRD patterns, which show the coexistence of NiO and metallic Ni post-reduction. Raman features associated with carbon materials, including the D (~1350 cm−1), G (~1580 cm−1), D’ (~1620 cm−1), and G’ (~2700 cm−1) bands, are present in both spectra (calcined and reduced) due to the carbon nanotube (CNT) support. The G band is characteristic of well-organized graphitic structures, while the D band reflects defects and atomic vacancies in the structure. The higher intensity of the D band compared to that of the G band indicates a defective CNT structure. Furthermore, the Raman spectra indicate that the sample remains predominantly amorphous after reduction, consistent with the XRD results.

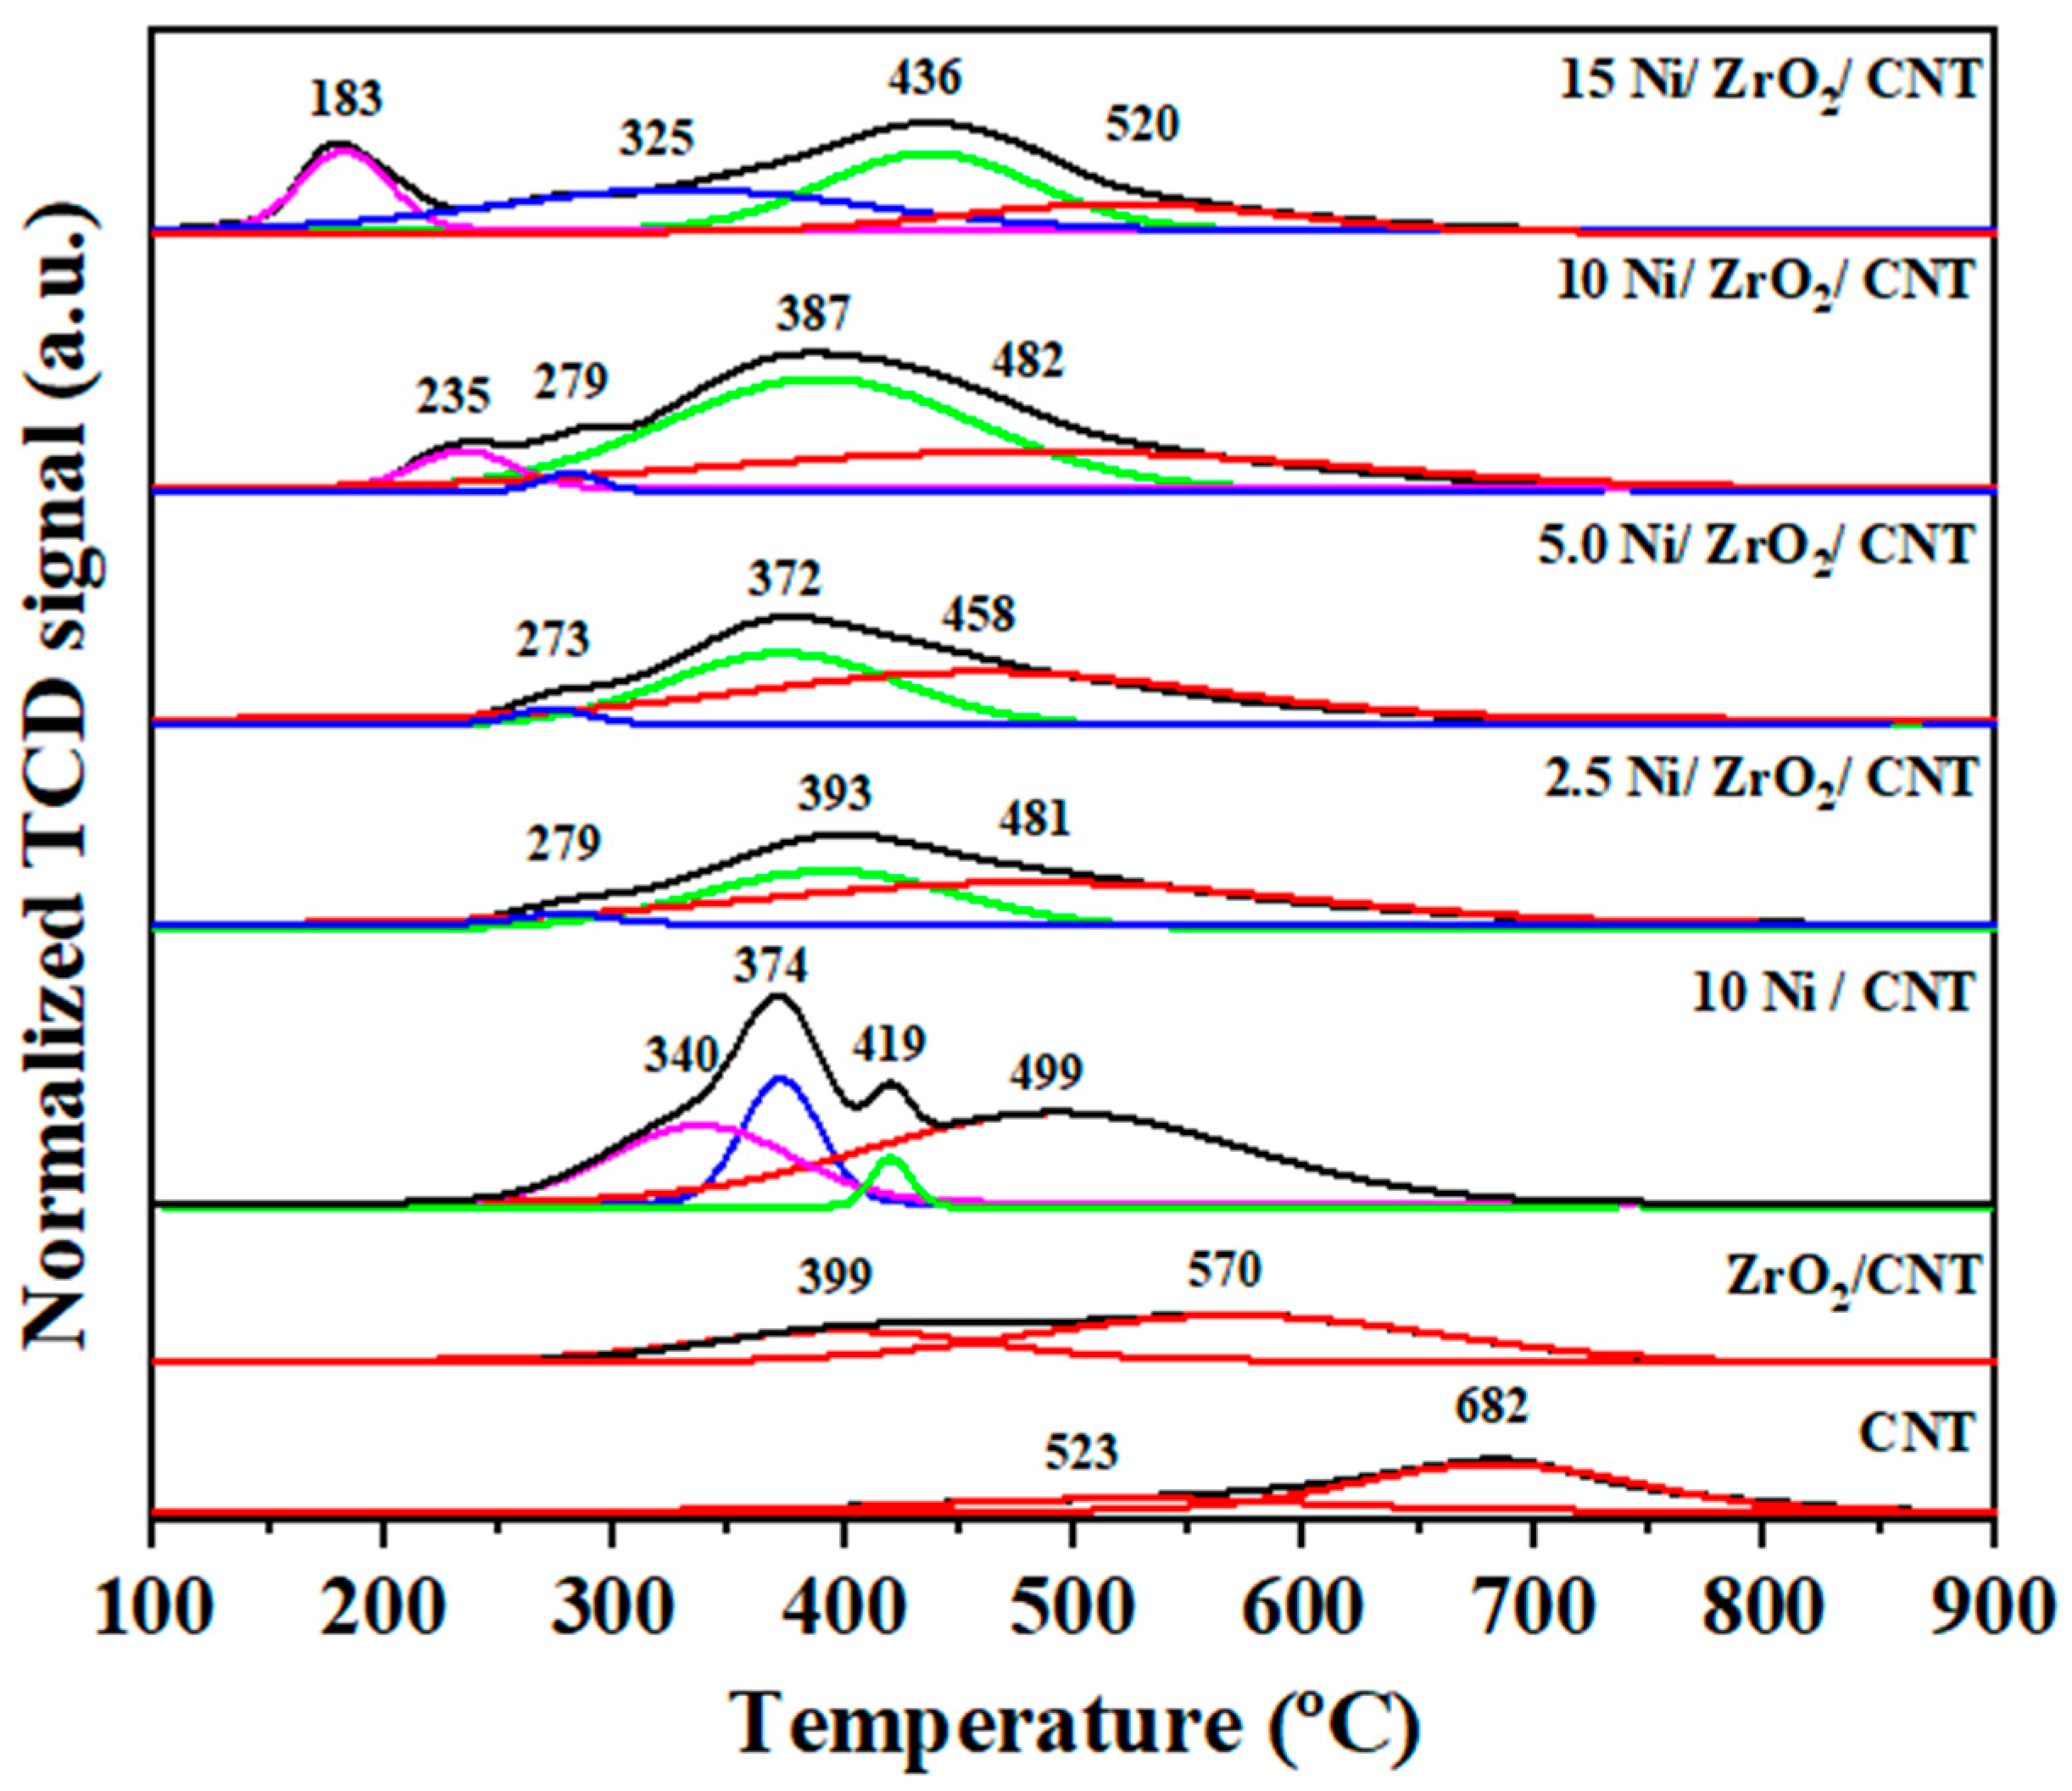
2.1.5. Temperature-Programmed Reduction (H2-TPR)

The H2-TPR profiles for the CNT and Ni-based catalysts are shown in Figure 5. The signals were normalized by the sample mass used in each experiment, and the profiles were deconvoluted to aid the discussion. For the 2.5 and 5.0% Ni materials, three peaks were identified, while for the 10 and 15% Ni catalysts, there were four signals.
For the pure CNT sample, two broad peaks of H2 consumption were observed at around 523 and 682 °C. The first peak can be attributed to the decomposition of the functional groups of the CNT [80], while the second broad peak is likely due to the formation of methane through a hydrogenation reaction of the carbon present in the CNTs with H2 [47,48].
The H2-TPR profile of the 10Ni/CNT sample presents four reduction peaks between 250 and 750 °C, suggesting reduction of the NiO species with different interactions with the CNTs. The first peak at about 340 °C likely corresponds to the reduction of NiO with weak interaction with the CNTs, while the peaks at 374 and 419 °C can be related to the reduction of NiO with moderate and strong interactions with the CNTs (Figure 5), respectively. The last peak at 499 °C can also be attributed to the reduction of NiO with strong interaction with the CNTs, but this peak could also be due to the formation of methane through the hydrogenation of carbon by H2. In addition, according to the literature, reduction of the metal oxide species inside CNTs occurs at lower temperatures than the reduction of metal oxides outside CNTs [47,81]. For example, Chen et al. [82] observed that the reduction of Fe2O3 inside CNTs occurred at a 60–90 °C lower temperature than that observed for Fe2O3 outside CNTs. Furthermore, it is known that the hydrogenation of carbon from CNTs, producing methane, occurs at around 680 °C, but the Ni species catalyzed this reaction, and consequently, the reaction temperature shifted to a lower temperature. In fact, other studies have also reported the gasification of carbon in CNTs catalyzed by metals at temperatures above 500 °C [83]. Thus, the hydrogenation of the carbon present in the CNTs occurred to a greater extent for the Ni-containing CNT samples than for the CNT sample. The degradation of the CNT and Ni-based catalysts will be presented in the next section.
For the ZrO2/CNT sample, the H2-TPR profile shows a large shoulder centered at 620 °C, which is deconvoluted in two peaks, indicating that the decomposition of the functional groups occurred to a lesser extent and that the hydrogenation of the carbon from the CNTs took place at lower temperatures compared to the CNT sample. The addition of ZrO2 promoted the hydrogenation of carbon into methane, but this effect was much smaller than that observed for the Ni/CNT sample.
The Ni/ZrO2/CNT samples loaded with 2.5 and 5.0 wt.% Ni present very similar reduction behavior, with the main H2 uptake occurring at 393 and 372 °C, respectively, corresponding to well-dispersed Ni particles interacting with the support. A secondary peak at 279 °C for 2.5Ni/ZrO2/CNT and 273 °C for 5.0Ni/ZrO2/CNT can be attributed to the weak interactions between the Ni and the support. The increase in the Ni load induced the appearance of a new peak at 235 °C in the 10Ni/ZrO2/CNT sample, which was shifted to 183 °C for the 15Ni/ZrO2/CNT catalyst. These new signals at lower temperatures show that above 10 wt.% Ni loading, some of the metal incorporated is distributed into even bigger particles, with weak interaction with the support. This is corroborated by the decrease in the intensity of the signal at 436 °C and the increase in the peaks at lower temperatures in the 15 wt.% Ni sample’s profile. The formation of larger particles for the samples with higher Ni loading (15 wt.%) is in good agreement with the XRD analysis. The peaks at high temperatures observed for all of the Ni-containing samples can be attributed to the reduction of the Ni with strong interaction with the support, as well as the formation of CH4 through the hydrogenation of CNTs.

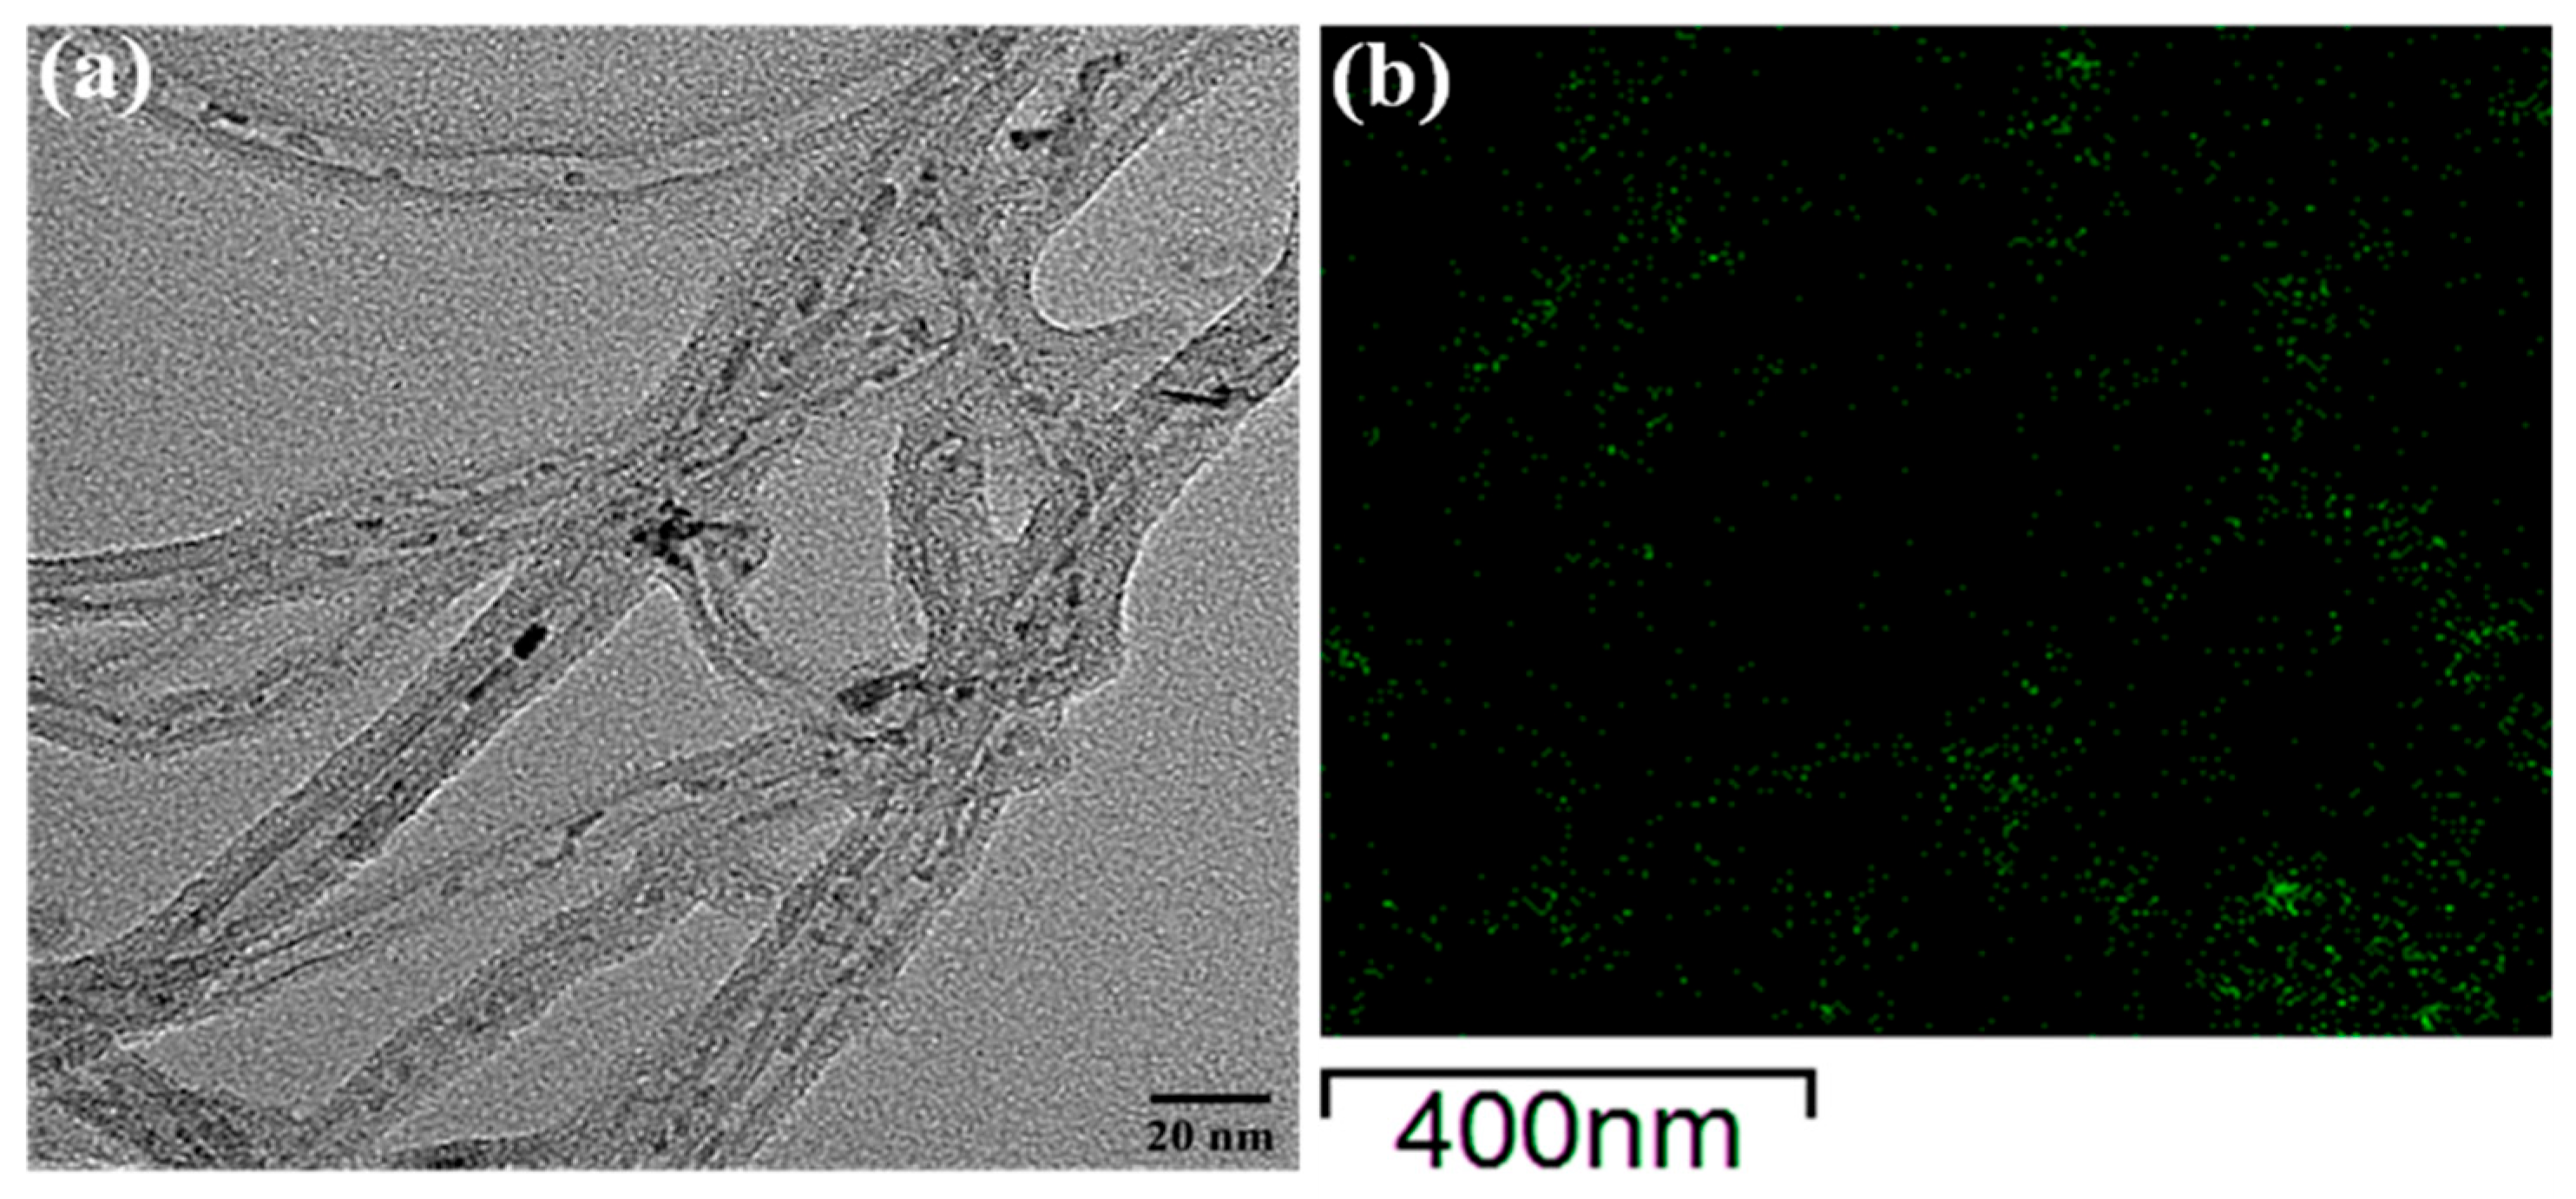
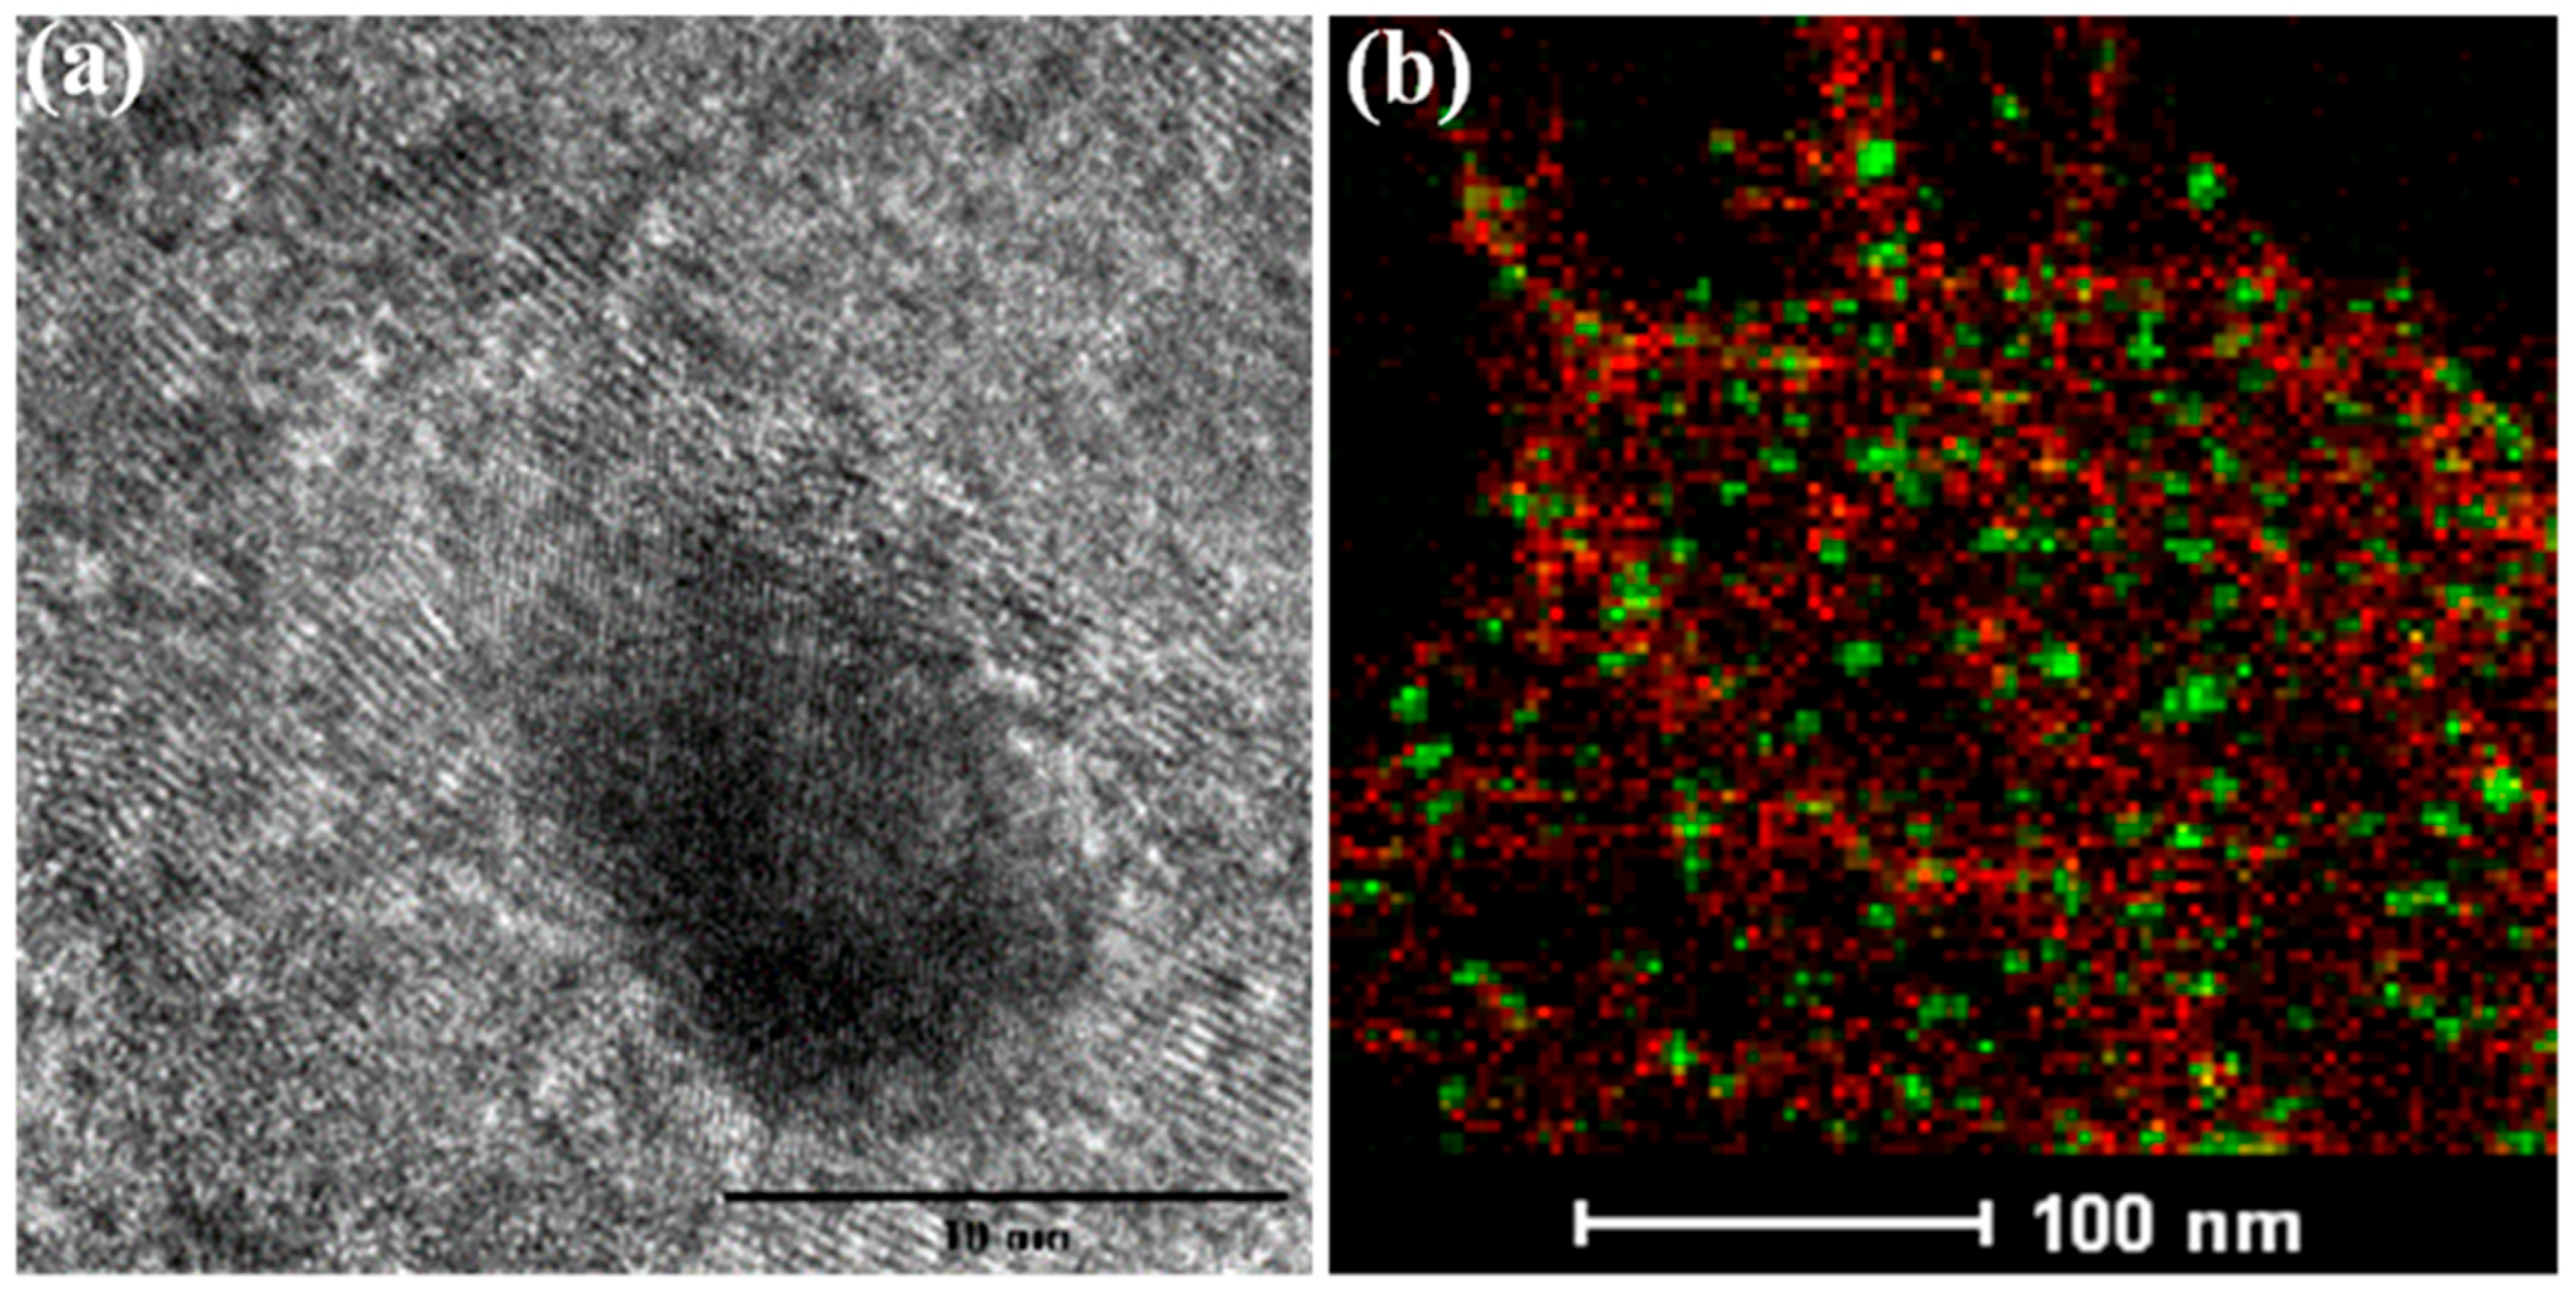
2.1.6. Transmission Electron Microscopy (TEM)

Figure S4 shows the TEM images of the calcined 10Ni/CNT, 10Ni/ZrO2/CNT, and 20ZrO2/CNT samples. The images show nanoparticles of NiO and ZrO2 inside and outside of the CNTs. However, the analysis of the images revealed that most of the particles (NiO and ZrO2) were inside the CNTs, indicating that the incipient wetness impregnation method was successfully applied to preparing the catalysts with nickel and zirconium species inside the CNTs.
The TEM images of the 10Ni/CNT and 10Ni/ZrO2/CNT catalysts (Figure 6 and Figure 7) show that most of the NiO and ZrO2 particles have diameters smaller than the inner diameter of the CNTs. EDS elemental mapping revealed that the Ni and ZrO2 nanoparticles, with sizes of around 2 nm, were well-dispersed in both samples, highlighting the critical role of the CNTs in stabilizing these nanoparticles. Furthermore, EDS elemental mapping indicates intimate contact between Ni and Zr, which likely contributes to the high dispersion of Ni nanoparticles, facilitated by the confinement effect of the CNTs.
TEM images of the samples reduced under the H2 flow at 500 °C are presented in Figure 7, where it is possible to observe a slight coalescence of Ni particles surrounded by small ZrO2 nanoparticles.
Nevertheless, the Ni particles were present at a size smaller than 6 nm. Furthermore, the TEM image indicates that the catalyst phases exhibit a low degree of crystallization, corroborating the XRD and Raman spectroscopy results. It is also interesting to note the nanosized distribution of ZrO2, which might be associated with the CNTs’ confining effect. Moreover, the nano-ZrO2 in close interaction with Ni might be responsible for the high Cu dispersion, with particles below 6 nm. At this scale, electronic effects take a predominant role.

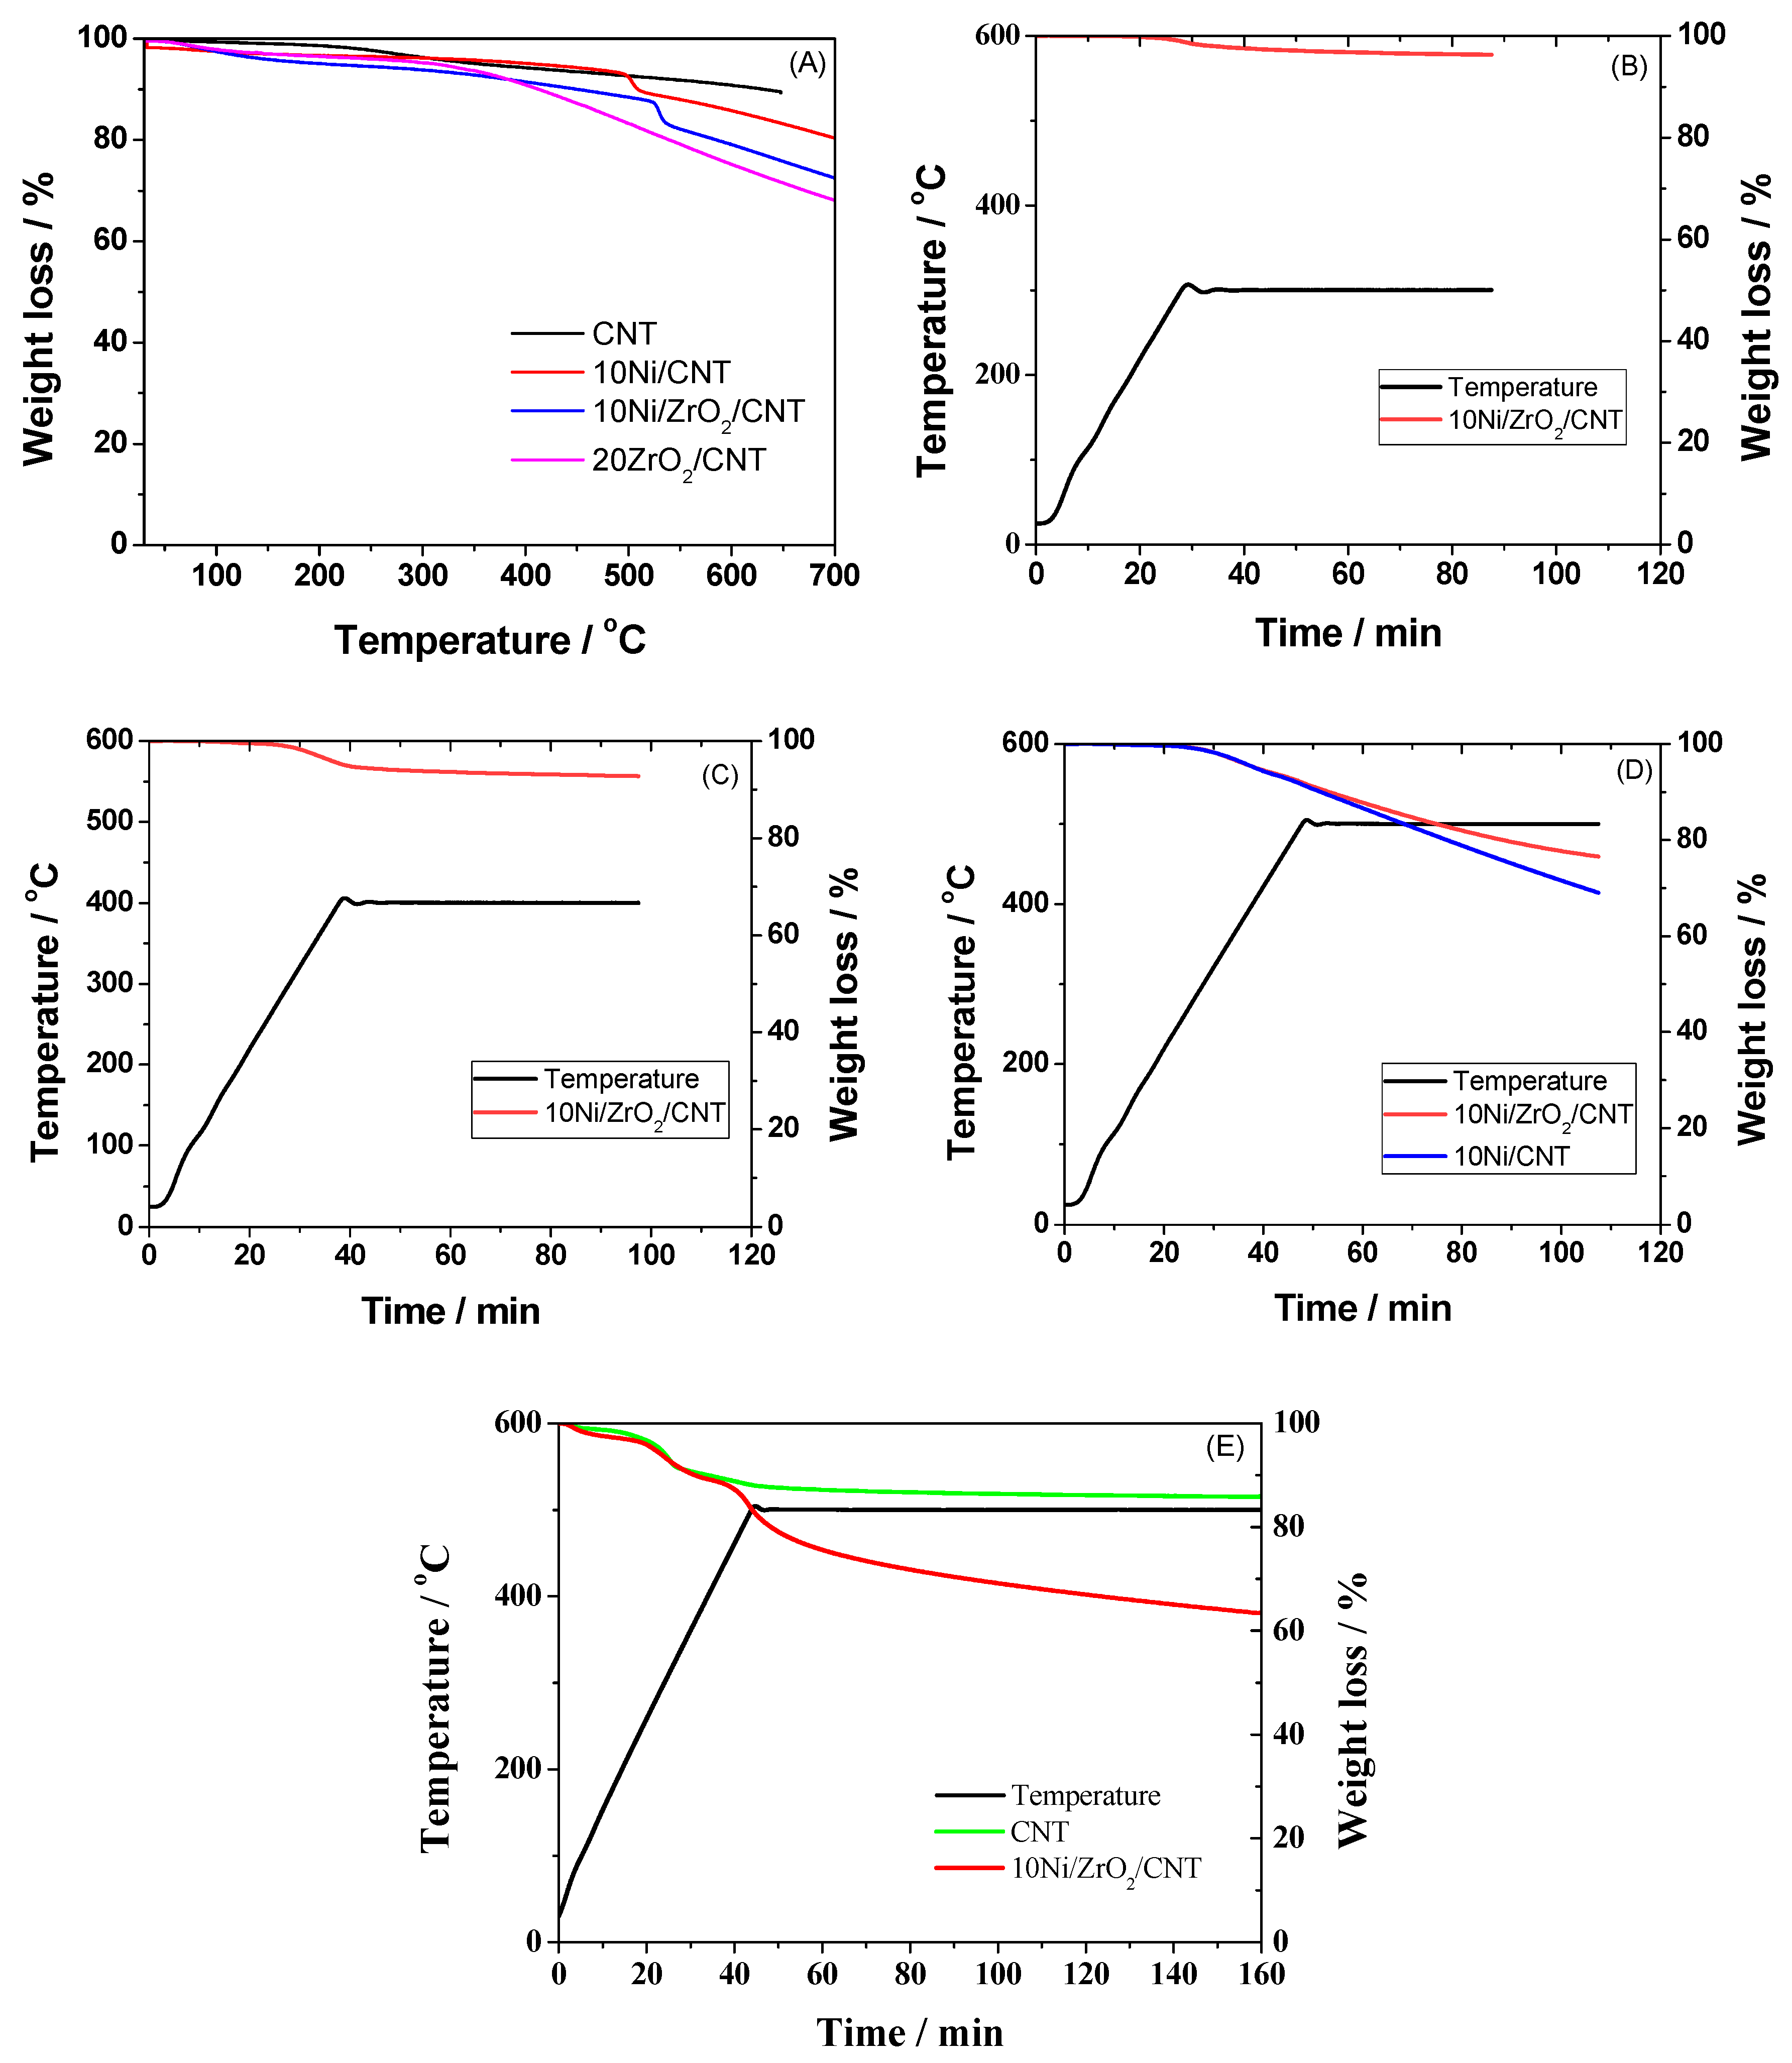
2.1.7. The Thermogravimetric Analysis

A thermogravimetric analysis was used to verify the decomposition of the CNT, 10Ni/CNT, and 10Ni/ZrO2/CNT samples in inert and reducing atmospheres (Figure 8). All of the samples showed similar behavior during treatment in the N2 stream. Figure 8A shows low weight loss at temperatures below 300 °C and a more pronounced loss of mass at 500 °C and 550 °C for the 10Ni/CNT and 10Ni/ZrO2/CNT samples, respectively. The weight loss below 300 °C can be attributed to the removal of water and adsorbed species in the sample, as well as the dehydration of the CNTs. Kundu et al. [84] reported that carboxyl and phenolic hydroxyl groups can be dehydrated when CNTs treated with HNO3 are heated in He from 100 to 700 °C. Above 300 °C, the weight loss could be assigned to the decomposition of carboxylic groups, while degradation of the carboxylic anhydride and lactone groups occurred above 500 °C. Thus, we can conclude that the CNT-based samples treated in the N2 stream presented thermal stability up to 500 °C since the weight loss was less than 10%. According to the literature, the heteroatom surface groups and carbon can be hydrogenated during CNT treatment in a H2 stream at a high temperature [85,86,87]. The H2-TPR results (Figure 5) indicated that the CNTs were hydrogenated, forming CH4 at about 682 °C. For the treatment in the reducing atmosphere, the weight loss started at around 240 °C for the 10Ni/ZrO2/CNT sample treated with H2 (Figure 8B), and at 300 °C, the weight loss was about 5%, indicating the high stability of the CNTs. The low weight loss for the 10Ni/ZrO2/CNT sample treated in H2 at 300 °C also suggests the reduction of NiO species into metallic Ni to some extent. According to Kundu et al. [84], carboxyl, carbonyl, phenol and ether-type oxygen groups can be generated during acid treatment of CNTs. These authors observed that the thermal stability of these functional groups decreased after treatment of the CNTs in a H2 stream at 300 °C, and carboxylic groups were reduced into phenolic groups in the same conditions [84]. Thus, based on the literature, we can suggest that the H2 treatment at 300 °C used in our work reduced the functional groups in the CNTs, with small changes in the weight of the 10Ni/ZrO2/CNT sample.
Increasing the reduction temperature to 400 °C, the weight loss was about 8%, indicating low degradation of the CNTs (Figure 8C). The reduction of the 10Ni/ZrO2/CNT sample at 500 °C led to a weight loss of 23.5%, while for the 10Ni/ZrO2 sample, the weight loss was about 31% (Figure 8D). It is important to note that the reduction of NiO into metallic Ni (NiO + H2 → Ni + H2O) occurs with 21.42% loss of the initial mass considering total reduction of the NiO species. The reduction of the 10Ni/CNT sample showed about a 10% higher mass loss compared to the theoretical value, suggesting that both NiO was reduced into metallic Ni and the CNTs were decomposed during the treatment in 10% H2/Ar at 500 °C. Increasing the H2 concentration to 80% led to an increase in the mass loss to 33% for the 10Ni/ZrO2/CNT sample in 1 h at 500 °C (Figure 8E), indicating that the degradation of the CNTs and NiO reduction were slightly dependent on the H2 concentration. Similar degradation was observed for the CNT sample treated at 500 °C using 80% H2/Ar and treated using N2 (Figure 8A,E), suggesting that H2 was not activated on the CNTs. In fact, other works have shown that carbon degradation occurs at a high temperature (above 700 °C) under a H2 flow [84,86]. Moreover, Zhou et al. [88] observed that the treatment of CNTs in H2 decreased the amount of electrophilic species such as carboxylic and peroxide/superoxide groups, and this could be attributed to the decomposition of electrophilic groups, forming defects on the CNTs. Moreover, C-H bonds can be formed through the reaction between H2 and the defects on the CNT. The effect of heat treatment on H2 is more pronounced in the Ni-containing samples since H2 is activated on the Ni’s surface and the adsorbed H can react via spillover with the CNTs, or carbon species can be transported onto the metal surface via metal migration and then hydrogenated into CH4 [89,90]. Our results indicated a peak for the 10Ni/CNT and 10Ni/ZrO2/CNT samples that was attributed to the formation of CH4 at lower temperatures compared to that for the CNT sample, indicating the promoting effect of Ni on the decomposition of the CNTs.

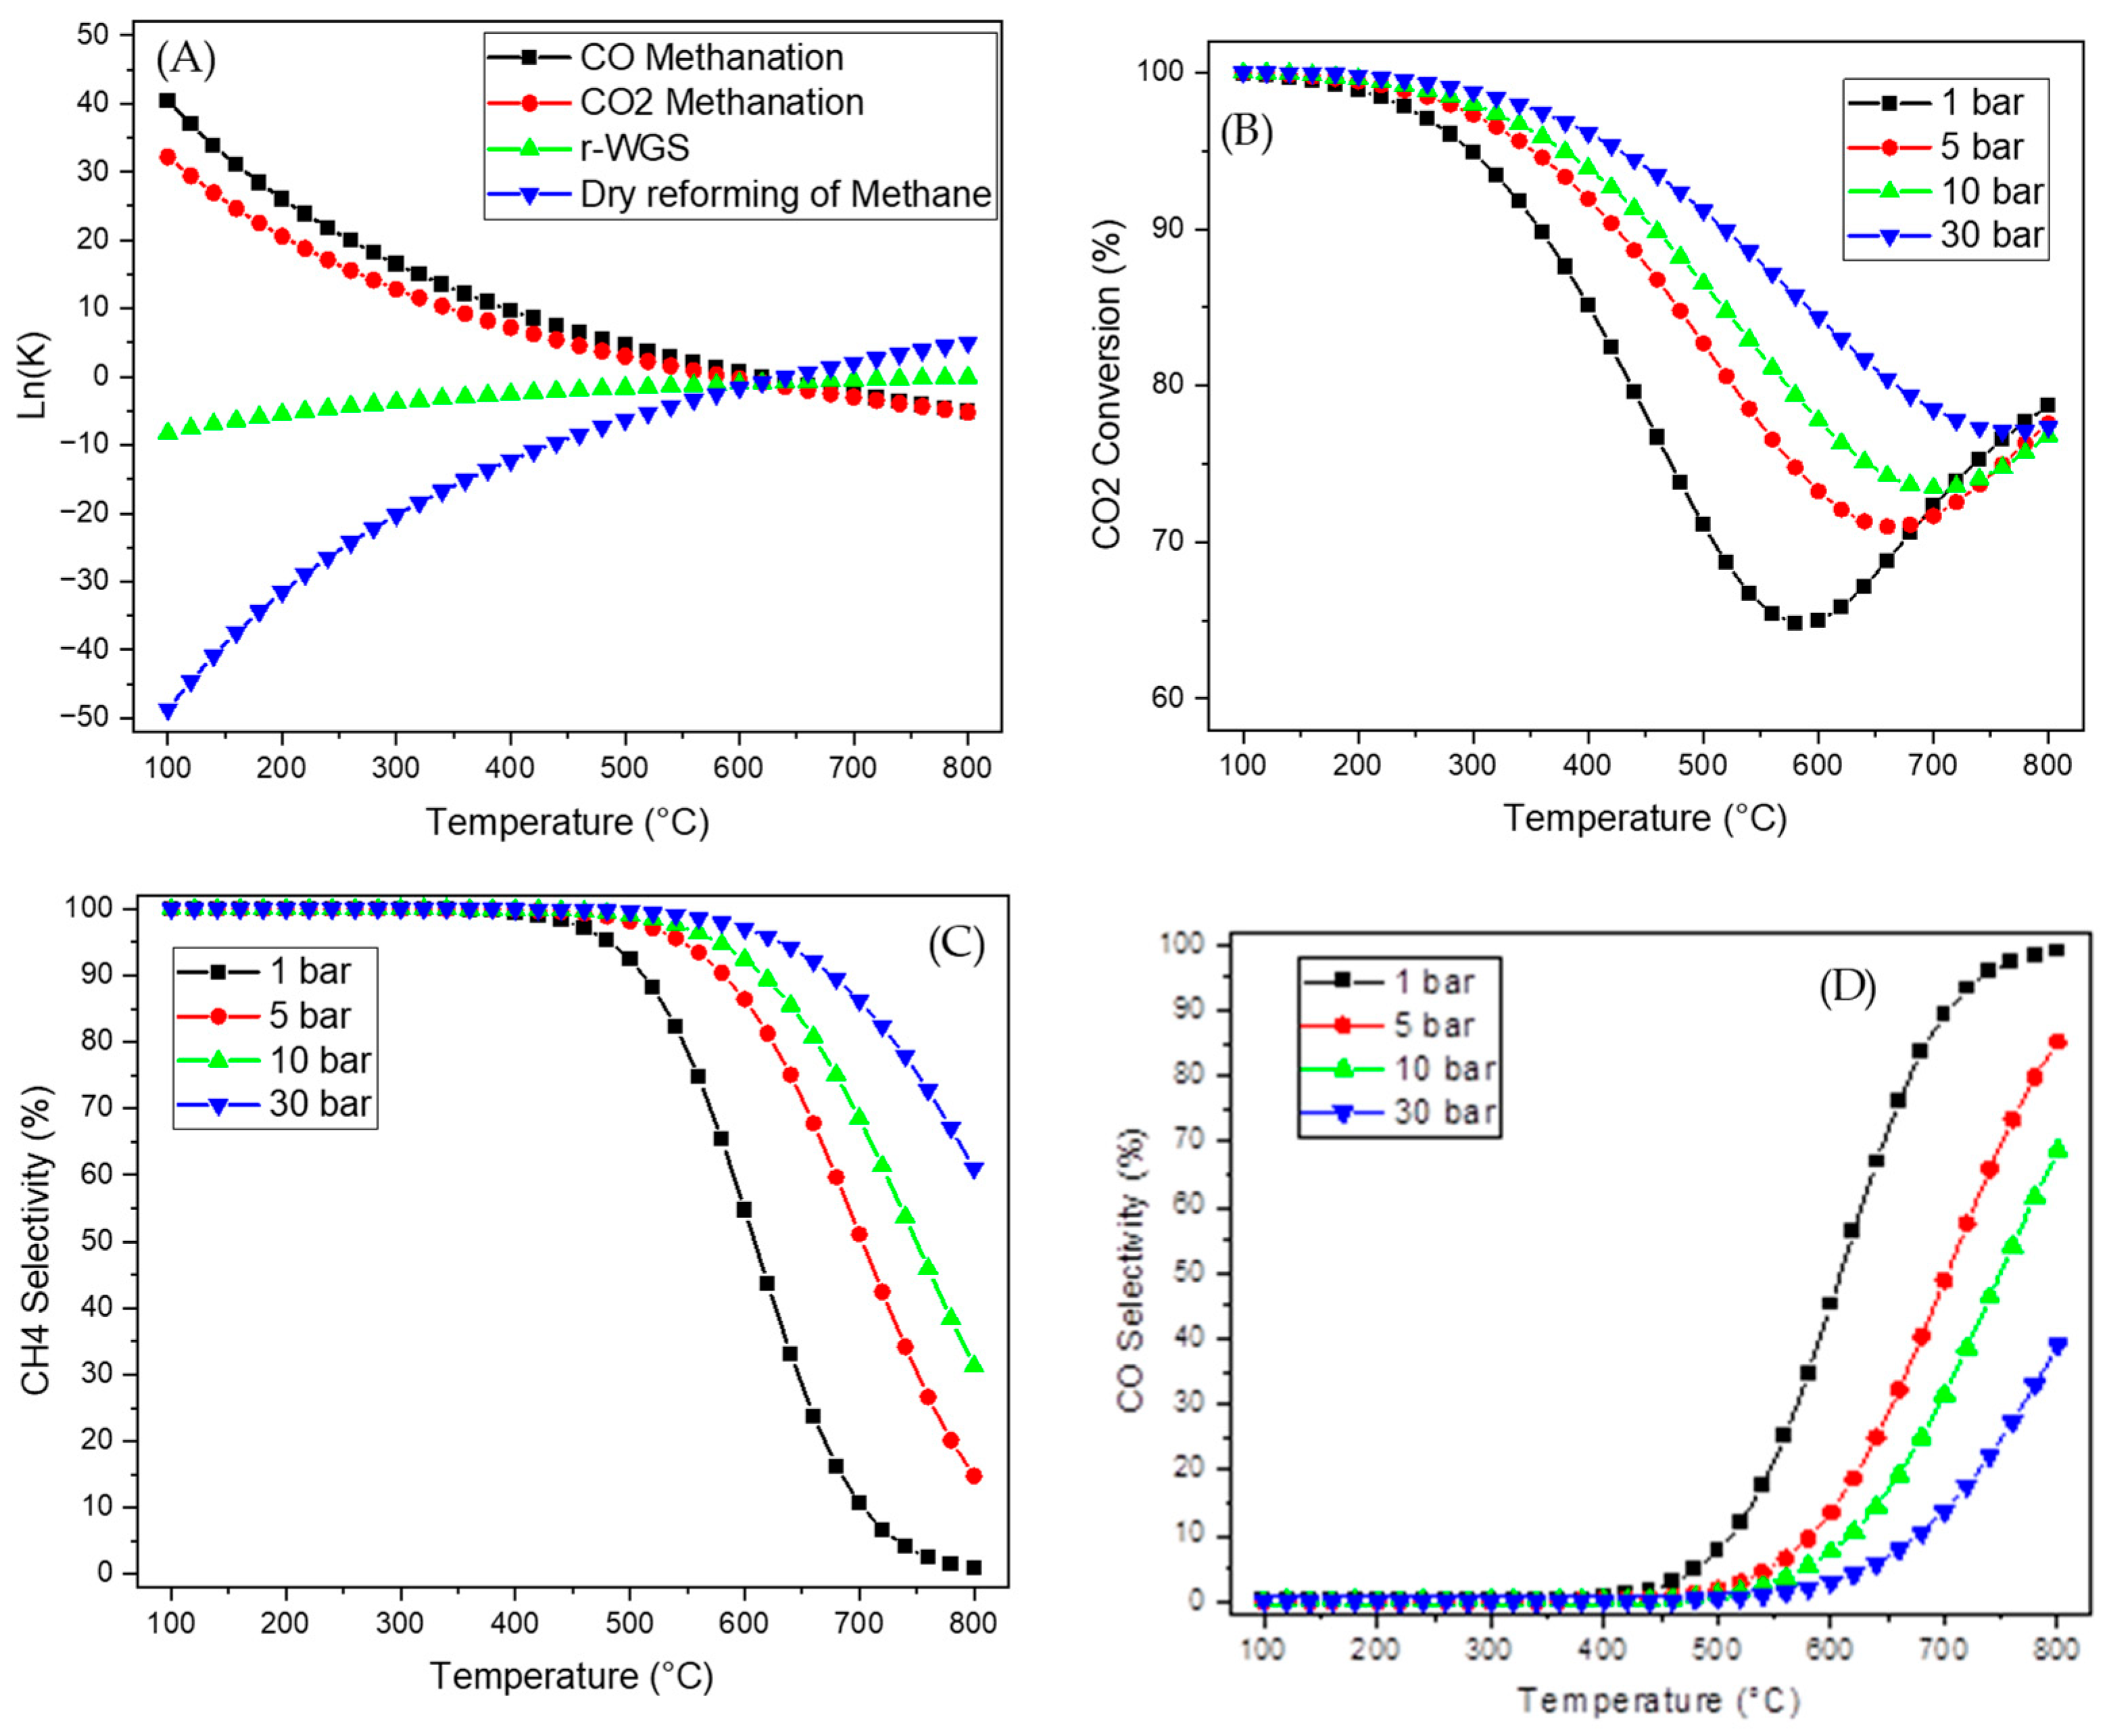
2.2. Thermodynamic Equilibrium

The equilibrium constants for the CO and CO2 methanation reactions; the rWGS reaction; and the methane dry reforming reaction as a function of temperature are shown in Figure 9. It is important to note that as CO and CO2 methanation reactions are exothermic reactions, consequently, an increase in the reaction temperature results in a decrease in their equilibrium constants. At a high temperature, the rWGS reaction and dry reforming of CO2 are favored due to their endothermic characteristics. It should be noted that in addition to consuming CO2, dry reforming also uses CH4, which is the product of interest in this set of reactions.
The effects of pressure and temperature on CO2 methanation conversion were simulated using a H2:CO2 molar ratio equal to 4 (Figure 9). It can be seen that for 1 bar, the conversion of CO2 remains practically constant in the 100–200 °C temperature range, and above 200 °C, the CO2 conversion decreases until it reaches its minimum value at 580 °C and then increases again. The decrease in conversion can be attributed to the predominance of the CO2 methanation reaction at low temperatures due to their exothermic nature, and at high temperatures, the rWGS reaction is favored, increasing the CO2 conversion. Pressure is also a variable that influences the conversion of the reactants. It is also observed that between 200 and 700 °C, the CO2 conversion increases with increasing pressure. Above 700 °C, the effect of pressure on conversion is attenuated because the favored rWGS reaction involves an equimolar ratio between the reactants and products. In addition, the dry reforming of CH4 also has an influence on the CO2 conversion at a high temperature. The thermodynamic characteristics of these reactions indicate that at lower temperatures and higher pressures, CH4 is selectively produced, reaching a selectivity close to 100% at temperatures up to 400 °C under all conditions, while the selectivity towards CO increases at higher temperatures and lower pressures. It is noteworthy that the equilibrium simulation results under these conditions did not demonstrate the formation of coke. In fact, the experimental results suggest that the formation of coke is negligible during CO2 methanation [91,92,93]. Thus, the results of the simulation suggest that the formation of CH4 is favored at low temperatures and high pressures.
The effect of H2:CO2 molar ratios between 1 and 8 on a CO2 methanation reaction realized at 1 bar is shown in Figure 10. The higher the H2/CO2 molar ratio, the higher the CO2 conversion at all temperatures. Furthermore, a significant enhancement in CO2 conversion is observed for the H2:CO2 molar ratio above 2. Figure 10 shows that the use of a low H2/CO2 molar ratio (1 and 2) led to the formation of carbon, potentially through the Boudouard reaction (2CO ⇔ C + CO2), decreasing the selectivity towards CH4 [94,95]. High H2/CO2 molar ratios (4, 6, and 8) suppress coke formation and promote CH4 production with a selectivity close to 100% at up to around 400 °C in all of the simulated scenarios. In fact, the experimental results indicate that a high amount of H2 is sufficient to hydrogenate the carbon on the catalyst’s surface (C + 2H2 ⇄ CH4), avoiding deactivation by coke [91,92,93]. Above 400 °C, the CH4 selectivity begins to decay, accompanied by an increase in the CO selectivity. Thus, in this work, a H2/CO2 molar ratio equal to 4 was used in the experimental measurements of the catalytic activity.

2.3. The Catalytic Activity

A blank experiment showed that CO2 conversion did not occur in the homogenous phase. Experiments with the CNTs, ZrO2, and 20ZrO2/CNT reduced at 500 °C for 2 h also showed no CO2 conversion between 200 and 400 °C (Figure S5). These results indicate that when the CNTs and ZrO2 were used alone, they did not present catalytic activity for the methanation reaction under the conditions used in this work. In order to verify the chemical interaction between Ni and ZrO2, a CO2 methanation experiment using a mechanical mixture between the 10Ni/CNT and 20ZrO2/CNT catalysts (Figure S6). The CO2 conversion for the mechanical mixture of catalysts was much lower than that for 10Ni/ZrO2/CNT, indicating the importance of the interaction and synergy between Ni and ZrO2.
The CO2 conversion at different temperatures up to 500 °C in the CO2 methanation reactions using the reduced catalysts is shown in Figure 11. The 10Ni/CNT catalyst showed CO2 conversion with an increasing temperature and CH4 selectivity between 65 and 70% in the 250–350 °C temperature range. At 400 °C, the CH4 selectivity increased to 90%. The formation of CH4 for Ni/CNT was the lowest at all temperatures among the materials evaluated. The CO2 conversion for 10Ni/ZrO2 was higher than that for the 10Ni/CNT catalyst at all temperatures. The CH4 selectivity was close to 100% for the catalysts containing Ni and ZrO2, while for the Ni/CNT catalyst, the selectivity was below 90%.
The addition of ZrO2 to the 10Ni/CNT catalyst through the co-impregnation method led to a higher CO2 conversion than that for the 10Ni/ZrO2 catalyst within all of the temperature ranges evaluated. This result can be explained by a reaction mechanism where H2 activation occurs on the Ni’s surface and CO2 activation takes place on the support [96,97,98].
These results indicate that the addition of ZrO2 promotes CO2 activation, increasing the CO2 conversion and CH4 selectivity. Similar behavior for Ni/ZrO2 catalysts has been reported in other works during CO2 methanation reactions [61]. The results presented in our work (Figure 11) indicate that the use of the CNTs resulted in a more active catalyst for CO2 methanation at all temperatures. For example, the CO2 conversion at 300 °C was about 58% for the 10Ni/ZrO2/CNT catalyst, while for 10Ni/ZrO2, the CO2 conversion was 25%. Thus, the interaction and the interface between Ni and ZrO2 enhanced the CO2 methanation activity. Our results are in good agreement with works reported in the literature which have observed an increase in the catalytic activity for reactions using CNTs as the support [38,73,74,91]. The increased activity and selectivity in the reactions containing metal/oxides/CNTs compared to these properties for conventional catalysts have been attributed mainly to the confinement effect for metal/oxides in CNTs [49,82,83,99]. The interface and the synergistic effect between metals/oxides/CNTs have also been invoked to explain this increased activity [44,100].
The conversion of CO2 and the selectivity towards CH4 as a function of temperature for the Ni/ZrO2/CNT catalysts with different Ni loadings are shown in Figure 12. It can be seen that the CO2 conversion increased with an increasing temperature for the catalysts with 2.5, 5.0, and 10 wt.% Ni, while on the 15Ni/ZrO2/CNT catalyst, the CO2 conversion increased from about 5% at 200 °C to 80% at 300 °C, and then the conversion remained constant at 350 °C and decreased to 75% at 400 °C. These results indicate that the higher the nickel load (up to 10 wt.% Ni), the higher the CO2 conversion, suggesting that the active Ni sites available for reaction increased with an increasing amount of Ni loading. Interestingly, the catalytic activity for 15Ni at a low temperature is much higher than that of the other catalysts. Interestingly, the 15Ni/ZrO2/CNT catalyst was highly active at 250 °C with 100% selectivity towards CH4, indicating that this catalyst can be used in the methanation of CO2 at low temperatures. The other catalysts showed much lower CO2 conversion than that for the 15Ni/ZrO2/CNT sample. The space–time yield of CH4 at 250 °C was 1.41 mol gNi−1h−1 for the 15Ni/ZrO2/CNT sample, while for the 10Ni/ZrO2/CNT sample, it was 0.35 mol gNi−1h−1. Comparing these values with data at low temperatures from the literature, it is possible to say that the catalytic activity value obtained for the 15Ni/ZrO2/CNT catalyst is one of the highest reported in the literature [101,102]. The higher catalytic activity for the 15Ni/ZrO2/CNT catalyst could be due to the Ni particles’ size. In fact, the particle size can affect the activity and selectivity during CO2 methanation reactions, as this reaction is considered to be structure-sensitive [103,104]. The formation of large Ni particles was suggested based on the TPR results for the 15Ni/ZrO2/CNT catalyst, which presented reduction peaks at a low temperature. Moreover, the intensity of the XRD peak at 2θ = 44.3° for 15Ni/ZrO2/CNT indicated larger Ni crystallites compared to those in the samples with low Ni loading.
The CH4 selectivity in the 200–300 °C temperature range was practically 100% for all zNi/ZrO2/CNT catalysts. However, above 300 °C, the CH4 selectivity decreased slightly for the catalysts with low Ni loading. For example, for the 2.5% and 5.0%Ni/ZrO2/CNT catalysts, the CH4 selectivity was about 90% and 96% at 400 °C, respectively. Thus, under low Ni loading, CO formation occurred above 300 °C. Riani et al. [105] observed the formation of CO for a Ni/SiO2 catalyst with low Ni loading during CO2 methanation at temperatures between 350 and 500 °C. An increase in CO selectivity was also observed in other works when low Ni loading was used in the catalyst for CO2 methanation. The previous results of the equilibrium simulations (Section 2.2) indicated that a high temperature favored the reverse water–gas shift reaction, leading to the formation of CO during the methanation reaction. In addition, intermediates can be dependent on the Ni particle size, and the reaction of adsorbed H with the intermediates can lead to CO. According to the literature, the selectivity for CO increases with a decreasing Ni particle size, in good agreement with our results presented for 2.5 and 5.0Ni/ZrO2/CNT, while a higher catalytic activity has been reported for catalysts with larger Ni particle sizes, in agreement with the results reported for 15Ni/ZrO2/CNT [35,100,104,106]. Thus, the Ni loading can be optimized in order to increase the catalytic activity at low temperatures.
The catalytic activity for CO2 methanation on the 10Ni/ZrO2/CNT sample was also measured for the calcined catalyst while varying the reduction temperature (300, 400, and 500 °C) and for the calcined catalyst without reduction (Figure 12). The CO2 conversion on the calcined catalyst increased with an increasing temperature until reaching the maximum conversion at 400 °C. In addition, the CH4 selectivity increased from about 35% at 200 °C to 92% at 250 °C, remaining above this value at temperatures above 250 °C. Considering that the calcined 10Ni/ZrO2/CNT catalyst was oxidized at the beginning of the reaction and that the reaction occurred on metallic Ni, we can suggest that the NiO species were reduced by the reaction mixture, which is rich in H2, to form metallic Ni. As well as CO2 methanation, the dynamics of the oxidation and reduction of NiO in H2/CO2 are also dependent on the Ni particle size. For example, De Coster et al. [107] verified based on X-ray absorption spectroscopy that Ni/MgAl2O4 was oxidized in a CO2 stream and that the extent of oxidation depended on the Ni particle size. Complete reoxidation of Ni was observed for the smallest particle sizes [106]. According to the literature, the Ni–support interface is the most energetically favorable site for CO2 activation [104,108,109]. Operando XAS was used by Shirsath et al. [110] to study the dynamics of catalysts during CO2 methanation, and the authors reported that Ni was oxidized at the inlet and the middle of the reactor, while at the end of the reactor, the Ni remained reduced. Thus, we can conclude that NiO was reduced during CO2 methanation on the 10Ni/ZrO2/CNT catalyst.
The reduction of the catalyst at 300 °C led to a higher CO2 conversion at 250–300 °C compared to that by the calcined catalyst, indicating that the reductive treatment led to the formation of active sites. The CO2 conversion was similar for the sample catalysts treated at 400 and 500 °C, suggesting that 400 °C was enough to form the active sites to produce methane. At 350 °C, the CO2 conversion was similar for the catalysts treated at 300, 400, and 500 °C, suggesting that the reduction of NiO into metallic Ni occurred during the reaction and that this reduction was dependent on the time and temperature. For the calcined catalyst, the CO2 conversion at 400 °C was similar to that for the catalysts treated with H2, indicating that after some time in the reaction conditions at high temperatures, the active sites were formed in a similar way to that observed for the catalyst treated at 500 °C (Figure 13).
As described in the H2-TPR results, the reduction of NiO into metallic Ni is temperature-dependent. We can consider that the amount of metallic Ni available for the reaction increased with an increasing reduction temperature. Therefore, the following order of Ni dispersion can be considered: NiO reduced at 300 °C < NiO reduced at 400 °C < NiO reduced at 500 °C. Regarding CO2 hydrogenation, the low-temperature CO2 conversion increased with an increasing catalyst reduction temperature (300 to 400 °C). This can be explained by the increase in the amount of exposed Ni as a function of temperature. On the other hand, the reductive treatment at 500 °C did not increase the CO2 conversion compared to that for the catalyst treated at 400 °C. According to the TG experiments, reductive treatment of the catalyst at 500 °C led to partial degradation of the CNTs, which was confirmed by the H2-TPR experiments using the 10Ni/ZrO2/CNT catalyst recorded using mass spectroscopy. A slight increase in the Ni particle size after catalyst reduction was also observed through TEM. In addition, the specific surface area of the catalyst also increased after reduction. Clearly, the properties of the surface were modified after the reductive treatment with H2 at 500 °C. In fact, functional groups can be removed from CNTs during heat treatment, modifying their surface properties. For example, functional groups such as carboxylic and lactone facilitate H spillover, while phenolic and carbonyl are less efficient for H spillover [111]. In addition, the formation of a carboxylic group and a C−H bond through irreversible binding of the spillover H with the lactone groups was reported by Wang et al. [112] Interestingly, functional groups such as carboxylic, carboxylic anhydride, and lactone are removed by heat treatment, generating CO and/or CO2. Carboxylic groups are removed between 200 and 300 °C, while carboxylic anhydride groups are removed at temperatures above 450 °C and lactone groups are removed above 580 °C. Therefore, the treatment of the 10Ni/ZrO2/CNT catalyst at 500 °C led to the removal of carboxylic and carboxylic anhydride groups. Considering that the functional groups were removed after heat treatment and that the metal in general is anchored to these groups, we could expect for the surface properties to have been modified, altering the adsorption of CO2 and H2. In order to verify the effect of catalyst temperature reduction on the CO2 adsorption at 25 °C, we performed adsorption experiments using a Thermobalance SETSYS Evolution. The results indicated that the CO2 adsorption was almost the same for the catalysts treated at 300 and 400 °C, while the CO2 adsorption decreased for the catalyst treated at 500 °C (Figure S7). Therefore, our results indicated that the functional groups removed by the H2 treatment at 500 °C led to a decrease in CO2 adsorption. In addition, we can conclude that the H spillover tends to change as well as the CO2 conversion due to changes in the functional groups present in the CNTs. In addition, we can consider 400 °C to have been the ideal temperature for the reduction of NiO into metallic Ni among the reduction temperatures tested in this work.
The catalytic stability was evaluated for the 10Ni/ZrO2/CNT and Ni/ZrO2 catalysts at 350 °C for 24 h (Figure 14). Both the 10Ni/ZrO2/CNT and 10Ni/ZrO2 catalysts exhibited good stability and performance over 24 h of reaction with enhanced CO2 conversion and high selectivity towards CH4. Moreover, the catalytic activity was higher for the 10Ni/ZrO2/CNT catalyst compared to that for 10Ni/ZrO2, indicating a positive effect of the CNTs on the reaction. The selectivity remained high over time, indicating that the catalysts had an excellent ability to produce CH4 from CO2 with little variation throughout the reaction. The results showed the high stability of the CNT-based catalyst, indicating that the CNTs were not degraded during the CO2 methanation reaction at 350 °C. In addition to the high conversion and selectivity observed for the CNT-containing catalyst, we need to point out that the amount of ZrO2 used in the 10Ni/ZrO2/CNT catalyst was much lower than the amount used in the 10Ni/ZrO2 catalyst. The high activity, selectivity for CH4, and excellent stability of the 10Ni/ZrO2/CNT catalyst could be attributed to the synergistic interactions among the Ni, ZrO2, and carbon nanotubes (CNTs). Romero-Saez et al. [61] and Wang et al. [45] also reported high activity and stability for Ni-based catalysts that used CNTs as the support.
Although Romero-Saez et al. [61] used Ni/ZrO2/CNT in the hydrogenation of CO2 into CH4, their catalyst preparation method (wet impregnation) was different from the method used in this work (dry impregnation). The main difference is that in the catalysts prepared by Romero Saez et al. [61], the Ni particles were on the outside of the CNTs, while Ni was mainly added inside the CNT pores in the catalysts prepared in this work, as observed using TEM. Moreover, the low activity of the catalyst prepared through co-impregnation was attributed to the blocking of Ni by ZrO2. On the other hand, the catalyst prepared through sequential impregnation showed high Ni dispersion and a high space–time CH4 yield of about 0.65 mol gNi−1h−1 at 350 °C. The enhanced yield can be attributed to the access of the reactants to the Ni-ZrO2 interface, which was greater in the catalyst prepared through sequential impregnation. Wang et al. [45] verified that the yield of CH4 (1.7 mol gNi−1h−1) for 12Ni4.5Ce/CNT was higher than that obtained for a 12Ni/CNT catalyst, and this was attributed to the donation of electrons from Ce and the CNTs to the Ni metal, activating CO2 and H2.
In our work, a high space–time CH4 yield (2.4 mol gNi−1h−1) for the CO2 hydrogenation at 350 °C was observed for the 10Ni/ZrO2/CNT catalyst which was prepared through co-impregnation. This high yield can be attributed to the combination of high Ni dispersion inside the CNTs, the 10Ni/ZrO2/CNT interface, and the confinement effect. Interestingly, the 10Ni/ZrO2/CNT catalyst showed high catalytic stability throughout 24 h of reaction at 350 °C. Although catalyst reduction at 500 °C removed functional groups from the CNTs, this did not affect the catalytic stability, which was attributed to the presence of Ni/ZrO2 particles inside the nanotubes. These results are in good agreement with previous works that have used metal inside CNTs.
The spent 10Ni/ZrO2/CNT catalyst was analyzed using electron microscopy (Figure S8), which revealed no significant particle sintering, confirming the effectiveness of the synergistic interaction among the Ni, ZrO2, and CNTs, as well as the confinement effect of the CNTs. The confinement effect, arising from the encapsulation of most of the Ni and ZrO2 nanoparticles within the CNT pores, likely enhances the catalyst’s activity and stability. Furthermore, the nanoscale size of the Ni and ZrO2 particles, as evidenced through TEM and elemental EDS mapping, combined with their intimate contact with size at the nanoscale, may promote predominant electronic effects that contribute further to the catalytic performance. In nanosized particles such as Ni and ZrO2 confined in CNTz, electronic effects often dominate due to the high surface-to-volume ratio and the prevalence of defects such as oxygen and/or metal vacancies. These defects might significantly affect the local electronic structure, altering the Ni-d-band center, leading to charge transfer at the Ni-ZrO2 interface. For instance, the oxygen vacancies in ZrO2 create electron-deficient sites that modify the electronic properties of Ni, enhancing the adsorption and activation of reactants such as H2 and CO2, thereby reducing the energy barriers for catalytic reactions like hydrogenation. The increased surface area of nanoparticles amplifies these electronic effects, making phenomena like charge redistribution and metal–support interactions the primary drivers of catalytic performance.
These findings suggest that the Ni/ZrO2/CNT composite is a promising material for use as a catalyst in the production of synthetic natural gas from CO2.

3. The Experimental Section

3.1. Material Synthesis

Multi-walled carbon nanotubes (MWCNTs, CHEAP TUBES INC., 98% purity, diameters between 20 and 30 nm) were acquired from CHEATUBES INC. (Cheap Tubes Inc. Grafton, VT, USA). The MWCNTs were functionalized through treatment with concentrated nitric acid (HNO3, 65% P.A., QHEMIS, Uberaba, MG, Brazil) to introduce oxygenated functional groups onto their surfaces. In a round-bottom flask, ca. 1 g of the MWCNTs and 100 mL of concentrated HNO3 were mixed under reflux for 5 h at 110 °C. Then, the mixture was cooled down to room temperature (RT), and it was repeatedly washed with deionized water until the pH of the mixture was close to 7. In order to remove moisture and adsorbed species, the functionalized MWCNTs were dried overnight in an oven maintained at 150 °C. Afterwards, the dried and functionalized MWCNTs were crushed, and particles between 125 and 149 µm were used as a support to prepare the catalysts. The dried functionalized MWCNTs are simply referred to as CNTs.
All of the catalysts supported on the CNTs were prepared through incipient wetness impregnation [113,114]. Ethanol solutions containing nickel and zirconium were prepared by dissolving a suitable amount of nickel nitrate (Ni(NO3)2·6H2O, 97%, Sigma-Aldrich, Burlington, MA, USA) and zirconium oxynitrate (ZrO(NO3)2·× H2O, 99.99%, Sigma-Aldrich). The quantities of each precursor were then adjusted to prepare catalysts containing 20 wt.% of ZrO2 and 2, 5, 10, and 15 wt.% of Ni on CNTs. The precursor solution was added dropwise to the CNTs, which was continually stirred at room temperature until the impregnation was complete. The samples were dried at 110 °C overnight to remove residual solvent, and the material was calcined under a 50 mL min−1 argon flow at 350 °C for 2 h. The samples were labeled as zNi/ZrO2/CNT, where z represents the Ni loading in the catalyst (2, 5, 10, and 15 wt.%). The 10Ni/CNT and 20ZrO2/CNT samples were prepared using the same experimental procedure as that applied to the zNi/ZrO2/CNT catalyst. A sample (10Ni/ZrO2) containing 10 wt.% Ni was prepared through the impregnation of ZrO2, supplied by Saint Gobain NORPRO (Stow, OH, USA), using Ni(NO3)2 solution. A physical mixture was also prepared using equal parts of the calcined 10Ni/CNT and 20ZrO2/CNT catalysts.

3.2. Characterization Methods

The powder X-ray diffraction (XRD) patterns were measured using a Rigaku MiniFlex 600 (Tokyo, Japan) with Cu Kα (λKα1 = 0.15406 nm) radiation. The samples were analyzed in a 2θ range of 10–80° and using a scan step size of 0.167°.
Powder X-ray diffraction (XRD) was conducted in situ on a Bruker D8 Focus diffractometer, using CuKα radiation (graphite monochromator, λKα1 = 0.15406 nm) operated at 50 kV and 30 mA, with a θ–2θ configuration. Data were collected over a 2θ range of 20° to 70°, with 2θ steps of 0.02°. The diffractometer was fitted with an Anton Paar TTK-45 chamber (Graz, Austria), enabling temperature and atmosphere control. The catalyst was treated in situ under a 5% H2/N2 mixture flow at 30 mL min−1. The temperature was increased to 400 °C at a heating rate of 10 °C min−1. Afterward, the system was maintained at 400 °C for 2 h, followed by switching the flow to He. After one hour, the temperature was decreased to 25 °C.
The N2 adsorption–desorption isotherms were measured at −196 °C using Micromeritics ASAP 2420 equipment (Norcross, GA, USA). Prior to the N2 isotherm measurements, the samples were degassed in a vacuum for 3 h at 150 °C. The BET method was used to calculate the specific surface area of the samples, while the BJH method was used to calculate the pore distribution and size of the samples [115].
The chemical composition of the samples was measured through energy-dispersive X-ray fluorescence (XRF) using Shimadzu equipment (Kyoto, Japan), model EDX-720, with 100 s radiation, a vacuum atmosphere, a rhodium source, and an applied voltage of up to 40 kV. The quantification of light elements such as carbon (C) was not feasible due to the requirement for a specific analyzing crystal. Quantification of light elements (e.g., carbon, Z = 6) is challenging because of their emission of low-energy X-rays (e. g., CK-α at 0.277 keV), which are easily absorbed and required specialized analyzing crystals, in addition to detectors optimized for low-energy scenarios. However, the spectrometer used for the FRX analysis lacked this crystal, so carbon quantification was performed using a thermogravimetric analysis.
The thermogravimetric analysis (TGA) was carried out in Shimadzu DTG-60 equipment where the sample was heated from room temperature up to 900 °C at 10 °C min−1 under an air flow (50 cm3 min−1). Some of the samples were also analyzed under oxidative and reductive streams using a SETARAN Thermobalance SetSys to verify the decomposition of the CNTs.
The temperature-programmed reduction (H2-TPR) analysis was realized in a Micromeritics AutoChemII 2920 using a quartz reactor, and the gases evolved from the reactor were detected using a thermal conductivity detector. A sample (0.15 g) was loaded into the reactor, and it was subjected to the following analysis sequence. First, the catalyst was treated at 200 °C for 2 h under an argon flow, and the sample was then cooled to room temperature. Then, the argon was switched for a mixture containing 5 mol.% H2/Ar flowing at a 50 cm3 min−1. After this, the temperature was increased from room temperature to 900 °C at a heating rate of 10 °C min−1. The water formed during H2-TPR was removed from the gas stream into a dewar using a cooling bath maintained at −10 °C.
Studies of the CO2 adsorption at 25 °C and atmospheric pressure were performed in a thermobalance (Setsys Evolutiom, Setaram, Caluire-et-Cuire, France). A sample (about 20 mg) was loaded into the thermobalance, and an Ar flow of 50 mL/min was used to clean the reactor. After stabilization of the mass inside the thermobalance, the system was heated to 300 °C under an Ar flow. Then, the temperature was cooled to 25 °C, and the Ar flow was switched to 5% CO2/Ar. CO2 absorption was conducted for 1.5 h.
The transmission electron microscopy (TEM) and energy-dispersive X-ray spectroscopy (EDS) analyses were conducted in a FEI Tecnai F20 Transmission Electron Microscope (Hillsboro, OR, USA) operated at 200 kV. A fine powder sample was dispersed in isopropyl alcohol using ultrasound and then deposited onto copper grids. Prior to the TEM analysis, the sample was exposed to argon plasma before the microscopy measurements to remove organic contamination.
The Raman spectra were collected using a Witec (Alpha-300 R) spectrometer (Ulm, Germany) fitted with optical confocal microscopy. This setup allowed for target acquisition of spectra from specific regions of the sample, facilitated by microscope observations. As Raman spectroscopy is a spot-sized technique, various areas of the samples were analyzed, taking into account the heterogeneous nature of the catalyst. The laser wavelength employed was 532 nm. Raman spectra of the 10Ni/ZrO2/CNT sample were obtained before in situ reduction in the XRD setup and after 2 h of reduction at 400 °C in the diffractometer, as outlined in the in situ XRD section.
Selected samples were reduced under a H2 flow (500 °C and 50 mL min−1 for 2 h). The catalysts used in CO2 methanation were characterized through XRD, TEM, and Raman spectroscopy techniques, as previously described.

3.3. The Catalytic Performance Evaluation

The CO2 methanation experiments were carried out in a fixed-bed quartz reactor at atmospheric pressure and within a 200–400 °C temperature range. The quartz U-reactor was loaded with 0.05 g of the catalyst in each experiment. All of the samples were ground, sieved, and selected in the 125–149 µm range. Prior to the reaction, the sample was reduced at 300, 400, and 500 °C for 2 h under pure H2 flowing at 50 cm3 min−1, and then the temperature was decreased to 200 °C. Then, the H2 flow was switched to a CO2:H2 reactant mixture with a molar ratio of 1:4 and a GHSV of 44,400 cm3·h−1·g−1. All of the gases were controlled using calibrated mass flow controllers from MKS. The exit flow was analyzed online using a gas chromatograph (Bruker 450-GC) equipped with a Hayasep Q and two Molsieve 5 Å packed columns connected to two thermal conductivity detectors. In order to verify the catalyst’s stability, experiments were conducted at 350 °C for 24 h using the conditions already described above. The conversion of CO2 (XCO2) and the selectivity towards methane (SCH4) were determined using equations 1 and 2, respectively. FCO, FCH4, and FCO2 are the molar flow rates for CO, CH4, and CO2, respectively. In this work, C2 and C2+ hydrocarbons were not observed under the experimental conditions employed.
X C O 2 % = F C O + F C H 4 F C O + F C H 4 + F C O 2 × 100 %
S C H 4 % = F C H 4 F C O + F C H 4 × 100 %

3.4. Simulations

Thermodynamic simulations were conducted using the Aspen Plus 14.0 software, with the chemical and phase equilibria calculated by minimizing the Gibbs free energies of the system using the RGibbs block, while the equilibrium constants were estimated using the REquil block. The thermodynamic properties of the components were calculated using the Soave–Redlich–Kwong thermodynamic model, and the simulations were performed considering the compounds H2, CO, CO2, CH4, H2O, and solid carbon (C) as the products of CO2 methanation. Then, the effects of temperature, pressure, and the CO2/H2 molar ratio on the CO2 conversion and the selectivity towards CH4 were studied.

4. Conclusions

Carbon-nanotube-supported Ni/ZrO2 catalysts were prepared through incipient wetness impregnation and then tested in CO2 methanation reactions between 200 and 400 °C. The TEM images showed that most of the NiO and ZrO2 species were inside the CNTs. Moreover, NiO and ZrO2 were well dispersed on the CNTs, but after reduction at 500 °C, the Ni particles were slightly altered, as observed through TEM, and this was attributed to the degradation of the CNTs. The use of CNTs as a support for Ni/ZrO2 increased the catalytic activity and selectivity towards CH4 compared to those of the Ni/ZrO2 catalyst. In addition, the Ni/CNT catalyst showed low catalytic activity in relation to Ni/ZrO2/CNT, indicating the effect of ZrO2 on the CO2 adsorption and its activation. The reduction of the Ni/ZrO2/CNT catalysts at 300, 400, and 500 °C affected the catalytic activity, probably due to variations in the surface chemistry of the CNTs. The Ni/ZrO2/CNT catalyst was highly active, selective towards CH4, and stable at 350 °C during 24 h.

Supplementary Materials

The following supporting information can be downloaded at https://www.mdpi.com/article/10.3390/catal15070675/s1. Figure S1: TGA results in an air atmosphere for (A) CNTs and 10Ni/CNT and (B) 10Ni/ZrO2/CNT, 20ZrO2/CNT, and 10Ni/ZrO2 samples; Figure S2: N2 adsorption–desorption isotherms and pore size distributions for CNTs and calcined samples; Figure S3: X-ray diffraction patterns of CNT, 10Ni/CNT, ZrO2, 20ZrO2/CNT, and 10Ni/ZrO2 samples; Figure S4: TEM images for calcined 10Ni/CNT, 10Ni/ZrO2/CNT, and 20ZrO2/CNT samples; Figure S5: CO2 conversion (A) and CH4 selectivity (B) for CO2 methanation in the blank test and for the ZrO2, CNT, and 20ZrO2/CNT samples; Figure S6: CO2 conversion (A) and CH4 selectivity (B) for CO2 methanation on 10Ni/CNT, 10Ni/ZrO2/CNT, and mechanical mixture samples; Figure S7: CO2 adsorption at 25 °C for 10Ni/ZrO2/CNT catalyst reduced at 300, 400, and 500 °C; Figure S8: TEM images of the spent sample 10Ni/ZrO2/CNT used in the stability test.

Author Contributions

J.P.B.d.O., M.T.I., H.C.M., J.L.M.B., A.A.S., B.d.S.M. and C.A.F.: conceptualization, methodology, and writing (original draft preparation); E.A.U.-G., R.J.C., J.M.C.B., A.M.d.S. and J.B.O.d.S.: writing (review and editing). All authors have read and agreed to the published version of the manuscript.

Funding

This research received no external funding.

Data Availability Statement

Data are contained within the article and Supplementary Materials.

Acknowledgments

The authors thank FAPESP (Processo 18/01258-5, 19/06436-1, 19/09219-1), Coordenação de Aperfeiçoamento de Pessoal de Nível Superior-Brasil (CAPES)-Finance Code 001, and FINEP (Processo 01.23.0662.00) for their financial support.

Conflicts of Interest

The authors declare no conflicts of interest.

References

  1. Ai, X.E.; Studer, A.S.; Sigman, D.M.; Martínez-García, D.A.; Fripiat, F.; Thöle, L.M.; Michel, E.; Gottschalk, J.; Arnold, L.; Moretti, S.; et al. Southern Ocean upwelling, Earth’s obliquity, and glacial-interglacial atmospheric CO2 change. Science 2020, 370, 1348–1352. [Google Scholar] [CrossRef] [PubMed]
  2. Sun, Z.; Wang, H.; Fan, M. Stoichiometric theory in aquatic carbon sequestration under elevated carbon dioxide. Math. Biosci. 2024, 376, 109285. [Google Scholar] [CrossRef]
  3. Li, J.; Jia, K.; Wei, X.; Xia, M.; Chen, Z.; Yao, Y.; Zhang, X.; Jiang, H.; Yuan, B.; Tao, G.; et al. High-spatiotemporal resolution mapping of spatiotemporally continuous atmospheric CO2 concentrations over the global continent. Int. J. Appl. Earth Obs. Geoinf. 2022, 108, 102743. [Google Scholar] [CrossRef]
  4. Martens, J.A.; Bogaerts, A.; Kimpe, N.; Jacobs, P.A.; Marin, G.B.; Rabaey, K.; Saeys, M.; Verhelst, S. The Chemical Route to a Carbon Dioxide Neutral World. ChemSusChem 2017, 10, 1039–1055. [Google Scholar] [CrossRef]
  5. Antenucci, A.; Sansavini, G. Extensive CO2 recycling in power systems via Power-to-Gas and network storage. Renew. Sustain. Energy Rev. 2019, 100, 33–43. [Google Scholar] [CrossRef]
  6. Bailera, M.; Lisbona, P.; Romeo, L.M.; Espatolero, S. Power to Gas projects review: Lab, pilot and demo plants for storing renewable energy and CO2. Renew. Sustain. Energy Rev. 2017, 69, 292–312. [Google Scholar] [CrossRef]
  7. Ghaib, K.; Ben-Fares, F.Z. Power-to-Methane: A state-of-the-art review. Renew. Sustain. Energy Rev. 2018, 81, 433–446. [Google Scholar] [CrossRef]
  8. Götz, M.; Lefebvre, J.; Mörs, F.; Koch, A.M.; Graf, F.; Bajohr, S.; Reimert, R.; Kolb, T. Renewable Power-to-Gas: A technological and economic review. Renew. Energy 2016, 85, 1371–1390. [Google Scholar] [CrossRef]
  9. Leonzio, G. Design and feasibility analysis of a Power-to-Gas plant in Germany. J. Clean. Prod. 2017, 162, 609–623. [Google Scholar] [CrossRef]
  10. Martsinchyk, K.; Martsinchyk, A.; Łazor, M.; Shuhayeu, P.; Kupecki, J.; Niemczyk, A.; Błesznowski, M.; Milewski, J. Feasibility study and techno-economic assessment of power-to-gas (P2G) technology based on solid oxide electrolysis (SOE). J. Environ. Manag. 2024, 354, 120425. [Google Scholar] [CrossRef] [PubMed]
  11. Mazza, A.; Bompard, E.; Chicco, G. Applications of power to gas technologies in emerging electrical systems. Renew. Sustain. Energy Rev. 2018, 92, 794–806. [Google Scholar] [CrossRef]
  12. Ozturk, M.; Dincer, I. A comprehensive review on power-to-gas with hydrogen options for cleaner applications. Int. J. Hydrogen Energy 2021, 46, 31511–31522. [Google Scholar] [CrossRef]
  13. Thema, M.; Bauer, F.; Sterner, M. Power-to-Gas: Electrolysis and methanation status review. Renew. Sustain. Energy Rev. 2019, 112, 775–787. [Google Scholar] [CrossRef]
  14. Zhang, U.; Zhang, X.; Feng, S. Power to gas: An option for 2060 high penetration rate of renewable energy scenario of China. Environ. Sci. Pollut. Res. 2022, 29, 6857–6870. [Google Scholar] [CrossRef] [PubMed]
  15. Estevez, R.; Aguado-Deblas, L.; Bautista, F.M.; López-Tenllado, F.J.; Romero, A.A.; Luna, D. A Review on Green Hydrogen Valorization by Heterogeneous Catalytic Hydrogenation of Captured CO2 into Value-Added Products. Catalysts 2022, 12, 1555. [Google Scholar] [CrossRef]
  16. Rönsch, S.; Schneider, J.; Matthischke, S.; Schlüter, M.; Götz, M.; Lefebvre, J.; Prabhakaran, P.; Bajohr, S. Review on methanation—From fundamentals to current projects. Fuel 2016, 166, 276–296. [Google Scholar] [CrossRef]
  17. Vogt, C.; Monai, M.; Kramer, G.K.; Weckhuysen, B.M. The renaissance of the Sabatier reaction and its applications on Earth and in space. Nat. Catal. 2019, 2, 188–197. [Google Scholar] [CrossRef]
  18. Gac, W.; Zawadzki, W.; Rotko, M.; Greluk, M.; Slowik, G.; Kolb, G. Effects of support composition on the performance of nickel catalysts in CO2 methanation reaction. Catal. Today 2020, 357, 468–482. [Google Scholar] [CrossRef]
  19. González-Rangulan, V.V.; Reyero, I.; Bimbela, F.; Romero-Sarria, F.; Daturi, M.; Gandía, L.M. CO2 Methanation over Nickel Catalysts: Support Effects Investigated through Specific Activity and Operando IR Spectroscopy Measurements. Catalysts 2023, 13, 448. [Google Scholar] [CrossRef]
  20. Martínez, J.; Hernández, E.; Alfaro, S.; López Medina, R.; Valverde Aguilar, G.; Albiter, E.; Valenzuela, M.A. High Selectivity and Stability of Nickel Catalysts for CO2 Methanation: Support Effects. Catalysts 2019, 9, 24. [Google Scholar] [CrossRef]
  21. Pandey, D.; Deo, G. Effect of support on the catalytic activity of supported Ni-Fe catalysts for the CO2 methanation reaction. J. Ind. Eng. Chem. 2016, 33, 99–107. [Google Scholar] [CrossRef]
  22. Wang, K.; Men, U.; Liu, S.; Wang, J.G.; Li, Y.U.; Tang, Y.H.; Li, Z.P.; An, W.; Pan, X.L.; Li, L. Decoupling the size and support/metal loadings effect of Ni/SiO2 catalysts for CO2 methanation. Fuel 2021, 304, 121388. [Google Scholar] [CrossRef]
  23. Chen, S.L.; Abdel-Mageed, A.M.; Li, M.R.; Cisneros, S.; Bansmann, J.; Rabeah, J.; Brückner, A.; Gross, A.; Behm, R.J. Electronic metal-support interactions and their promotional effect on CO2 methanation on Ru/ZrO2 catalysts. J. Catal. 2021, 400, 407–420. [Google Scholar] [CrossRef]
  24. El-Salamony, R.A.; Acharya, K.; Al-Fatesh, A.S.; Osman, A.I.; Alreshaidan, S.B.; Kumar, N.S.; Ahmed, H.; Kumar, R. Enhanced direct methanation of CO2 using Ni-based catalysts supported on ZrO2, CeO2-ZrO2, and La2O3-ZrO2: The effect of support material on the reducible NiO-interacted species and catalytic activity. Mol. Catal. 2023, 547, 113378. [Google Scholar] [CrossRef]
  25. Jia, X.; Zhang, X.; Rui, N.; Hu, X.; Liu, C.-J. Structural effect of Ni/ZrO2 catalyst on CO2 methanation with enhanced activity. Appl. Catal. B 2019, 244, 159–169. [Google Scholar] [CrossRef]
  26. Shen, L.; Xu, J.; Zhu, M.; Han, Y.-N. Essential Role of the Support for Nickel-Based CO2 Methanation Catalysts. ACS Catal. 2020, 10, 14581–14591. [Google Scholar] [CrossRef]
  27. Fan, W.K.; Tahir, M. Recent trends in developments of active metals and heterogeneous materials for catalytic CO2 hydrogenation to renewable methane: A review. J. Environ. Chem. Eng. 2021, 9, 105460. [Google Scholar] [CrossRef]
  28. Zhao, K.; Wang, W.; Li, Z. Highly efficient Ni/ZrO2 catalysts prepared via combustion method for CO2 methanation. J. CO2 Util. 2016, 16, 236–244. [Google Scholar] [CrossRef]
  29. Souza, E.F.; Appel, L.G. Oxygen vacancy formation and their role in the CO2 activation on Ca doped ZrO2 surface: An ab-initio DFT study. Appl. Surf. Sci. 2021, 553, 149589. [Google Scholar] [CrossRef]
  30. Niu, J.T.; Zhang, C.X.; Liu, H.Y.; Jin, Y.; Zhang, R.G. Enhanced performance of oxygen vacancies on CO2 adsorption and activation over different phases of ZrO2. Front. Energy 2023, 17, 545–554. [Google Scholar] [CrossRef]
  31. Yamaguchi, T. Application of ZrO2 as a catalyst and a catalyst support. Catal. Today 1994, 20, 199–217. [Google Scholar] [CrossRef]
  32. Hao, Z.; Shen, J.; Lin, S.; Han, X.; Chang, X.; Liu, J.; Li, M.; Ma, X. Decoupling the effect of Ni particle size and surface oxygen deficiencies in CO2 methanation over ceria supported Ni. Appl. Catal. B 2021, 286, 119922–119932. [Google Scholar] [CrossRef]
  33. Kuhaudomlap, S.; Srifa, A.; Koo-Amornpattana, W.; Fukuhara, W.; Ratchahat, S. Insight and comprehensive study of Ni-based catalysts supported on various metal oxides for CO2 methanation. Sci. Rep. 2024, 14, 23149. [Google Scholar] [CrossRef]
  34. Kwak, J.H.; Kovarik, L.; Szany, J. Heterogeneous Catalysis on Atomically Dispersed Supported Metals: CO2 Reduction on Multifunctional Pd Catalysts. ACS Catal. 2013, 3, 2094–2100. [Google Scholar] [CrossRef]
  35. Wu, H.C.; Chang, Y.C.; Wu, J.H.; Lin, J.H.; Lin, I.K.; Chen, C.S. Methanation of CO2 and reverse water gas shift reactions on Ni/SiO2 catalysts: The influence of particle size on selectivity and reaction pathway. Catal. Sci. Technol. 2015, 5, 4154–4163. [Google Scholar] [CrossRef]
  36. Wang, Z.; Shu, D.; Chen, H.; Ding, C.; Wang, J.; Lv, Y.; Gu, Q.; Wang, Q.; Yang, B. Dynamic Interplay between Particle Size and Strong Metal Support Interaction in Rh/TiO2 Tuning the Selectivity of CO2 Hydrogenation. ACS Catal. 2025, 15, 4101–4109. [Google Scholar] [CrossRef]
  37. Tauster, S.J.; Fung, S.C.; Garten, R.L. Strong metal-support interactions. Group 8 noble metals supported on titanium dioxide. J. Am. Chem. Soc. 1978, 100, 170–175. [Google Scholar] [CrossRef]
  38. Vayssilov, G.N.; Lykhach, Y.; Migani, A.; Staudt, T.; Petrova, G.P.; Tsud, N.; Skála, T.; Bruix, A.; Illa, F.; Prince, K.C.; et al. Support nanostructure boosts oxygen transfer to catalytically active platinum nanoparticles. Nat. Mat. 2011, 10, 310–315. [Google Scholar] [CrossRef]
  39. Franchini, C.A.; Llorca, J.; Kuznetsov, A.; Silva, A.M. Outstanding dispersion of CeO2 on reduced graphene oxide. Implications for highly dispersed Pd catalysts. Diam. Relat. Mater. 2020, 109, 108061–108071. [Google Scholar] [CrossRef]
  40. Puigdollers, A.R.; Pacchioni, G. Reducibility of ZrO2/Pt3Zr and ZrO2/Pt 2D films compared to bulk zirconia: A DFT+U study of oxygen removal and H2 adsorption. Nanoscale 2017, 9, 6866–6876. [Google Scholar] [CrossRef]
  41. Puigdollers, A.R.; Tosoni, S.; Pacchioni, G. Turning a Nonreducible into a Reducible Oxide via Nanostructuring: Opposite Behavior of Bulk ZrO2 and ZrO2 Nanoparticles Toward H2 Adsorption. J. Phys. Chem. C 2016, 120, 15329–15337. [Google Scholar] [CrossRef]
  42. Espino, O.E.; Zonetti, P.C.; Celin, R.R.; Costa, L.T.; Alves, O.C.; Spadotto, J.C.; Appel, L.G.; Avillez, R.R. The tendency of supports to generate oxygen vacancies and the catalytic performance of Ni/ZrO2 and Ni/Mg(Al)O in CO2 methanation. Catal. Sci. Technol. 2022, 12, 1324. [Google Scholar] [CrossRef]
  43. Gharegozloo, S.; Ataie, S.; Abdizadeh, H.; Mostafavi, E.; Parnian, M.J.; Khodadadi, A.A. High performance Ni–CNTs catalyst: Synthesis and characterization. RSC Adv. 2016, 6, 47072–47082. [Google Scholar] [CrossRef]
  44. Li, J.; Zhou, Y.; Xiao, X.; Wang, W.; Wang, N.; Qian, W.; Chu, W. Regulation of Ni–CNT Interaction on Mn-Promoted Nickel Nanocatalysts Supported on Oxygenated CNTs for CO2 Selective Hydrogenation. ACS Appl. Mater. Interfaces 2018, 10, 41224–41236. [Google Scholar] [CrossRef]
  45. Wang, W.; Chu, W.; Wang, N.; Yang, W.; Jiang, C. Mesoporous nickel catalyst supported on multi-walled carbon nanotubes for carbon dioxide methanation. Int. J. Hydrogen Energy 2016, 41, 967–975. [Google Scholar] [CrossRef]
  46. Eschemann, T.O.; Lamme, W.S.; Manchester, R.L.; Parmentier, T.E.; Cognigni, A.; Rønning, M.; Jong, K.P. Effect of support surface treatment on the synthesis, structure, and performance of Co/CNT Fischer–Tropsch catalysts. J. Catal. 2015, 328, 130–138. [Google Scholar] [CrossRef]
  47. Huang, Y.; Cai, J.; Zheng, S.; Guo, Y. Fabrication of a high-performance Pb–PtCu/CNT catalyst for methanol electro-oxidation. J. Power Sources 2012, 210, 81–85. [Google Scholar] [CrossRef]
  48. Liu, L.; Lou, H.; Chen, M. Selective hydrogenation of furfural to tetrahydrofurfuryl alcohol over Ni/CNTs and bimetallic Cu Ni/CNTs catalysts. Int. J. Hydrogen Energy 2016, 41, 14721–14731. [Google Scholar] [CrossRef]
  49. Qu, Y.; Xu, G.; Yang, J.; Zhang, Z. Reduction of aromatic nitro compounds over Ni nanoparticles confined in CNTs. Appl. Catal. A 2020, 590, 117311. [Google Scholar] [CrossRef]
  50. Sun, Y.; Li, C.; Zhang, A. Preparation of Ni/CNTs catalyst with high reducibility and their superior catalytic performance in benzene hydrogenation. Appl. Catal. A 2016, 522, 180–187. [Google Scholar] [CrossRef]
  51. Tessonnier, J.P.; Pesant, L.; Ehret, G.; Ledoux, M.J.; Pham-Huu, C. Pd nanoparticles introduced inside multi-walled carbon nanotubes for selective hydrogenation of cinnamaldehyde into hydrocinnamaldehyde. Appl. Catal. A 2005, 288, 203–210. [Google Scholar] [CrossRef]
  52. Wei, Q.; Chen, X.; He, Y.; Fu, J.; Liang, J.; Wei, X.; Wang, L. Ni Nanoparticles supported on N-doped carbon nanotubes for efficient hydrogenation of C5 hydrocarbon resins under mild conditions. Microporous Mesoporous Mater. 2022, 222, 111727. [Google Scholar] [CrossRef]
  53. Zhang, A.M.; Dong, J.L.; Xu, K.H.; Rhee, H.K.; Li, X.L. Palladium cluster filled in inner of carbon nanotubes and their catalytic properties in liquid phase benzene hydrogenation. Catal. Today 2004, 93–95, 347–352. [Google Scholar] [CrossRef]
  54. Saravanan, A.; Prasad, K.; Gokulakrishnan, N.; Kalaivani, R.; Somanathan, T. Efficiency of Transition Metals in Combustion Catalyst for High Yield Helical Multi-Walled Carbon Nanotubes. Adv. Sci. Eng. Med. 2014, 6, 809–813. [Google Scholar] [CrossRef]
  55. Wepasnick, K.A.; Smith, B.A.; Bitter, J.L.; Fairbrother, H. Chemical and structural characterization of carbon nanotube surfaces. Anal. Bioanal. Chem. 2010, 396, 1003–1014. [Google Scholar] [CrossRef]
  56. Feng, Y.; Yang, W.; Chu, W. A Study of CO2 Methanation over Ni-Based Catalysts Supported by CNTs with Various Textural Characteristics. Int. J. Chem. Eng. 2015, 795386. [Google Scholar] [CrossRef]
  57. Hou, P.-X.; Xu, S.-T.; Ying, Z.; Yang, Q.-H.; Liu, C.; Cheng, H.-M. Hydrogen adsorption/desorption behavior of multi-walled carbon nanotubes with different diameters. Carbon 2003, 41, 2471–2476. [Google Scholar] [CrossRef]
  58. Zacharia, R.; Kim, K.Y.; Fazle Kibria, A.L.M.; Nahm, K.S. Enhancement of hydrogen storage capacity of carbon nanotubes via spill-over from vanadium and palladium nanoparticles. Chem. Phys. Lett. 2005, 412, 369–375. [Google Scholar] [CrossRef]
  59. Gonçalves, L.P.L.; Meledina, M.; Meledin, A.; Petrovykh, D.Y.; Sousa, J.P.S.; Soares, O.S.G.P.; Kolenko, Y.V.; Pereira, M.F.R. Understanding the importance of N−doping for CNT-supported Ni catalysts for CO2 methanation. Carbon 2022, 195, 35–43. [Google Scholar] [CrossRef]
  60. Bogdan, V.I.; Pokusaeva, Y.A.; Koklin, A.E.; Savilov, S.V.; Chernyak, S.A.; Lunin, V.V.; Kustov, L.M. Carbon Dioxide Reduction with Hydrogen on Carbon-Nanotube-Supported Catalysts under Supercritical Conditions. Energy Technol. 2019, 7, 3–8. [Google Scholar] [CrossRef]
  61. Romero-Sáez, M.; Dongil, A.B.; Benito, N.; Espinoza-González, R.; Escalona, N.; Gracia, F. CO2 methanation over nickel-ZrO2 catalyst supported on carbon nanotubes: A comparison between two impregnation strategies. App. Catal. B 2018, 237, 817–825. [Google Scholar] [CrossRef]
  62. Hu, Y.H.; Ruckenstein, E. Pore Size Distribution of Single-Walled Carbon Nanotubes. Ind. Eng. Chem. Res. 2004, 43, 708–711. [Google Scholar] [CrossRef]
  63. Duong, H.M.; Einarsson, E.; Okawa, J.; Xiang, R.; Maruyama, S. Thermal Degradation of Single-Walled Carbon Nanotubes. Jpn. J. Appl. Phys. 2008, 47, 1994. [Google Scholar] [CrossRef]
  64. Bom, D.; Andrews, R.; Jacques, D.; Anthony, J.; Chen, B.; Meier, B.S.; Selegue, J.P. Thermogravimetric Analysis of the Oxidation of Multiwalled Carbon Nanotubes:  Evidence for the Role of Defect Sites in Carbon Nanotube Chemistry. Nano Lett. 2002, 2, 615–619. [Google Scholar] [CrossRef]
  65. Mahajan, A.; Kingon, A.; Kukovecz, Á.; Konya, Z.; Vilarinho, P.M. Studies on the thermal decomposition of multiwall carbon nanotubes under different atmospheres. Mater. Lett. 2013, 90, 165–168. [Google Scholar] [CrossRef]
  66. Łamacz, A.; Matus, K.; Liszka, B.; Silvestre-Albero, J.; Lafjah, M.; Dintzer, T.; Janowska, I. The impact of synthesis method of CNT supported CeZrO2 and Ni-CeZrO2 on catalytic activity in WGS reaction. Catal. Today 2018, 301, 172–182. [Google Scholar] [CrossRef]
  67. Zhang, J.; Jiang, D. Influence of geometries of multi-walled carbon nanotubes on the pore structures of Buckypaper. Compos. Part A Appl. Sci. Manuf. 2012, 43, 469–474. [Google Scholar] [CrossRef]
  68. Sun, C.H.; Li, F.; Cheng, H.M.; Lu, C.Q. Packing-dependent pore structures in single-walled carbon nanotube arrays. Appl. Phys. Lett. 2005, 87, 243109. [Google Scholar] [CrossRef]
  69. Yang, Q.-H.; Hou, P.-X.; Bai, S.; Wang, M.-Z.; Cheng, H.-M. Adsorption and capillarity of nitrogen in aggregated multi-walled carbon nanotubes. Chem. Phys. Lett. 2001, 345, 18–24. [Google Scholar] [CrossRef]
  70. Leofanti, G.; Padovan, M.; Tozzola, G.; Venturelli, B. Surface area and pore texture of catalysts. Catal. Today 1998, 41, 207–219. [Google Scholar] [CrossRef]
  71. Fujiwara, A.; Ishii, K.; Suematsu, H.; Kataura, H.; Maniwa, Y.; Suzuki, S.; Achiba, Y. Gas adsorption in the inside and outside of single-walled carbon nanotubes. Chem. Phys. Lett. 2001, 336, 205–211. [Google Scholar] [CrossRef]
  72. Kocabas, S.; Kopac, T.; Dogu, G.; Dogu, T. Effect of thermal treatments and palladium loading on hydrogen sorption characteristics of single-walled carbon nanotubes. Int. J. Hydrogen Energy 2008, 33, 1693–1699. [Google Scholar] [CrossRef]
  73. Srinivasan, R.; Davis, B.H.; Cavin, O.B.; Hubbard, C.R. Crystallization and Phase Transformation Process in Zirconia: An in situ High-Temperature X-ray Diffraction Study. J. Am. Ceram. Soc. 1992, 75, 1217–1222. [Google Scholar] [CrossRef]
  74. Ramamoorthy, R.; Sundararaman, D.; Ramasamy, S. X-ray diffraction study of phase transformation in hydrolyzed zirconia nanoparticles. J. Eur. Ceram. Soc. 1999, 19, 1827–1833. [Google Scholar] [CrossRef]
  75. Srinivasan, R.; De Angelis, R.; Davis, B.H. Factors influencing the stability of the tetragonal form of zirconia. J. Mater. Res. 1986, 1, 583–588. [Google Scholar] [CrossRef]
  76. Srinivasan, R.; Harris, M.B.; Simpson, S.F.; Deangelis, R.J.; Davis, B.H. Zirconium-oxide crystal phase—The role fo the pH and the time to attain the final pH for precipitation of hydrous oxide. J. Mater. Res. 1988, 3, 787–797. [Google Scholar] [CrossRef]
  77. Denkewicz, R.P.; Tenhuisen, K.S.; Adair, J.H. Hydrothermal crystallization kinetics of meta-ZrO2 and t-ZrO2. J. Mater. Res. 1990, 5, 2698–2705. [Google Scholar] [CrossRef]
  78. Collins, D.E.; Bowman, K.J. Influence of atmosphere on crystallization of zirconia from a zirconium alkoxide. J. Mater. Res. 1998, 13, 1230–1237. [Google Scholar] [CrossRef]
  79. Basahel1, S.N.; Ali, T.T.; Mokhtar, M.; Narasimharao, K. Influence of crystal structure of nanosized ZrO2 on the photocatalytic degradation of methyl orange. Res. Lett. 2015, 10, 73. [Google Scholar] [CrossRef]
  80. Román-Martínez, M.C.; Cazorla-Amorós, D.; Linares-Solano, A.; Lecea, C.S.M. Tpd and TPR characterization of carbonaceous supports and Pt/C catalysts. Carbon 1993, 31, 895–902. [Google Scholar] [CrossRef]
  81. Pan, X.; Bao, X. The Effects of Confinement inside Carbon Nanotubes on Catalysis. Acc. Chem. Res. 2011, 44, 553–562. [Google Scholar] [CrossRef]
  82. Chen, W.; Fan, Z.; Pan, X.; Bao, X. Effect of Confinement in Carbon Nanotubes on the Activity of Fischer−Tropsch Iron Catalyst. J. Am. Chem. Soc. 2008, 130, 9414–9419. [Google Scholar] [CrossRef]
  83. Bian, J.; Xiao, M.; Wang, S.-J.; Lu, Y.-X.; Meng, Y.-Z. Carbon nanotubes supported Cu–Ni bimetallic catalysts and their properties for the direct synthesis of dimethyl carbonate from methanol and carbon dioxide. Appl. Surf. Sci. 2009, 255, 7188–7196. [Google Scholar] [CrossRef]
  84. Kundu, S.; Wang, Y.; Xia, W.; Muhler, M. Thermal Stability and Reducibility of Oxygen-Containing Functional Groups on Multiwalled Carbon Nanotube Surfaces: A Quantitative High-Resolution XPS and TPD/TPR Study. J. Phys. Chem. C. 2008, 112, 16869–16878. [Google Scholar] [CrossRef]
  85. Holstein, W.L.; Boudart, M. Hydrogenolysis of carbon and its catalysis by platinum. J. Catal. 1981, 72, 328–337. [Google Scholar] [CrossRef]
  86. Cao, J.R.; Back, M.H. Kinetics of the reaction of hydrogen with thin films of carbon. Carbon 1982, 20, 505–512. [Google Scholar] [CrossRef]
  87. Treptau, M.H.; Miller, D.J. Hydrogen gasification of HNO3-oxidized carbons. Carbon 1991, 29, 531–539. [Google Scholar] [CrossRef]
  88. Zhou, Z.; Orcutt, E.K.; Anderson, H.C.; Stowers, K.J. Hydrogen surface modification of a carbon nanotube catalyst for the improvement of ethane oxidative dehydrogenation. Carbon 2019, 152, 924–931. [Google Scholar] [CrossRef]
  89. Herold, F.; Gläsel, J.; Etzold, B.J.M.; Rønning, M. Can Temperature-Programmed Techniques Provide the Gold Standard for Carbon Surface Characterization? Chem. Mater. 2022, 34, 8490–8516. [Google Scholar] [CrossRef]
  90. Lobo, L.S.; Carabineiro, S.A.C. Kinetics and mechanism of catalytic carbon gasification. Fuel 2016, 183, 457–469. [Google Scholar] [CrossRef]
  91. Gardner, D.C.; Bartholomew, C.H. Kinetics of carbon deposition during methanation of carbon monoxide. IEC Prod. Res. Dev. 1981, 20, 80–87. [Google Scholar] [CrossRef]
  92. Schmider, D.; Maier, L.; Deutschmann, O. Reaction Kinetics of CO and CO2 Methanation over Nickel. Ind. Eng. Chem. Res. 2021, 60, 5792–5805. [Google Scholar] [CrossRef]
  93. Lalinde, J.A.H.; Roongruangsree, P.; Ilsemann, J.; Bäumer, M.; Kopyscinski, J. CO2 methanation and reverse water gas shift reaction. Kinetic study based on in situ spatially-resolved measurements. Chem. Eng. J. 2020, 390, 124629. [Google Scholar] [CrossRef]
  94. Ghaib, K.; Nitz, K.; Ben-Fares, F.-Z. Chemical Methanation of CO2: A Review. ChemBioEng Rev. 2016, 3, 266–275. [Google Scholar] [CrossRef]
  95. Lim, J.U.; McGregor, J.; Sederman, A.J.; Dennis, J.S. The role of the Boudouard and water–gas shift reactions in the methanation of CO or CO2 over Ni/γ-Al2O3 catalyst. Chem. Eng. Sci. 2016, 152, 754–766. [Google Scholar] [CrossRef]
  96. Ashok, J.; Pati, S.; Hongmanorom, P.; Tianxi, Z.; Junmei, C.; Kawi, S. A review of recent catalyst advances in CO2 methanation processes. Catal. Today 2020, 356, 471–489. [Google Scholar] [CrossRef]
  97. Vogt, C.; Monai, M.; Sterk, E.B.; Palle, J.; Melcherts, A.E.M.; Zijlstra, B.; Groeneveld, E.; Berben, P.H.; Boereboom, J.M.; Hensen, E.J.M.; et al. Understanding carbon dioxide activation and carbon–carbon coupling over nickel. Nat. Commun. 2019, 10, 5330. [Google Scholar] [CrossRef]
  98. Wang, W.; Duong-Viet, C.; Ba, H.; Baaziz, W.; Tuci, G.; Caporali, S.; Nguyen-Dinh, L.; Ersen, O.; Giambastiani, G.; Pham-Huu, C. Nickel Nanoparticles Decorated Nitrogen-Doped Carbon Nanotubes (Ni/N-CNT); a Robust Catalyst for the Efficient and Selective CO2 Methanation. ACS Appl. Energy Mater. 2019, 2, 1111–1120. [Google Scholar] [CrossRef]
  99. Le, T.; Striolo, S.; Turner, C.H.; Cole, D.R. Confinement Effects on Carbon Dioxide Methanation: A Novel Mechanism for Abiotic Methane Formation. Sci. Rep. 2017, 7, 9021. [Google Scholar] [CrossRef]
  100. Kattel, S.; Liu, P.; Chen, J.G. Tuning Selectivity of CO2 Hydrogenation Reactions at the Metal/Oxide Interface. J. Am. Chem. Soc. 2017, 139, 9739–9754. [Google Scholar] [CrossRef]
  101. Ye, R.-P.; Li, Q.; Gong, W.; Wang, T.; Razink, J.J.; Lin, L.; Qin, Y.-Y.; Zhou, Z.; Adidharma, H.; Tang, J.; et al. High-performance of nanostructured Ni/CeO2 catalyst on CO2 methanation. Appl. Catal. B 2020, 268, 118474. [Google Scholar] [CrossRef]
  102. Mutz, B.; Belimov, M.; Wang, W.; Sprenger, P.; Serrer, M.-A.; Wang, D.; Pfeifer, P.; Kleist, W.; Grunwaldt, J.-D. Potential of an Alumina-Supported Ni3Fe Catalyst in the Methanation of CO2: Impact of Alloy Formation on Activity and Stability. ACS Catal. 2017, 7, 6802–6814. [Google Scholar] [CrossRef]
  103. Simons, J.F.M.; de Heer, T.J.; van de Poll, R.C.J.; Muravev, V.; Kosinov, N.; Hensen, E.J.M. Structure Sensitivity of CO2 Hydrogenation on Ni Revisited. J. Am. Chem. Soc. 2023, 145, 20289–20301. [Google Scholar] [CrossRef] [PubMed]
  104. Visser, N.L.; Daoura, O.; Plessow, P.N.; Smulders, L.C.J.; Rijk, J.W.; Stewart, J.A.; Vandegehuchte, B.D.; Studt, F.; van der Hoeven, J.E.S.; Jongh, P.E. Particle Size Effects of Carbon Supported Nickel Nanoparticles for High Pressure CO2 Methanation. ChemCatChem 2022, 14, e202200665. [Google Scholar] [CrossRef]
  105. Riani, P.; Spennati, E.; Garcia, E.M.V.; Escribano, V.S.; Busca, G.; Garbarino, G. Ni/Al2O3 catalysts for CO2 methanation: Effect of silica and nickel loading. Int. J. Hydrogen Energy 2023, 48, 24976–24995. [Google Scholar] [CrossRef]
  106. De Coster, V.; Srinath, N.V.; Yazdani, P.; Poelman, H.; Galvita, V.V. Does CO2 Oxidize Ni Catalysts? A Quick X-ray Absorption Spectroscopy Answer. J. Phys. Chem. Lett. 2022, 13, 7947–7952. [Google Scholar] [CrossRef]
  107. Foppa, L.; Margossian, T.; Kim, S.M.; Müller, C.; Copéret, C.; Larmier, K.; Comas-Vives, A. Contrasting the Role of Ni/Al2O3 Interfaces in Water–Gas Shift and Dry Reforming of Methane. J. Am. Chem. Soc. 2017, 139, 17128–17139. [Google Scholar] [CrossRef]
  108. Silaghi, M.-C.; Comas-Vives, A.; Copéret, C. CO2 Activation on Ni/γ–Al2O3 Catalysts by First-Principles Calculations: From Ideal Surfaces to Supported Nanoparticles. ACS Catal. 2016, 6, 4501–4505. [Google Scholar] [CrossRef]
  109. Shirsath, A.B.; Schulte, M.L.; Kreitz, B.; Tischer, S.; Grunwaldt, J.-D.; Deutschmann, O. Spatially-resolved investigation of CO2 methanation over Ni/γ-Al2O3 and Ni3.2Fe/γ-Al2O3 catalysts in a packed-bed reactor. J. Chem. Eng. 2023, 469, 143847. [Google Scholar] [CrossRef]
  110. Navarro-Ruiz, J.; Audevard, J.; Vidal, M.; Campos, C.H.; Rosal, I.D.; Serp, P.; Gerber, I.C. Mechanism of Hydrogen Spillover on Metal-Doped Carbon Materials: Surface Carboxylic Groups Are Key. ACS Catal. 2024, 14, 7111–7126. [Google Scholar] [CrossRef]
  111. Wang, Z.; Yang, F.H.; Yang, R.T. Enhanced Hydrogen Spillover on Carbon Surfaces Modified by Oxygen Plasma. J. Phys. Chem. C 2010, 114, 1601–1609. [Google Scholar] [CrossRef]
  112. Munnik, P.; Jongh, P.E.; Jong, K.P. Recent Developments in the Synthesis of Supported Catalysts. Chem. Rev. 2015, 115, 6687–6718. [Google Scholar] [CrossRef] [PubMed]
  113. Mehrabadi, B.A.T.; Eskandari, S.; Khan, U.; White, R.D.; Regalbuto, J.R. Chapter One—A Review of Preparation Methods for Supported Metal Catalysts. In Advances in Catalysis; Song, C., Ed.; Academic Press: Cambridge, MA, USA, 2017; pp. 1–35. [Google Scholar] [CrossRef]
  114. Brunauer, S.; Emmett, P.H.; Teller, E. Adsorption of Gases in Multimolecular Layers. J. Am. Chem. Soc. 1938, 60, 309–319. [Google Scholar] [CrossRef]
  115. Barrett, E.P.; Joyner, L.G.; Halenda, P.P. The Determination of Pore Volume and Area Distributions in Porous Substances. I. Computations from Nitrogen Isotherms. J. Am. Chem. Soc. 1952, 73, 373–380. [Google Scholar] [CrossRef]
Figure 1. XRD diffraction patterns obtained for (A) CNT and zNi/ZrO2/CNT samples and the (B) calcined and reduced 10Ni/ZrO2/CNT sample.
Catalysts 15 00675 g001
Figure 2. The XRD patterns of the in situ reduction of the catalyst 10 Ni/ZrO2/CNT with 5% H2/N2 at room temperature (RT) and 400 °C with different exposure times to the reduction.
Catalysts 15 00675 g002
Figure 3. The XRD patterns of the in situ reduction of the catalyst 10 Ni/ZrO2/CNT with 5% H2/N2 at room temperature (RT) and 400 °C in the 2θ range of 35–55 °.
Catalysts 15 00675 g003
Figure 4. Raman spectra of 10Ni/ZrO2/CNT before in situ reduction of different sample regions (red and black) and after reduction at 400 °C for 2 h under a H2 flow (blue).
Catalysts 15 00675 g004
Figure 5. H2-TPR profiles obtained for the CNT and zNi/ZrO2/CNT samples.
Catalysts 15 00675 g005
Figure 6. Calcined 10Ni/CNT sample: (a) TEM image and (b) EDX elemental mapping; Ni (green).
Catalysts 15 00675 g006
Figure 7. Reduced 10Ni/ZrO2/CNT sample: (a) TEM image and (b) EDX elemental mapping; Ni (green) and Zr (red).
Catalysts 15 00675 g007
Figure 8. The thermogravimetric analysis of (A) samples treated in N2, (B) the 10Ni/ZrO2/CNT sample treated in 10% H2/Ar at 300 °C for 1 h, (C) the 10Ni/ZrO2/CNT sample treated in 10% H2/Ar at 400 °C for 1 h, (D) the 10Ni/ZrO2/CNT and 10 Ni/CNT samples treated in 10% H2/Ar at 500 °C for 1 h, and (E) the CNT and 10Ni/ZrO2/CNT samples treated in 80% H2/Ar at 500 °C for 1 h.
Catalysts 15 00675 g008
Figure 9. Thermodynamic equilibrium for CO2 methanation: (A) the equilibrium constants of the main reactions as a function of temperature; (B) CO2 conversion, (C) CH4 selectivity, and (D) CO selectivity as a function of pressure and temperature in a reaction system fed with a H2:CO2 mixture at a 4:1 molar ratio.
Catalysts 15 00675 g009
Figure 10. The effect of the H2/CO2 molar ratio on thermodynamic equilibrium for CO2 methanation at 1 bar: (A) CO2 conversion, (B) CH4 selectivity, (C) CO selectivity, and (D) carbon selectivity as a function of temperature.
Catalysts 15 00675 g010
Figure 11. CO2 conversion (A) and CH4 selectivity (B) for CO2 methanation on Ni-based catalysts. Reaction conditions: p = 1.0 atm, GHSV = 40,000 mLg−1h−1, H2:CO2 molar ratio = 4:1.
Catalysts 15 00675 g011
Figure 12. CO2 conversion (A) and CH4 selectivity (B) for CO2 methanation on zNi/ZrO2/CNT catalysts. Reaction conditions: p = 1.0 atm, GHSV = 40,000 mLg−1h−1, H2:CO2 molar ratio = 4:1.
Catalysts 15 00675 g012
Figure 13. CO2 conversion (A) and CH4 selectivity (B) for CO2 methanation on 10Ni/ZrO2/CNT catalyst reduced at 300, 400, and 500 °C. Reaction conditions: p = 1.0 atm, GHSV = 40,000 mLg−1h−1, H2:CO2 molar ratio = 4:1).
Catalysts 15 00675 g013
Figure 14. Catalytic stability for 10Ni/ZrO2 and 10Ni/ZrO2/CNT. Reaction conditions: p = 1.0 atm, GHSV = 40,000 mLg−1h−1, H2:CO2 molar ratio = 4:1.
Catalysts 15 00675 g014
Table 1. Composition of calcined samples supported on CNTs.
SampleResidual Weight a (%)XRF b (%)Actual Amount c (%)
NiOZrO2NiONiZrO2
CNT0-----
10Ni/CNT13.11000.0013.19.90.0
10Ni/ZrO2/CNT31.343.856.213.710.717.6
20ZrO2/CNT20.70.00100-0.020.7
2.5Ni/ZrO2/CNT24.316.183.93.93.020.4
5Ni/ZrO2/CNT24.331.468.67.66.016.6
15Ni/ZrO2/CNT41.149.250.820.215.920.7
a Residual weight was determined through TGA. b Amounts of NiO and ZrO2 were determined through XRF. c Real amount of metallic Ni was determined through stoichiometry (NiO + H2 → Ni + H2O).
Table 2. Textural properties of calcined and reduced samples.
SampleCalcined SamplesReduced Samples
SBET (m2/g)VP
(cm3/g)
DP
(nm)
SBET (m2/g)VP
(cm3/g)
DP
(nm)
CNT3230.8114131.111
10Ni/CNT2690.7124751.514
10Ni/ZrO2/CNT2180.5113170.811
20ZrO2/CNT2330.8153741.011
10Ni/ZrO21140.14.5---
Disclaimer/Publisher’s Note: The statements, opinions and data contained in all publications are solely those of the individual author(s) and contributor(s) and not of MDPI and/or the editor(s). MDPI and/or the editor(s) disclaim responsibility for any injury to people or property resulting from any ideas, methods, instructions or products referred to in the content.

