Article

The Role of Geometry in Cobalt–Polypyridine Complexes in the Electrochemical Reduction of CO2 Using UV-Vis Spectroelectrochemistry

by
Gilberto Rocha-Ortiz
1,
Anahí Barrios-Velasco
2,
Omar Monsalvo Zúñiga
1,
Marisela Cruz-Ramírez
3,
Angel Mendoza
4,
Lillian G. Ramírez-Palma
5,
Juan Pablo F. Rebolledo-Chávez
5 and
Luis Ortiz-Frade
1,*
1
Departamento de Electroquímica, Centro de Investigación y Desarrollo Tecnológico en Electroquímica S.C., Pedro Escobedo C.P. 76703, Mexico
2
Tecnológico Nacional de México Campus Ciudad Hidalgo, División de Nanotecnología, C. Hidalgo C.P. 61100, Mexico
3
Escuela de Bachilleres Plantel San Juan del Río, Universidad Autónoma de Querétaro, Calle Corregidora No. 4, Colonia Centro, San Juan del Rio C.P. 76800, Mexico
4
Centro de Química, Instituto de Ciencias, Benemérita Universidad Autónoma de Puebla, Ciudad Universitaria, Col. San Manuel, Puebla C.P. 72570, Mexico
5
División de Química y Energías Renovables, Universidad Tecnológica de San Juan del Río, Avenida La Palma No. 125 Vista Hermosa, San Juan del Rio C.P. 76826, Mexico
*
Author to whom correspondence should be addressed.
Catalysts 2025, 15(7), 641; https://doi.org/10.3390/catal15070641
Submission received: 31 May 2025 / Revised: 19 June 2025 / Accepted: 27 June 2025 / Published: 30 June 2025
(This article belongs to the Special Issue Green Heterogeneous Catalysis for CO2 Reduction)

Abstract

This work explores the effect of geometry and the presence of a site available for carbon dioxide coordination in molecular catalysis of CO2 reduction for cobalt complexes using electrochemical and spectroelectrochemical studies. The octahedral complexes [CoII(bztpen)Br]PF6 and [CoII(bpy)3](BF4)2, along with the trigonal bipyramidal complex [CoII(TPA)Cl]Cl, were selected for this study (where bztepen = N-benzyl-N,N′,N′-tris-(pyridine-2-ylmethyl)-ethylenediamine), TPA = tris (2-pyridimethyl)-amine, and bpy = 2′-2′- pyridine). DFT calculations were performed to predict the geometries of the complexes and to propose the sites at which electron transfer occurs. Among the studied compounds, [CoII(bpy)3(BF4)2] exhibited the highest catalytic rate constant for CO2 reduction (k = 1.22 × 10² M−1·s−1) compared to [CoII(bztpen)Br]PF6 (k = 8.93 × 101 M−1·s−1). The trigonal bipyramidal complex [CoII(TPA)Cl]Cl presented the lowest catalytic rate constant for CO2 reduction (k = 1.47 × 101 M−1·s−1). UV-Vis spectroelectrochemical studies and DFT calculations suggested the formation of [CoI(bztpen)(CO)]+ and [CoI(tpa)(CO)]+ species, which are associated with catalyst deactivation and may account for the lower performance of CO2 reduction.

Graphical Abstract

1. Introduction

The greenhouse effect has contributed to a global temperature increase of 1.1 °C between 2010 and 2020 [1]. Within this context, CO2 is identified as the primary agent associated with this effect. Data indicate that CO2 emissions increased from 20 billion tons in 1990 to 41.6 billion tons in 2024 [2]. Since 2010, the atmospheric concentration of CO2 has been increasing at an average annual rate of approximately 2 ppm, mainly attributed to coal combustion [3,4]. In response to this challenge, various strategies have been developed to mitigate CO2 emissions that include chemical and physical absorption methods. However, they face significant limitations, including high energy demands for absorbent regeneration [5]. Consequently, catalysis for CO2 conversion has emerged as a promising alternative. In particular, the transformation of CO2 into liquid fuels, which can serve as feedstock for other industrial processes, has garnered considerable attention. This approach, often facilitated by metal complexes, is especially interesting due to its high efficiency [6,7].
Carbon dioxide is the product of the complete oxidation of carbon. As a small, stable, and inert molecule, it poses significant challenges for efficient activation. In its ground state, CO2 exhibits a linear geometry and a standard Gibbs free energy of formation (ΔG°f) of −396 kJ/mol [8,9,10]. Consequently, CO2 transformation into valuable products requires substantial energy consumption. In this context, CO2 reduction involves multi-electron transfer processes that yield products such as formic acid, carbon monoxide, oxalic acid, methanol, or methane [7,11,12].
  E ° V v s   N H E
C O 2 + 2 H + + 2   e   H C O 2 H                                       0.61
C O 2 + 2 H + + 2   e   C O +   H 2 O                             0.52
C O 2 + 4 H + + 4   e   H C H O +   H 2 O               0.48
C O 2 + 6 H + + 6   e   C H 3 O H +   H 2 O             0.38
C O 2 + 8 H + + 8   e   C H 4 +   2 H 2 O                       0.24
These reactions are particularly challenging due to involving multiple electron transfers and coupled chemical steps such as protonation [7,12]. An important parameter in these processes is the standard redox potential for the formation of the CO2•− radical anion, which is −1.97 V vs. SHE in DMF and −1.90 V vs. SHE in water. In both cases, the electrochemical process’s high overpotentials are required due to high reorganization energies [7,12,13]. The activation energy barrier for the formation of this chemical species can be decreased either using modified electrodes with semiconductor and transition metal electrocatalysts or using mercury electrodes [13,14,15]. However, these strategies are compromised by the mercury toxicity and lack of control of the chemical species responsible for the electrocatalytic reduction.
Molecular catalysis offers an alternative approach to promote CO2 reduction, utilizing molecules as catalysts either in solution or immobilized on the electrode surface as a monolayer or multilayer [13]. A molecular catalyst is defined as an electron transfer agent with a redox potential value (E0) close to a specific target reaction. Additionally, it must exhibit a high homogeneous electron transfer rate constant, kcat, for the target reaction. Furthermore, the heterogeneous electron transfer rate, k°, for the oxidation or reduction of the molecular catalyst must also be high. The characteristics already mentioned can be optimized using coordination compounds [7,11,15].
The initial step in CO2 reduction in molecular catalysis using transition metal complexes involves coordination of CO2 to the reduced metal center (Mn+), forming an intermediate species Mm+L(CO2). The most common coordination mode occurs through σ bonding between the metal center and the carbon atom. During this process, bond cleavage can lead to CO release, or alternatively, protonation of the reduced catalyst may form a metal hydride intermediate (H–Mn+L). This species can follow two competing pathways: reaction with CO2 to yield formate (HCO2) or reaction with H+ to produce H2. The acidity of the medium critically influences the distribution of products such as carbon monoxide, formate, and hydrogen gas [14].
Several key factors must be considered in the design of transition metal-based molecular catalysts for CO2 reduction. First, the stability of the complexes during preparation, isolation, and purification. Second, the presence of one or more vacant coordination sites for CO2 binding [12].
Ternary coordination compounds employing macrocyclic, pyridinic, or phosphine ligands have been developed as molecular catalysts [14,15,16,17]. Among these, Fe(0) porphyrins are the most extensively studied, demonstrating both efficiency and stability in selectively converting CO2 to CO, particularly in the presence of Lewis or weak Brønsted acids [14]. Additionally, Ir and Pd pincer complexes in water–acetonitrile mixtures exhibit high catalytic activity for CO2 reduction, achieving faradaic yields of up to 90%. Formate is the main product, although H2 evolution due to water reduction also occurs [10].
Tetraazamacrocyclic cobalt and nickel complexes have achieved faradaic yields of up to 98% for CO2 reduction to CO, with reduction potentials ranging from −1.3 to −1.6 V vs. SCE [14,15]. Re, Ru, Ir, Rh, Os, Pd, Mo, Cu, Co, Ni, Mn, and Fe complexes with similar ligands have been explored, yielding products such as oxalate, carbon monoxide, and occasionally, formic acid [18].
Molecular catalysts based on Re, Rh, Os, and Ru complexes with polypyridine ligands have also been reported for CO2 reduction, where formic acid and formate are the principal products. Their effectiveness is attributed to the ability of these complexes to stabilize low oxidation states and store electrons in π orbitals [15]. Complexes with 1,10-phenanthroline (phen) and earth-abundant metals such as Co, Ni, Fe, and Cu have been proposed as promising low-cost molecular catalysts for CO2 reduction in comparison with platinum group derivatives [19,20].
Cobalt has been extensively investigated as an efficient catalyst for CO2 reduction in various forms, including single-atom catalysts, multi-metals, Co-based metal–organic frameworks (MOFs), cobalt oxides, and cobalt complexes, due to its cost-effectiveness, versatility, and high efficiency in producing carbon monoxide and formate [21]. Furthermore, the [Co(triphos)(bdt)]+ complex has been reported as an effective CO2 reduction catalyst, with its geometry playing a key role in selectively producing formate as the main product [22].
In a recent work, we investigated, using cyclic voltammetry, the role of redox potential of a series of Co(II) octahedral complexes [Co(L)3]2+ and [Co(L′)2]2+, where L = 2,2′-bpyridine, 1,10-phenanthroline, 3,4,7,8-tetramethyl-1,10-phenanthroline, 5,6-dimethyl-1,10-phenanthroline, and 4,7-diphenyl-1,10-phenanthroline and L′ = terpyridine and 4-chloro-terpyridine in the mediated electrochemical reduction of CO2 [23]. It was found that metal complexes with more negative redox potential enhance the catalytic performance for CO2 reduction. However, no other geometries, the presence of a site available for CO2 coordination, and the presence of intermediates using UV-Vis spectroelectrochemistry were explored. This technique combines in situ UV-Vis spectroscopy with potential step electrolysis to observe changes in the electronic structure of substances or the presence of new species that occur during a redox process. Such studies can provide information for the design of catalysts with abundant earth metals for electrochemical CO2 reduction.
The objective of the presented work is to explore, for cobalt complexes, the effect of the complex geometry and the presence of a site available for carbon dioxide coordination in molecular catalysis of CO2 using electrochemical and coupled UV-Vis spectroelectrochemical techniques that can give information about the presence of intermediates generated during the CO2 electrochemical reduction. For this purpose, the octahedral complexes [CoII(bztpen)Br]PF6 and [CoII(bpy)3](BF4)2 and the trigonal bipyramidal complex [CoII(TPA)Cl]Cl were selected (where bztepen = N-benzyl-N,N′,N′-tris-(pyridine-2-ylmethyl)-ethylenediamine and TPA = tris-(2-pyridymethyl)-amie)bpy = 2′-2′- pyridine). The chemical structures of the compounds [CoII(bztpen)Br]PF6, [CoII(TPA)Cl]Cl, and [CoII(bpy)3](BF4)2 are shown in Figure 1. DFT calculations were also carried out to predict geometry in complexes and to propose sites where the electron transfer takes place.

2. Results and Discussion

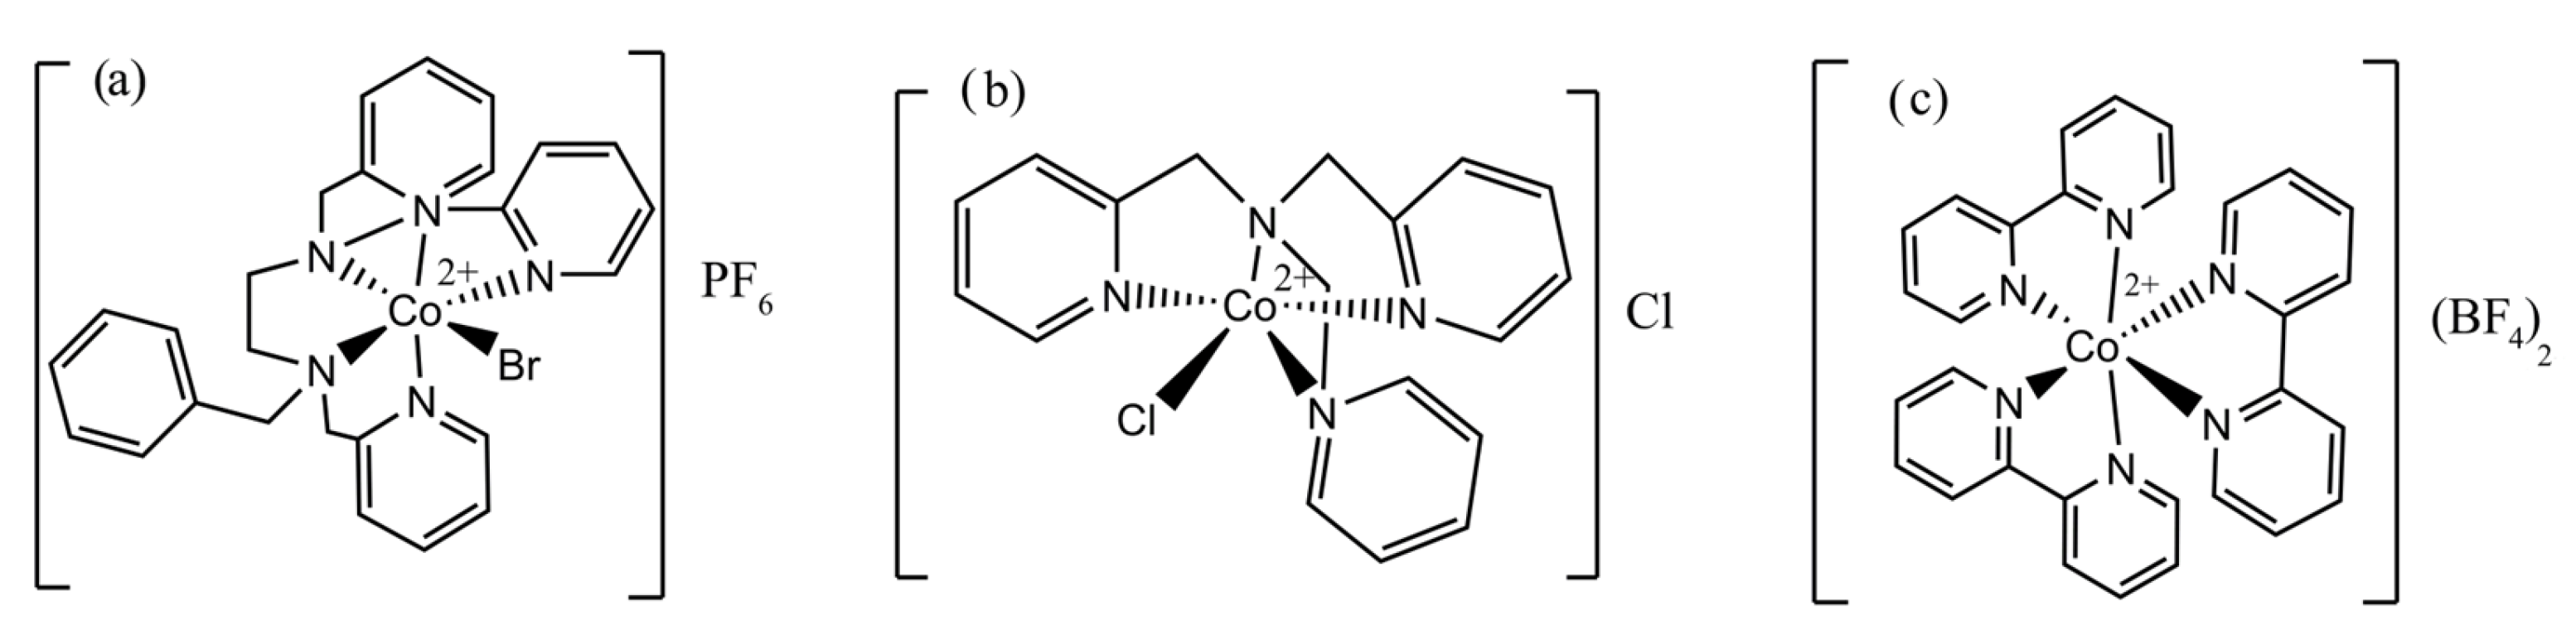
2.1. Complexes’ Characterization

2.1.1. IR Spectroscopy

The IR spectra of the metal complexes [CoII(Bztpen)Br]PF6, [CoII(tpa)Cl]Cl, and [CoII(bpy)3](BF4)2 exhibit characteristic vibrational frequencies of the ligands (Figure S1). The bond stretching ν(=C-H) is observed in the range of 3000–3100 cm−1, while the overtone vibrations σ(=CH) appear between 1600 and 2000 cm−1. The stretching bands ν(C=C) and ν(C=N) of the polypyridine rings are recorded in the 1420–1640 cm−1 region. Additionally, out-of-plane bending vibrations of the aromatic C-H bonds are observed between 856 and 700 cm−1. Intense signals at approximately 1061 cm−1 and 831 cm−1 correspond to the B-F and P-F stretching vibrations of the BF4 and PF6 counterions, respectively.

2.1.2. UV-Vis Spectroscopy

The electronic spectra of the metal complexes were recorded in acetonitrile solution. The [CoII(bpy)3](BF4)2 complex exhibits electronic transitions at ν1 = 4T1g(P)→4T2g(F) around 910 nm and ν2 = 4T1g(P)→4T1g(F) at 450 nm, resulting in a ν12 ratio of 2.02, typical for octahedral configurations [24,25]. The ν3 transition is not observed due to overlap with the intense metal-to-ligand charge transfer (MLCT) band. For the complex [Co(Bztpen)Br]PF6, only the electronic transition ν2 = 4T1g(P)→4T1g(F), typical for octahedral geometry, was detected at 515 nm.
For the [CoII(tpa)Cl]Cl complex, the electronic spectrum displays a broad absorption band around 276 nm, corresponding to the π→π* transition of the TPA ligand. Additionally, two absorption bands at 492 nm and 628 nm attributed to the d-d transitions are observed [7]. These spectral features are consistent with a five-coordinated cobalt (II) center adopting a trigonal bipyramidal (TBP) geometry and point group D3h, in agreement with previous reports [26,27,28,29,30].

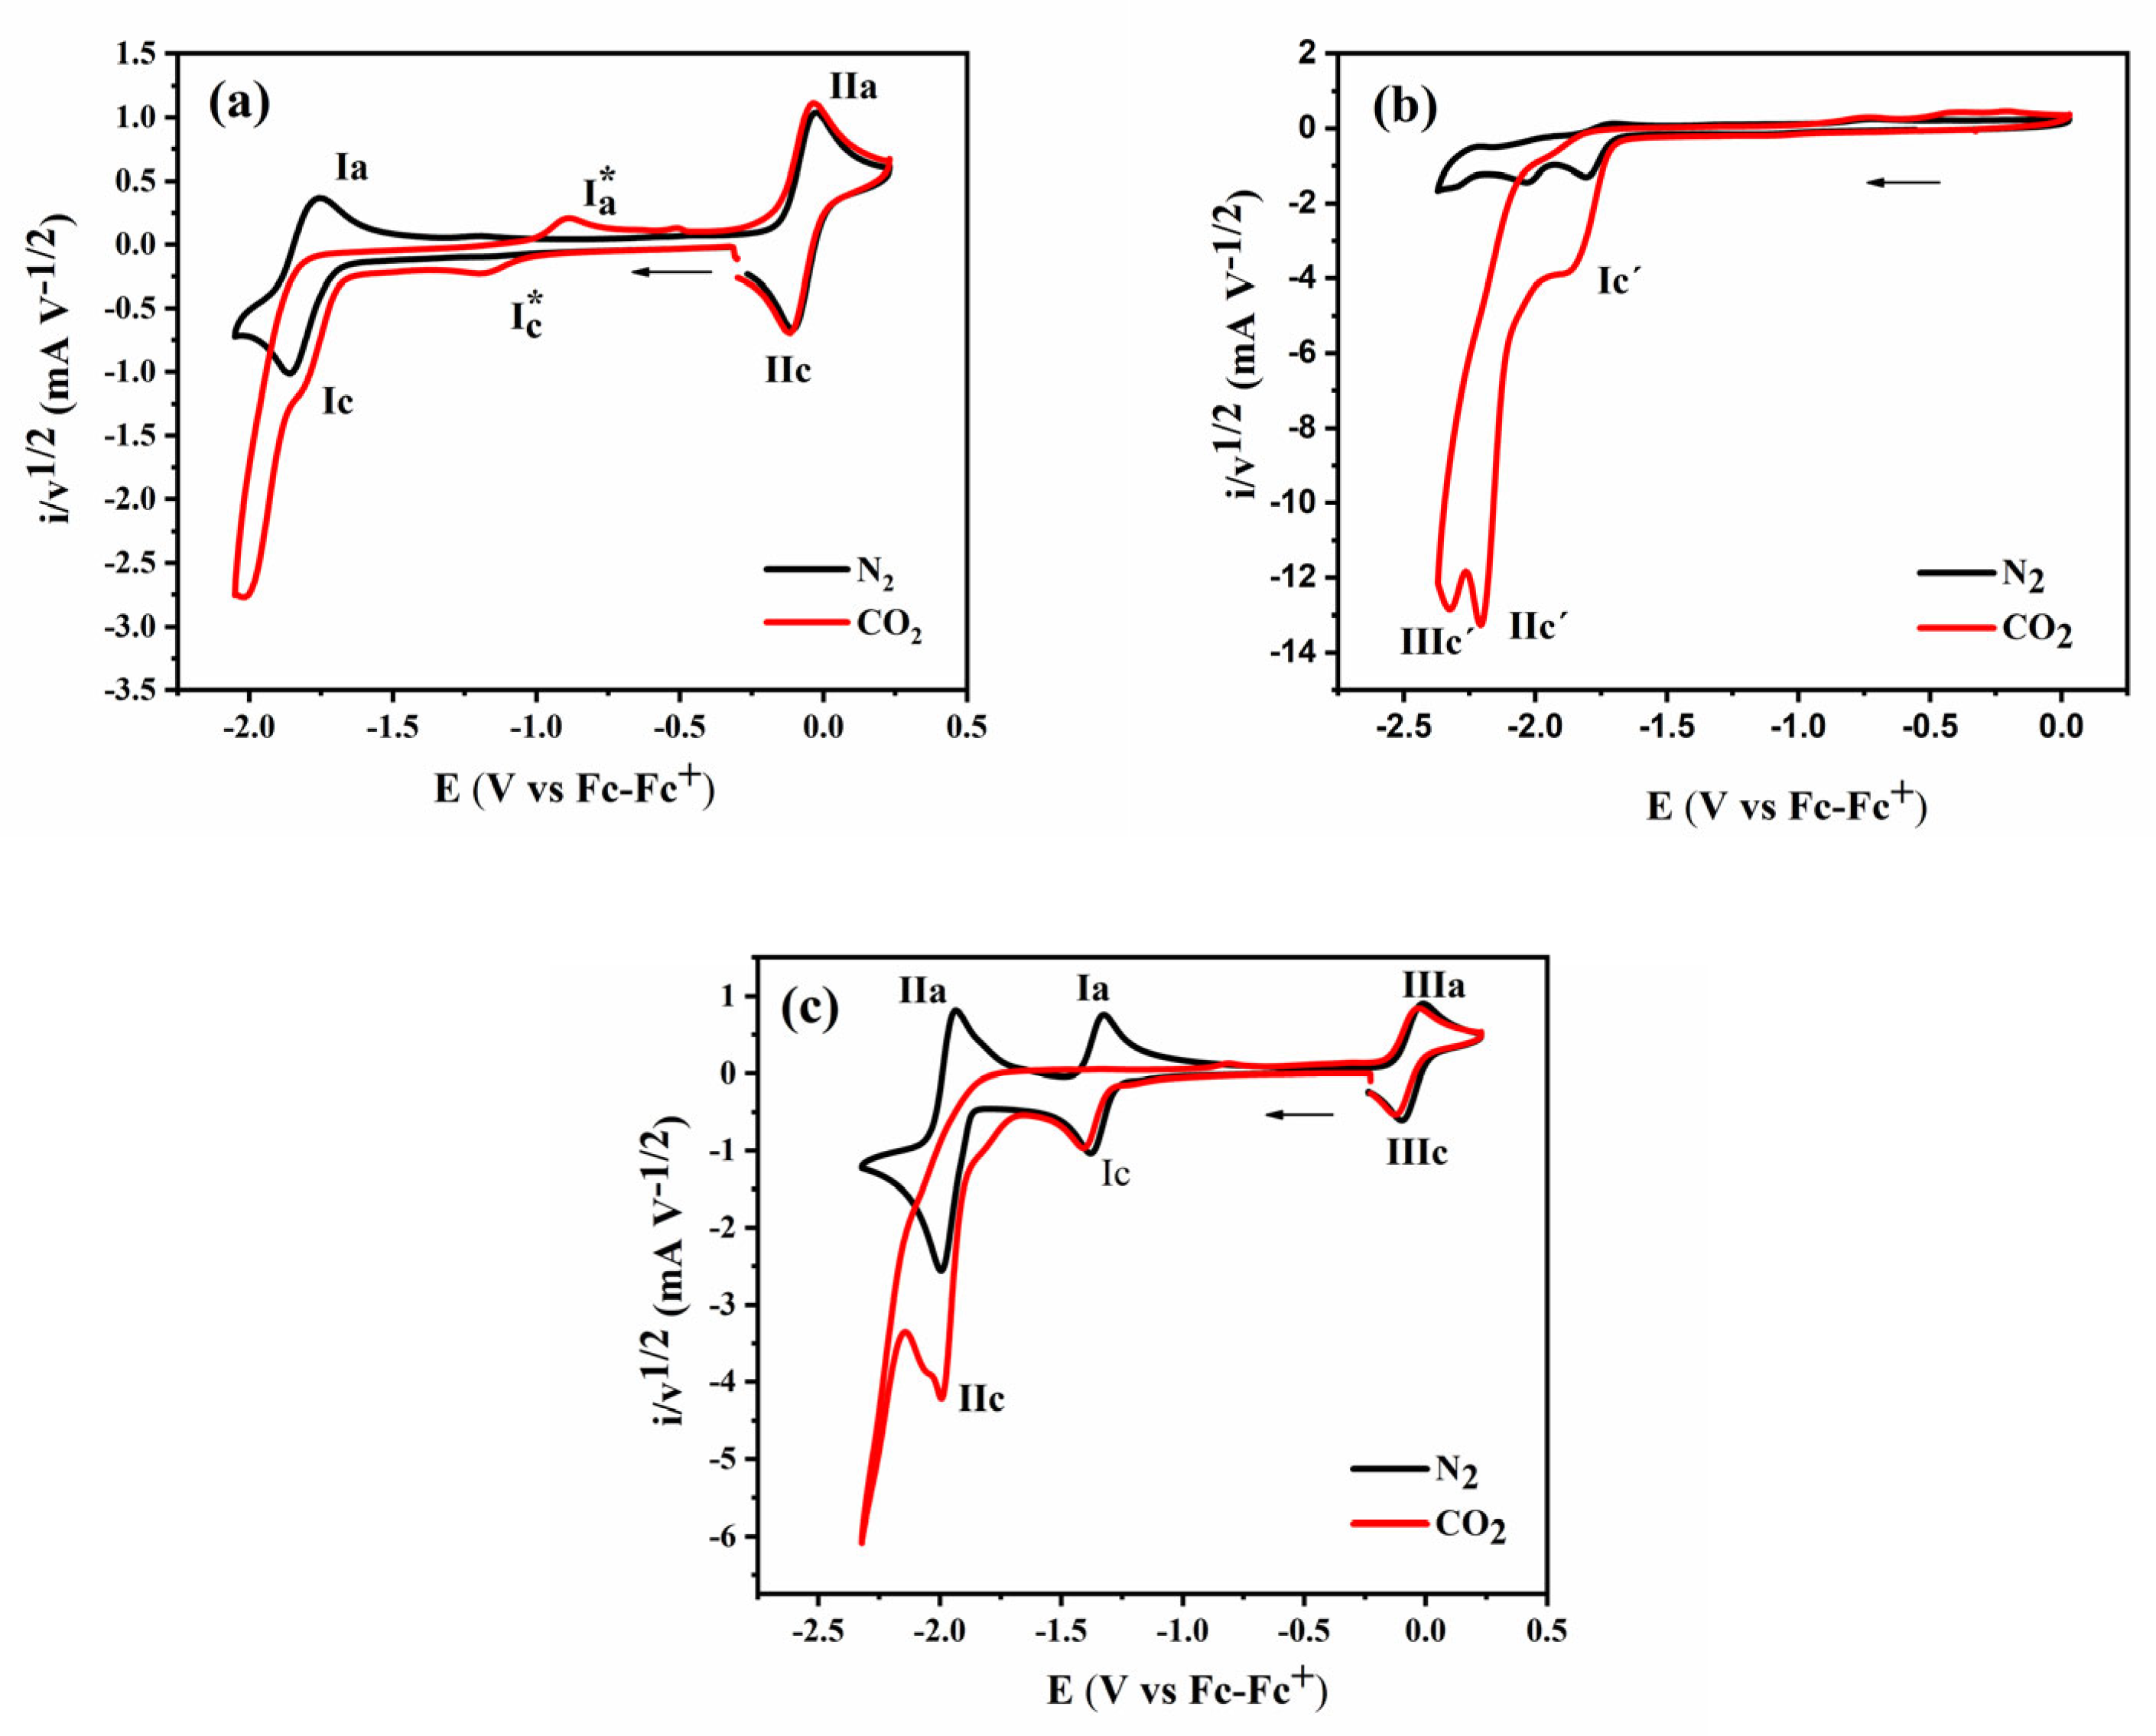
2.2. Cyclic Voltammetry Response of Metal Complexes

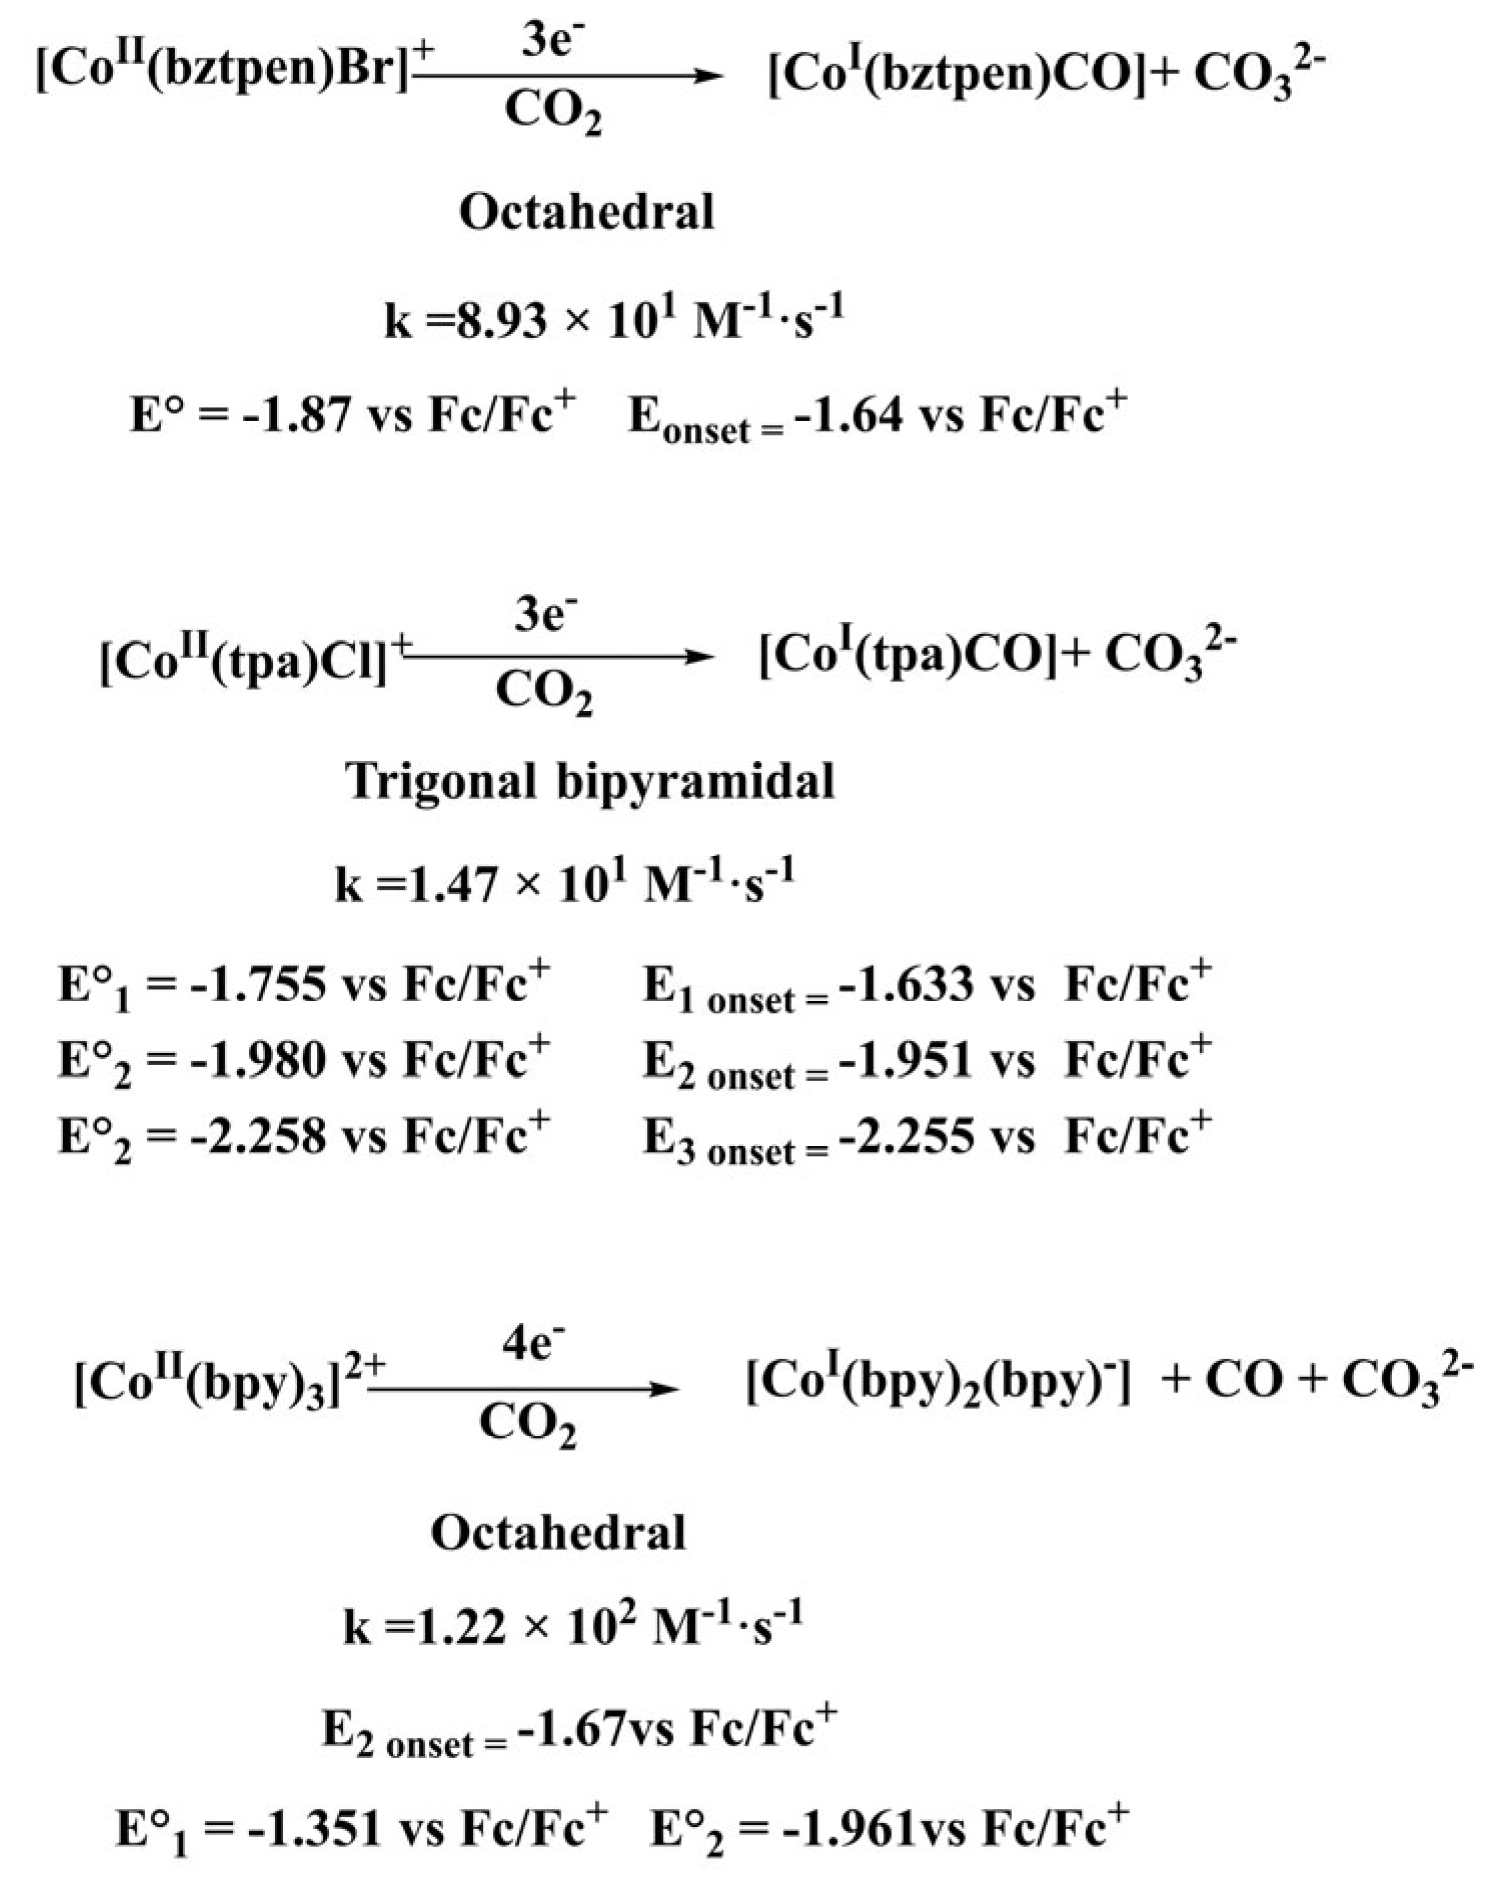
2.2.1. Cyclic Voltammetry of [CoII(bztpen)Br]PF6

Cyclic voltammetry experiments were carried out at a complex concentration of 1 mM in a MeCN solution with 0.1 M TBAPF6 as the supporting electrolyte. Potential scan was initiated from the open circuit potential in a negative direction. All voltammograms at scan rates ranging from 50 to 1500 mV·s−1 are presented in a normalized current representation (i/v1/2). Figure 2a displays typical cyclic voltammograms for [Co(bztpen)Br]PF6. At a scan rate of 100 mV·s−1, one reduction peak (Ic) and one oxidation peak (Ia) were observed at Ep(Ic) = −1.857 V and Ep(Ia) = −1.757 V vs. Fc/Fc+, respectively, with a ΔEp = 0.103 V. After completing the scan, additional redox signals appeared (IIa and IIc) at Ep(IIa) = −0.026 V and Ep(IIc) = −0.107 V vs. Fc/Fc+, with ΔEp = 0.081 V. In both processes, ΔEp > 0.060 V indicates a quasi-reversible electron transfer. Additionally, increasing the scan rate causes a shift in the peak potential toward more negative and more positive values, resulting in a large ΔEp at higher scan rates consistent with electrochemical quasi-reversibility. According to the literature, the following mechanism is proposed [23,31,32]:
  [ C o I I b z t p e n B r ] + +   1 e   C o I b z t p e n B r                                                                                     I  
    [ C o I I b z t p e n B r ] + C o I I I b z t p e n B r +   1 e                                                                                 I I  

2.2.2. Cyclic Voltammetry of [CoII (tpa)Cl]Cl

For the complex [CoII(tpa)Cl]Cl (Figure 2b), the cyclic voltammogram in normalized current representation at a scan rate of 100 mV·s−1 exhibits three reduction peaks (Ic, IIc, and IIIc) at Epc(Ic) = −1.808 V, Epc(IIc) = −2.028 V, and Epc(IIIc) = −2.303 V vs. Fc/Fc+, along with three corresponding oxidation peaks (Ia, IIa, and IIIa) at Epa(Ia) = −1.702 V, Epa(IIa) = −1.932 V, and Epa(IIIa) = −2.213 V vs. Fc/Fc+. Additionally, two extra signals (I*c and I*a) are observed at Epc(Ic) = −1.12 V and Epa(Ia) = −0.718 V vs. Fc/Fc+.
The normalized current for the oxidation signals suggests the involvement of coupled chemical reactions, consistent with an electrochemical–chemical–electrochemical mechanism (ECE). The additional signals I*c and I*a are attributed to surface-adsorbed species on the electrode. Based on the literature, the following mechanism is proposed [23,31,32]:
    [ C o I I t p a C l ] + +   1 e   C o I t p a C l                                                               E         I    
C o I t p a C l     [ C o I t p a ] +       +   C l                                                                                   C  
    [ C o I t p a ] + + 1 e C o 0 t p a                                                                                       E           I I
      C o 0 t p a +   1 e   C o   0 ( t p a )                                                                           E       I I I  

2.2.3. Cyclic Voltammetry of [CoII(bpy)3](BF4)2

For the complex [CoII(bpy)3](BF4)2, its electrochemical response (Figure 2c) at a scan rate of 100 mV·s−1 displays three reduction peaks at Epc(Ic) = −1.38 V, Epc(IIc) = −1.995 V, and Epc(IIIc) = −0.098 V vs. Fc/Fc+, along with three corresponding oxidation peaks at Epa(Ia) = −1.322 V, Epa(IIa) = −1.928 V, and Epa(IIIa) = −0.01 V vs. Fc/Fc+. Process I is attributed to a reversible electron transfer, as indicated by ΔEp = 0.057 V. In contrast, processes II and III exhibit ΔEp > 0.060 V, suggesting quasi-reversible behavior. Based on the literature, the following mechanism is proposed [23,31,32]:
C o I I b p y 3 2 +     C o I I I b p y 3   3 + +   1 e                                                 I I I  
C o I I b p y 3 2 + +   1 e C o I b p y 3   +                                                                     I      
                C o I b p y 3 +   +   2 e C o I b p y b p y 2                                             I I                      
  C o I b p y b p y 2   C o I b p y 2   + b p y                                      

2.3. Cyclic Voltammetry Response of Complexes in the Presence of CO2

2.3.1. Cyclic Voltammetry of [CoII(bztpen)Br]PF6 in the presence of CO2

After that, the electrochemical behavior of the cobalt complexes was presented, and their ability for electrochemical molecular catalysis for CO2 reduction was evaluated. The voltammogram of [Co(bztpen)Br]PF6 in the presence of CO2 is shown in Figure 3a. At more negative potentials, where the reduction [CoII(bztpen)Br]+ +1e → [CoI(bztpen)Br] takes place, its Epc value shifts to a more positive value (−1.814 V vs. Fc/Fc+), accompanied by a significant increase in current. Additionally, the corresponding oxidation peak (Ia) was not observed. This behavior can be associated with typical molecular catalysis of CO2. A new reduction signal, I*c, which is associated with an adsorbed species, was observed. When the scan was inverted, a new oxidation signal, I a * , also associated with adsorbed species, was detected. The anhydrous conditions allow us to discard catalytic activity for electrochemical proton reduction [33].

2.3.2. Cyclic Voltammetry of [CoII (tpa)Cl]Cl in the presence of CO2

For the [Co(tpa)Cl]Cl complex (Figure 3b), CO2 molecular catalysis begins at a slightly more negative potential than the corresponding electron transfer [CoII(tpa)Cl]+ +1e → [CoI(tpa)Cl], recorded at Epc(Ic′) = −1.865 V vs. Fc-Fc+. At more negative potentials, the voltammogram displays two additional reduction signals, Epc(IIc′) = −2.202 and Epc(IIIc′) = −2.235 V vs. Fc-Fc+, indicating high molecular catalysis activity by highly reduced species, as reported in the literature [26,27,34]. No oxidation peaks are observed in the reverse scan.

2.3.3. Cyclic Voltammetry of [CoII (bpy)3(BF4)2] in the presence of CO2

For [Co(bpy)3(BF4)2] (Figure 3c), a catalytic current for CO2 reduction is observed at −1.994 V vs. Fc/Fc+, corresponding to the reduction process [CoI(bpy)3]+ + 2e → [CoI(bpy)(bpy)2]. This behavior is consistent with previous reports [23,35].
A summary of the redox potentials of complexes and the onset potential related to CO2 reduction is shown in Table 1, where the complex [Co(tpa)Cl]Cl presented the lowest value of overpotential for the CO2 reduction in the first electron transfer. The highest overpotential value corresponds to the complex [Co(bpy)3](BF4)2.

2.3.4. FOWA

Cyclic voltammetry experiments at variable scan rates were performed to evaluate the catalytic constant for electrochemical CO2 reduction (Figure 4). For the [CoII(bztpen)Br]PF6 complex (Figure 4a), the voltammograms show that when the scan rate was increased, the Epc(Ic″) shifted to negative values, with a decrease in the catalytic current. This behavior indicated that the molecular catalysis is decoupled at high scan rates. In the case of [CoII(tpa)Cl]Cl (Figure 4b), an initial increase in the catalytic current is observed at 100 mV·s−1. However, beyond 250 mV·s−1, the redox processes involved in CO2 molecular catalysis begin to decouple, resulting in a diminished catalytic current. For [CoII(bpy)3(BF4)2] (Figure 4c), increasing the scan rate causes a minor cathodic shift in the catalytic peak, but the current intensity remains relatively constant, suggesting a more stable catalytic behavior.
From the voltammograms recorded at variable scan rates, foot of the wave analysis (FOWA) [36,37] was carried out for the reduction processes Ic in the complex [CoII(bztpen)Br]PF6, for the process IIc in the complex [CoII(bpy)3(BF4)2, and for the process Ic in the complex [CoII(tpa)Cl]Cl (see Figure 5a,c,e). The catalytic rate constant (k) was calculated using Equation (1) from the slope of the plot i k i p ° v s 1 1 + exp F R T E E ° M L r e d M L o x , where ik is the catalytic current and ip° is the diffusion-controlled peak current in the absence of substrate:
i k i p ° = 2.24 R T F ν 2 k C C O 2 0 1 + e x p [ F R T E E ° M L r e d M L o x ]              
The shape of the FOWA curves for the [CoII(bztpen)Br]PF6 complex (Figure 5a) indicates that the catalytic reaction at high potential values presents the deactivation of the catalyst due to parallel reactions. For an ideal catalytic system, a linear response is expected. In contrast, the FOWA curves for [CoII(bpy)3(BF4)2] (Figure 5c) exhibit a response closer to the ideal even at lower scan rates, indicating a more efficient catalytic process under these conditions compared to [CoII(bztpen)Br]PF6. From the slope of the low-potential region of the FOWA, the catalytic rate constant k was calculated. The resulting values were 8.93 × 101 M−1·s−1 for [CoII(bztpen)Br]PF6 (Figure 5b) and 1.22 × 10² M−1·s−1 for [CoII(bpy)3(BF4)2] (Figure 5d). For [CoII(tpa)Cl]Cl (Figure 5e), a catalytic rate constant k value was 1.47 × 101 M1·s−1 in the process Ic (Figure 5f), considering the lowest efficient catalytic process.

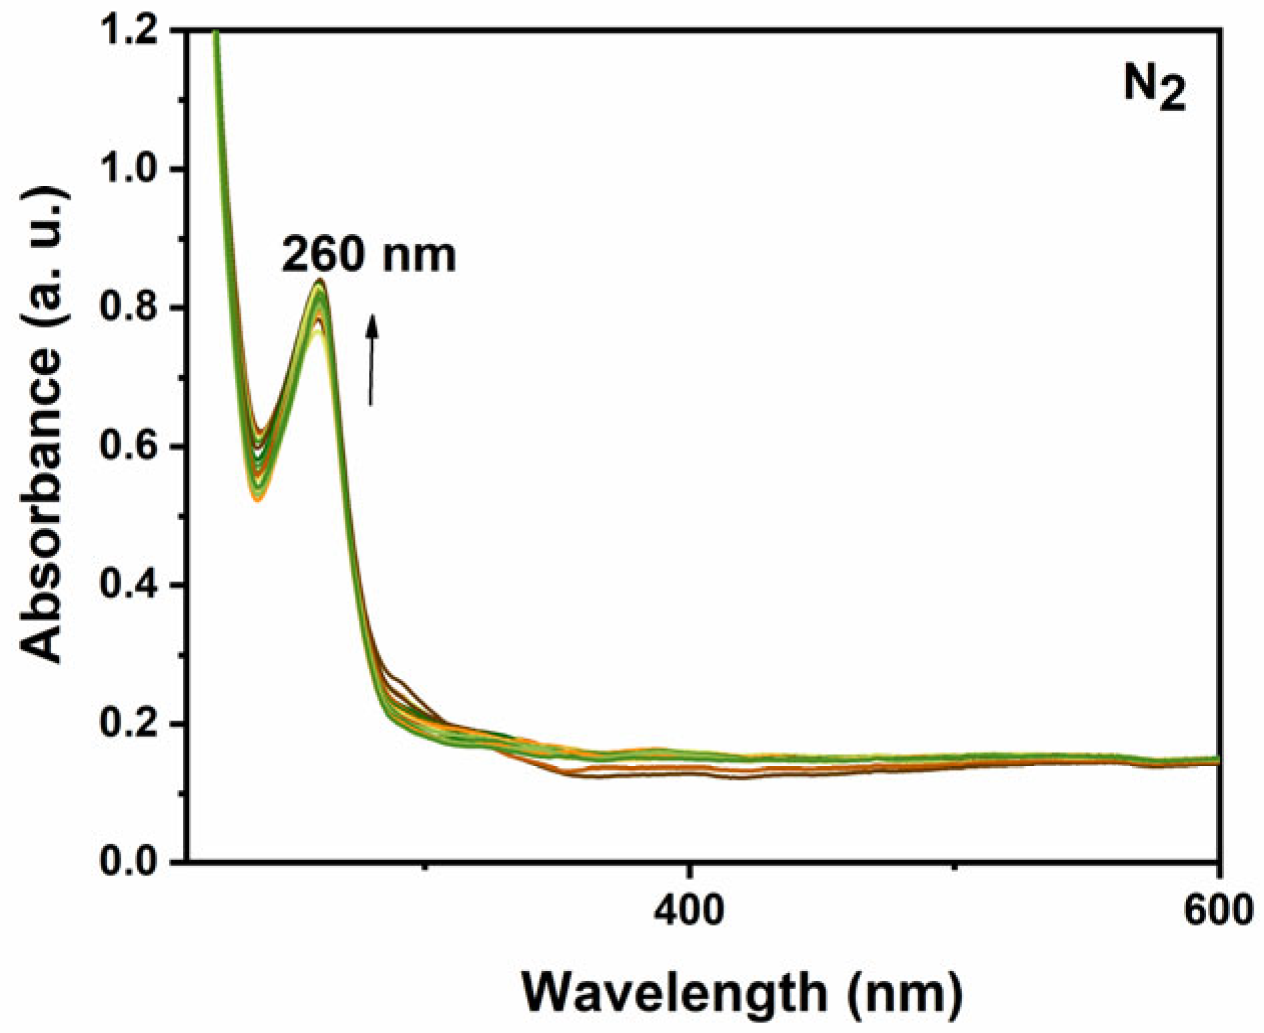
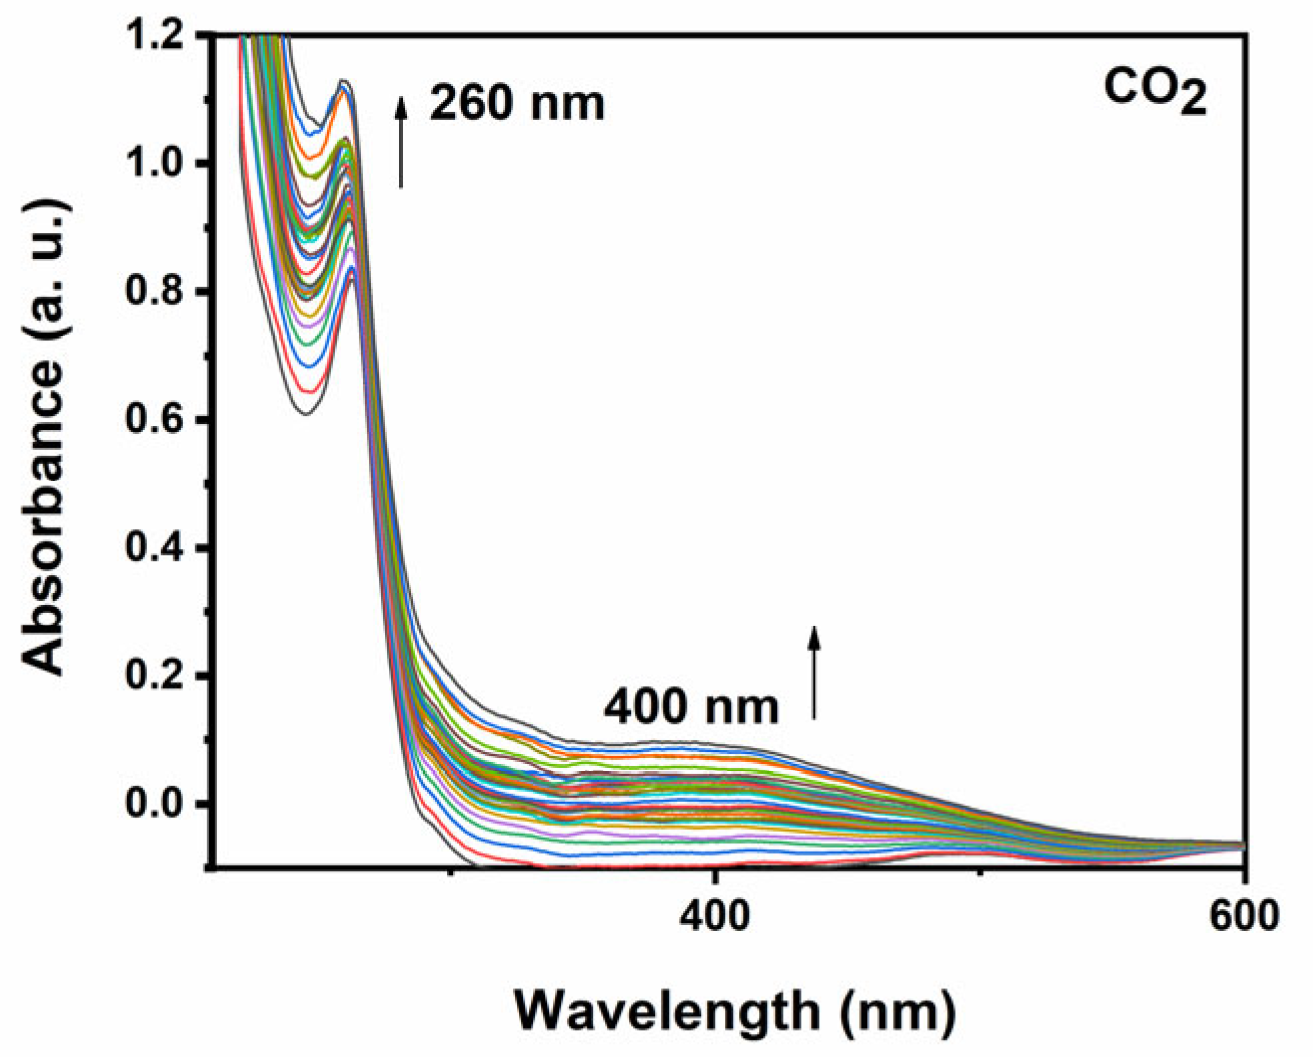
2.4. UV-Vis Spectroelectrochemical Response of the Complexes in the Presence and in the Absence of CO2

2.4.1. UV-Vis Spectroelectrochemical Response of [CoII(Bztpen)Br]PF6

First, Uv-Vis spectroelectrochemical experiments were performed using a 1 mM solution of [CoII(bztpen)Br]PF6 in MeCN with 0.1 M TBAPF6 in the presence of N2. A gold mesh was used as the working electrode, and chronoamperometry measurements were performed by applying a constant potential of −1.95 V vs. Fc/Fc+. Simultaneously, UV-Vis spectra were recorded every 3 s during electrolysis at the electrode surface for a total duration of 3 min (Figure 6). The absorbance bands at 260, associated with the ligand [38], remained unchanged throughout the experiment, indicating that the electron transfer is located on the metal center (Figure S2).
In contrast, under a CO2 atmosphere, a slight hypsochromic shift of the ligand band was observed, and a new absorption band is recorded at 400 nm (Figure 7 and Figure S3). These spectral changes are consistent with the formation of a new coordination species. The appearance of the band at 400 nm is attributed to Co(I)L species, in agreement with previous reports [31]. This observation supports the formation of a [CoI(Bztpen)CO] complex, yielded during the molecular catalysis of CO2. Taking these results into consideration, the following mechanism is proposed:
C o I I b z t p e n B r + +   1 e   C o I b z t p e n B r  
C o I b z t p e n B r +   C O 2   C o I b z t p e n C O 2 + + B r  
C o I b z t p e n C O 2 + +   C O 2 + 2 e C o I b z t p e n C O + + C O 3 2  

2.4.2. UV-Vis Spectroelectrochemical Response of [CoII(tpa)Cl]Cl

Uv-Vis spectroelectrochemical experiments for [CoII(tpa)Cl]Cl in MeCN containing 0.1 M TBAPF6 were carried out at the potentials corresponding to signals IIc (–2.06 V vs. Fc/Fc+) and IIIc (–2.24 V vs. Fc/Fc+), both in the presence and absence of CO2. Under N2 atmosphere, the spectral response closely resembled that of the [CoII(bztpen)Br]PF6 complex (Figure 8, Figure 9, Figures S6 and S10), with no significant changes in the absorbance values of the ligand-associated electronic transition, irrespective of the applied potential.
In contrast, under a CO2 atmosphere (Figure 10, Figure 11, Figures S7 and S11), the ligand signal exhibited a slight hypsochromic shift, and a new absorption band was detected at 400 nm, like the behavior observed for the [CoII(bztpen)Br]PF6 complex. The intensity of this band increased similarly at both applied potentials, indicating that the first reduced species plays a key role in controlling the molecular catalysis process of CO2. Based on these findings, the following mechanism is proposed:
[ C o I t p a ] + + C O 2     C o I t p a C O 2 +
C o I t p a C O 2 + +   C O 2 + 2 e C o I t p a C O + + C O 3 2

2.4.3. UV-Vis Spectroelectrochemical Response of [CoII(bpy)3](BF4)2

Furthermore, the electrochemical behavior of the complex [CoII(bpy)3](BF4)2 was studied. Upon applying a potential of −1.55 V and −2.25 V vs. Fc/Fc+, a slight shift in the absorption band associated with the bipyridine ligand reduction was observed, moving from 290 to 300 [38]. Additionally, a new absorption band appeared at 380 nm, which is attributed to a metal-to-ligand charge (MLCT), and 600 nm, which is attributed to a d-d transition [39]. Similar spectral changes were observed at both potentials in the presence of CO2 (see Figures S14–S23), suggesting that no CO-coordinated species are yielded during molecular catalysis. Based on these results, the following reaction is proposed for the CO2 reduction:
C o I b p y b p y 2   +   1 e +   2 C O 2 C o I ( b p y ) 2 b p y + C O + C O 3 2

2.4.4. Kinetics of the Formation of Intermediate Species

The spectroelectrochemical data indicate that the formation of new species and the degradation of the starting complex during electrolysis follow an exponential trend (Figures S4, S5, S8, S9, S12, S13, S19, S24 and S25) consistent with first-order kinetics [40]. Based on this observation, the data were fitted to a first-order kineti equation, and the kinetic rate constant (k) was extracted and summarized in Table 2. The values obtained are in close agreement, indicating that the reactions proceed via a consistent mechanistic pathway. Furthermore, the values obtained at 400 nm are indicative of the catalytic reaction of CO2 yielding by the species [CoI(bztpen)(CO)] and [CoI(tpa)(CO)] +.
These results agree with the behavior of FOWA curves, where the deactivation of the catalyst for the complex [CoII(bztpen)Br]PF6 was proposed, which can be attributed to the formation of the chemical species [Co0(bztpen)(CO)]. The opposite is observed in FOWA curves for [CoII(bpy)3(BF4)2], where no deactivation was proposed due to coordination of CO.

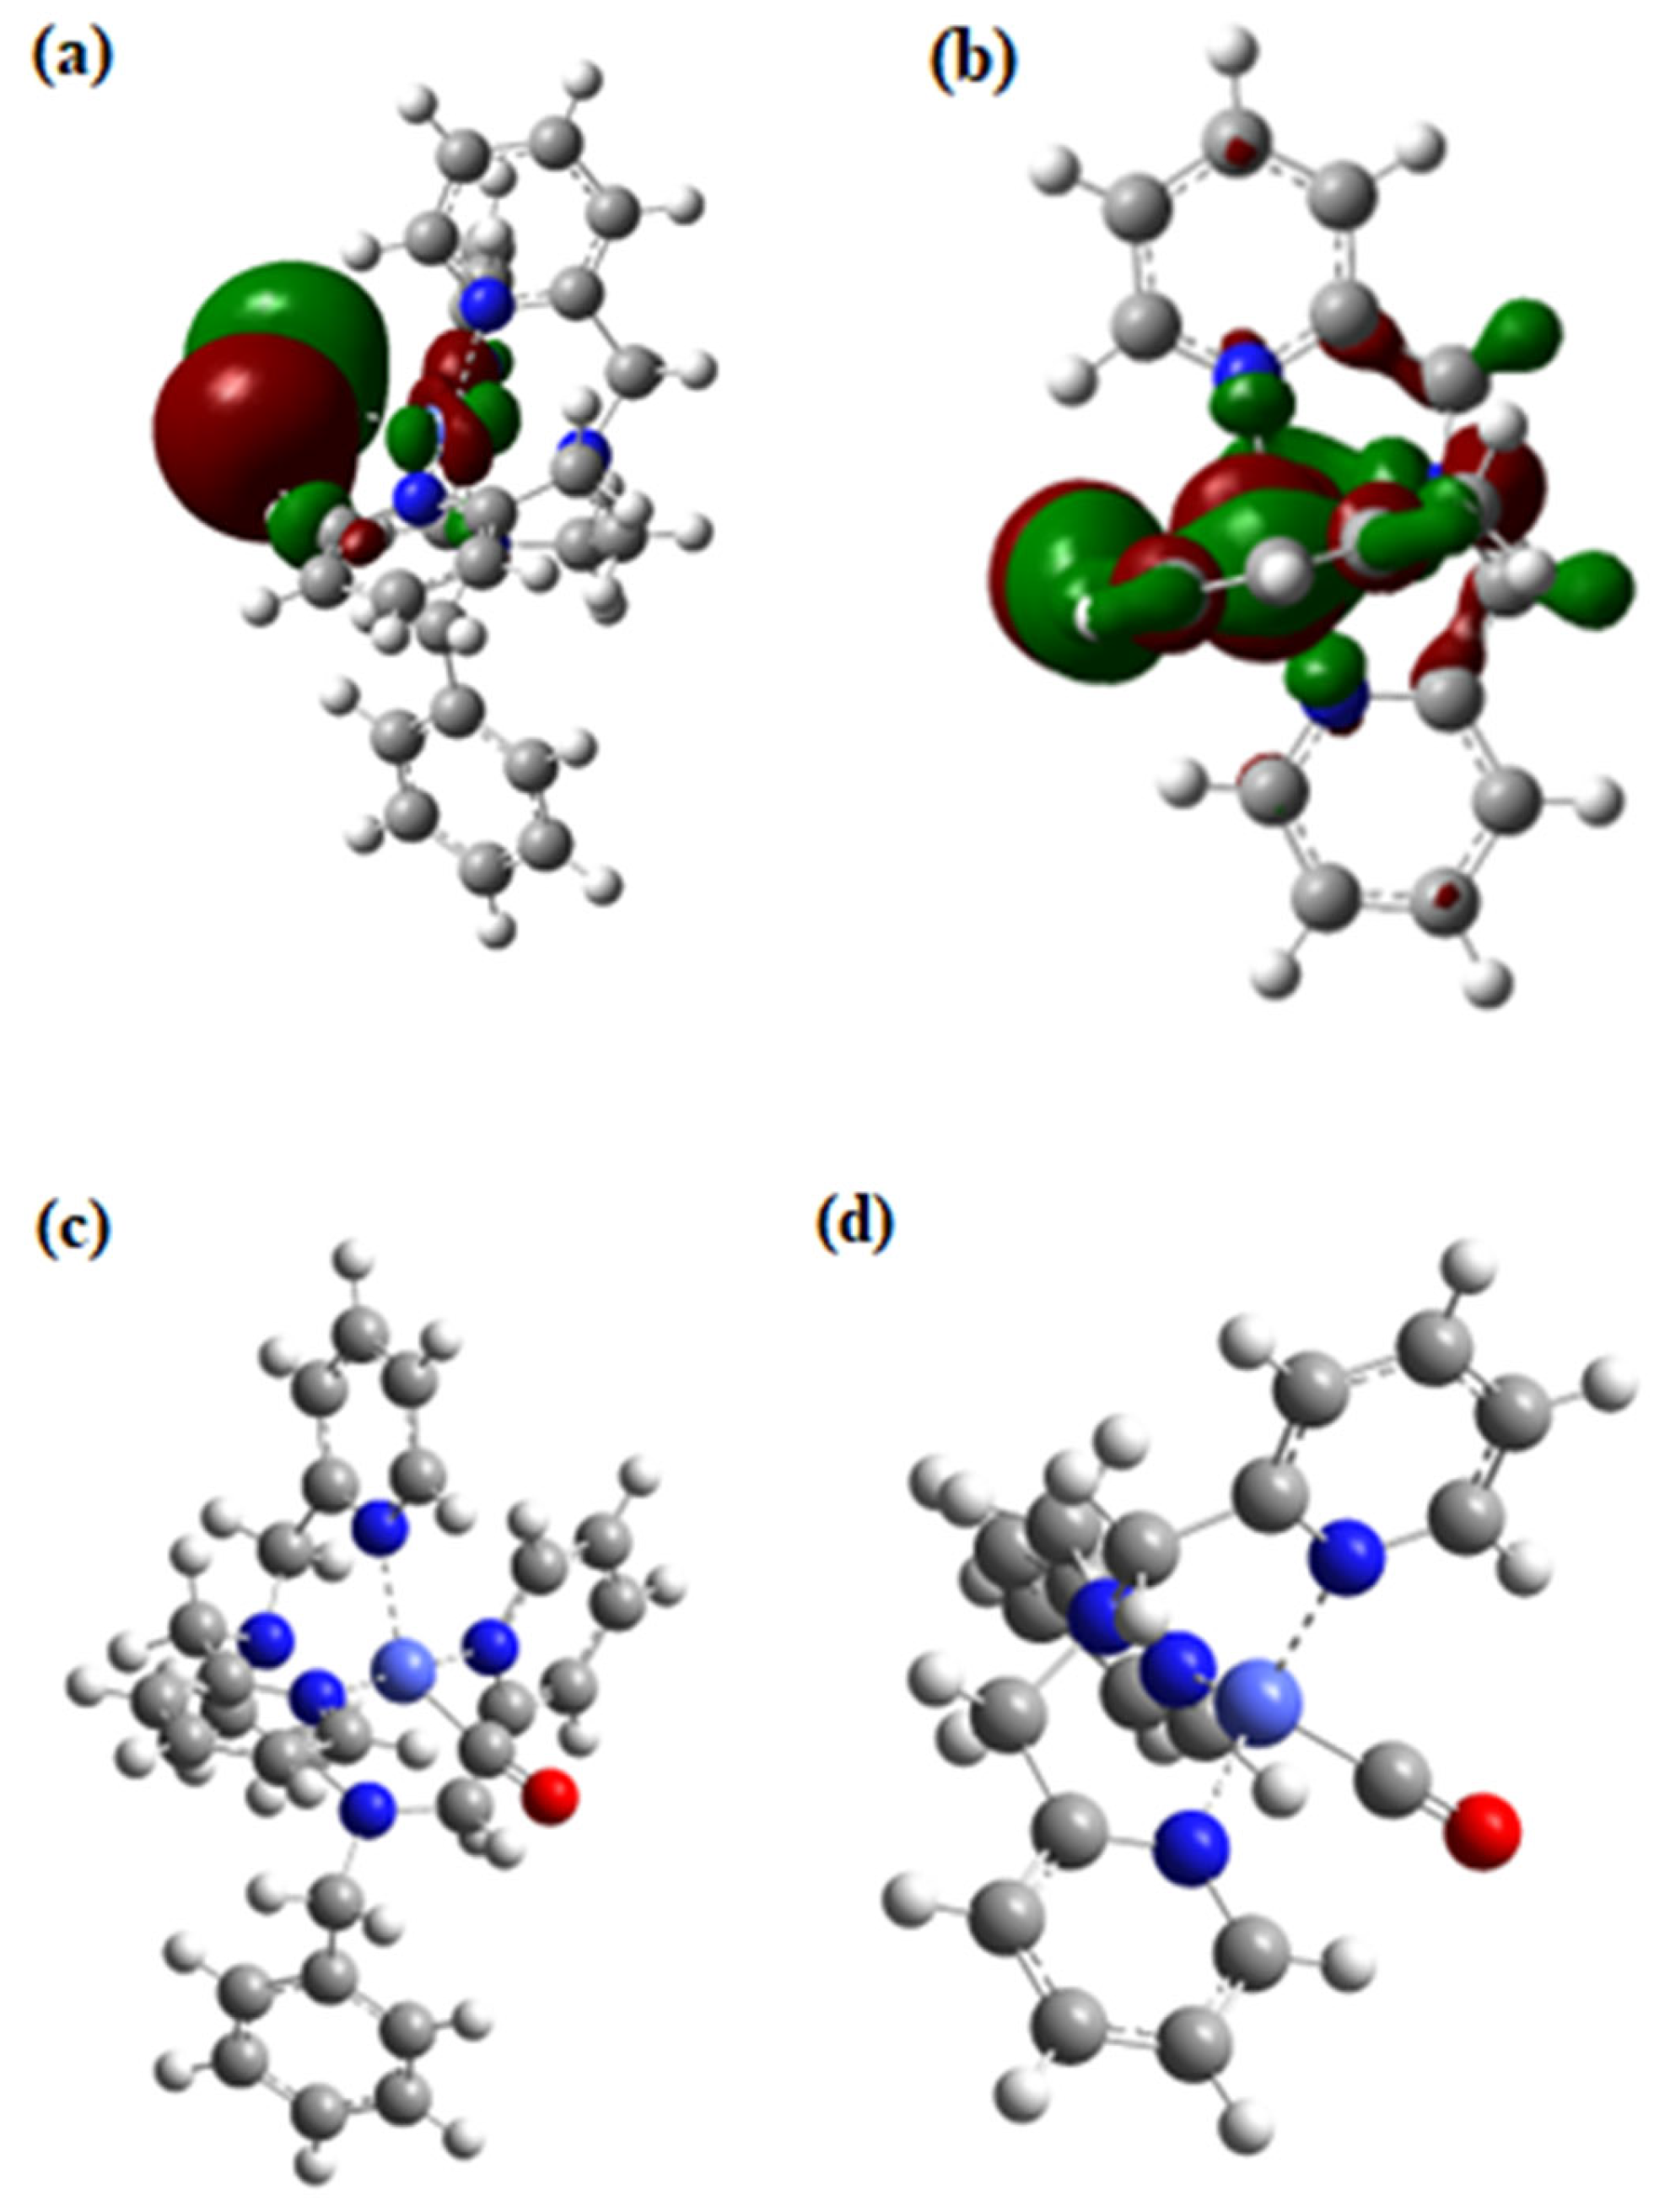
2.5. DFT Calculations

DFT calculations were performed for the cationic complexes [Co(bztpen)Br]+, [Co(tpa)Cl]+, and the intermediate species [CoI(bztpen)(CO)]+ and [CoI(tpa)(CO)]+ to support the electrochemical findings (Figure 12a–d). The LUMO analysis shows that the electronic density is primarily localized on the cobalt center and the polypyridine ligands. This suggests that the first reduction process predominantly occurs at the metallic center.
By means of DFT-DT, the UV-Vis spectra were calculated for intermediate species electrogenerated during electrolysis in the presence of CO2. The optimized chemicals [CoI(bztpen)(CO)]+ and [CoI(tpa)(CO)]+ (see Figure 12c,d) presented an electronic transition close to 400 nm, which is very similar to the signal recorded at spectroelectrochemical experiments in the presence of CO2. The presence of Co(0) species must be neglected because electronic transitions are predicted to be around 600 nm (Figures S26 and S27). Finally, Mulliken charges of the [CoII(bztpen)Br], [CoI(bztpen)(CO)] +, [CoII(tpa)Cl], and [CoI(tpa)(CO)]+ were estimated (Tables S1–S4) to identify the electronic charge distribution of the atoms within each molecule.

3. Materials and Methods

3.1. Reagents

All chemical reagents were of analytical grade and used as received from Aldrich Chemical Co. (St. Louis, MO, USA) and J.T. Baker (Radnor, PA, USA) without any further purification.

3.2. FTIR-IR and UV-Vis Measurements

IR characterization was conducted with an FTIR-IR Affinity-1S Shimadzu spectrophotometer (Shimadzu Corporation, Kyoto, Japan). Electronic spectra were recorded on a Thermo Scientific Evolution Array spectrophotometer (Waltham, MA, USA) within a spectral range of 200–1100 nm.

3.3. Synthesis of Complexes

3.3.1. [Co(bztpen)Br]PF6

A solution of Bztpen (1.005 g, 2.37 mmol in 10 mL of methanol) was added dropwise to a 10 mL methanolic solution of cobalt (II) bromide hydrate, CoBr2·nH2O (0.516 g, 2.37 mmol). The mixture was heated and stirred for 3 h. Subsequently, ammonium hexafluorophosphate (0.0815 g, 0.5 mmol) was added to the reaction mixture. A purple precipitate formed, which was filtered and washed with pure ethanol.

3.3.2. [Co(tpa)Cl]Cl

[Co(tpa)Cl]Cl was synthesized by dissolving 0.01 mmol CoCl2·6H2O in acetonitrile within a Schlenk system. After saturating the solution with N2, 0.01 mmol TPA was added, and the reaction mixture was stirred at room temperature for 1 h. The resulting products were washed with ethyl ether to remove any remaining ligand, then filtered and dried under vacuum.

3.3.3. [Co(bpy)3](BF4)2

A 5 mL 0.06 M methanolic solution of 2,2-bpyridine was added dropwise to a 5 mL 0.02 M methanolic solution of [Co(H2O)6](BF4)2. The reaction mixture was stirred at room temperature for 1 h. Afterward, the solvent was removed by slow evaporation. The obtained product was washed with ethyl ether to remove any remaining ligand, filtered, and dried under vacuum.

3.4. Electrochemical Studies in the Absence and in the Presence of CO2

The electrochemical experiments were conducted using a Biologic SP-300 potentiostat–galvanostat (Seyssinet-Pariset, France). The compounds were dissolved at a concentration of 1 mM in MeCN, with a supporting electrolyte of 0.1 M Tetrabutylammonium hexafluorophosphate (TBAPF6). A typical three-electrode setup was employed, with a glassy carbon electrode as the working electrode, a platinum wire as the counter electrode, and a silver wire as the pseudo-reference electrode. All potentials were referenced to the Fc/Fc+ redox couple, in accordance with IUPAC standards [41]. Cyclic voltammetry was performed at scan rates of 50, 100, 250, 500, 750, 1000, and 1500 mV s−1. Prior to use, the working electrode was polished with 0.5 µm α-alumina on a Buehler 740 cloth, rinsed with distilled water, and sonicated for approximately 130 s. The solutions were bubbled with N2 or CO2 before each experiment. Ohmic drop compensation was performed using positive feedback using Ru values measured by electrochemical impedance spectroscopy.

3.5. UV-Vis Spectroelectrochemical Studies in the Absence and in the Presence of CO2

For the procedure, 1 mL of different complex solutions (1 mM [Co(tpa)Cl]Cl, 1 mM [CoII(bztpen)Br]PF6, and 0.2 mM [Co(bpy)3](BF4)2) in MeCN containing 0.1 M TBAPF6, previously bubbled with N2, was added into a spectroelectrochemical quartz cell with an optical path length of 0.7 mm. Then an optically transparent Au mesh, used as a working electrode, was placed in the quartz cell. A non-aqueous Ag/Ag+ reference electrode (0.1 M AgNO3 in MeCN) and a Pt wire as the auxiliary electrode were employed. All potential values were referenced to the Fc/Fc+ redox couple, in accordance with IUPAC standards [41]. A Thermo Scientific Evolution Array spectrophotometer, which allows us to simultaneously measure absorbance values at a wavelength range from 190 to 1000 nm, coupled to a Bio-Logic SP-50 potentiostat–galvanostat (Seyssinet-Pariset, France), was used. UV-Vis spectra were recorded every 3 s for 3 min during the imposition of different potentials. The procedure was then repeated with the solution under a CO2 atmosphere. The calibration of the spectrophotometer was carried out by the equipment supplier using a standard holmium oxide.

3.6. DFT Theoretical Studies

Density functional theory (DFT) calculations [42,43,44] were performed using Gaussian 16 [45]. Full geometry optimizations without symmetry constraints, frequency calculations, and UV-Vis spectra simulations were conducted using the CAM-B3LYP [46] density functional and the LanL2DZ [47,48]. The optimized geometries of local minima were confirmed by the absence of imaginary frequencies. The solvation model used was SMD with acetonitrile as solvent.

4. Conclusions

Electrochemical and spectroelectrochemical studies enabled the elucidation of the reaction mechanisms involved in the molecular catalysis of CO2 complexes [CoII(bztpen)Br]PF6, [CoII(TPA)Cl]Cl, and [CoII(bpy)3](BF4)2. The results suggest the formation of the chemical species [CoI(bztpen)(CO)] and [CoI(tpa)(CO)] during electrolysis in the presence of CO2, and this was confirmed by DFT calculations. On the other hand, the [CoII(bpy)3](BF4)2 complex does not appear to form such intermediates. The trigonal bipyramidal [CoII(tpa)Cl]Cl complex exhibits the lowest catalytic rate constant for CO2 reduction. In contrast, the octahedral complexes [CoII(bztpen)Br]PF6 and [Co(bpy)3](BF4)2 exhibit higher catalytic efficiency, highlighting the influence of octahedral geometry on the catalytic behavior. Although their mechanisms differ, the CO2 reduction mediated by [CoII(bpy)3](BF4)2 proceeds via an outer-sphere mechanism, whereas [CoII(bztpen)Br]PF6 operates through an inner-sphere mechanism. Key information is shown in Scheme 1.

Supplementary Materials

The following supporting information can be downloaded at: https://www.mdpi.com/article/10.3390/catal15070641/s1, Figure S1. IR-spectra of [CoII(bztpen)Br]PF6, [CoII(tpa)Cl]Cl, and [CoII(bpy)3](BF4)2. Figure S2. Comparative Uv-Vis spectra showing the first and last recorded spectra from the UV-Vis spectroelectrochemical response of 1 mM [Co(Bztpen)Br]PF6 in MeCN containing 0.1 M TBAPF6 under N2 atmosphere. Figure S3. Comparative Uv-Vis spectra showing the first and last recorded spectra from the UV-Vis spectroelectrochemical of 1 mM [Co(Bztpen)Br]PF6 in MeCN containing 0.1 M TBAPF6 under CO2 atmosphere. Figure S4. Comparative plot of time vs. Δabsorbance at 260 nm for the UV-Vis spectroelectrochemical response of 1 mM [Co(Bztpen)Br]PF6 in MeCN containing 0.1 M TBAPF6 under CO2 and N2 atmospheres. Figure S5. Comparative plot of time vs. Δabsorbance at 400 nm for the UV-Vis spectroelectrochemical response of 1 mM [Co(Bztpen)Br]PF6 in MeCN containing 0.1 M TBAPF6 under CO2 and N2 atmospheres. Figure S6. Comparative Uv-Vis spectra showing the first and last recorded spectra from the UV-Vis spectroelectrochemical of 1 mM [Co(tpa)Cl]Cl in MeCN containing 0.1 M TBAPF6 under N2 atmosphere. Figure S7. Comparative Uv-Vis spectra showing the first and last recorded spectra from the UV-Vis spectroelectrochemical of 1 mM [Co(tpa)Cl]Cl in MeCN containing 0.1 M TBAPF6 under CO2 atmosphere. Figure S8. Comparative plot of time vs. Δabsorbance at 260 nm for the UV-Vis spectroelectrochemical response of 1 mM [Co(tpa)Cl]Cl in MeCN containing 0.1 M TBAPF6 under CO2 and N2 atmospheres. Figure S9. Comparative plot of time vs. Δabsorbance at 400 nm for the UV-Vis spectroelectrochemical response of 1 mM [Co(tpa)Cl]Cl in MeCN containing 0.1 M TBAPF6 under CO2 and N2 atmospheres. Figure S10. Comparative Uv-Vis spectra showing the first and last recorded spectra from the UV-Vis spectroelectrochemical of 1 mM [Co(tpa)Cl]Cl in MeCN containing 0.1 M TBAPF6 under N2 atmosphere. Figure S11. Comparative Uv-Vis spectra showing the first and last recorded spectra from the UV-Vis spectroelectrochemical of 1 mM [Co(tpa)Cl]Cl in MeCN containing 0.1 M TBAPF6 under CO2 atmosphere. Figure S12. Comparative plot of time vs. Δabsorbance at 260 nm for the UV-Vis spectroelectrochemical response of 1 mM [Co(tpa)Cl]Cl in MeCN containing 0.1 M TBAPF6 under CO2 and N2 atmospheres. Figure S13. Comparative plot of time vs. Δabsorbance at 400 nm for the UV-Vis spectroelectrochemical response of 1 mM [Co(tpa)Cl]Cl in MeCN containing 0.1 M TBAPF6 under CO2 and N2 atmospheres. Figure S14. UV-Vis spectroelectrochemical response of 0.2 mM CoII(bpy)3](BF4)2 in MeCN containing 0.1 M TBAPF6, under N2 atmosphere. Figure S15. Comparative Uv-Vis spectra showing the first and last recorded spectra from the UV-Vis spectroelectrochemical of 0.2 mM CoII(bpy)3](BF4)2 in MeCN containing 0.1 M TBAPF6, under N2 atmosphere. Figure S16. UV-Vis spectroelectrochemical response of 0.2 mM CoII(bpy)3](BF4)2 in MeCN containing 0.1 M TBAPF6, under CO2 atmosphere. Figure S17. Comparative Uv-Vis spectra showing the first and last recorded spectra from the UV-Vis spectroelectrochemical of 0.2 mM CoII(bpy)3](BF4)2 in MeCN containing 0.1 M TBAPF6, under CO2 atmosphere. Figure S18. Comparative plot of time vs. Δabsorbance at 245 nm for the spectroelectrochemical response of 0.2 mM CoII(bpy)3](BF4)2 in MeCN containing 0.1 M TBAPF6 under CO2 and N2 atmospheres. Figure S19. Comparative plot of time vs. Δabsorbance at 380 nm for the UV-Vis spectroelectrochemical response of 0.2 mM CoII(bpy)3](BF4)2 in MeCN containing 0.1 M TBAPF6 under CO2 and N2 atmospheres. Figure S20. UV-Vis spectroelectrochemical response of 0.2 mM CoII(bpy)3](BF4)2 in MeCN containing 0.1 M TBAPF6, under N2 atmosphere. Figure S21. Comparative Uv-Vis spectra showing the first and last recorded spectra from the UV-Vis spectroelectrochemical of 0.2 mM CoII(bpy)3](BF4)2 in MeCN containing 0.1 M TBAPF6, under N2 atmosphere. Figure S22. UV-Vis spectroelectrochemical response of 0.2 mM CoII(bpy)3](BF4)2 in MeCN containing 0.1 M TBAPF6, under CO2 atmosphere. Figure S23. Comparative Uv-Vis spectra showing the first and last recorded spectra from the UV-Vis spectroelectrochemical of 0.2 mM CoII(bpy)3](BF4)2 in MeCN containing 0.1 M TBAPF6, under CO2 atmosphere. Figure S24. Comparative plot of time vs. Δabsorbance at 245 nm for the spectroelectrochemical response of 0.2 mM CoII(bpy)3](BF4)2 in MeCN containing 0.1 M TBAPF6 under CO2 and N2 atmospheres. Figure S25. Comparative plot of time vs. Δabsorbance at 380 nm for the UV-Vis spectroelectrochemical response of 0.2 mM CoII(bpy)3](BF4)2 in MeCN containing 0.1 M TBAPF6 under CO2 and N2 atmospheres. Figure S26. Calculated DFT UV-Vis absorption spectra of the intermediates species [Co0(bztpen)CO] and [CoI(bztpen)CO], obtained using the CAM-B3LYP/LanL2DZ level of theory. Figure S27. (A) Calculated DFT and experimental UV-Vis absorption spectra of the intermediate species [CoI(bztpen)CO] obtained using the CAM-B3LYP/LanL2DZ level of theory and (B) last recorded spectra from the UV-Vis spectroelectrochemical of 1 mM [CoII(bztpen)Br]PF6 in MeCN containing 0.1 M TBAPF6 under CO2 atmosphere. Figure S28. Calculated DFT UV-Vis absorption spectra of the intermediates species [Co0(tpa)CO] and [CoI(tpa)CO], obtained using the CAM-B3LYP/LanL2DZ level of theory. Figure S29. (A) Calculated DFT and experimental UV-Vis absorption spectra of the intermediate species [CoI(tpa)CO], obtained using the CAM-B3LYP/LanL2DZ level of theory and (b) last recorded spectra from the UV-Vis spectroelectrochemical of 1 mM [CoII(tpa)Cl]Cl in MeCN containing 0.1 M TBAPF6 under CO2 atmosphere. Table S1. Atomic coordinates and atomic Mulliken charge for [CoII(bztpen)Br] complex. Table S2. Atomic coordinates and atomic Mulliken charge for [CoI(bztpen)CO] complex. Table S3. Atomic coordinates and atomic Mulliken charge for [CoII(tpa)Cl] complex. Table S4. Atomic coordinates and atomic Mulliken charge for [CoI(tpa)CO] complex.

Author Contributions

Conceptualization, G.R.-O. and L.O.-F.; methodology, G.R.-O. and A.B.-V.; software, J.P.F.R.-C. and L.G.R.-P.; validation, M.C.-R. and J.P.F.R.-C.; formal analysis, A.M.; investigation, L.O.-F. and M.C.-R.; resources, L.O.-F.; data curation, G.R.-O. and A.B.-V.; writing original draft preparation, J.P.F.R.-C. and O.M.Z.; writing—review and editing, O.M.Z., G.R.-O. and L.O.-F.; visualization, J.P.F.R.-C. and L.G.R.-P.; supervision, L.O.-F.; project administration, L.O.-F.; funding acquisition, L.O.-F. All authors have read and agreed to the published version of the manuscript.

Funding

This research was funded by “Secretaria de Ciencia Humanidades Tecnología e Innovación SECIHTI”, “Ciencia Básica y de Frontera 2023–2024”, Grant number CBF2023-2024-3108, and “Laboratorio Nacional de Supercómputo del Sureste de México” (LNS), Grant number 202502033C.

Data Availability Statement

Data is available in the Supporting Information File.

Acknowledgments

G.R.O. expresses gratitude to SECIHTI (Ministry of Science, Humanities, Technology and Innovation) for grant no. 6364841 provided through the program Estancias Posdoctorales por México 2024. The authors thank Alejandra Medrano Banda for their help in this work.

Conflicts of Interest

The authors declare no conflicts of interest.

References

  1. Core Writing Team; Lee, H.; Romero, J. (Eds.) Summary for Policymakers. In Climate Change 2023: Synthesis Report. Contribution of Working Groups I, II and III to the Sixth Assessment Report of the Intergovernmental Panel on Climate Change; IPCC: Geneva, Switzerland, 2023; pp. 1–34. [Google Scholar] [CrossRef]
  2. Ritchie, H.; Roser, M. CO2 Emissions. Published Online at OurWorldinData.org. [Online Resource]. 2020. Available online: https://ourworldindata.org/co2-emissions (accessed on 26 June 2025).
  3. Hogue, C. CO Levels Climb Ever Higher. Chem. Eng. News 2015, 93, 6. [Google Scholar] [CrossRef]
  4. Albero, J.S.; Albero, A.S.; Casco, M.E.; Reinoso, F.R. Retos actuales para la captura y almacenamiento de CO2. Real Sociedad Española de Química. An. Quim. 2014, 110, 30–34. [Google Scholar]
  5. Bui, A.T.; Hartley, N.A.; Thom, A.J.W.; Forse, A.C. Trade-Off between Redox Potential and the Strength of Electrochemical CO2 Capture in Quinone. J. Phys. Chem. C 2022, 126, 14163–14172. [Google Scholar] [CrossRef] [PubMed]
  6. White, T.A.; Maji, S.; Ott, S. Mechanistic insights into electrocatalytic CO2 reduction within [RuII(tpy)(NN)X]n+ architectures. Dalton Trans. 2014, 43, 15028–15037. [Google Scholar] [CrossRef] [PubMed]
  7. Yadav, P.K.; Kumari, N.; Pachfule, P.; Banerjee, R.; Mishra, L. Metal [Zn(II), Cd(II)], 1,10-Phenanthroline Containing Coordination Polymers Constructed on the Skeleton of Polycarboxylates: Synthesis, Characterization, Microstructural, and CO2 Gas Adsorption Studies. Cryst. Growth Des. 2012, 12, 5311–5319. [Google Scholar] [CrossRef]
  8. Thoi, V.S.; Sun, Y.; Long, J.R.; Chang, C.J. Complexes of earth-abundant metals for catalytic electrochemical hydrogen generation under aqueous conditions. Chem. Soc. Rev. 2013, 42, 2388–2400. [Google Scholar] [CrossRef] [PubMed]
  9. Rountree, E.S.; McCarthy, B.D.; Eisenhart, T.T.; Dempsey, J.L. Dempsey, Evaluation of Homogeneous Electrocatalysts by Cyclic Voltammetry. Inorg. Chem. 2014, 53, 998–10002. [Google Scholar] [CrossRef]
  10. Garba, M.D.; Usman, M.; Khan, S.; Shehzad, F.; Galadima, A.; Ehsan, M.F.; Ghanem, A.S.; Humayun, M. CO2 towards fuels: A review of catalytic conversion of carbon dioxide to hydrocarbons. J. Environ. Chem. Eng. 2021, 9, 104756. [Google Scholar] [CrossRef]
  11. Schrodt, A.; Neubrand, A.; van Eldik, R. Fixation of CO2 by Zinc(II) Chelates in Alcoholic Medium. X-ray Structures of {[Zn(cyclen)]33-CO3)}(ClO4)4 and [Zn(cyclen)EtOH](ClO4)2. Inorg. Chem. 1997, 36, 4579–4584. [Google Scholar] [CrossRef]
  12. Chiericato, G.; Arana, C.; Casado, C.; Cuadrado, I.; Abruña, H. Electrocatalytic reduction of carbon dioxide mediated by transition metal complexes with terdentate ligands derived from diacetylpyridine. Inorg. Chim. Acta 2000, 300, 32–42. [Google Scholar] [CrossRef]
  13. Savéant, J.-M. Molecular Catalysis of Electrochemical Reactions. Mechanistic Aspects. Chem. Rev. 2008, 108, 2348–2378. [Google Scholar] [CrossRef]
  14. Berardi, S.; Drouet, S.; Francàs, L.; Gimbert-Suriñach, C.; Guttentag, M.; Richmond, C.; Stoll, T.; Llobet, A. Molecular artificial photosynthesis. Chem. Soc. Rev. 2014, 43, 7501–7519. [Google Scholar] [CrossRef]
  15. Benson, E.E.; Kubiak, C.P.; Sathrum, A.J.; Smieja, J.M. Electrocatalytic and homogeneous approaches to conversion of CO2 to liquid fuels. Chem. Soc. Rev. 2009, 38, 89–99. [Google Scholar] [CrossRef] [PubMed]
  16. Zhang, W.; Hu, Y.; Ma, L.; Zhu, G.; Wang, Y.; Xue, X.; Chen, R.; Yang, S.; Jin, Z. Progress and perspective of electrocatalytic CO2 reduction for renewable carbonaceous fuels and chemicals. Adv. Sci. 2018, 5, 1700275. [Google Scholar] [CrossRef] [PubMed]
  17. Han, J.; Bai, X.; Xu, X.; Husile, A.; Zhang, S.; Qi, L.; Guan, J. Advances and challenges in the electrochemical reduction of carbon dioxide. Chem. Sci. 2024, 15, 7870–7907. [Google Scholar] [CrossRef]
  18. Bonin, J.; Robert, M.; Routier, M. Selective and Efficient Photocatalytic CO2 Reduction to CO Using Visible Light and an Iron-Based Homogeneous Catalyst. J. Am. Chem. Soc. 2014, 136, 16768–16771. [Google Scholar] [CrossRef]
  19. Simpson, T.C.; Durand, R.R. Ligand participation in the reduction of CO2 catalyzed by complexes of 1,10 o-phenanthroline. Electrochim. Acta. 1998, 33, 581–583. [Google Scholar] [CrossRef]
  20. Juris, A.; Balzani, V.; Barigelletti, F.; Campagna, S.; Belser, P.; von Zelewsky, A. Ru(II) polypyridine complexes: Photophysics, photochemistry, eletrochemistry, and chemiluminescence. Coord. Chem. Rev. 1988, 84, 85–277. [Google Scholar] [CrossRef]
  21. Usman, M.; Humayun, M.; Garba, M.D.; Ullah, L.; Zeb, Z.; Helal, A.; Suliman, M.H.; Alfaifi, B.Y.; Iqbal, N.; Abdinejad, M.; et al. Electrochemical reduction of CO2: A review of cobalt based catalyst for carbon dioxide conversion to fuels. Nanomaterials 2021, 11, 2029. [Google Scholar] [CrossRef]
  22. Intrator, J.A.; Velazquez, D.A.; Fan, S.; Mastrobattista, E.; Yu, C.J.; Marinescu, S.C. A Electrocatalytic CO2 reduction to formate by a cobalt phosphino–thiolate complex. Chem. Sci. 2024, 15, 6385–6396. [Google Scholar] [CrossRef]
  23. Rebolledo-Chávez, J.P.F.; Toral, G.T.; Ramírez-Delgado, V.; Reyes-Vidal, Y.; Jiménez-González, M.L.; Cruz-Ramírez, M.; Mendoza, A.; Ortiz-Frade, L. The Role of Redox Potential and Molecular Structure of Co(II)-Polypyridine Complexes on the Molecular Catalysis of CO2 Reduction. Catalysts 2021, 11, 948. [Google Scholar] [CrossRef]
  24. Reimann, C.W. Electron absorption spectrum of cobalt (II)-doped trisphenanthrolinezinc nitrate dihydrate. J. Res. Nat. Stand. A Phys. Chem. 1966, 70, 417–419. [Google Scholar] [CrossRef]
  25. Louise, I.S.Y.; Nabila, S.; Sugiyarto, K.H. Complex of Tris (Phenan- throline) Cobalt (II) Trifluoroacetate: Characterization and Powder XRD Analysis. Orient. J. Chem. 2019, 35, 1500–1507. [Google Scholar] [CrossRef]
  26. Chan, S.L.-F.; Lam, T.L.; Yang, C.; Lai, J.; Cao, B.; Zhou, Z.; Zhu, Q. Cobalt(II) tris(2-pyridylmethyl)amine complexes [Co(TPA)X] + bearing co- ordinating anion (X = Cl, Br, I and NCS): Synthesis and application for carbon dioxide reduction. Polyhedron 2017, 125, 156–163. [Google Scholar] [CrossRef]
  27. Massoud, S.S.; Broussard, K.T.; Mautner, F.A.; Vicente, R.; Saha, M.K.; Bernal, I. Five-coordinate cobalt (II) complexes of tris(2-pyridylmethyl) amine (TPA): Synthesis, structural and magnetic characterization of a terephthalato-bridged dinuclear cobalt (II) complex. Inor. Chim. Acta 2008, 361, 123–131. [Google Scholar] [CrossRef]
  28. Blackman, A.G. Tripodal tetraamine ligands containing three pyridine units: The other polypyridyl ligands. Eur. J. Inorg. Chem. 2008, 17, 2633–2647. [Google Scholar] [CrossRef]
  29. Blackman, A.G. The coordination chemistry of tripodal tetraamine ligands. Polyhedron 2005, 24, 1–39. [Google Scholar] [CrossRef]
  30. England, J.; Bill, E.; Weyhermüller, T.; Neese, F.; Atanasov, M.; Wieghardt, K. Molecular and Electronic Structures of Homoleptic Six-Coordinate Cobalt(I) Complexes of 2,2:6,2-Terpyridine, 2,2-Bpyridine, and 1,10-Phenanthroline. An Experimental and Computational Study. Inorg. Chem. 2015, 54, 12002–12018. [Google Scholar] [CrossRef]
  31. Kurtz, D.A.; Zhang, J.; Sookezian, A.; Kallick, J.; Hill, M.G.; Hunter, B.M. A cobalt phosphine complex in five oxidation states. Inorg. Chem. 2021, 60, 17445–17449. [Google Scholar] [CrossRef]
  32. Isaacs, M.; Canales, J.; Aguirre, M.; Estiú, G.; Caruso, F.; Ferraudi, G.; Costamagna, J. Electrocatalytic reduction of CO2 by aza-macrocyclic complexo f Ni (II), Co (II), and Cu (II). Theoretical contribution to probable mechanisms. Inorg. Chim. Acta 2002, 339, 224. [Google Scholar] [CrossRef]
  33. Zhang, P.; Wang, M.; Yang, Y.; Yao, T.; Sun, L. A molecular copper catalyst for electrochemical water reduction with a large hydrogen-generation rate constant in aqueous solution. Angew. Chem. Int. Ed. 2014, 126, 14023–14027. [Google Scholar] [CrossRef]
  34. Chan, S.L.-F.; Lam, T.L.; Yang, C.; Yan, S.-C.; Cheng, N.M. A robust and efficient cobalt molecular catalyst for CO2 reduction. Chem. Commun. 2015, 51, 7799. [Google Scholar] [CrossRef] [PubMed]
  35. Keene, F.R.; Creutz, C.; Sutin, N. Reduction of carbon dioxide by tris(2,2′-bpyridine)cobalt(I), Coord. Chem. Rev. 1985, 64, 247–260. [Google Scholar] [CrossRef]
  36. Costentin, C.; Drouet, S.; Passard, G.; Robert, M.; Savéant, J.-M. Proton-Coupled Electron Transfer Cleavage of Heavy-Atom Bonds in Electrocatalytic Processes. Cleavage of a CO Bond in the Catalyzed Electrochemical Reduction of CO2. J. Am. Chem. Soc. 2003, 135, 9023–9031. [Google Scholar] [CrossRef]
  37. Azcarate, I.; Costentin, C.; Robert, M.; Savéant, J.-M. A Study of Through-Space Charge Interaction Substituent Effects in Molecular Catalysis Leading to the Design of the Most Efficient Catalyst of CO2-to-CO Electrochemical Conversion. J. Am. Chem. Soc. 2016, 138, 16639–16644. [Google Scholar] [CrossRef]
  38. McSkimming, A.; Bhadbhade, M.; Colbran, S.B. Hydride ion-carrier ability in Rh(i) complexes of a nicotinamide-functionalised N-heterocyclic carbene ligand. Dalton Trans. 2010, 39, 10581–10584. [Google Scholar] [CrossRef]
  39. Záliš, S.; Consani, C.; El Nahhas, A.; Cannizzo, A.; Chergui, M.; Hartl, F.; Vlček, A., Jr. Origin of electronic absorption spectra of MLCT-excited and one-electron reduced 2,2’ -bpyridine and 1,10-phenanthroline complexes. Inorg. Chim. Acta. 2011, 374, 578–585. [Google Scholar] [CrossRef]
  40. Keszei, E. Kinetics of Composite Reactions. Reaction Kinetics; Springer: Cham, Switzerland, 2021; pp. 71–116. [Google Scholar] [CrossRef]
  41. Trasatti, S. The Absolute Electrode Potential: An Explanatory Note (Recommendations 1986). Pure Appl. Chem. 1986, 58, 955–966. [Google Scholar] [CrossRef]
  42. Kohn, W.; Becke, A.D.; Parr, R.G. Density Functional Theory of Electronic Structure. J. Phys. Chem. 1996, 100, 12974–12980. [Google Scholar] [CrossRef]
  43. Kohn, W.; Sham, L.J. Self-consistent equations including exchange and correlation effects. Phys. Rev. 1965, 140, A1133. [Google Scholar] [CrossRef]
  44. Hohenberg, P.; Kohn, W. Inhomogeneous electron gas. Phys. Rev. B 1964, 7, 1912–1919. [Google Scholar] [CrossRef]
  45. Frisch, M.J.; Trucks, G.W.; Schlegel, H.B.; Scuseria, G.E.; Robb, M.A.; Cheeseman, J.R.; Scalmani, G.; Barone, V.; Petersson, G.A.; Nakatsuji, H.; et al. Gaussian 16, Revision C.01; Gaussian, Inc.: Wallingford, CT, USA, 2016. [Google Scholar]
  46. Yanai, T.; Tew, D.P.; Handy, N.C. A new hybrid exchange-correlation functional using the Coulomb-attenuating method (CAM-B3LYP). Chem. Phys. Lett. 2004, 399, 51–57. [Google Scholar] [CrossRef]
  47. Dunning, T.H., Jr.; Hay, P.J. Modern Theoretical Chemistry; Schaefer, H.F., Ed.; Plenum: New York, NY, USA, 1977; Volume 3, pp. 1–28. [Google Scholar]
  48. Wadt, W.R.; Hay, P.J. Ab initio effective core potentials for molecular calculations. Potentials for main group elements Na to Bi. J. Chem. Phys. 1985, 82, 284–298. [Google Scholar] [CrossRef]
Figure 1. Structure of complex compounds of (a) [CoII(bztpen)Br]PF6, (b) [CoII(tpa)Cl]Cl, and (c) [CoII(bpy)3](BF4)2.
Catalysts 15 00641 g001
Figure 2. Normalized current cyclic voltammograms of 1 mM of cobalt complexes (a) [Co(bztpen)Br]PF6, (b) [Co(tpa)Cl]Cl, and (c) [Co(bpy)3](BF4)2 in MeCN with 0.1 M TBAPF6 as supporting electrolyte. Solutions were purged with N2 and scans were initiated from open-circuit potential to negative direction. A glassy carbon disk was used as the working electrode.
Catalysts 15 00641 g002
Figure 3. Normalized current cyclic voltammograms of 1 mM cobalt complexes (a) [Co(bztpen)Br]PF6, (b) [Co(tpa)Cl]Cl, and (c) [Co(bpy)3(BF4)2] solutions in MeCN with 0.1 M TBAPF6 as the supporting electrolyte. Measurements were carried out under N2 (black line) and CO2 (red line). Scan rate 100 mVs−1. The potential was swept from open circuit potential toward the cathodic direction. A glassy carbon disk was used as the working electrode.
Catalysts 15 00641 g003
Figure 4. Normalized current cyclic voltammograms of 1 mM cobalt complexes (a) [CoII(bztpen)Br]PF, (b) [CoII(tpa)Cl]Cl, and (c) [CoII(bpy)3](BF4)2 solutions in MeCN with 0.1 M TBAPF6 as the supporting electrolyte. Solutions were saturated with CO2 and scans were recorded from open circuit potential to negative direction. A glassy carbon disk was used as the working electrode.
Catalysts 15 00641 g004
Figure 5. (a) FOWA of [CoII(Bztpen)Br]PF6; (b) the corresponding logarithmic rate constant plot; (c) FOWA of a 1 mM [CoII(bpy)3](BF4)2; (d) the corresponding logarithmic rate constant plot; (e) FOWA of [CoII(tpa)C]Cl; and (f) the corresponding logarithmic rate constant plot. A measure of 1 mM of complexes in MeCN with 0.1 M TBAPF6 was used as a supporting electrolyte.
Catalysts 15 00641 g005aCatalysts 15 00641 g005b
Figure 6. UV-Vis spectroelectrochemical response of 1 mM [CoII(bztpen)Br]PF6 in MeCN containing 0.1 M TBAPF6 under N2 atmosphere. A potential of −1.95 V vs. Fc/Fc+ was applied, and UV-Vis spectra were recorded every 3 s over a period of 3 min.
Catalysts 15 00641 g006
Figure 7. UV-Vis spectroelectrochemical response of 1 mM [CoII(bztpen)Br]PF6 in MeCN containing 0.1 M TBAPF6 under CO2 atmosphere. A potential of −1.95 V vs. Fc/Fc+ was applied, and UV-Vis spectra were recorded every 3 s over a period of 3 min.
Catalysts 15 00641 g007
Figure 8. UV-Vis spectroelectrochemical response of 1 mM [CoII(tpa)Cl]Cl in MeCN containing 0.1 M TBAPF6 under N2 atmosphere. A potential of −2.06 V vs. Fc/Fc+ was applied, and UV-Vis spectra were recorded every 3 s over a period of 3 min.
Catalysts 15 00641 g008
Figure 9. UV-Vis spectroelectrochemical response of 1 mM [CoII(tpa)Cl]Cl in MeCN containing 0.1 M TBAPF6 under N2 atmosphere. A potential of −2.24 V vs. Fc/Fc+ was applied, and UV-Vis spectra were recorded every 3 s over a period of 3 min.
Catalysts 15 00641 g009
Figure 10. UV-Vis spectroelectrochemical response of 1 mM [CoII(tpa)Cl]Cl in MeCN containing 0.1 M TBAPF6 under CO2 atmosphere. A potential of −2.06 V vs. Fc/Fc+ was applied, and UV-Vis spectra were recorded every 3 s over a period of 3 min.
Catalysts 15 00641 g010
Figure 11. UV-Vis spectroelectrochemical response of 1 mM [CoII(tpa)Cl]Cl in MeCN containing 0.1 M TBAPF6 under CO2 atmosphere. A potential of −2.24 V vs. Fc/Fc+ was applied, and UV-Vis spectra were recorded every 3 s over a period of 3 min.
Catalysts 15 00641 g011
Figure 12. SOMO diagrams of the species (a) [Co(Bztpen)Br]+ and (b) [Co(tpa)Cl]+]2+ and the proposed optimized species electrogenerated during electrolysis in the presence of CO2: (c) [CoI(bztpen)(CO)]+ and (d) [CoI(tpa)(CO)] +.
Catalysts 15 00641 g012
Scheme 1. Overview of the main parameters considered.
Catalysts 15 00641 sch001
Table 1. Redox potential, electrochemical reaction, and onset potential for compounds studied in this work.
CompoundRedox Potential
(V vs. Fc/Fc+)
Onset Potential
(V vs. Fc/Fc+)
[CoII(bztpen)Br]PF6
[ C o I I b z t p e n B r ] + + 1 e C o I b z t p e n B r −1.807−1.640
[ C o I I b z t p e n B r ] + C o I I I b z t p e n B r + 1 e −0.0655n.o.
[CoII(tpa)Cl]Cl
[ C o I I t p a C l ] + + 1 e C o I t p a C l −1.755−1.633
[ C o I t p a ] + + 1 e C o 0 t p a −1.980−1.951
  C o 0 t p a + 1 e C o 0 ( t p a ) −2.258−2.255
[CoII(bpy)3](BF4)2
C o I I b p y 3 2 + + 1 e C o I b p y 3 + −1.351n.o.
C o I b p y 3 + + 2 e C o I b p y b p y 2 −1.961−1.667
Data is reported at 100 mVs−1 in MeCN solution with 0.1 M TBAPF6 as the supporting electrolyte. A glassy carbon disk was used as the working electrode; n.o. = not observed.
Table 2. Kinetic rate constants determined from the spectroelectrochemical response of the compounds.
CompoundPotential Applied
(V vs. Fc/Fc+)
Wavelength
(nm)
k
(s−1)
[CoII(bztpen)Br]PF6−1.954000.026 ± 0.001
[CoII(tpa)Cl]Cl−2.064000.037 ± 0.001
[CoII(tpa)Cl]Cl−2.244000.015 ± 0.001
[CoII(bpy)3](BF4)2−1.553800.008 ± 0.002
[CoII(bpy)3](BF4)2−2.253800.0001 ± 0.002
[CoII(bztpen)Br]PF6−1.95260n.o.
[CoII(tpa)Cl]Cl−2.062600.031 ± 0.002
[CoII(tpa)Cl]Cl−2.242600.021 ± 0.002
[CoII(bpy)3](BF4)2−1.552450.020 ± 0.002
[CoII(bpy)3](BF4)2−2.25 245n.o.
All experiments were conducted under identical conditions to ensure consistency and comparability with the results. n.o. not observed.
Disclaimer/Publisher’s Note: The statements, opinions and data contained in all publications are solely those of the individual author(s) and contributor(s) and not of MDPI and/or the editor(s). MDPI and/or the editor(s) disclaim responsibility for any injury to people or property resulting from any ideas, methods, instructions or products referred to in the content.

