1. Introduction
Biomass gasification is a process with high prospects for manufacturing alternative energy [
1,
2]. Biomass utilization offers, however, special challenges. Biomass is a low bulk density feedstock that is collected across large, distant, and frequently remote areas and is available on a seasonal basis, with transportation costs being a key for its utilization.
During gasification, biomass (solid or liquid) is converted into syngas, biochar, and tar [
3,
4]. The produced biomass-derived syngas (BMD-syngas) can be used as a chemical feedstock or, alternatively, as a fuel for heat and/or energy generation, while biochar can have valuable applications as a soil fertility enhancer. Biomass gasification can lead to the formation of tars, which consist of a liquid fraction, with molecules with carbon numbers exceeding six. Tar can be a nuisance for the syngas produced in view of its combustion in gas turbines [
5].
Tars are considered to be a product of biomass pyrolytic decomposition during gasification [
6]. When condensed in various gasifier downstream units, tars may cause operational problems and lower the quality of the produced syngas [
7,
8]. The proportions of biomass constituents, including cellulose, hemicellulose, and lignin, can affect the products obtained from the gasification process. For instance, when lignin is the main biomass constituent, the lowest gas yields of a low calorific value are obtained [
6].
Table 1 describes the different process issues that occur when tars are formed during biomass gasification. These unresolved issues may be classed as (a) pipeline blockage, (b) corrosion of downstream equipment, (c) catalyst deactivation, (d) reduction in gasification efficiency, (e) formation of phenolic species contaminating process water, and (f) environmental issues harmful to health.
Thus, a catalytic post-gasification (CPG) unit using a tar conversion catalyst (TCC) with formed tars being converted into valuable products such as H2, CO, and CH4 can play a significant role in biomass gasification viability. It is with these facts in mind that the present review assesses the possible formulation of new catalysts for the conversion of derived tars from biomass. Their evaluation is conducted using an advanced laboratory-scale fluidized reactor designated as the CREC Riser Simulator invented and developed at the Chemical Reactor Engineering Center (CREC), at the University of Western Ontario. It is also with this aim that this review considers a continuous CPG unit for tar conversion in the context of an integrated waste biomass gasification plant.
2. Biomass and Biomass Gasification Overview
2.1. Biomass Properties
Biomass is an organic matter, from either plant or animal origin, that is living, or was living, in the recent past. During the photosynthesis process, the energy required for biomass synthesis comes from the sun. Biomass is considered to be a renewable resource. It is a raw material that is CO
2 neutral, given that the same moles of carbon used for biomass photosynthesis are returned to the atmosphere when combusted [
10]. When biomass C-H, C-O, and C-C bonds are broken, enthalpies of 337 kJ/mol, 1,076 kJ/mol, and 607 kJ/mol [
11], respectively, are required [
10]. Furthermore, when compared to fossil fuels, one can see that biomass conversion leads to lower gas emissions of chemicals such as SO
X and NO
X [
10].
Biomass is mainly composed of cellulose, hemicellulose, and lignin components. The amount of cellulose, hemicellulose, and lignin present in biomass can vary from one source to another.
Table 2 reports the cellulose, hemicellulose, and lignin of different types of biomass.
Additionally, biomass can be classified based on its origin, such as agricultural waste, forest waste, or industrial waste [
9].
2.2. Biomass Gasification
Gasification is one thermochemical process that can be used to convert waste biomass into biofuels, gases, and chemicals [
10,
12]. When evaluating biomass in terms of its capacity to produce energy, one can envision it as a partial oxidation process [
5], where a low-energy-density material is converted into gaseous products with a higher calorific value.
During the gasification process, a wide variety of heterogeneous and gas-phase reactions take place.
Table 3 summarizes these possible gasification reactions, such as volatilization, partial combustion, water–gas shift, the Boudouard reaction, dry and steam reforming, and ammonia synthesis, among others. The various reactions of this complex reaction network determine the composition of the resulting gasification products.
The ensemble of these reactions together leads to a syngas blend consisting of CO, CO2, H2, CH4, and H2O, together with a solid residue and a liquid fraction designated as biochar and tar, respectively.
3. Tar Properties
Tars include a wide variety of chemical compounds. As a result, over the years, different tar definitions have been proposed, with tar classifications being based on diverse criteria. For example, in the Brussels Meeting of the IEA Bioenergy that took place in 1998, tars were defined as “hydrocarbons of higher molecular weight than benzene” [
14]. In addition, tars are considered to be constituted of condensable organic compounds, mainly aromatic species, produced under thermal or partial-oxidation conditions [
15]. However, it is found that in the above-described biomass-derived tars, one should also include oxygenated hydrocarbons, sulfur and chlorine species, alkali metals, and fuel-bound nitrogen [
16].
One should mention as well, that the maximum amount of tars allowed in the producer gas depends on the specific syngas application. Valderrama et al. [
17] state that tar content in syngas should be less than 100 mg/Nm
3 in the case of internal combustion engines, while for gas turbines, it should be less than 5 mg/Nm
3, and for fuel cell and methanol production, it should be less than 1 mg/Nm
3.
Furthermore, tar composition can be affected by the gasifier’s operational conditions, such as temperature, total pressure, steam-to-biomass ratio, type of biomass feedstock, and gasifying agent. Given all this, tars can be classified based on (a) tar molecular weight, (b) tar molecular structure, (c) tar solubility, and (d) tar condensability.
An important physicochemical property of tar is its “dew point”. This is the temperature at which the tar partial pressure equals the tar saturation vapor pressure [
18]. Thus, when the tar partial pressure is higher than the tar saturation vapor pressure, tar condenses. The tar dew point can be affected by tar composition. For example, in the case of polyaromatic hydrocarbons (e.g., naphthalene, anthracene), tar compositions have an important effect on tar dew point. On the other hand, for water-soluble tars (e.g., pyridine, phenol, cresols, toluene, xylene), tar composition modestly affects the tar dew point [
16]. When these tars are condensed, they lead to equipment corrosion and affect the downstream gasification process.
Tars resulting from gasification can also be classified and studied on the basis of the extent of biomass conversion, as reported in
Table 4 [
6,
15].
Table 5 reports the typical percentages of aromatics, phenolic, heterocyclic, and other chemical constituents that make up a typical tar composition.
Considering these various issues regarding tar and the complexity of its composition, CREC–UWO researchers selected 4-methoxy-2-methylphenol (4M2MP) as a surrogate model compound [
20] to study the efficiency of tar removal via CPG due to its similarity with lignin in terms of its oxygen, carbon, and hydrogen element contents. A 4M2MP displays a good balance between aromatic, methyl, methoxy, and hydroxyl groups. All these chemical groups are expected to be contained in lignin.
4. Catalytic Removal of Tars
An approach designated as “hot-gas tar cleaning” can be used to promote a series of tar conversion reactions during tar catalytic decomposition. Catalysts used in the “hot tar cleaning process” can be used both inside the sand gasifier unit itself [
4,
21,
22,
23,
24,
25] and in a separate fluidized unit following the sand fluidized gasifier [
26]. Regarding these two possible options, the one where the CPG unit follows the sand gasifier is preferred by CREC researchers [
27] to minimize issues with sand, ash, and catalyst separation in the industrial process.
In the two different unit configurations, catalysts may help favorably by simultaneously modifying the gasifier-produced syngas composition and by removing tar in a process where it decomposes into smaller molecules, such as permanent gases (H
2, CO, CO
2, CH
4) [
6,
28,
29,
30]. Thus, the function of these catalysts is to boost the tar removal rate and/or the selectivity of gasification reactions toward higher H
2/CO ratios [
31].
The “hot-tar cleaning” process requires a fluidizable catalyst that addresses the following issues: (a) the metal crystallites and the catalyst support do not lead to the formation of unreactive solid phases (e.g., nickel aluminates) and (b) the metal crystallites themselves do not yield undesirable crystallite agglomeration, in a process where there may be a reduction in metal dispersion and an increase in the crystallite sizes [
32].
Natural mineral materials such as olivine, clay minerals, calcined rocks, or ferrous metal oxides can be considered good catalysts for tar removal. Alternatively, one can employ synthetic materials such as char or activated carbon, catalytic cracking catalysts, alkali alumina, or transition metals (Ni, Pt, Zr, Ru) [
33]. However, these various materials frequently display limits in their applications given the following: (a) they do not fluidize well, (b) they have limited resistance to attrition, and (c) they do not recover activity completely following catalyst regeneration.
Table 6 describes the advantages and disadvantages of using the above-described materials as catalysts for tar conversion.
Thus, for the “hot tar cleaning” process, catalysts involving the following characteristics are required [
17,
37]:
Good activity and efficient tar conversion;
Good activity for the water–gas shift reaction when aiming to achieve high H2 concentrations;
Good stability for coke deactivation and H2S poisoning;
Easy regeneration;
Good resistance to attrition, with this being particularly important if the gasification involves a fluidization unit;
Commercial availability and low cost;
Free of negative environmental impact.
Typical TCCs employed in the “hot-tar cleaning process” have complex compositions and involve high surface area materials [
38,
39]. They contain three solid phases: (a) the active phase, (b) the promoter phase enhancing catalytic activity and/or stability, and (c) the support providing a high surface area that facilitates the dispersion of the active phase.
Transition metals can act as active phases given (a) their partially empty
d-orbital, (b) their adequate crystallite surface for the adsorption of reactant molecules, (c) their ability to lower the activation energy involved in energy transition states, and (d) their property of exhibiting multiple oxidation states. Studies have shown the good performance of noble metals, such as Ru, Rh, Pd, Os, Ir, Pt, Au, and Ag. [
40,
41,
42]. However, these catalysts are not attractive due to their high cost.
Consequently, Ni-based catalysts are considered a good option, as they display good performance at a lower cost [
36]. Ni-based catalysts can contribute to the cracking of both C-H and C-C bonds. These catalysts have also shown good performance in biomass gasification, particularly given that they promote both steam and dry reforming to form hydrogen at adequately selected operating conditions [
37]. Likewise, Ni-based catalysts can activate the H
2O and CO
2 species present, promoting both tar reforming and water–gas shift reactions [
40].
Ni-catalysts can also be modified with other metals in order to improve Ni dispersion, oxygen capacity, reducibility, activity, and stability. In spite of Wulff’s rule, where the morphology of a crystalline substance determines the crystal planes exposed on the surface [
43], catalysts usually exhibit an uneven and irregular morphology, with precursors and synthesis methods having an impact on this matter. This modification with other metals can also lead to changes in specific surface area and Ni crystallite particle size, with larger catalyst surface areas enhancing Ni particle dispersion.
TCC catalysts are manufactured using a catalyst support. The TCC catalyst support should have a porous and high specific surface area. Possible catalyst support materials can be perovskites, biochar, activated carbon, zeolites, silica gels, activated clays, and activated alumina. These support materials have a wide range of surface areas (1.5 to 1500 m
2/g), pore volumes (from 0.4–1 cm
3/g), and pore diameters (ranging from 0.4 to 2000 nm). One can consider Al
2O
3 as a valuable support choice, given its thermal stability and physicochemical properties [
41]. Al
2O
3 can be found in different phases. However, the most popular ones for catalytic purposes are the α and the γ phases. Al
2O
3 displays advantages as a support for tar conversion catalysts, promoting strongly binding active phases that prevent metal leaching and the formation of acidic and basic sites and oxygen vacancies. Similarly, silica can be used as a support. Silica shares some of the advantages of Al
2O
3, such as having a high surface area, thermal stability, and preventing metal sintering due to the formation of metal silicates.
Given the various catalyst support alternatives available and the research focus on fluidized catalysts for CPG, a commercially available Sasol fluidizable γ-Al
2O
3 with good attrition resistance was selected by the CREC–UWO team. Furthermore, a cerium oxide alkaline earth metal was considered to reduce the acidity of the strongest acid sites of the γ-Al
2O
3 support [
27]
5. Catalyst Deactivation by Coke
The mechanisms of coke formation have been extensively studied [
44], and it is accepted that they follow three steps: (i) hydrogen transfer at acid sites, (ii) dehydrogenation of hydrocarbons, and (iii) polycondensation. Catalysts can deactivate in different ways, with the formation of coke causing catalyst deactivation (active site coverage) and/or pore blocking [
45].
In particular, catalysts used in tar removal are susceptible to the formation of coke. This is due to the splitting of the C-H bonds [
36], which leads to the formation of carbon-rich deposits [
46]. Three types of coke have been identified: pyrolytic, encapsulated, and whisker carbon types. Pyrolytic and whisker coke are commonly formed at temperatures above 650 °C [
36], while encapsulated coke is more likely to be formed at lower temperatures (600 °C) [
47].
In the case of Ni-based catalysts, the whisker type of coke is the most common. This type of coke can be characterized as being filamentous and associated with high temperatures, low water content, and the presence of aromatics [
36]. When filamentous coke is formed, the active surfaces of the catalysts are still available. However, as the catalysts are reused, the carbon accumulates, leading to an eventual significant drop in catalytic activity [
46].
Thus, as a result, it is worth stating that the evaluation of coke formation under the 550–600 °C anticipated temperature conditions commonly employed with fluidized catalysts, as the one developed by CREC–UWO researchers [
48] is of paramount importance, for the CPG process.
6. Ceria as a Promoter of Tar Removal Catalysts
A promoter can be a key component of a TCC [
49,
50,
51]. In a CPG unit, a catalyst promoter can help to moderate the formation of carbon and to oxidize the carbonaceous species [
52]. This can be achieved with the extra oxygen storage capacity and oxygen mobility induced by a promoter. Oxygen vacancies and oxygen transport to the active sites can help steam reforming and coke elimination, as well as assist the water–gas shift reaction [
33]. In this manner, the inclusion of a promoter in a TCC can assist in delaying catalyst deactivation [
27].
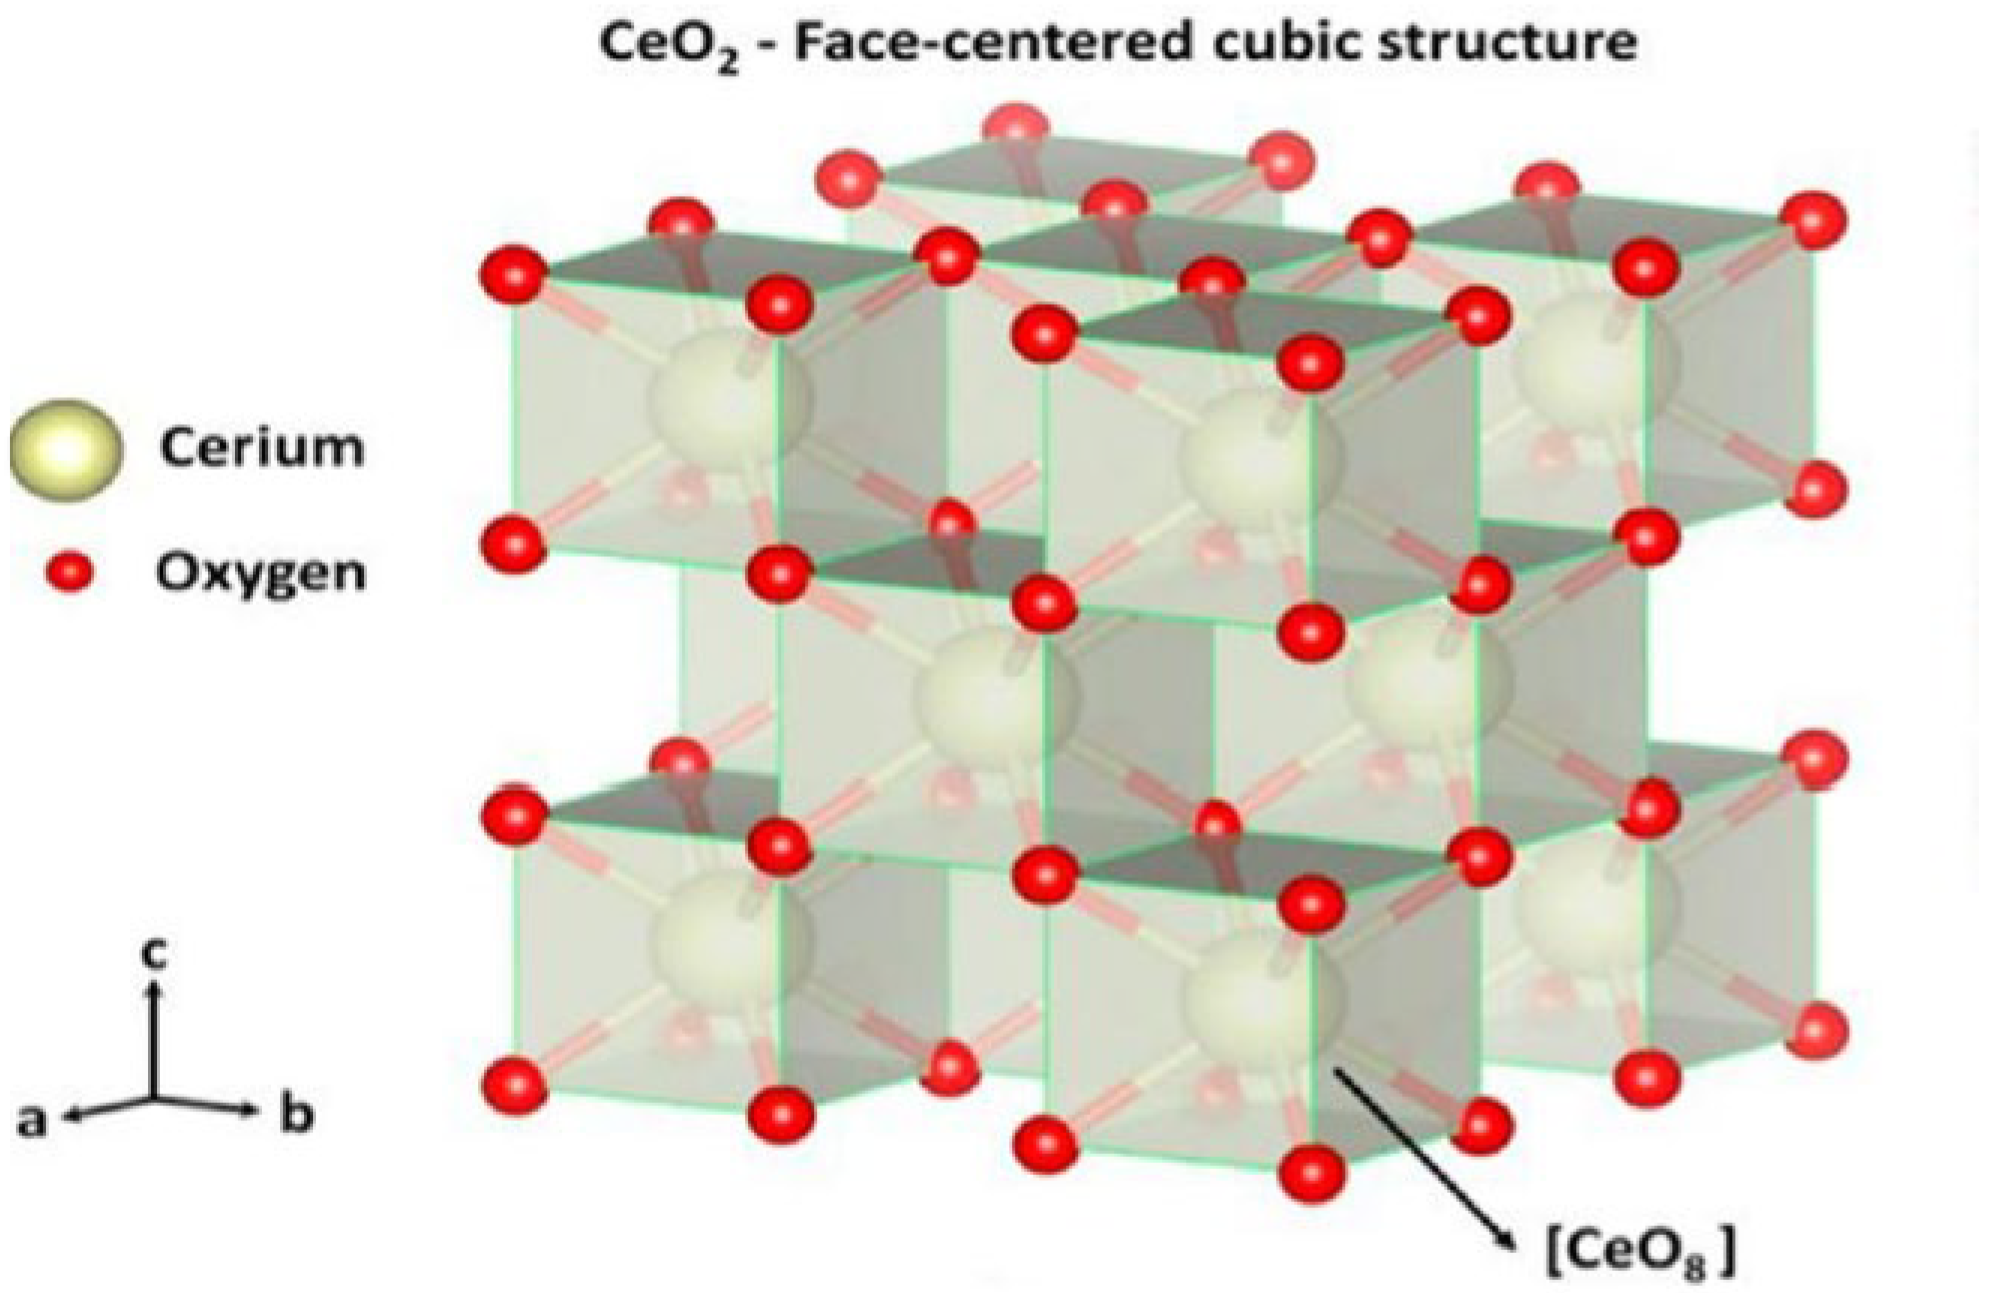
Ceria is a good candidate as a catalyst promoter, given its high oxygen storage capacity and the fact that it can absorb and release oxygen reversibly via oxygen vacancies [
53,
54]. CeO
2 has a fluorite cubic unit cell structure, as shown in
Figure 1. In the fluorite, each Ce
4+ is coordinated with eight oxygen atoms. Furthermore, each O
2- in the tetrahedral space is, in turn, coordinated with the four Ce
4+ nearest atoms [
55].
There is also evidence that ceria can improve the dispersion of the active species [
56]. CeO
2 can delay the transition phase of alumina from gamma to alpha at temperatures above 730 °C [
57]. Moreover, ceria can enhance the activity, stability, and resistance to coke formation on Ni/Al
2O
3 catalysts [
56]. Altogether, when Al
2O
3 and CeO
2 are combined, the catalyst shows better stability and greater redox activity. This is the case given that fluorite displays vacant octahedral holes that can facilitate oxygen mobility through a defect structure [
58].
It has been recognized that CeO
2 loadings ranging from 1 wt% to 5%wt play an important role in reducing the interaction between the Ni-based catalyst and the Al
2O
3 support. This leads to a stronger dispersion of the nickel particles. Other than the nickel dispersion, CeO
2 facilitates the electron transfer [
27].
Table 7 reports a summary of CeO
2-doped Ni Catalysts on Al
2O
3 supports used for methane dry reforming, as reported in the technical literature.
While these studies provide valuable references and precedents, one has to note that the performances of these Ni/CeO2-Al2O3 catalysts were evaluated using the methane dry-reforming reaction in fixed bed laboratory scale units. Fluid dynamic and reaction conditions in these fixed units differ significantly with respect to the ones anticipated in circulating fluidized beds, as is the case in the CPG process of the present review.
7. The Catalytic Post-Gasification (CPG) Process
An integrated gasification process with CPG, as the one described in
Figure 2, should involve two steps. In the first step, biomass is gasified in a fluidized gasifier unit. In the second step, tars are converted as follows: (a) biomass-derived tars are converted into lighter hydrocarbons consisting of CO, CO
2, and H
2; (b) the composition of the syngas exiting the gasifier is modified to an H
2/CO ratio larger than 2, as required for methanol synthesis. These two functions of the CPG unit are expected to be conducted via dominant tar steam cracking and water–gas shift reaction functionalities imparted to the TCC catalyst.
It is significant to observe that a successfully integrated gasification process, including tar CPG, should involve several steps with adequate thermal compatibility between the steps as follows:
- (a)
Tgasifier = 800 °C > TCPG = 550 °C;
- (b)
Tregenerator = 615° C > TCPG downer = 550 °C;
- (c)
Tregenerator close to Treducer,
with Tgasifier, TCPG, Tregenerator, and Treducer representing selected temperatures in the gasifier unit, the catalytic post-gasification unit, the regenerator, and the reducer units, respectively.
In this manner, the various units of the integrated gasification process, as shown in
Figure 2, can operate within the desirable thermal ranges, maximizing enthalpy recovery for electrical power production and yielding syngas with a composition compatible with alcohol synthesis.
Thus, to accomplish this, a fluidizable TCC in a CPG unit is required to perform at 500–550 °C, 2.2 atm, and short contact times (e.g., 10 s). Furthermore, a high-temperature heat exchanger, as shown in
Figure 2, is needed to recover a significant fraction of the available process thermal enthalpy for electrical power generation via a steam turbine. One should note that the temperature operating conditions at the syngas side of the heat exchanger are reduced from 800 °C to 550 °C to prevent tar condensation between the gasifier exit and the CPG downer unit entry.
8. Thermodynamics of Syngas Composition During Catalytic Post-Gasification Tar Conversion
The main anticipated reactions in catalytic post-gasification can be designated as being of the “primary type” or of the “secondary type”. The “primary type” reactions, such as surrogate tar steam cracking, are represented by Equation (18). The “secondary type” reactions (water–gas shift reaction, steam, and dry reforming) are described with Equations (19)–(21). The extent of these secondary reactions is strongly affected by the thermal level, the reaction environment (e.g., partial pressure of primary chemical product species and steam), and thermodynamics.
where α, β, γ, ε, δ, σ, ω are stoichiometric coefficients;
CmHnOo is a generic hydrocarbon product resulting from the cracking and reforming of tar, and C
(s) is a solid carbonaceous deposit, designated as coke.
While the overall tar conversion (R1) can be represented by Equation (18), the actual distribution of gaseous products in the tar catalytic conversion unit is affected by the relative reaction contribution of R2, R3, and R4, as shown in Equations (19)–(21).
Given the nature of the proposed Ni-based catalyst, which strongly promotes these three reactions, one can conclude that the extent of these R2, R3, and R4 reactions influence syngas composition. In order to clarify this matter, the K
y,eq equilibrium constants, at 550 °C and 800 °C and with total pressure at 2.2 atm are reported in
Table 8, based on the chemical species molar fractions. These two temperatures are the anticipated typical thermal levels for the CPG and biomass gasifier units, respectively.
The thermodynamic equilibrium calculations in
Table 8 show a dominant influence of R2, R3, and R4 reactions at gasification conditions (e.g., 800 °C and 2.2 atm), while only R2 rules at 550 °C in the CPG unit. In other words, one can expect that the composition of syngas coming from the gasifier is transformed in CPG, and this is given the significant influence of the water–gas shift reaction, with a substantial increase in the H
2/CO ratio.
Table 9 reports a syngas mixture, including CO, CO
2, H
2, H
2O, and N
2, as typically exiting a biomass gasifier [
64], which is processed later in the tar CPG conversion reactor, assuming chemical equilibrium. One can see in
Table 9 that a high H
2/CO ratio (e.g., 2.8 ratio) is anticipated at the outlet of the CPG unit at thermodynamic equilibrium.
Thus, on this basis, one can expect that by using a Ni-based catalyst, the R2 reaction is strongly promoted, achieving, in this manner, both the reduction in biomass-derived tar in syngas as well as increasing the H2/CO ratio in the CPG unit. As a result, this makes the obtained syngas blend a suitable option for the synthesis of alcohols. As shown later in this review, the reported thermodynamic analysis described in this section is critical to establishing the syngas feed composition that can be used in tar catalytic conversion experiments.
9. Biomass Gasification Catalysts Evaluated in the CREC Riser Simulator
The CREC Riser Simulator, as shown in
Figure 3, is a laboratory-scale fluidized reactor operated in the “batch mode” at conditions similar to the ones of industrial fluidized risers and fluidized downers [
48], in terms of chemical species reactant partial pressures, reaction times, temperatures, and catalyst/reactant ratios.
By using the CREC Riser Simulator, several catalytic gasification biomass studies have been conducted under different operating conditions in Canada, Mexico, and Saudi Arabia university laboratories [
48]. The value of this unit for establishing Ni- and Fe-based fluidizable catalyst performances by using various chemical tar surrogates has been reported in a significant number of publications, as reported in
Table 10. In this table, both the conditions and reaction results are described in detail. In this respect, significant results were obtained by using a diversity of chemical species to simulate tar produced from biomass gasification, such as glucose, 2-methoxy-4-methylphenol, toluene, and their blends. Ni and Fe catalysts supported on fluidizable alumina were the preferred TCC catalysts. Various dopants were added to these catalysts, such as La
2O
3, CeO
2, Ru, CaO, Co, and ZrO
2.
In spite of the well-documented progress in evaluating TCC catalysts in the CREC Riser Simulator, as documented in
Table 10, more recently, the CREC–UWO team has established the concept of testing the TCC catalysts (fluidizable Ni/ceria on γ-Al
2O
3 catalyst) by using a specially selected syngas blend that emulates a “Water–Gas Shift (WGS) equilibrated syngas”. The composition of this “Water–Gas Shift (WGS) equilibrated syngas” can be calculated from chemical equilibrium thermodynamics at the CPG reaction conditions, as described in
Section 8.
10. The TCC Catalyst Preparation
The TCC fluidizable catalyst proposed by CREC–UWO researchers was prepared by using the incipient wetness technique. A mesoporous γ-Al
2O
3 support was employed for this catalyst. Cerium oxide (IV) was used as a catalyst promoter, and nickel was employed as the catalyst active phase. The preparation of the catalyst via the incipient wetness technique was conducted as follows: First, the catalyst precursor salts were dissolved in distilled water. Then, the amount of precursor used was based on the desired precursor loading. The volume of the impregnating precursor solution was calculated based on the pore volume of the γ-Al
2O
3 support that was obtained from the N
2 adsorption analysis. Additional details regarding the preparation of the catalyst are provided in [
20].
The prepared catalyst was characterized by using (a) nitrogen physisorption to obtain the specific surface area, the average pore diameter, and the pore volume; (b) ammonia-TPD to establish the acid site strengths of the catalyst γ-alumina support, and the influence on acidity of both cerium promoter and nickel; (c) CO2-TPD to evaluate the cerium promoter and the nickel active phase effects on support basicity; (d) H2-TPR to assess the reduction in the nickel active phase, including the active metal surface, the metal dispersion, and the average metal crystallite size; (e) XRD to establish the crystalline structures and phases present in the catalyst; (f) pyridine FTIR to evaluate the presence of Brønsted and Lewis acid sites.
In these respects, the most promising catalyst for tar reduction, identified as consisting of 15%Ni–5%CeO2 γ-Al2O3, has the following properties: (a) a 139 m2/g specific surface area, (b) 15 wt% nickel loading, (c) an 84% reducible active nickel phase, (d) a 0.97% nickel dispersion, (d) a 107 nm nickel crystallite size, and (e) a 6.8 cm 3 STP ammonia acidity and a 2.4 cm3 STP/g CO2 basicity.
11. Evaluation of a Ni/Ce-γ-Al2O3 Catalyst Using a Close to “Equilibrium Syngas Blend”
The performance of the 15%Ni–5%CeO
2 on γ-Al
2O
3 catalyst was evaluated in the CREC Riser Simulator. The CREC Riser Simulator is a bench-scale batch mini-fluidized reactor unit.
Figure 4 and
Figure 5 show schematic diagrams of the reactor section and its auxiliary components, respectively. The reaction cell, as described in
Figure 4, contains the solid sample (biomass or catalyst) in a 50 cm
3 volume.
The catalyst is placed in the lower shell of the reactor inside a basket contained between two grids. An impeller in the upper shell fluidizes the catalyst sample inside the basket, with the reaction gas blend moving upwards inside the catalyst basket and downwards in the outer annulus located between the basket and the reactor body walls. A metal gasket is used to seal the upper- and lower-unit shells. Both shells of the reactor are equipped with rod heaters and thermocouples, allowing one to control the reactor temperature. There is an injection port located in the lower shell. This port allows one to inject the sample of feedstock to be processed almost instantaneously. After sealing the reactor shell and doing the leak test, a thermal insulation canister is set around the CREC Riser Simulator body. The Riser Simulator is also equipped with a water-cooling system, which protects the impeller graphite gaskets from thermal damage.
Figure 5 describes the CREC Riser Simulator and its auxiliary components. The CREC Riser Simulator has a vacuum box of approximately 1000 cm
3 that connects to the reactor through a four-port valve (4PV). This valve allows for the entrance of the fluidizing agent (such as argon or helium) or the gases needed for the regeneration of the catalyst (air and hydrogen). Moreover, this valve isolates the reactor chamber from the vacuum box while the reaction is taking place.
Once the reaction time is completed, the four-port valve automatically opens and transfers the produced gas products to the vacuum box. The vacuum box is also equipped with a mixer that ensures that the product gas is well-mixed before an aliquot of the vacuum box contents is sent to the gas chromatograph.
The reactor and vacuum box are equipped with pressure transducers. Pressure transducers help monitor the total pressure changes throughout the different phases of a run: (a) at the feedstock injection, (b) during the reaction run, and (c) at reactor content evacuation. These pressure transducers are connected to analog/digital cards for data collection. Additionally, the reactor, the vacuum box, and the transfer lines are equipped with thermocouples connected to their respective temperature controllers that allow them to have the desired temperatures in these various CREC Riser Simulator components. The CREC Riser Simulator is also trained with a six-port valve (6PV) that allows the transfer of the produced gas samples to the gas chromatograph. To accomplish this, a 6PV loop is first filled with a produced gas sample when the 6PV is in the “load” position. The 6PV can be turned to the “injection” position to send the gas sample to the GC for sample analysis.
The configuration of the CREC Riser Simulator with all its auxiliary components has been demonstrated to be most valuable to study and evaluate fluidizable catalysts for several catalytic and heterogenous reactions: the catalytic cracking of hydrocarbons [
48], the oxydehydrogenation of light paraffins [
75,
76], the chemical looping combustion of waste biomass [
77], the catalytic gasification of biomass [
66], under short contact times, providing on-line” product analysis using gas chromatography.
12. Typical Tar Conversion Runs in the CREC Riser Simulator
Biomass is mainly composed of cellulose, hemicellulose, and lignin, with the latter having the most complex chemical structure of the three. During the experiments in the CREC Riser Simulator, the tar model compound selected was the 2-methoxy-4-methlylphenol due to its chemical similarity with lignin [
66,
69,
78].
The following procedure is followed for runs in the Riser Simulator: (a) 0.30 g of catalyst is loaded in the reactor; (b) prior to each reaction run, the catalyst is regenerated. This is accomplished by flowing air first through the CREC Riser Simulator unit and then by flowing pure nitrogen through it. Each of these steps takes place at 610–615 °C for 15 min. During the regeneration of the catalyst, the impeller is started to make sure that catalyst particles are in contact with either air or nitrogen; (c) after this preparatory step, the desired temperature is set, depending on the conditions for the experiment. As the system is heated up or cooled down, helium is flown through the catalyst sample; (d) once the reaction temperature is reached, the reactor pressure is lowered to 14.7 psi, and the vacuum box is set to 5 psi; (e) the impeller is started at 5000 rpm and the water/model compound, with a steam-to-biomass ratio of approximately 1, is injected; (f) once the reaction time is complete, the reactor is automatically opened, and the produced gas is transferred to the vacuum box; (g) then, a 1 mL loop representative aliquot is sampled via a 6PV and is sent to the gas chromatograph (GC) to be analyzed. Additional details regarding the analytical methods used can be found in [
20].
Figure 6 displays the typical pressure profile obtained in the CREC-Riser Simulator during a run: (a) a first pressure jump at “
A” at H
2/CO
2 gas feeding; (b) a second pressure jump at “
B” at water–tar surrogate blend injection; (c) a third “
B–
C” progressive pressure increase during tar conversion, as well as syngas reforming; and (d) a fourth “
C–
D” sudden pressure drop showing the reactor content product evacuation, and the quick chemical species transport from the reactor toward the vacuum box.
13. Results of Catalytic Tar Conversion Runs
The selection of the syngas mixture to be used in the experiments in the CREC Riser Simulator presents special challenges. This is the case because, regardless of the composition of the syngas fed and the tar conversion catalyst loaded in the reactor unit, there is a significant influence of the catalytic water–gas shift reaction. As a result, CO and water react, favoring the formation of CO
2 and H
2 species (CO + H
2O = CO
2 + H
2), as described in
Section 8 of this review. This water–gas shift activity was confirmed via various experiments, where high CO
2/CO ratios, in the range of 6, and H
2/CO ratios, in the range of 3–4, were observed.
As a result, it was decided to select a H2/CO2 = 1 syngas gas blend and to perform these runs under the assumption that the tar surrogate compound was being exposed to a syngas rich in CO2, H2, and H2O, with a minor amount of CH4 and CO contained, as is expected in the 500–550 °C range, under the presence of a water–gas shift active catalyst.
Figure 7a reports the 2M4MP surrogate tar conversions under steam and a H
2/CO
2 atmosphere when using a 15%Ni–5%CeO
2 γ-Al
2O
3 catalyst at 500 °C, 525 °C, and 550 °C and a 10 s reaction time. For further details regarding these conversion calculations refer to
Appendix A. One can see that an 83% surrogate tar conversion is reached at 550 °C.
Figure 7b shows the CO selectivity for these runs. At 550 °C, one can notice a higher 0.068–0.077 CO selectivity versus the 0.024–0.027 CO selectivity obtained under steam conditions only [
27]. These selectivity results agree with those reported in [
68], where it is shown that there is a similar increasing trend of CO selectivity when CO
2 is introduced in the CREC Riser Simulator feed.
Figure 7c reports the CO
2 selectivity under the same conditions as in
Figure 7a,b. At 550 °C, one can notice a higher stabilized 0.2–0.25 CO
2 selectivity under steam–H
2/CO
2 than the 0.11–0.13 CO
2 selectivity obtained using steam only [
20].
On this basis, the CO2/CO ratios under steam and H2/CO2 can be obtained as follows: (a) 7.4 at 500 °C, (b) 5.9 at 525 °C, (c) 3.0 at 550 °C. Thus, CO2/CO ratios obtained show a decreasing trend with increasing temperature, with this being attributed to the influence of chemical equilibrium conditions for the exothermic water–gas shift reaction.
Furthermore, and for the same runs as reported in
Figure 7a–c,
Figure 8a shows the hydrocarbon product distribution as CH4, C
1+, and coke. One can notice in this respect, as reported in
Figure 8a, that the CH
4 selectivity falls in the 0.045–0.058 range, augmenting with temperature. One can conclude on this basis that co-feeding steam and H
2/CO
2 favors CH
4 formation via the catalytic hydrogenation of the formed methyl radicals. This is the result of both the increased 2M4MP steam cracking and the expected amplified reverse dry reforming, as discussed in
Section 8. In addition,
Figure 8b displays the C
1+ species selectivity, with these selectivities falling in the 0.61–0.76 range. One can notice that at higher thermal levels, there is a beneficial and desirable reduction in C
1+ species selectivity. One should observe as well that C
1+ selectivity values reported in
Figure 8b are comparable with the 0.82–0.87 C
1+ levels obtained under a steam atmosphere by Rojas Chaves et al. [
27].
Finally,
Figure 8c shows the coke yields for the runs described in
Figure 7a–c and
Figure 8a,b. One can notice in
Figure 8c that the coke formed stabilizes at 550 °C, remaining at a low 0.0006–0.00067 gcokegcat-1 (0.06–0.067%) level. These low coke levels are encouraging, given that they show that only a small fraction of about 1/10 of the total catalyst stream is required to be recirculated in the CPG unit, as described in
Figure 2, to be reactivated via combined coke combustion and active nickel species reduction.
One should note that in addition to the carbon-containing product fractions reported in
Figure 7 and
Figure 8, hydrogen was also monitored under steam–H
2/CO
2 blends at 550 °C during 5–10 s reaction times, as described in
Table 11.
Table 11 shows that in all cases, the resulting H
2/CO ratios obtained at 550 °C when using the 15%Ni–5%CeO
2 on γ-Al
2O
3 catalyst stay at 3.8–3.9. These high H
2/CO ratios are anticipated from thermodynamics, as reported in
Section 8. This demonstrates the value of a CPG unit for both tar conversions, as well as to provide syngas with an H
2/CO ratio larger than 2, which is the syngas-required ratio for alcohol production, such as in the case of methanol synthesis.
In summary, the experimental results obtained in the CREC Riser Simulator provide favorable indicators for a CPG process as follows: (a) very high tar 83% conversion; (b) a favorable H
2/CO ratio of 3.8, larger than 2; (c) reduced 0.7 C
1+ selectivity. Thus, the reported results set the stage for the full-scale implementation of an integrated waste biomass gasification process, as described in
Figure 2.
14. Conclusions and Future Perspectives
Waste biomass gasification yields syngas with undesirable tar content and a relatively low H
2/CO ratio. Tar removal can be accomplished via different procedures available. However, there are still barriers to overcome for the commercialization of these technologies, with some of them being (a) low energy efficiency, (b) cost of implementation, (c) environmental impact, (d) health hazards, (e) syngas heating value, (f) process water treatment [
14].
To implement waste biomass gasification, the following significant issues should be addressed, as described in
Figure 2:
Waste biomass gasification requires the integration of various process steps, accounting for thermal balances and thermal efficiency, as well as for the quality of the produced syngas and biochar. The produced syngas should be free of tars and have an H2/CO > 2 quality to be suitable for alcohol synthesis;
Waste biomass gasification needs a process configuration involving circulating fluidized beds. This is the case given the periodic catalyst regeneration and catalyst reduction in the continuous process. Thus, the catalyst used for CPG should have good fluidization properties and exhibit minimum attrition;
Waste biomass gasification requires a CPG catalyst such as the 15%Ni–5%CeO2 on γ-Al2O3 catalyst proposed by CREC–UWO researchers. This catalyst must achieve a high tar conversion while promoting steam hydrocarbon reforming, as well as the water–gas shift reaction, in order to enrich the syngas quality, yielding a hydrogen/CO ratio higher than 2, suitable for alcohol synthesis;
The waste biomass gasification process with the CPG should be designed from reaction engineering principles and be developed with lab-scale data from devices suitable for the evaluation of fluidizable catalysts, such as in the case of the CREC Riser Simulator, which emulates the reaction conditions of a large-scale CPG gasification process.
These issues are addressed in the present review, which examines the encouraging results obtained by CREC–UWO researchers in the area of integrated waste biomass gasification. These positive indicators are obtained via experiments in the CREC Riser Simulator with 0.6 v% 15%Ni–5%CeO2 on γ-Al2O3 catalyst volumetric concentrations. These volumetric concentrations are considered relatively low when compared with the ones expected both in industrial risers and downers, which are in the 2–5 v% range. Thus, it can be predicted that CPG could be significantly improved by using higher volumetric catalyst concentrations (e.g., 5 v%), yielding complete tar removal estimated at 99.7% or greater.
Author Contributions
This manuscript was written with contributions from all the authors. These authors contributed as follows: conceptualization, H.d.L. and F.R.C.; methodology, F.R.C., H.d.L. and N.T.B.; validation, N.T.B., F.R.C. and H.d.L.; investigation, H.d.L., F.R.C. and B.S.R.; resources, H.d.L.; writing—original draft preparation, H.d.L. and N.T.B.; writing—review and editing, H.d.L., B.S.R. and N.T.B.; supervision, H.d.L.; funding acquisition, H.d.L. and B.S.R. All authors have read and agreed to the published version of the manuscript.
Funding
This research was funded by the Natural Sciences and Engineering Research Council (NSERC) of Canada Discovery Grant awarded to H.d.L., and CONACYT-Mexico funding awarded to B.S.R.
Data Availability Statement
The data that support the findings of this study are available from the corresponding author, H.d.L., upon reasonable request.
Acknowledgments
The authors acknowledge the financial support from the NSERC (Natural Sciences and Engineering Research Council) and the Conacyt-Mexico with funds awarded to Hugo de Lasa (HdL NSERC-Canada Discovery Grant) and Benito Serrano Rosales (Conacyt Mexico Researcher Membership), respectively. We would also like to thank Florencia de Lasa, who provided valuable assistance in the editing of this manuscript and preparation of the graphical abstract.
Conflicts of Interest
The authors declare no conflicts of interest.
Notation
| CB% | percentual carbon balance (−) |
| mcoke,TOC | mass of coke as measured with the TOC (Total Organic Carbon) instrument (g) |
| mcatalyst,TOC | mass of catalyst employed in TOC analysis (g) |
| mcoke | mass of coke(g) |
| mcatalyst | mass of catalyst (g) |
| mc,in | mass of carbon “in” contained in various hydrocarbons (g) |
| mc,out | total mass of carbon at the end of a run (g) |
| mco2 | mass of CO2 (g) |
| mHC | mass of hydrocarbons (g) |
| mc,CO2 | mass of carbon in CO2 (g) |
| mc,CO | mass of carbon in CO (g) |
| mc,CH4 | mass of carbon in methane (g) |
| mc, C+1 | mass of carbon for hydrocarbons with a carbon number larger than 1 (g) |
| ni | moles of a generic “i” species (moles) |
| nT | total number of moles (moles) |
| nc,MC | moles of carbon in the surrogate tar compound injected(moles) |
| xcoke,sample | mass fraction of coke in the catalyst sample (−) |
| X% | conversion of tar surrogate contained carbon (%) |
| Yi | molar fractions of various chemical species. |
Appendix A. Tar Surrogate Conversion, Product Selectivity, and Carbon Balances in the CREC Riser Simulator
The tar surrogate conversion and product selectivity can be calculated as follows:
where
X% represents the conversion of the carbon-containing species on a percentual basis, with
yi being the “i” species selectivity,
ni standing for the moles of carbon in the i species,
nT denoting the total moles of carbon in the model compound injected, and
nc,MC representing the moles of carbon of the model compound converted.
When using helium as the carrier gas flow and to obtain the “ni” or the moles of carbon of the “i” species, the following has to be considered, given the GC split of the FID stream and a TCD stream: (a) First step: All hydrocarbon peaks in the FID-GC chromatogram provide peak areas, which are considered proportional to the number of moles of carbon detected by the FID detector. This includes methane, C2, C3, C4s, C5s,C6s, C7s, and C8s; (b) Second Step: By using calibration curves for CO, CO2, and CH4 TCD areas, the moles of CO, CO2 and CH4 and the moles of carbon, are calculated; (c) Step 3: The moles of carbon contained in the CO and CO2 are revised using a 5.5 calibration factor, accounting for the split flow. This was required to set all carbon species on the same measurement scale.
Furthermore, to determine the mass of carbon contained in the various gas products, the moles of every “i” species are multiplied by the factor of 12. Summation of all these masses yields the total mass of carbon contained in the 1 mL of the 6PV sample loop. Thus, to assess
mc,out, the total mass of the species in the vacuum bottle, the mass contained in the 1 mL sample loop has to be multiplied by a 1060 factor as follows:
Coke was measured using a TOC (Total Organic Carbon) Analyzer. The TOC provides the amount of coke as a fraction of the catalyst weight. Thus, multiplying this fraction of coke by the catalyst amount in this experiment yields the total weight of coke produced in a run as follows:
with
xcoke,TOC being the fraction of coke on the catalyst sample determined by the TOC analysis,
mcoke representing the total mass of coke on the catalyst,
mcoke,TOC standing for the mass of coke calculated via TOC analysis, and
mcatalsyst,TOC denoting the mass of catalyst used during the TOC analysis.
Given all of the above, the
mcoke was added to the
mc,out and compared with the total mass of carbon fed, as follows:
with CB% being the carbon balance closure expressed on a percentage basis, and
mc,in representing the mass of carbon injected into the system.
References
- Schmid, J.C.; Benedikt, F.; Fuchs, J.; Mauerhofer, A.M.; Müller, S.; Hofbauer, H. Syngas for Biorefineries from Thermochemical Gasification of Lignocellulosic Fuels and Residues—5 Years’ Experience with an Advanced Dual Fluidized Bed Gasifier Design. Biomass Convers. Biorefinery 2021, 11, 2405–2442. [Google Scholar] [CrossRef]
- Maitlo, G.; Ali, I.; Mangi, K.H.; Ali, S.; Maitlo, H.A.; Unar, I.N.; Pirzada, A.M. Thermochemical Conversion of Biomass for Syngas Production: Current Status and Future Trends. Sustainability 2022, 14, 2596. [Google Scholar] [CrossRef]
- Hashemisohi, A.; Wang, L.; Shahbazi, A. Numerical Analysis of Tar and Syngas Formation during the Steam Gasification of Biomass in a Fluidized Bed. Energies 2023, 16, 5283. [Google Scholar] [CrossRef]
- Galadima, A.; Masudi, A.; Muraza, O. Catalyst Development for Tar Reduction in Biomass Gasification: Recent Progress and the Way Forward. J. Environ. Manag. 2022, 305, 114274. [Google Scholar] [CrossRef] [PubMed]
- Luo, X.; Wu, T.; Shi, K.; Song, M.; Rao, Y. Biomass Gasification: An Overview of Technological Barriers and Socio-Environmental Impact. In Gasification for Low-Grade Feedstock; IntechOpen: London, UK, 2018; pp. 1–15. [Google Scholar] [CrossRef]
- Narnaware, S.L.; Panwar, N. Catalysts and Their Role in Biomass Gasification and Tar Abetment: A Review. Biomass Convers. Biorefinery 2021, 11, 1–31. [Google Scholar] [CrossRef]
- Puig-Gamero, M.; Pio, D.; Tarelho, L.A.; Sánchez, P.; Sanchez-Silva, L. Simulation of Biomass Gasification in Bubbling Fluidized Bed Reactor Using Aspen Plus®. Energy Convers. Manag. 2021, 235, 113981. [Google Scholar] [CrossRef]
- Feng, D.; Zhang, Y.; Zhao, Y.; Sun, S. Mechanism of In-Situ Catalytic Cracking of Biomass Tar over Biochar with Multiple Active Sites. In Applications of Biochar for Environmental Safety; A. Abdelhafez, A., H.H. Abbas, M., Eds.; IntechOpen: London, UK, 2020; ISBN 978-1-78985-895-2. [Google Scholar]
- Cortazar, M.; Santamaria, L.; Lopez, G.; Alvarez, J.; Zhang, L.; Wang, R.; Bi, X.; Olazar, M. A Comprehensive Review of Primary Strategies for Tar Removal in Biomass Gasification. Energy Convers. Manag. 2023, 276, 116496. [Google Scholar] [CrossRef]
- Chandraratne, M.R.; Daful, A.G. Recent Advances in Thermochemical Conversion. In Recent Perspectives in Pyrolysis Research; IntechOpen: London, UK, 2022; p. 145. [Google Scholar] [CrossRef]
- De Darwent, B. Bond Dissociation Energies in Simple Molecules. NSRDS-NBS 31; U.S. Department of Commerce, National Bureau of Standards: Gaithersburg, MD, USA, 1970. [Google Scholar] [CrossRef]
- Sansaniwal, S.; Pal, K.; Rosen, M.; Tyagi, S. Recent Advances in the Development of Biomass Gasification Technology: A Comprehensive Review. Renew. Sustain. Energy Rev. 2017, 72, 363–384. [Google Scholar] [CrossRef]
- Nunes, L.J. Biomass Gasification as an Industrial Process with Effective Proof-of-Concept: A Comprehensive Review on Technologies, Processes and Future Developments. Results Eng. 2022, 14, 100408. [Google Scholar] [CrossRef]
- Maniatis, K.; Beenackers, A. Tar Protocols. IEA Bioenergy Gasification Task. Biomass Bioenergy 2000, 18, 1–4. [Google Scholar] [CrossRef]
- Milne, T.A.; Evans, R.J.; Abatzaglou, N. Biomass Gasifier”Tars”: Their Nature, Formation, and Conversion; US Department of Energy: Washington, DC, USA, 1998. [Google Scholar] [CrossRef]
- Lotfi, S.; Ma, W.; Tunney, J.; Du, N. Technologies for Tar Removal from Biomass-Derived Syngas. Pet. Petrochem. Eng. J. 2021, 5, 1–35. [Google Scholar] [CrossRef]
- Rios, M.L.V.; González, A.M.; Lora, E.E.S.; del Olmo, O.A.A. Reduction of Tar Generated during Biomass Gasification: A Review. Biomass Bioenergy 2018, 108, 345–370. [Google Scholar] [CrossRef]
- Zwart, R.W.R. Gas Cleaning Downstream Biomass Gasification. Status Report 2009; Energy research Centre of the Netherlands ECN, Petten: Maartensvlotbrug, The Netherlands, 2009. [Google Scholar]
- Guan, G.; Kaewpanha, M.; Hao, X.; Abudula, A. Catalytic Steam Reforming of Biomass Tar: Prospects and Challenges. Renew. Sustain. Energy Rev. 2016, 58, 450–461. [Google Scholar] [CrossRef]
- Chaves, F.R. Conversion of Biomass Derived Tar in a Catalytic Post-Gasification Process. Master’s Thesis, Master of Engineering Science, Western University, London, UK, 2023. [Google Scholar]
- Ruivo, L.C.; Gomes, H.; Lopes, D.V.; Yaremchenko, A.A.; Vilas-Boas, C.; Tarelho, L.A.; Frade, J.R. Catalytic O2-Steam Gasification of Biomass over Fe2−xMnxO3 Oxides Supported on Ceramic Foam Filters. Fuel 2022, 324, 124566. [Google Scholar] [CrossRef]
- Papa, A.A.; Savuto, E.; Di Carlo, A.; Tacconi, A.; Rapagnà, S. Synergic Effects of Bed Materials and Catalytic Filter Candle for the Conversion of Tar during Biomass Steam Gasification. Energies 2023, 16, 595. [Google Scholar] [CrossRef]
- Kurkela, E.; Kurkela, M.; Hiltunen, I. Pilot-Scale Development of Pressurized Fixed-Bed Gasification for Synthesis Gas Production from Biomass Residues. Biomass Convers. Biorefinery 2023, 13, 6553–6574. [Google Scholar] [CrossRef]
- Tian, Y.; Du, J.; Luo, Z.; He, D.; Ma, W.; Zhou, X.; Liang, S.; Yuan, L. Kinetic Study on Biomass Gasification Coupled with Tar Reforming for Syngas Production. Biomass Convers. Biorefinery 2024, 14, 28377–28385. [Google Scholar] [CrossRef]
- Li, B.; Mbeugang, C.F.M.; Huang, Y.; Liu, D.; Wang, Q.; Zhang, S. A Review of CaO Based Catalysts for Tar Removal during Biomass Gasification. Energy 2022, 244, 123172. [Google Scholar] [CrossRef]
- Tang, W.; Cao, J.-P.; He, Z.-M.; Jiang, W.; Wang, Z.-H.; Zhao, X.-Y. Recent Progress of Catalysts for Reforming of Biomass Tar/Tar Models at Low Temperatures–A Short Review. ChemCatChem 2023, 15, e202300581. [Google Scholar] [CrossRef]
- Chaves, F.R.; Brauer, N.T.; Torres, C.; de Lasa, H. Conversion of Biomass-Derived Tars in a Fluidized Catalytic Post-Gasification Process. Catalysts 2024, 14, 202. [Google Scholar] [CrossRef]
- Ramadhani, B.; Kivevele, T.; Kihedu, J.H.; Jande, Y.A. Catalytic Tar Conversion and the Prospective Use of Iron-Based Catalyst in the Future Development of Biomass Gasification: A Review. Biomass Convers. Biorefinery 2022, 12, 1369–1392. [Google Scholar] [CrossRef]
- Chen, W.; Xi, B.; Ye, M.; Li, M.; Hou, J.; Wei, Y.; Yu, C.; Meng, F.; Dai, X. Nickel Doped Enhanced LaFeO3 Catalytic Cracking of Tar for Hydrogen Production. J. Anal. Appl. Pyrolysis 2024, 183, 106825. [Google Scholar] [CrossRef]
- Abidin, S.Z.; Osazuwa, O.U.; Othman, N.H.; Setiabudi, H.D.; Sulaiman, S. Recent Progress on Catalyst Development in Biomass Tar Steam Reforming: Toluene as a Biomass Tar Model Compound. Biomass Convers. Biorefinery 2024, 14, 15187–15222. [Google Scholar] [CrossRef]
- Zhang, L.; Xu, C.C.; Champagne, P. Overview of Recent Advances in Thermo-Chemical Conversion of Biomass. Energy Convers. Manag. 2010, 51, 969–982. [Google Scholar] [CrossRef]
- Jang, W.-J.; Shim, J.-O.; Kim, H.-M.; Yoo, S.-Y.; Roh, H.-S. A Review on Dry Reforming of Methane in Aspect of Catalytic Properties. Catal. Today 2019, 324, 15–26. [Google Scholar] [CrossRef]
- Ren, J.; Cao, J.-P.; Zhao, X.-Y. Fabrication Strategies of Ni-Based Catalysts in Reforming of Biomass Tar/Tar Model Compounds. Appl. Energy Combust. Sci. 2022, 9, 100053. [Google Scholar] [CrossRef]
- Devi, L.; Ptasinski, K.J.; Janssen, F.J.; van Paasen, S.V.; Bergman, P.C.; Kiel, J.H. Catalytic Decomposition of Biomass Tars: Use of Dolomite and Untreated Olivine. Renew. Energy 2005, 30, 565–587. [Google Scholar] [CrossRef]
- Islam, M.W. A Review of Dolomite Catalyst for Biomass Gasification Tar Removal. Fuel 2020, 267, 117095. [Google Scholar] [CrossRef]
- Ekeoma, B.C.; Yusuf, M.; Johari, K.; Abdullah, B. Mesoporous Silica Supported Ni-Based Catalysts for Methane Dry Reforming: A Review of Recent Studies. Int. J. Hydrogen Energy 2022, 47, 41596–41620. [Google Scholar] [CrossRef]
- Ngo, T.N.L.T.; Chiang, K.-Y.; Liu, C.-F.; Chang, Y.-H.; Wan, H.-P. Hydrogen Production Enhancement Using Hot Gas Cleaning System Combined with Prepared Ni-Based Catalyst in Biomass Gasification. Int. J. Hydrogen Energy 2021, 46, 11269–11283. [Google Scholar] [CrossRef]
- Ashok, J.; Dewangan, N.; Das, S.; Hongmanorom, P.; Wai, M.H.; Tomishige, K.; Kawi, S. Recent Progress in the Development of Catalysts for Steam Reforming of Biomass Tar Model Reaction. Fuel Process. Technol. 2020, 199, 106252. [Google Scholar] [CrossRef]
- Ren, J.; Liu, Y.-L.; Zhao, X.-Y.; Cao, J.-P. Biomass Thermochemical Conversion: A Review on Tar Elimination from Biomass Catalytic Gasification. J. Energy Inst. 2020, 93, 1083–1098. [Google Scholar] [CrossRef]
- Zhang, Z.; Liu, L.; Shen, B.; Wu, C. Preparation, Modification and Development of Ni-Based Catalysts for Catalytic Reforming of Tar Produced from Biomass Gasification. Renew. Sustain. Energy Rev. 2018, 94, 1086–1109. [Google Scholar] [CrossRef]
- Gao, N.; Salisu, J.; Quan, C.; Williams, P. Modified Nickel-Based Catalysts for Improved Steam Reforming of Biomass Tar: A Critical Review. Renew. Sustain. Energy Rev. 2021, 145, 111023. [Google Scholar] [CrossRef]
- Kim, H.Y.; Henkelman, G. CO Oxidation at the Interface of Au Nanoclusters and the Stepped-CeO2(111) Surface by the Mars–van Krevelen Mechanism. J. Phys. Chem. Lett. 2013, 4, 216–221. [Google Scholar] [CrossRef]
- Huang, W. Oxide Nanocrystal Model Catalysts. Acc. Chem. Res. 2016, 49, 520–527. [Google Scholar] [CrossRef] [PubMed]
- Bartholomew, C.H. Mechanisms of Catalyst Deactivation. Appl. Catal. A Gen. 2001, 212, 17–60. [Google Scholar] [CrossRef]
- Zhou, J.; Zhao, J.; Zhang, J.; Zhang, T.; Ye, M.; Liu, Z. Regeneration of Catalysts Deactivated by Coke Deposition: A Review. Chin. J. Catal. 2020, 41, 1048–1061. [Google Scholar] [CrossRef]
- Papadopoulou, C.; Matralis, H.; Verykios, X. Utilization of Biogas as a Renewable Carbon Source: Dry Reforming of Methane. In Catalysis for Alternative Energy Generation; Guczi, L., Erdôhelyi, A., Eds.; Springer: New York, NY, USA, 2012; pp. 57–127. ISBN 978-1-4614-0343-2. [Google Scholar]
- Ochoa, A.; Arregi, A.; Amutio, M.; Gayubo, A.G.; Olazar, M.; Bilbao, J.; Castaño, P. Coking and Sintering Progress of a Ni Supported Catalyst in the Steam Reforming of Biomass Pyrolysis Volatiles. Appl. Catal. B Environ. 2018, 233, 289–300. [Google Scholar] [CrossRef]
- de Lasa, H. The CREC Fluidized Riser Simulator a Unique Tool for Catalytic Process Development. Catalysts 2022, 12, 888. [Google Scholar] [CrossRef]
- Nishikawa, J.; Nakamura, K.; Asadullah, M.; Miyazawa, T.; Kunimori, K.; Tomishige, K. Catalytic Performance of Ni/CeO2/Al2O3 Modified with Noble Metals in Steam Gasification of Biomass. Catal. Today 2008, 131, 146–155. [Google Scholar] [CrossRef]
- Marinho, A.L.; Toniolo, F.S.; Noronha, F.B.; Epron, F.; Duprez, D.; Bion, N. Highly Active and Stable Ni Dispersed on Mesoporous CeO2-Al2O3 Catalysts for Production of Syngas by Dry Reforming of Methane. Appl. Catal. B Environ. 2021, 281, 119459. [Google Scholar] [CrossRef]
- Sepehri, S.; Rezaei, M. Ce Promoting Effect on the Activity and Coke Formation of Ni Catalysts Supported on Mesoporous Nanocrystalline γ-Al2O3 in Autothermal Reforming of Methane. Int. J. Hydrog. Energy 2017, 42, 11130–11138. [Google Scholar] [CrossRef]
- Chan, F.L.; Tanksale, A. Review of Recent Developments in Ni-Based Catalysts for Biomass Gasification. Renew. Sustain. Energy Rev. 2014, 38, 428–438. [Google Scholar] [CrossRef]
- Chen, J.; Wang, R.; Zhang, J.; He, F.; Han, S. Effects of Preparation Methods on Properties of Ni/CeO2–Al2O3 Catalysts for Methane Reforming with Carbon Dioxide. J. Mol. Catal. A Chem. 2005, 235, 302–310. [Google Scholar] [CrossRef]
- Liu, H.; Zou, X.; Wang, X.; Lu, X.; Ding, W. Effect of CeO2 Addition on Ni/Al2O3 Catalysts for Methanation of Carbon Dioxide with Hydrogen. J. Nat. Gas Chem. 2012, 21, 703–707. [Google Scholar] [CrossRef]
- Yang, C.; Lu, Y.; Zhang, L.; Kong, Z.; Yang, T.; Tao, L.; Zou, Y.; Wang, S. Defect Engineering on CeO2-Based Catalysts for Heterogeneous Catalytic Applications. Small Struct. 2021, 2, 2100058. [Google Scholar] [CrossRef]
- Wang, S.; Lu, G.M. Role of CeO2 in Ni/CeO2–Al2O3 Catalysts for Carbon Dioxide Reforming of Methane. Appl. Catal. B Environ. 1998, 19, 267–277. [Google Scholar] [CrossRef]
- Morterra, C.; Bolis, V.; Magnacca, G. Surface Characterization of Modified Aluminas. Part 4.—Surface Hydration and Lewis Acidity of CeO2–Al2O3 Systems. J. Chem. Soc. Faraday Trans. 1996, 92, 1991–1999. [Google Scholar] [CrossRef]
- Farooq, M.; Ramli, A.; Subbarao, D. Physiochemical Properties of γ-Al2O3–MgO and γ-Al2O3–CeO2 Composite Oxides. J. Chem. Eng. Data 2012, 57, 26–32. [Google Scholar] [CrossRef]
- Bereketidou, O.; Goula, M. Biogas Reforming for Syngas Production over Nickel Supported on Ceria–Alumina Catalysts. Catal. Today 2012, 195, 93–100. [Google Scholar] [CrossRef]
- Luisetto, I.; Tuti, S.; Battocchio, C.; Mastro, S.L.; Sodo, A. Ni/CeO2–Al2O3 Catalysts for the Dry Reforming of Methane: The Effect of CeAlO3 Content and Nickel Crystallite Size on Catalytic Activity and Coke Resistance. Appl. Catal. A Gen. 2015, 500, 12–22. [Google Scholar] [CrossRef]
- Santamaria, L.; Artetxe, M.; Lopez, G.; Cortazar, M.; Amutio, M.; Bilbao, J.; Olazar, M. Effect of CeO2 and MgO Promoters on the Performance of a Ni/Al2O3 Catalyst in the Steam Reforming of Biomass Pyrolysis Volatiles. Fuel Process. Technol. 2020, 198, 106223. [Google Scholar] [CrossRef]
- Meshksar, M.; Farsi, M.; Rahimpour, M.R. Effect of Ni Active Site Position and Synthesis Route on Activity, Stability, and Morphology of Ce Promoted Ni/Al2O3 Catalyst for Clean H2 Production. J. Environ. Chem. Eng. 2022, 10, 108471. [Google Scholar] [CrossRef]
- Chein, R.-Y.; Fung, W.-Y. Syngas Production via Dry Reforming of Methane over CeO2 Modified Ni/Al2O3 Catalysts. Int. J. Hydrogen Energy 2019, 44, 14303–14315. [Google Scholar] [CrossRef]
- Couto, N.; Rouboa, A.; Silva, V.; Monteiro, E.; Bouziane, K. Influence of the Biomass Gasification Processes on the Final Composition of Syngas. Energy Procedia 2013, 36, 596–606. [Google Scholar] [CrossRef]
- Salaices, E.; Serrano, B.; de Lasa, H. Biomass Catalytic Steam Gasification Thermodynamics Analysis and Reaction Experiments in a CREC Riser Simulator. Ind. Eng. Chem. Res. 2010, 49, 6834–6844. [Google Scholar] [CrossRef]
- Mazumder, J.; de Lasa, H.I. Catalytic Steam Gasification of Biomass Surrogates: Thermodynamics and Effect of Operating Conditions. Chem. Eng. J. 2016, 293, 232–242. [Google Scholar] [CrossRef]
- Adnan, M.A.; Muraza, O.; Razzak, S.A.; Hossain, M.M.; de Lasa, H.I. Iron Oxide over Silica-Doped Alumina Catalyst for Catalytic Steam Reforming of Toluene as a Surrogate Tar Biomass Species. Energy Fuels 2017, 31, 7471–7481. [Google Scholar] [CrossRef]
- Bastos, A.K.; Torres, C.; Mazumder, A.; de Lasa, H. CO2 Biomass Fluidized Gasification. Thermodynamic and Reactivity Studies. Can. J. Chem. Eng. 2018, 96, 2176–2184. [Google Scholar] [CrossRef]
- Torres, C.; Rostom, S.; de Lasa, H. An Eco-Friendly Fluidizable FexOy/CaO-γ-Al2O3 Catalyst for Tar Cracking during Biomass Gasification. Catalysts 2020, 10, 806. [Google Scholar] [CrossRef]
- Hernandez, A.R.C.; Castañeda, D.G.G.; Enriquez, A.S.; de Lasa, H.; Rosales, B.S. Ru-Promoted Ni/γ-Al2O3 Fluidized Catalyst for Biomass Gasification. Catalysts 2020, 10, 316. [Google Scholar] [CrossRef]
- Adnan, M.A.; Adamu, S.; Muraza, O.; Hossain, M.M. Fluidizable NiO–Fe2O3/SiO2–γAl2O3 for Tar (Toluene) Conversion in Biomass Gasification. Process Saf. Environ. Prot. 2018, 116, 754–762. [Google Scholar] [CrossRef]
- Adnan, M.A.; Hidayat, A.; Ajumobi, O.O.; Adamu, S.; Muraza, O.; Hossain, M.M. Fluidizable Fe–Co/Ce–ZrO2 Catalysts for Steam Reforming of Toluene as a Tar Surrogate in Biomass Gasification. Energy Fuels 2018, 32, 12833–12842. [Google Scholar] [CrossRef]
- Adamu, S.; Hossain, M.M. Kinetics of Steam Gasification of Glucose as a Biomass Surrogate over Ni/Ce–Mesoporous Al2O3 in a Fluidized Bed Reactor. Ind. Eng. Chem. Res. 2018, 57, 3128–3137. [Google Scholar] [CrossRef]
- Adamu, S.; Xiong, Q.; Bakare, I.A.; Hossain, M.M. Ni/CeAl2O3 for Optimum Hydrogen Production from Biomass/Tar Model Compounds: Role of Support Type and Ceria Modification on Desorption Kinetics. Int. J. Hydrog. Energy 2019, 44, 15811–15822. [Google Scholar] [CrossRef]
- Bin Sulayman, A.; Brauer, N.T.; de Lasa, H. A Fluidizable Catalyst for N-Butane Oxidative Dehydrogenation under Oxygen-Free Reaction Conditions. Catalysts 2023, 13, 1462. [Google Scholar] [CrossRef]
- Bin Sulayman, A.; de Lasa, H. A Kinetic Model for Catalytic N-Butane Oxidative Dehydrogenation under Oxygen-Free Reaction Conditions in a Fluidized CREC Riser Simulator. Catalysts 2024, 14, 505. [Google Scholar] [CrossRef]
- de Lasa, H.; Brauer, N.T. Biomass-Derived Syngas Chemical Looping Combustion Using Fluidizable Oxygen Carriers: A Review. Processes 2025, 13, 1053. [Google Scholar] [CrossRef]
- Hernandez, A.R.C.; Rosales, B.S.; de Lasa, H. Kinetic Model of Catalytic Steam Gasification of 2-Methoxy-4-Methylphenol Using 5% Ni–0.25% Ru/γAl2O3 in a CREC-Riser Simulator. Catalysts 2022, 12, 282. [Google Scholar] [CrossRef]
| Disclaimer/Publisher’s Note: The statements, opinions and data contained in all publications are solely those of the individual author(s) and contributor(s) and not of MDPI and/or the editor(s). MDPI and/or the editor(s) disclaim responsibility for any injury to people or property resulting from any ideas, methods, instructions or products referred to in the content. |
© 2025 by the authors. Licensee MDPI, Basel, Switzerland. This article is an open access article distributed under the terms and conditions of the Creative Commons Attribution (CC BY) license (https://creativecommons.org/licenses/by/4.0/).


