Article

Support Effects on Fe- or Cu-Promoted Ni Catalysts Used in the Catalytic Deoxygenation of Tristearin to Fuel-like Hydrocarbons

1
Center for Applied Energy Research, University of Kentucky, Lexington, KY 40511, USA
2
Department of Chemistry, University of Kentucky, Lexington, KY 40506, USA
3
Université Bourgogne Europe, CNRS, Laboratoire Interdisciplinaire Carnot de Bourgogne ICB UMR 6303, 21000 Dijon, France
*
Author to whom correspondence should be addressed.
Catalysts 2025, 15(5), 501; https://doi.org/10.3390/catal15050501
Submission received: 24 April 2025 / Revised: 16 May 2025 / Accepted: 18 May 2025 / Published: 21 May 2025

Abstract

:
Previous studies have shown that fats, oils, and greases (FOG) can be deoxygenated to fuel-like hydrocarbons over inexpensive alumina-supported Ni catalysts promoted with Cu or Fe to afford excellent yields of renewable diesel (RD). In this study, supports other than alumina—namely, SiO2-Al2O3, Ce0.8Pr0.2O2, and ZrO2—were investigated to develop catalysts showing improved RD yields and resistance to coke-induced deactivation relative to Al2O3-supported catalysts. Results showed that catalysts supported on Ce0.8Pr0.2O2 and ZrO2 outperformed SiO2-Al2O3-supported formulations, with 20%Ni-5%Fe/ZrO2 affording a quantitative yield of diesel-like hydrocarbons. Notably, the abundance of weak acid sites varied considerably across the different supports, and a moderate concentration of these sites corresponded with the best results. Additionally, temperature-programmed reduction measurements revealed that Ni reduction is greatly dependent on both the identity of the promoter and catalyst support, which can also be invoked to explain catalyst performance since metallic Ni is identified as the likely active site for the deoxygenation reaction. It was also observed that Ce0.8Pr0.2O2 provides high oxygen storage capacity and oxygen mobility/accessibility, which also improves catalyst activity.

Graphical Abstract

1. Introduction

Renewable diesel (RD) generated from the catalytic deoxygenation of fats, oils, and greases (FOG) is chemically indistinguishable from petroleum-derived diesel and offers several advantages over both biodiesel and petrodiesel, including better performance and reduced emissions [1]. These characteristics make RD an excellent drop-in hydrocarbon biofuel for diesel engines. Apart from platinum group metals (PGM) like Pt and Pd, Ni-based catalysts have proven very effective for the deoxygenation of FOG to diesel-like hydrocarbons via decarboxylation/decarbonylation (deCOx) [2,3,4,5]. In addition to the active metal phase, other catalyst components such as the catalyst support and promoters are essential, owing to their ability to also enhance catalytic performance during the deoxygenation of FOG [1,6]. Indeed, several studies have investigated the interactions between active metal phases, promoters, and catalyst supports, as well as how these interactions influence catalyst performance in the conversion of FOG to fuel-like hydrocarbons [4,7,8,9].
Regarding the active metal phase, a preliminary deCOx catalyst screening study performed by Snåre et al. revealed the superior performance of PGM among catalysts with the same metal loading, with a 5%Pd/C catalyst affording the best result over 5%Ni/C in the conversion of stearic acid [10]. However, Crocker and co-workers analyzed the performance of three different catalysts—1 wt% Pt/C, 5 wt% Pd/C, and 20 wt% Ni/C—for the conversion of soybean oil, and the results showed that the Ni catalyst achieved a high conversion of 92%, while the Pt and Pd catalysts displayed lower conversions of 23% and 30% respectively [11]. This confirms that Ni catalysts at higher loadings can outperform PGMs in the deoxygenation of FOG. As for the effect of promoters, bimetallic formulations have attracted attention for their superior performance compared to their monometallic counterparts. For instance, in a study by Loe et al., 20 wt% Ni/Al2O3 and 20 wt% Ni-5 wt% Cu/Al2O3 catalysts were utilized in the deoxygenation of tristearin. The results showed that while 20 wt% Ni/Al2O3 displayed a conversion of 27% and a selectivity to C17 of 63%, 20 wt% Ni-5 wt% Cu/Al2O3 achieved conversion and C17 selectivity values of 97% and 71%, respectively [12].
With respect to the catalyst supports, Gosselink et al. improved the deoxygenation activity of carbon-supported catalysts by enhancing the properties of the carrier with polarized functional groups [13]. In addition to their tunability, the improved performance of carbonaceous supports has been attributed to their large surface area (>500 m2/g) [14]; however, carbon-supported catalysts are disfavored due to the difficulty associated with their regeneration from coke-induced deactivation. As a result, metal oxides represent better support for deCOx catalysts, since they facilitate the regeneration of coked formulations via calcination in hot air [14]. Saliently, Lercher and co-workers reported the performance of catalysts comprising reducible oxidic supports such as ZrO2 and CeO2 [15]. In their study, 10wt% Ni on these reducible supports was tested in the conversion of stearic acid, achieving quantitative conversion and C17 selectivity as high as 96%. In contrast, non-reducible supports such as Al2O3 and SiO2 achieved lower conversions of 63% and 45%, respectively. Albeit SiO2 has been reported to be a poor support for Ni-based deCOx catalysts [16,17], it has proven to be a good support for Pd- and Ni-Pd-based catalysts. This indicates that although support effects depend on the nature of the active phase [18], reducible oxides with high surface area and moderate acidity are most suitable for deCOx catalysts [14,19,20,21]. In this study, supports other than Al2O3—namely, Ce0.8Pr0.2O2, SiO2-Al2O3, and ZrO2—were used to prepare deCOx catalysts with improved renewable diesel yield and resistance to coke-induced deactivation, focusing on the most promising bimetallic active phases (Ni-Cu and Ni-Fe) identified in previous studies. Based on the latter, Ni-Cu and Ni-Fe catalysts were prepared to target metal loadings of 20 wt% Ni and 5 wt% Cu or Fe to afford the following formulations: 20% Ni-5% Cu/Ce0.8Pr0.2O2 (NCC), 20% Ni-5% Fe/Ce0.8Pr0.2O2 (NFC), 20% Ni-5% Cu/SiO2-Al2O3 (NCSA), 20% Ni-5% Fe/SiO2-Al2O3 (NFSA), 20% Ni-5% Cu/ZrO2 (NCZ), and 20% Ni-5% Fe/ZrO2 (NFZ). Additionally, several catalyst characterization methods (including N₂-physisorption, X-ray diffraction, transmission electron microscopy, and temperature-programmed technique) were employed to elucidate metal-support interactions and structure-activity relationships.

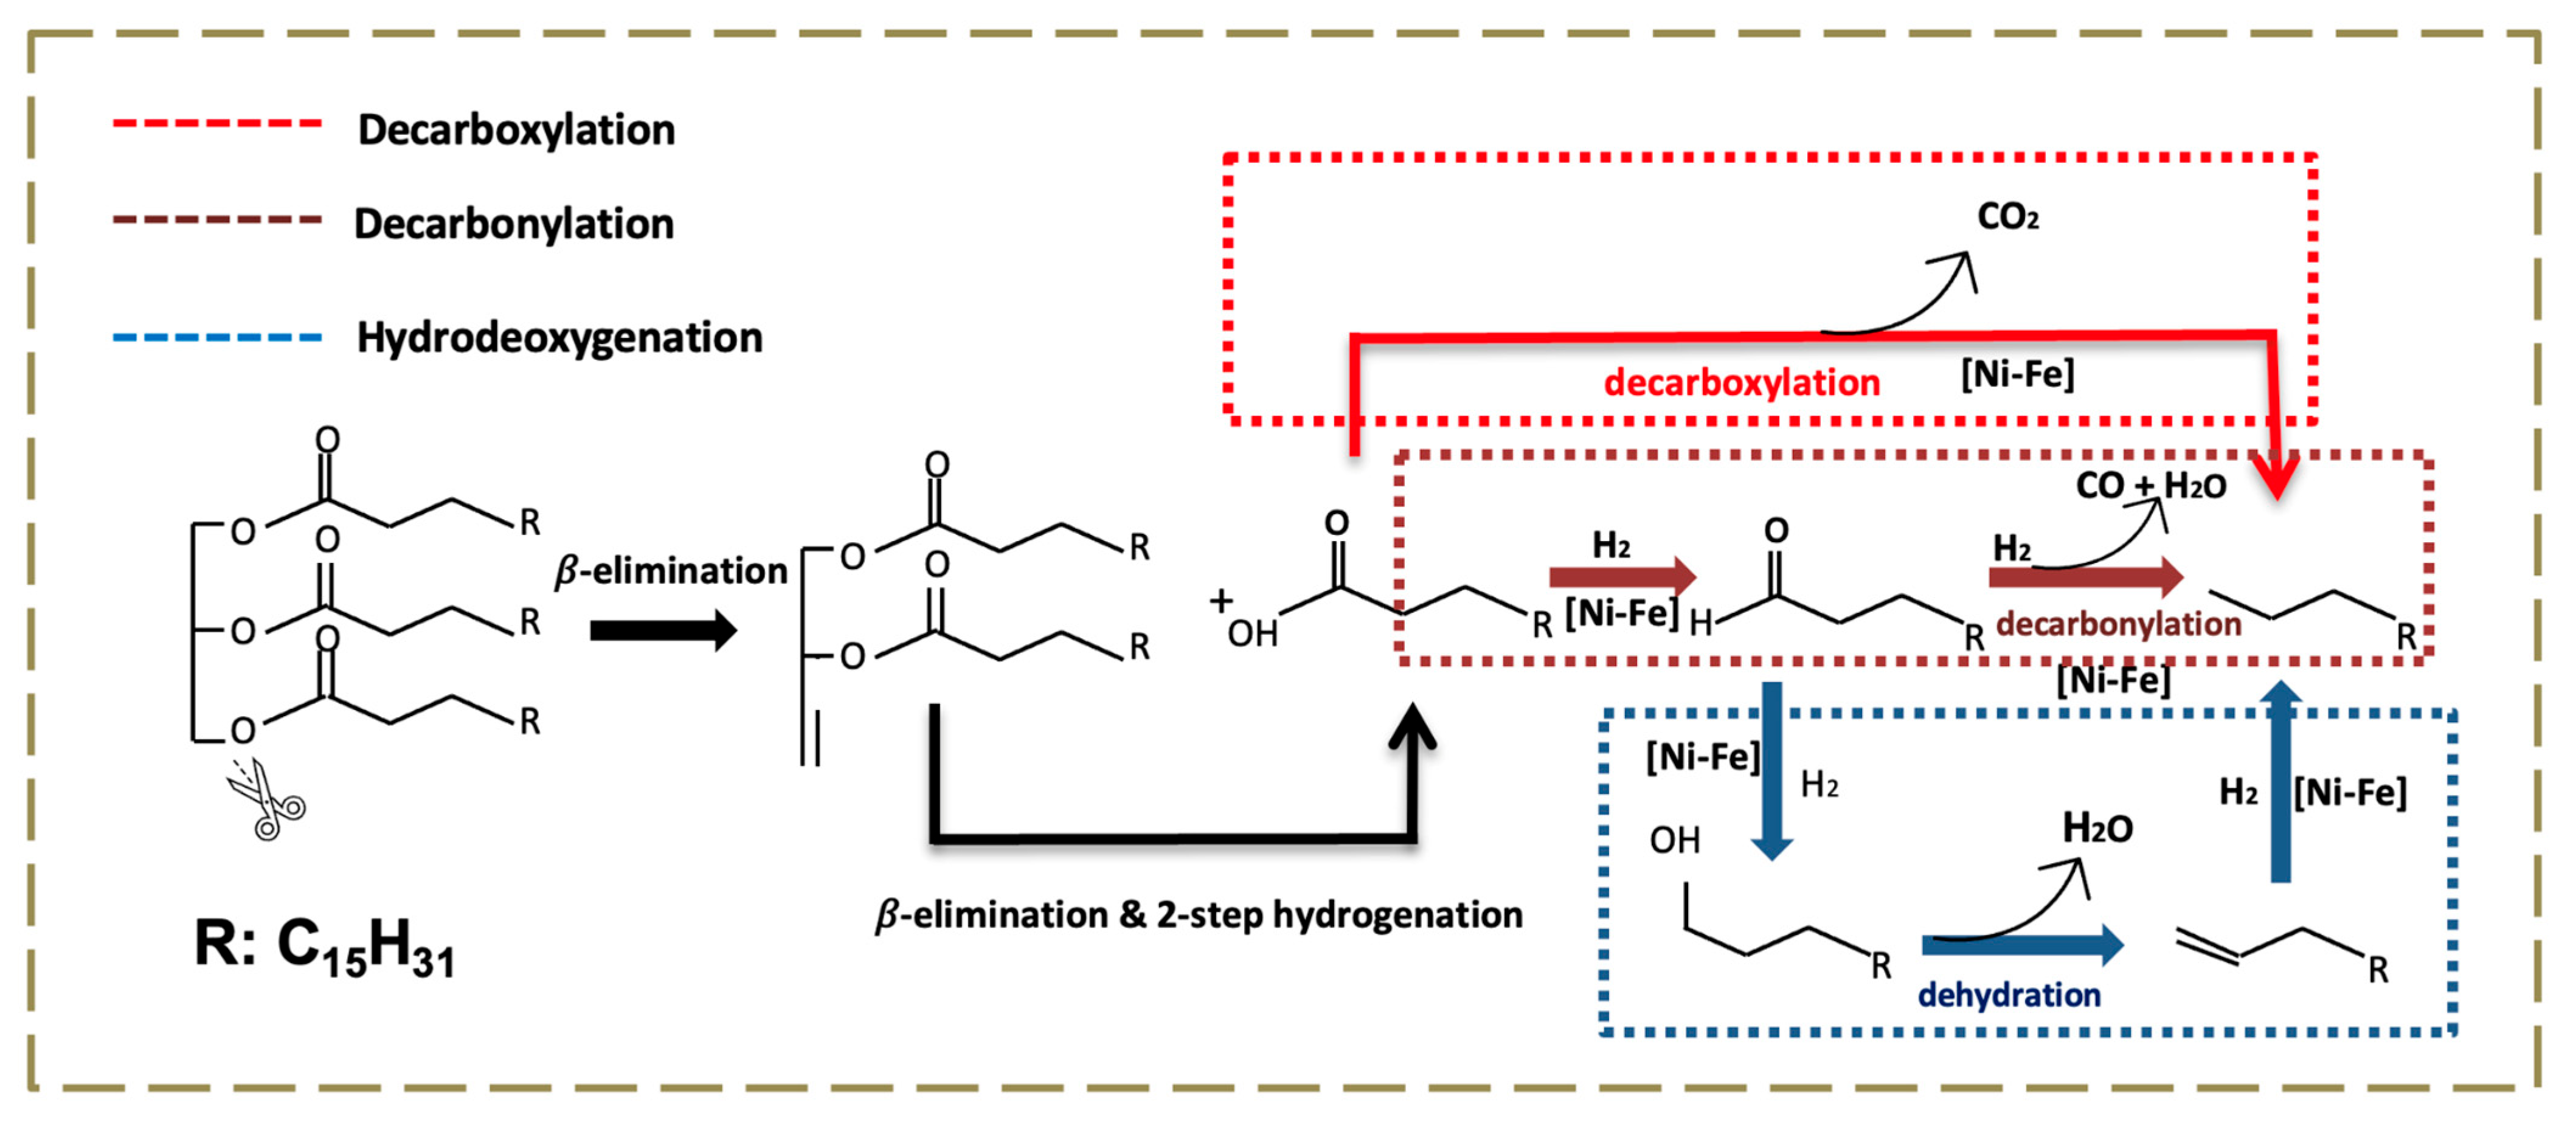
2. Results and Discussion

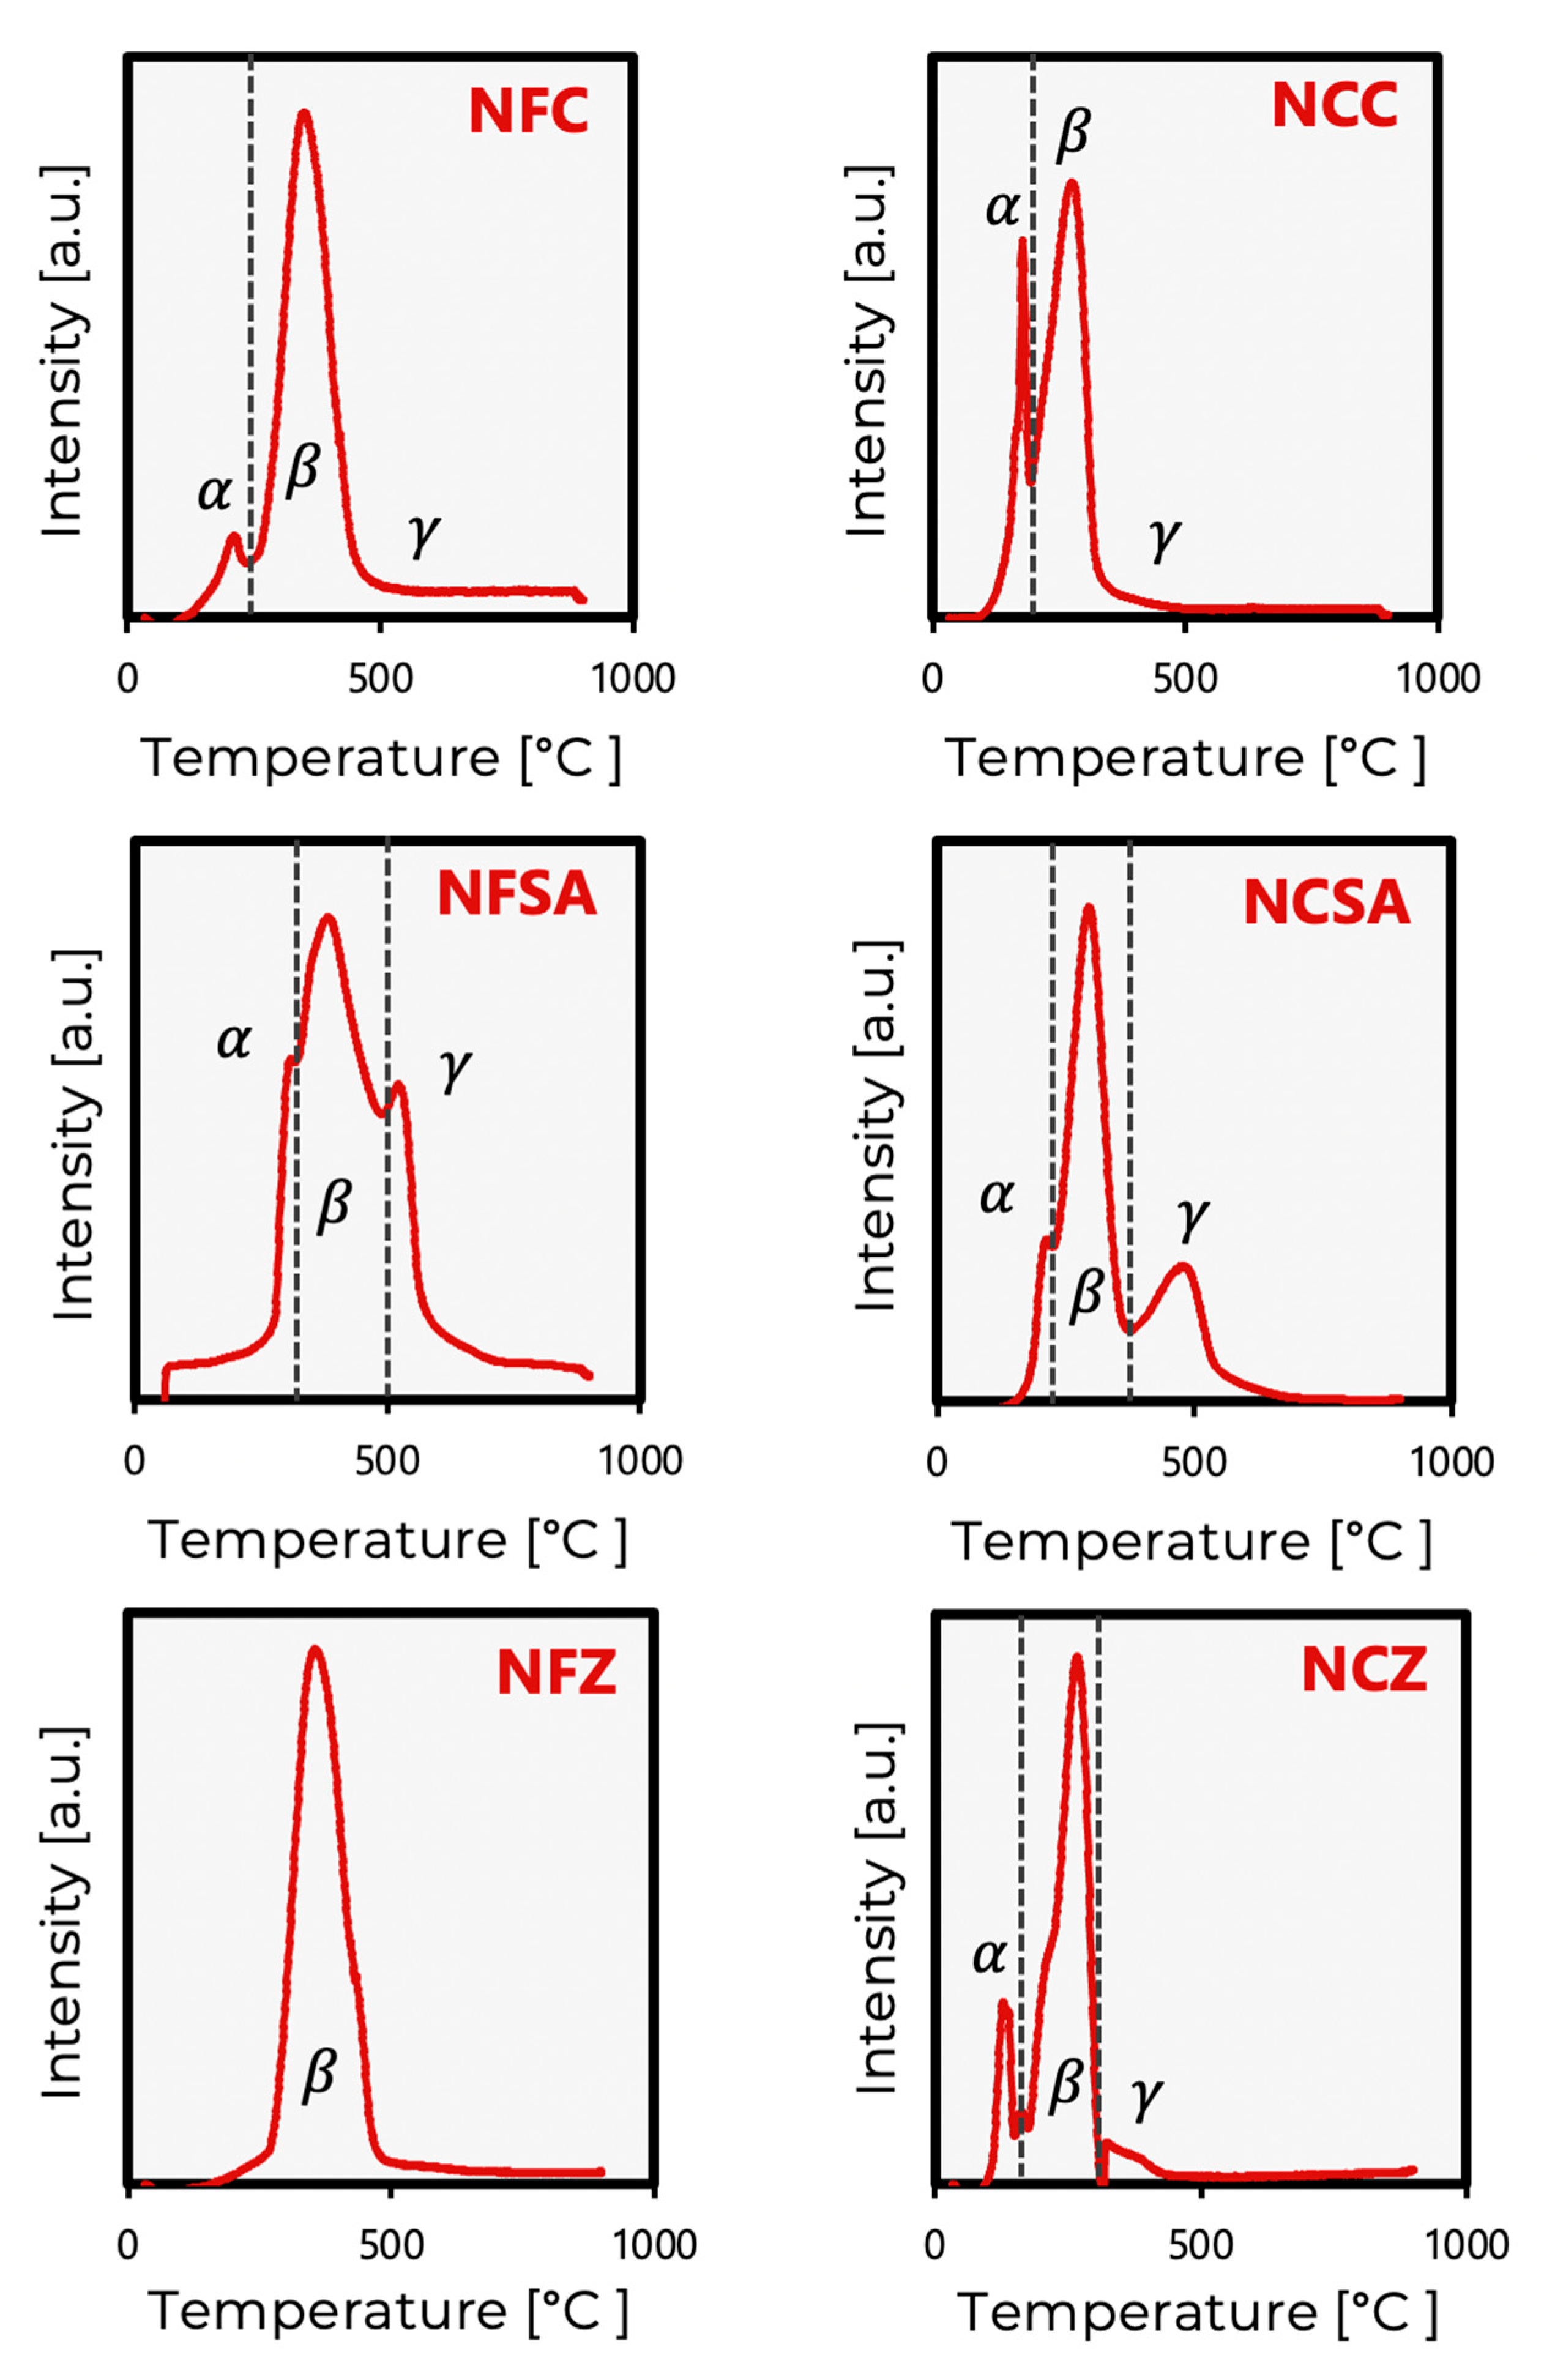
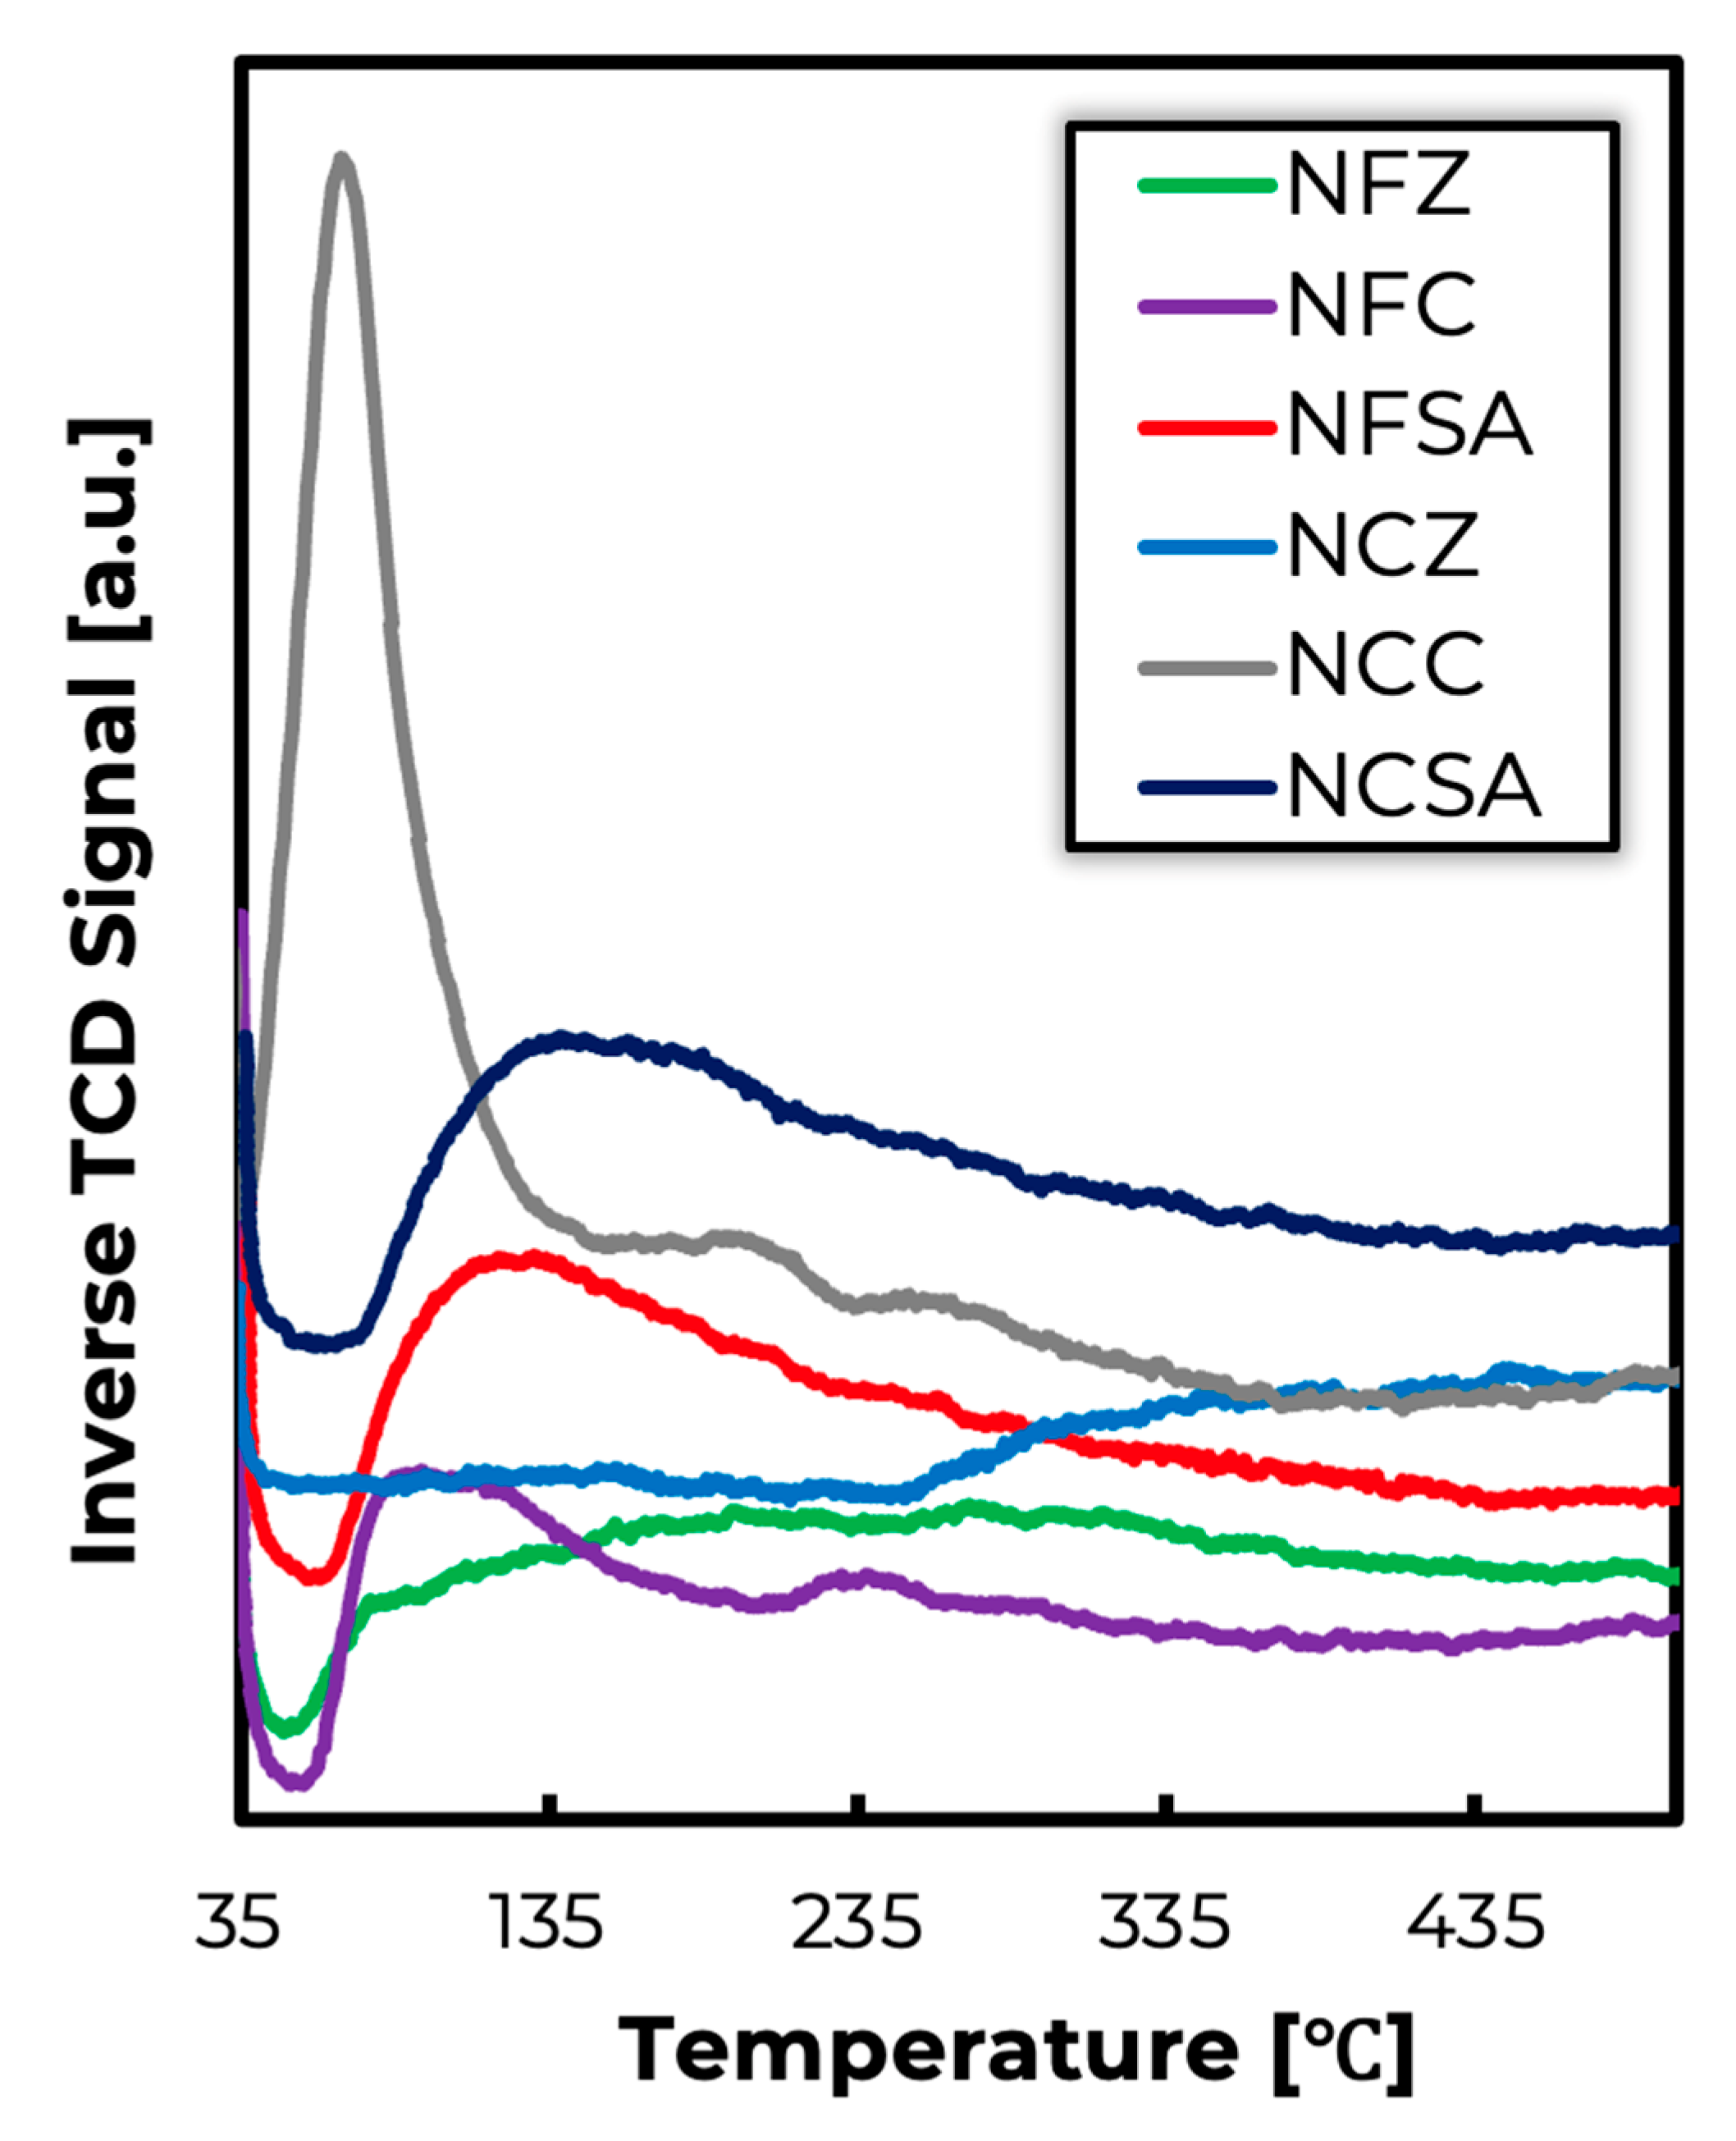
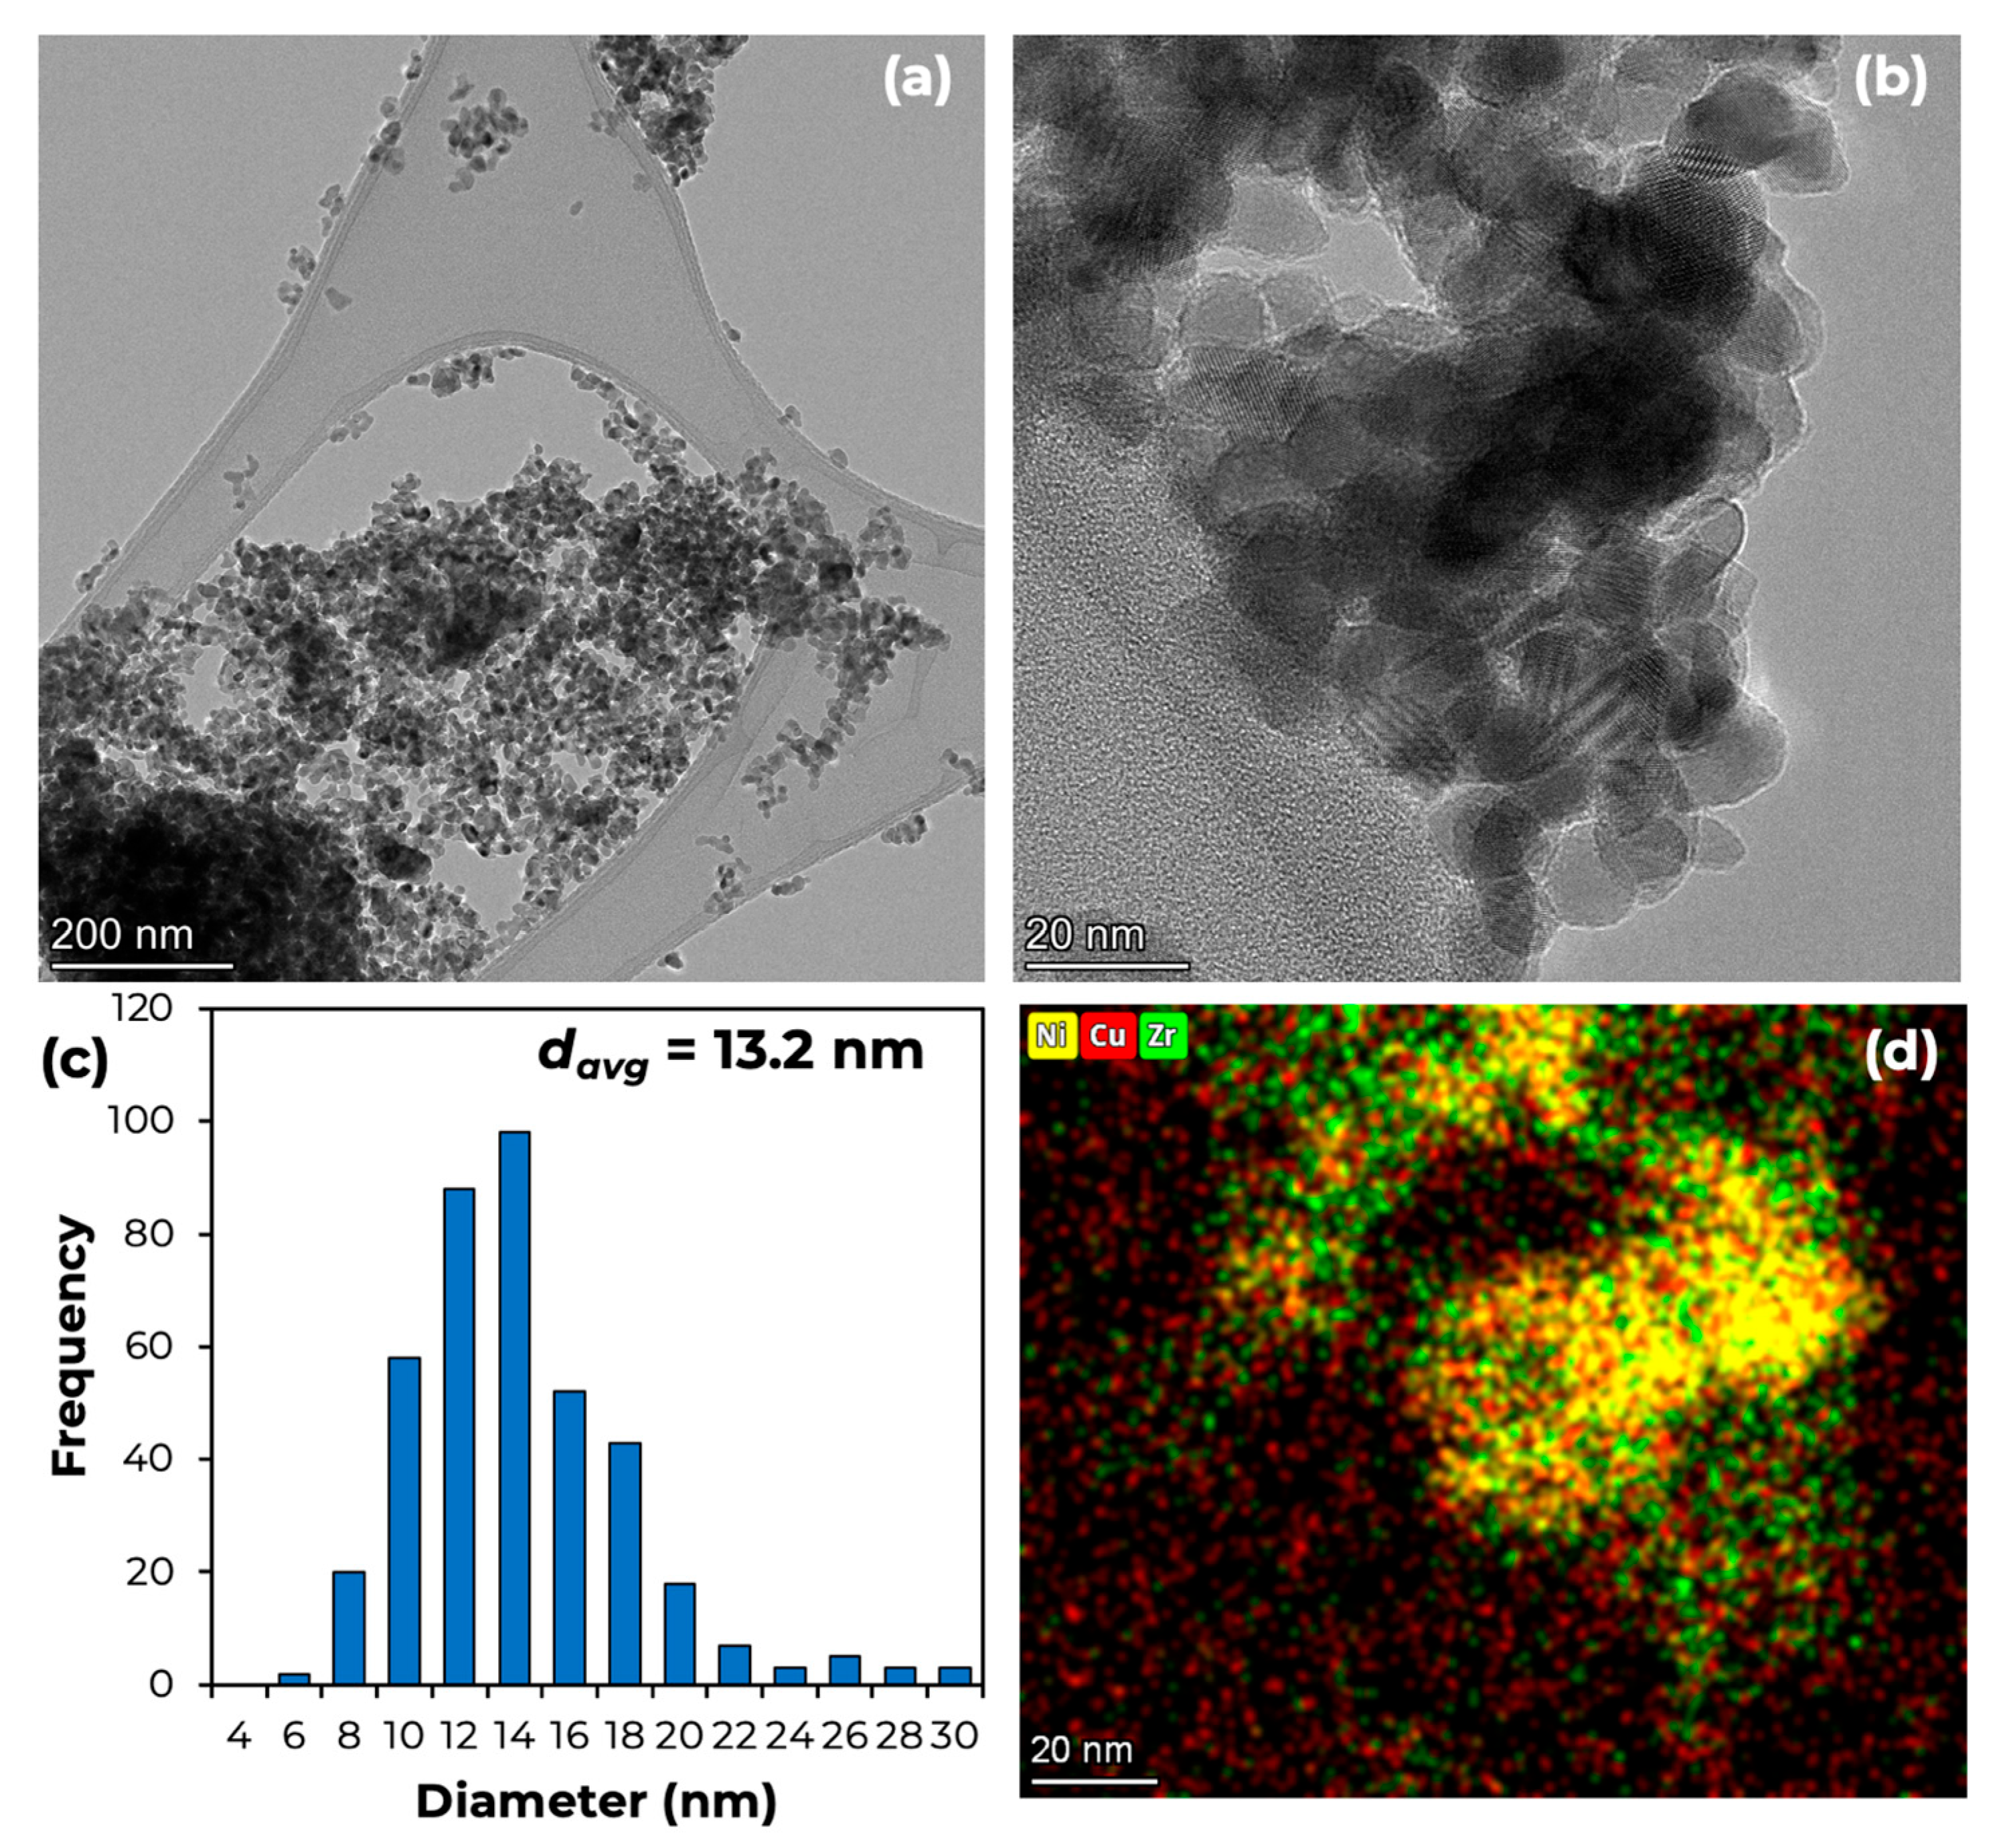
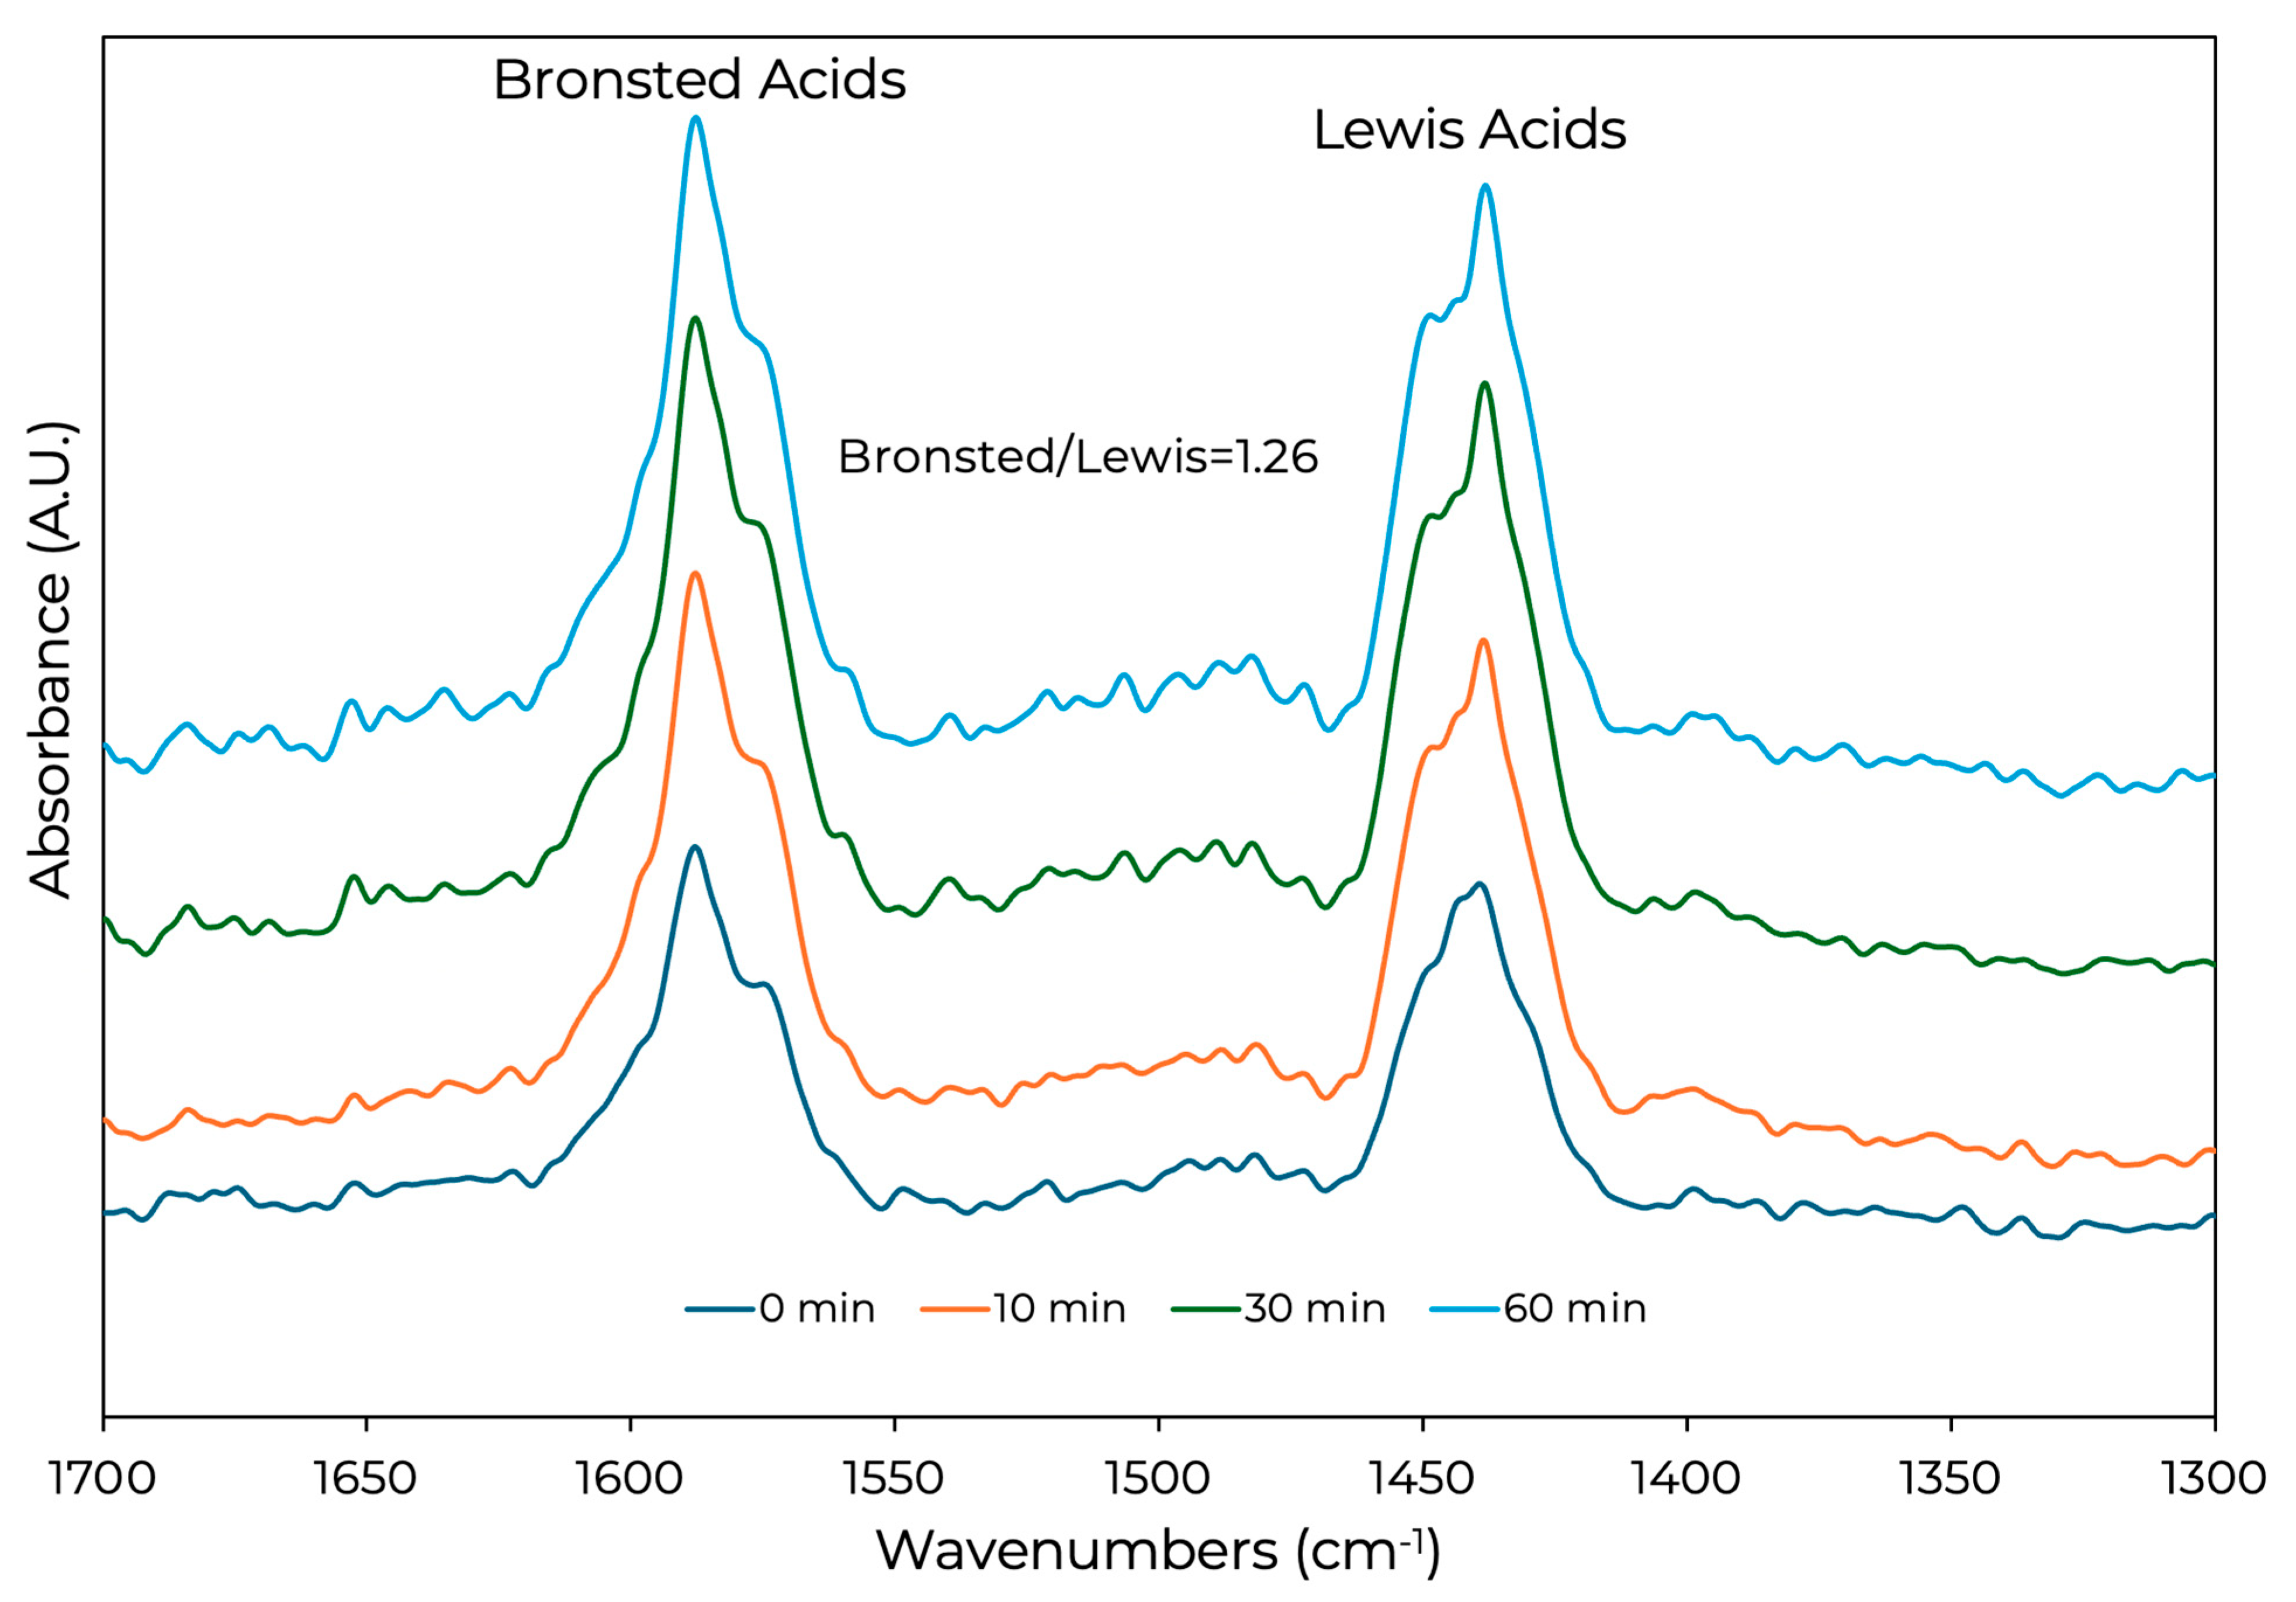
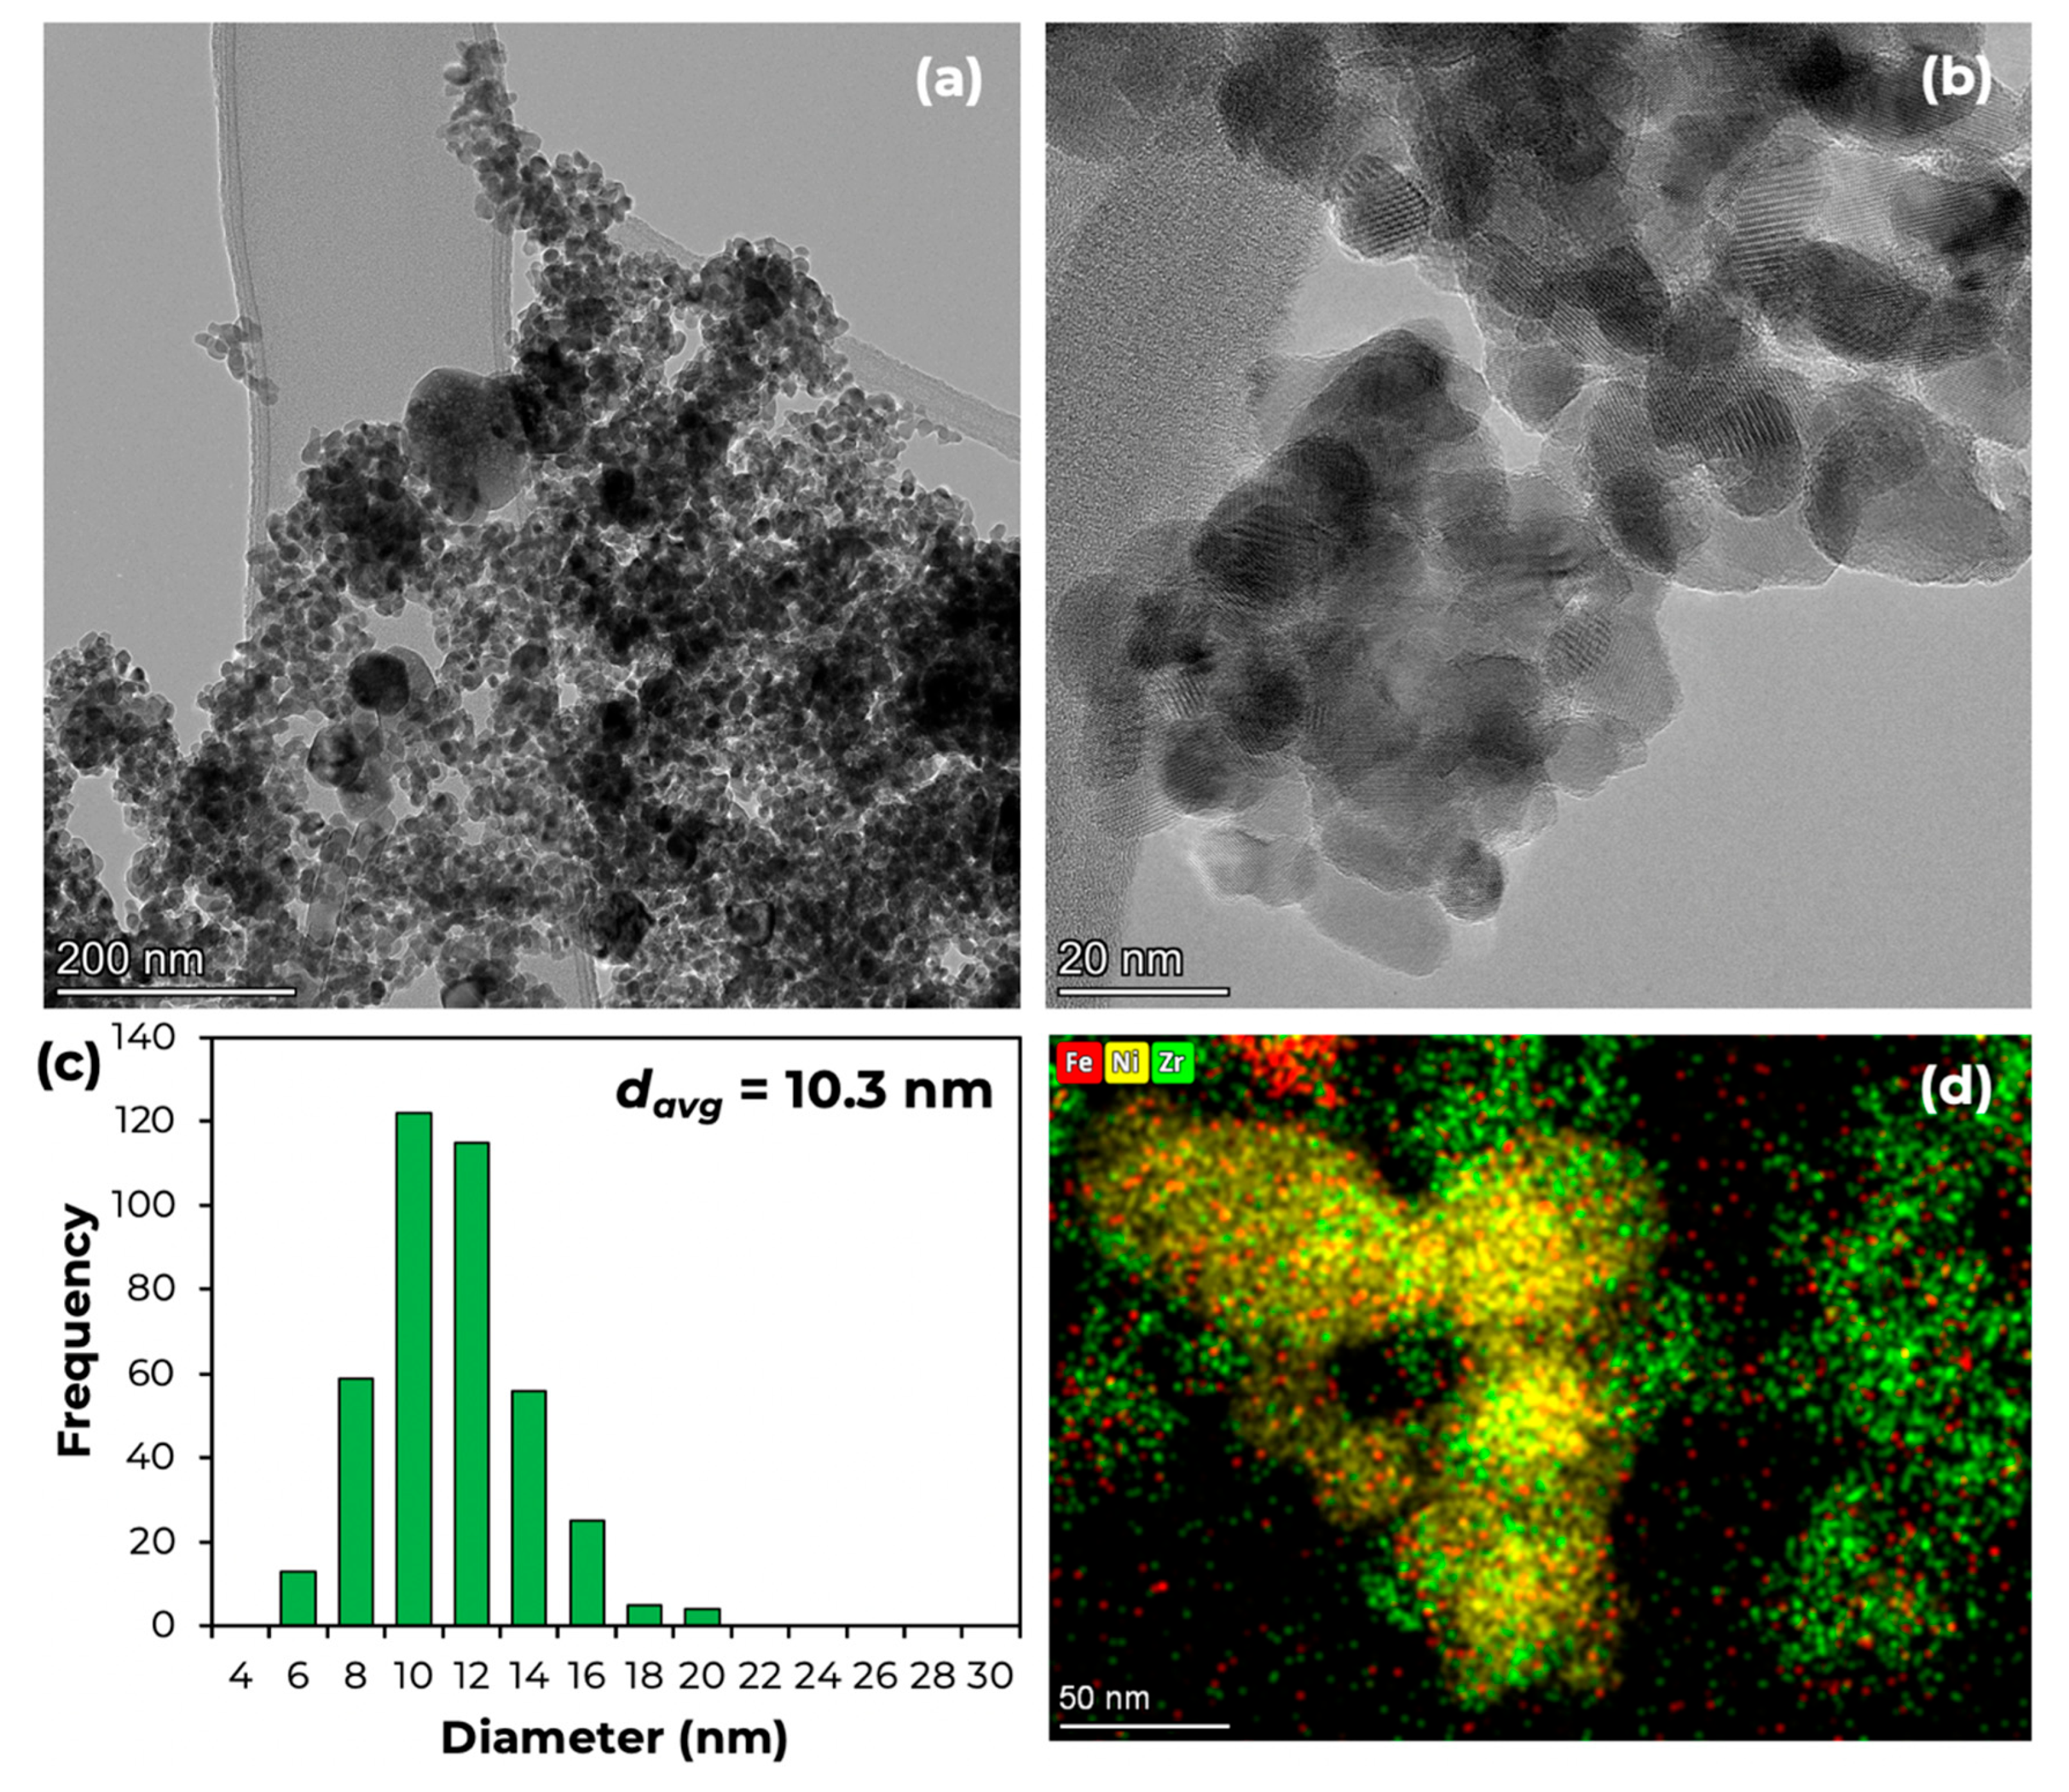
2.1. Fresh Catalyst Characterization

Table 1 shows the surface area of the bare supports, which follows the order SiO2-Al2O3 >> ZrO2 > Ce0.8Pr0.2O2. Unsurprisingly, the addition of Ni and Cu or Fe results in an appreciable decrease in surface area, pore volume, and pore diameter, which is generally attributed to particles of these metals partially blocking the pores of the supports [22,23].
The XRD patterns of the Ni-Cu and Ni-Fe catalysts on different supports that were used in this study are shown in Figure 1. The most intense and well-defined peaks observed in the X-ray diffractograms correspond to NiO, ZrO2, and CeO2, which suggest that the SiO2-Al2O3 support is amorphous [24] and that the metal promoters (Fe and Cu) are well dispersed on the catalyst surface. The diffraction peaks assigned to NiO were observed at 36.9°, 43.1°, and 62.4°, which correspond to the (111), (200), and (220) planes, respectively [25,26,27,28].
The average NiO particle size was determined by applying the Scherrer equation to the most intense XRD peak corresponding to NiO, which was observed at 43.1°. As shown in Table 1, the average NiO particle size ranged from 10 to 20 nm, which is in agreement with previous reports on Ni-based bimetallic catalysts [12,19]. Saliently, the NiO particle size of all Fe-promoted catalysts is almost identical (10.5 ± 0.3 nm). In contrast, Ni-Cu promoted catalysts show a considerably larger NiO particle size over both Ce0.8Pr0.2O2 and ZrO2—which is attributed to their lower surface area and their weak interaction with NiO [19]—while NCSA shows a NiO particle size similar to that of Ni-Fe formulations due to its much higher surface area and/or stronger metal-support interactions [28]. In short, the data in Table 1 indicate that while promotion with Fe does not affect NiO particle size irrespective of the surface area of the support, promotion with Cu can lead to the formation of larger NiO particles when the strength of the interaction between NiO and the support (and the surface area of the latter) is insufficient to stabilize smaller NiO particles.
The H2-TPR results in Figure 2 evince the reduction events that take place when the calcined catalysts are exposed to a temperature ramp under flowing hydrogen. In line with previous reports [9,12], all supported Ni-Cu catalysts display a peak or a shoulder below or around 180 °C (which corresponds to the reduction of copper oxide) and a peak between 180 and 250–300 °C, attributable to the reduction of large NiO-CuO particles that interact weakly with the support. The NCSA catalyst shows another peak above 300 °C, which can be assigned to small NiO-CuO particles interacting more strongly with the SiO2-Al2O3 support and is consistent with the surface area and average metal particle size results in Table 1. Also in line with a previous report [9], all supported Ni-Fe formulations show a main peak (with a maximum of around 300 °C for NFZ and NFSA and 260 °C for NFC), which commingles the reduction of nickel and iron oxides leading to the formation of a Ni-Fe alloy. However, while NFZ shows a single peak, NFC also shows a low-temperature signal and NFSA displays both lower and higher temperature signals accompanying the main reduction event. Low-temperature signals can be attributed to large particles of nickel and iron oxide interacting weakly with the support, while the high-temperature signal in the NFSA catalyst can be assigned to small particles of nickel and iron oxide interacting strongly with the SiO2-Al2O3 carrier. In general, the high surface area of SiO2-Al2O3 leads to the formation of smaller metal particles displaying strong interactions with the oxidic support resulting in the highest reduction temperatures. Figure A1 shows the TPR profile for each catalyst separately, which facilitates the distinction of various sections of the curve corresponding to the hydrogen adsorbed at 30–200 °C, 200–400 °C, and 400–600 °C (sections α, β, and γ, respectively).
The TPO profiles in Figure A2 show the oxidation events displayed by the fresh catalysts during a temperature ramp performed under flowing 10%O2/Ar after an initial drying step. NFZ and NCZ catalysts show almost no features as the temperature increases during TPO analysis, suggesting little or no observable oxidation on zirconia-supported catalysts. The peaks identified below 235 °C indicate the ease of oxidation of Ni⁰ to NiO, and the different oxygen consumption peaks are based on the distinct support types [29,30]. Observed for NFC is a small broad peak at 90 °C, identical to large and broad peaks also observed for both NCSA and NFSA at 135 °C, which may be attributed to the oxidation of nickel [31]. However, a very sharp peak is observed for NCC at 72 °C, which is assigned to the oxidation of nickel and copper [30]. These oxidation peaks indicate morphological changes observed as a result of the oxidation of the metallic species on the catalyst support as the temperature increases, complementing TPR results.
Results from NH3-TPD (see Figure 3 and Table 2 below) reveal that total acidity (measured as the µmols of NH3 adsorbed and desorbed per gram of catalyst) of the catalysts follows the trend NFSA (3280) >> NCSA (215) > NFZ (39.2) > NCZ (33.5) > NCC (10.5) > NFC (0.986). The fact that the catalysts comprising SiO2-Al2O3 as support possess the highest acidity is unsurprising since this particular carrier is a solid acid [32] whose acidity is much higher than that of ZrO2 or Ce0.8Pr0.2O2 [33,34]. The NH3-TPD profile of NFSA contains a broad peak from ~80 to ~250 °C as well as a sharper and more intense peak with a maximum of ~375 °C, which can be attributed to weak and moderate strength acid sites, respectively [35]. Albeit the NCSA formulation displays similar peaks, the latter are two orders of magnitude less intense than those of NFSA, indicating that NCSA is much less acidic overall. Moreover, the second desorption event is much less pronounced and has its maximum at a lower temperature relative to NFSA, revealing that most of the acid sites in NCSA are weakly acidic. All other catalysts are much less acidic than the SiO2-Al2O3-supported formulations and exclusively display weak acid sites. The strong acidity of NFSA may be attributed to silanol (-SiOH) sites, which have been reported to be present in high concentrations (2700 μmol/g) on amorphous SiO2-Al2O3 [33]. The strong acidity of silanol sites stems from undercoordinated Al sites grafted onto the silica surface [33]. Indeed, the undercoordination of Al in the silica framework disrupts the Si–O–Si network, leading to the formation of additional silanol groups, increasing both silanol density and total acidity [33,36].
The results from H2 pulse chemisorption in Table 2 show the amount of hydrogen adsorbed on the catalyst surface, which was performed to measure the number of metal sites available after the reduction of the catalysts prior to the deCOx reaction, higher hydrogen uptake values indicating higher metal dispersion and metal-specific surface area. Parenthetically, the stoichiometry of H₂ adsorption on Ni employed to calculate Ni specific surface area was one molecule of H2 corresponding to two surface Ni sites due to the dissociative adsorption of hydrogen on Ni (by which every molecule of H2 that adsorbs dissociates into two H adatoms, each occupying one surface Ni site). The H2 uptake (in cm3/g) follows the trend NFZ > NFC > NCZ > NFSA > NCC > NCSA. Independent of the active metal (Fe or Cu), the H2 uptake follows the order ZrO2 ≈ Ce0.8Pr0.2O2 > SiO2-Al2O3, which is consistent with reported results [19]. Similarly, the O2 uptake was measured to determine the oxygen storage capacity (OSC) of the catalysts studied. The results (also included in Table 2), show that the O2 uptake (in cm3/g) follows the trend NCC > NFC > NCZ > NFZ > NCSA > NFSA. The fact that irrespective of the nature of the active phase OSC follows the trend Ce0.8Pr0.2O2 > ZrO2 > SiO2-Al2O3 suggests OSC is mainly driven by the oxygen storage capacity of the support, which is greater for Ce0.8Pr0.2O2 relative to ZrO2 and SiO2-Al2O3. Parenthetically, the ability of CeO2 to adsorb oxygen can be traced to its partial reducibility at lower temperatures [37,38]. Previous reports have shown that the use of CeO2 as catalyst support leads to high oxygen storage capacity, accessibility, and mobility [39,40], which in turn enhances coking resistance and catalyst performance [37] since higher OSC can facilitate access to more active sites [41]. The enhanced mobility of oxygen species from the bulk of the catalyst to the surface can increase the supply of lattice oxygen that can react with surface carbon to remove coke deposits [42].
Table 3 below shows the surface concentrations (in at.%) of elements detected via x-ray photoelectron spectroscopy (XPS) after reduction under a flow of 10% H2/Ar at 350 °C for 3 h, as well as the amount of Ni present in the metallic state (Ni0). Parenthetically, determining the surface concentration of elements in general—and of supported metals like Ni and Cu in particular—via XPS offers distinct advantages over other techniques. Indeed, XRD is limited by the fact that it cannot detect elements in amorphous and/or subnanometric species, while pulse chemisorption results can be confounded by the presence of multiple metals and/or reducible supports. Moreover, in addition to elemental surface concentration data, XPS provides information on the oxidation state of surface elements, which is critical since Ni0 represents the active site for deCOx reactions. As shown in Table 3, the total Ni0 detected via XPS is highest for the Ce0.8Pr0.2O2-supported catalyst, following the trend Ce0.8Pr0.2O2 > ZrO2 >> SiO2-Al2O3. This suggests that the surface concentration of available metallic Ni0 sites is higher for Ce0.8Pr0.2O2- and ZrO2-based catalysts, and the presence of these sites may significantly influence deoxygenation activity. Additional observations from Table 3 suggest that irrespective of the support, catalysts promoted with Cu display a higher amount of surface Ni0 compared to the corresponding Fe-promoted formulations. This increase in Ni0 surface concentration observed in Cu-promoted catalysts may suggest that Cu promotion facilitates Ni reducibility more effectively than Fe-promotion [9]. Furthermore, XPS detects a higher Ni0 concentration on the surface of CeO2-based catalysts. These results are in overall agreement with those of TPR measurements (vide supra) since Cu-promoted and/or Ce0.8Pr0.2O2-supported catalysts were shown to display lower reduction temperatures.
Figure 4a–c shows the fitting of the Ni 2p3/2 peaks within the x-ray photoelectron spectra acquired. A signal corresponding to the Ni0 peak is detected across all catalysts studied at ~852.5 eV, this signal being more pronounced in Cu-promoted catalysts. Other nickel species identified include NiO and Ni(OH)2 at 855.5 eV regardless of Cu- or Fe-promotion for ZrO2 and SiO2-Al2O3. The 2p XPS peaks for Fe and Cu of the reduced catalysts—shown in Figure A3a–c and Figure A3d–g, respectively—are consistent with those observed in a previous study [9]. The oxide species observed within the Fe 2p peak for NFC and NFZ at 706 eV is attributed to iron (II) oxide (Fe2+). In contrast, NFSA exhibits the absence of Fe2+ species in the 2p spectra, indicating the presence of iron (III) oxide (Fe3+) instead [43]. For the Cu 2p peaks, a weak satellite peak is observed for NCSA, attributed to copper (I) oxide (Cu+), whereas a strong satellite peak is detected for NCZ after reduction, indicative of copper (II) oxide (Cu2+) [43,44,45]. Additionally, for the Ce0.8Pr0.2O2 support, the strong satellite peak observed for NCC before reduction flattens after reduction, indicative of the presence of 100% Cu0 species [9,45].
Given that NFZ and NCZ share the same support while respectively displaying the best and a subpar performance (see Table 4), these ZrO2-supported catalysts were subjected to additional characterization via transmission electron microscopy-energy dispersive spectroscopy (TEM-EDS) to further investigate their microstructure. The results obtained using NFZ are shown in Figure 5a–d. The metal particle size distribution for NFZ (in Figure 5c) shows a wide distribution ranging from 6 to 20 nm, with an average size centered at 10.3 nm, which is in overall agreement with XRD results (Table 1). Furthermore, the elemental maps in Figure 5d reveal that Fe is better dispersed than Ni and present both in association with the latter metal as well as on its own, which is consistent with both XRD results in which a Fe peak was not observed. The results obtained using NCZ are shown in Figure A4a–d. NCZ shows a metal particle size distribution made up of larger particles relative to those observed in NFZ, which is also in line with XRD results (Table 2). The elemental maps in Figure A4d show that Cu is much better dispersed than Ni and present in areas both rich and poor in Ni, which is also consistent with both XRD results in which a Cu peak was not observed as well as with TPR results in which a peak corresponding to unalloyed Cu was observed. In short, TEM-EDS characterization confirmed that the main difference between Fe- and Cu-promoted Ni catalysts comprising relatively low-surface-area support like ZrO2, lies in the fact that Cu promotion yields larger NiO particles compared to Fe-promoted formulations.

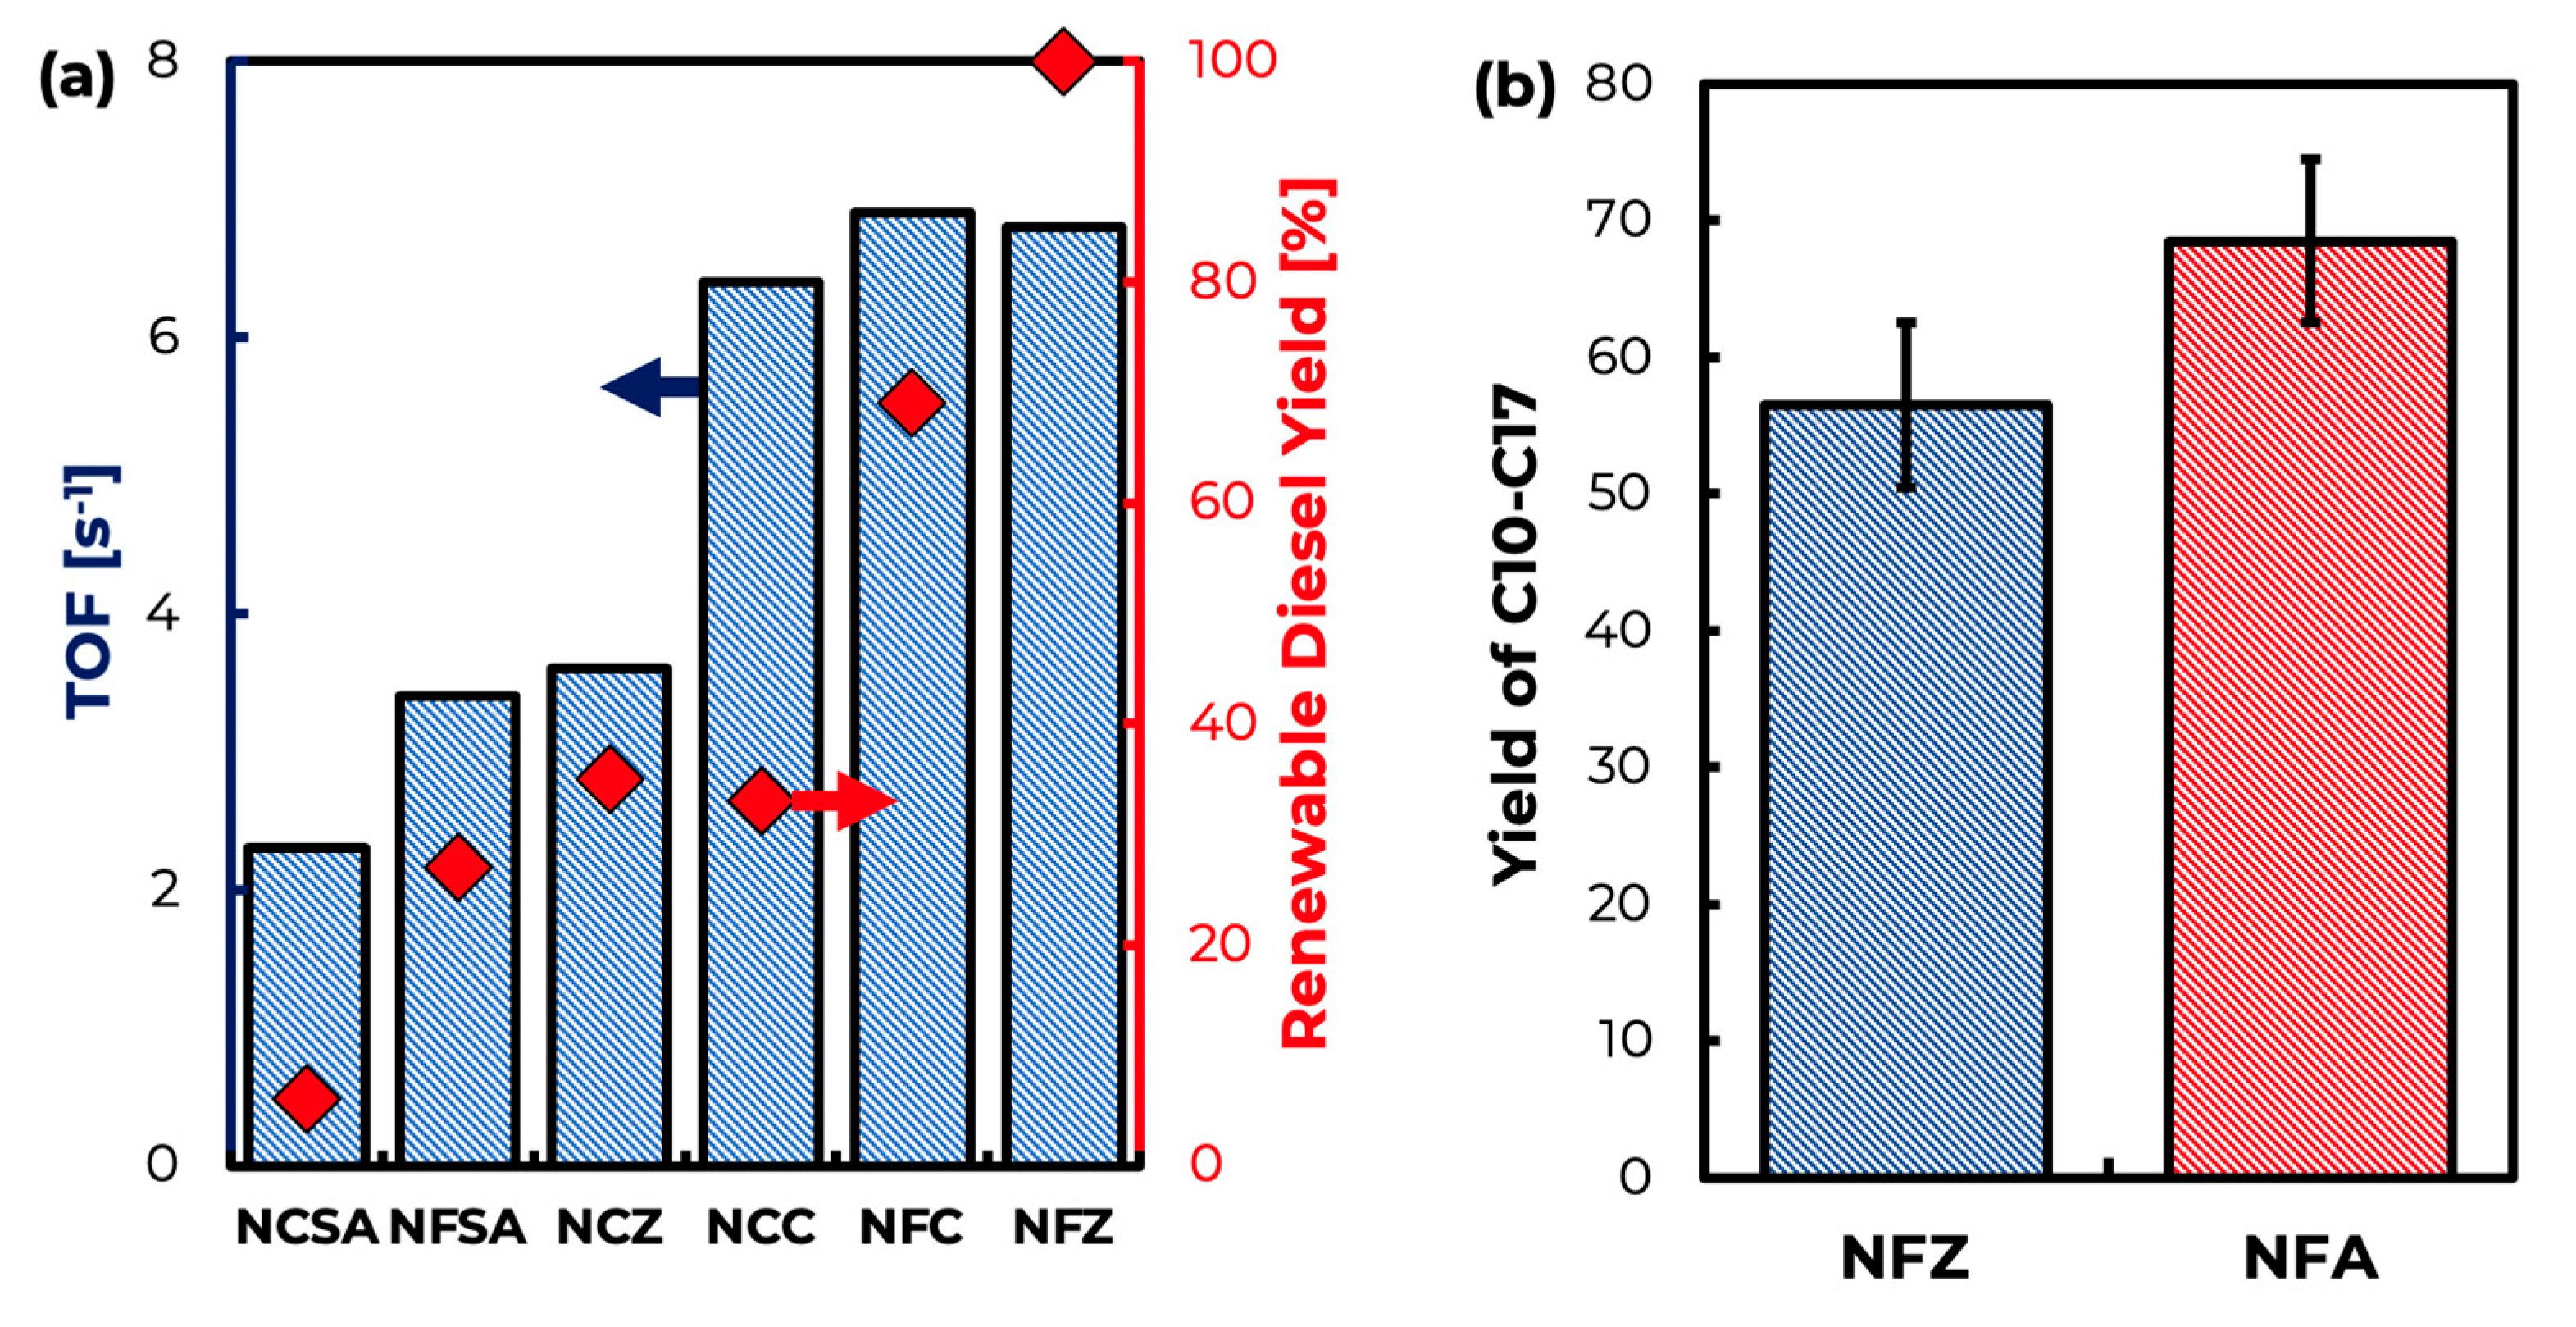
2.2. Tristearin Deoxygenation in Semi-Batch Mode

Table 4 shows the results of tristearin deoxygenation experiments performed in a semi-batch reactor. Overall, Ni-Fe afforded superior yields of diesel-like (C10–C18) hydrocarbons over the Ni-Cu formulations comprising the same support. This can be attributed—at least in part—to the higher number of Ni active sites indicated by the smaller metal particles and the higher metal-specific surface area of Ni-Fe formulations (see Table 1 and Table 2). Similarly, ZrO2-supported catalysts showed superior yields of diesel-like hydrocarbons over the formulations with the same active phase supported on Ce0.8Pr0.2O2 or SiO2-Al2O3. Given the two aforementioned trends, the fact that NFZ afforded the best results is unsurprising. Indeed, NFZ displayed a tristearin conversion as well as a selectivity to—and yield of—C10–C18 hydrocarbons, of 100%. The superior performance of NFZ may be attributed to it having the highest Ni-specific surface area (10.2 m2/g) and thus the most metal sites available to catalyze the deoxygenation reaction. Notably, in addition to NFZ having the highest number of active sites, the latter also seems to be highly active intrinsically, at least based on the apparent turnover frequency (TOF) values shown in Figure 6a, which were admittedly calculated at high conversion and thus may be impacted by deactivation phenomena. Saliently, NFZ displays one of the highest apparent TOFs among all catalysts tested (6.8 sec−1), and Fe promotion is observed to result in catalysts displaying higher TOF irrespective of the catalyst support (see Table 4). In short, NFZ shows the highest number of active sites, and the latter are some of the most intrinsically active in the catalysts investigated, which explains the superior performance of this formulation in terms of conversion and yield of diesel-like hydrocarbons. The catalytic performance of NFZ was compared to that of 20% Ni-5% Fe/Al2O3 (NFA) (see Figure 6b) since alumina represents one of the most commonly used carriers for deCOx catalysts [3,12]. The result showed that zirconia- and alumina-supported catalysts afford comparable results. Thus, both ZrO2 and Al2O3 constitute good oxidic carriers for catalysts used in the conversion of FOG to diesel-like hydrocarbons via deCOx and the choice between them could depend on considerations other than conversion and yield, such as mechanical strength or hydrothermal stability requirements.
As stated above, Fe promotion leads to higher yields of C10–C18 hydrocarbons than Cu-promotion irrespective of the catalyst support employed, which can be attributed to improved dispersion and metal-specific surface area as well as to Fe-promotion resulting in more intrinsically active sites. However, the fact that the yield of C10–C18 hydrocarbons follows the trend ZrO2 > Ce0.8Pr0.2O2 > SiO2-Al2O3 within both Fe- and Cu-promoted formulations points to the importance of another variable—acidity—that can explain this trend, a moderate amount of weak acid sites affording the best results. Indeed, SiO2-Al2O3-supported catalysts displayed lower conversions and yields to diesel-like hydrocarbons, as well as significantly lower selectivity to C17. This poor performance is attributed to the high acidity of this carrier, which is two orders of magnitude higher when compared to other catalysts (see Figure 3) and causes excessive cracking that leads to coke-induced catalyst deactivation. Notably, NFSA displays a uniquely high selectivity to C18, which suggests that this formulation favors the hydrodeoxygenation (HDO) reaction over deCOx. This is reminiscent of a recent report by Wang et al., who observed that Ni-based catalysts supported on SiO2-Al2O3 used in the conversion of tristearin to diesel-like hydrocarbons produced much higher amounts of C18 than other formulations with the same active phase but different oxidic supports, which did not yield any C18 [19]. Wang et al. explained this phenomenon invoking Scheme A1 in Appendix A, in which tristearin undergoes a series of ß-elimination and hydrogenation reactions to afford stearic acid, which is then converted to diesel-like hydrocarbons via (1) direct decarboxylation to C17; and (2) hydrogenation into an aldehyde intermediate that then undergoes either (a) direct decarbonylation to C17; or (b) reduction to octadecanol that is subsequently dehydrated to octadecene, which is finally hydrogenated to C18 [1]. The increased acidity of NFSA (3280 µmol/g) enhances octadecanol dehydration, favoring the HDO pathway [19,47].

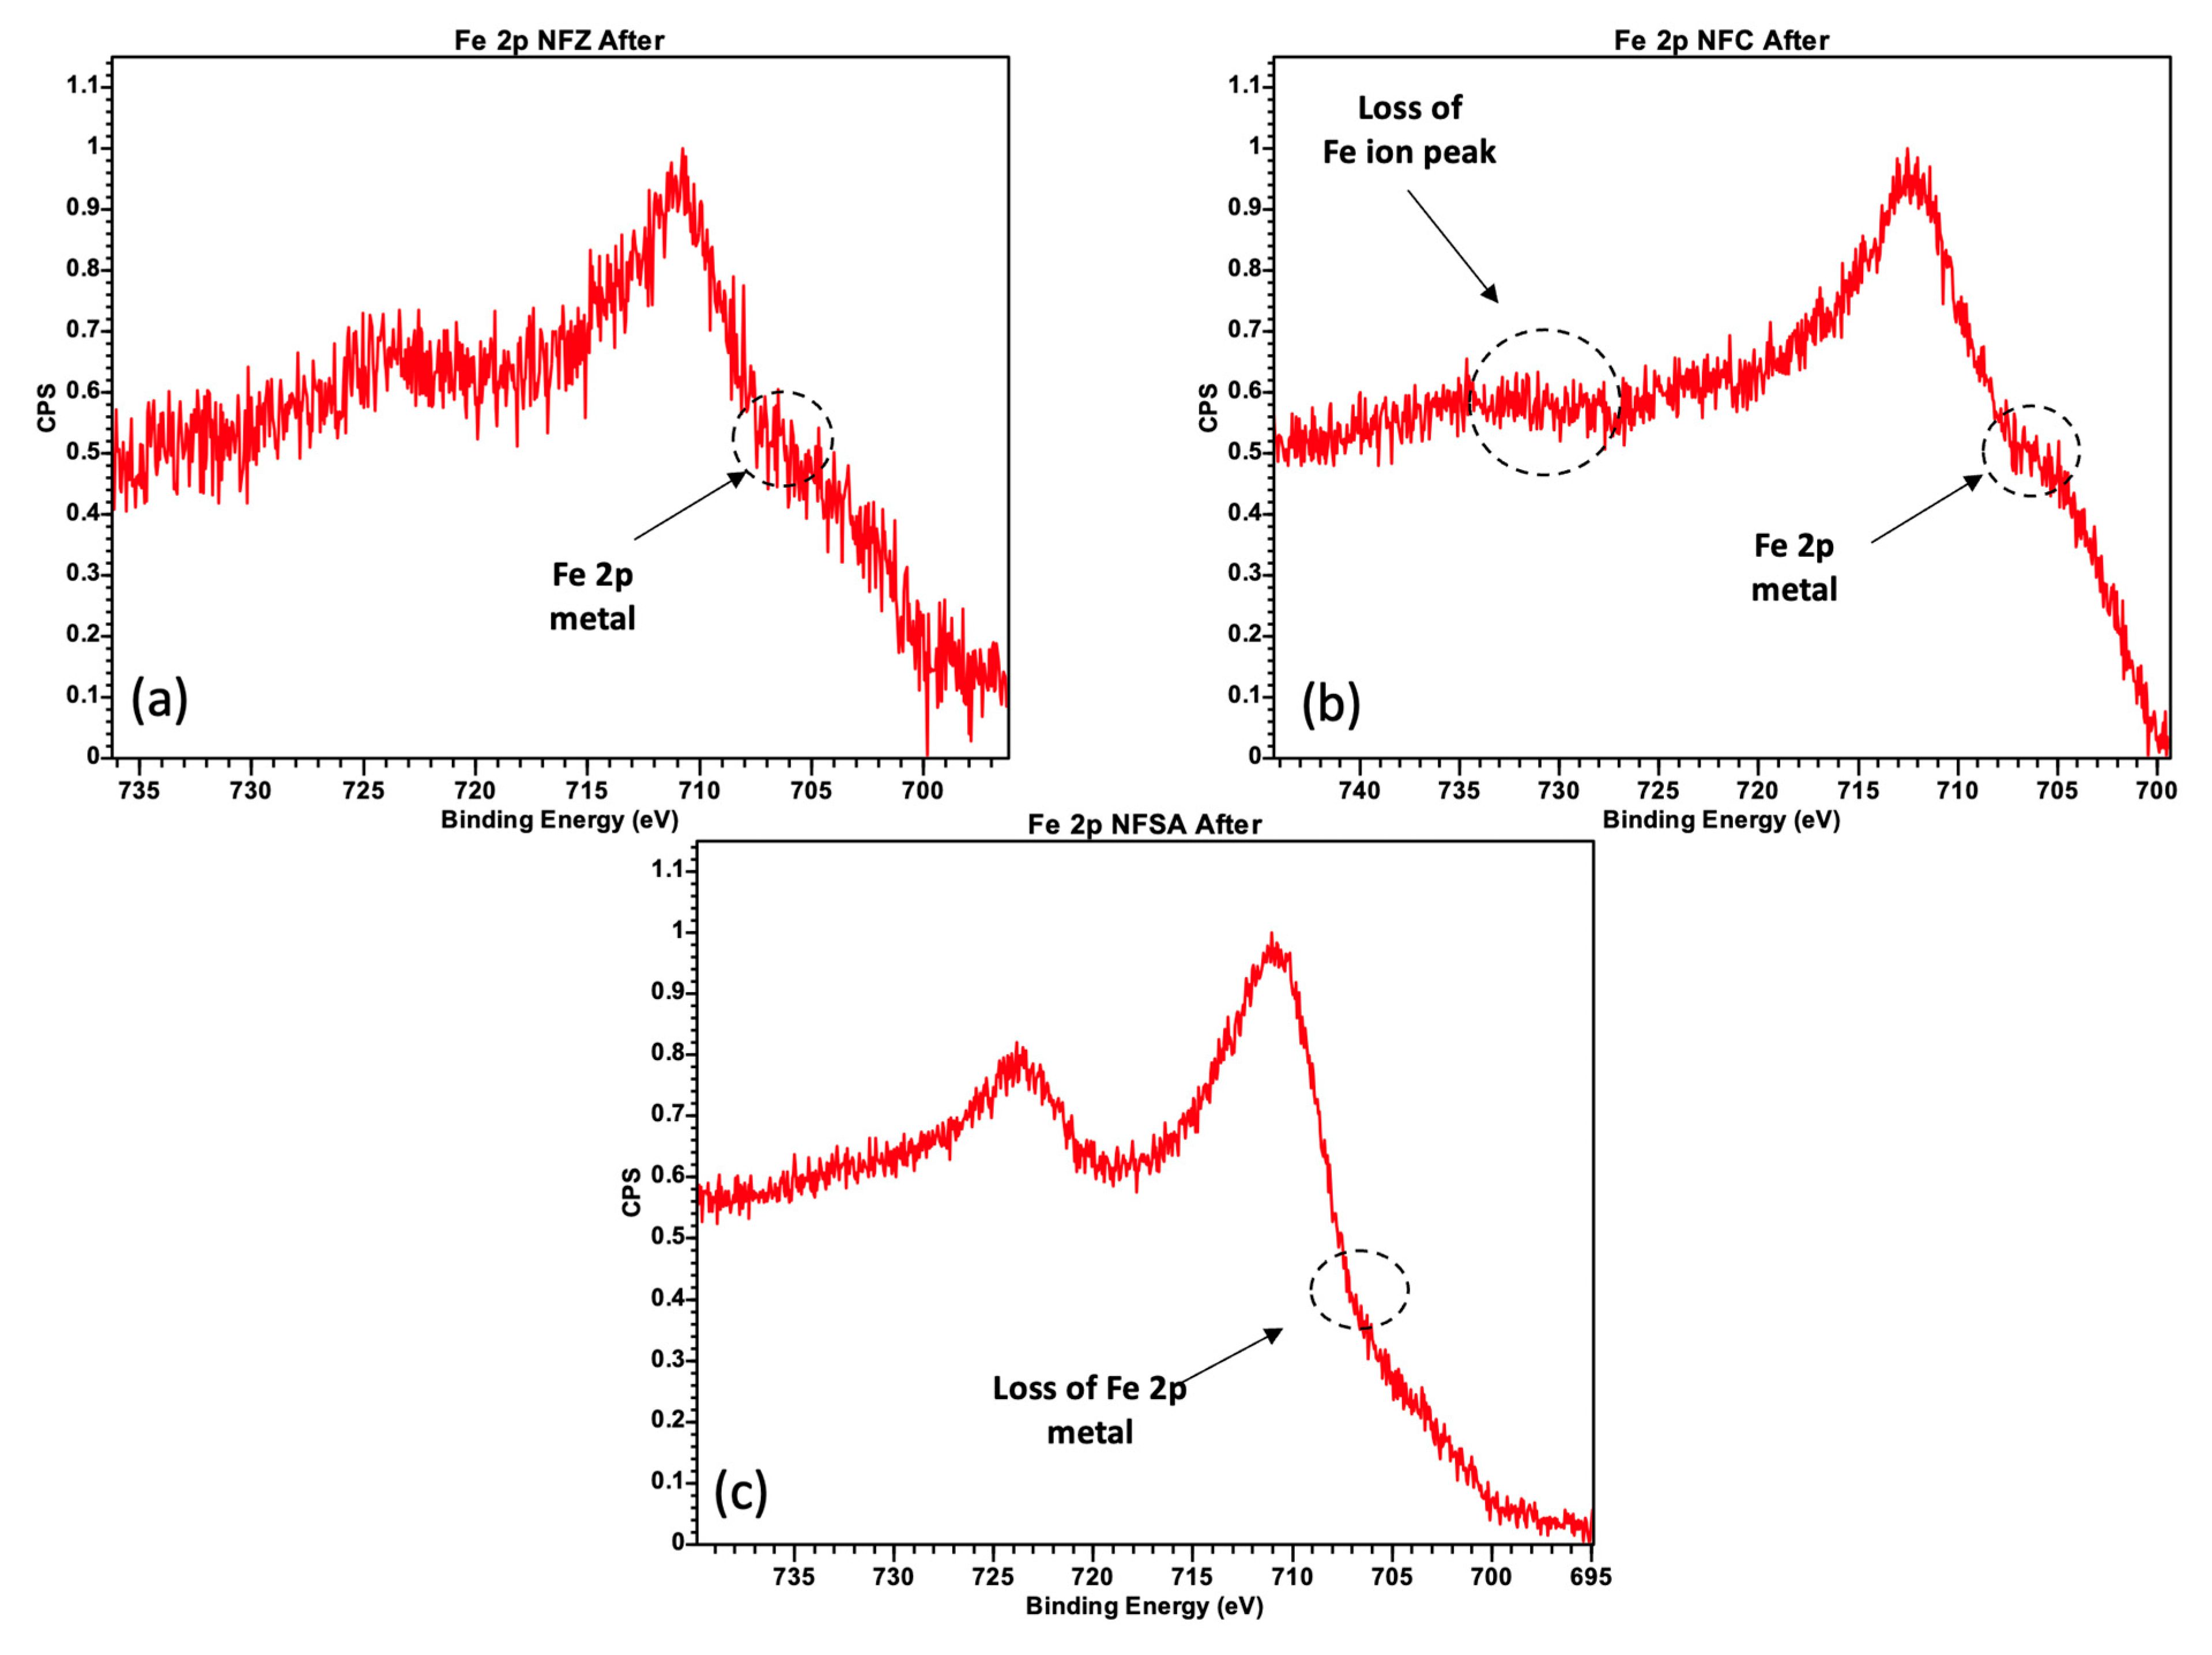
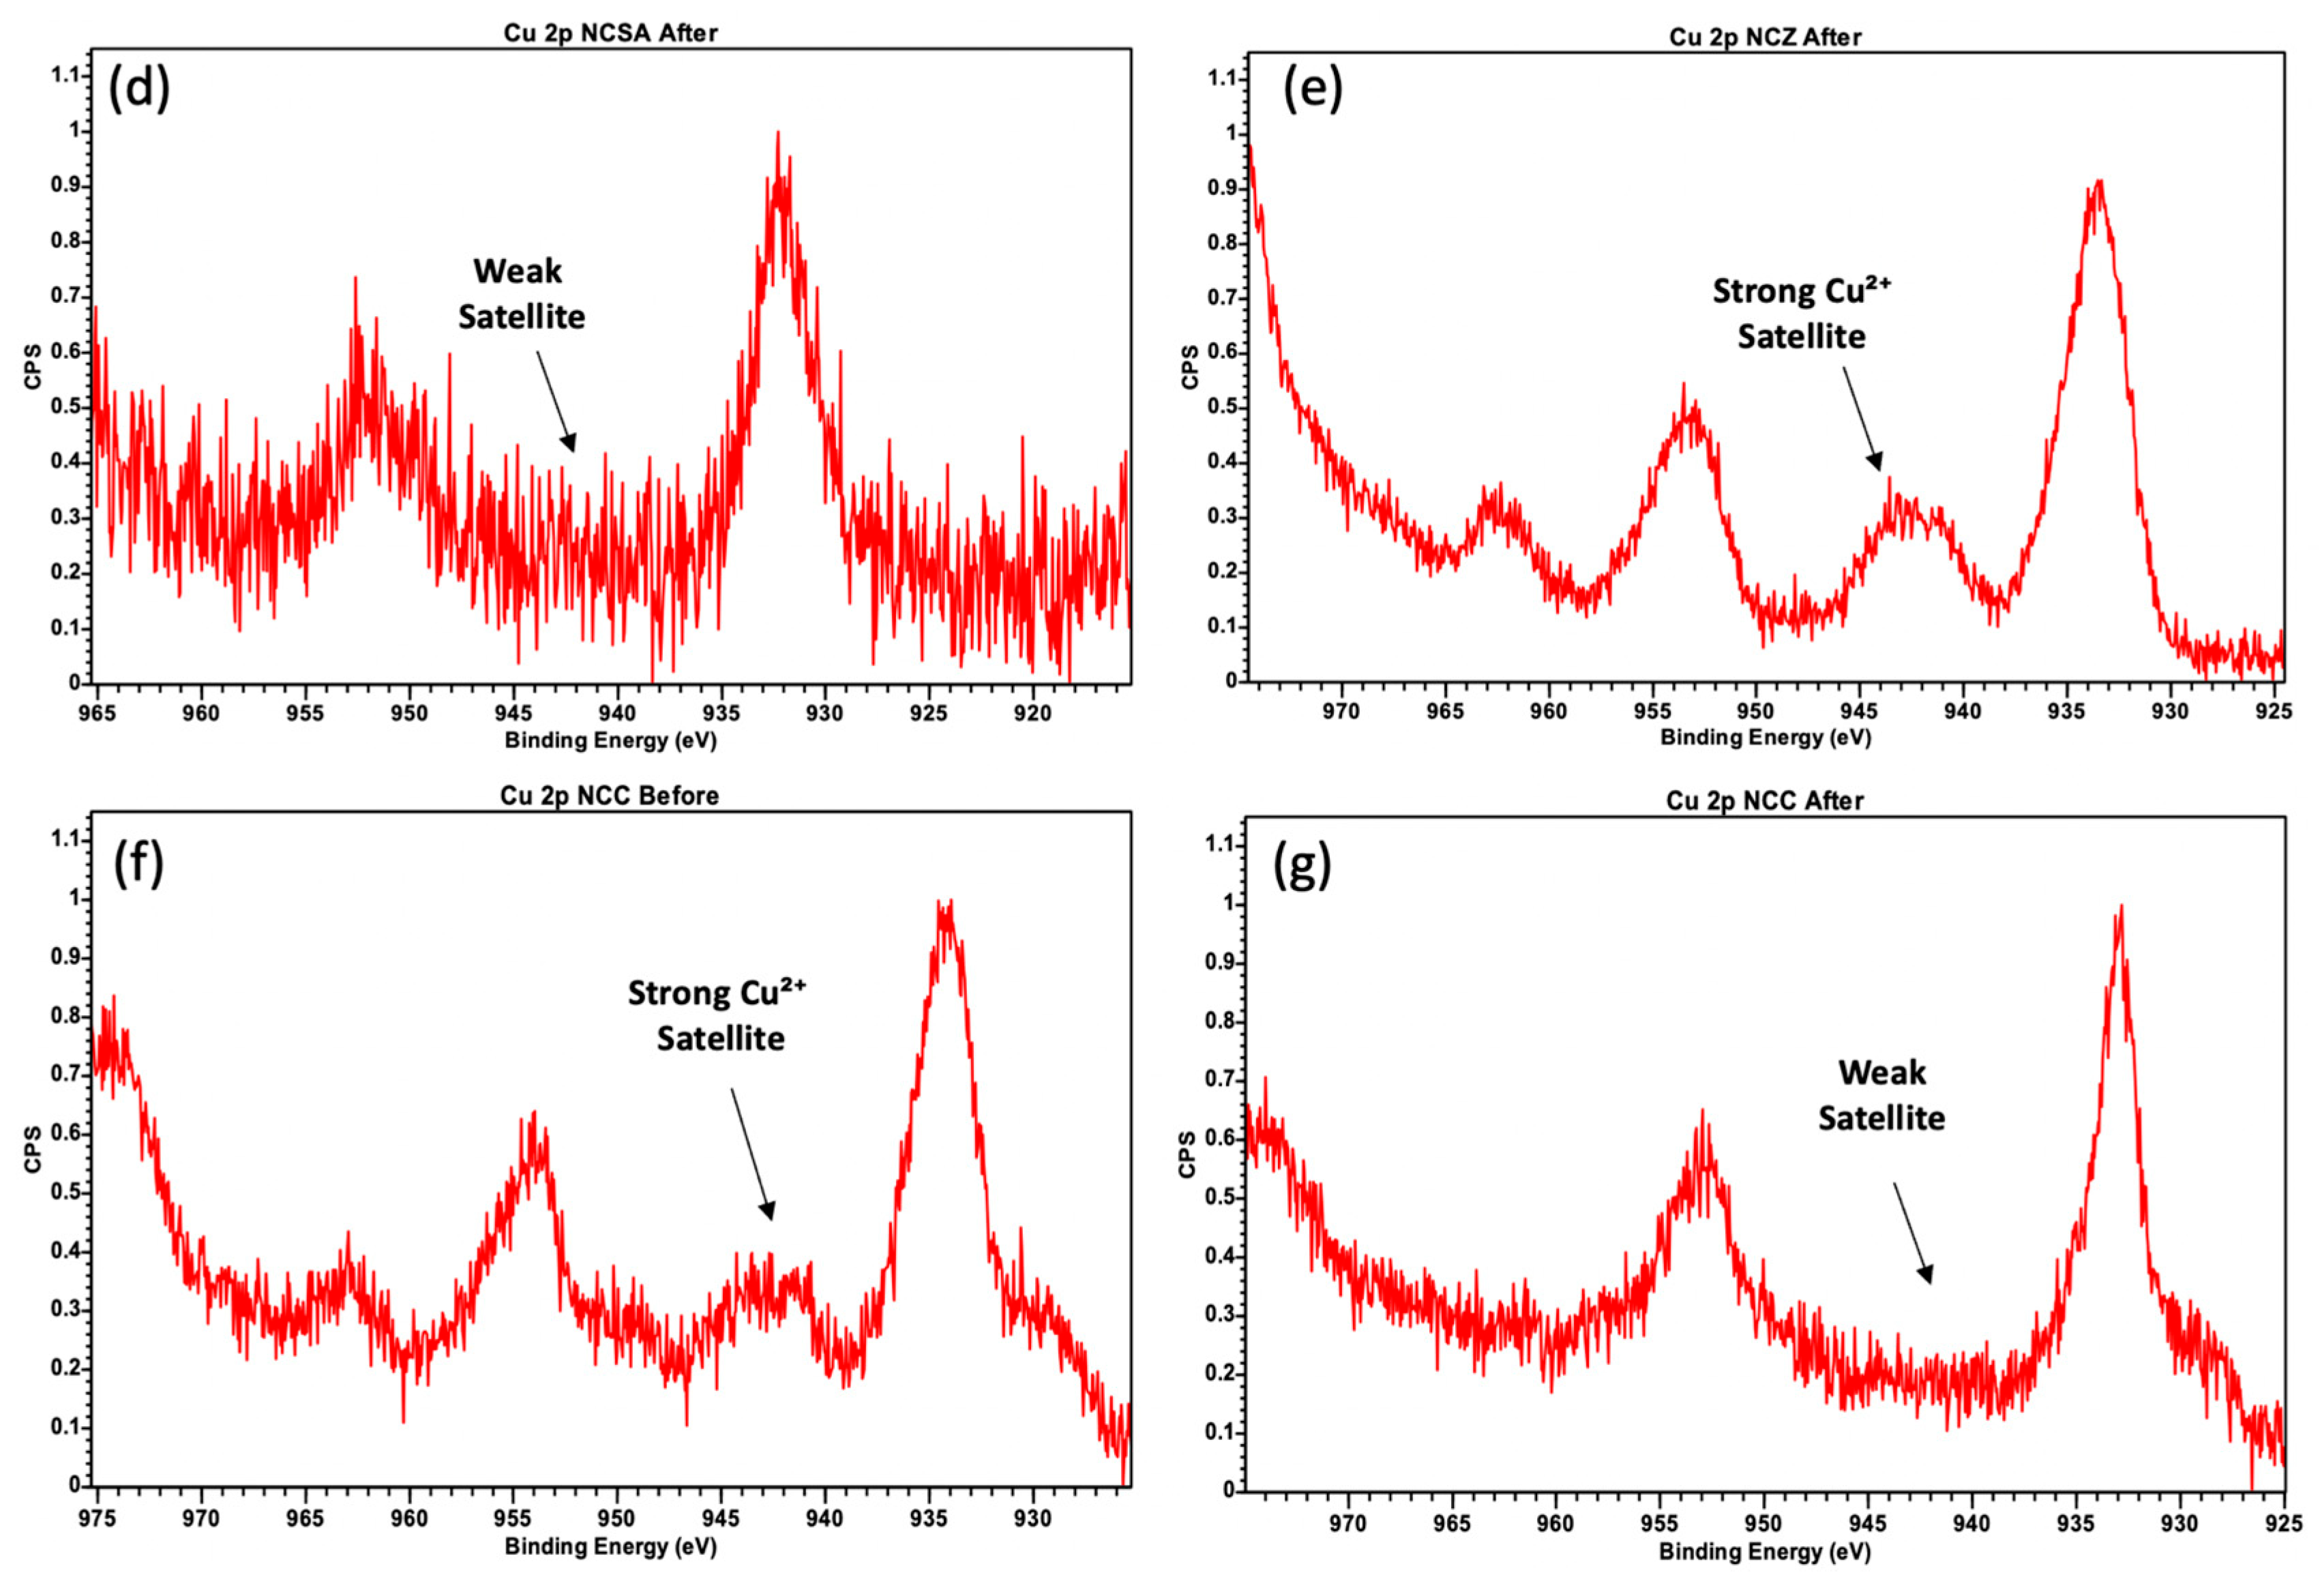
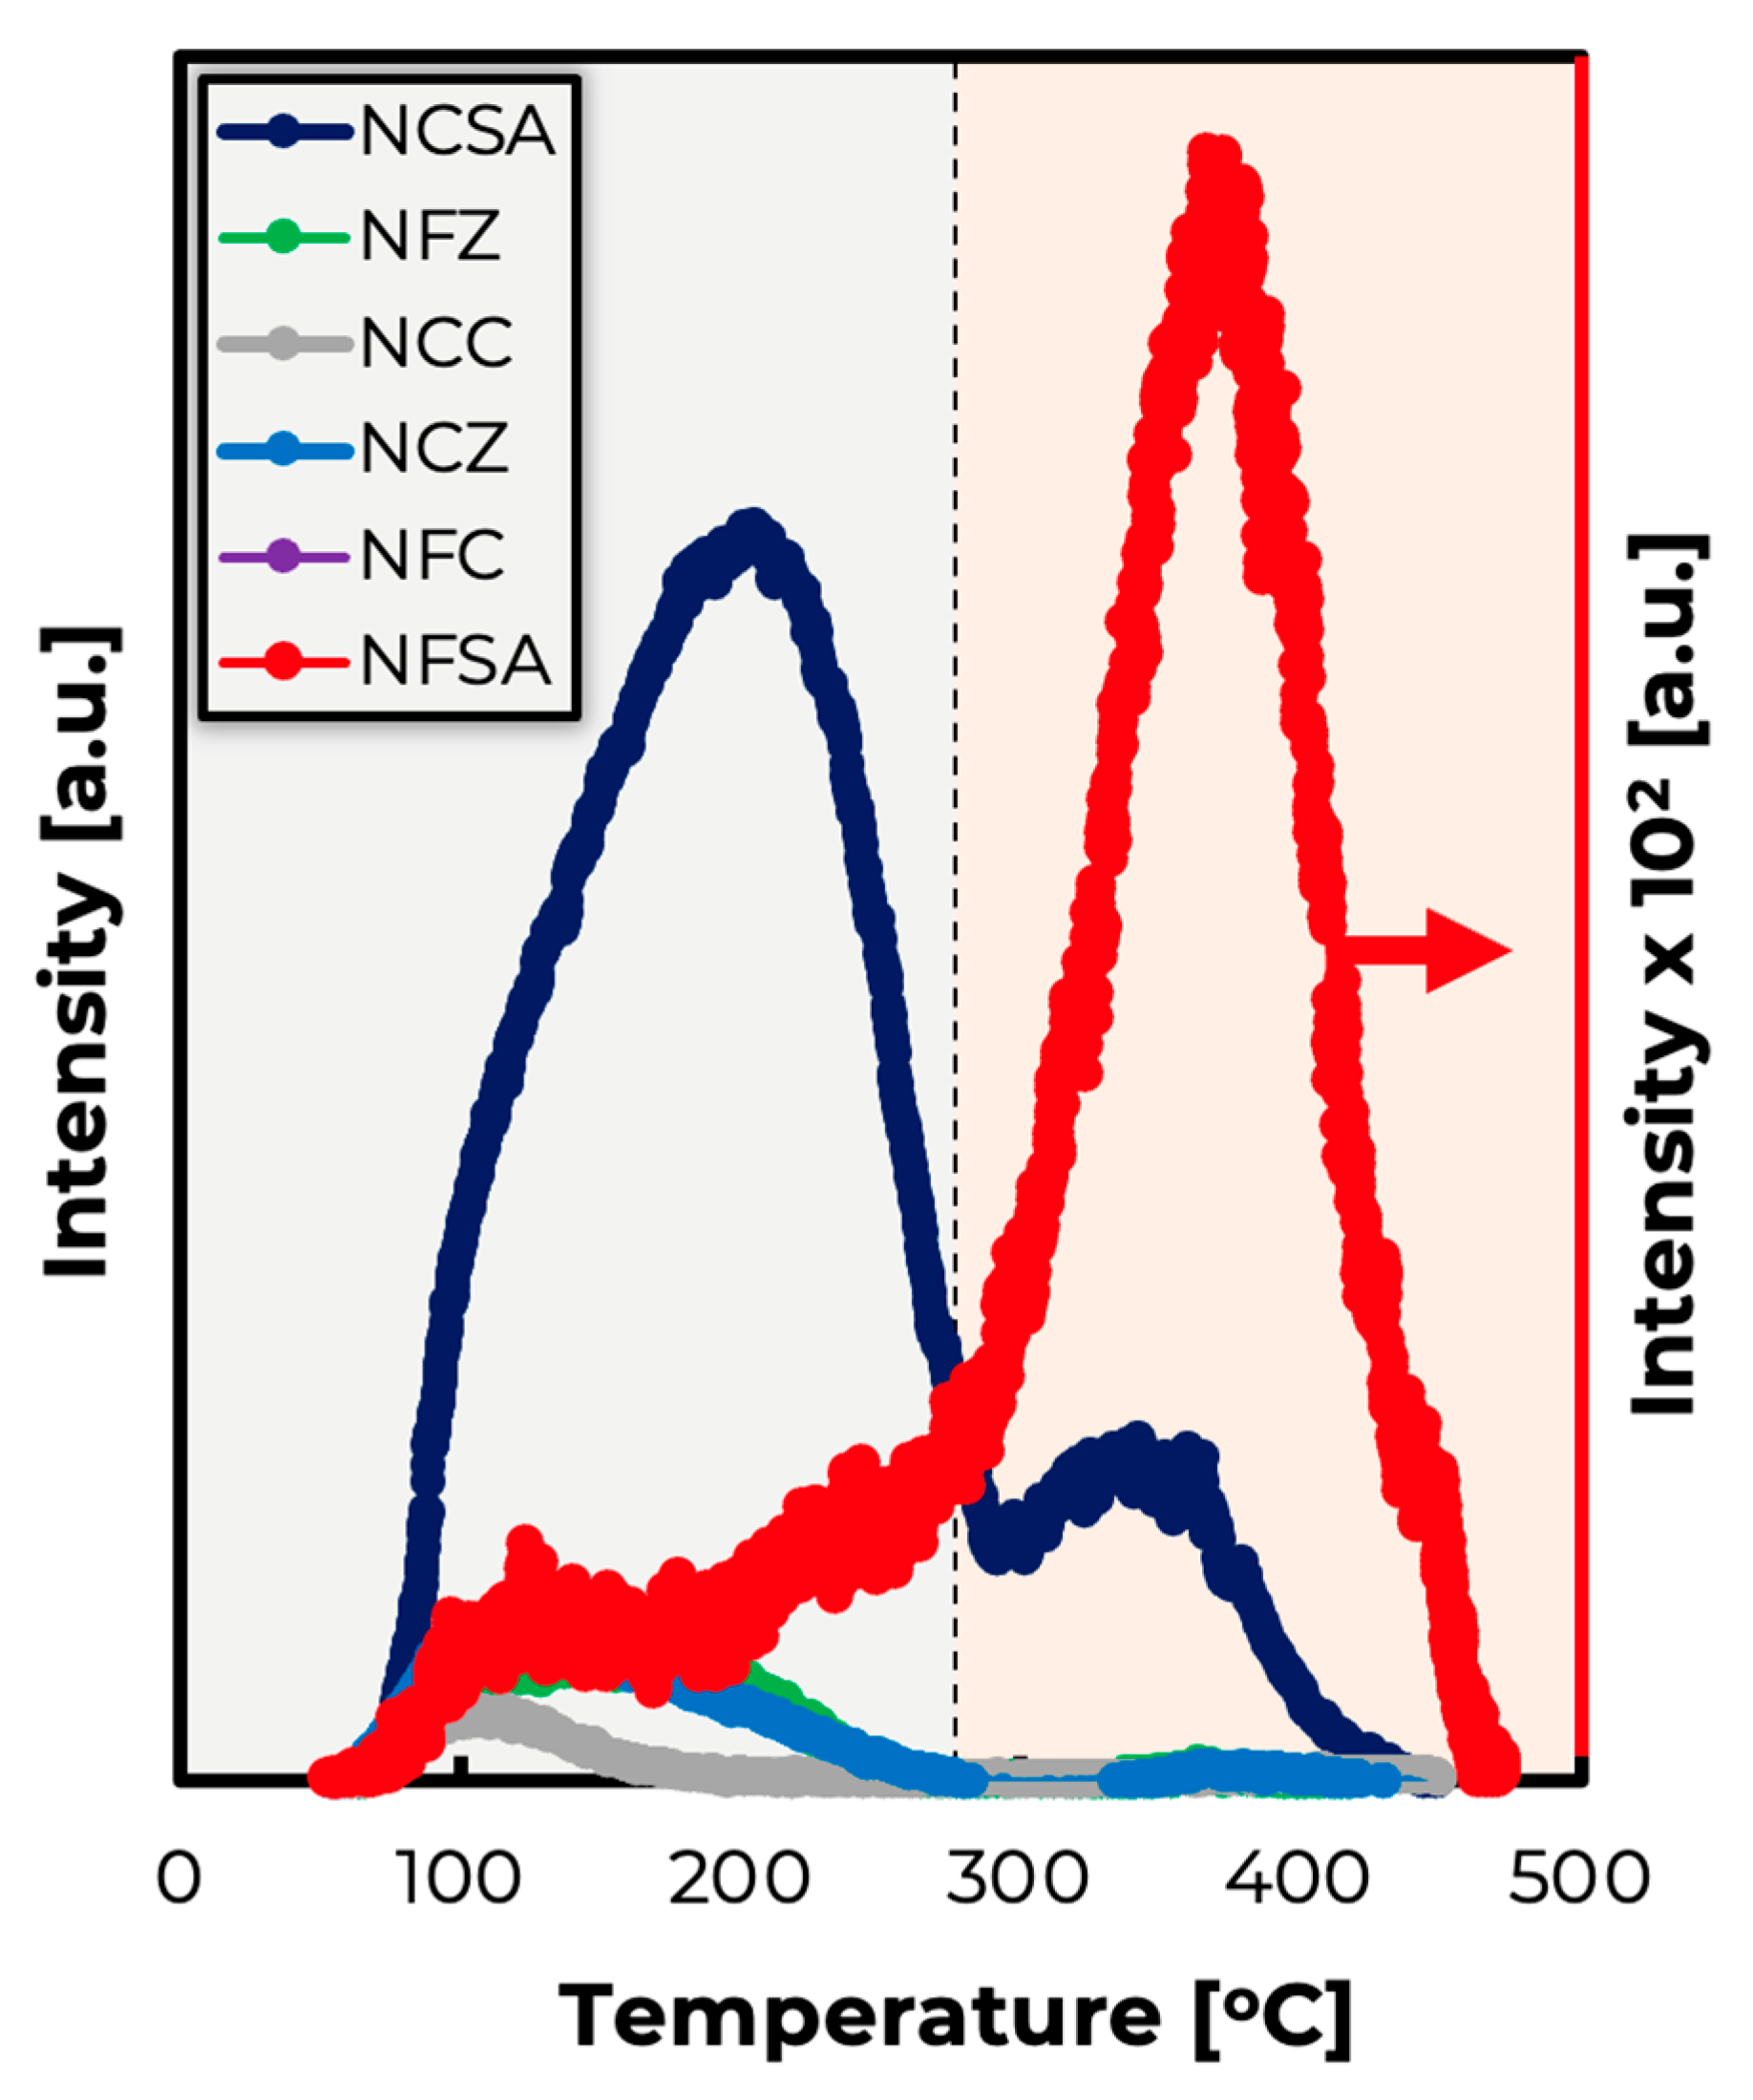
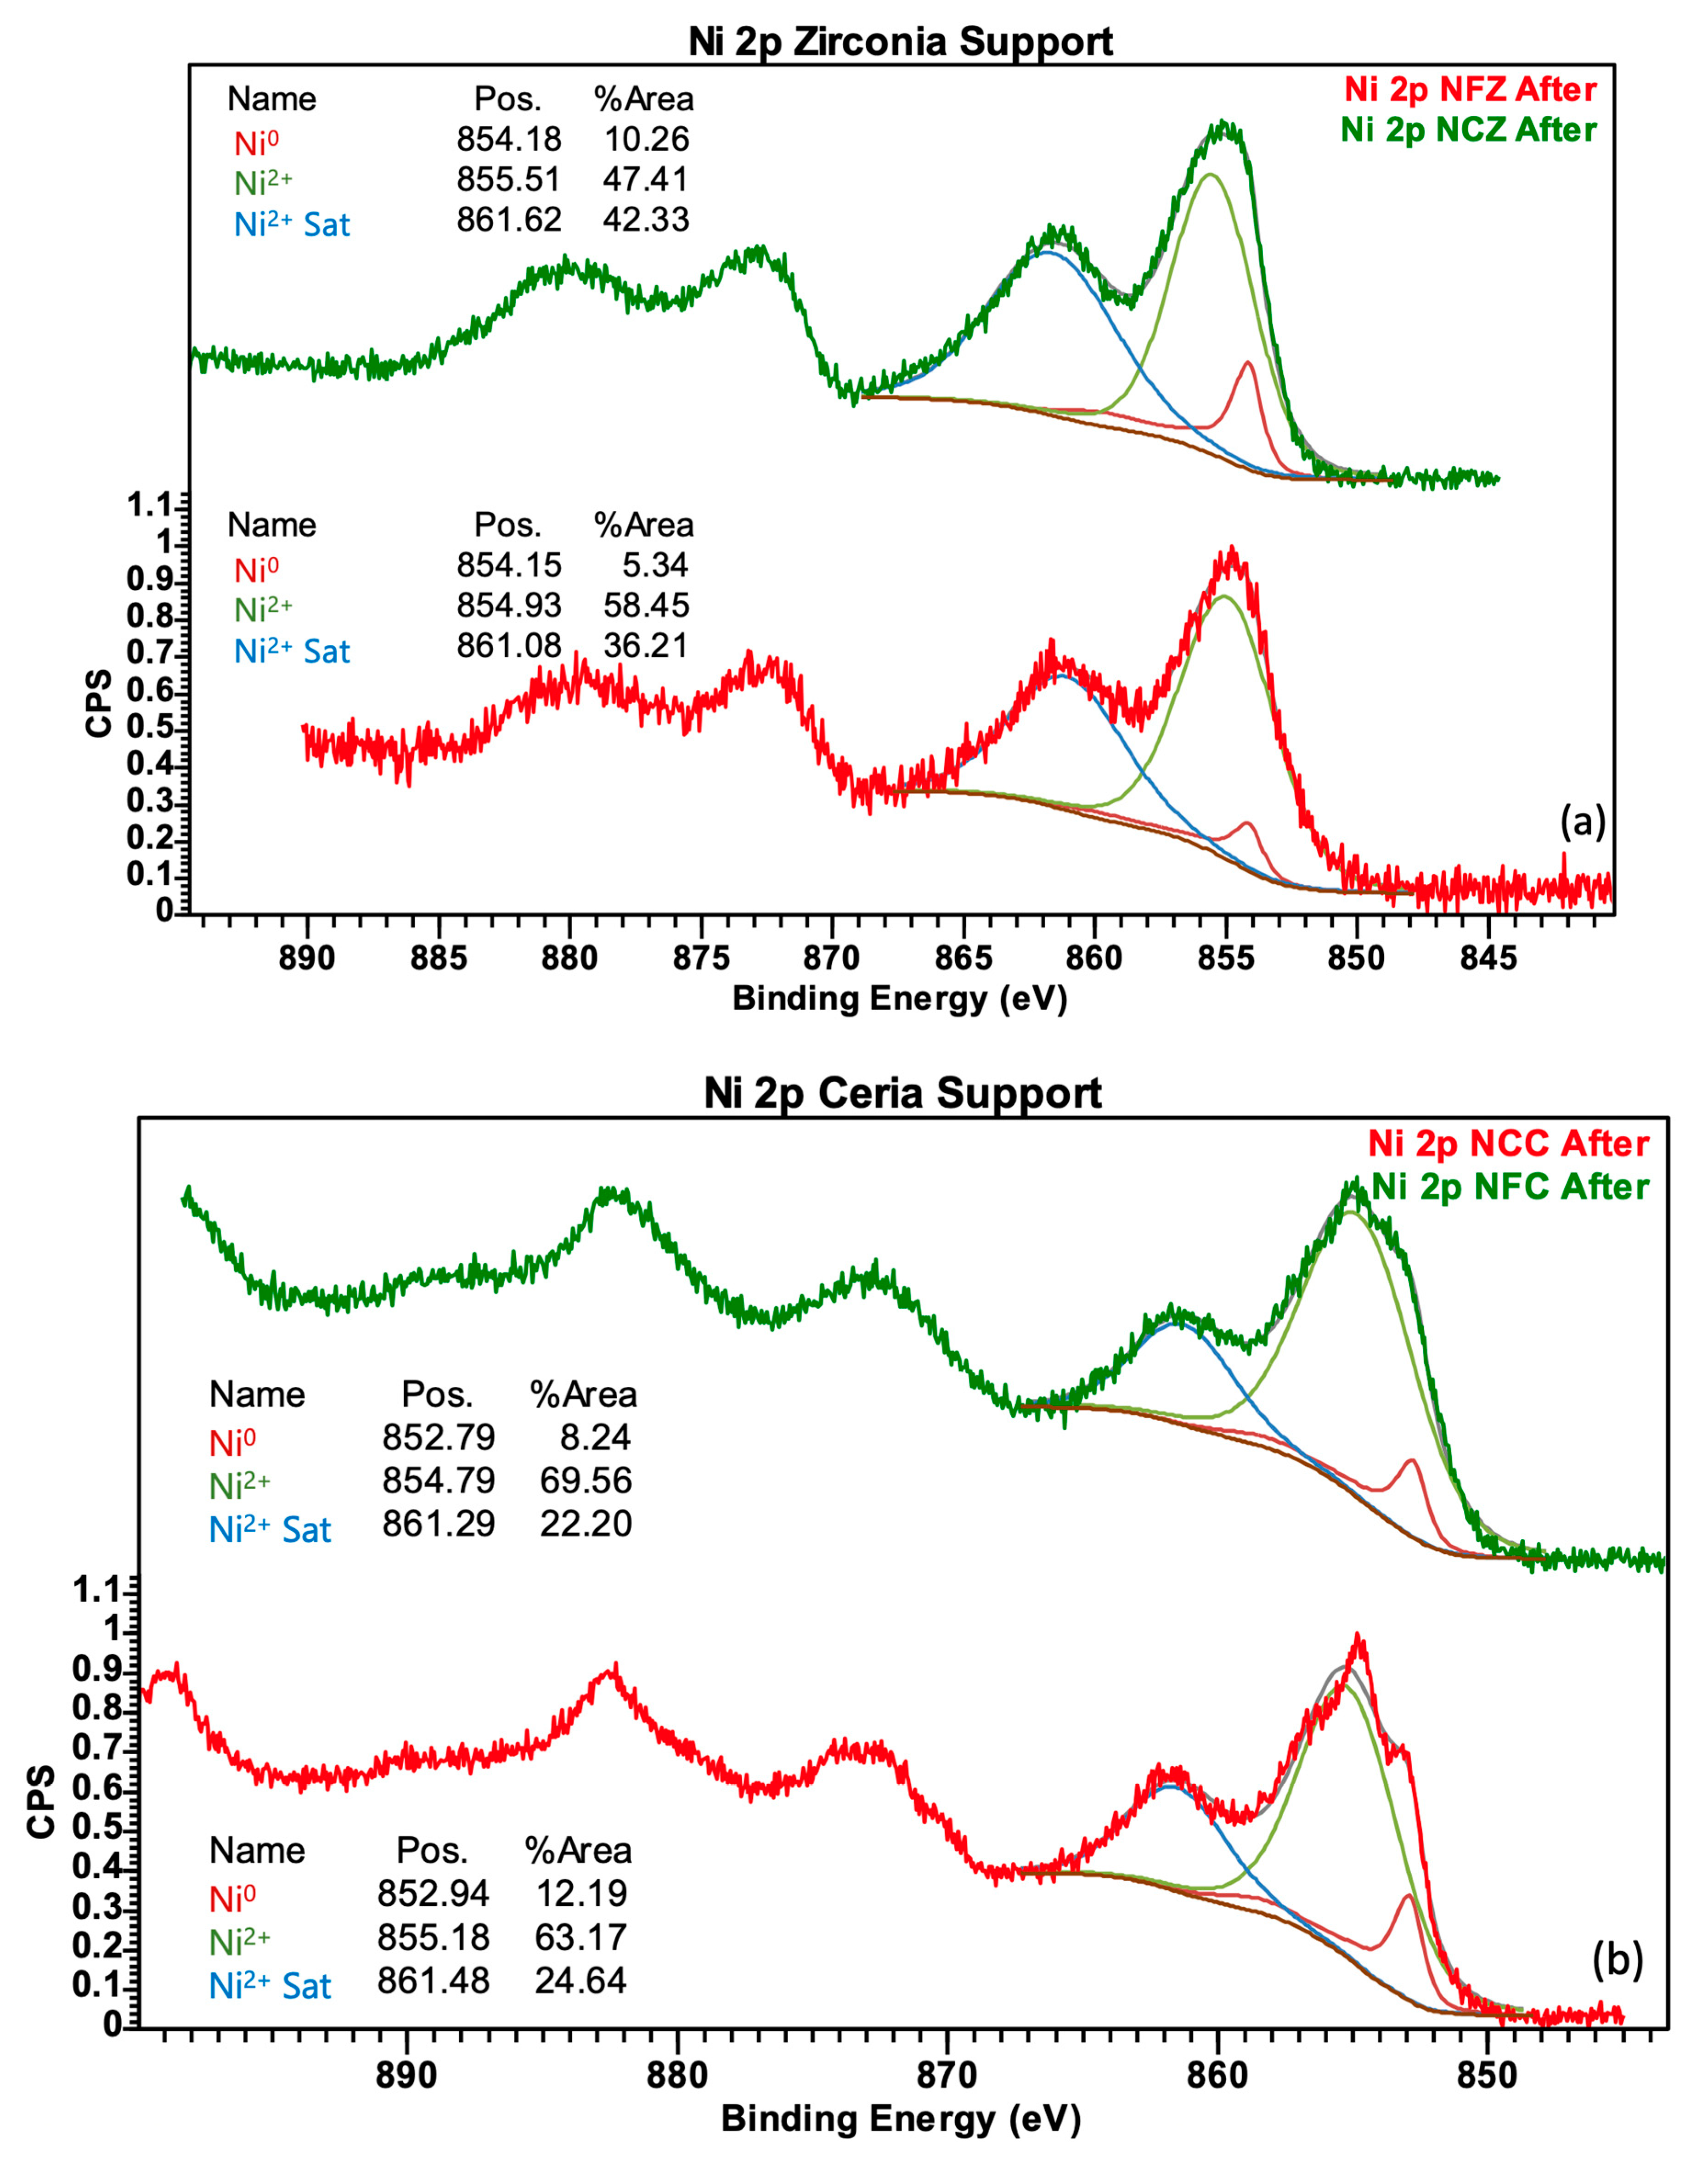
2.3. Spent Catalysts Characterization

Previous work has shown that fouling and coking represent the main deactivation mechanism for supported Ni-Cu and Ni-Fe catalysts since the loss of these metals due to leaching and/or the formation of volatile carbonyls has been determined to be negligible [3]. In this work, Fe-promoted catalysts exhibited superior performance (ranked as NFZ > NFC >> NFSA) compared to their Cu-promoted counterparts, the performance of NFZ being found to be comparable to that of an alumina-supported catalyst (see Figure 6b). Against this backdrop, the spent Fe-promoted catalysts were subjected to thermogravimetric analysis (TGA) under air to gauge their degree of fouling and coking. Figure 7a below shows the TGA profile of the spent Fe-promoted catalysts, all of which displayed their major weight loss below 400 °C, attributed to the removal of reactants, intermediates, products, and/or disordered carbon deposits [12]. The improved performance of NFZ and NFC compared to other catalysts could also be due to their negligible weight loss, which corresponds to low amounts of coke formation. The spent Fe-promoted Ni-catalysts with the least acidity NFC (0.986 µmol/g) and NFZ (39.2 µmol/g), experienced the least amount of weight loss and by extension deactivation due to catalyst coking. In contrast, the spent catalyst with the highest acidity NFSA (3280 µmol/g) showed the highest weight loss of about 14 wt%, which indicates that the high acidity of this catalyst led to a high degree of fouling and coking. Figure 7a also shows that NFZ has physisorbed components on the surface that evolve as the temperature increases to 250 °C. However, as the temperature approaches 400 °C, the TGA trace only shows the weight gain associated with the oxidation of Ni to NiO. Although NFZ and NFA are both suitable for deCOx reactions, the TGA results show that NFZ is less prone to coke-induced deactivation compared to NFA. Figure 7b shows the correlation between acidity and TOF of all supported catalysts studied, illustrating the relationship between deoxygenation activity and support-dependent acidity. In short, the SiO2-Al2O3 support displays the highest and strongest acidity, and the activity of SiO2-Al2O3-supported catalysts is lower than that of other catalysts with higher TOFs, which suggests that a high concentration of strongly acidic sites may not be beneficial for FOG deoxygenation. The latter can be attributed to high and strong acidity leading to deactivation due to fouling and coking observed in the thermograph in Figure 7a. The deviation of NCZ from the inverse correlation between activity and acidity in Figure 7b can be attributed to the nature of its acid sites. Indeed, the pyridine-FTIR spectra for NCZ (Figure A5) show distinct bands at ~1437 cm−1 and ~1587 cm−1—which correspond to Lewis and Brønsted acid sites, respectively—displaying a Brønsted/Lewis ratio of 1.26, the absence of intermediate bands suggesting minimal interaction between the two types of acid site. This fairly balanced distribution of Brønsted and Lewis acidity likely can explain NCZ position within the plot in Figure 7b relative to other catalysts, which are dominated by either Brønsted (SiO2-Al2O3) or Lewis (Ce0.8Pr0.2O2) acidity.

3. Materials and Methods

3.1. Catalysts Preparation

The catalysts were prepared by excess wetness impregnation using Ni(NO3)2∙6H2O, Cu(NO3)2∙3H2O, and Fe(NO3)2∙9H2O as metal precursors and Ce0.8Pr0.2O2, SiO2-Al2O3, and ZrO2 as supports. While SiO2-Al2O3 and ZrO2 supports were sourced commercially, Ce0.8Pr0.2O2 was prepared in-house by co-precipitation method, using Ce(NO3)3∙6H2O) and Pr(NO3)3∙6H2O as precursors following a synthesis procedure that has previously been reported [19]. Ni-Cu and Ni-Fe catalysts were prepared to target metal loadings of 20 wt% Ni and 5 wt% Fe or Cu to afford the following formulations: 20% Ni-5% Fe/Ce0.8Pr0.2O2 (NFC), 20% Ni-5% Cu/Ce0.8Pr0.2O2 (NCC), 20% Ni-5% Fe/SiO2-Al2O3 (NFSA), 20% Ni-5% Cu/SiO2-Al2O3 (NCSA), 20% Ni-5% Fe/ZrO2 (NFZ), and 20% Ni-5% Cu/ZrO2 (NCZ). Briefly, the supports were co-impregnated with the metal precursors and dried overnight at 60 °C under a vacuum oven prior to calcination under static air for 3 h at 500 °C. Afterwards, the calcined catalysts were sieved to afford particles between 150 and 300 µm in size. The resulting catalysts were reduced under a constant 10% H2/Ar flow at 350 °C prior to their use for the deoxygenation of tristearin (a model triglyceride and surrogate for FOG) in a semi-batch reactor.

3.2. Catalyst Characterization

Surface areas, average pore radii, and pore volumes of the fresh catalysts (in their oxidized form) were determined by N2 physisorption at −196 °C using the Brunauer-Emmett-Teller (BET) method, with instrumentation and methodology previously described [11]. Average metal particle size was determined by applying the Scherrer equation to the most intense peak observed in the powder X-ray diffractograms (XRD), which were acquired using equipment and procedures reported in a past contribution [48], using a Phillips X’pert diffractometer with Cu Kα radiation recording in the 2Θ range of 10–90° using a step size of 0.02°. Pulse chemisorption was performed by loading 250 mg of the calcined catalyst samples into a quartz U-tube reactor connected to a Micromeritics (Norcross, GA, USA) Autochem II analyzer equipped with a thermal conductivity detector (TCD). Prior to pulse chemisorption, the calcined catalyst was reduced under flowing 10% H2/Ar (50 sccm) at 350 °C for 1 h. The U-tube reactor was then purged with flowing Ar (50 sccm) at 450 °C for 30 min, followed by cooling to 45 °C. 0.025 mL (STP) of either H2 or O2 was then pulsed into the reactor using Ar as the carrier gas flowing into the reactor at 50 sccm. Pulses were introduced in 3 min intervals until the area of the resulting TCD peaks remained constant.
Ammonia temperature-programmed desorption (NH3-TPD) experiments were performed by loading 250 mg of the calcined catalyst samples into a quartz U-tube reactor connected to an Autochem II analyzer (Micromeritics, Norcross, GA, USA) coupled to a Thermostar mass spectrometer (Pfeiffer, Aßlar, Germany) detector. The calcined catalysts were first reduced at 350 °C for 3 h under a flow (60 sccm) of 10% H2/Ar prior to removing hydrogen from the surface of the catalyst with a flow (100 sccm) of Ar at 450 °C for 30 min and cooling down the catalyst to 30 °C. NH3 adsorption was performed at that temperature by flowing 100 sccm of 1% NH3/N2 for 1 h. Following this NH3 adsorption step, the system was purged with 100 sccm of Ar for 1 h to remove physisorbed NH3. Finally, the temperature of the catalyst was raised from 30 °C to 500 °C at a rate of 10 °C/min using the mass spectrometer to track the signal corresponding to ammonia (m/z = 16). Temperature-programmed reduction (TPR) and temperature-programmed oxidation (TPO) experiments were employed to study the catalyst reducibility and oxidative behavior, respectively, using a Micromeritics AutoChem II chemisorption analyzer equipped with a thermal conductivity detector (TCD) as described in previous reports [48]. Briefly, prior to analysis, the 250 mg fresh catalyst samples were subject to an initial drying step at a temperature of 120 °C for 1 h, under flowing He before cooling to 50 °C. Afterward, 10% H2/Ar or 10% O2/Ar was allowed to flow through the fresh catalyst samples at 100 sccm, after which the temperature was ramped from 25 °C room temperature to 800 °C at a rate of 10 °C/min.
A Nicolet iS50r infrared spectrometer equipped with an MCT/A detector was used to acquire FTIR spectra. 512 scans were collected at a resolution of 4 wavenumbers. The sample was first reduced under a flow (50 sccm) of 10% H2/Ar in a Harrick Scientific Praying Mantis high-temperature reaction chamber at 350 °C for 3 h. The gas flow was switched to helium and the sample was then cooled to ambient temperature. Pyridine was introduced to the sample by switching the gas flow path through a bubbler placed upstream from the reaction chamber. The sample was exposed to pyridine for 60 min, after which the IR bands had stopped increasing in intensity.
X-ray photoelectron spectroscopy (XPS) analyses were performed using a PHI 5000 Versaprobe apparatus with a monochromatic Al Kα1 X-ray source (enhanced with energy of 1486.6 eV, accelerating voltage of 15 kV, power of 50 W, and spot size diameter of 200 µm). Samples were reduced prior to XPS measurements in a Lenton tube furnace under the same conditions the catalysts experienced prior to semi-batch reactions. The reduction was performed by flowing 10% H2 in He (10 mL/min) while the sample was heated at a rate of 10 °C/min to 350 °C and maintaining that temperature for 3 h. This was done in a pre-treatment chamber that can be filled with flowing gas, heated up samples up to 1050 °C, and placed under vacuum, which allows pretreated samples to be transferred to the XPS analysis chamber without exposure to air. The X-ray photoelectron spectra were processed using the CasaXPS software package (version 2.3.25PR1.0), while ionization cross-sections from Landau were used to quantify the semi-empirical relative sensitivity factors.
Transmission electron microscopy (TEM) was performed on the fresh NFZ and NCZ catalysts. Sample preparation involved dispersing the catalyst powders in 1 mL of deionized water via sonication for 20 min. A drop of the resulting suspension was then deposited onto a 400-mesh lacey carbon gold (C/Au) grid, which was then allowed to air-dry. The grids thus prepared were then introduced into a Thermo Scientific (Waltham, MA, USA) Talos F200X analytical electron microscope, operated at 200 keV and equipped with four silicon drift detector-based EDS systems for quantitative chemical analysis and elemental mapping.

3.3. Deoxygenation in a Semi-Batch Mode

Catalyst performance was evaluated for the deoxygenation of tristearin using 0.5 g of catalyst loaded into a 100 mL mechanically stirred stainless steel semi-batch reactor. Prior to the deoxygenation reaction, the catalyst was reduced at 350 °C for 3 h under a flow of 10% H2/N2 (60 sccm) while the reactor was kept pressurized to 0.69 MPa with the use of a back pressure regulator. Afterward, the reactor was allowed to cool before being purged and filled with Ar. This inert gas protected the catalyst from oxidation while 22.75 g of solvent (dodecane 99+%, Alfa Aesar, Haverhill, MA, USA) was introduced to the reactor using a port on the reactor head. The dodecane added continued to protect the catalyst from oxidation while the reactor was opened and 1.8 g of tristearin (95%, City Chemical, Jersey City, NJ, USA), was added resulting in a substrate-catalyst ratio of 3.6. After closing the reactor and purging it with hydrogen the system was pressurized to 4 MPa and a flow of 60 sccm was established. The reactor, which was stirred constantly at 1000 rpm, was then heated to 260 °C and kept at this temperature for 3 h. Subsequently, the system was sequentially cooled with forced air and an ice water bath prior to the collection of products. The reactor contents were filtered to separate the spent catalyst, which was rinsed with chloroform to recover materials adsorbed on the catalyst surface, after which the chloroform was removed from the liquid mixture with the help of a rotary evaporator. Each deoxygenation reaction was performed in duplicate, and the mass balance was >95% in all cases.

3.4. Liquid Product Analysis

The reaction products were analyzed using a gas chromatography (GC) method developed to identify and quantify components in the feed and products obtained from the upgrading of fats and oils to hydrocarbons employed in previous work [12]. Analyses were conducted using an Agilent 7890A GC (Santa Clara, CA, USA) equipped with an Agilent Multimode inlet, a deactivated open-ended helix liner, and a flame ionization detector (FID). Helium served as the carrier gas and the injection volume was 1 µL. The FID was maintained at 350 °C with gas flow rates set to: H2 = 30 mL/min; air = 400 mL/min; makeup = 5 mL/min. The inlet operated in split mode (split ratio 25:1; split flow 50 mL/min) using an initial temperature of 100 °C. Inlet temperature was increased immediately upon injection (at a rate of 8 °C/min) to a final temperature of 320 °C, which was maintained throughout the run. The initial oven temperature of 45 °C was immediately increased upon injection first to 325 °C (at a rate of 4 °C/min) and then to 400 °C (at a rate of 10 °C/min). This temperature was then maintained for 12.5 min, making the total run time 90 min. An Agilent (Santa Clara, CA, USA) J&W DB-5HT column (30 m × 250 µm × 0.1 µm) rated to 400 °C was used with a constant He flow of 2 mL/min. Quantification was performed using cyclohexanone as an internal standard. Agilent Chemstation and SimDis Expert 9 software (Separation Systems Inc., Gulf Breeze, FL, USA) were respectively used to perform chromatographic programming and to process the chromatographic data acquired. Solvents (i.e., chloroform and dodecane) and internal standard (cyclohexanone) were quenched or subtracted prior to processing the data.

4. Conclusions

In this study, a series of Cu- and Fe-promoted Ni-catalysts on different supports—namely, SiO2-Al2O3, Ce0.8Pr0.2O2, and ZrO2—were prepared, characterized, and tested for activity on the conversion of tristearin to fuel-like hydrocarbons via deCOx. Catalyst characterization showed that the acidity of the resulting catalysts was dictated by the support employed and followed the trend SiO2-Al2O3 >> ZrO2 > Ce0.8Pr0.2O2. When these catalysts were tested, two main trends emerged: (1) the diesel yield follows the trend ZrO2 > Ce0.8Pr0.2O2 > SiO2-Al2O3 within both Fe- and Cu-promoted formulations; and (2) Fe promotion leads to higher diesel yields than Cu-promotion irrespective of the catalyst support employed. Whereas acidity appears to be the main feature explaining the first trend, improved dispersion, and metal-specific surface area—and to some extent, Fe-promotion resulting in more active sites—can be invoked to explain the second trend. The combination of results stemming from catalyst characterization and testing allowed for the identification of some structure-activity relationships. For instance, a moderate amount of weakly acidic sites was found to afford the best results, while an excessive amount of more strongly acidic sites results in undesirable cracking and fouling leading to lower selectivity to diesel-like hydrocarbons and/or coke-induced deactivation. Finally, when the performance of the best catalyst identified in this work (NFZ) was compared to that of the corresponding catalyst supported on alumina, both formulations were found to display comparable results. However, the TGA of spent NFZ and NFA formulations suggest that the former is much more resistant to fouling and coking than the latter, which makes NFZ a better formulation to withstand coke-induced deactivation. In short, although both zirconia and alumina are suitable oxidic carriers for catalysts used to convert FOG to diesel-like hydrocarbons via deCOx, zirconia can be considered a promising carrier due to its superior resistance to coking.

Author Contributions

Conceptualization, E.S.-J., and R.P.; methodology, E.S.-J., and R.P.; validation, G.C.U., and T.R.; formal analysis, G.C.U., T.R., and O.H.; investigation, G.C.U., T.R., and O.H.; resources, G.C.; data curation, G.C.U., T.R., and O.H.; writing—original draft preparation, G.C.U. and E.S.-J.; writing—review and editing, R.P., G.C. and O.H.; visualization, G.C.U. and E.S.-J.; supervision, E.S.-J. and R.P.; project administration, E.S.-J.; funding acquisition, E.S.-J. All authors have read and agreed to the published version of the manuscript.

Funding

This material is based upon work supported by the National Science Foundation under Grant No. 1922694. This project was also supported in part by the UKinSPIRE (Seeding Partnerships for International Research Engagement) initiative, an internal seed funding program jointly administered by the University of Kentucky International Center and the Office of the Vice President for Research. This work was also supported in part by a University of Kentucky Sustainability Challenge Grant. This project was also supported by the Graduate School EIPHI (Contract ANR-17-EURE-0002).

Data Availability Statement

The original contributions presented in this study are included in the article. Further inquiries can be directed to the corresponding author.

Acknowledgments

Shelley Hopps and Tonya Morgan are thanked for their assistance with XRD measurements.

Conflicts of Interest

The authors declare no conflicts of interest. The funders had no role in the design of the study; in the collection, analyses, or interpretation of data; in the writing of the manuscript; or in the decision to publish the results.

Appendix A

Figure A1. Separate catalyst TPR profiles showing hydrogen uptake regions at α = 30–200 °C, β = 200–400 °C, and γ = 400–600 °C.
Catalysts 15 00501 g0a1
Figure A2. Temperature-programmed oxidation profiles of the fresh catalysts studied.
Catalysts 15 00501 g0a2
Figure A3. (a) Fe 2p peak for NFZ after treatment (b) Fe 2p peak for NFC after treatment (c) Fe 2p peak for NFSA after treatment (d) Cu 2p peak for NCSA after treatment (e) Cu 2p peak for NCZ after treatment (f) Cu 2p peak for NCC before treatment (g) Cu 2p peak for NCC after treatment.
Catalysts 15 00501 g0a3aCatalysts 15 00501 g0a3b
Figure A4. (a,b) HAADF-STEM image of 20%Ni-5%Cu/ZrO2, (c) particle size distribution, and (d) EDS elemental mapping of Ni, Zr, and Cu, all elements show uniform distribution over ZrO2 support.
Catalysts 15 00501 g0a4
Scheme A1. Proposed reaction scheme for decarboxylation/decarbonylation reaction.
Catalysts 15 00501 sch001
Figure A5. Pyridine-adsorbed FTIR spectrum of NCZ.
Catalysts 15 00501 g0a5

References

  1. Umenweke, G.C.; Santillan-Jimenez, E. Hydrocarbon Biofuels; American Chemical Society: Washington, DC, USA, 2024. [Google Scholar]
  2. Azman, N.S.; Marliza, T.S.; Mijan, N.A.; Yun Hin, T.Y.; Khairuddin, N. Production of Biodiesel from Waste Cooking Oil via Deoxygenation Using Ni-Mo/Ac Catalyst. Processes 2021, 9, 750. [Google Scholar] [CrossRef]
  3. Loe, R.; Lavoignat, Y.; Maier, M.; Abdallah, M.; Morgan, T.; Qian, D.; Pace, R.; Santillan-Jimenez, E.; Crocker, M. Continuous Catalytic Deoxygenation of Waste Free Fatty Acid-Based Feeds to Fuel-Like Hydrocarbons Over a Supported Ni-Cu Catalyst. Catalysts 2019, 9, 123. [Google Scholar] [CrossRef]
  4. Zhang, H.; Lin, H.; Zheng, Y. The role of cobalt and nickel in deoxygenation of vegetable oils. Appl. Catal. B Environ. 2014, 160–161, 415–422. [Google Scholar] [CrossRef]
  5. Zhou, K.; Du, X.; Zhou, L.; Yang, H.; Lei, X.; Zeng, Y.; Li, D.; Hu, C. The Deoxygenation of Jatropha Oil to High Quality Fuel via the Synergistic Catalytic Effect of Ni, W2C and WC Species. Catalysts 2021, 11, 469. [Google Scholar] [CrossRef]
  6. Kung, H.H.; Ko, E.I. Preparation of oxide catalysts and catalyst supports—A review of recent advances. Chem. Eng. J. Biochem. Eng. J. 1996, 64, 203–214. [Google Scholar] [CrossRef]
  7. Zulkepli, S.; Rahman, N.A.; Lee, H.V.; Cheng, C.K.; Chen, W.-H.; Juan, J.C. Synergistic effect of bimetallic Fe-Ni supported on hexagonal mesoporous silica for production of hydrocarbon-like biofuels via deoxygenation under hydrogen-free condition. Energy Convers. Manag. 2022, 273, 116371. [Google Scholar] [CrossRef]
  8. Simakova, I.; Simakova, O.; Mäki-Arvela, P.; Simakov, A.; Estrada, M.; Murzin, D.Y. Deoxygenation of palmitic and stearic acid over supported Pd catalysts: Effect of metal dispersion. Appl. Catal. A 2009, 355, 100. [Google Scholar] [CrossRef]
  9. Silva, G.C.R.; Qian, D.; Pace, R.; Heintz, O.; Caboche, G.; Santillan-Jimenez, E.; Crocker, M. Promotional Effect of Cu, Fe and Pt on the Performance of Ni/Al2O3 in the Deoxygenation of Used Cooking Oil to Fuel-Like Hydrocarbons. Catalysts 2020, 10, 91. [Google Scholar] [CrossRef]
  10. Snåre, M.; Kubičková, I.; Mäki-Arvela, P.; Eränen, K.; Murzin, D.Y. Heterogeneous catalytic deoxygenation of stearic acid for production of biodiesel. Ind. Eng. Chem. Res. 2006, 45, 5708. [Google Scholar] [CrossRef]
  11. Morgan, T.; Grubb, D.; Santillan-Jimenez, E.; Crocker, M. Conversion of Triglycerides to Hydrocarbons Over Supported Metal Catalysts. Top. Catal. 2010, 53, 820–829. [Google Scholar] [CrossRef]
  12. Loe, R.; Santillan-Jimenez, E.; Morgan, T.; Sewell, L.; Ji, Y.; Jones, S.; Isaacs, M.A.; Lee, A.F.; Crocker, M. Effect of Cu and Sn promotion on the catalytic deoxygenation of model and algal lipids to fuel-like hydrocarbons over supported Ni catalysts. Appl. Catal. B Environ. 2016, 191, 147–156. [Google Scholar] [CrossRef]
  13. Gosselink, R.W.; Xia, W.; Muhler, M.; de Jong, K.P.; Bitter, J.H. Enhancing the Activity of Pd on Carbon Nanofibers for Deoxygenation of Amphiphilic Fatty Acid Molecules through Support Polarity. ACS Catal. 2013, 3, 2397–2402. [Google Scholar] [CrossRef]
  14. Loe, R.; Santillan-Jimenez, E.; Crocker, M. Upgrading of Lipids to Fuel-like Hydrocarbons and Terminal Olefins via Decarbonylation/Decarboxylation. In Chemical Catalysts for Biomass Upgrading; Wiley-VCH Verlag GmbH & Co.: Weinheim, Germany, 2020; pp. 497–528. [Google Scholar]
  15. Peng, B.; Yuan, X.; Zhao, C.; Lercher, J.A. Stabilizing Catalytic Pathways via Redundancy: Selective Reduction of Microalgae Oil to Alkanes. J. Am. Chem. Soc. 2012, 134, 9400–9405. [Google Scholar] [CrossRef]
  16. Zuo, H.L.; Liu, Q.; Wang, T.J.; Shi, N.; Liu, J.; Ma, L.L. Catalytic hydrodeoxygenation of vegetable oil over Ni catalysts to produce second-generation biodiesel. J. Fuel Chem. Technol. 2012, 40, 1067–1073. [Google Scholar]
  17. Kumar, P.; Yenumala, S.R.; Maity, S.K.; Shee, D. Kinetics of hydrodeoxygenation of stearic acid using supported nickel catalysts: Effects of supports. Appl. Catal. A Gen. 2014, 471, 28–38. [Google Scholar] [CrossRef]
  18. Maier, W.F.; Roth, W.; Thies, I.; Schleyer, P.V.R. Hydrogenolysis, IV. Gas phase decarboxylation of carboxylic acids. Chem. Berichte 1982, 115, 808–812. [Google Scholar] [CrossRef]
  19. Wang, F.; Pace, R.; Ji, Y.; Jiang, J.; Jiang, X.; Krystianiak, A.; Heintz, O.; Caboche, G.; Santillan-Jimenez, E.; Crocker, M. Effect of Pd promotion and catalyst support on the Ni-catalyzed deoxygenation of tristearin to fuel-like hydrocarbons. Renew. Energy 2022, 195, 1468–1479. [Google Scholar] [CrossRef]
  20. Peng, B.; Zhao, C.; Kasakov, S.; Foraita, S.; Lercher, J.A. Manipulating Catalytic Pathways: Deoxygenation of Palmitic Acid on Multifunctional Catalysts. Chem. A Eur. J. 2013, 19, 4732–4741. [Google Scholar] [CrossRef]
  21. Yakovlev, V.A.; Khromova, S.A.; Sherstyuk, O.V.; Dundich, V.O.; Ermakov, D.Y.; Novopashina, V.M.; Lebedev, M.Y.; Bulavchenko, O.; Parmon, V.N. Development of new catalytic systems for upgraded bio-fuels production from bio-crude-oil and biodiesel. Catal. Today 2009, 144, 362–366. [Google Scholar] [CrossRef]
  22. Khoshroo, G.; Sapi, A.; Imre, S.; Efremova, A.; Bali, H.; B. Ábrahámné, K.; Erdőhelyi, A.; Kukovecz, A.; Kónya, Z. Pure Ni-Based and Trimetallic Ni-Co-Fe Catalysts for the Dry Reforming of Methane: Effect of K Promoter and the Calcination Temperature. Catal. Lett. 2022, 153, 2755–2762. [Google Scholar] [CrossRef]
  23. Harris, P.J.F. Growth and structure of supported metal catalyst particles. Int. Mater. Rev. 1995, 40, 97–115. [Google Scholar] [CrossRef]
  24. Albero, J.; Garcia, H.; Corma, A. Temperature Dependence of Solar Light Assisted CO2 Reduction on Ni Based Photocatalyst. Top. Catal. 2016, 59, 787–791. [Google Scholar] [CrossRef]
  25. Kline, M.J.; Karunarathne, S.A.; Schwartz, T.J.; Wheeler, M.C. Hydrogenation of 2-methylnaphthalene over bi-functional Ni catalysts. Appl. Catal. A Gen. 2022, 630, 118462. [Google Scholar] [CrossRef]
  26. Seelam, P.K.; Balla, P.; Rajendiran, R.; Ravi, B.; Prathap, C.; Lassi, U.; Kim, S.; Vijayanand, P. Activity of Nickel Supported Over Nanorod-Shaped Strontium Hydroxyapatite Catalysts in Selective Methanation of CO & CO2. Top. Catal. 2023, 66, 1391–1405. [Google Scholar]
  27. Hongxia, Q.; Zhiqiang, W.; Hua, Y.; Lin, Z.; Xiaoyan, Y. Preparation and Characterization of NiO Nanoparticles by Anodic Arc Plasma Method. J. Nanomater. 2009, 479, 795928. [Google Scholar]
  28. Taghvaei, H.; Rahimpour, M.R.; Bruggeman, P. Catalytic hydrodeoxygenation of anisole over nickel supported on plasma treated alumina–silica mixed oxides. RSC Adv. 2017, 7, 30990–30998. [Google Scholar] [CrossRef]
  29. Gac, W.; Zawadzki, W.; Kuśmierz, M.; Słowik, G.; Grudziński, W. Neodymium promoted ceria and alumina supported nickel catalysts for CO2 methanation reaction. Appl. Surf. Sci. 2023, 631, 157542. [Google Scholar] [CrossRef]
  30. Zimmer, P.; Tschöpe, A.; Birringer, R. Temperature-Programmed Reaction Spectroscopy of Ceria- and Cu/Ceria-Supported Oxide Catalyst. J. Catal. 2002, 205, 339–345. [Google Scholar] [CrossRef]
  31. Ji, K.; Meng, F.; Xun, J.; Liu, P.; Zhang, K.; Li, Z.; Gao, J. Carbon Deposition Behavior of Ni Catalyst Prepared by Combustion Method in Slurry Methanation Reaction. Catalysts 2019, 9, 570. [Google Scholar] [CrossRef]
  32. Marczewski, M.; Migdał, A.; Marczewska, H. Acidity of the silica–alumina/BX3 superacids. Phys. Chem. Chem. Phys. 2003, 5, 423–429. [Google Scholar] [CrossRef]
  33. Hensen, E.J.M.; Poduval, D.G.; Degirmenci, V.; Ligthart, D.A.J.M.; Chen, W.; Maugé, F.; Rigutto, M.S.; van Veen, J.A.R. Acidity Characterization of Amorphous Silica–Alumina. J. Phys. Chem. C 2012, 116, 21416–21429. [Google Scholar] [CrossRef]
  34. Chizallet, C.; Raybaud, P. Pseudo-Bridging Silanols as Versatile Brønsted Acid Sites of Amorphous Aluminosilicate Surfaces. Angew. Chem. Int. Ed. 2009, 48, 2891–2893. [Google Scholar] [CrossRef] [PubMed]
  35. Castaño, P.; Pawelec, B.; Fierro, J.L.G.; Arandes, J.M.; Bilbao, J. Enhancement of pyrolysis gasoline hydrogenation over Pd-promoted Ni/SiO2–Al2O3 catalysts. Fuel 2007, 86, 2262–2274. [Google Scholar] [CrossRef]
  36. Rebba, E.; Ivanchenko, P.; Bordignon, S.; Samrout, O.E.; Chierotti, M.R.; Cesano, F.; Berlier, G. Exploring hydrophobic surface modifications in silica and alumina nanomaterials. Surf. Interfaces 2024, 51, 104535. [Google Scholar] [CrossRef]
  37. Song, H.; Ozkan, U.S. Changing the Oxygen Mobility in Co/Ceria Catalysts by Ca Incorporation: Implications for Ethanol Steam Reforming. J. Phys. Chem. A 2010, 114, 3796–3801. [Google Scholar] [CrossRef]
  38. Cai, W.; Zhang, B.; Li, Y.; Xu, Y.; Shen, W. Hydrogen production by oxidative steam reforming of ethanol over an Ir/CeO2 catalyst. Catal. Commun. 2007, 8, 1588–1594. [Google Scholar] [CrossRef]
  39. Yang, F.; Bao, X.; Li, P.; Wang, X.; Cheng, G.; Chen, S.; Luo, W. Boosting Hydrogen Oxidation Activity of Ni in Alkaline Media through Oxygen-Vacancy-Rich CeO2/Ni Heterostructures. Angew. Chem. Int. Ed. 2019, 58, 14179–14183. [Google Scholar] [CrossRef]
  40. Lu, Z.; Yang, Z.; He, B.; Castleton, C.; Hermansson, K. Cu-doped ceria: Oxygen vacancy formation made easy. Chem. Phys. Lett. 2011, 510, 60–66. [Google Scholar] [CrossRef]
  41. Rao, M.; Raju, B.; Kamaraju, S. Unique influence of rare earth (Pr, Nd, and Er) oxide surface acidic texture over CeO2/γ-Al2O3 catalysts for selective production of styrene using CO2 flow. Res. Chem. Intermed. 2019, 45, 2749–2770. [Google Scholar]
  42. Kopelent, R.; van Bokhoven, J.A.; Szlachetko, J.; Edebeli, J.; Paun, C.; Nachtegaal, M.; Safonova, O.V. Catalytically Active and Spectator Ce3+ in Ceria-Supported Metal Catalysts. Angew. Chem. Int. Ed. 2015, 54, 8728–8731. [Google Scholar] [CrossRef]
  43. Biesinger, M.C.; Payne, B.P.; Grosvenor, A.P.; Lau, L.W.M.; Gerson, A.R.; Smart, R.S.C. Resolving Surface Chemical States in XPS Analysis of First Row Transition Metals, Oxides and Hydroxides: Cr, Mn, Fe, Co and Ni. Appl. Surf. Sci. 2011, 257, 2717. [Google Scholar] [CrossRef]
  44. Grosvenor, A.P.; Biesinger, M.C.; Smart, R.S.C.; McIntyre, N.S. New interpretations of XPS spectra of nickel metal and oxides. Surf. Sci. 2006, 600, 1771–1779. [Google Scholar] [CrossRef]
  45. Biesinger, M.C. Advanced analysis of copper X-ray photoelectron spectra. Surf. Interface Anal. 2017, 49, 1325–1334. [Google Scholar] [CrossRef]
  46. Santillan-Jimenez, E.; Crocker, M. Catalytic deoxygenation of fatty acids and their derivatives to hydrocarbon fuels via decarboxylation/decarbonylation. J. Chem. Technol. Biotechnol. 2012, 87, 1041–1050. [Google Scholar] [CrossRef]
  47. Chen, H.; Zhang, X.; Zhang, J.; Wang, Q. Tuning the decarboxylation selectivity for deoxygenation of vegetable oil over Pt–Ni bimetal catalysts via surface engineering. Catal. Sci. Technol. 2018, 8, 1126–1133. [Google Scholar] [CrossRef]
  48. Morgan, T.; Santillan-Jimenez, E.; Harman-Ware, A.E.; Ji, Y.; Grubb, D.; Crocker, M. Catalytic deoxygenation of triglycerides to hydrocarbons over supported nickel catalysts. Chem. Eng. J. 2012, 189–190, 346–355. [Google Scholar] [CrossRef]
Figure 1. X-ray diffraction patterns of calcined catalysts studied.
Catalysts 15 00501 g001
Figure 2. Temperature programmed reduction.
Catalysts 15 00501 g002
Figure 3. Temperature-programmed desorption profiles of the catalysts studied (Note: The right y-axis provided for NFSA displays values two orders of magnitude higher than the left y-axis, which corresponds to all other catalysts).
Catalysts 15 00501 g003
Figure 4. (a) Ni 2p peaks for NFZ and NCZ; (b) Ni 2p peaks for NFC and NCC; (c) Ni 2p peaks for NFSA and NCSA after treatment (350 °C, 0.69 MPa, 60 sccm H2/Ar, 3 h).
Catalysts 15 00501 g004aCatalysts 15 00501 g004b
Figure 5. (a,b) HAADF-STEM image of 20%Ni-5%Fe/ZrO2, (c) particle size distribution, and (d) EDS elemental mapping of Ni, Zr, and Fe, all elements show uniform distribution over ZrO2 support.
Catalysts 15 00501 g005
Figure 6. (a) Renewable diesel yield (in %) and apparent turnover frequencies (in sec−1) of the catalysts studied; (b) Yield (in %) of C10–C17 over NFZ and NFA catalyst. Reaction conditions: 0.25 g catalyst, reaction temperature 260 °C, H2 pressure 4 MPa, tristearin amount 1.8 g, n-dodecane amount 22.75 g, and reaction time 3 h.
Catalysts 15 00501 g006
Figure 7. (a) TGA profiles of Fe-promoted catalysts spent upgrading tristearin (b) Correlation plot between activity (TOF) and acidity.
Catalysts 15 00501 g007
Table 1. Textural properties of the promoted Ni-based catalysts with different supports.
CatalystSurface Area (m2/g)Pore Volume (cm3/g)Pore Width
(nm)
NiO Particle Size (nm)
Ce0.8Pr0.2O2 Support740.146.8-
NFC410.065.310.4
NCC450.086.620.5
SiO2-Al2O3 Support5170.734.8-
NFSA3650.343.710.2
NCSA2080.224.010.4
ZrO2 Support870.227.7-
NFZ500.138.710.7
NCZ420.138.119.7
Table 2. NH3-TPD, H2-, and O2-pulse chemisorption results of catalysts studied.
CatalystH2 Uptake (cm3/g)Ni Specific Surface Area (m2/g)O2 Uptake (cm3/g)Acidity (µmol/g)
NFC0.2017.00.3120.99
NCC0.1033.60.36810.5
NFSA0.1575.50.1593280
NCSA0.0511.80.197215
NFZ0.29310.20.29639.2
NCZ0.1946.80.32933.5
Table 3. Surface Concentration (in at.%) of elements detected via XPS.
CatalystNi (Ni0) *COFeCuZrAlSiCePr
NFZ6.3 (0.31)12.4649.524.79-26.94----
NCZ8.9 (0.92)11.3750.45-2.7126.57----
NFC14.5 (1.18)36.1732.847.65----7.791.05
NCC15.3 (2.03)4031.84-3.85---6.801.86
NFSA4.36 (0.16)5.7234.195.96--38.5711.19--
NCSA2.77 (0.40)3.9941.14-0.58-23.4928.03--
* Ni × Ni0 % Area.
Table 4. Results of testing Fe- and Cu-promoted Ni catalysts on different supports for activity in tristearin deoxygenation using a semi-batch reactor.
CatalystsConversion (%)Selectivity to (% yield of) C10–C18Selectivity to (% yield of) C17Selectivity to (% yield of) C18TOF (sec−1) a
NFC8285 (69)61 (50)4 (3)6.9
NCC3789 (33)69 (25)0 (0)6.4
NFSA2993 (27)23 (7)48 (14)3.4
NCSA3020 (6)8 (2)8 (2)2.3
NFZ100100 (100)62 (62)7 (7)6.8
NCZ3794 (35)72 (27)0 (0)3.6
a Based on chemisorption results [46]. Reaction conditions: 0.5 g catalyst, reaction temperature 260 °C, H2 pressure 4 MPa, tristearin amount 1.8 g, n-dodecane amount 22.75 g, and reaction time 3 h. Turnover Frequency (TOF) (sec−1) = m o l   o f   t r i s t e a r i n   c o n v e r t e d m o l   o f   s u r f a c e   N i   s i t e s × t i m e   ( s ) . Conversion: wt% of product with bp <375 °C. Selectivity to C10–C18: 100 × [ w t %   w i t h   b p < 314   ° C w t %   w i t h   b p < 177   ° C w t %   o f   p r o d u c t   w i t h   b p < 375   ° C ]. Selectivity to C17: 100 × [ w t %   w i t h   b p < 314   ° C w t % w i t h   b p < 295   ° C w t %   o f   p r o d u c t   w i t h   b p < 375 ° C ]. Selectivity to C18: 100 × [ w t %   w i t h   b p < 325   ° C w t %   w i t h   b p < 314   ° C w t %   o f   p r o d u c t   w i t h   b p < 375   ° C ].
Disclaimer/Publisher’s Note: The statements, opinions and data contained in all publications are solely those of the individual author(s) and contributor(s) and not of MDPI and/or the editor(s). MDPI and/or the editor(s) disclaim responsibility for any injury to people or property resulting from any ideas, methods, instructions or products referred to in the content.

