Article

Optimizing Methane Oxidative Coupling over La2O3: Kinetic and Product Analysis

School of Physical Science and Technology, ShanghaiTech University, Shanghai 201210, China
*
Author to whom correspondence should be addressed.
Catalysts 2025, 15(5), 499; https://doi.org/10.3390/catal15050499
Submission received: 26 December 2024 / Revised: 12 May 2025 / Accepted: 19 May 2025 / Published: 20 May 2025

Abstract

:
The oxidative coupling of methane (OCM) is a promising process for converting methane directly into more valuable ethane and ethylene. In this work, high time resolution online mass spectrometry was employed to track the OCM reaction over a commercial La2O3 catalyst, focusing on the effects of methane to oxygen ratio, gas hourly space velocity (GHSV), and the presence of H2O and CO in the feed gas on methane conversion and C2 yield. The results demonstrated that an optimized GHSV (44,640 to 93,000 mL·g−1·h−1) and methane to oxygen ratio (CH4/O2 = 3) would achieve the highest methane conversion and C2 yield at 740 °C. Furthermore, at a GHSV of 44,640 mL·g−1·h−1, the introduction of 1% H2O into the reaction mixture resulted in a twofold increase in C2 yield at 650 °C, while the addition of 1% CO led to a threefold increase in C2 yield at 550 °C. A model in which only the front-end catalyst is active was also developed to show excellent agreement with the experimental data. The relationship between catalytic performance and the effective catalyst position in the catalyst bed provides important insights into optimizing reactor design and operating conditions to maximize C2 yield and selectivity in the OCM reaction.

1. Introduction

Methane, as the primary component of natural gas, holds substantial industrial value due to its abundance and versatility. It serves as a fundamental feedstock in the chemical industry, where it is converted into high-value products such as ethane and ethylene [1,2]. Among the various pathways for methane conversion, the oxidative coupling of methane (OCM) presents an effective and promising route for the direct transformation of methane into these valuable industrial compounds [3,4,5,6]. Due to its high activity in OCM and its high selectivity towards C2 hydrocarbons at low temperature, La2O3 has been widely investigated and explored in research [7,8,9,10]. However, the C2 yield achieved by the La2O3 catalyst falls short of meeting broadly accepted techno-economic targets of ~35% C2 product yield and 90% C2 selectivity [4,11]. To further enhance methane conversion and C2 yield in La2O3-based systems, thereby bringing the OCM process closer to achieving its desired industrial targets, an in-depth investigation of the reaction conditions is required.
Many researchers have extensively investigated the reaction conditions for the OCM process [12,13,14,15,16]. Yaghobi et al. [12] conducted a parameter study on the GHSV and the methane to oxygen ratio in the OCM reaction. They found that, in the Sn/BaTiO3 system, the optimal conditions for achieving the highest C2 yield occur when the methane to oxygen ratio is 2 and the GHSV ranges from 8000 to 12,000 mL·g−1·h−1. Ahari et al. [13] demonstrated that at higher GHSV ranges (12,765–15,790 mL·g−1·h−1), increasing GHSV significantly enhances C2 selectivity. In contrast, Karimi et al. [14], investigating the same catalytic system at lower GHSV ranges (1300–2200 mL·g−1·h−1), reported that higher GHSV leads to a decrease in C2 yield. This difference suggests that high GHSV and low GHSV may involve different reaction mechanisms. Therefore, a systematic analysis across a broader GHSV range is necessary to fully elucidate the impact of GHSV on both C2 selectivity and yield. Achieving a balance between selectivity and yield through a unified perspective is crucial for optimizing catalyst design and enhancing catalytic performance.
Another method for changing the operating parameters is to introduce H2O into feed gas. Ni et al. [15] investigated the effect of H2O on the Mn2O3–Na2WO4/TiO2 catalyst (CH4:O2 = 3:1, total GHSV of 7200 mL·g−1·h−1). Adding 20% H2O increased methane conversion from 33.0% to 35.5% and improved C2–C3 selectivity from 62.1% to 66% at 700 °C, demonstrating that H2O enhances catalytic performance. In addition, Aydin et al. [17] separately investigated the role of water in the OCM reaction (O2–OCM) and the OCM reaction with N2O (N2O–OCM) systems. The results indicated that H2O can enhance methane conversion and C2 selectivity, with this positive promoting effect being more pronounced in the O2–OCM system. Other researchers have also explained the promoting effect of water from the perspective of the water-mediated enhancement of selective surface O species [18] or ·OH radicals [19]. However, studies on the promoting effect of water in the literature are primarily limited to the Mn2O3–Na2WO4 system, with very few investigations related to the La2O3 system. Considering the unique catalytic properties of La2O3, further research on its interaction with water could provide valuable insights into optimizing OCM performance.
The above research studied the effects of parameters such as GHSV, the methane to oxygen ratio, and the addition of H2O into the feed gas on the catalytic performance of the OCM reaction. However, while valuable insights have been provided, the conclusions have shown some variation and may benefit from more systematic and comprehensive investigation to fully understand these influences. To gain a clearer understanding of how these parameters influence the catalytic performance of the La2O3 system, this work conducted a comprehensive experimental investigation of the operating parameters. The specific operating parameters include the methane to oxygen ratio, GHSV, and the addition of H2O and CO to the feed gas. By tracking the reaction process by online mass spectrometry, we were able to directly observe the impact of these parameters on crucial catalytic performance indicators such as methane conversion, C2 yield, and C2 selectivity in the OCM reaction. Further analysis discusses the location of the active catalytic position within the reactor and establishes a model in which only the front-end catalyst remains active, while the rest gradually deactivates due to poisoning as the OCM reaction progresses. This model explains the observed effects of various experimental parameters on catalytic performance indicators.

2. Results

2.1. Effect of Methane to Oxygen Ratio
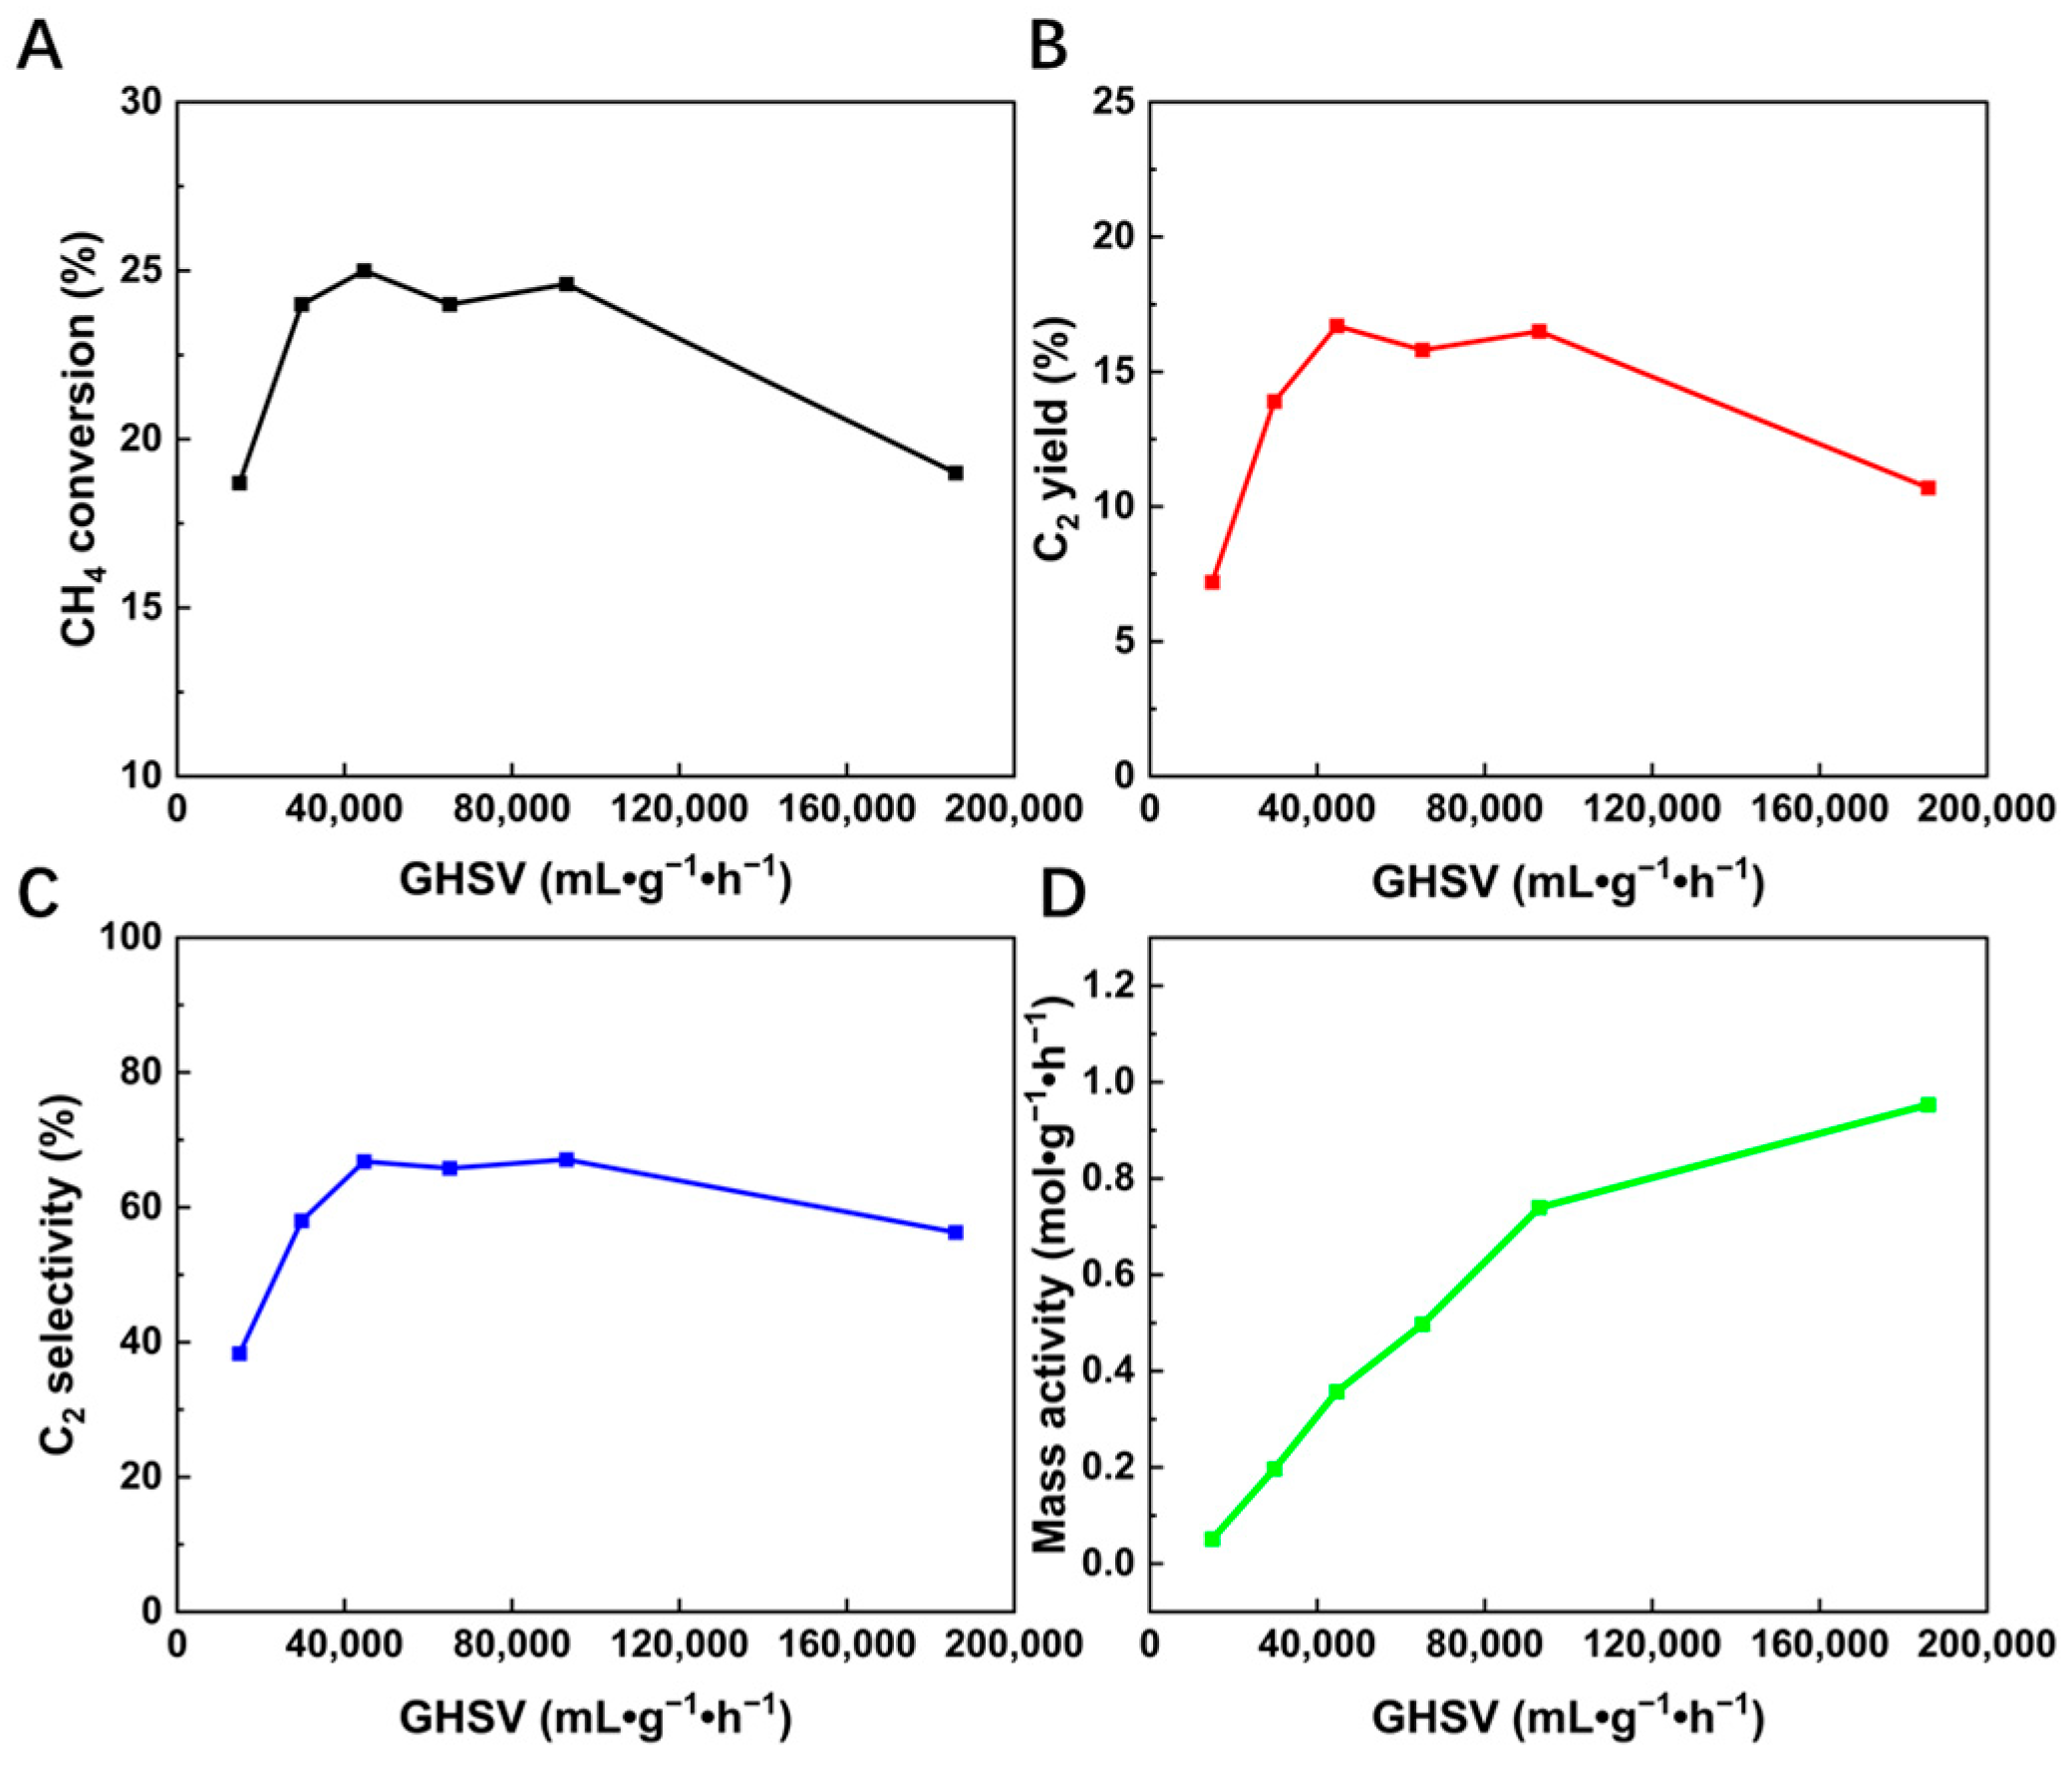
The effect of the methane to oxygen ratio was investigated by comparing the CH4 conversion, CO2 yield, and C2 yield in the OCM reaction over the La2O3 catalyst. Three distinct methane to oxygen ratios, namely 3:1, 5:1, and 10:1, were selected for the experimental investigations. As shown in Figure 1A, for GHSV = 44,640 mL·g−1·h−1, the best results for methane conversion are achieved at CH4:O2 = 3:1, indicating that a higher oxygen content improves the catalytic activity of La2O3 catalyst in OCM reaction. When CH4:O2= 3:1, the curve of methane conversion rises rapidly with increasing temperature, stabilizing only around 650 °C. The C2 yield follows a similar trend. In contrast, under conditions with a higher methane to oxygen ratio, the rate of increase in methane conversion slows down around 520 °C. As shown in Figure 1B,C, this slowdown in methane conversion can be explained by the stabilization of CO2 production after 520 °C, while C2 products have not yet started to form. This indicates that under low oxygen partial pressure conditions, methane activation is limited, hindering further conversion.
Figure 1D shows that the selectivity of C2 products at different methane to oxygen ratios is similar at 740 °C. However, at 650 °C, significant differences in C2 selectivity are observed. Specifically, for a methane to oxygen ratio of 3:1, the C2 selectivity reaches 69%, while for ratios of 5:1 and 10:1, it is 38% and 43%, respectively. These results indicate that a higher oxygen concentration (at a CH4/O2 ratio of 3:1) significantly enhances the C2 selectivity at lower temperatures. To further investigate the impact of oxygen content, we examined the oxygen consumption under different methane to oxygen ratios. In Figure S1, under the conditions of a methane to oxygen ratio of 3:1, the higher oxygen concentration ensures that oxygen is fully consumed at 740 °C, even though the reaction rate is relatively slow. In contrast, at methane to oxygen ratios of 5:1 and 10:1, oxygen is consumed more rapidly initially but not fully depleted. The experimental observation can be explained by the role of a higher oxygen partial pressure in facilitating the formation of methyl radicals (·CH3). As reported in the literature [20], at lower CH4/O2 ratios, the formation of methyl radicals was improved by the high partial pressure of O2 to achieve high CH4 conversion. However, at higher CH4/O2 ratios, the excess methane may competitively occupy oxidative active sites on the catalyst surface, limiting the oxygen’s ability to generate sufficient methyl radicals. As a result, the lower oxygen partial pressure under these conditions reduces the formation of methyl radicals, which in turn hinders methane activation and reduces methane conversion.

2.2. Effect of GHSV

In this work, the influence of GHSV is investigated by varying the sample mass and flow rate. The GHSV values range from 14,880 to 186,000 mL·g−1·h−1. The specific experimental settings are listed in Table S1. It should be noted that the methane to oxygen ratio in all experiments was optimized to 3:1. In these tests, methane conversion, C2 yields, C2 selectivity, and mass activity were all measured at a constant temperature of 740 °C. As shown in Figure 2A–C, both methane conversion, C2 yields and C2 selectivity first increase and then decrease with the rise in GHSV, reaching their optimal values within the GHSV range of 44,640–93,000 mL·g−1·h−1. In this study, the trend in C2 selectivity is consistent with that of methane conversion and C2 yield. Moreover, within a specific range of GHSV (44,640–93,000 mL·g−1·h−1), both C2 selectivity and yield remain at high levels. By enhancing C2 selectivity without compromising C2 yield, this study offers a new pathway for the industrial feasibility of direct methane conversion into high-value C2 products.
Figure 2D further illustrates the relationship between GHSVs and mass activity (in mol·g−1·h−1). In a reactor with a uniform temperature, the mass activity of the catalyst generally does not change with changes in GHSV. However, in this study, the mass activity increased with rising GHSVs, suggesting that not all parts of the catalyst are equally active throughout the reactor. Even when the GHSV reaches 186,000 mL·g−1·h−1, with a catalyst mass as low as 6 mg, the mass activity remains significant, with methane conversion still close to 19% and C2 selectivity exceeding 56% (Table 1). This indicates that even a minimal amount of a catalyst can yield considerable catalytic activity in a microreactor setup.

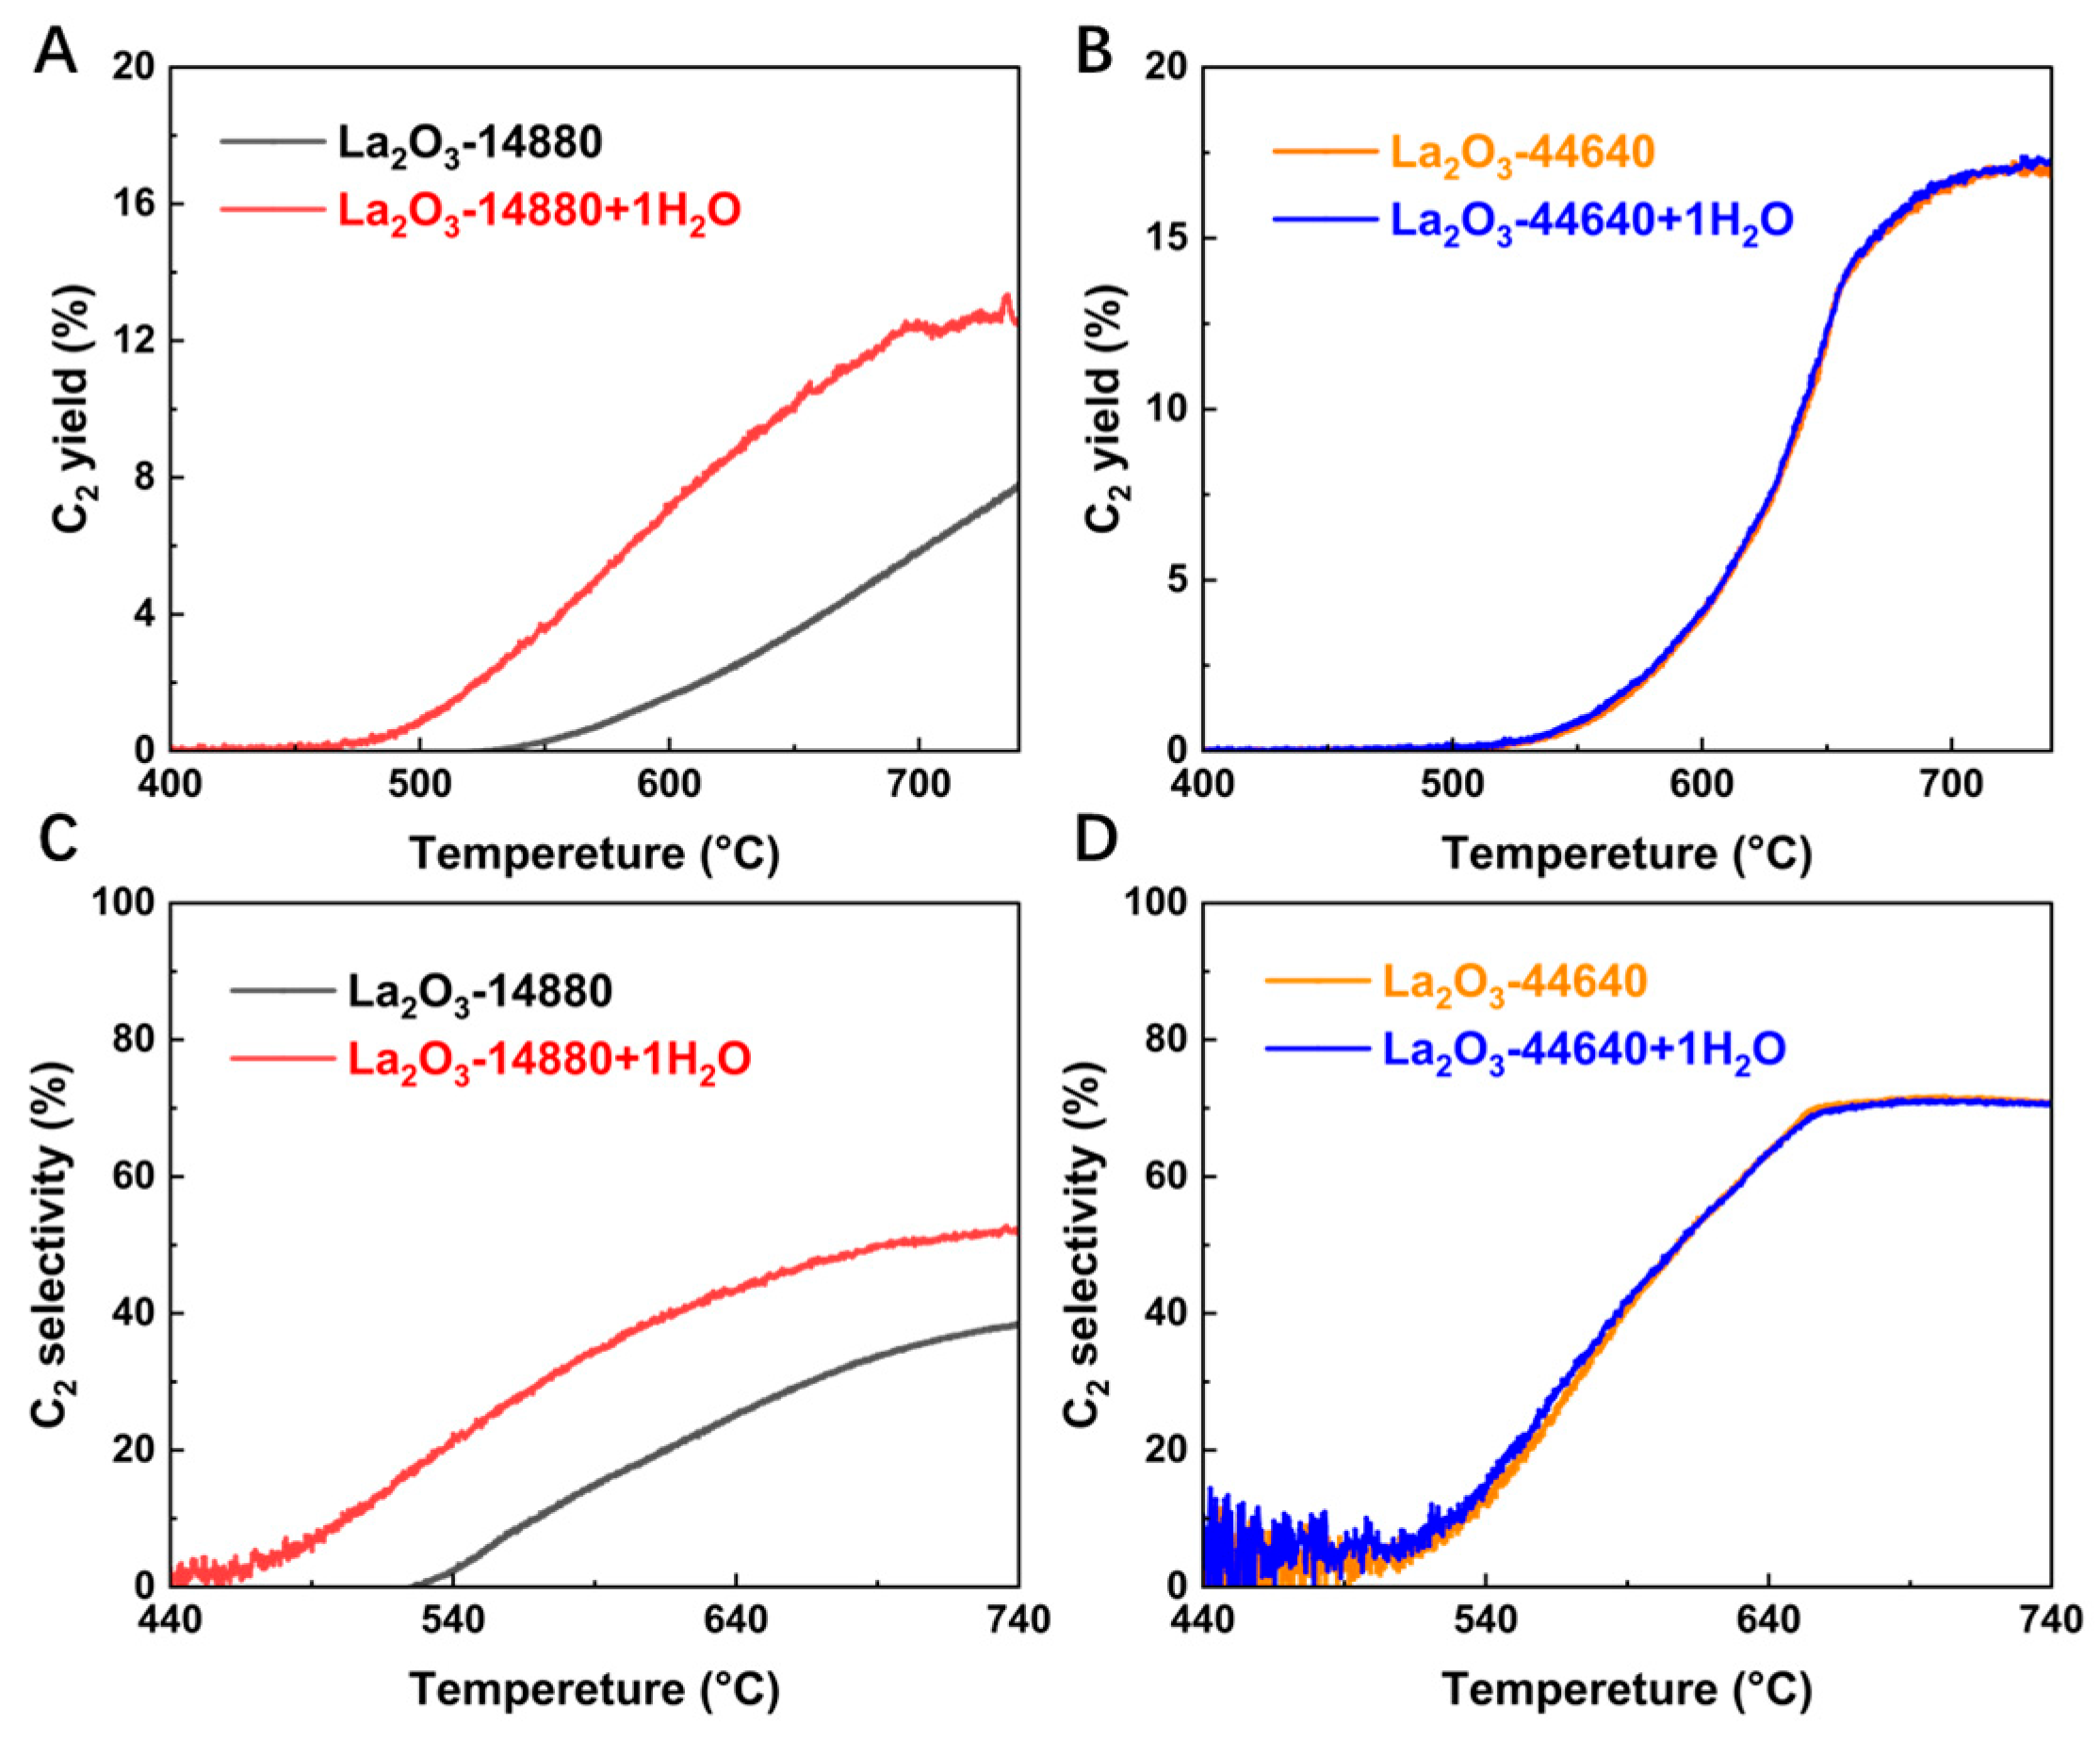
2.3. Effect of H2O in the Reaction Gas

To investigate the impact of adding water to the reaction gas on catalyst performance, two sets of OCM experiments were designed. Each set of experiments was conducted under two different GHSV conditions, namely 14,880 mL·g−1·h−1 and 44,640 mL·g−1·h−1, representing the lowest and the optimal GHSV values within the range explored in this study. For each GHSV condition, one group included the addition of 1% water in the reaction gas, while the other served as a control group in the absence of water.
As shown in Figure 3A, at a GHSV of 14,880 mL·g−1·h−1, the addition of 1% water not only lowered the activation temperature for C2 product formation by approximately 100 °C (from 540 °C to 440 °C), but also nearly doubled the C2 yield in both the low temperature (650 °C) and high temperature (740 °C) ranges. At the same time, it can be seen from Figure 3C that the methane conversion of the system with water added increased by 5% and the C2 selectivity increased by 14.4%. These results suggest that the addition of water significantly enhances the performance of the La2O3 catalyst. As shown in Figure 3B,D, at 44,640 mL·g−1·h−1 (the optimized GHSV), the C2 yield and C2 selectivity curves for the water-added group (blue) and the non-water group (orange) completely overlap, indicating that the addition of water has no effect on catalytic performance. The effect of adding water to the reaction gas varies significantly under different GHSV conditions. This demonstrates that only at lower GHSVs, where the contact time between the catalyst and water vapor is sufficiently long, can the catalytic activity be markedly improved.
It is noteworthy that water is also a product of the OCM reaction, accounting for approximately 10%. However, the introduction of just 1% H2O into the reaction gas significantly enhances catalytic activity. This suggests that the role of added water differs from that of the water produced during the OCM reaction. First, the interaction of added water with the catalyst involves unique chemical pathways, such as the formation of ·OH radicals [19], which are absent or less pronounced in the case of produced water. These radicals play a crucial role in enhancing reaction kinetics and improving the overall efficiency of the OCM process. Secondly, added water directly participates in the reaction mechanism by promoting the formation of active oxygen species on the catalyst surface. These species facilitate the activation of methane and the subsequent formation of C2 products [18]. In contrast, water produced during the reaction does not effectively interact with the catalyst due to its location downstream of the reaction zone.
However, under high gas flow conditions, the experimental results indicate that the addition of water does not significantly enhance catalytic performance. This observation suggests that the second explanation—water’s role in promoting active oxygen species—is more plausible. If the enhancement of catalytic activity were primarily due to the formation of ·OH radicals (first explanation), then this effect should still be observed at high gas flow rates, as the chemical nature of water remains unchanged. However, our experiments show that the promotional effect of water diminishes at high flow rates, implying that its influence is dependent on sufficient residence time on the catalyst surface. This suggests that ·OH radical formation alone is not the dominant mechanism, as its effect should not be limited by flow conditions. Instead, the key factor determining water’s promotional effect is its ability to sufficiently interact with the active catalyst sites before being swept away by the gas flow, which aligns well with the second explanation regarding the formation of active oxygen species.

2.4. Effect of CO in the Reaction Gas

The effect of CO was studied by adding 0%, 1%, and 5% CO into the reaction gas. All experiments were conducted under the optimized methane/oxygen ratio (3:1) and GHSV (44,640 mL·g−1·h−1). As shown in Figure 4A,B, after the addition of 5% CO, both CH4 conversion and C2 yield are significantly lower compared to the control group in the absence of CO. This is attributed to the poisoning effect of CO2 [21], which is generated from the reaction between the added CO and oxygen. However, similar results were not observed in the experimental group with 1% CO addition. The C2 yield with 1% CO addition is slightly lower than that of the control group without CO. As shown in Table 2, at 550 °C, the introduction of 1% CO into the feed gas led to a significant enhancement in C2 yield, increasing from 0.77% in the control group to 2.5%, which is more than three times higher. This significant difference highlights the crucial role of CO in enhancing catalytic performance at lower temperatures. It is well known that low-temperature C2 production in the OCM reaction holds substantial economic value, and this effect of CO underscores its important research potential.
The distinctly different effects observed with varying concentrations of CO indicate that only low concentrations of CO can enhance catalytic performance. Figure 4C illustrates the dynamic changes in CO2 production under different CO concentrations. With 1% CO added, a small amount of CO2 begins to form when the reaction temperature reaches around 250 °C. However, with 5% CO, a large amount of CO2 is generated in the temperature range between 300 °C and 400 °C. This suggests that at 1% CO concentrations, CO reacts with the oxygen in the system through CO oxidation around 250 °C. The La2O3 catalyst may have undergone structural changes during this reaction process, which would be a key factor in the subsequent improvement of catalytic activity. At higher CO concentrations, the poisoning effect of excessive CO2 inhibits the promotional effect of this process, which explains why adding high concentrations of CO leads to a decrease in catalytic activity. Figure 4D shows the evolution of CO throughout the entire OCM process. The evolution in CO can be divided into two parts. First, as CO is introduced as a feed gas, 1% CO (0.11 μmol·s−1) begins to decrease at 250 °C and is completely consumed by 300 °C, while 5% CO (0.55 μmol·s−1) starts to decline at 300 °C and is depleted by 400 °C. This trend in CO corresponds precisely with the generation of CO2 (Figure 4C), indicating that this portion of CO is fully converted to CO2 within this temperature range. At temperatures above 500 °C, both the 1% and 5% CO experimental groups begin to gradually generate CO, with this portion of CO accounting for approximately 5% of the total products. This CO can be attributed to the CO generated by the OCM reaction. The impact of CO on catalyst activity occurs within the temperature range of 250–300 °C, during which the oxidation of CO to CO2 ultimately leads to the early appearance of C2 products and a significant increase in yield at lower temperatures.

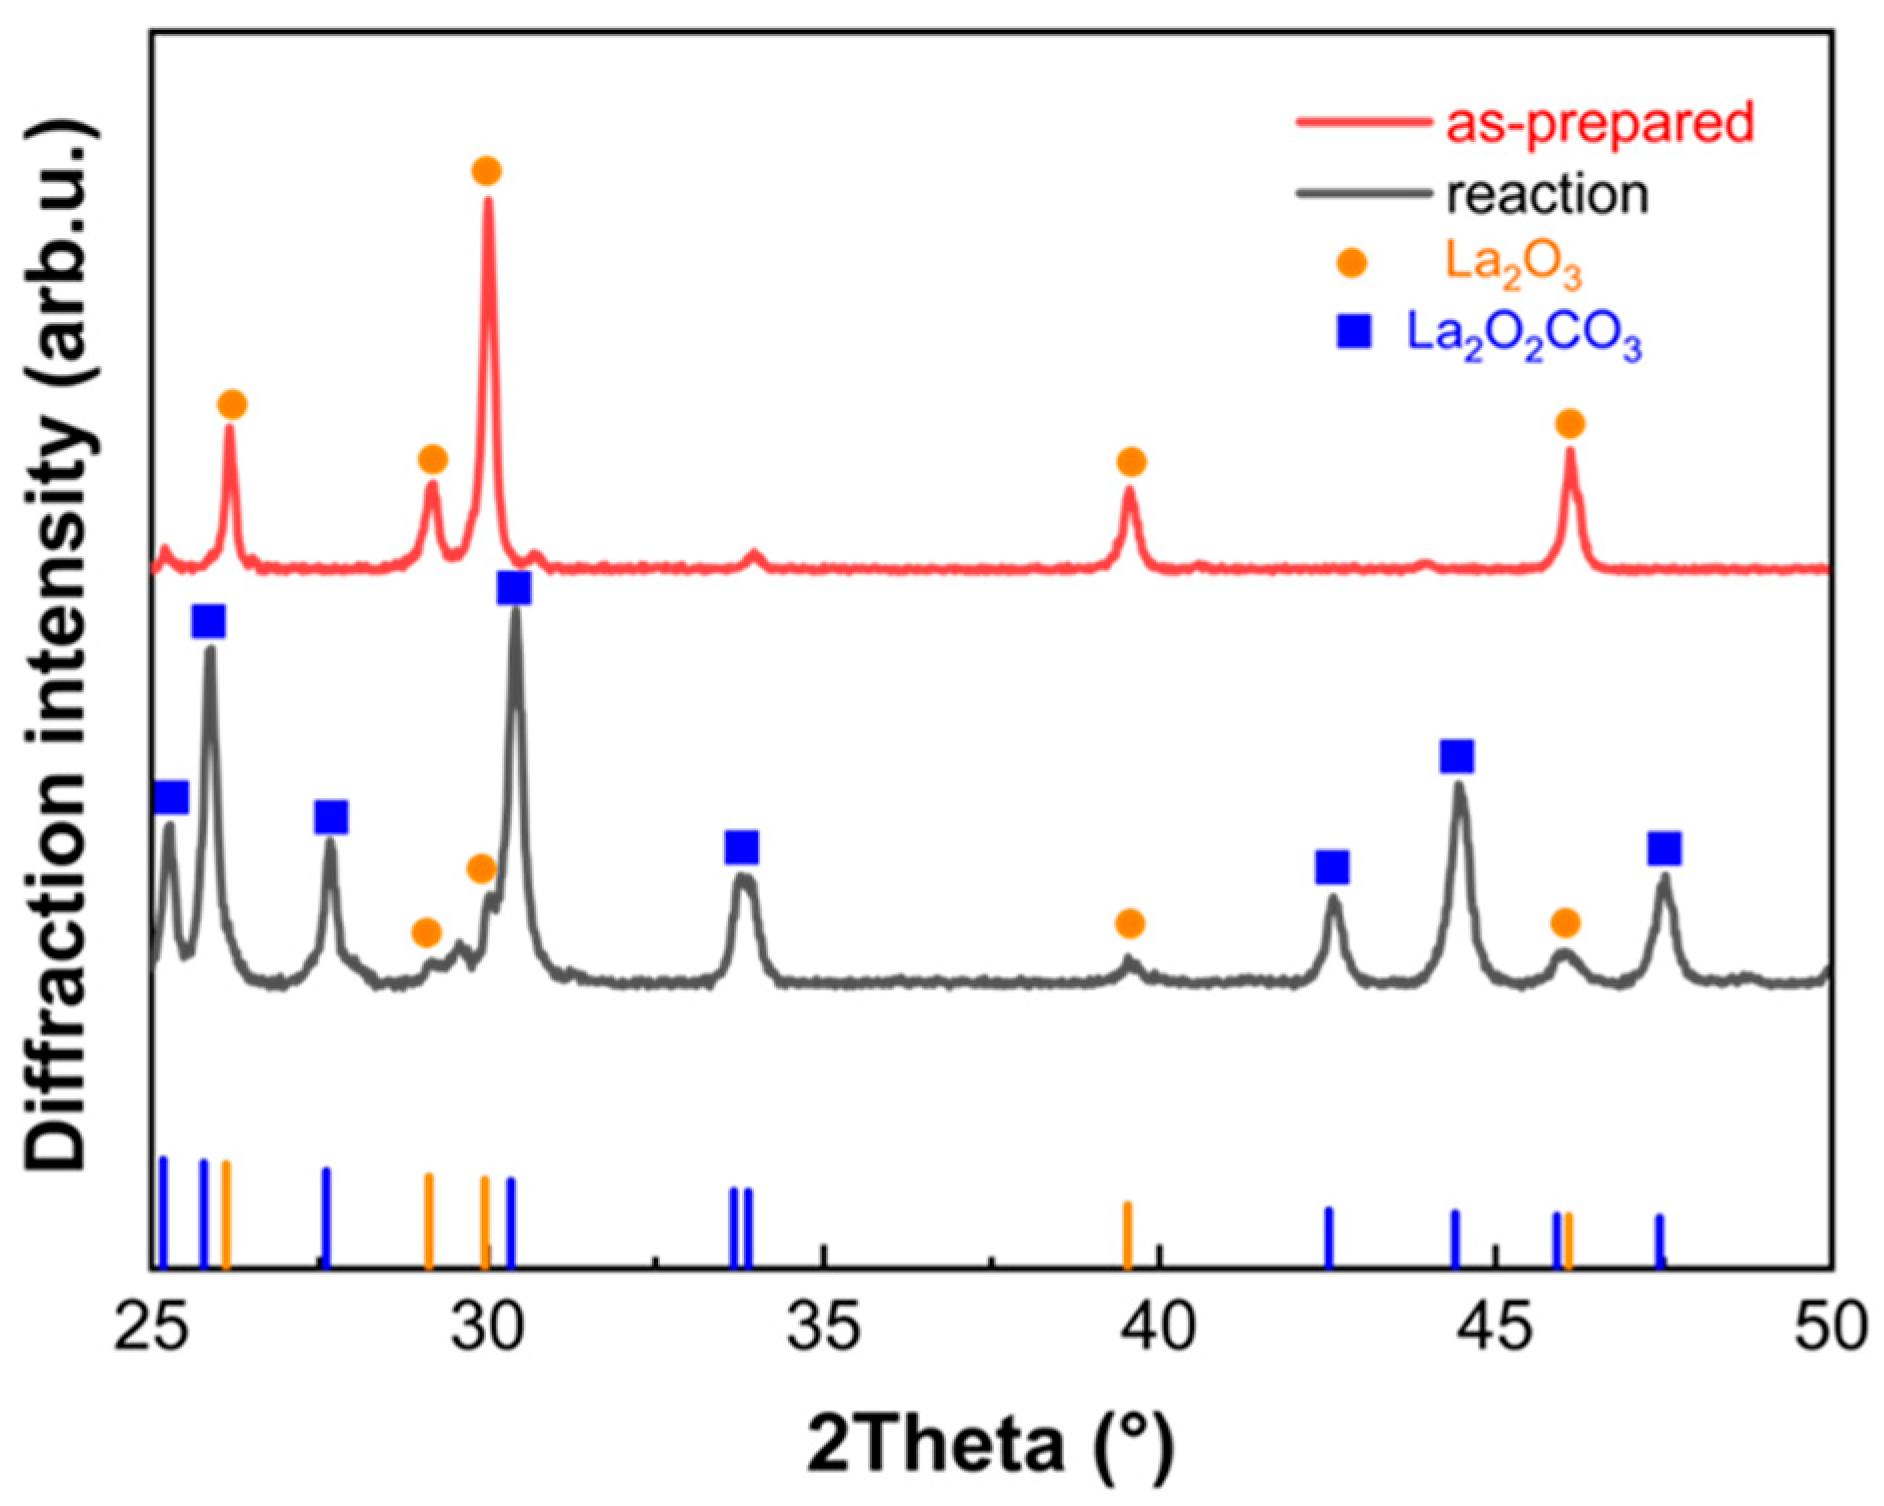
2.5. Structure Characterization
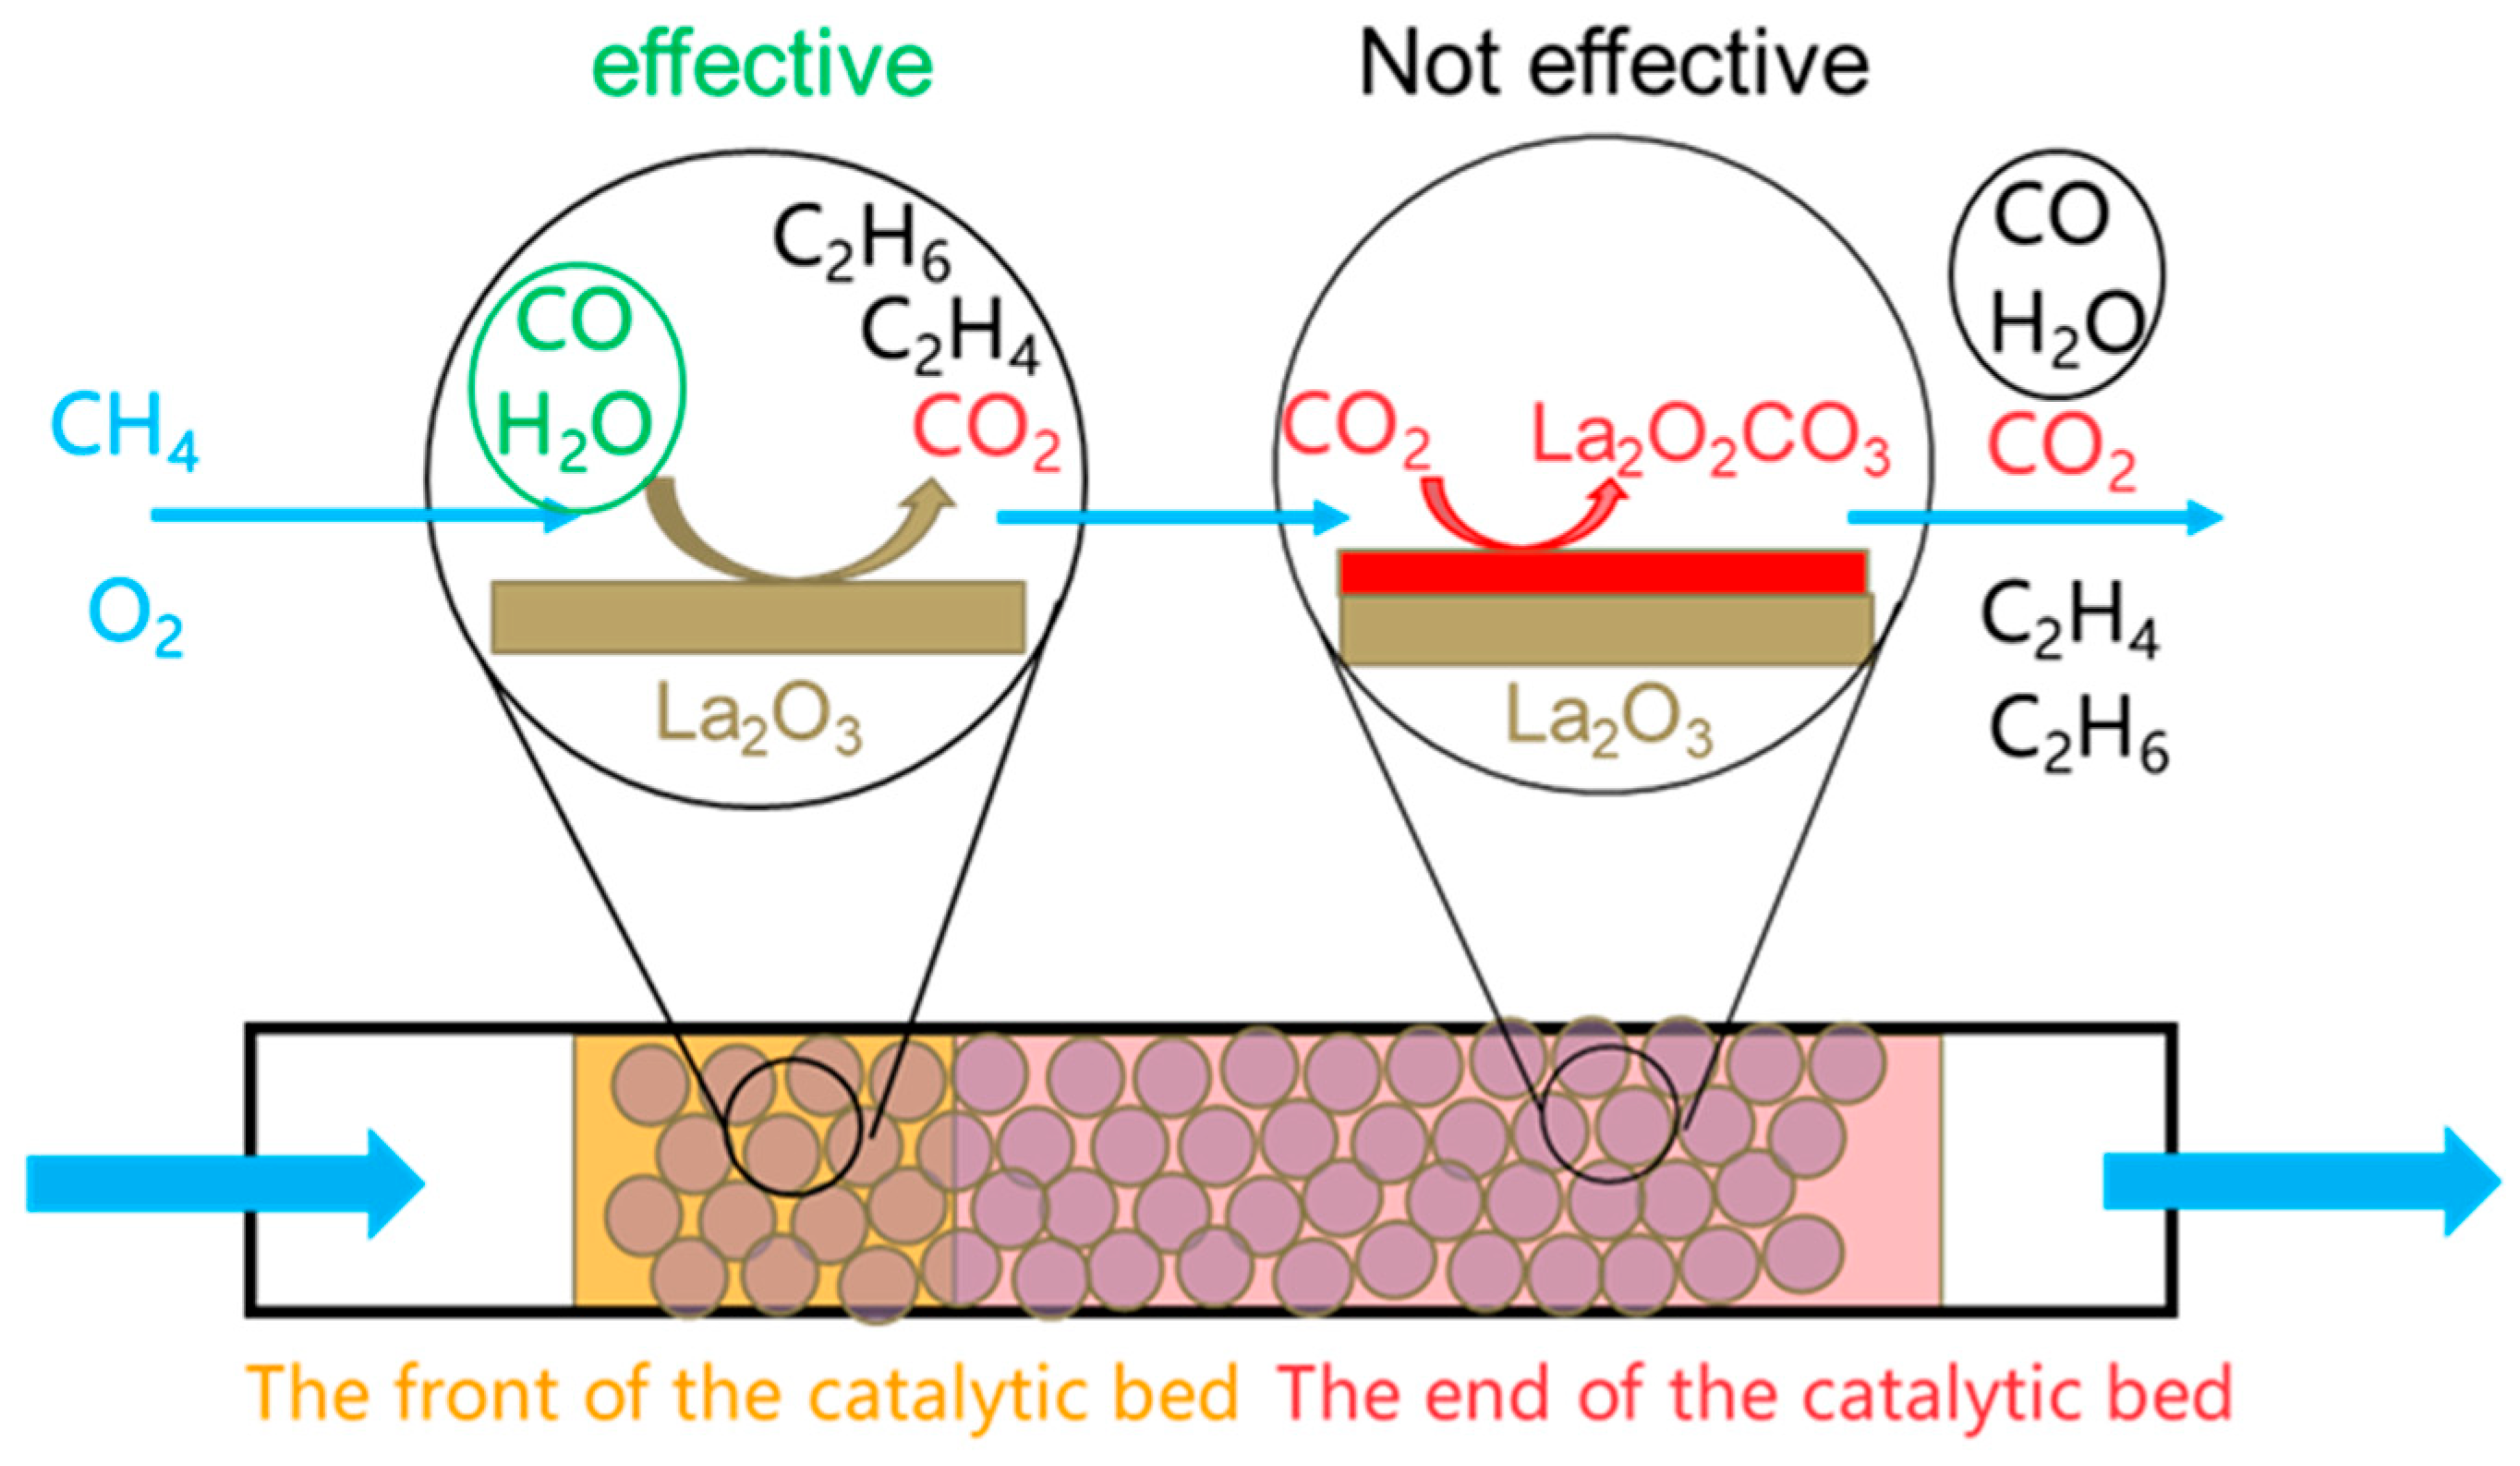
To further investigate the properties of the catalyst, we characterized the commercial La2O3 before and after the reaction using SEM, XRD, and XPS. Based on the optimized reaction conditions, the OCM reaction was conducted with a CH4:O2 ratio of 3:1 and a GHSV of 44,640 mL·g−1·h−1. As shown in Figure S2, the SEM images of the La2O3 catalyst before and after the reaction exhibit no significant morphological changes, with particle size and distribution remaining nearly unchanged, indicating high structural stability and resistance to sintering under reaction conditions.
For a detailed analysis of the structure evolution, XRD characterization was performed. As shown in Figure 5, the XRD pattern of the as-prepared La2O3 sample matches well with the standard PDF card of hexagonal La2O3 (PDF # 05-0602). After the OCM reaction, the XRD pattern is dominated by La2O2CO3 (PDF # 37-0804), with a significant increase in diffraction peak intensity. However, diffraction peaks corresponding to hexagonal La2O3 (30.0°, 39.5°) are still detectable, indicating that while most of the La2O3 underwent a phase transition to La2O2CO3, a small fraction of La2O3 remained, suggesting that the transformation from oxide to carbonate was not complete.
To confirm the presence of La2O2CO3 on the surface of the used sample, XPS analysis was performed on the samples before and after the reaction, providing insights into the surface elements and electronic structure. Figure S3 presents the XPS spectra of C 1s and O 1s for the as-prepared sample (red) and the used sample (black). In the O 1s spectra of the as-prepared sample, two main peaks are observed, with the peak at 529.8 eV corresponding to lattice oxygen [22,23,24]. After the OCM reaction, a significant amount of carbonate species formed on the surface, as evidenced by characteristic peaks at 290.5 eV in the C 1s spectra and 532.5 eV in the O 1s spectra [24,25]. The emergence of carbonate species largely replaced the O 1s species at 531.9 eV; however, the lattice oxygen peak (529.8 eV) remains clearly visible at its original position. These findings are in excellent agreement with the XRD results, collectively indicating that after the OCM reaction, a considerable portion of both the bulk phase and surface of the La2O3 sample transformed into La2O2CO3.

3. Discussion

Upon the introduction of a small amount of H2O and CO into the reaction gas, the activation temperature of the commercial La2O3 catalyst was reduced to 440 °C and 490 °C, respectively. In Table S2, we compare the performance of the optimized commercial La2O3 catalyst with other catalysts reported in the literature. The results show that although the high-temperature C2 yield of the optimized commercial La2O3 catalyst is comparable to that of the standard La2O3 catalysts [26], its C2 product activation temperature was reduced by more than 100 °C, clearly demonstrating the effectiveness of the optimization strategy in enhancing low-temperature activity. Wang et al. [26] reported that doping La2O3 with CeO2 lowered the activation temperature by 100 °C and improved the C2 yield at lower temperatures. Similarly, other researchers achieved a C2 yield of 4.8% at 550 °C using La2Ce2O7 synthesized via CeO2 doping [27]. However, beyond 750 °C, the C2 yields of La2O3 and La2Ce2O7 become comparable, a trend that closely resembles the behavior of the optimized commercial La2O3 catalyst in our study.
Mn–Na2WO4/SiO2 represents another promising class of OCM catalysts, typically exhibiting C2 yields above 20% around 800 °C [28,29,30]. By optimizing the ratio between MnWOx and NaWSiOx phases, C2 yields as high as 28% can be achieved even at 775 °C [28]. Lu et al. [29] further improved the C2 yield to 20% at 720 °C by doping with TiO2. However, these systems typically exhibit high activation temperatures (above 600 °C), whereas the optimized La2O3 catalyst in our study achieves activation at temperatures as low as 440 °C. In our previous work [6], we combined the advantages of La2O3 and Mn–Na2WO4/SiO2 by designing a Na2WO4/La2O3 catalyst that achieved a C2 activation temperature of 415 °C.
As summarized in Table S2, different studies have lowered the activation temperature for C2 formation to 500 °C, 415 °C, and 440 °C by doping La2O3 with CeO2, Na2WO4, and Sr, respectively [26,31,32]. In another study, doping BaF2 into Y2O3 enhanced the C2 yield by nearly threefold [33]. These results typically rely on altering the catalyst structure through complex doping procedures. In contrast, in our work, without any doping modification and using only a commercially available La2O3 catalyst, a similar reduction in activation temperature was achieved simply through the optimization of the reaction conditions. This strongly highlights the significance of our study. Furthermore, it suggests that in future research, applying similar strategies (such as introducing small amounts of H2O or CO2 into the feed gas) to doped or supported La2O3 catalysts could potentially further lower the activation temperature for C2 product formation.
In the previous discussion, we suggested that the promotional effect of water originates from its role in facilitating the formation of active oxygen species. In prior research on the active sites of lanthanum oxide [34], XPS results indicate that the catalytic process of C2 formation observed experimentally closely resembles the surface peroxide species predicted by the theoretical model, suggesting that peroxide is the active site. For this research, we infer that the use of H2O as weak oxidants will promote the formation of peroxide sites, thereby increasing the C2 yield and enhancing the OCM reaction. The promotional effect of a small amount of CO on low-temperature OCM reactions may be attributed to the generation of a small amount of CO2, which acts as a weak oxidant similar to water, or to structural changes in the catalyst induced by oxidation reactions occurring at 250–300 °C, which is an inference that requires further validation through in situ characterization techniques in future research.
In the OCM reaction, CO and H2O are both products with yields exceeding 5%. In comparison, the addition of only 1% CO to the reaction feed significantly enhances catalytic activity, suggesting that H2O and CO, as OCM products, do not play the same role as the 1% H2O and CO added to the reaction feed. Notably, the low concentrations of H2O and CO are added at the front-end of the catalyst in the reactor, while the H2O and CO generated during the reaction are found at the rear end of the catalyst. The fact that smaller amounts have a greater effect suggests that H2O and CO influence the different active positions of the catalyst. Tests related to GHSV also support this observation. Typically, when the temperature within the reactor is uniformly maintained and no significant catalyst deactivation or poisoning occurs, each part of the catalyst in the reactor is expected to contribute equally. However, the GHSV experiments show that over a significant range, the mass activity of the catalyst increases as GHSV rises. Additionally, the fact that even a small amount of catalyst exhibits good OCM performance implies that only a small portion of the catalyst mass is actively contributing, and the catalyst’s active position is limited to a small region. Based on these insights, we developed a new model to discuss and explain how various experimental parameters influence OCM performance, as shown in Scheme 1.
In Scheme 1, we divided the catalyst bed into two positions: the front-end and the rear end. At around 400 °C, the La2O3 catalyst at the front starts to generate CO2 after the OCM reaction. According to a previous study on the poisoning effect of carbonate, the CO2 generated during the OCM reaction gradually accumulates [21]. The La2O2CO3 formed from the CO2 poisons the catalyst surface, leading to a decline in catalyst activity. In this model, The CO2 produced at the front-end of the catalyst bed during the OCM reaction is carried by the gas flow to the rear end of the bed. There, it interacts with La2O3 on the surface to form La2O2CO3, which is identified as a poison for OCM [21]. Therefore, the active position of the catalyst is only present in the La2O3 at the front-end of the catalyst bed. Further studies on the distribution of La2O2CO3 within the reactor based on this model are planned for future work.
The model on the active position of the catalyst explains well the experimental phenomena observed in OCM reaction kinetics. This model provides a comprehensive explanation of the experimental phenomena observed in the kinetics of the OCM reaction. In the GHSV experiments, even at the stage where the reaction rate begins to decline with increasing GHSV, the OCM reaction can still rely on the active portion at the front-end of the catalyst bed. This results in a continuous increase in the mass flow rate per unit of catalyst activity in the front position, thereby enhancing the catalyst’s utilization efficiency per unit time. Consequently, while methane conversion and C2 selectivity eventually decrease due to limited reaction time, the mass activity of the catalyst continues to increase with rising GHSVs.
The model in which only the front-end catalyst is active explains water’s varying effects at different GHSV levels. At low GHSVs, the extended residence time in the catalyst’s front position allows thorough contact between reactants and active sites. Under these conditions, 1% added water acts as a weak oxidant, promoting peroxide site formation and enhancing C2 selectivity, thereby significantly boosting catalyst performance. However, at high GHSVs, reduced residence time limits water’s effect, diminishing its impact on enhancing activity. This model also explains the different effects of adding 1% versus 5% CO to the reaction gas on catalytic activity. With 1% CO, the low concentration is expected to undergo oxidation at 250–300 °C, potentially altering the catalyst’s redox state and contributing to the enhancement of C2 yield at low temperatures. However, with 5% CO the front-end concentration becomes too high, leading to excess CO2 that poisons the catalyst surface, preventing any improvement in catalytic activity. In the OCM reaction, the amounts of self-generated H2O and CO typically exceed 5%, accumulating progressively in the middle-to-late stages, particularly in the rear position of the catalyst. However, according to this model, the rear portion of the catalyst is inactive, so the accumulated H2O and CO in the later stages cannot promote catalysis at the onset as effectively as the 1% H2O and CO added to the front.

4. Materials and Methods

4.1. Catalyst

Investigations are performed over a commercial La2O3 (L812319, ≥99.99%) catalyst supplied by Shanghai Macklin Biochemical Co., Ltd. (Shanghai, China). The BET surface area of commercial La2O3 is 3.4 m2·g−1 (measured under Kr atmosphere) [21]. Samples with a mass of 6 mg to 25 mg are diluted with quartz powder (high-purity grade, 150 Å pore size, 200–425 mesh) to a total loading of 100 mg. According to previous publications [21,34], the commercial La2O3 undergoes carbonation and hydroxylation upon exposure to air (contacting H2O and CO2), resulting in a decrease in the activity of the catalyst. Therefore, before using commercial La2O3 (hereinafter referred to as commercial La2O3) for OCM reaction, it is necessary to perform in situ pre-calcination to remove carbonates and hydroxides. The pretreatment steps are as follows: the La2O3 sample is placed in a microreactor, heated to 800 °C (heating rate: 10 °C/min) under argon atmosphere (argon flow rate: 20 mL·min−1), and then cooled to room temperature for subsequent experiments. Previous XPS [34] and XRD [21] study show that when the sample is calcined to 800 °C under argon, a pure La2O3 phase can be obtained, and the catalyst surface is a clean surface.

4.2. Reactor

The kinetics experiments in this paper were conducted using our custom-designed microreactor, which is loaded with a quarter-inch quartz tube [35]. This microreactor is equipped with an efficient heat dissipation system, effectively preventing temperature runaway effect caused by the significant exothermic nature of the OCM reaction. Additionally, the position of the microreactor where the catalyst is loaded is heated uniformly. The detailed temperature profiles of the microreactor were provided in previous publications [36].

4.3. Online MS and Reaction Conditions

The analysis of OCM products was achieved using a Pfeiffer Prisma quadrupole mass spectrometer (Pfeiffer Vacuum, Aßlar, Germany). Figure S4 shows images of the online MS and the reactor used for the OCM process. The MS analysis in this study required fragment correction due to overlapping mass fragments of primary reaction products. Our previous results detailed the methodology for mass fragment correction [36]. Specifically, the reactants in the OCM reaction are CH4 (m/z = 14) and O2 (m/z = 32), both of which have unique mass fragments without interference from other species. Of the products, CO2 (m/z = 44) and C2H6 (m/z = 30) are also unique and do not require correction. However, C2H4 (m/z = 27) and CO (m/z = 28) share mass fragments with other species, necessitating correction. The m/z = 27 signal originates not only from C2H4 but also from C2H6. Therefore, the C2H6 content is first determined from the unique m/z = 30 signal, and its contribution is subtracted from the m/z = 27 signal to obtain the corrected C2H4 content. Similarly, the m/z = 28 signal comprises contributions from CO, C2H6, C2H4, and CO2. Since the contents of C2H6, C2H4, and CO2 can be derived from their respective unique signals at m/z = 30, m/z = 27, and m/z = 44, their contributions are subtracted from the m/z = 28 signal to accurately determine the CO content. After these corrections, the MS signals are calibrated using 36Ar as an internal standard to obtain actual flow rates, expressed in μmol·s−1.
As an example of an OCM reaction (reaction conditions: 0.025 g of the catalyst under 20 mL·min−1; CH4/O2/Ar = 70:23:7; flow rate, GHSV = 44,640 mL·g−1·h−1; heating rate, 10 °C/min), the initial distribution of mass fragments obtained via MS is shown in Figure S5. Following the aforementioned fragment correction, the product distribution (Figure S6) is determined in μmol·s−1. Finally, based on these corrected values, the C2 product yield and selectivity are calculated. Additionally, higher-mass carbon products were examined (Figure S6), revealing negligible signals at m/z = 43 (a primary fragment of C3H8), indicating that heavier hydrocarbons are not present in significant amounts and are therefore not considered in subsequent experiments.
Information on experimental settings such as sample mass, GHSV, and feed gas flow rate for the comparative experiments with varying operational parameters is listed in Table S1 in the Supporting Information. To unify standards, the GHSV in this study is calculated solely based on the flow rates of methane and oxygen. The La2O3 catalyst at a GHSV of X mL·g−1·h−1, with n% concentrations of H2O/CO added to the reaction gas, is denoted as La2O3-XmL-nH2O/CO. In all OCM experiments, 1.4 mL·min−1 of Ar was added as an internal flow standard in the feed gas, and 147 mL·min−1 of Ar was used as a diluent in the exhaust gas before MS analysis. The temperature ramping was programmed from RT to 740 °C with a heating rate of 10 °C/min. The carbon balance for all OCM reactions discussed in this paper is shown in Figures S7–S10 in the Supporting Information. The carbon balance results indicate that for most OCM experiments, the carbon balance was below 100% at 600 °C, while at 740 °C, it reached approximately 110%, with a few cases exceeding this value. This discrepancy can be attributed to the partial adsorption of products on the catalyst surface at lower temperatures, followed by their desorption at elevated temperatures. The CH4 conversion rate, C2 selectivity, and yields of C2 and CO2 are calculated using the following equation:
CH 4   conversion % = CH 4   input CH 4   output CH 4   input × 100
Yield % = n Product CH 4   input × 100
Selectivity % = n Product C total   output × 100
where n in Equations (2) and (3) is the carbon number of the product molecules.
The mass activity is determined using the following equation:
Mass   activity mol · g 1 · h 1 = Yield CH 4   input m
where m is the loading quality of the sample; yield is calculated by Equation (2).

4.4. Characterization

The crystal structure information was obtained using X-ray diffraction (Bruker, D8 advance, Bruker Corporation, Billerica, MA, USA) with Cu-Ka radiation (λ = 1.5406 Å). The morphology of the samples was analyzed using SEM (JSM-7800F Prime, JEOL Ltd., Tokyo, Japan). The gentle beam (GB) mode was employed to observe the surface structure, enabling high-resolution imaging with a high signal-to-noise ratio. Surface analysis of the catalysts was performed by XPS using a Thermo Fischer ESCALAB 250Xi photoelectron spectrometer (Thermo Fisher Scientific, Waltham, MA, USA). The spectra were recorded using monochromated X-ray irradiation AlKα (hv = 1486.7 eV) and a 180° double focusing hemispherical. The binding energy scale of photoelectron spectra was calibrated to C 1s peak at 284.8 eV.

5. Conclusions

The effects of operating parameters on OCM over commercial La2O3 catalyst have been studied by using online mass spectrometry. Experimental results show that an optimized GHSV (44,640 to 93,000 mL·g−1·h−1) and optimum methane to oxygen ratio (CH4/O2 = 3) would achieve the highest methane conversion and C2 yield. Moreover, at a GHSV of 44,640 mL·g−1·h−1, introducing a small amount of CO and H2O into the reaction mixture can significantly improve the C2 yield of OCM reaction at low temperatures. The model we established explains the influence of the operating parameters on OCM performance. With only the front position active, the input of 1% CO and H2O exhibits a distinct catalytic enhancement compared to the effects of self-generated H2O and CO.

Supplementary Materials

The following supporting information can be downloaded at: https://www.mdpi.com/article/10.3390/catal15050499/s1. Figure S1: Oxygen consumption vs. temperature of the OCM reaction over La2O3 catalyst by cofeeding 3:1, 5:1, and 10:1 CH4 and O2. Figure S2: SEM image of the as prepared (A) and after reaction (B) La2O3 sample. OCM reaction conditions: 0.025 g of the catalyst under 20 mL·min−1; CH4/O2/Ar = 70:23:7; flow rate, GHSV = 44,640 mL·g−1·h−1; heating rate, 10 °C/min. Figure S3: C 1s (A) and O 1s (B) XPS spectra of the as prepared and after reaction La2O3 sample. OCM reaction conditions: 0.025 g of the catalyst under 20 mL·min−1; CH4/O2/Ar = 70:23:7; flow rate, GHSV = 44,640 mL·g−1·h−1; heating rate, 10 °C/min. Figure S4: Images of the online MS (left) and the reactor (right) used for the OCM process. Figure S5: MS signals of OCM reaction catalyzed by La2O3. OCM reaction conditions: 0.02 g of the catalyst under 20 mL·min−1; CH4/O2/Ar = 70:23:7; flow rate, GHSV = 44,640 mL·g−1·h−1; heating rate, 10 °C/min. Figure S6: The rate of OCM reaction products over La2O3. OCM reaction conditions: 0.02 g of the catalyst under 20 mL·min−1; CH4/O2/Ar = 70:23:7; flow rate, GHSV = 44,640 mL·g−1·h−1; heating rate, 10 °C/min. Figure S7: Carbon balance on La2O3 catalyst by cofeeding 3:1 (black), 5:1 (red), and 10:1 (blue) CH4 and O2. Figure S8: Carbon balance on La2O3 catalyst at different GHSVs. The GHSVs vary from 14,880 L·g−1·h−1 to 186,000 mL·g−1·h−1. Figure S9: Carbon balance on La2O3 catalyst by cofeeding 3:1 CH4 and O2 with 1% vol H2O at GHSV = 14,880 mL·g−1·h−1 and 44,640 mL·g−1·h−1. Figure S10: Carbon balance on La2O3 catalyst by cofeeding 3:1 CH4 and O2 with 1% vol CO and 5% vol CO at GHSV = 44,640 mL·g−1·h−1. Table S1: Experimental setup for catalyst testing under different operating parameters including sample mass, GHSV, and feed gas composition. Table S2. Comparison of the performance of commercial La2O3 with other catalysts reported in the literature for OCM.

Author Contributions

Z.Q.: Conceptualization, methodology, software, validation, formal analysis, investigation, resources, data curation, writing—original draft preparation, writing—review and editing, visualization, and supervision. Y.C.: Methodology, validation, formal analysis, data curation, and writing—review and editing. All authors have read and agreed to the published version of the manuscript.

Funding

This research received no external funding.

Data Availability Statement

The raw data supporting the conclusions of this article will be made available by the authors upon request.

Acknowledgments

The authors would like to thank the support from Analytical Instrumentation Center (contract no. SPST-AIC10112914), SPST, ShanghaiTech University.

Conflicts of Interest

The authors declare no conflicts of interest.

References

  1. Lunsford, J.H. Catalytic conversion of methane to more useful chemicals and fuels: A challenge for the 21st century. Catal. Today 2000, 63, 165–174. [Google Scholar] [CrossRef]
  2. Schwach, P.; Pan, X.; Bao, X. Direct conversion of methane to value-added chemicals over heterogeneous catalysts: Challenges and prospects. Chem. Rev. 2017, 117, 8497–8520. [Google Scholar] [CrossRef] [PubMed]
  3. Lunsford, J.H. The catalytic oxidative coupling of methane. Angew. Chem. Int. Ed. Engl. 1995, 34, 970–980. [Google Scholar] [CrossRef]
  4. Zavyalova, U.; Holena, M.; Schlögl, R.; Baerns, M. Statistical analysis of past catalytic data on oxidative methane coupling for new insights into the composition of high-performance catalysts. ChemCatChem 2011, 3, 1935–1947. [Google Scholar] [CrossRef]
  5. Keller, G.; Bhasin, M. Synthesis of ethylene via oxidative coupling of methane: I. Determination of active catalysts. J. Catal. 1982, 73, 9–19. [Google Scholar] [CrossRef]
  6. Ortiz-Bravo, C.A.; Chagas, C.A.; Toniolo, F.S. Oxidative coupling of methane (OCM): An overview of the challenges and opportunities for developing new technologies. J. Nat. Gas Sci. Eng. 2021, 96, 104254. [Google Scholar] [CrossRef]
  7. Huang, P.; Zhao, Y.; Zhang, J.; Zhu, Y.; Sun, Y. Exploiting shape effects of La2O3 nanocatalysts for oxidative coupling of methane reaction. Nanoscale 2013, 5, 10844–10848. [Google Scholar] [CrossRef]
  8. Kim, I.; Lee, G.; Na, H.B.; Ha, J.-M.; Jung, J.C. Selective oxygen species for the oxidative coupling of methane. Mol. Catal. 2017, 435, 13–23. [Google Scholar] [CrossRef]
  9. Xiong, Z.; Guo, J.; Deng, Y.; Liu, B.; Lou, H.; Zeng, M.; Wang, Z.; Zhou, Z.; Yuan, W.; Qi, F. Elucidating the mechanism for oxidative coupling of methane catalyzed by La2O3: Experimental and microkinetic modeling studies. ACS Catal. 2024, 14, 1267–1280. [Google Scholar] [CrossRef]
  10. Yue, J.; Xiao, Q.; Zhao, D.; Guan, Y.; Liu, J.; Xu, G. Surfactant-assisted preparation of nanorod La2O3 catalysts for oxidative coupling of methane. Energy Fuels 2023, 37, 15986–15994. [Google Scholar] [CrossRef]
  11. Kuo, J.; Kresge, C.; Palermo, R. Evaluation of direct methane conversion to higher hydrocarbons and oxygenates. Catal. Today 1989, 4, 463–470. [Google Scholar] [CrossRef]
  12. Yaghobi, N. The role of gas hourly space velocity and feed composition for catalytic oxidative coupling of methane: Experimental study. J. King Saud Univ.-Eng. Sci. 2013, 25, 1–10. [Google Scholar] [CrossRef]
  13. Ahari, J.S.; Sadeghi, M.T.; Zarrinpashne, S. Effects of operating parameters on oxidative coupling of methane over Na-W-Mn/SiO2 catalyst at elevated pressures. J. Nat. Gas Chem. 2011, 20, 204–213. [Google Scholar] [CrossRef]
  14. Karimi, A.; Ahmadi, R.; Zadeh, H.B.; Jolodar, A.J.; Barkhordarion, A. Catalytic oxidative coupling of methane-experimental investigation and optimization of operational conditions. Pet. Coal 2007, 49, 36–40. [Google Scholar]
  15. Ni, J.; Lan, T.; Liu, P.; Lu, Y. Fluidized-bed OCM reaction: A promising Mn2O3-Na2WO4/TiO2 catalyst and a numerical study. Chem. Eng. J. 2024, 499, 155845. [Google Scholar] [CrossRef]
  16. Alturkistani, S.; Wang, H.; Gautam, R.; Sarathy, S.M. Importance of Process Variables and Their Optimization for Oxidative Coupling of Methane (OCM). ACS Omega 2023, 8, 21223–21236. [Google Scholar] [CrossRef]
  17. Aydin, Z.; Zanina, A.; Kondratenko, V.A.; Rabeah, J.; Li, J.; Chen, J.; Li, Y.; Jiang, G.; Lund, H.; Bartling, S. Effects of N2O and water on activity and selectivity in the oxidative coupling of methane over Mn–Na2WO4/SiO2: Role of oxygen species. ACS Catal. 2022, 12, 1298–1309. [Google Scholar] [CrossRef]
  18. Sadjadi, S.; Jašo, S.; Godini, H.; Arndt, S.; Wollgarten, M.; Blume, R.; Görke, O.; Schomäcker, R.; Wozny, G.; Simon, U. Feasibility study of the Mn–Na2WO4/SiO2 catalytic system for the oxidative coupling of methane in a fluidized-bed reactor. Catal. Sci. Technol. 2015, 5, 942–952. [Google Scholar] [CrossRef]
  19. Takanabe, K.; Iglesia, E. Rate and selectivity enhancements mediated by OH radicals in the oxidative coupling of methane catalyzed by Mn/Na2WO4/SiO2. Angew. Chem. 2008, 120, 7803–7807. [Google Scholar] [CrossRef]
  20. Yoon, S.; Lim, S.; Choi, J.-W.; Suh, D.J.; Song, K.H.; Ha, J.-M. Study on the unsteady state oxidative coupling of methane: Effects of oxygen species from O2, surface lattice oxygen, and CO2 on the C2+ selectivity. RSC Adv. 2020, 10, 35889–35897. [Google Scholar] [CrossRef]
  21. Guan, C.; Yang, Y.; Pang, Y.; Liu, Z.; Li, S.; Vovk, E.I.; Zhou, X.; Li, J.P.H.; Zhang, J.; Yu, N. How CO2 poisons La2O3 in an OCM catalytic reaction: A study by in situ XRD-MS and DFT. J. Catal. 2021, 396, 202–214. [Google Scholar] [CrossRef]
  22. Stoychev, D.; Valov, I.; Stefanov, P.; Atanasova, G.; Stoycheva, M.; Marinova, T. Electrochemical growth of thin La2O3 films on oxide and metal surfaces. Mater. Sci. Eng. C 2003, 23, 123–128. [Google Scholar] [CrossRef]
  23. Sunding, M.; Hadidi, K.; Diplas, S.; Løvvik, O.; Norby, T.; Gunnæs, A. XPS characterisation of in situ treated lanthanum oxide and hydroxide using tailored charge referencing and peak fitting procedures. J. Electron Spectrosc. Relat. Phenom. 2011, 184, 399–409. [Google Scholar] [CrossRef]
  24. Li, J.P.H.; Zhou, X.; Pang, Y.; Zhu, L.; Vovk, E.I.; Cong, L.; van Bavel, A.P.; Li, S.; Yang, Y. Understanding of binding energy calibration in XPS of lanthanum oxide by in situ treatment. Phys. Chem. Chem. Phys. 2019, 21, 22351–22358. [Google Scholar] [CrossRef]
  25. Lee, H.; Northrop, W.F. Oxidative coupling of methane using oxidant mixtures of CO2 and O2 over Sr/La2O3. Appl. Catal. A Gen. 2024, 673, 119587. [Google Scholar] [CrossRef]
  26. Wang, H.; Yang, C.; Shao, C.; Alturkistani, S.; Magnotti, G.; Gascon, J.; Takanabe, K.; Sarathy, S.M. A Homogeneous-Heterogeneous Kinetic Study of Oxidative Coupling of Methane (OCM) on La2O3/CeO2 Catalyst. ChemCatChem 2022, 14, e202200927. [Google Scholar] [CrossRef]
  27. Zhang, Z.; Gong, Y.; Xu, J.; Zhang, Y.; Xiao, Q.; Xi, R.; Xu, X.; Fang, X.; Wang, X. Dissecting La2Ce2O7 catalyst to unravel the origin of the surface active sites devoting to its performance for oxidative coupling of methane (OCM). Catal. Today 2022, 400, 73–81. [Google Scholar] [CrossRef]
  28. Xie, Y.; Cheng, J.; Wang, W.; Han, Y.; Fan, Q.; Li, H.; Cheng, K.; Zhang, Q.; Wang, Y. Separation of MnWOx and NaWSiOx Phases Boosts Oxidative Coupling of Methane. Angew. Chem. 2025, e202503767. [Google Scholar] [CrossRef]
  29. Wang, P.; Zhao, G.; Wang, Y.; Lu, Y. MnTiO3-driven low-temperature oxidative coupling of methane over TiO2-doped Mn2O3-Na2WO4/SiO2 catalyst. Sci. Adv. 2017, 3, e1603180. [Google Scholar] [CrossRef]
  30. Vovk, E.I.; Wang, D.; Qiu, Z.; Liu, Y.; He, M.; Zhou, X.; Guan, C.; Yu, N.; Lu, Y.; Lang, J. In situ structure study of a TiO2 doped MnOX-Na2WO4/SiO2 catalyst under Na2WO4 melting conditions. Top. Catal. 2024, 1–15. [Google Scholar] [CrossRef]
  31. Wang, D.; Lang, J.; Qiu, Z.; Ding, N.; Yang, Y. Investigating the Impact of Na2WO4 Doping in La2O3-Catalyzed OCM Reaction: A Structure–Activity Study via In Situ XRD-MS. Catalysts 2024, 14, 150. [Google Scholar] [CrossRef]
  32. Zhao, M.; Ke, S.; Wu, H.; Xia, W.; Wan, H. Flower-like Sr-La2O3 microspheres with hierarchically porous structures for oxidative coupling of methane. Ind. Eng. Chem. Res. 2019, 58, 22847–22856. [Google Scholar] [CrossRef]
  33. Au, C.; Zhou, X.; Liu, Y.; Ji, W.; Ng, C. The Characterization of BaF2/Y2O3 Catalysts for the OCM Reaction. J. Catal. 1998, 174, 153–163. [Google Scholar] [CrossRef]
  34. Zhou, X.; Pang, Y.; Liu, Z.; Vovk, E.I.; van Bavel, A.P.; Li, S.; Yang, Y. Active oxygen center in oxidative coupling of methane on La2O3 catalyst. J. Energy Chem. 2021, 60, 649–659. [Google Scholar] [CrossRef]
  35. Li, J.P.H.; Liu, Z.; Wu, H.; Yang, Y. Investigation of CO oxidation over Au/TiO2 catalyst through detailed temperature programmed desorption study under low temperature and Operando conditions. Catal. Today 2018, 307, 84–92. [Google Scholar] [CrossRef]
  36. Liu, Z.; Ho Li, J.P.; Vovk, E.; Zhu, Y.; Li, S.; Wang, S.; van Bavel, A.P.; Yang, Y. Online kinetics study of oxidative coupling of methane over La2O3 for methane activation: What is behind the distinguished light-off temperatures? ACS Catal. 2018, 8, 11761–11772. [Google Scholar] [CrossRef]
Figure 1. CH4 conversion (A), CO2 yield (B), C2 yield (C), and C2 selectivity (D) vs. temperature of the OCM reaction over La2O3 catalyst by cofeeding 3:1 (black), 5:1 (red), and 10:1 (blue) CH4 and O2. OCM reaction conditions: 0.025 g of the catalysts under 20 mL·min−1; CH4/O2/Ar = 70:23:7, 77.5:15.5:7, and 85:8.5:6.5; flow rate, GHSV = 44,640 mL·g−1·h−1; heating rate: 10 °C/min.
Catalysts 15 00499 g001
Figure 2. Comparison of CH4 conversion (A), C2 yield (B), C2 selectivity (C), and mass activity (D) for catalysts at different GHSVs, measured at 740 °C. The GHSVs vary from 14,880 mL·g−1·h−1 to 186,000 mL·g−1·h−1.
Catalysts 15 00499 g002
Figure 3. C2 yield and selectivity vs. temperature of the OCM reaction over La2O3 catalyst by cofeeding 3:1 CH4 and O2 with (orange) or without (blue) 1% vol H2O at GHSV = 14,880 mL·g−1·h−1 (A,C) and 44,640 mL·g−1·h−1 (B,D). OCM reaction conditions: 0.025g of the catalysts under 6.7 (A,C) and 20 mL·min−1 (B,D); CH4/O2/Ar = 70:23:7 flow rate; heating rate, 10 °C/min. The experiment represented by the orange line in Figure 3 corresponds to the same experiment as that performed under the same conditions in Figure 2.
Catalysts 15 00499 g003
Figure 4. CH4 conversion (A), C2 yield (B), and CO2 yield (C) vs. temperature of the OCM reaction over La2O3 catalyst by adding 1% (black) and 5% (red) concentrations of CO to the reaction gas. The control group (blue) had no added CO. (D) The online MS results of the real time CO in exhaust outputs vs. temperature during the OCM reaction. OCM reaction conditions: 0.025 g of the catalysts under 20 mL·min−1; CH4/O2/Ar/CO = 70:23:6:1, 70:23:2:5, and 70:23:7:0; flow rate, GHSV = 44,640 mL·g−1·h−1; heating rate, 10 °C/min.
Catalysts 15 00499 g004
Figure 5. XRD patterns of the as-prepared and after reaction La2O3 sample, compared with standard XRD PDF reference cards for La2O3 and La2O2CO3. OCM reaction conditions: 0.025 g of the catalyst under 20 mL·min−1; CH4/O2/Ar = 70:23:7; flow rate, GHSV = 44,640 mL·g−1·h−1; heating rate, 10 °C/min.
Catalysts 15 00499 g005
Scheme 1. Catalyst reaction activity at different positions in the bed.
Catalysts 15 00499 sch001
Table 1. Comparison of CH4 conversion and C2 selectivity for catalysts at different GHSVs.
GHSV (mL·g−1·h−1)CH4 Conversion at 740 °C (%)C2 Selectivity at 740 °C (%)
14,88018.738.3
29,7602458.1
44,6402571
65,1002470.3
93,00024.670.4
186,0001956.3
Table 2. Comparison of C2 yield for La2O3 with and without 1% and 5% concentrations of CO to the reaction gas at 44,640 mL·g−1·h−1. OCM reaction conditions: 0.025 g of the catalysts under 20 mL·min−1; CH4/O2/Ar/CO = 70:23:6:1, 70:23:2:5, and 70:23:7:0; flow rate, GHSV = 44,640 mL·g−1·h−1; heating rate, 10 °C/min.
SampleC2 Yield at 550 °C (%)C2 Yield at 740 °C (%)
La2O3-44,6400.7717.0
La2O3-44,640 + 1%CO2.515.6
La2O3-44,640 + 5%CO0.4614.5
Disclaimer/Publisher’s Note: The statements, opinions and data contained in all publications are solely those of the individual author(s) and contributor(s) and not of MDPI and/or the editor(s). MDPI and/or the editor(s) disclaim responsibility for any injury to people or property resulting from any ideas, methods, instructions or products referred to in the content.

