Abstract
Platinum- and/or palladium-containing silica-based supports were applied for the selective catalytic reduction of NOx with hydrogen (H2-SCR-DeNOx). To obtain enhanced activity and N2 selectivity below 150 °C, we varied the type and loading of noble metals (Pt and Pd both individually and paired, 0.1–1.0 wt.-%), silica-containing supports (ZrO2/SiO2, ZrO2/SiO2/Al2O3, Al2O3/SiO2/TiO2), as well as the H2 concentration in the feed (2000–4000 ppm). All of these contributed to enhancing N2 selectivity during H2-SCR-DeNOx over the (0.5 wt.-%)Pt/Pd/ZrO2/SiO2 catalyst in the presence of 10 vol.-% of O2. H2 was completely consumed at 150 °C. A comparison of the catalytic results obtained during H2-SCR-DeNOx,(H2-)NH3-SCR-DeNOx, as well as stop-flow H2-SCR-DeNOx and temperature-programmed studies, revealed that in the temperature range between 150 and 250 °C, the continuously coupled or overlaying mechanism of NO reduction by hydrogen and ammonia based on NH3 formation at lower temperatures, which is temporarily stored at the acid sites of the support and desorbed in this temperature range, could be postulated.
1. Introduction
Emissions of nitrogen oxides (NOx: NO and NO2) from stationary and mobile sources affect human health and the environment (e.g., [1,2]). The selective catalytic reduction of NOx with hydrogen (H2-SCR-DeNOx) with an efficiency of up to 90% is applicable in various sectors, including power generation and transport [3,4,5]. This innovative process replaces NH3-SCR-DeNOx, particularly in industrial power stations using hydrogen, such as H2 engines for combined heat and power (CHP) with exhaust gas temperatures below 150 °C. The extensive investigation of materials specifically tailored for H2-SCR-DeNOx is still ongoing as many catalysts promote severe N2O formation in the low-temperature range (below 200 °C). Different supports (e.g., SiO2, Al2O3, ZrO2, mesoporous silicas, zeolites ZSM-5, or SSZ-13 [6,7,8,9]) vary the dispersion of the active components (such as Pt, Pd [10,11], including promotors W, Mo, Cr [12,13,14], etc.) and thus the activity and N2 selectivity of the final catalyst as well as the reaction pathways. Properties such as the redox and acidity of the support, together with its interactions with noble metals, are frequently reported as the determinants of the catalytic properties in H2-SCR-DeNOx (e.g., [15,16]). For example, Shibata et al. [16] reported the relationship between the integrated white line intensity of the Pt LIII-edge XANES spectrum and the turnover frequency for NOx (TOF), estimated from the NOx conversion and Pt dispersion. The oxidation state of Pt was assumed to be the controlling the H2-SCR-DeNOx activity, which decreased among the investigated catalysts as follows: Pt/SiO2 > Pt/SiO2-Al2O3 > Pt/ZSM-5 (n(Si)/n(Al) = 20), Pt/MOR (mordenite, n(Si)/n(Al) = 7.7) > Pt/Al2O3 > Pt/MgO. The N2 selectivity on Pt-containing zeolites was higher than on oxide-supported Pt, which was related to the different amount of Brønsted acid sites (NH4+) on the respective catalyst, as detected using FT-IR spectroscopy. Costa and Efstathiou [17] reported the correlation between Pt dispersion (estimated from H2 chemisorption) and the specific rate of N2 formation over Pt/MgO-CeO2. A reduction in Pt dispersion from 90% (for 0.1 wt.-% Pt loading) to 10% (for 2 wt.-% Pt loading) led to a decrease in the specific integral rate of N2 formation by more than an order of magnitude. Yu et al. [18] reported that the valance states of Pt (80% in Pt0, 20% in Pt2+O) in Pt-ZSM-35 (n(Si)/n(Al) = 15) remain independent from noble metal loading (0.5–2.0 wt.-%). They attributed the low activity in 2 wt.-% Pt/ZSM-35 to the blockage of the acid sites and the aggregation of Pt species (as confirmed by XRD and TEM analyses). Conversely, Park et al. [11] reported higher NOx conversion for catalysts aged up to 850 °C, despite a reduction in the acid sites and Pt particle sintering. Thus, these results indicate the need for systematic studies on particular groups of H2-SCR-DeNOx catalysts, as their activity and N2 selectivity may vary depending on the applied catalyst preparation and treatment as well as the reaction conditions.
Additionally, Pt-containing catalysts and Pd-containing materials have been documented in this reaction due to their lower price and frequently higher N2 selectivity than Pt-based catalysts. For example, Pd supported on inorganic oxides, such as TiO2-Al2O3 or ZrO2-CeO2 (80–87% NO conversion at 150–180 °C) had more than 80% N2 selectivity below 180 °C [19,20], and Pd-ZSM-5 was reported to possess more than 95% NOx activity and N2 selectivity at 150 °C [21]. Recently, we summarized the current status of the Pt-based (and partly Pd-based) catalysts in H2-SCR-DeNOx in a review article [22].
In this work, Pt and/or Pd supported on selected silica-based supports were evaluated in H2-SCR-DeNOx for their activity and N2 selectivity in a feed containing 10 vol.-% O2. Although numerous investigations refer to Pt- or Pd-containing catalysts separately, to the best of our knowledge, this is the first time that the performance of Pt–Pd-containing catalysts is reported. Furthermore, none of the studies reported so far compared Pt- and Pd-containing catalysts under the same reaction conditions. Systematic investigations of these catalysts will provide a fundamental basis for a knowledge-driven catalyst design and improvement for industrial application.
2. Results
Figures S1–S3 together with Tables S1 and S2 show the results of the physico-chemical characterization of the selected samples. The powder XRD patterns of the ZrO2/SiO2-based samples mainly revealed Bragg reflexes characteristic of ZrO2 (cubic) at 2 theta values of 30.2°, 35.0°, 50.4°, 60.2°, and 63.0° (e.g., [23,24]). Otherwise, the ZrO2/SiO2/Al2O3-based samples showed an amorphous phase. For the Al2O3/SiO2/TiO2-based samples, the reflexes mainly occurred at 2 theta of 25.3°, 37.8°, 48.0°, 54.0°, 55.2°, and 62.7°, indicating TiO2 (anatase) as the main crystalline phase of these materials (e.g., [25]). Thus, our XRD analysis revealed that the alumina-silica-based support interspersed with TiO2 particles. The N2 sorption analysis showed that the analyzed samples possessed mesopores up to 30 nm. The elemental analysis revealed a slightly higher amount of Pt (0.73–0.77 wt.-%) than the intended amount. Furthermore, in the Pt–Pd-containing samples, nearly two times the amount of Pt was compared with the Pd species (Table S1). Figure S3 shows the NH3-TPD profiles for the investigated materials. For comparative purposes, an NH3-TPD study was also performed over Pt-, Pd-, and Pt–Pd-containing catalysts, showing no significant effect of the precious metal component on the NH3-TPD profile. Similar findings were obtained previously over Mo/ZrO2 and Pt-doped Mo/ZrO2 [26]. As can be seen, NH3 desorbed mainly in one broad peak up to 350 °C, with a broad shoulder for Al-containing samples above 350 °C. Based on the NH3-TPD analysis (Figure S3, Table S3), the Al-containing materials possessed the highest concentration of acid sites, up to 343 μmol g−1, for titania containing Pt/Pd/Al2O3/SiO2/TiO2 (30/10) catalyst. However, taking into account the specific surface area of the samples (Table S2), Pt/ZrO2/SiO2 had a higher acid site density than Pt/ZrO2/SiO2/Al2O3 (1.47 versus 1.22 μmol m−2). Due to the relatively low Pt and Pd loading, we could not determine the valance state of catalysts. However, Li et al. [27] asserted that Pt appears as Pt2+O in Pt/ZrO2 (calcined at 500 °C in air for 5 h), similar to Pd2+O in Pd/ZrO2 (calcined at 800 °C in air for 10 h) [28].
2.1. Results of Catalytic Studies
2.1.1. Type of Precious Metal
Figure 1 compares the activity and N2 selectivity of Pt- or Pd-containing ZrO2/SiO2 and ZrO2/SiO2/Al2O3 in H2-SCR-DeNOx. The NO conversion as a function of temperature shows a volcano-shaped profile for all catalysts, although less pronounced in the case of Pd-containing catalysts. The NO reduction over Pt-containing catalysts enhanced between 75–100 °C compared to those containing Pd species (150–350 °C). Furthermore, Pt-based ZrO2/SiO2/Al2O3 had slightly higher activity and N2 selectivity than Pt/ZrO2/SiO2. The NO reduction behavior at a maximum at 100 °C over the Pt-based catalysts (especially for Pt/ZrO2/SiO2) arose due to the NO reduction with H2 according to Equation (1) (e.g., [5,29,30]). The observed high amount of nitrous oxide in this temperature range is caused by the dissociative adsorption of NO on the active precious metal sites, followed by a re-arrangement of the adsorbed species and desorption of N2O and H2O via Equations (2)–(4).
2 NO + 2 H2 → N2 + 2 H2O
2 NO → 2 Nads + 2 Oads → N2O + Oads
H2 → 2 Hads
Oads + 2 Hads → H2O
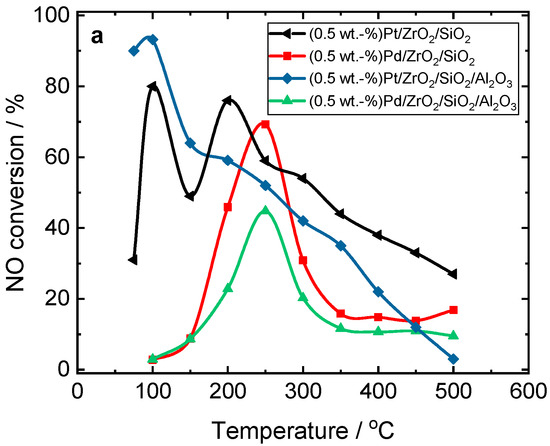
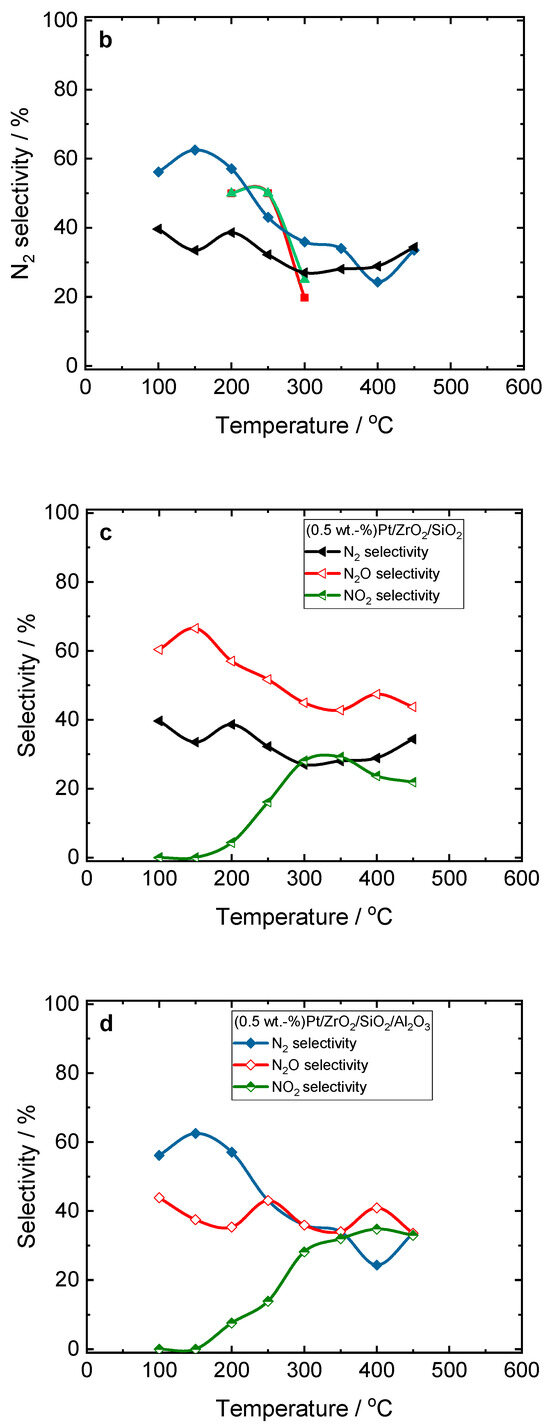
Figure 1.
(a) NO conversion and (b–d) selectivity over Pt- and Pd-containing ZrO2/SiO2 and ZrO2/SiO2/Al2O3 catalysts during H2-SCR-DeNOx; (a,b) sample labels are equal; reaction conditions: mK = 0.1 g, c(NO) = 200 ppm, c(H2) = 2000 ppm, c(O2) = 10 vol.-%, diluted in He, FTOT = 200 mL min−1, GHSV = 30,000 h−1.
As H2 is completely consumed at 150 °C (Equation (5)), the real H2-SCR-DeNOx takes place only below this temperature (Figures S4 and S5).
2 H2 + O2 → 2 H2O
At 150 °C, NO is preferentially adsorbed on the surface of ZrO2/SiO2-based catalysts as NOads, which dissociates into Nads and Oads species with the formation of N2O (Equation (2)). To prove the adsorption of NO on the surface of ZrO2/SiO2-based catalysts at this temperature, we performed stop-flow experiments. H2-SCR-DeNOx was performed for 45 min (simulating a single step of the process); after that, the feed was exchanged for pure helium for 90 min. Finally, the temperature was increased up to 500 °C. The results revealed an accumulation of NO on the surface of the ZrO2/SiO2-based catalysts (Figure 2 and Figure S6). Interestingly, the NO conversion curve for Pt/ZrO2/SiO2 shows a second maximum at 200 °C, which suggests a second reaction pathway.
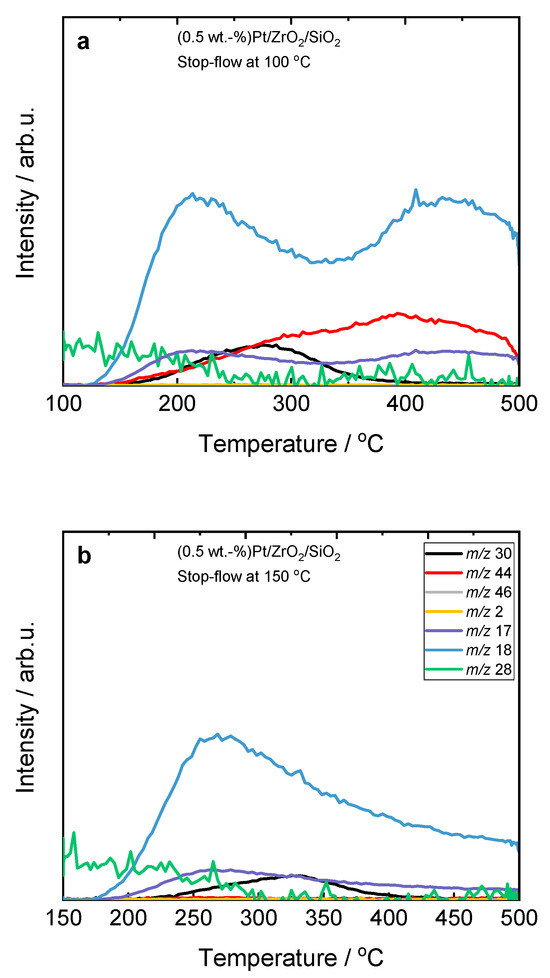
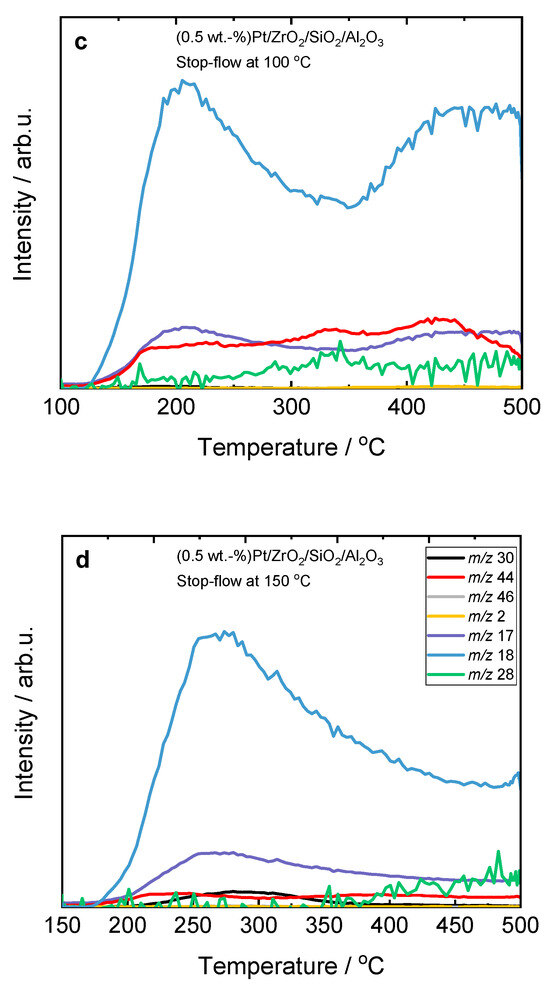
Figure 2.
Stop-flow H2-SCR-DeNOx experiments over (a,b) Pt-containing ZrO2/SiO2 and (c,d) ZrO2/SiO2/Al2O3 catalysts; (a–d) labels are equal; reaction conditions: mK = 0.1 g, c(NO) = 200 ppm, c(H2) = 2000 ppm, c(O2) = 10 vol.-%, diluted in He, FTOT = 200 mL min−1, GHSV = 30,000 h−1 (m/z—mass-to-charge ratio). H2 (m/z 2), N2 (m/z 28), NO (m/z 30), N2O (m/z 44), and NO2 (m/z 46).
2.1.2. H2-SCR-DeNOx Versus NH3-SCR-DeNOx and H2-NH3-SCR-DeNOx
The catalytic properties of selected Pt-containing samples were evaluated in NH3-SCR-DeNOx, as shown in Figure S7. Cleary, Pt-based ZrO2/SiO2/Al2O3 reduced more NO with NH3, while the selectivity of both materials remained nearly the same. In addition, the maximum NO conversion in NH3-SCR-DeNOx for Pt/ZrO2/SiO2 at 200 °C was in the same temperature range where the second peak in H2-SCR-DeNOx occurred (compared to the platinized ZrO2/SiO2/Al2O3 with a conversion maximum at 150 °C). As a consequence, for the Al-containing support, a volcano-shaped NO conversion curve in the temperature range between 75 and 300 °C in H2-SCR-DeNOx was observed, which could be based on a continuously coupled or overlaying mechanism of NO reduction by hydrogen and ammonia. In the case of Pt/ZrO2/SiO2, the NH3-SCR-DeNOx-based NO reduction started intensely above 150 °C, resulting in a split conversion curve with two maxima. Thus, the formed NH3 reduced NOx above 150 °C and thus explained the increase in the NO conversion during the H2-SCR-DeNOx process. Based on this result, it could be further hypothesized that, in the temperature range between 150 and 250 °C, the H2-SCR-DeNOx reaction is dominated through the NH3-SCR-DeNOx process (Equations (6) and (7)). The in situ NH3 formed at lower temperatures, as confirmed by in situ DRIFTS measurements (via Equation (8), Figure S8, Table S4), was temporarily stored at the acid sites of the support and desorbed in this temperature range (e.g., [5,29,30]):
4 NO + 4 NH3 + O2 → 4 N2 + 6 H2O
4 NO + 4 NH3 + 3 O2 → 4 N2O + 6 H2O
2 NO + 5 H2 → 2 NH3 + 2 H2O
To further prove if NH3-SCR-DeNOx dominated above 150 °C over Pt-containing catalysts, we performed NH3-assisted H2-SCR-DeNOx over both Pt/ZrO2/SiO2 and Pt/ZrO2/SiO2/Al2O3 (Figures S9 and S10). It can be seen that the NH3-SCR-DeNOx process started at lower temperatures over Pt/ZrO2/SiO2/Al2O3 than for Pt/ZrO2/SiO2. This was further supported for H2-SCR-DeNOx with pre-adsorbed NH3 (Figure S11) over Pt/ZrO2/SiO2 and Pt/ZrO2/SiO2/Al2O3. Again, it was shown that N2O preferentially formed as a result of the dissociative adsorption of NO below 200 °C over Pt/ZrO2/SiO2.
Above 250 °C, NO oxidation to NO2 takes place (Equation (9)), resulting in a continuous decrease in the NO concentration in the reaction gas:
2 NO + O2 → 2 NO2
To clarify the role of each applied noble metal, in addition to H2-SCR-DeNOx, we performed NH3-SCR-DeNOx (Figure S11) over the Pd-containing counterparts. A comparison of H2-SCR-DeNOx over Pt- and Pd-containing catalysts (Figure 1 and Figure S6) revealed that NO conversion occurred over both samples. In contrast, for NH3-SCR-DeNOx over both catalysts (Figure S12), the NO conversion occurred over Pt-containing catalysts, while NH3 was oxidized mainly to NO over Pd-containing materials.
2.1.3. Effect of Precious Metal Loading
Figure S13 compares the NO conversion and N2 selectivity over the Pt- and Pt/Pd-containing catalysts during H2-SCR-DeNOx. Among the evaluated samples, the Pt/Pd combinations supported on ZrO2/SiO2 had the highest N2 selectivity. Thus, we then focused on the loading of precious metals over both ZrO2/SiO2- and ZrO2/SiO2/Al2O3-supported materials. Figure 3 reveals the activity and N2 selectivity of the Pt/Pd-containing ZrO2/SiO2 and ZrO2/SiO2/Al2O3 plotted versus temperature with various noble metal concentrations (0.1–1.0 wt.-%) in H2-SCR-DeNOx. Among the ZrO2/SiO2-based catalysts, the NO conversion above 80% below 150 °C was achieved over (1.0 wt.-%)Pt/Pd/ZrO2/SiO2. Otherwise, the N2 selectivity over this sample was below 60% up to 200 °C. For the samples with loadings of 0.5–1.0 wt.-% supported on ZrO2/SiO2/Al2O3, no NO conversion at 150 °C was detected. This significant drop in activity appeared as H2 was completely consumed at 150 °C, while any NO was adsorbed over this type of support. Above 150 °C, NO oxidation started to dominate over the Pt/Pd/ZrO2/SiO2/Al2O3 catalyst.
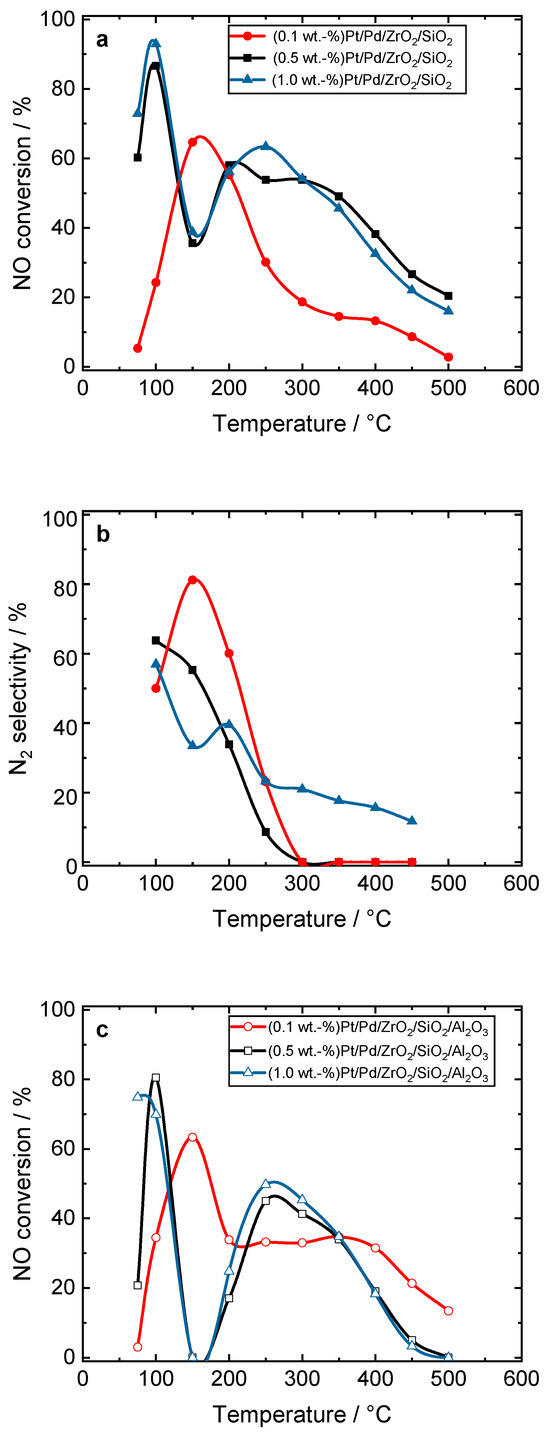
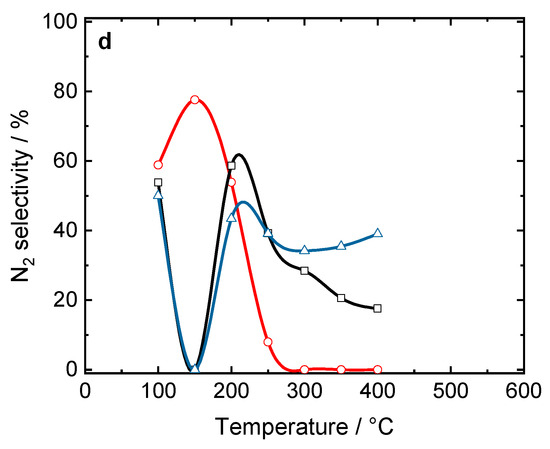
Figure 3.
(a,c) NO conversion and (b,d) N2 selectivity over Pt/Pd-containing ZrO2/SiO2 and ZrO2/SiO2/Al2O3 catalysts during H2-SCR-DeNOx; (a,b) and (c,d) sample labels are equal; reaction conditions: mK = 0.1 g, c(NO) = 200 ppm, c(H2) = 2000 ppm, c(O2) = 10 vol.-%, diluted in He, FTOT = 200 mL min−1, GHSV = 30,000 h−1.
As the loading of the noble metals reduced, the maximum NO reduction shifted progressively to higher temperatures. The catalyst with the lowest Pt/Pd loading of 0.1 wt.-% showed a more pronounced volcano-shaped conversion between 100 and 300 °C. The lower NO conversion of the material with 0.1 wt.-% loading and the enhanced N2 selectivity at 150 °C (ca. 80%) indicated the lower accessibility of the precious metal species to reactant molecules. Also, this material resulted in the higher oxidation of NO to NO2, which was reflected by the drop in the N2 selectivity above 300 °C. A similar trend was observed in the case of the samples based on the ZrO2/SiO2/Al2O3 support. Among the investigated series of Pt/Pd-containing samples, the (0.5 wt.-%)Pt/Pd/ZrO2/SiO2 catalysts had the optimum activity and N2 selectivity during H2-SCR-DeNOx (i.e., below 150 °C). In addition, similar conversion and selectivity were found for the Pt- and Pt–Pd-containing oxides (with the exception of Pt/ZrO2/SiO2) in NH3-SCR-DeNOx (Figure S10), indicating that both reactions proceeded over the same precious metal species.
2.1.4. Effect of Support Composition
Figure 4 compares the activity and N2 selectivity of the (0.5 wt.-%) Pt/Pd-loaded ZrO2/SiO2, ZrO2/SiO2/Al2O3, and commercial titania-containing Al2O3/SiO2/TiO2 (5/20, 30/10) in H2-SCR-DeNOx. A maximum NO conversion of 94% at 100 °C was obtained with Al2O3/SiO2/TiO2 (5/20), followed by both Al2O3/SiO2/TiO2 (30/10; i.e., with a higher silica amount) and ZrO2/SiO2/Al2O3 (88%). It was remarkable that the maximum NO conversion was obtained at 100 °C for all silica-based catalysts. Also, a volcano-type behavior in NO conversion was observed for all catalysts. Still, (0.5 wt.-%)Pt/Pd/ZrO2/SiO2 showed the highest selectivity toward N2 (80% at 100 °C) among the investigated materials (with N2 selectivity below 60% at this temperature).
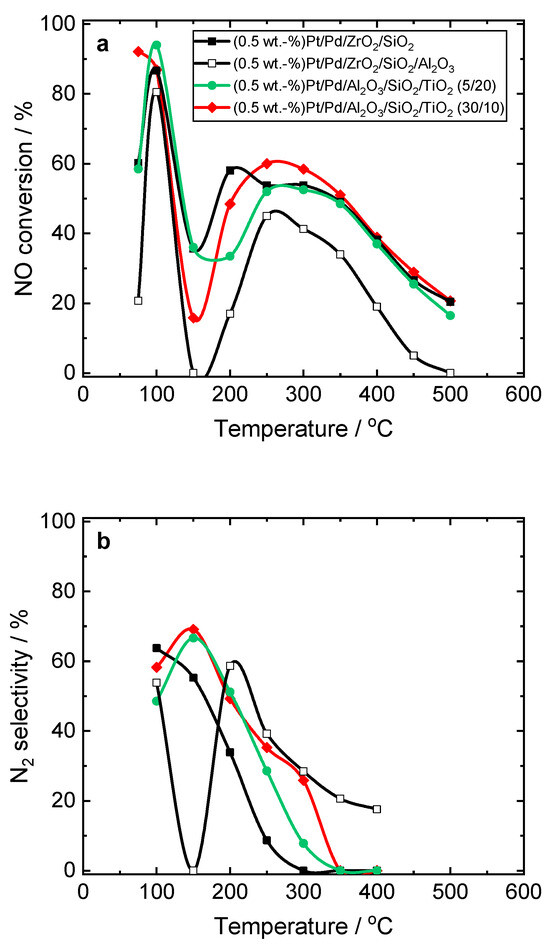
Figure 4.
(a) NO conversion and (b) N2 selectivity over Pt/Pd-containing ZrO2/SiO2, ZrO2/SiO2/Al2O3, Al2O3/SiO2/TiO2 (5/20 and 30/10) catalysts during H2-SCR-DeNOx; (a,b) sample labels are equal; reaction conditions: mK = 0.1 g, c(NO) = 200 ppm, c(H2) = 2000 ppm, c(O2) = 10 vol.-%, diluted in He, FTOT = 200 mL min−1, GHSV = 30,000 h−1.
Additionally, the (0.5 wt.-%)Pt/Pd/ZrO2/SiO2 catalyst was tested in six consecutive cycling tests with heating to 500 °C and cooling down to 30 °C (Figure S14) as well as in the 24 h steady-state at 100 °C for 24 h (Figure S15). This catalyst showed stable NO conversion and selectivity during the applied temperature and time. In the following studies, this material will be coated on monolith and investigated as a catalyst applied in H2 engines in the feed gas (containing above 12 wt.-% H2O).
The morphological images of the catalyst before and after the reactions are provided to illustrate the stability of the catalyst. Figure S16 shows the ToF-SIMS images collected from the surface of (0.5 wt.-%)Pt/Pd/ZrO2/SiO2 for the fresh sample, after H2-SCR-DeNOx for 24 h at 100 °C, and after six cycles during H2-SCR-DeNOx. The obtained results showed that the distribution of Pd+ and Pt+ ions on the surface of the tested materials was homogeneous and did not change in the case of samples tested after the reaction. Table S5 presents the intensity ratios of selected ions calculated from the collected spectra. Among all investigated samples, minor changes appeared in the signal coming from the Pd+ and Pt+ ions with respect to the main carrier components (Si+ and Zr+ ions).
2.1.5. Effect of Hydrogen Concentration
Figure 5 shows the NO conversion as well as the N2 and N2O selectivity of (0.5 wt.-%) Pt/Pd-containing ZrO2/SiO2 and ZrO2/SiO2/Al2O3 in H2-SCR-DeNOx at 120 °C with varied H2 concentrations at 120 °C. After 3 h of conditioning in the feed containing 2000 ppm of hydrogen, its concentration was increased up to 4000 ppm (in intervals of 0.5 h), while keeping the total flow content. For the ZrO2/SiO2-based catalyst, an increase in NO conversion from 77 to 89% was observed with increasing the H2 concentration to 4000 ppm. However, the enhanced NO conversion was accompanied by the N2 selectivity dropping from 71 to 66%. Thus, the N2O selectivity of Pt/Pd/ZrO2/SiO2 increased with increasing H2 concentration in the feed at 120 °C. Hence, the accumulation of NO over time at the surface of the ZrO2/SiO2-based catalyst led to the formation of N2O (Equation (2)). Conversely, for the ZrO2/SiO2/Al2O3-based catalyst, an increase in NO conversion of 21% was observed, resulting in an increase in N2 selectivity from 44 to 55%, indicating different reaction pathways over the second catalyst (i.e., according to the NO reduction with H2, Equation (1); Figures S17 and S18). A schematic representation of the above-described mechanism is presented in Figure 6.
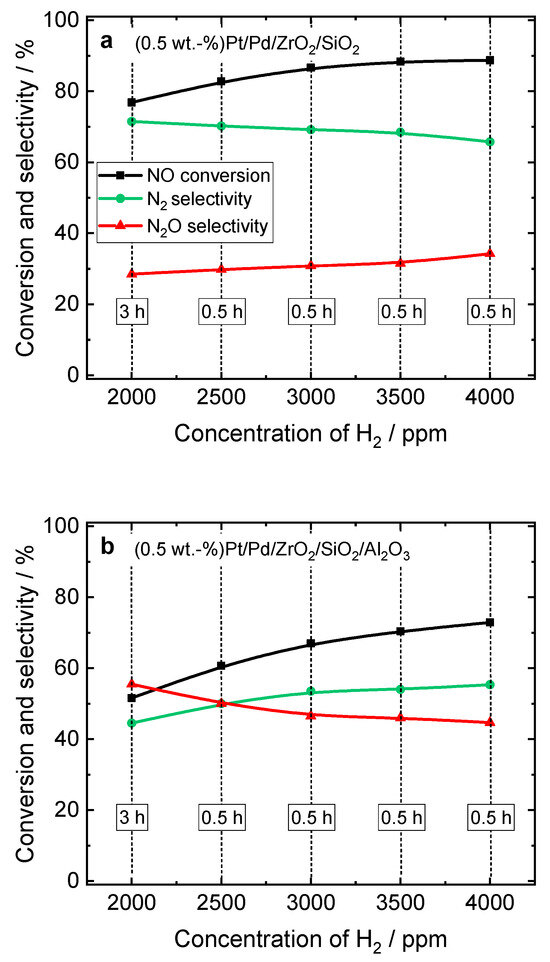
Figure 5.
NO conversion and N2 selectivity over (a) Pt/Pd-containing ZrO2/SiO2 and (b) ZrO2/SiO2/Al2O3 during H2-SCR-DeNOx with various H2 concentrations at 120 °C; (a,b) labels are equal; reaction conditions: mK = 0.1 g, c(NO) = 200 ppm, c(H2) = 2000–4000 ppm, c(O2) = 10 vol.-%, diluted in He, FTOT = 200 mL min−1, GHSV = 30,000 h−1.
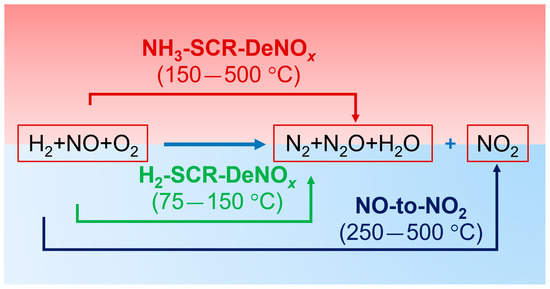
Figure 6.
Schematic representation of the reaction mechanism.
3. Catalyst Preparation and Characterization
Commercially available silica-containing supports such as ZrO2/SiO2 (Luxfer Mel Technologies, Manchester, UK; XCO 2699; 10 wt.-% SiO2), ZrO2/SiO2/Al2O3 (Sasol Germany GmbH, Hamburg Germany; Siralox SZ 25/15; 25 wt.-% SiO2, 15 wt.-% ZrO2), Al2O3/SiO2/TiO2 (5/20) (Sasol Germany GmbH, Hamburg, Germany; Siralox 5/Ti 20; 5 wt.-% SiO2, 20 wt.-% TiO2), and Al2O3/SiO2/TiO2 (30/10) (Sasol Germany GmbH, Hamburg, Germany; Siralox 30/Ti 10; 30 wt.-% SiO2, 10 wt.-% TiO2) were used in this study. These supports were impregnated by the incipient wetness impregnation (IWI) method with Pt, Pd, and Pt/Pd precursors. The total precious metal contents of the resulting catalyst were adjusted to 0.1, 0.5, and 1 wt.-%. Therefore, appropriate amounts of aqueous solutions of (NH3)4Pt(NO3)2 (99 wt.-%, Fisher Scientific GmbH, Schwerte, Germany) and (NH3)4Pd(NO3)2 (99 wt.-%, Stanford Advanced Materials, Lake Forest, CA, USA) or their mixtures (based on H2O absorption analysis in advance) were mixed with the supports. Bimetallic Pt/Pd samples were prepared with a ratio of n(Pt)/n(Pd) = 1.0. The resulting wet powders were dried at 120 °C and afterwards calcined at 550 °C (1 h, 3 °C min−1). The sample abbreviations include information about the intended loading of the noble metal and selected support, e.g., (0.5 wt.-%)Pt/ZrO2/SiO2.
The information regarding the physico-chemical characterization of the selected samples, including XRD, N2 sorption, inductively coupled plasma–optical emission spectroscopy (ICP-OES), temperature-programmed desorption of ammonia (NH3-TPD), time-of-flight secondary ion mass spectrometry (ToF-SIMS), and in situ DRIFTS, can be found in the Supplementary Information.
4. Catalytic Studies
The catalytic experiments were carried out with 0.1 g of catalyst, with a particle size fraction of 200–400 µm, placed in a fixed-bed quartz tube reactor (ID: 6 mm, L: 200 mm). Before each experiment, the catalyst was activated at 350 °C for 1.5 h at a flow rate of 50 mL min−1 of pure helium (He). The reactor was then cooled to 50 °C. The total gas phase flow was 200 mL min−1, corresponding to a gas hourly space velocity (GHSV) of 30,000 h−1. The feed consisting of c(NO) = 200 ppm, c(H2) = 2000 ppm, and c(O2) = 10 vol.-% was diluted in He. Our target application of H2-SCR-DeNOx in the H2-fired internal combustion engines for combined heat and power (CHP) with exhaust gas temperatures below 150 °C did not require catalytic experiments with NO2 in the feed gas. The reaction was carried out at atmospheric pressure up to 500 °C in increments of 25–50 °C. At each temperature, the reaction was allowed to stabilize for 45 min before quantitative analysis of the product gas composition, and the resulting concentration was obtained. The reagents and products were analyzed continuously using a QMS MKS Cirrus-3 (Munich, Germany) connected directly to the reactor outlet via a heated capillary.
The NO conversion (X(NO)) was determined using the formula X(NO) = ([c(NO)in-c(NO)out]/c(NO)in) × 100%. In this equation, c(NO)in and c(NO)out represent the NO concentration in the inlet and outlet gas, respectively. To maintain the accuracy of the measurements, the He line signal was used as an internal standard to compensate for small variations in operating pressure. During the H2-SCR-DeNOx reaction, in addition to N2, N2O and NOx were identified. To calculate the selectivity toward N2 formation, the equation S(N2) = (c(N2))/(c(N2) + c(N2O) + 0.5c(NO2)) × 100% was applied. In this expression, c(N2), c(N2O), and c(NO2) correspond to the concentrations of N2, N2O, and NO2 in the flue gases, respectively. The experimental uncertainty in the calculated NO conversion was found to be ±5% (as indicated by repeated measurements of identical catalysts).
For the stop-flow experiments, the reaction was carried out for 45 min at 100 or 150 °C with the feed gas as specified above. After that time, the feed was exchanged with a flow of pure helium (50 mL min−1). After 90 min of purging, the temperature was increased up to 500 °C with a heating step of 10 °C min−1.
Selected samples were investigated for the selective catalytic reduction of NOx with ammonia (NH3-SCR-DeNOx) and combined H2-NH3-SCR-DeNOx, following the same procedure as applied for H2-SCR-DeNOx. The total gas phase flow was 200 mL min−1 (120 mL min−1 for NH3-SCR-DeNOx), consisting of c(NO) = 200 ppm, c(H2) = 2000 ppm, c(NH3) = 1000 ppm, c(O2) = 10 vol.-% diluted in helium (c(NO) = 1000 ppm, c(NH3) = 1000 ppm, and c(O2) = 10 vol.-% diluted in helium). The gas hourly space velocity (GHSV) was also set at 30,000 h−1. Again, the experimental uncertainty of the calculated NO conversion was found to be ±5% (as indicated by repeated measurements of identical catalysts).
5. Conclusions
Pt- and/or Pd-deposited on the different silica supports were investigated in H2-SCR-DeNOx under lean reaction conditions with 10 vol.-% O2. The Pt–Pd-containing catalysts reported for the first time in this paper outperformed monometallic catalysts. Different catalyst compositions had the highest activity and N2 selectivity below 150 °C for Pt/Pd/ZrO2/SiO2, with a total noble metal loading of 0.5 wt.-%. This catalyst showed high stability during time-on-stream H2-SCR-DeNOx. H2 was completely consumed at 150 °C during H2-SCR-DeNOx over the applied catalysts. In addition to H2-SCR-DeNOx, selected materials were examined in NH3-SCR-DeNOx as well as NH3-assisted H2-SCR-DeNOx. A comparison of the catalytic results from H2-SCR-DeNOx, (H2-)NH3-SCR-DeNOx, and stop-flow H2-SCR-DeNOx indicated that in the temperature range between 150 and 250 °C, a continuously coupled or overlaying mechanism of NO reduction by hydrogen and ammonia based on NH3 formation at lower temperatures, which was temporarily stored at acid sites of the support and desorbed in this temperature range, could be postulated. The oxidation of NO appeared above 250 °C.
Supplementary Materials
The following supporting information can be downloaded at: https://www.mdpi.com/article/10.3390/catal15050483/s1, Figure S1: XRD patterns of Pt- and Pd-containing catalysts; * ZrO2 (cubic), + TiO2 (anatase); Figure S2: (a,b) N2 sorption isotherms collected at −196 °C and (c,d) BJH pore width distribution of Pt- and Pd-containing catalysts; (a,c) and (b,d) sample labels are identical. Figure S3: NH3-TPD profiles of Pt-, Pd- and Pt/Pd-containing catalysts: (a) ZrO2/SiO2, (b) ZrO2/SiO2/Al2O3, and (c) Al2O3/SiO2/TiO2. Table S1: The elemental analysis results of Pt- and/or Pd-containing catalysts (ωi: mass fractions; ω(TOT): total mass fractions of noble metals). Table S2: The textural properties of Pt- and/or Pd-containing catalysts: specific surface area (As(BET)), micropore pore volume (VMIC), mesopore pore volume (VMES), and total pore volume (VTOT). Table S3: The results of NH3-TPD of Pt- and/or Pd-containing catalysts: concentration of acid sites (CNH3) and acid site density (ANH3). Figure S4: Examples of raw data, showing the temperature-dependent disappearance of H2 (m/z = 2) from the reaction mixture due to its oxidation (m/z, mass-to-charge ratio; 1 scan = 19 s). Figure S5: Raw data for H2-SCR-DeNOx over pure (a) ZrO2/SiO2 and (b) ZrO2/SiO2/Al2O3 supports (without metals); (a,b) labels are equal; reaction conditions: mK = 0.1 g, c(NO) = 200 ppm, c(H2) = 2000 ppm, c(O2) = 10 vol.-%, diluted in He, FTOT = 200 mL min−1, GHSV = 30,000 h−1 (m/z, mass-to-charge ratio; 1 scan = 19 s). H2 (m/z 2), NH3 (m/z 17) H2O (m/z 18), N2 (m/z 28), NO (m/z 30), N2O (m/z 44), and NO2 (m/z 46). Figure S6: Raw data for H2-SCR-DeNOx over (a,b) Pt-containing ZrO2/SiO2 and ZrO2/SiO2/Al2O3 catalysts, and (c,d) Pd-containing ZrO2/SiO2 and ZrO2/SiO2/Al2O3 catalysts; (a–d) labels are equal; Reaction conditions: mK = 0.1 g, c(NO) = 200 ppm, c(H2) = 2000 ppm, c(O2) = 10 vol.-%, diluted in He, FTOT = 200 mL min−1, GHSV = 30,000 h−1 (m/z, mass-to-charge ratio; 1 scan = 19 s). H2 (m/z 2), N2 (m/z 28), NO (m/z 30), N2O (m/z 44), and NO2 (m/z 46). Figure S7: (a) NO conversion and (b) selectivity over Pt-containing ZrO2/SiO2 and ZrO2/SiO2/Al2O3 catalysts during NH3-SCR-DeNOx; (a) and (b) sample labels are equal; reaction conditions: mK = 0.1 g, c(NO) = 1000 ppm, c(NH3) = 1000 ppm, c(O2) = 10 vol.-%, diluted in He, FTOT = 120 mL min−1, GHSV = 30,000 h−1. Figure S8: DRIFT spectra of the (a,c) Pt-containing ZrO2/SiO2 and (b,d) ZrO2/SiO2/Al2O3 catalysts during H2-SCR-DeNOx. Table S4: Assignment of the identified peaks [31,32]. Figure S9: Raw data for H2-NH3-SCR-DeNOx over (a) Pt-containing ZrO2/SiO2 and (b) ZrO2/SiO2/Al2O3 catalysts; (a–c) labels are equal; Reaction conditions: mK = 0.1 g, c(NO) = 200 ppm, c(H2) = 2000 ppm, c(NH3) = 1000 ppm, c(O2) = 10 vol.-%, diluted in He, FTOT = 200 mL min−1, GHSV = 30,000 h−1 (m/z, mass-to-charge ratio; 1 scan = 19 s). H2 (m/z 2), NH3 (m/z 17), H2O (m/z 18), N2 (m/z 28), NO (m/z 30), N2O (m/z 44), and NO2 (m/z 46). Figure S10: Comparison of the (a,c) NO conversion and (b,d) N2 selectivity during H2-SCR-, NH3-SCR- and H2-NH3-SCR-DeNOx over Pt-containing ZrO2/SiO2 and ZrO2/SiO2/Al2O3 catalysts. Reaction conditions for H2-NH3-SCR-DeNOx: mK = 0.1 g, c(NO) = 200 ppm, c(H2) = 2000 ppm, c(NH3) = 1000 ppm, c(O2) = 10 vol.-%, diluted in He, FTOT = 200 mL min−1, GHSV = 30,000 h−1. Figure S11: Temperature-programmed desorption over (a) Pt-containing ZrO2/SiO2 and (b) ZrO2/SiO2/Al2O3 catalysts: NH3 desorption in NO+O2+H2; Reaction conditions: mK = 0.1 g, adsorption: c(NH3) = 3000 ppm, diluted in He, 45 min, 50 mL min−1, desorption: pure He, 90 min, 50 mL min−1, surface reaction: c(NO) = 3000 ppm, c(H2) = 1000 ppm and c(O2) = 10 vol.-%, diluted in He, 50 mL min−1; (m/z, mass-to-charge ratio; 1 scan = 19 s). NH3 (m/z 17), H2O (m/z 18), N2 (m/z 28), NO (m/z 30), N2O (m/z 44), NO2 (m/z 46), and H2 (m/z 2). Figure S12: Raw data for NH3-SCR-DeNOx over (a,b) Pt-containing ZrO2/SiO2 and ZrO2/SiO2/Al2O3 catalysts, and (c,d) Pd-containing ZrO2/SiO2 and ZrO2/SiO2/Al2O3 catalysts; (a–d) labels are equal; Reaction conditions: mK = 0.1 g, c(NO) = 1000 ppm, c(NH3) = 1000 ppm, c(O2) = 10 vol.-%, diluted in He, FTOT = 120 mL min−1, GHSV = 30,000 h−1 (m/z, mass-to-charge ratio; 1 scan = 19 s). NH3 (m/z 17), H2O (m/z 18), N2 (m/z 28), NO (m/z 30), N2O (m/z 44), and NO2 (m/z 46). Figure S13: (a) NO conversion and (b) N2 selectivity over Pt- and Pt/Pd-containing ZrO2/SiO2 and ZrO2/SiO2/Al2O3 catalysts during H2-SCR-DeNOx; (a,b) sample labels are equal; reaction conditions: mK = 0.1 g, c(NO) = 200 ppm, c(H2) = 2000 ppm, c(O2) = 10 vol.-%, diluted in He, FTOT = 200 mL min−1, GHSV = 30,000 h−1. Figure S14: Comparison of the (a) activity and (b) selectivity of (0.5 wt.-%)Pt/Pd/ZrO2/SiO2 during heating (30–500 °C) and cooling down (500–30 °C) during H2-SCR-DeNOx. Reaction conditions: mK = 0.1 g, c(NO) = 200 ppm, c(H2) = 2000 ppm, c(O2) = 10 vol.-%, diluted in He, FTOT = 200 mL min−1, GHSV = 30,000 h−1, linear heating rate of 10 °C min−1 (m/z, mass-to-charge ratio; 1 scan = 19 s). NO (m/z 30), N2 (m/z 28), N2O (m/z 44), and H2 (m/z 2). Figure S15: Long-term experiments over (0.5 wt.-%)Pt/Pd/ZrO2/SiO2 during H2-SCR-DeNOx at 100 °C for 24 h; reaction conditions: mK = 0.1 g, c(NO) = 200 ppm, c(H2) = 2000 ppm, c(O2) = 10 vol.-%, diluted in He, FTOT = 200 mL min−1, GHSV = 30,000 h−1 (m/z, mass-to-charge ratio; 1 scan = 19 s). H2 (m/z 2), H2O (m/z 18), N2 (m/z 28), NO (m/z 30), N2O (m/z 44), and NO2 (m/z 46). Figure S16: ToF-SIMS images collected from the surface of (0.5 wt.-%)Pt/Pd/ZrO2/SiO2 (tc, total counts), (a) fresh sample, (b) after H2-SCR-DeNOx for 24 h at 100 °C, (c) after H2-SCR-DeNOx with H2O, and (d) after six cycles during H2-SCR-DeNOx. Table S5: Intensity ratios of selected ions calculated based on ToF-SIMS spectra collected from the surface of the samples. Figure S17: Comparison of the (a,b) NO conversion and N2 selectivity during (c) H2-SCR-DeNOx and (d) NH3-SCR-DeNOx over (a,c) Pt-containing and (b,d) Pt/Pd-containing ZrO2/SiO2 and ZrO2/SiO2/Al2O3 catalysts; (a,b) and (c,d) sample labels are equal. Figure S18: (a) NO conversion and (b–d) selectivity over Pt- and Pt/Pd-containing ZrO2/SiO2 and ZrO2/SiO2/Al2O3 catalysts during NH3-SCR-DeNOx; (a–d) sample labels are equal; reaction conditions: mK = 0.1 g, c(NO) = 1000 ppm, c(NH3) = 1000 ppm, c(O2) = 10 vol.-%, diluted in He, FTOT = 120 mL min−1, GHSV = 30,000 h−1.
Author Contributions
M.J.: conceptualization, methodology, investigation, data curation, writing—original draft, writing—review and editing, supervision, project management. A.O.H.: investigation, data curation, writing—original draft. J.D.: conceptualization, methodology, investigation, writing—review and editing. J.G.: investigation, data curation. A.G.: investigation, data curation. U.S.: review. R.G.: review. All authors have read and agreed to the published version of the manuscript.
Funding
M.J. acknowledges a DFG Research Grant JA 2998/2-1. M.J., J.D. and R.G. acknowledge Bundesministerium für Wirtschaft und Klimaschutz Project FDZ 03EE5122B.
Data Availability Statement
Data are contained within this article and Supplementary Materials.
Conflicts of Interest
The authors do not have any conflicts of interest.
References
- Skowron, A.; Lee, D.S.; De León, R.R. Variation of radiative forcings and global warming potentials from regional aviation NOx emissions. Atmos. Environ. 2015, 104, 69–78. [Google Scholar] [CrossRef]
- Hui, K.; Yuan, Y.; Xi, B.; Tan, W. A review of the factors affecting the emission of the ozone chemical precursors VOCs and NOx from the soil. Environ. Int. 2023, 172, 107799. [Google Scholar] [CrossRef] [PubMed]
- Zhao, X.; Zhang, X.; Xu, Y.; Liu, Y.; Wang, X.; Yu, Q. The effect of H2O on the H2-SCR of NOx over Pt/HZSM-5. J. Mol. Catal. A Chem. 2015, 400, 147–153. [Google Scholar] [CrossRef]
- Cao, L.; Wang, Q.; Yang, J. Ultrafine Pt particles directed by polyvinylpyrrolidone on zeolite beta as an efficient low-temperature H2-SCR catalyst. J. Environ. Chem. Eng. 2020, 8, 103631. [Google Scholar] [CrossRef]
- Hu, Z.; Yang, R.T. 110th Anniversary: Recent progress and future challenges in selective catalytic reduction of NO by H2 in the presence of O2. Ind. Eng. Chem. Res. 2019, 58, 10140–10153. [Google Scholar] [CrossRef]
- Liu, Y.; Tursun, M.; Yu, H.; Wang, X. Surface property and activity of Pt/Nb2O5-ZrO2 for selective catalytic reduction of NO by H2. Mol. Catal. 2019, 464, 22–28. [Google Scholar] [CrossRef]
- Choi, M.; Yook, S.; Kim, H. Hydrogen spillover in encapsulated metal catalysts: New opportunities for designing advanced hydroprocessing catalysts. ChemCatChem 2015, 7, 1048–1057. [Google Scholar] [CrossRef]
- Hong, Z.; Sun, X.; Wang, Z.; Zhao, G.; Li, X.; Zhu, Z. Pt/SSZ-13 as an efficient catalyst for the selective catalytic reduction of NOx with H2. Catal. Sci. Technol. 2019, 9, 3994–4001. [Google Scholar] [CrossRef]
- Li, L.; Wu, P.; Yu, Q.; Wu, G.; Guan, N. Low temperature H2-SCR over platinum catalysts supported on Ti-containing MCM-41. Appl. Catal. B Environ. 2010, 94, 254–262. [Google Scholar] [CrossRef]
- Zhang, Y.; Xu, S.; Li, J.; He, E.; Liu, Z. Unraveling the promotional effect of Co on the Pd/TiO2 Catalyst for H2-SCR of NOx in the presence of oxygen. J. Phys. Chem. C 2023, 127, 7248–7256. [Google Scholar] [CrossRef]
- Park, D.C.; Moon, S.; Song, J.H.; Kim, H.; Lee, E.; Lim, Y.H.; Kim, D.H. Widening the operating window of Pt/ZSM-5 catalysts for efficient NOx removal in H2-SCR: Insights from thermal aging. Catal. Today 2024, 425, 114318. [Google Scholar] [CrossRef]
- Schott, F.J.P.; Balle, P.; Adler, J.; Kureti, S. Reduction of NOx by H2 on Pt/WO3/ZrO2 catalysts in oxygen-rich exhaust. Appl. Catal. B Environ. 2009, 87, 18–29. [Google Scholar] [CrossRef]
- Yu, Q.; Richter, M.; Li, L.; Kong, F.; Wu, G.; Guan, N. The promotional effect of Cr on catalytic activity of Pt/ZSM-35 for H2-SCR in excess oxygen. Catal. Commun. 2010, 11, 955–959. [Google Scholar] [CrossRef]
- Hamada, S.; Hibarino, S.; Ikeue, K.; Machida, M. Preparation of supported Pt-M catalysts (M = Mo and W) from anion-exchanged hydrotalcites and their catalytic activity for low temperature NO-H2-O2 reaction. Appl. Catal. B Environ. 2007, 74, 197–202. [Google Scholar] [CrossRef]
- Liu, Z.; Li, J.; Woo, S.I. Recent advances in the selective catalytic reduction of NO x by hydrogen in the presence of oxygen. Energy Environ. Sci. 2012, 5, 8799–8814. [Google Scholar] [CrossRef]
- Shibata, J.; Hashimoto, M.; Shimizu, K.; Yoshida, H.; Hattori, T.; Satsuma, A. Factors controlling activity and selectivity for SCR of NO by hydrogen over supported platinum catalysts. J. Phys. Chem. B 2004, 108, 18327–18335. [Google Scholar] [CrossRef]
- Costa, C.N.; Efstathiou, A.M. Low-temperature H2-SCR of NO on a novel Pt/MgO-CeO2 catalyst. Appl. Catal. B Environ. 2007, 72, 240–252. [Google Scholar] [CrossRef]
- Yu, Q.; Richter, M.; Kong, F.; Li, L.; Wu, G.; Guan, N. Selective catalytic reduction of NO by hydrogen over Pt/ZSM-35. Catal. Today 2010, 158, 452–458. [Google Scholar] [CrossRef]
- Duan, K.; Chen, B.; Zhu, T.; Liu, Z. Mn promoted Pd/TiO2-Al2O3 catalyst for the selective catalytic reduction of NOx by H2. Appl. Catal. B Environ. 2015, 176, 618–626. [Google Scholar] [CrossRef]
- Patel, V.K.; Sharma, S. Effect of oxide supports on palladium based catalysts for NO reduction by H2-SCR. Catal. Today 2021, 375, 591–600. [Google Scholar] [CrossRef]
- Moon, S.; Park, D.C.; Lee, E.; You, Y.-W.; Heo, I.; Kim, Y.J.; Kim, D.H. Excellent activity and selectivity of Pd/ZSM-5 catalyst in the selective catalytic reduction of NOx by H2. Environ. Res. 2023, 227, 115707. [Google Scholar] [CrossRef]
- Jabłońska, M.; Osorio Hernández, A. Selective catalytic reduction of nitrogen oxides with hydrogen (H2-SCR-DeNOx) over platinum-based catalysts. ChemCatChem 2024, 16, e202400977. [Google Scholar] [CrossRef]
- Mangla, O.; Roy, S. Monoclinic zirconium oxide nanostructures having tunable band gap synthesized under extremely non-equilibrium plasma conditions. Proceedings 2019, 3, 10. [Google Scholar]
- Tan, D.; Lin, G.; Liu, Y.; Teng, Y.; Zhuang, Y.; Zhu, B.; Zhao, Q.; Qiu, J. Synthesis of nanocrystalline cubic zirconia using femtosecond laser ablation. J. Nanopart. Res. 2011, 13, 1183–1190. [Google Scholar] [CrossRef]
- Chaiyo, P.; Duangsing, B.; Thumthan, O.; Nutariya, J.; Pukird, S. Electrical and gas sensing properties of TiO2/GO nanocomposites for CO2 sensor application. J. Phys. Conf. Ser. 2017, 901, 012095. [Google Scholar] [CrossRef]
- Schröder, D.; Kureti, S. Low-temperature NOx reduction by H2 on Mo-promoted Pt/ZrO2 catalysts in lean exhaust gases. Top. Catal. 2023, 66, 787–796. [Google Scholar] [CrossRef]
- Li, X.; Zhang, X.; Xu, Y.; Liu, Y.; Wang, X. Influence of support properties on H2 selective catalytic reduction activities and N2 selectivities of Pt catalysts. Chin. J. Catal. 2015, 36, 197–203. [Google Scholar] [CrossRef]
- Park, J.-H.; Cho, J.H.; Kim, Y.J.; Kim, E.S.; Han, H.S.; Shin, C.-H. Hydrothermal stability of Pd/ZrO2 catalysts for high temperature methane combustion. Appl. Catal. B Environ. 2014, 160, 135–143. [Google Scholar] [CrossRef]
- Farhan, S.M.; Wang, P.; Chen, Z.; Yin, J. Innovative catalysts for the selective catalytic reduction of NOx with H2: A systematic review. Fuel 2024, 355, 129364. [Google Scholar] [CrossRef]
- Guan, Y.; Liu, Y.; Lv, Q.; Wang, B.; Che, D. Review on the selective catalytic reduction of NOx with H2 by using novel catalysts. J. Environ. Chem. Eng. 2021, 9, 106770. [Google Scholar] [CrossRef]
- Eldridge, T.J.; Borchers, M.; Lott, P.; Grunwaldt, J.D.; Doronkin, D.E. Elucidating the role of the state of Pd in the H2-SCR of NOx by operando XANES and DRIFTS. Catal. Sci. Technol. 2024, 14, 4198–4210. [Google Scholar] [CrossRef]
- Fan, J.; Ning, P.; Song, Z.; Liu, X.; Wang, L.; Wang, J.; Wang, H.; Long, K.; Zhang, Q. Mechanistic aspects of NH3-SCR reaction over CeO2/TiO2-ZrO2-SO42− catalyst: In situ DRIFTS investigation. Chem. Eng. J. 2018, 334, 855–863. [Google Scholar] [CrossRef]
Disclaimer/Publisher’s Note: The statements, opinions and data contained in all publications are solely those of the individual author(s) and contributor(s) and not of MDPI and/or the editor(s). MDPI and/or the editor(s) disclaim responsibility for any injury to people or property resulting from any ideas, methods, instructions or products referred to in the content. |
© 2025 by the authors. Licensee MDPI, Basel, Switzerland. This article is an open access article distributed under the terms and conditions of the Creative Commons Attribution (CC BY) license (https://creativecommons.org/licenses/by/4.0/).