
Removal from Water of Some Pharmaceuticals by Photolysis and Photocatalysis: Kinetic Models

Abstract

1. Introduction
- (a)
- Investigate the photolytic and photocatalytic degradation kinetics of a mixture comprising four pharmaceuticals, proposing a generic kinetic model to address the complexity of simultaneously removing multiple compounds, considering the formation of reactive oxygen species (ROS),
- (b)
- Determination of the actual quantum yield at 254 nm of each pharmaceutical and identification of the specific ROS generated during their photolysis.
- (c)
- Determination of the reaction rate constant of each pharmaceutical with 1O2 to elucidate the role of this species in the photolysis of photosensitizing agents.
- (d)
- Check the influence of TiO2 concentration incorporated into the kinetic model in order to simulate the photocatalytic degradation of the four pharmaceuticals as a mixture, as well as the evolution of the ROS involved throughout the process.
2. Results and Discussion
2.1. UVC Photolysis
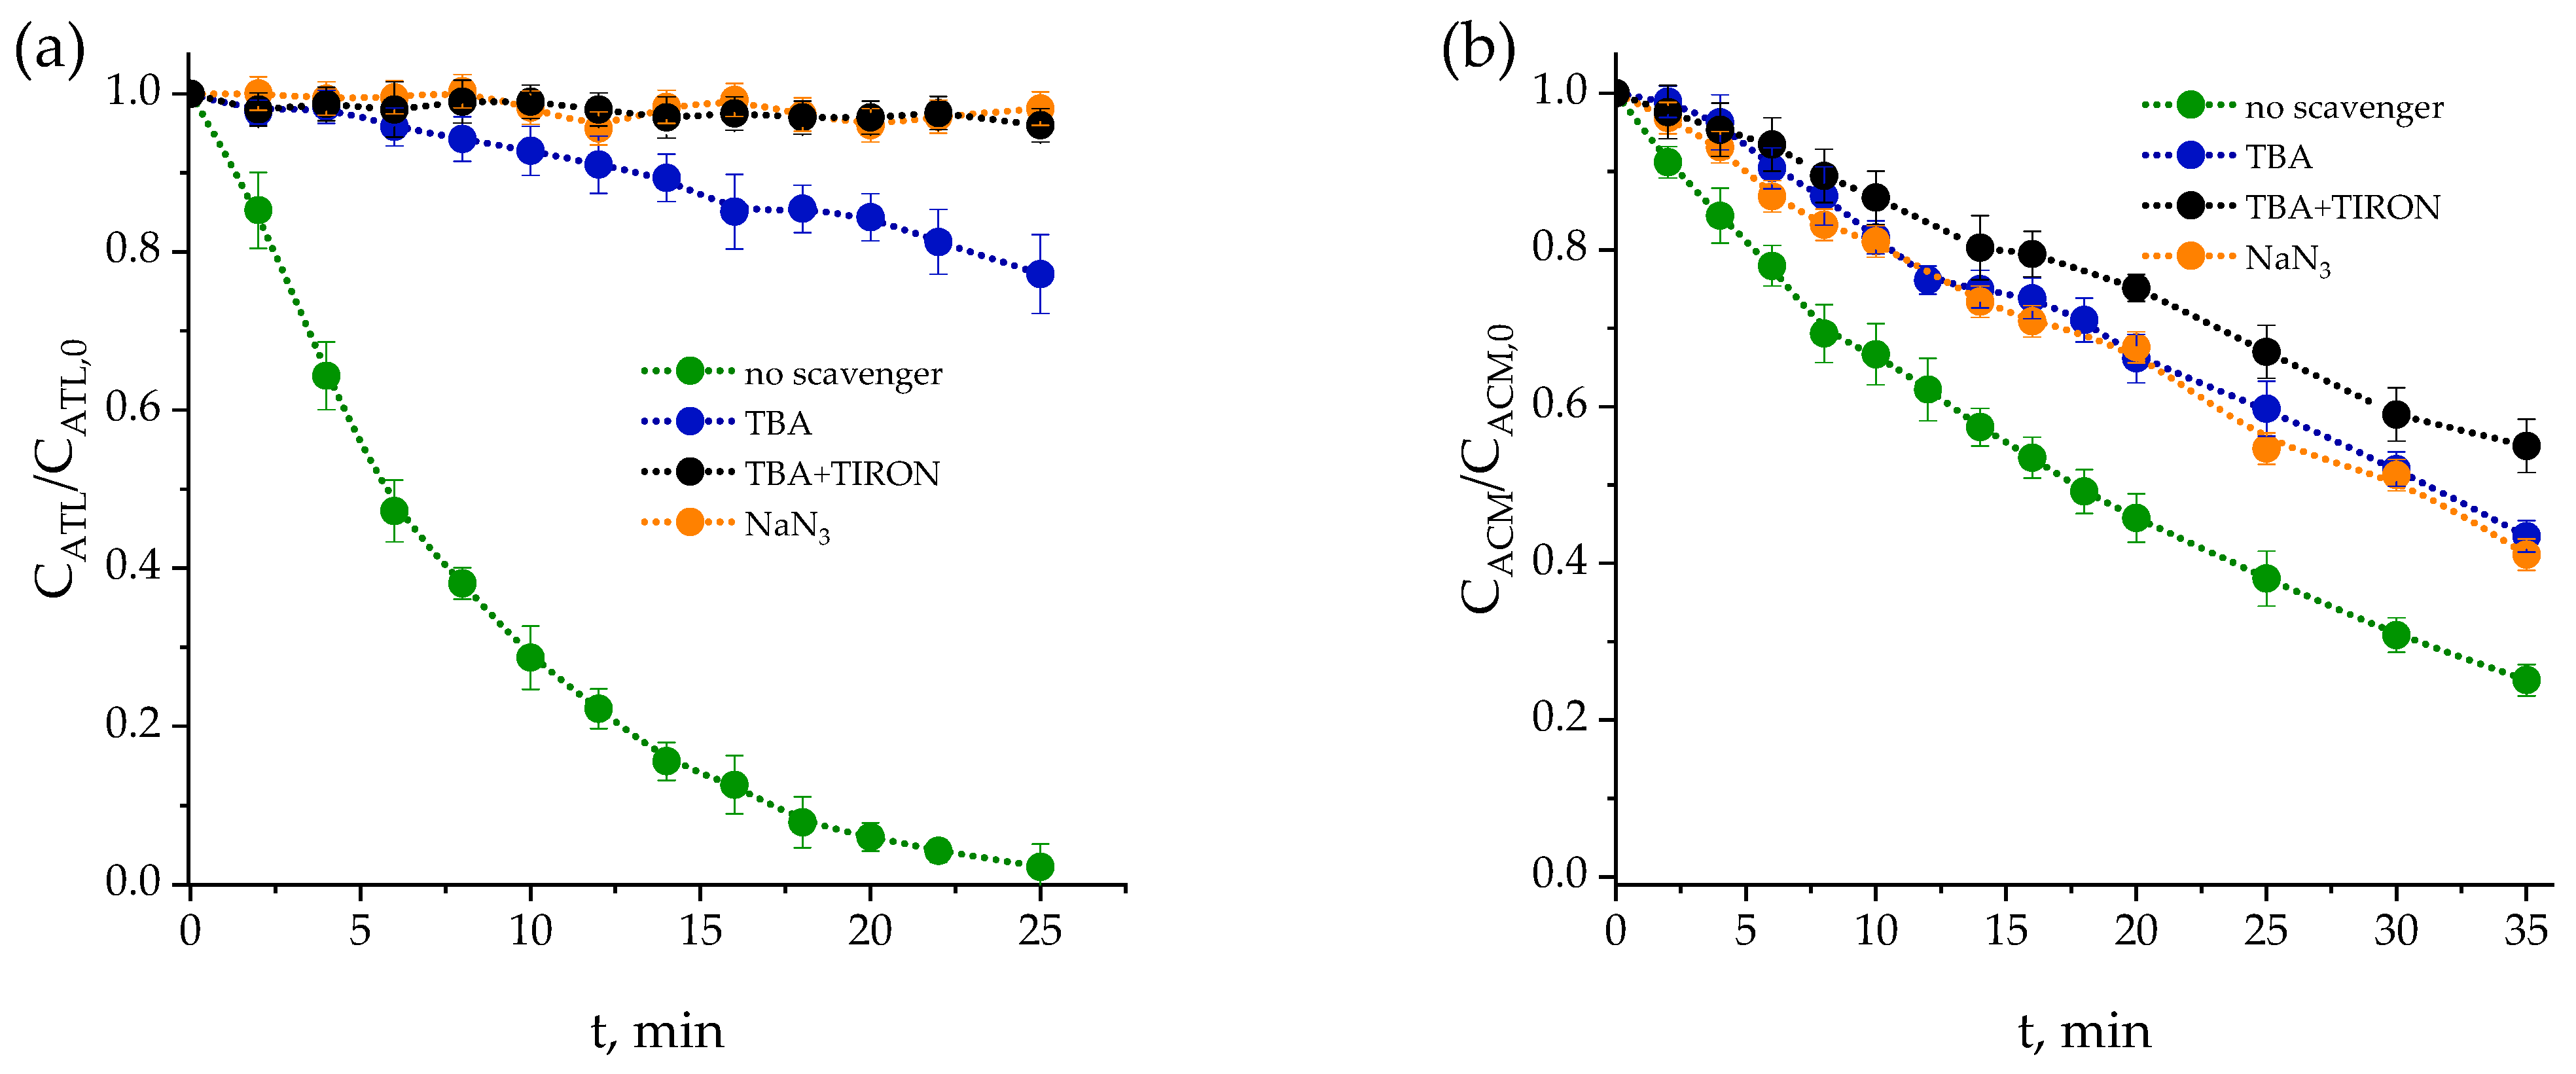
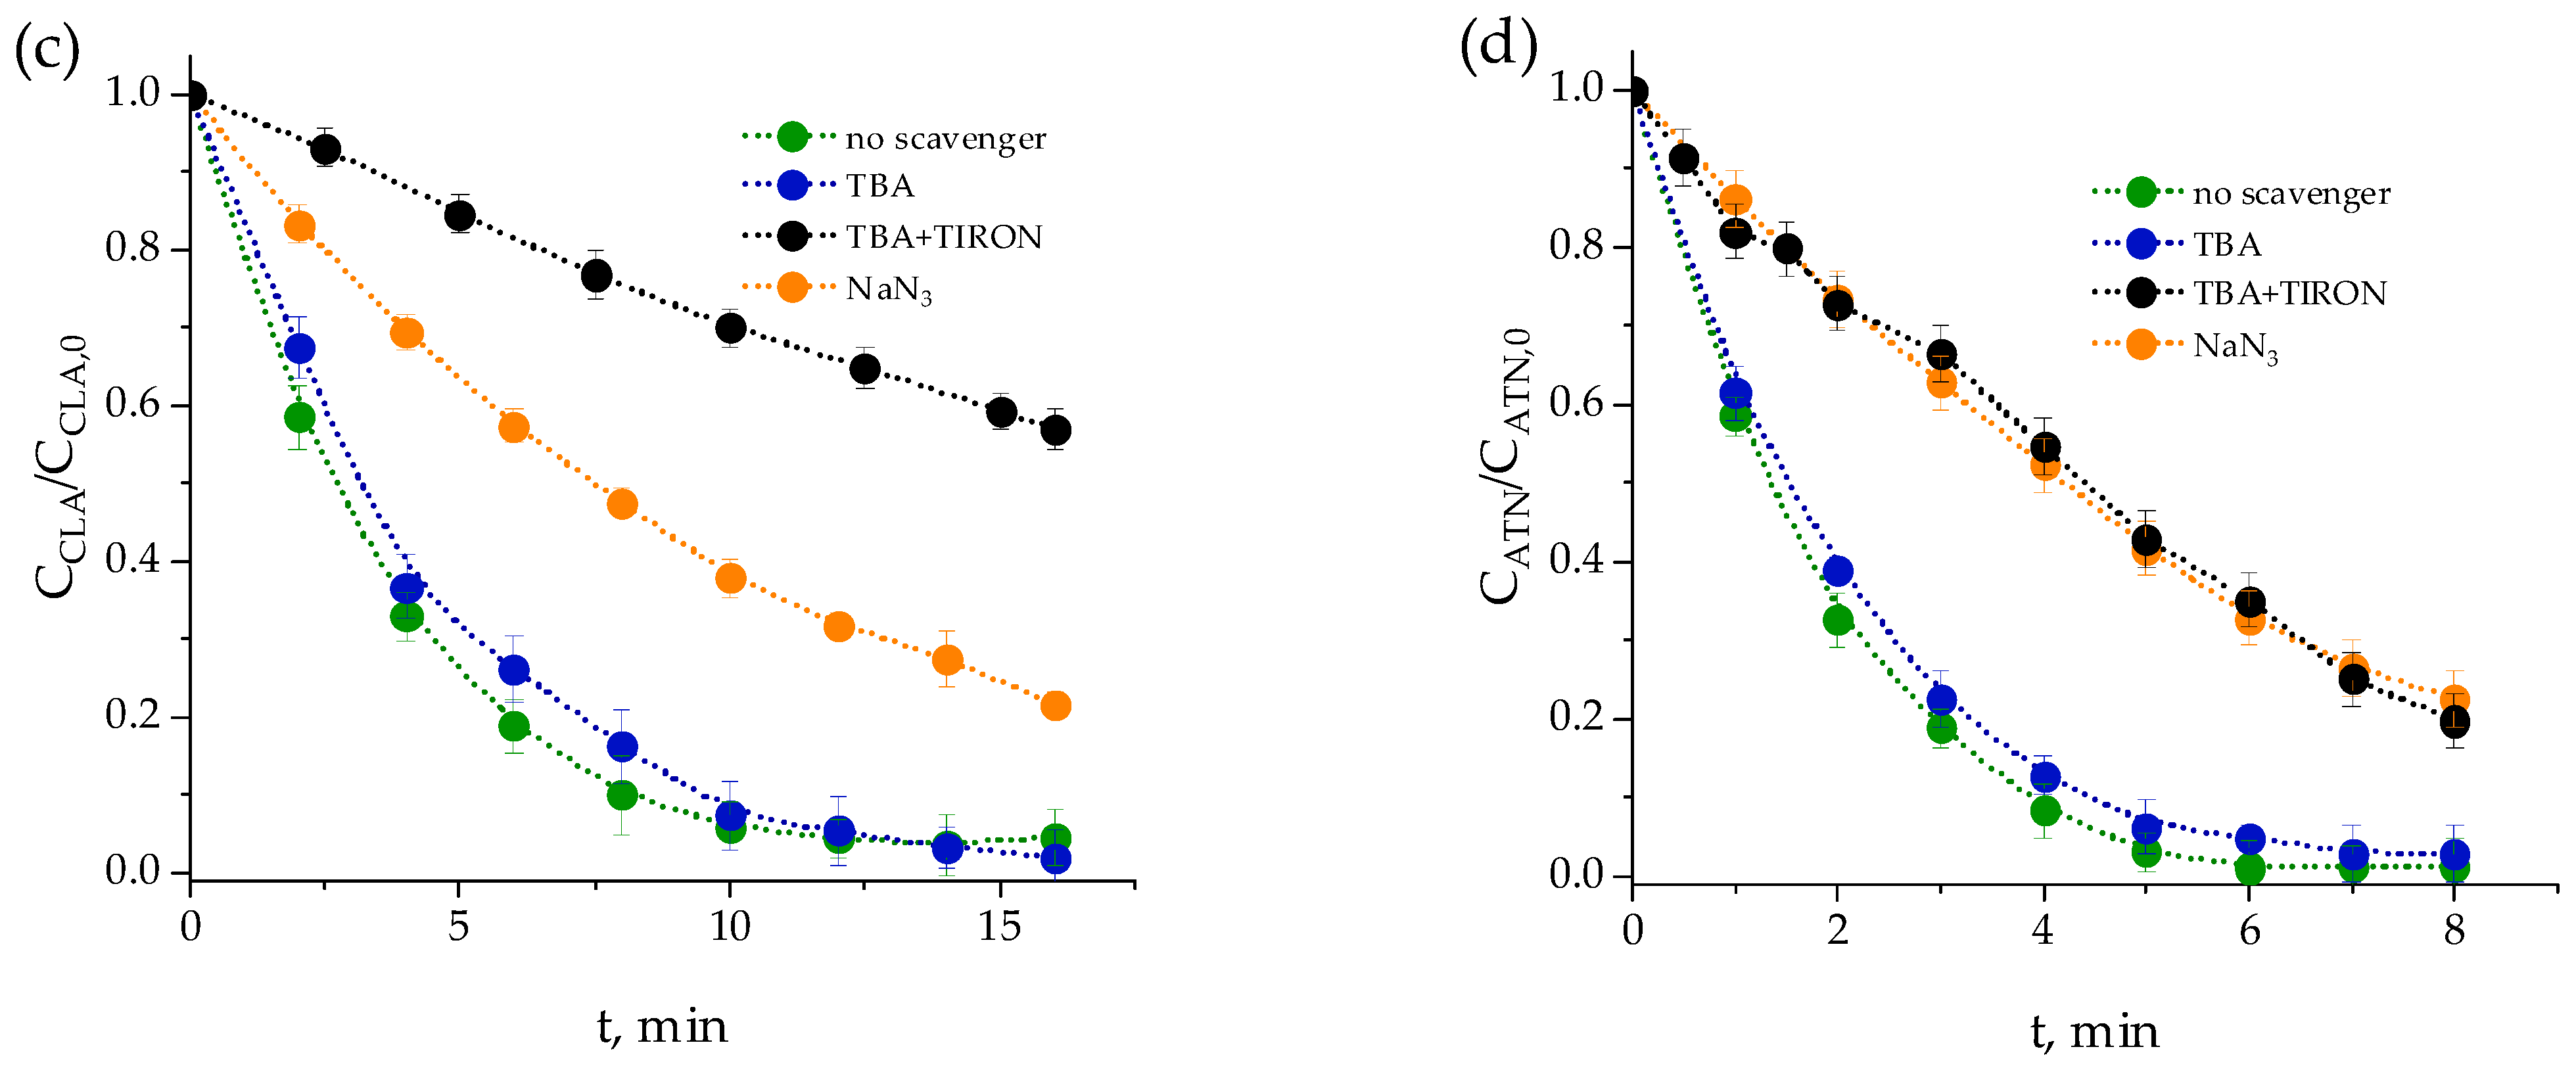
2.1.1. Effects of Scavengers
2.1.2. Comparison with Photolysis Results from Literature
2.1.3. Apparent and Actual Direct Quantum Yields
2.1.4. Determination of the Reaction Rate Constant with Singlet Oxygen
2.2. UVC Photolysis in Effluent of Urban Wastewater
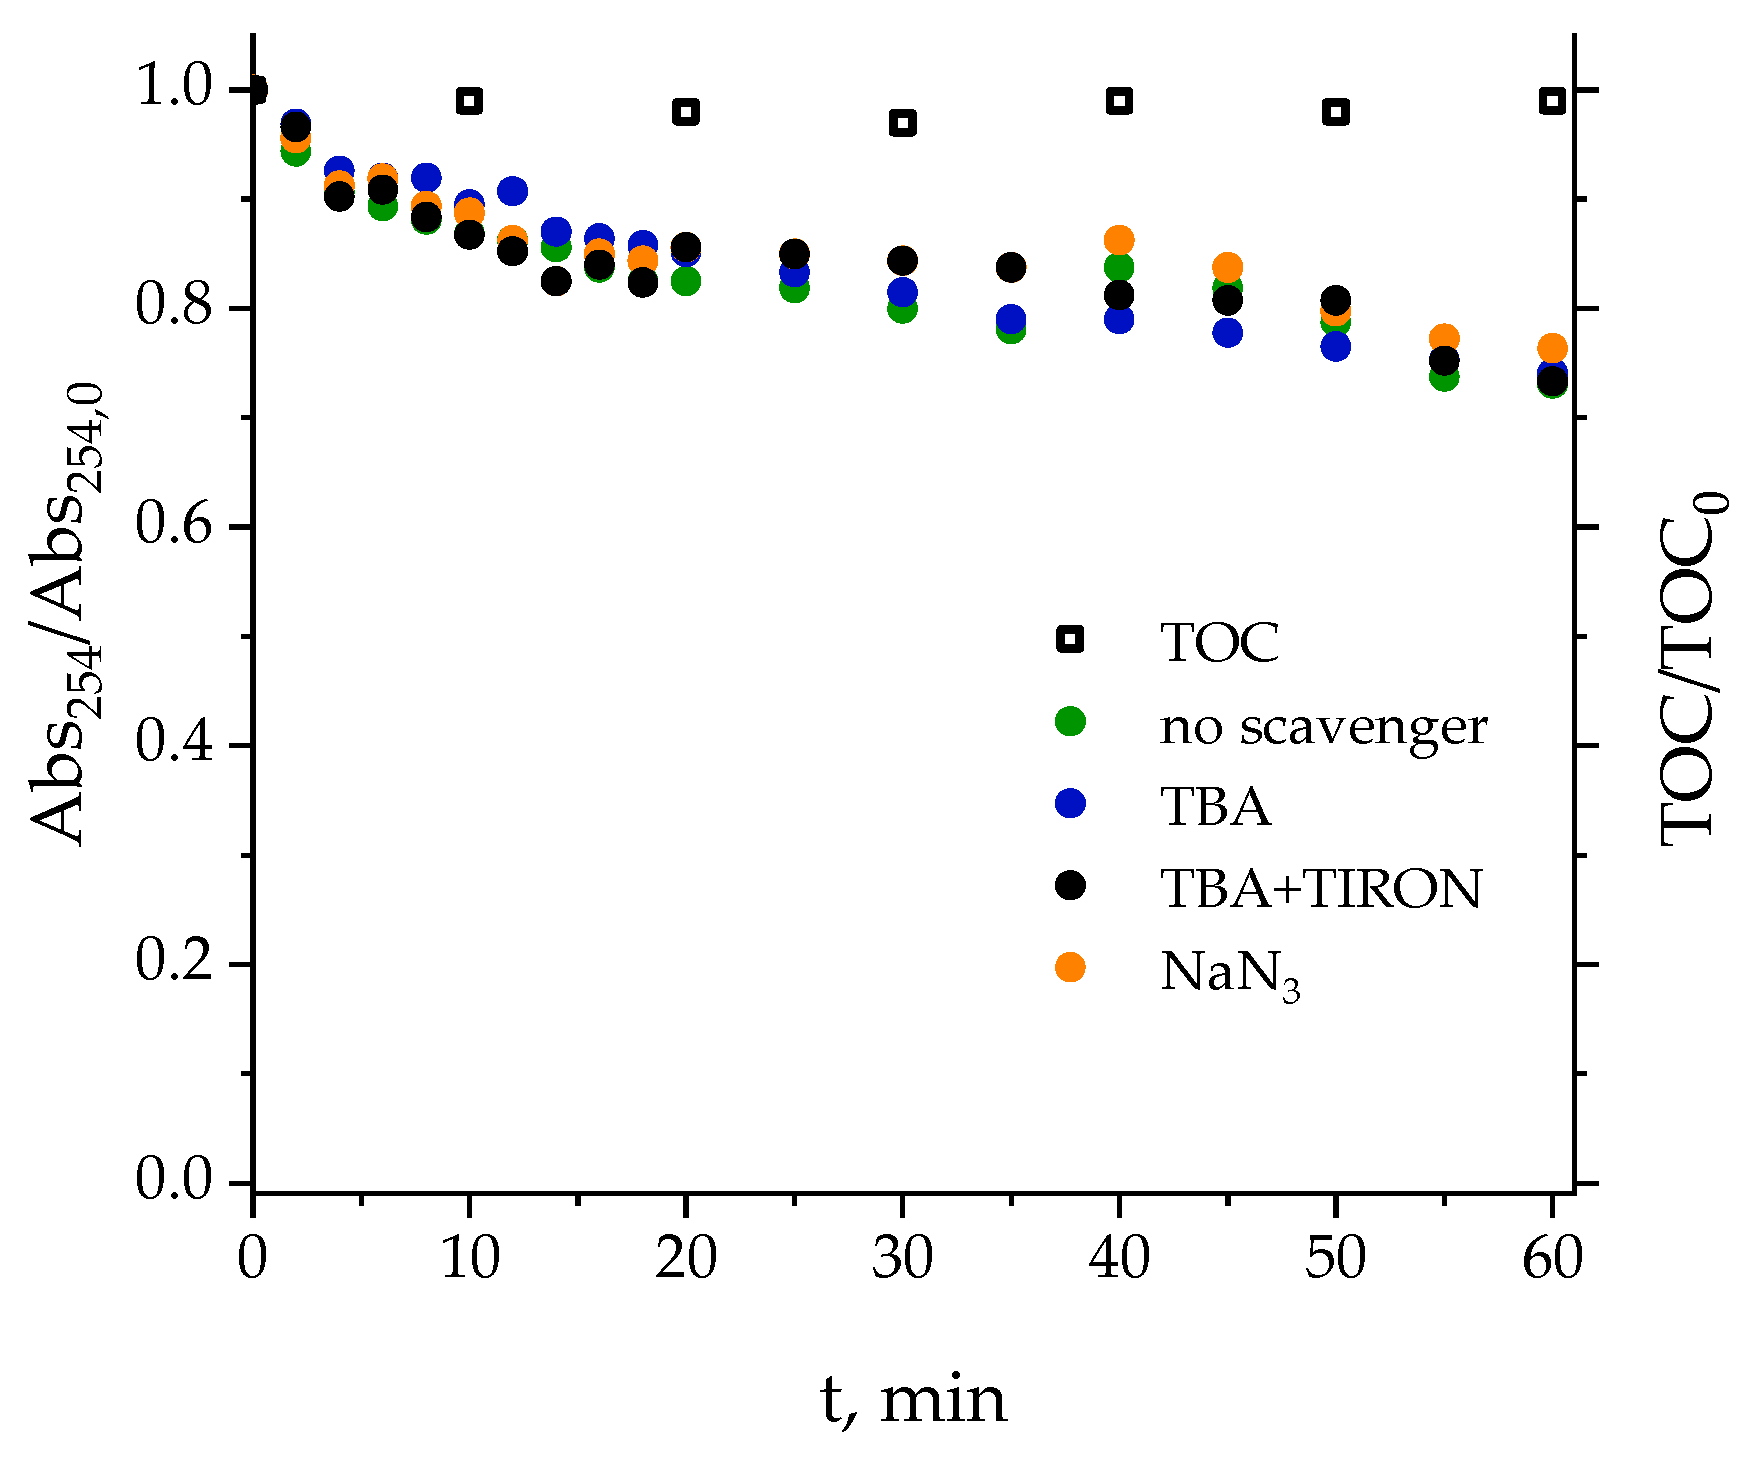
2.2.1. Determination of ROS Involved in the Photolysis of Secondary Effluent
2.2.2. Effect of the Aqueous Matrix on the Photolysis of Pharmaceuticals
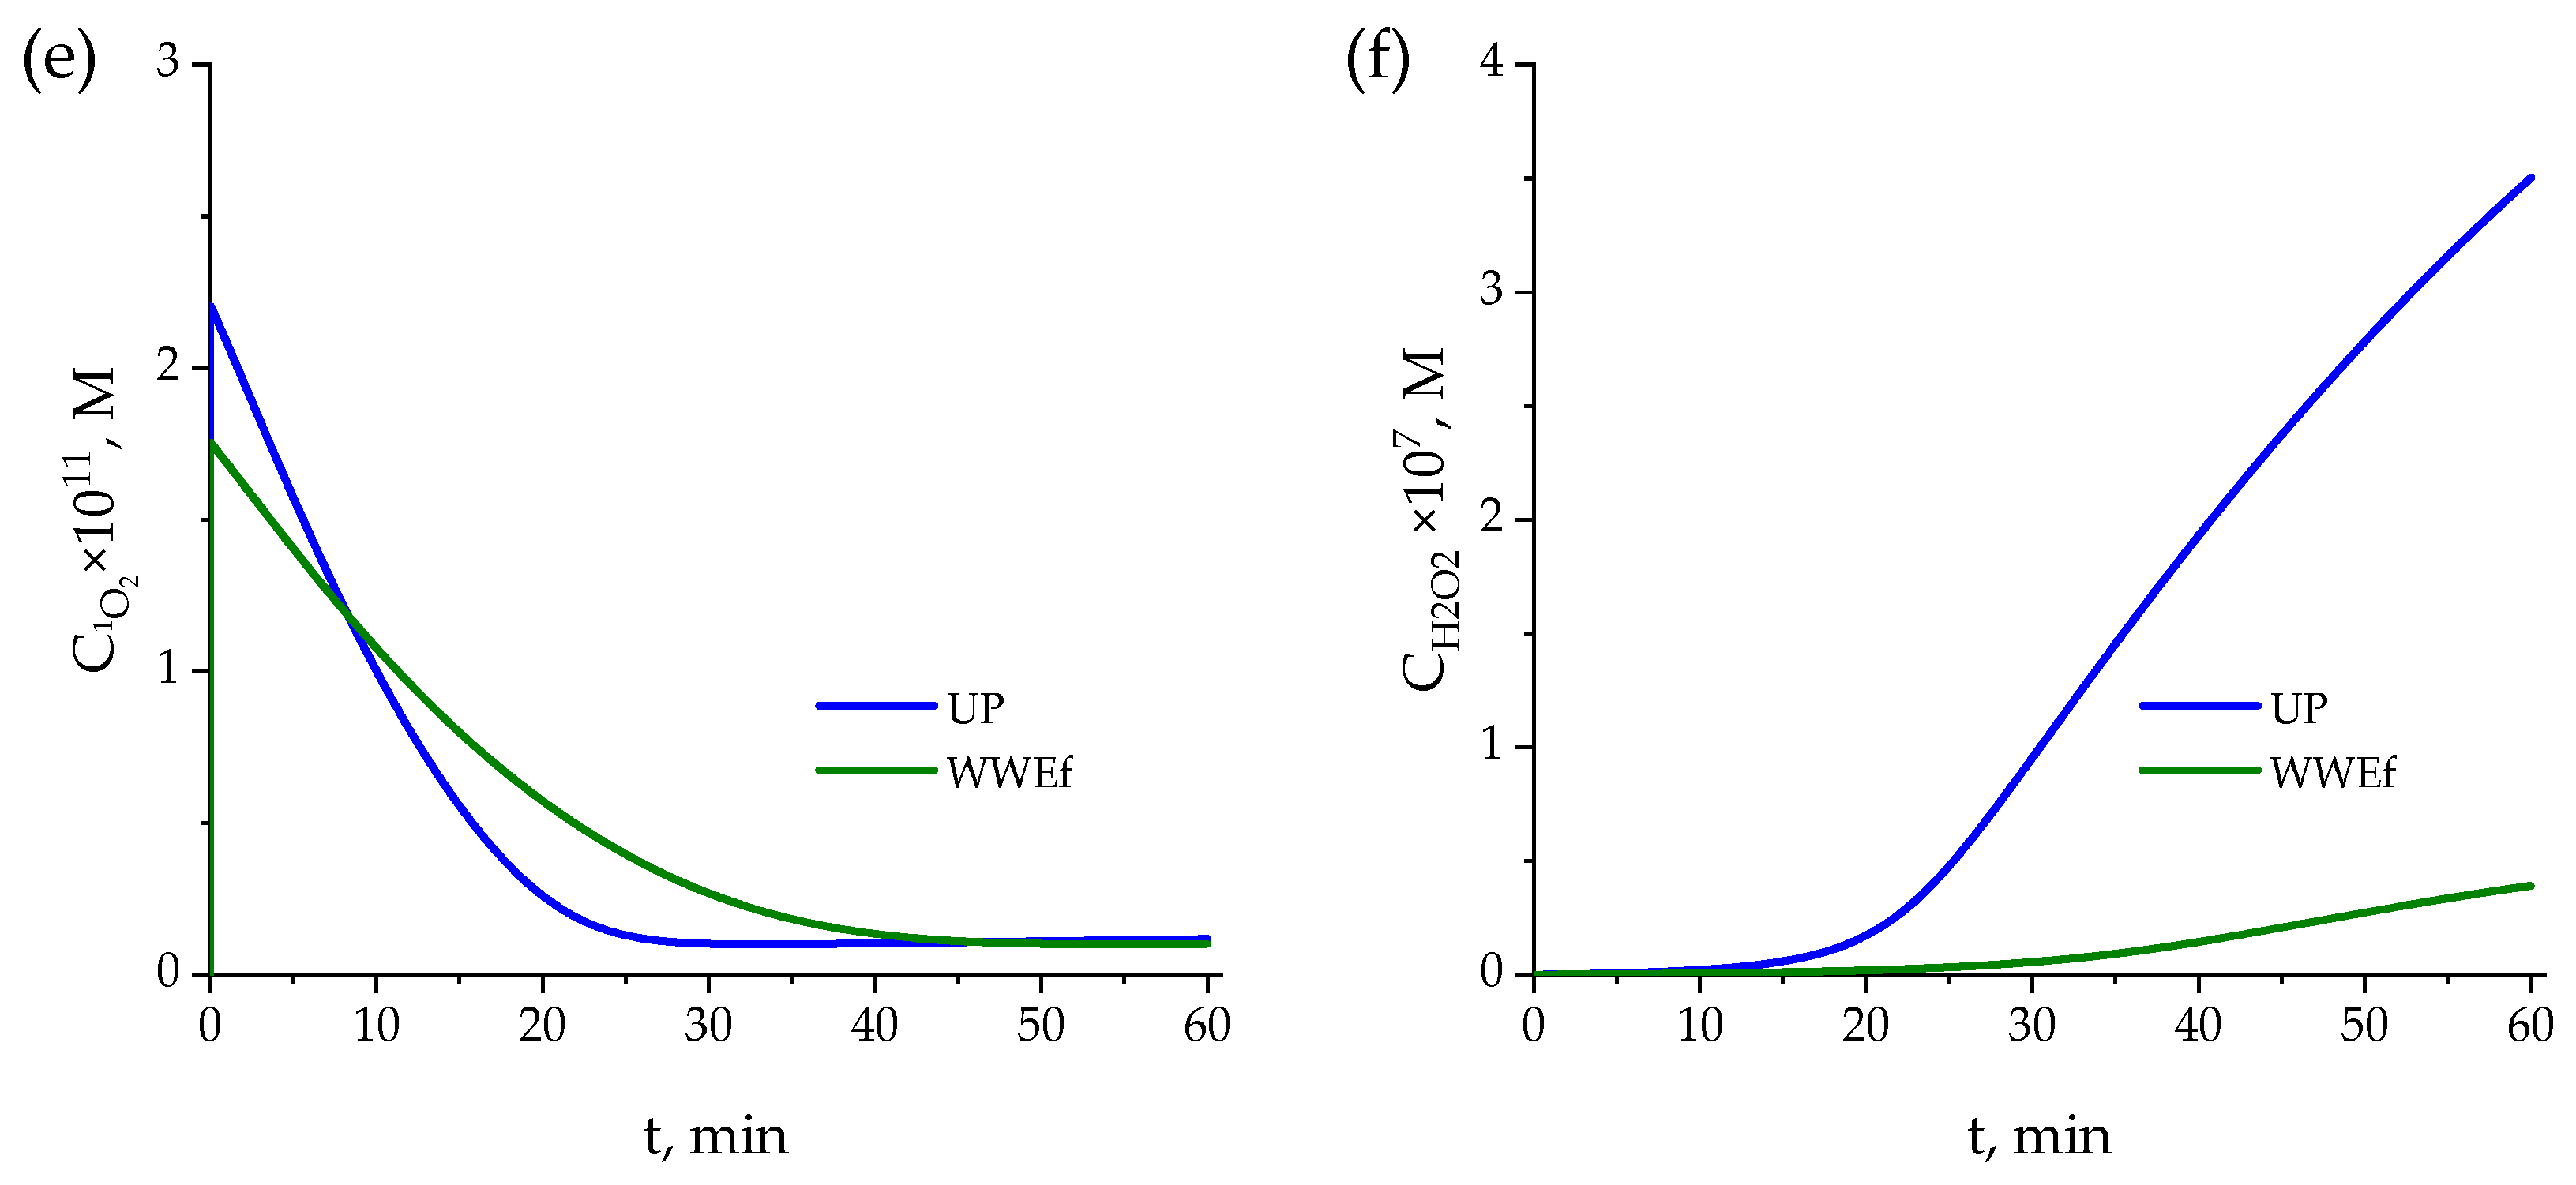
2.2.3. Kinetic Model of Photolysis
Ultrapure Water
- (a)
- For any pharmaceutical, the reaction rate comprises four contributions: direct photolysis and reactions with HO●, O2●−, and 1O2:where [56]:here, ϕi represents the quantum yield of species i, and eia its volumetric photon absorption rate, kHO·i, kO2·−ii and k1O2i denote the rate constants for reactions with HO●, O2●−, and 1O2, respectively, and CHO·, CO2·−, and C1O2 represent the concentrations of these reactive oxygen species.
- (b)
- For hydrogen peroxide, the net reaction rate is given by the following:where,with ϕH and εH as the quantum yield and absorptivity coefficient of hydrogen peroxide at 254 nm, respectively.
- (c)
- For the hydroxyl radical:where,
- (d)
- For the superoxide ion radical:
- (e)
- For singlet oxygen:
Secondary Effluent Water
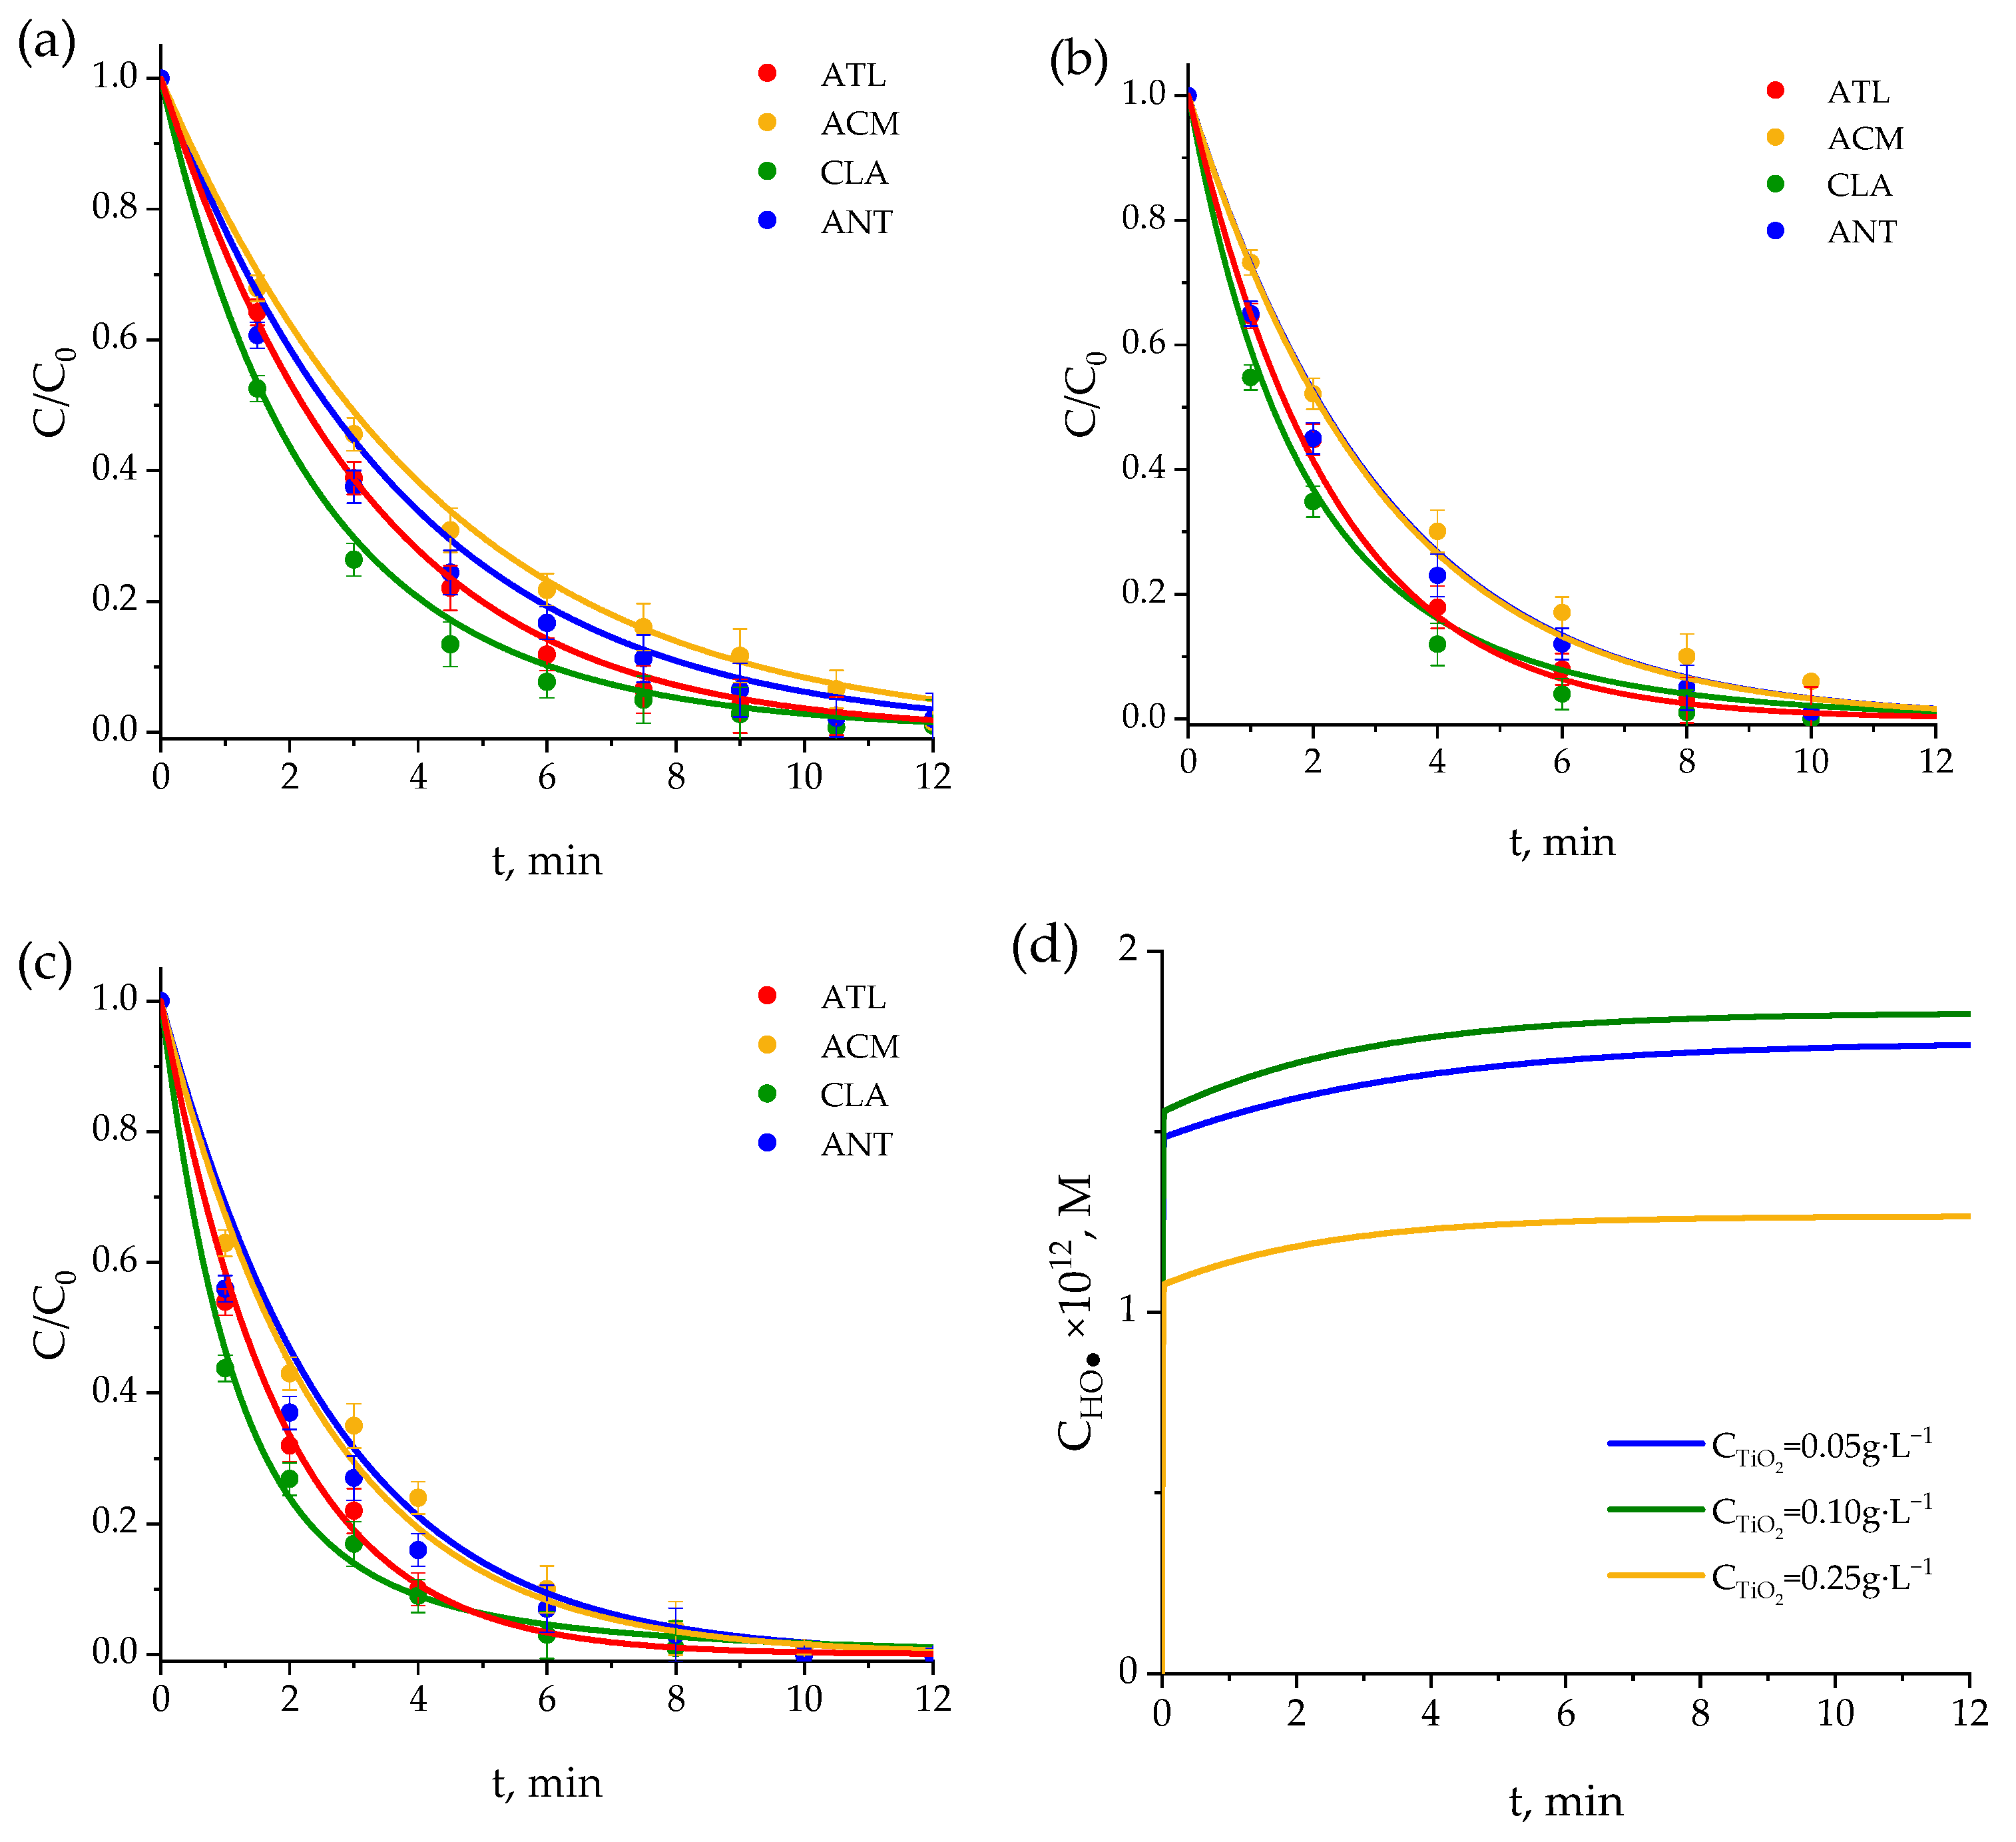
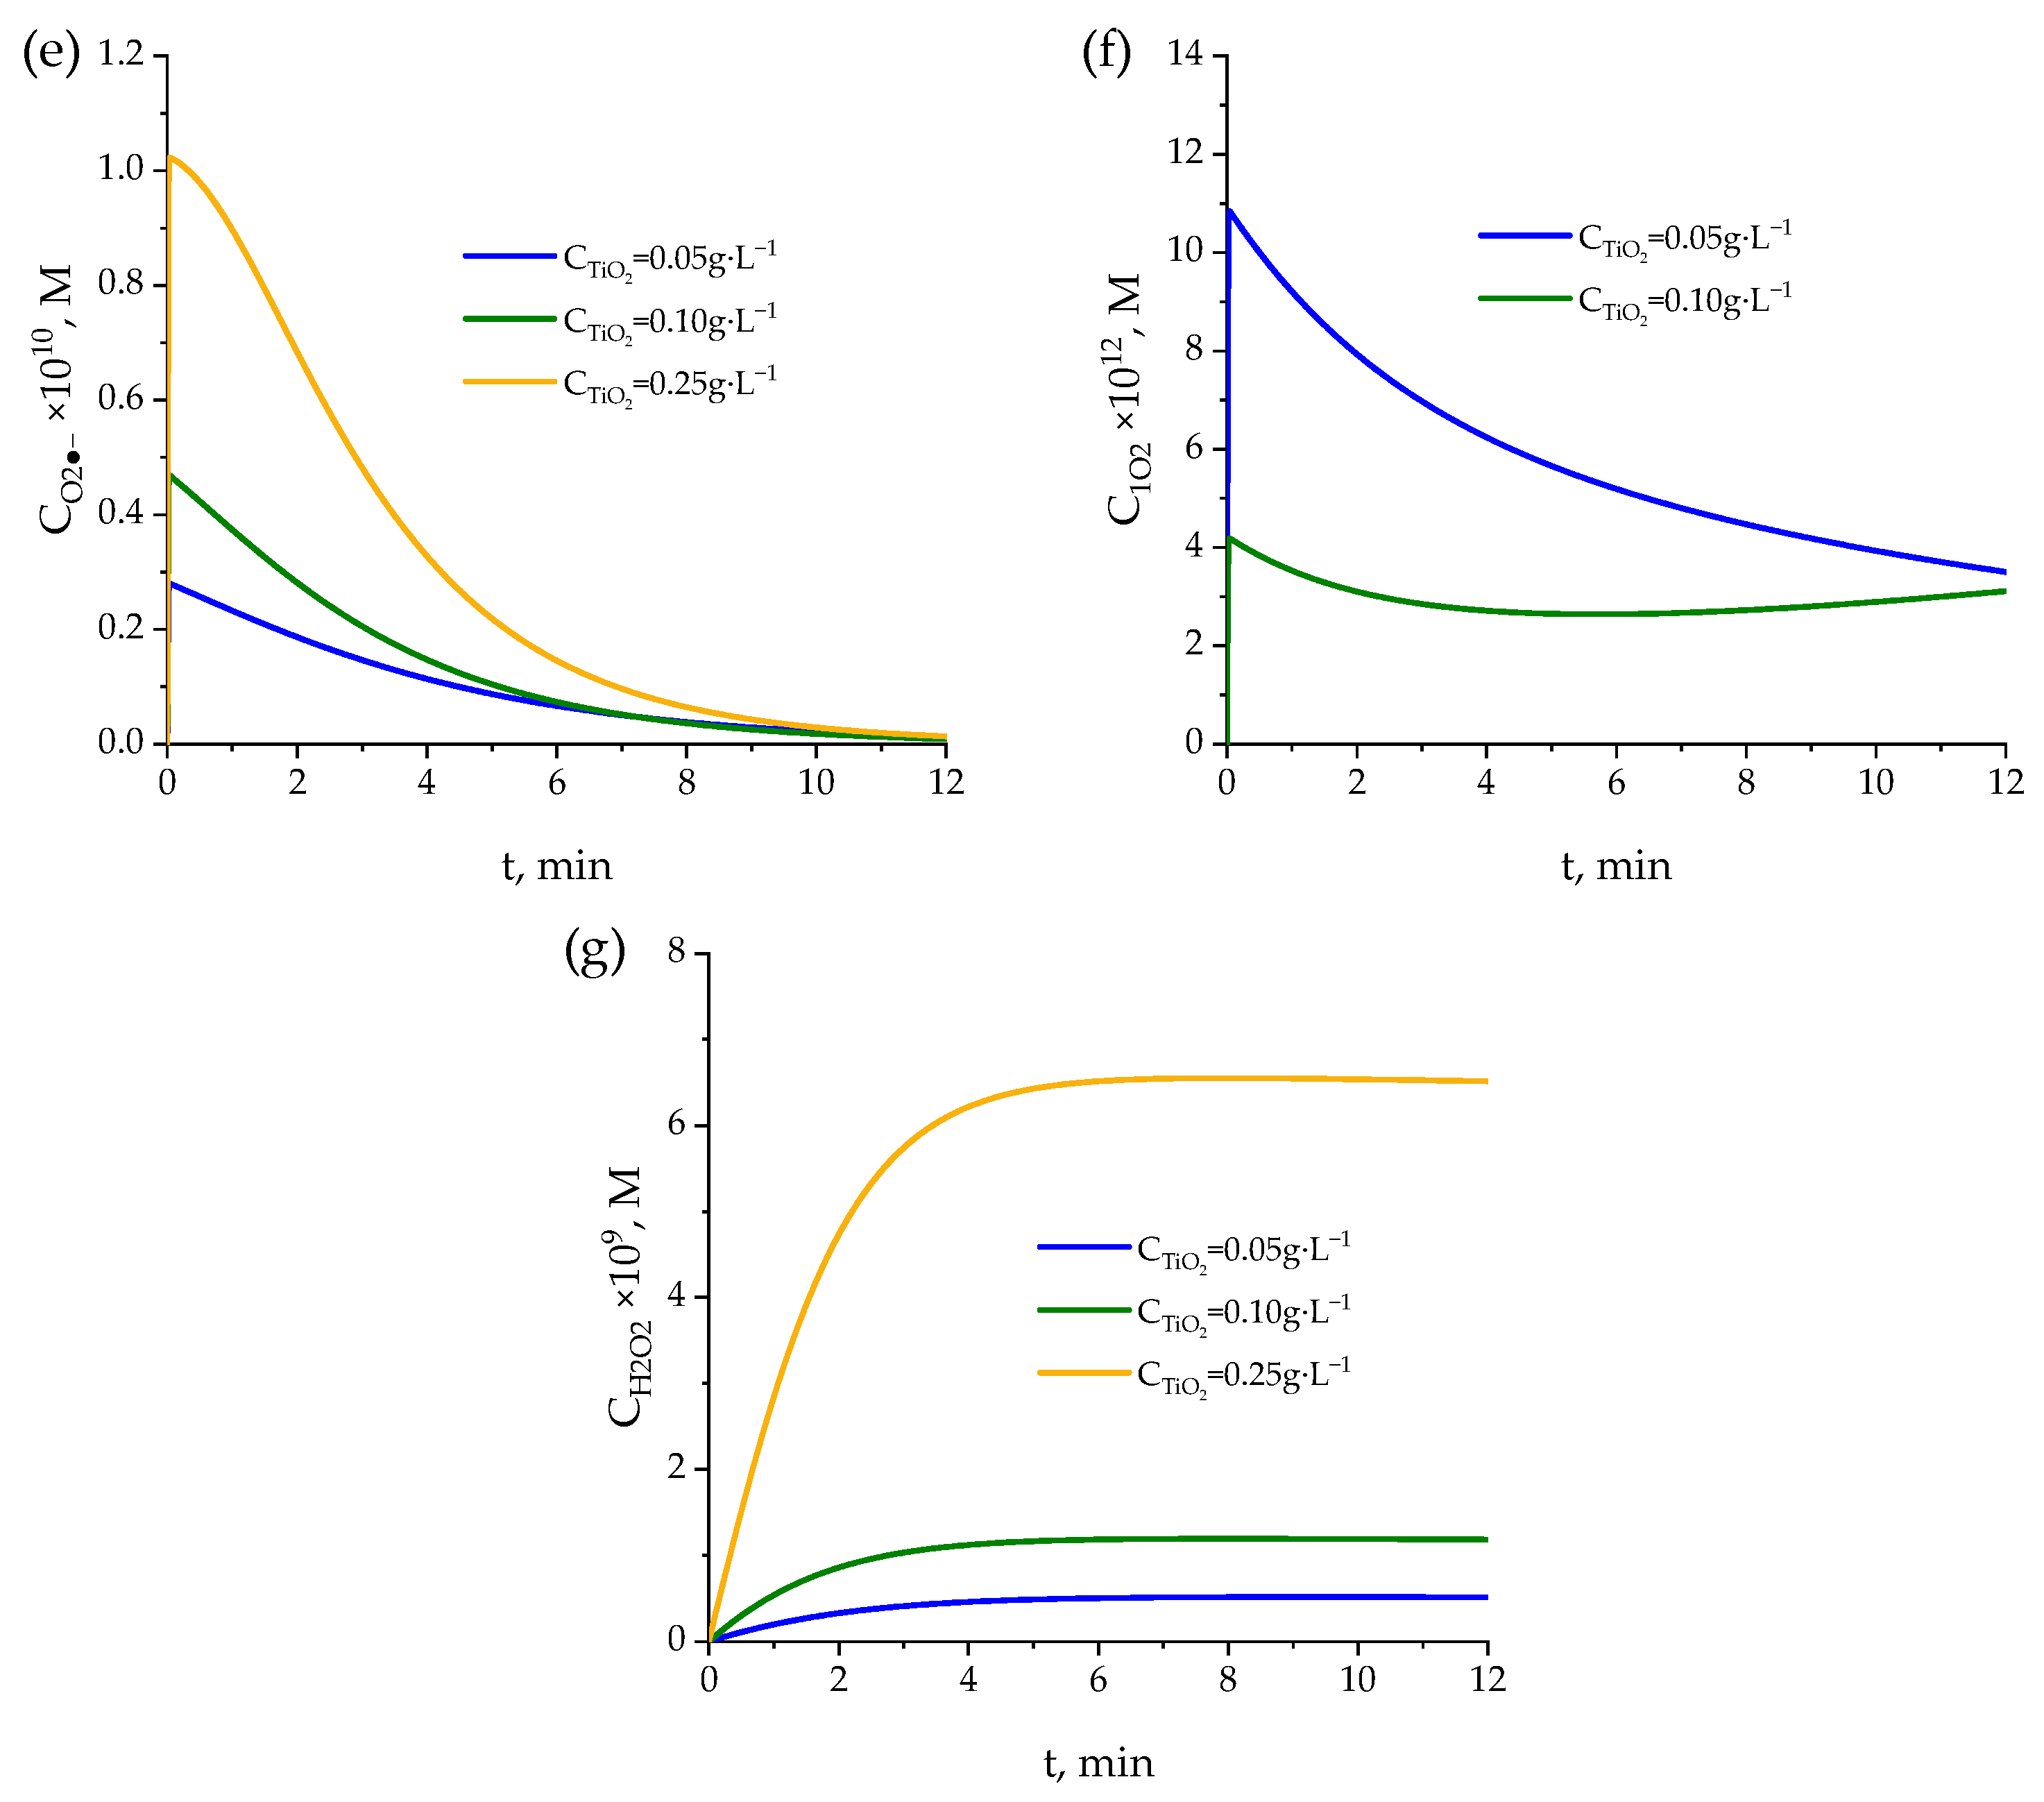
2.3. UVC TiO2 Photocatalysis
2.3.1. Comparison with Photocatalytic Results from Literature
2.3.2. Mechanism and Kinetic Model
- (a)
- For the balance of pharmaceuticals (Equation (24)):where kHOMs and CHOs are the rate constants of the reaction between any pharmaceutical M and adsorbed hydroxyl radicals and the concentration of the latter, respectively. However, adsorbed hydroxyl radicals are in equilibrium with hydroxyl radicals in solutions, that is, CHOs = KHO· CHO· [76], so that Equation (47) can be expressed as follows:with kHOs-M = kHO-M KHO·, the latter being the equilibrium constant [76].Initial values of kHOs-M for the photocatalytic kinetic model at TiO2 concentration of 0.1 g·L−1 were adopted from previous work [76] and initially considering the proportionality with TiO2 concentration for other catalyst concentrations. Table S3 shows the final optimized values of kHOs-M applied in the kinetic model. A proportional relationship between kHOs-M and catalyst concentration was ultimately observed. For instance, with some exception, kHOs-M values for 0.1 g·L−1 TiO2 concentration are twice the values for a 0.05 g·L−1 TiO2 concentration, and the corresponding proportionality was found for 0.25 g·L−1 catalyst concentration. Something similar was applied in the case of reactions of pharmaceuticals with adsorbed superoxide ion radical. Nevertheless, the contribution of these reactions was found to be negligible, so that only the superoxide ion radical reactions in solution, as in the photolysis kinetic model, were considered.
- (b)
- For the balance of hydroxyl radicals:where Ch+ and Ce− are the concentrations of holes and electrons, which are considered equal [78] and expressed as follows:wherewith k1s being a function of the rate constant of reaction (42), equilibrium constant between adsorbed and non-adsorbed hydroxyl radicals and catalyst concentration [76] and r0 is the TiO2 photon absorption rate calculated by solving the radiative transfer balance using the Six Flux Model (SFM) [79] (see Table S3 for r0 values). It has to be noted that for 0.25 g·L−1 catalyst concentration, the r0 value obtained from SFM was higher than the incident intensity of radiation, so this latter rate was taken as the photon absorption rate for this catalyst concentration. Therefore, at this catalyst concentration, the direct photolysis rate of pharmaceuticals, hydrogen peroxide, and WWEf was not included in the kinetic model. As a result, the participation of singlet oxygen was not considered either.
- (c)
- For the balance of total hydrogen peroxide:
- (d)
2.4. Importance of End Radical Reactions
3. Materials and Methods
3.1. Chemicals
3.2. Photochemical Experiments
3.3. Analytical Methods
4. Conclusions
Supplementary Materials
Author Contributions
Funding
Data Availability Statement
Acknowledgments
Conflicts of Interest
References
- Kanakaraju, D.; Glass, B.D.; Oelgemöller, M. Advanced Oxidation Process-Mediated Removal of Pharmaceuticals from Water: A Review. J. Environ. Manag. 2018, 219, 189–207. [Google Scholar] [CrossRef] [PubMed]
- Kumar, R.; Sarmah, A.K.; Padhye, L.P. Fate of Pharmaceuticals and Personal Care Products in a Wastewater Treatment Plant with Parallel Secondary Wastewater Treatment Train. J. Environ. Manag. 2019, 233, 649–659. [Google Scholar] [CrossRef]
- Peña-Guzmán, C.; Ulloa-Sánchez, S.; Mora, K.; Helena-Bustos, R.; Lopez-Barrera, E.; Alvarez, J.; Rodriguez-Pinzón, M. Emerging Pollutants in the Urban Water Cycle in Latin America: A Review of the Current Literature. J. Environ. Manag. 2019, 237, 408–423. [Google Scholar] [CrossRef]
- Rivera-Utrilla, J.; Sánchez-Polo, M.; Ferro-García, M.Á.; Prados-Joya, G.; Ocampo-Pérez, R. Pharmaceuticals as Emerging Contaminants and Their Removal from Water. A Review. Chemosphere 2013, 93, 1268–1287. [Google Scholar] [CrossRef] [PubMed]
- Dong, Z.; Senn, D.B.; Moran, R.E.; Shine, J.P. Prioritizing Environmental Risk of Prescription Pharmaceuticals. Regul. Toxicol. Pharmacol. 2013, 65, 60–67. [Google Scholar] [CrossRef] [PubMed]
- Oates, R.P.; Longley, G.; Hamlett, P.; Klein, D. Pharmaceutical and Endocrine Disruptor Compounds in Surface and Wastewater in San Marcos, Texas. Water Environ. Res. 2017, 89, 2021–2030. [Google Scholar] [CrossRef]
- Haro, N.K.; Del Vecchio, P.; Marcilio, N.R.; Féris, L.A. Removal of Atenolol by Adsorption—Study of Kinetics and Equilibrium. J. Clean Prod. 2017, 154, 214–219. [Google Scholar] [CrossRef]
- Papageorgiou, M.; Kosma, C.; Lambropoulou, D. Seasonal Occurrence, Removal, Mass Loading and Environmental Risk Assessment of 55 Pharmaceuticals and Personal Care Products in a Municipal Wastewater Treatment Plant in Central Greece. Sci. Total Environ. 2016, 543, 547–569. [Google Scholar] [CrossRef]
- Ulvi, A.; Aydın, S.; Aydın, M.E. Fate of Selected Pharmaceuticals in Hospital and Municipal Wastewater Effluent: Occurrence, Removal, and Environmental Risk Assessment. Environ. Sci. Pollut. Res. 2022, 29, 75609–75625. [Google Scholar] [CrossRef]
- Folarin, O.S.; Otitoloju, A.A.; Amaeze, N.H.; Saliu, J.K. Occurrence of Acetaminophen, Amoxicillin, Diclofenac and Methylparaben in Lagos and Ologe Lagoons, Lagos, Nigeria. J. Appl. Sci. Environ. Manag. 2019, 23, 2143–2149. [Google Scholar] [CrossRef]
- McLain, N.K.; Gomez, M.Y.; Gachomo, E.W. Acetaminophen Levels Found in Recycled Wastewater Alter Soil Microbial Community Structure and Functional Diversity. Microb. Ecol. 2023, 85, 1448–1462. [Google Scholar] [CrossRef]
- Ayman, Z.; Işik, M. Pharmaceutically Active Compounds in Water, Aksaray, Turkey. Clean 2015, 43, 1381–1388. [Google Scholar] [CrossRef]
- Pozdnyakov, I.P.; Zhang, X.; Maksimova, T.A.; Yanshole, V.V.; Wu, F.; Grivin, V.P.; Plyusnin, V.F. Wavelength-Dependent Photochemistry of Acetaminophen in Aqueous Solutions. J. Photochem. Photobiol. A Chem. 2014, 274, 117–123. [Google Scholar] [CrossRef]
- Roveri, V.; Guimarães, L.L.; Toma, W.; Correia, A.T. Occurrence, Ecological Risk Assessment and Prioritization of Pharmaceuticals and Abuse Drugs in Estuarine Waters along the São Paulo Coast, Brazil. Environ. Sci. Pollut. Res. 2022, 29, 89712–89726. [Google Scholar] [CrossRef] [PubMed]
- Cai, M.; Zhang, L.; Qi, F.; Feng, L. Influencing Factors and Degradation Products of Antipyrine Chlorination in Water with Free Chlorine. J. Environ. Sci. 2013, 25, 77–84. [Google Scholar] [CrossRef]
- Gomes, I.B.; Simões, L.C.; Simões, M. The Effects of Emerging Environmental Contaminants on Stenotrophomonas Maltophilia Isolated from Drinking Water in Planktonic and Sessile States. Sci. Total Environ. 2018, 643, 1348–1356. [Google Scholar] [CrossRef]
- Benotti, M.J.; Trenholm, R.A.; Vanderford, B.J.; Holady, J.C.; Stanford, B.D.; Snyder, S.A. Pharmaceuticals and Endocrine Disrupting Compounds in U.S. Drinking Water. Environ. Sci. Technol. 2009, 43, 597–603. [Google Scholar] [CrossRef]
- Lu, J.; Huang, Q.; Mao, L. Removal of Acetaminophen Using Enzyme-Mediated Oxidative Coupling Processes: I. Reaction Rates and Pathways. Environ. Sci. Technol. 2009, 43, 7062–7067. [Google Scholar] [CrossRef]
- Hwang, J.I.; Li, Z.; Andreacchio, N.; Ordonez Hinz, F.; Wilson, P.C. Potential Use of Floating Treatment Wetlands Established with Canna Flaccida for Removing Organic Contaminants from Surface Water. Int. J. Phytoremediat. 2020, 22, 1304–1312. [Google Scholar] [CrossRef]
- Qutob, M.; Hussein, M.A.; Alamry, K.A.; Rafatullah, M. A Review on the Degradation of Acetaminophen by Advanced Oxidation Process: Pathway, by-Products, Biotoxicity, and Density Functional Theory Calculation. RSC Adv. 2022, 12, 18373–18396. [Google Scholar] [CrossRef]
- Quesada, H.B.; Cusioli, L.F.; de O Bezerra, C.; Baptista, A.T.A.; Nishi, L.; Gomes, R.G.; Bergamasco, R. Acetaminophen Adsorption Using a Low-Cost Adsorbent Prepared from Modified Residues of Moringa Oleifera Lam. Seed Husks. J. Chem. Technol. Biotechnol. 2019, 94, 3147–3157. [Google Scholar] [CrossRef]
- Feng, S.; Zhang, X.; Liu, Y. New Insights into the Primary Phototransformation of Acetaminophen by UV/H2O2: Photo-Fries Rearrangement versus Hydroxyl Radical Induced Hydroxylation. Water Res. 2015, 86, 35–45. [Google Scholar] [CrossRef] [PubMed]
- Rivas, J.; Gimeno, O.; Borralho, T.; Sagasti, J. UV-C and UV-C/Peroxide Elimination of Selected Pharmaceuticals in Secondary Effluents. Desalination 2011, 279, 115–120. [Google Scholar] [CrossRef]
- Ioannou, L.A.; Hapeshi, E.; Vasquez, M.I.; Mantzavinos, D.; Fatta-Kassinos, D. Solar/TiO2 Photocatalytic Decomposition of β-Blockers Atenolol and Propranolol in Water and Wastewater. Sol. Energy 2011, 85, 1915–1926. [Google Scholar] [CrossRef]
- Salgado, R.; Pereira, V.J.; Carvalho, G.; Soeiro, R.; Gaffney, V.; Almeida, C.; Cardoso, V.V.; Ferreira, E.; Benoliel, M.J.; Ternes, T.A.; et al. Photodegradation Kinetics and Transformation Products of Ketoprofen, Diclofenac and Atenolol in Pure Water and Treated Wastewater. J. Hazard. Mater. 2013, 244–245, 516–527. [Google Scholar] [CrossRef] [PubMed]
- Su, C.C.; Bellotindos, L.M.; Chang, A.T.; Lu, M.C. Degradation of Acetaminophen in an Aerated Fenton Reactor. J. Taiwan Inst. Chem. Eng. 2013, 44, 310–316. [Google Scholar] [CrossRef]
- Dewil, R.; Mantzavinos, D.; Poulios, I.; Rodrigo, M.A. New Perspectives for Advanced Oxidation Processes. J. Environ. Manag. 2017, 195, 93–99. [Google Scholar] [CrossRef]
- Parsons, S. Advanced Oxidation Processes for Water and Wastewater Treatment. Water Intell. Online 2005, 4, 9781780403076. [Google Scholar] [CrossRef]
- Xiao, R.; Wei, Z.; Chen, D.; Weavers, L.K. Kinetics and Mechanism of Sonochemical Degradation of Pharmaceuticals in Municipal Wastewater. Environ. Sci. Technol. 2014, 48, 9675–9683. [Google Scholar] [CrossRef]
- Tang, Y.; Li, X.M.; Xu, Z.C.; Guo, Q.W.; Hong, C.Y.; Bing, Y.X. Removal of Naproxen and Bezafibrate by Activated Sludge under Aerobic Conditions: Kinetics and Effect of Substrates. Biotechnol. Appl. Biochem. 2014, 61, 333–341. [Google Scholar] [CrossRef]
- Moreno, A.d.H.; Salgado, H.R.N. Stability Study and Degradation Kinetics of Ceftazidime in Pharmaceutical Preparations. Adv. Anal. Chem. 2012, 2, 1–5. [Google Scholar] [CrossRef]
- Tazesh, S.; Tamizi, E.; Siahi Shadbad, M.; Mostaghimi, N.; Monajjemzadeh, F. Comparative Stability of Two Anti-Hyperpigmentation Agents: Kojic Acid as a Natural Metabolite and Its Di-Palmitate Ester, Under Oxidative Stress; Application to Pharmaceutical Formulation Design. Adv. Pharm. Bull. 2022, 12, 329–335. [Google Scholar] [CrossRef] [PubMed]
- Bhangare, D.; Rajput, N.; Jadav, T.; Sahu, A.K.; Tekade, R.K.; Sengupta, P. Systematic Strategies for Degradation Kinetic Study of Pharmaceuticals: An Issue of Utmost Importance Concerning Current Stability Analysis Practices. J. Anal. Sci. Technol. 2022, 13, 1–13. [Google Scholar] [CrossRef]
- Wang, C.; Xiong, M.C.; Zhao, X.; Liu, K.H. Kinetics Study on Reaction of Atenolol with Singlet Oxygen by Directly Monitoring the 1O2 Phosphorescence. Chin. J. Chem. Phys. 2021, 34, 406–412. [Google Scholar] [CrossRef]
- Chen, P.; Wang, F.; Zhang, Q.; Su, Y.; Shen, L.; Yao, K.; Chen, Z.F.; Liu, Y.; Cai, Z.; Lv, W.; et al. Photocatalytic Degradation of Clofibric Acid by G-C3N4/P25 Composites under Simulated Sunlight Irradiation: The Significant Effects of Reactive Species. Chemosphere 2017, 172, 193–200. [Google Scholar] [CrossRef]
- Zhang, X.; Liu, Z.; Kong, Q.; Liu, G.; Lv, W.; Li, F.; Lin, X. Aquatic Photodegradation of Clofibric Acid under Simulated Sunlight Irradiation: Kinetics and Mechanism Analysis. RSC Adv. 2018, 8, 27796–27804. [Google Scholar] [CrossRef] [PubMed]
- Bielski, B.H.J.; Cabelli, D.E.; Arudi, R.L.; Ross, A.B. Reactivity of HO2/O−2 Radicals in Aqueous Solution. J. Phys. Chem. Ref. Data 1985, 14, 1041–1100. [Google Scholar] [CrossRef]
- Wang, J.; Zhang, X.; Fan, L.; Su, L.; Zhao, Y. Photolysis Mechanism of Eleven Insecticides under Simulated Sunlight Irradiation: Kinetics, Pathway and QSAR. Chemosphere 2023, 334, 138968. [Google Scholar] [CrossRef]
- Rodríguez, E.M.; Márquez, G.; Tena, M.; Álvarez, P.M.; Beltrán, F.J. Determination of Main Species Involved in the First Steps of TiO2 Photocatalytic Degradation of Organics with the Use of Scavengers: The Case of Ofloxacin. Appl. Catal. B 2015, 178, 44–53. [Google Scholar] [CrossRef]
- Beltrán, F.J.; Chávez, A.M.; Jiménez-López, M.A.; Álvarez, P.M. Kinetic Modelling of UVC and UVC/H2O2 Oxidation of an Aqueous Mixture of Antibiotics in a Completely Mixed Batch Photoreactor. Environ. Sci. Pollut. Res. 2024, 31, 55222–55238. [Google Scholar] [CrossRef]
- Wang, L.; Xiao, K.; Zhao, H. The Debatable Role of Singlet Oxygen in Persulfate-Based Advanced Oxidation Processes. Water Res. 2023, 235, 119925. [Google Scholar] [CrossRef]
- Nidheesh, P.V.; Boczkaj, G.; Ganiyu, S.O.; Oladipo, A.A.; Fedorov, K.; Xiao, R.; Dionysiou, D.D. Generation, Properties, and Applications of Singlet Oxygen for Wastewater Treatment: A Review. Environ. Chem. Lett. 2025, 23, 195–240. [Google Scholar] [CrossRef]
- Katsumata, C.P.; Parizi, M.P.S.; Lastre-Acosta, A.M.; Teixeira, A.C.S.C. Low Pressure UV Photolysis of the Pharmaceutical Compounds Acetaminophen, Atenolol, Bezafibrate, Diclofenac and Ibuprofen. Water 2022, 14, 3165. [Google Scholar] [CrossRef]
- Li, W.; Lu, S.; Qiu, Z.; Lin, K. Clofibric Acid Degradation in UV254/H2O2 Process: Effect of Temperature. J. Hazard. Mater. 2010, 176, 1051–1057. [Google Scholar] [CrossRef]
- Tan, C.; Gao, N.; Deng, Y.; Zhang, Y.; Sui, M.; Deng, J.; Zhou, S. Degradation of Antipyrine by UV, UV/H2O2 and UV/PS. J. Hazard Mater. 2013, 260, 1008–1016. [Google Scholar] [CrossRef] [PubMed]
- Gao, L.; Guo, Y.; Zhan, J.; Yu, G.; Wang, Y. Assessment of the Validity of the Quenching Method for Evaluating the Role of Reactive Species in Pollutant Abatement during the Persulfate-Based Process. Water Res. 2022, 221, 118730. [Google Scholar] [CrossRef]
- Du, C.; Cheng, D.; Dai, J.; Du, Q.; Shao, A. Differences in the Ability of Dissolved Organic Matter from Different Sources to Produce Reactive Oxygen Species under Light Irradiation. Huanjing Kexue Xuebao/Acta Sci. Circumstantiae 2019, 39, 2279–2287. [Google Scholar] [CrossRef]
- Fujii, M.; Otani, E. Photochemical Generation and Decay Kinetics of Superoxide and Hydrogen Peroxide in the Presence of Standard Humic and Fulvic Acids. Water Res. 2017, 123, 642–654. [Google Scholar] [CrossRef]
- Vione, D.; Scozzaro, A. Photochemistry of Surface Fresh Waters in the Framework of Climate Change. Environ. Sci. Technol. 2019, 53, 7945–7963. [Google Scholar] [CrossRef]
- Westerhoff, P.; Song, R.; Amy, G.; Minear, R. Applications of Ozone Decomposition Models. Ozone Sci. Eng. 1997, 19, 55–73. [Google Scholar] [CrossRef]
- Rabani, J.; Matheson, M.S. The Pulse Radiolysis of Aqueous Solutions of Potassium Ferrocyanide. J. Phys. Chem. 1966, 70, 761–769. [Google Scholar] [CrossRef]
- Baxendale, J.H.; Wilson, J.A. The Photolysis of Hydrogen Peroxide at High Light Intensities. Trans. Faraday Soc. 1957, 53, 344–356. [Google Scholar] [CrossRef]
- Christensen, H.; Sehested, K.; Corfitzen, H. Reactions of Hydroxyl Radicals with Hydrogen Peroxide at Ambient and Elevated Temperatures. J. Phys. Chem. 1982, 86, 1588–1590. [Google Scholar] [CrossRef]
- Staehelln, J.; Hoigne, J. Decomposition of Ozone in Water in the Presence of Organic Solutes Acting as Promoters and Inhibitors of Radical Chain Reactions. Environ. Sci. Technol. 1985, 19, 1206–1213. [Google Scholar] [CrossRef]
- Fogler, H.S. Elements of Chemical Reaction Engineering; Prentice Hall Inc.: Upper Saddle River, NJ, USA, 1999; ISBN 0135317088. [Google Scholar]
- Leifer, A. The Kinetics of Environmental Aquatic Photochemistry American Chemical Society. In ACS Professional and Reference Book; Oxford University Press: New York, NY, USA, 1988. [Google Scholar]
- Buxton, G.V.; Greenstock, C.L.; Helman, W.P.; Ross, A.B. Critical Review of Rate Constants for Reactions of Hydrated Electrons, Hydrogen Atoms and Hydroxyl Radicals (·OH/·O− in Aqueous Solution. J. Phys. Chem. Ref. Data 1988, 17, 513–886. [Google Scholar] [CrossRef]
- Brame, J.; Long, M.; Li, Q.; Alvarez, P. Trading Oxidation Power for Efficiency: Differential Inhibition of Photo-Generated Hydroxyl Radicals versus Singlet Oxygen. Water Res. 2014, 60, 259–266. [Google Scholar] [CrossRef]
- Ahn, Y.; Lee, D.; Kwon, M.; Choi, I.h.; Nam, S.N.; Kang, J.W. Characteristics and Fate of Natural Organic Matter during UV Oxidation Processes. Chemosphere 2017, 184, 960–968. [Google Scholar] [CrossRef]
- Song, C.; Zhang, K.X.; Wang, X.J.; Zhao, S.; Wang, S.G. Effects of Natural Organic Matter on the Photolysis of Tetracycline in Aquatic Environment: Kinetics and Mechanism. Chemosphere 2021, 263, 128338. [Google Scholar] [CrossRef]
- Fu, H.; Zheng, W.; Duan, W.; Fang, G.; Duan, X.; Wang, S.; Feng, C.; Zhu, S. Overlooked Roles and Transformation of Carbon-Centered Radicals Produced from Natural Organic Matter in a Thermally Activated Persulfate System. Environ. Sci. Technol. 2024, 58, 14949–14960. [Google Scholar] [CrossRef]
- Qin, W.; Wang, Y.; Fang, G.; Wu, T.; Liu, C.; Zhou, D. Evidence for the Generation of Reactive Oxygen Species from Hydroquinone and Benzoquinone: Roles in Arsenite Oxidation. Chemosphere 2016, 150, 71–78. [Google Scholar] [CrossRef]
- Calza, P.; Minella, M.; Demarchis, L.; Sordello, F.; Minero, C. Photocatalytic Rate Dependence on Light Absorption Properties of Different TiO2 Specimens. Catal. Today 2020, 340, 12–18. [Google Scholar] [CrossRef]
- Yang, Q.; Ling Ang, P.; Ray, M.B.; Pehkonen, S.O. Light Distribution Field in Catalyst Suspensions within an Annular Photoreactor. Chem. Eng. Sci. 2005, 60, 5255–5268. [Google Scholar] [CrossRef]
- Minero, C.; Vione, D. A Quantitative Evalution of the Photocatalytic Performance of TiO2 Slurries. Appl. Catal. B 2006, 67, 257–269. [Google Scholar] [CrossRef]
- Pellegrino, F.; Pellutiè, L.; Sordello, F.; Minero, C.; Ortel, E.; Hodoroaba, V.D.; Maurino, V. Influence of Agglomeration and Aggregation on the Photocatalytic Activity of TiO2 Nanoparticles. Appl. Catal. B 2017, 216, 80–87. [Google Scholar] [CrossRef]
- Luo, B.; Song, R.; Jing, D. Particle Aggregation Behavior during Photocatalytic Ethanol Reforming Reaction and Its Correlation with the Activity of H2 Production. Colloids Surf A Physicochem. Eng. Asp. 2017, 535, 114–120. [Google Scholar] [CrossRef]
- Ren, Y.; Jing, D. Study on Particle and Photonic Flux Distributions in a Magnetically Stirred Photocatalytic Reactor. J. Photonics Energy 2015, 5, 052097. [Google Scholar] [CrossRef]
- Wang, X.; Shui, M.; Li, R.; Song, Y. Correlation of Lattice Distortion with Photocatalytic Activity of Titanium Dioxide. Mater. Res. Bull. 2008, 43, 2476–2484. [Google Scholar] [CrossRef]
- Roushenas, P.; Ong, Z.C.; Ismail, Z.; Majidnia, Z.; Ang, B.C.; Asadsangabifard, M.; Onn, C.C.; Tam, J.H. Operational Parameters Effects on Photocatalytic Reactors of Wastewater Pollutant: A Review. Desalin. Water Treat. 2018, 120, 109–118. [Google Scholar] [CrossRef]
- Li, X.; Chen, Y.; Tao, Y.; Shen, L.; Xu, Z.; Bian, Z.; Li, H. Challenges of Photocatalysis and Their Coping Strategies. Chem. Catal. 2022, 2, 1315–1345. [Google Scholar] [CrossRef]
- Mehrabadi, Z.; Faghihian, H. Comparative Photocatalytic Performance of TiO2 Supported on Clinoptilolite and TiO2/Salicylaldehyde-NH2-MIL-101(Cr) for Degradation of Pharmaceutical Pollutant Atenolol under UV and Visible Irradiations. J. Photochem. Photobiol. A Chem. 2018, 356, 102–111. [Google Scholar] [CrossRef]
- Radjenović, J.; Sirtori, C.; Petrović, M.; Barceló, D.; Malato, S. Solar Photocatalytic Degradation of Persistent Pharmaceuticals at Pilot-Scale: Kinetics and Characterization of Major Intermediate Products. Appl Catal. B 2009, 89, 255–264. [Google Scholar] [CrossRef]
- Harja, M.; Sescu, A.M.; Favier, L.; Lutic, D. Doping Titanium Dioxide with Palladiun for Enhancing the Photocatalytic Decontamination and Mineralization of a Refractory Water Pollutant. Rev. Chim. 2020, 71, 145–152. [Google Scholar] [CrossRef]
- Turchi, C.S.; Ollis, D.F. Photocatalytic Degradation of Organic Water Contaminants: Mechanisms Involving Hydroxyl Radical Attack. J. Catal. 1990, 122, 178–192. [Google Scholar] [CrossRef]
- Beltrán, F.J.; Jiménez-López, M.A.; Álvarez, P.M.; Rivas, F.J. Kinetic Modeling of Photocatalytic Oxidation-Ozonation of Metronidazole Removal from Water. J. Environ. Chem. Eng. 2025, 13, 115869. [Google Scholar] [CrossRef]
- Milosavijević, B.H.; Mićić, O.I. Solvated Electron Reactions in Water—Alcohol Solutions. J. Phys. Chem. 1978, 82, 1359–1362. [Google Scholar] [CrossRef]
- Tolosana-Moranchel, A.; Casas, J.A.; Carbajo, J.; Faraldos, M.; Bahamonde, A. Influence of TiO2 Optical Parameters in a Slurry Photocatalytic Reactor: Kinetic Modelling. Appl. Catal. B 2017, 200, 164–173. [Google Scholar] [CrossRef]
- Beltrán, F.J.; Rivas, F.J.; García-araya, J.F. Six Flux Model for the Central Lamp Reactor Applied to an External Four-lamp Reactor. Catalysts 2021, 11, 1190. [Google Scholar] [CrossRef]
- Wong, C.C.; Chu, W. The Hydrogen Peroxide-Assisted Photocatalytic Degradation of Alachlor in TiO2 Suspensions. Environ. Sci. Technol. 2003, 37, 2310–2316. [Google Scholar] [CrossRef]
- Rabani, J.; Mamane, H.; Pousty, D.; Bolton, J.R. Practical Chemical Actinometry—A Review. Photochem. Photobiol. 2021, 97, 873–902. [Google Scholar] [CrossRef]
- O’Sullivan, D.W.; Tyree, M. The Kinetics of Complex Formation between Ti(IV) and Hydrogen Peroxide. Int. J. Chem. Kinet. 2007, 39, 457–461. [Google Scholar] [CrossRef]
- Dalida, M.L.P.; Amer, K.M.S.; Su, C.C.; Lu, M.C. Photocatalytic Degradation of Acetaminophen in Modified TiO2 under Visible Irradiation. Environ. Sci. Pollut. Res. 2014, 21, 1208–1216. [Google Scholar] [CrossRef] [PubMed]
- Shahabi, H.; Allahrasani, A.; Naghizadeh, A. Photocatalytic Degradation of Acetaminophen in Aqueous Solution in the Presence of Montmorillonite Nanosheets Modified with Titanium Dioxide. Desalin. Water Treat. 2019, 149, 164–170. [Google Scholar] [CrossRef]
- Silva, C.G.; Faria, J.L. Anatase vs Rutile Efficiency on the Photocatalytic Degradation of Clofibric Acid under near UV to Visible Irradiation. Photochem. Photobiol. Sci. 2009, 8, 705–711. [Google Scholar] [CrossRef]
- Peñas-Garzón, M.; Gómez-Avilés, A.; Álvarez-Conde, J.; Bedia, J.; García-Frutos, E.M.; Belver, C. Azaindole Grafted Titanium Dioxide for the Photodegradation of Pharmaceuticals under Solar Irradiation. J. Colloid Interface Sci. 2023, 629, 593–603. [Google Scholar] [CrossRef] [PubMed]


| Pharmaceutical | Category | Chemical Formula | Molecular Weight (g·mol−1) | Solubility (g·L−1) | pKa | Structure |
|---|---|---|---|---|---|---|
| ATL (Atenolol) | β-blocker | C14H22N2O3 | 266.34 | 33.3 | 9.54 | 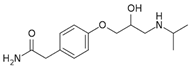 |
| ACM (Acetminophen) | Analgesic Antipyretic | C8H9NO2 | 151.16 | 14.0 | 9.50 | 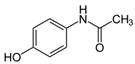 |
| CLA (Clofibric acid) | Lipid regulator | C10H11ClO3 | 214.65 | 0.58 | 2.9 | 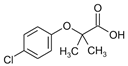 |
| ANT (Antipyrine) | Analgesic | C11H12N2O | 188.23 | 56.0 | 1.4 | 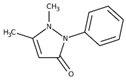 |
| Pharmaceutical | ε254 nm M−1·cm−1 | Concentration | Abs254 nm | Transmittance |
|---|---|---|---|---|
| M | a.u. | % | ||
| ATL | 441.2 | 1.87 × 10⁻⁶ | 8.25 × 10⁻⁴ | 99.8 |
| ACM | 10,645 | 3.31 × 10⁻⁶ | 3.52 × 10⁻² | 92.1 |
| CLA | 251.2 | 2.06 × 10⁻⁶ | 5.17 × 10⁻⁴ | 99.9 |
| ANT | 8890.6 | 2.65 × 10⁻⁶ | 2.36 × 10⁻² | 94.7 |
| TBA | 0.244 | 0.01 | 2.44 × 10⁻³ | 99.4 |
| NaN3 | 5.35 | 0.01 | 0.053 | 88.5 |
| TIRON | 444.1 | 0.001 | 0.404 | 39.5 |
| WWEf a | -- | -- | 0.16 | 69.2 |
| Pharmaceutical | ϕapp (mol·Einstein−1) | ϕd (mol·Einstein−1) |
|---|---|---|
| No Scavenger | TBA+TIRON | |
| ATL | 0.338 | 8.05 × 10⁻³ |
| ACM | 4.34 × 10⁻³ | 1.93 × 10⁻³ |
| CLA | 1.05 | 3.12 × 10⁻¹ |
| ANT | 6.44 × 10⁻² | 5.12 × 10⁻² |
| Pharmaceutical | k1O2 (M−1·s−1) |
|---|---|
| ATL | 9.93 |
| ACM | 1.30 × 10⁶ |
| CLA | 1.18 × 10² |
| ANT | 1.14 × 10⁴ |
Disclaimer/Publisher’s Note: The statements, opinions and data contained in all publications are solely those of the individual author(s) and contributor(s) and not of MDPI and/or the editor(s). MDPI and/or the editor(s) disclaim responsibility for any injury to people or property resulting from any ideas, methods, instructions or products referred to in the content. |
© 2025 by the authors. Licensee MDPI, Basel, Switzerland. This article is an open access article distributed under the terms and conditions of the Creative Commons Attribution (CC BY) license (https://creativecommons.org/licenses/by/4.0/).
Share and Cite
Jiménez-López, M.A.; Rubio-Gonzaga, M.C.; Beltrán, F.J. Removal from Water of Some Pharmaceuticals by Photolysis and Photocatalysis: Kinetic Models. Catalysts 2025, 15, 471. https://doi.org/10.3390/catal15050471
Jiménez-López MA, Rubio-Gonzaga MC, Beltrán FJ. Removal from Water of Some Pharmaceuticals by Photolysis and Photocatalysis: Kinetic Models. Catalysts. 2025; 15(5):471. https://doi.org/10.3390/catal15050471
Chicago/Turabian StyleJiménez-López, Miguel A., María C. Rubio-Gonzaga, and Fernando J. Beltrán. 2025. "Removal from Water of Some Pharmaceuticals by Photolysis and Photocatalysis: Kinetic Models" Catalysts 15, no. 5: 471. https://doi.org/10.3390/catal15050471
APA StyleJiménez-López, M. A., Rubio-Gonzaga, M. C., & Beltrán, F. J. (2025). Removal from Water of Some Pharmaceuticals by Photolysis and Photocatalysis: Kinetic Models. Catalysts, 15(5), 471. https://doi.org/10.3390/catal15050471