Article

Graphene Oxide-Supported Metal Catalysts for Selective Hydrogenation of Cinnamaldehyde: Impact of Metal Choice and Support Structure

1
Department of Organic Technology, University of Chemistry and Technology, 166 28 Prague, Czech Republic
2
Department of Inorganic Chemistry, University of Chemistry and Technology, 166 28 Prague, Czech Republic
*
Author to whom correspondence should be addressed.
Catalysts 2025, 15(5), 470; https://doi.org/10.3390/catal15050470 (registering DOI)
Submission received: 31 March 2025 / Revised: 2 May 2025 / Accepted: 8 May 2025 / Published: 10 May 2025
(This article belongs to the Special Issue Catalysis by Metals and Metal Oxides)

Abstract

:
This study explores the selective hydrogenation of cinnamaldehyde using a series of metal catalysts supported on reduced graphene oxide (rGO) and conventional activated carbon (AC). Catalysts based on Pt, Pd, Rh, Ru, and Co were synthesized with controlled metal loading and characterized by XRD, SEM-EDS, XRF, and TEM. Among all tested materials, Pd supported on rGO synthesized via the Tour method (Pd/rTOGO) exhibited the highest catalytic activity, achieving 62% conversion of cinnamaldehyde and superior selectivity toward hydrocinnamaldehyde (HCAL). The support material had a significant influence on performance, especially for Pd catalysts, where 2D rGO outperformed 3D AC in both conversion and selectivity. In contrast, other metals (Pt, Rh, Ru, Co) showed only modest activity and limited selectivity tuning via support choice. Notably, GC-MS analysis revealed the formation of a previously underreported side product, 3-isopropoxy-propan-1-yl benzene (ether), likely formed via reductive etherification in isopropanol. The combined kinetic and selectivity data enabled the proposal of reaction pathways, including rapid transformation of cinnamylalcohol (COL) to hydrocinnamal alcohol (HCOL) and HCAL to ether. These findings emphasize the importance of support structure and surface functionality, particularly in 2D carbon materials, for designing efficient and selective hydrogenation catalysts.

Graphical Abstract

1. Introduction

Hydrogenation is one of the most crucial reactions in the chemical industry. Selective hydrogenation over different hydrogenation metals have been under vivid research since the earliest stages of the history of catalytic hydrogenation. However, they still remain a challenging task. Even though certain trends have been established regarding which types of unsaturated bonds are preferentially hydrogenated by different active metals, these cannot be considered general rules for all hydrogenation reactions under various conditions [1,2]. Generally, hydrogenation activity of the hydrogenation metals decreased in the following order: Pd > Pt > Rh > Ru > Ni = Co > Cu > Fe [3,4]. Platinum and palladium are taken as the most active hydrogenation metals and are by far the most widely tested and used [4,5]. Furthermore, Pt is generally taken as active in hydrogenations of all types of unsaturated bonds, while Pd is usually used in partial or selective hydrogenations, since it is less active in hydrogenations of aromatics and ketones, and prefers C=C bond hydrogenation [4,6]. Ru catalysts are taken as the selective for aromatic ring hydrogenation, and therefore, Ru is used for hydrogenation of aromatic amines and alcohols toward corresponding cyclohexane derivatives [7,8,9,10]. Rh catalysts exhibit high activities, e.g., in the selective hydrogenation of aromatic ketones to the corresponding alcohols [11]. Additionally, high selectivity in hydrogenation of the aromatic ring can be achieved over Rh catalysts by the right choice of supporting material, promotors, and reaction conditions [12]. Cobalt, an example of a non-noble metal, can be efficiently used in the selective hydrogenation of C=O bond [13,14] or in hydrogenations of nitriles to primary amines [15,16].
Special attention in the selective hydrogenations takes selective hydrogenation of α,β-unsaturated aldehydes to the corresponding unsaturated alcohols or saturated aldehydes since it is of great importance in the field of fine chemicals syntheses [6,9,17,18]. Among the most important and the most studied α,β-unsaturated aldehydes are crotonaldehyde [19,20,21], acrolein [22,23,24], and cinnamaldehyde [9,25,26,27].
Next to C=O and C=C bonds also, the aromatic ring is present in cinnamaldehyde and therefore, the molecule is an optimal model reactant for evaluation of the effect of active metals and other properties of the catalysts on the selective hydrogenation of different types of double bonds. The products of cinnamaldehyde hydrogenation are cinnamylalcohol (COL, formed by hydrogenation of C=O), hydrocinnamaldehyde (HCAL, formed by hydrogenation of C=C), and hydrocinnamal alcohol (HCOL, formed by hydrogenation of both, C=O and C=C) (Figure 1). These products are utilized in the field of chemical specialties as intermediates for pharmaceuticals, perfumes, and fragrances [26].
Hydrogenation of carbon–carbon double bonds should be more easily feasible based on thermodynamics as well as kinetics since this bond exhibited lower bond energy compared to C=O bond, being 614 kJ/mol for C=C and 745 kJ/mol for C=O. However, the right choice of the active metals proved to be crucial in the shifting of selectivity toward different hydrogenation products. A high number of the results obtained in the study of the CAL hydrogenation have been published, and some general conclusions have been summarized in a review from 2020 [26]. Generally, selective hydrogenation of CAL toward HCAL can be performed on Pd supported catalysts while, supported Pt (mono- as well as bimetallic) [28,29,30], Au [31], Ru [28,32,33], Ir [34,35], Co [36,37], and Cu [38,39] catalysts were successfully used for selective C=O bond hydrogenation and therefore for selective COL preparation [26,40].
Not surprisingly, the Pt-based catalysts are the most tested in CAL hydrogenation. As mentioned above, Pt catalysts prefer C=O bond hydrogenation, so high COL selectivities can be achieved [26]. COL selectivities of over 90% were obtained, for example, by testing of Pt/carbon nanosheets in isopropyl alcohol [25], Pt/CeZrO2 in ethanol [41] or over bimetallic PtFe/carbon nanotubes [42]. Because of the high activity of Pt in hydrogenations, next to COL and HCOL, a product with hydrogenated double bonds can be formed, for example, 97% selectivity to HCOL was achieved using Pt/graphite in isopropyl alcohol [43]. However, selective COL synthesis is preferred and therefore the task to hinder C=C bond hydrogenation with the remaining high C=O hydrogenation activity is under vivid investigation. Therefore, the number of studies focused on varying supports, Pt particles size, reaction conditions (especially solvents), and study of Pt-CAL interactions are published yearly [26]. Special high attention is paid to the usage of carbon-based materials because it was assumed that the C=O bond hydrogenation is improved by the transfer of π-electrons from the carbon materials to the Pt nanoparticles (NPs) [44]. But this fact can anyway be diminished by other factors and different catalytic performance of different carbon-based supported Pt catalysts and has been usually addressed to different sizes of Pt NPs.
Also, research focused on selective HCAL synthesis is using carbon-based materials as the support, and palladium is used as the active species in the selective C=O hydrogenation. HCAL selectivities of over 90% have been achieved, for example, using Pd/OGF (oxygen-functionalized graphite felt) [45], Pd/CNF (carbon nanofibers) [46], and Pd-NMC (nitrogen-doped mesoporous carbon) [47].
Based on the mentioned data, carbon-based 2D materials, namely two types of graphene oxides, have been selected for the presented study. Graphene is the pioneering example of a two-dimensional material, isolated from natural graphite in 2004, which has since then been extensively investigated in the wide range of potential applications [48]. Layered 2D materials are characterized by minimum thickness to the physical limit, large surface area, uniformly exposed lattice plane, adjustable electronic state, ability of surface defect formation, and possibility of controlled surface functionalization [49,50]. One of the possible utilizations of 2D materials targets the catalysis as the catalyst or as the supports for various catalytically active metals. Excellent catalytic activities with superior selectivities have been described in various chemical and electrochemical reactions [48]. In the presented research, graphene is used in its oxidized form—graphene oxide. Two types of graphene oxide were synthesized following two previously described preparation methods, namely Hummer’s method [51] and Tour’s method [52] (described in Section 3). These methods should result in graphene oxides with slightly different compositions of the surface groups. Graphene oxide prepared by Hummer’s method (HUGO) [51] should be characterized by the presence of mainly epoxy and hydroxyl groups while graphene oxide prepared by Tour’s method (TOGO) [52] contains mainly carboxyl groups. Active metals deposition on the graphene oxide supports can be performed using various common as well as novel preparation methods. Simple wet impregnation of the GO is commonly accompanied by the reduction by various reduction agents such as NaBH4, ethylene glycol, or hydrazine [53,54,55,56,57]. The reduced graphene oxide (rGO) does not exactly have a defined structure since its reduction is usually only partial and different reduction methods result in different properties of rGO (Figure 2); however, it is characterized by the presence of hydroxyl, carbonyl, carboxyl, and epoxide groups on the surface that makes the reduced graphene oxide sheet soluble in water and offers binding sites for metal nano particles.

2. Results

A set of the graphene oxide supported metal catalysts has been prepared within the current study. Typical hydrogenation metals like Pt, Pd, Rh, Ru, and Co were used as active species. Two different graphene oxides differing in the preparation methods and subsequently in the surface composition, namely HUGO (GO prepared by Hummer’s method) and TOGO (GO prepared by Tour’s method), were used as the 2D supports. Activated carbon was used as the support for the comparison. All catalysts were prepared by the same method (impregnation with chemical reduction), with the same nominal metal loading (1 wt.%) and were reduced before testing in cinnamaldehyde hydrogenation reaction. The evaluation of the effect of different active metals supported on different 2D and 3D carbon-based supports on the selective hydrogenation of different types of double bonds was the main aim of the current study.

2.1. Catalyst Characterization

2.1.1. X-Ray Fluorescence

XRF analysis determined the elemental composition of the catalysts prepared using 2D supports TOGO and HUGO. Since XRF can only detect elements heavier than carbon, the elemental composition had to be calculated based on the detectable elements. This introduced uncertainties in the results, as the presence of carbon-based supports affected the accuracy of the calculated composition. However, XRF analysis confirmed the presence of all used metals in all prepared catalysts. Additionally, other elements were present in the samples as impurities in amounts below 0.1%, namely Cl (originating from metal precursors; not present in reduced samples), Si, Ca, Mn, and traces of P and S. All these elements originated from the synthesis of graphene oxides.

2.1.2. X-Ray Diffraction

XRD spectra of all reduced catalysts as well as pure supports were measured. Diffraction patterns of platinum and palladium modified catalysts as well as pure supports are depicted in Figure 3. Diffraction patterns of other catalysts (Rh, Ru, and Co) are presented in Supplementary Materials (Figure S1). Pure graphene oxide supports exhibit the main diffraction peak at 11° 2θ at reflection plane C (001). This peak is shifted compared to the peak of activated carbon at the very same reflection plane which is located at 2θ = 9°. The peak confirming presence of graphene oxides sheets (2θ = 11°) disappears after the reduction of the material (by the ethylene glycol treatment during the impregnation step or by the following reduction of the prepared catalysts). The reduction is additionally confirmed by the appearance of a diffraction peak at 24° 2θ at reflection plane C (002), which is in consistence with previously published data [58,59,60]. No presence of peak typical for GO was determined for all prepared catalysts, confirming reduction of graphene oxide supports during the impregnation step.
No significant shifts of carbon diffraction peaks were observed after the loading of metals on activated carbon, only intensity of the peak at 2θ = 9° significantly decreased. This indicates no changes in the structure of activated carbon caused by any treatment.
A very small diffraction peak at 2θ = 40.1° typical for reflection plane Pt (111) is visible in the XRD patterns Pt-supported catalysts suggesting the presence of well-dispersed small Pt nanoparticles present on the supports (Figure 3a).
Diffraction peaks typical for Pd are observed in all three prepared samples in positions 40.3°, 46.6°, and 68.5° 2θ at reflection planes Pd (111), (200), and (220), respectively (Figure 3b). Especially diffraction peak 2θ = 40.3° is sharp and clear, which indicates the presence of bigger Pd particles.
Comparing all other recorded XRD patterns of Rh, Ru, and Co supported materials (Supplementary Materials, Figure S1), the very same trends are observed for diffractions typical for supports (carbon). Diffraction patterns typical for Rh, Ru, as well as Co, are not visible in the XRD patterns of the prepared catalysts. For the Ru and Rh catalysts, the absence of characteristic metal diffraction peaks in the XRD patterns can be attributed to the fine dispersion of small metal nanoparticles, as confirmed by SEM and TEM analyses (see below Section 2.1.4 and Section 2.1.5). Although the Co particles were relatively large (~20 nm, determined below by TEM, Section 2.1.5), no Co-related diffraction peaks were observed in the XRD patterns. This can be explained by a combination of factors: (i) the low metal loading (1 wt.%), (ii) strong background scattering from the carbon supports, and (iii) the poor crystallinity or partial amorphous character of the cobalt nanoparticles, which suppress sharp XRD reflections.

2.1.3. Nitrogen Physisorption

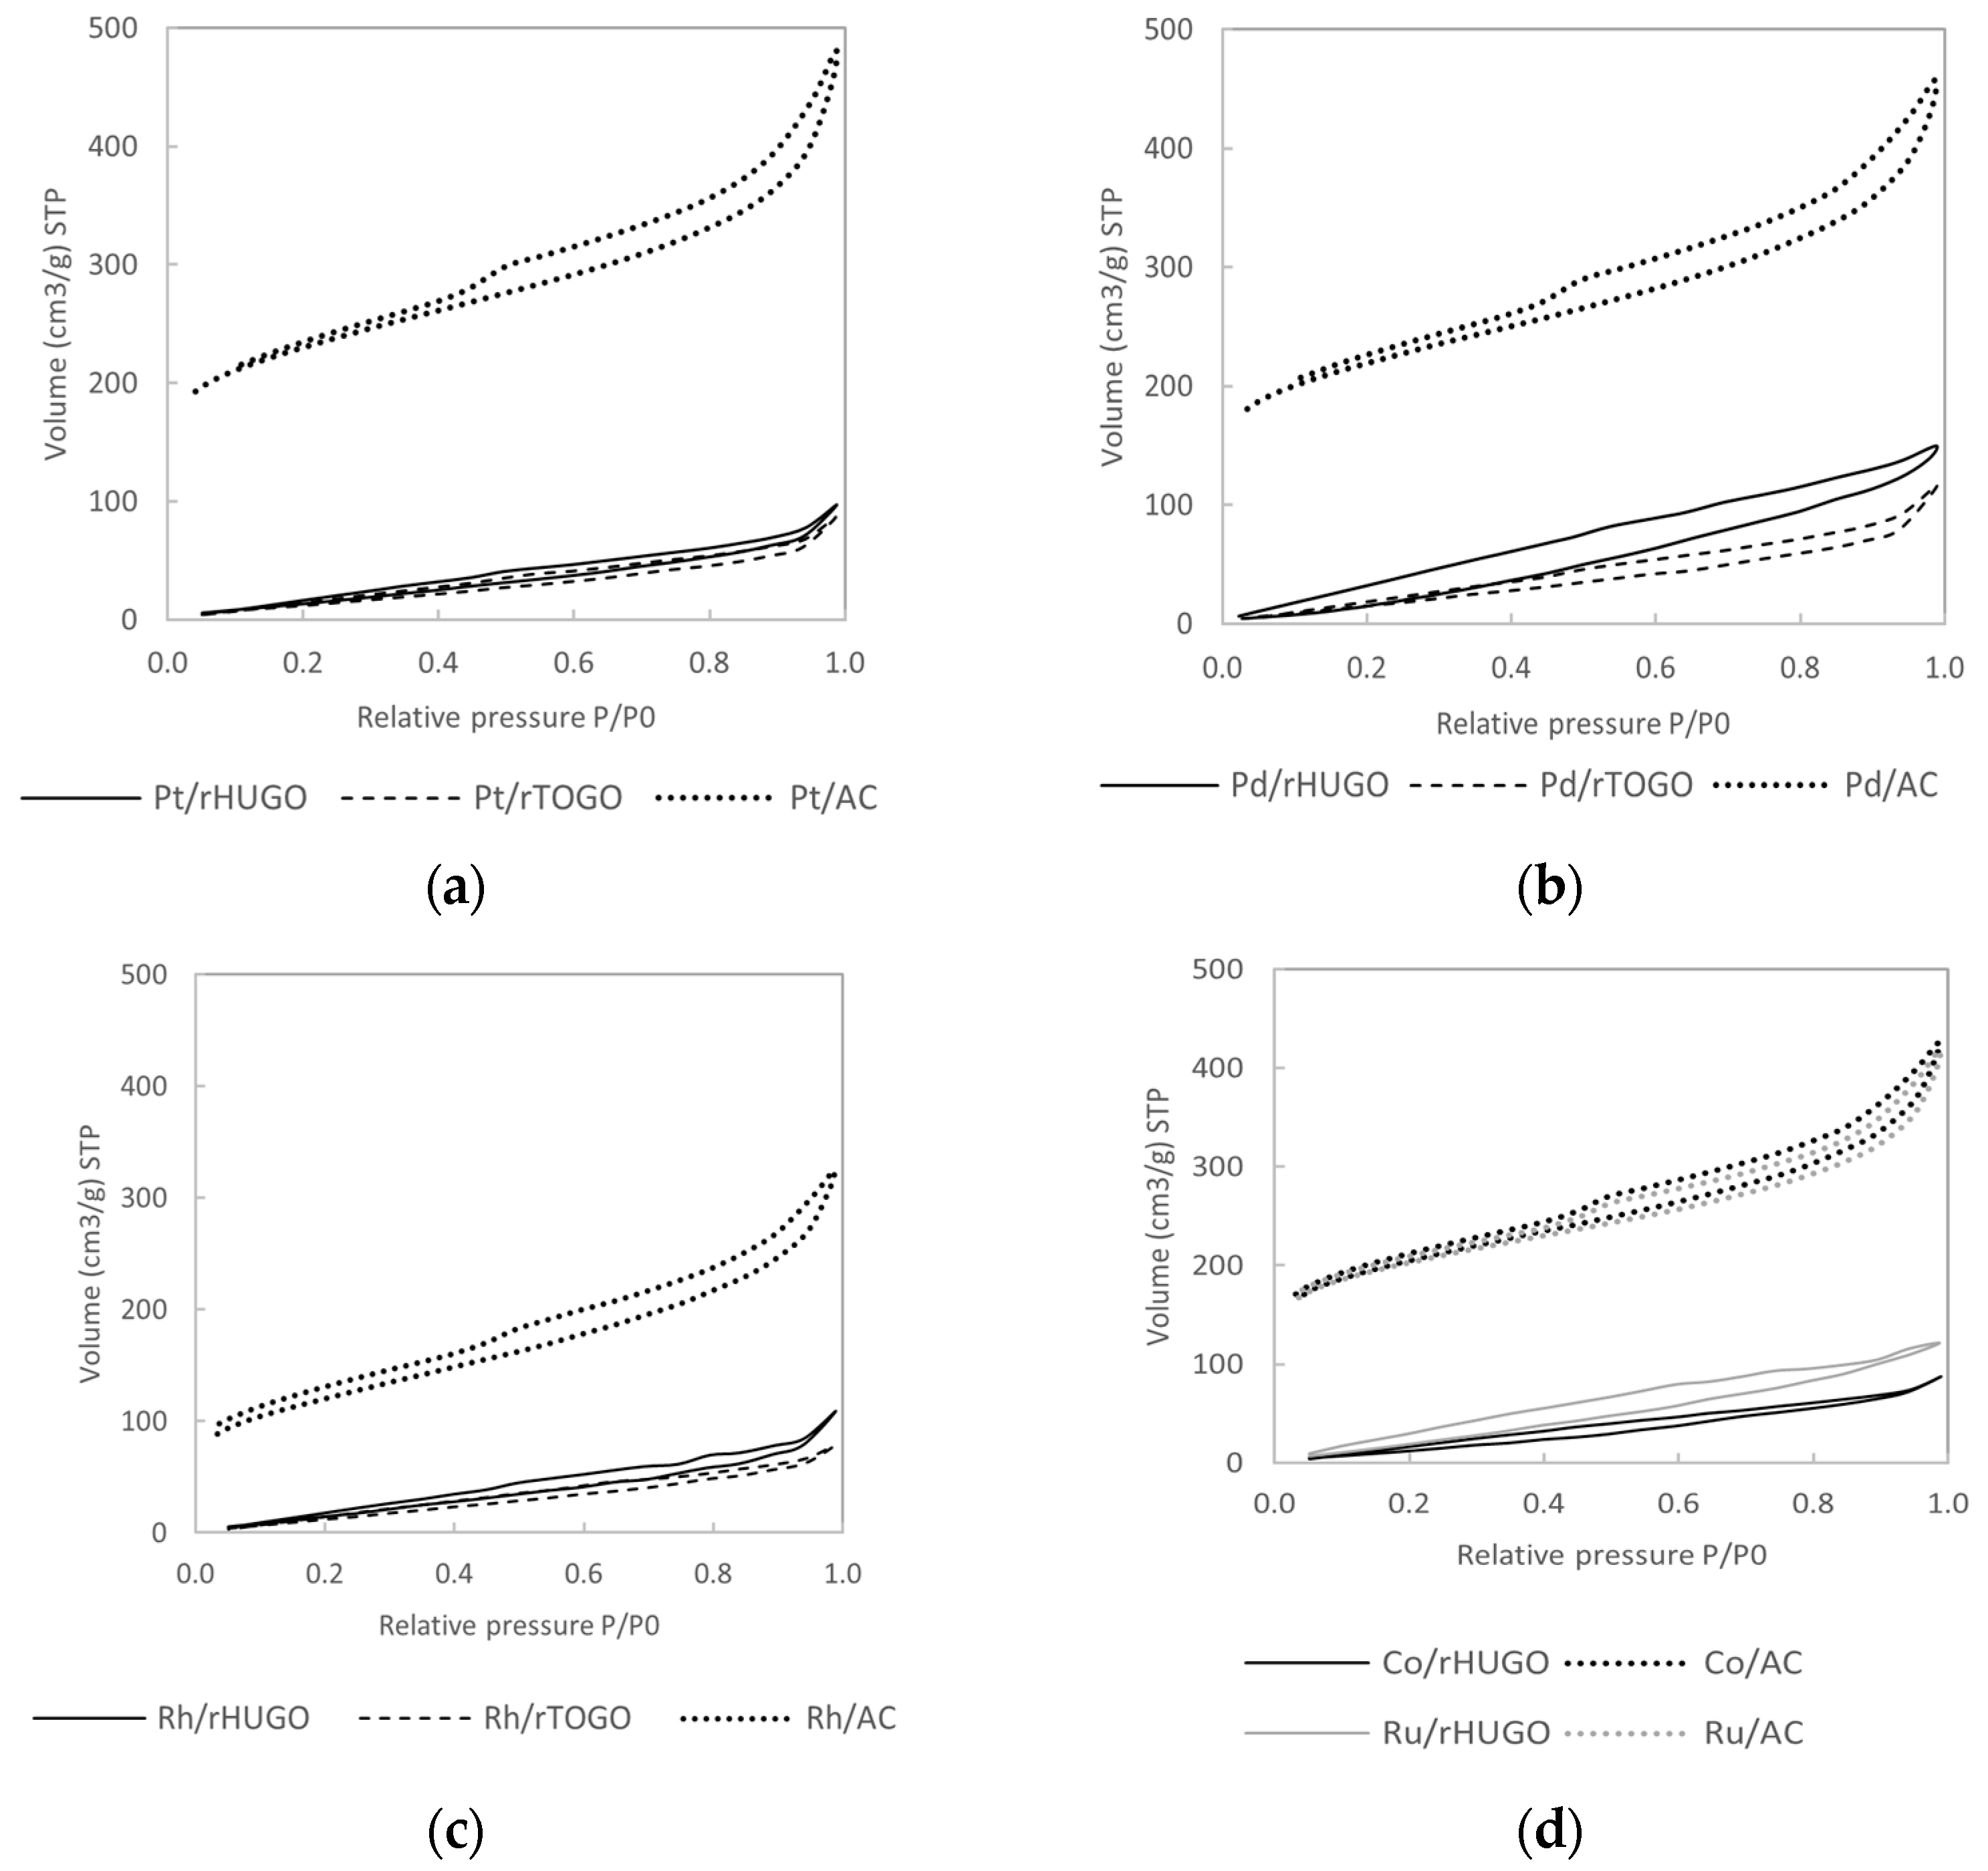
Nitrogen sorption measurements were used for the determination of BET surface areas of the prepared catalysts (Table 1) and for recording corresponding isotherms (Figure 4). As can be seen from the table, both graphene oxide supports are characterized by comparable, high surface areas around 550 m2/g. In contrast, the surface areas of the catalysts prepared by loading active metals on graphene oxides dropped significantly. The 5–7 times lower surface areas compared to pure GOs were determined for all metal catalysts. Activated carbon is characterized by a higher surface area than GOs, corresponding to its microporous character. In the case of catalysts using AC as the support, the metal loading did not cause such a significant change in the surface areas. Pt/AC and Pd/AC catalysts exhibited higher surface area than pure AC support, while the loading of Ru and Co on AC did not influence surface area almost at all. Decrease in the surface area of AC was observed only in case of Rh loading, where a drop to 418 m2/g was observed.
Isotherms of the catalysts prepared using conventional AC as the support exhibited isotherm type IV with H1 hysteresis loop typical for materials containing open micro- and mesopores.
Alternatively, isotherms measured for graphene oxides-supported catalysts are characterized by isotherm type V with H4 hysteresis loop which indicate the formation of aggregates of plate-like particles forming slit-like pores [61]. Absence of micropores in case of all graphene oxide materials is clear from the isotherms.

2.1.4. Scanning Electron Microscopy

The surface morphology of all prepared and reduced catalysts was studied using scanning electron microscopy (SEM, with BSE detector). Additionally, elemental composition of the samples was determined by energy-dispersive X-ray spectrometer (EDS). Differences mainly in the morphology of metals supported particles were studied. The limitation of the used microscope is around 15 nm; therefore, morphology of only bigger metal nanoparticles can be studied. For the examination of smaller NPs, a transmission electron microscope was used.
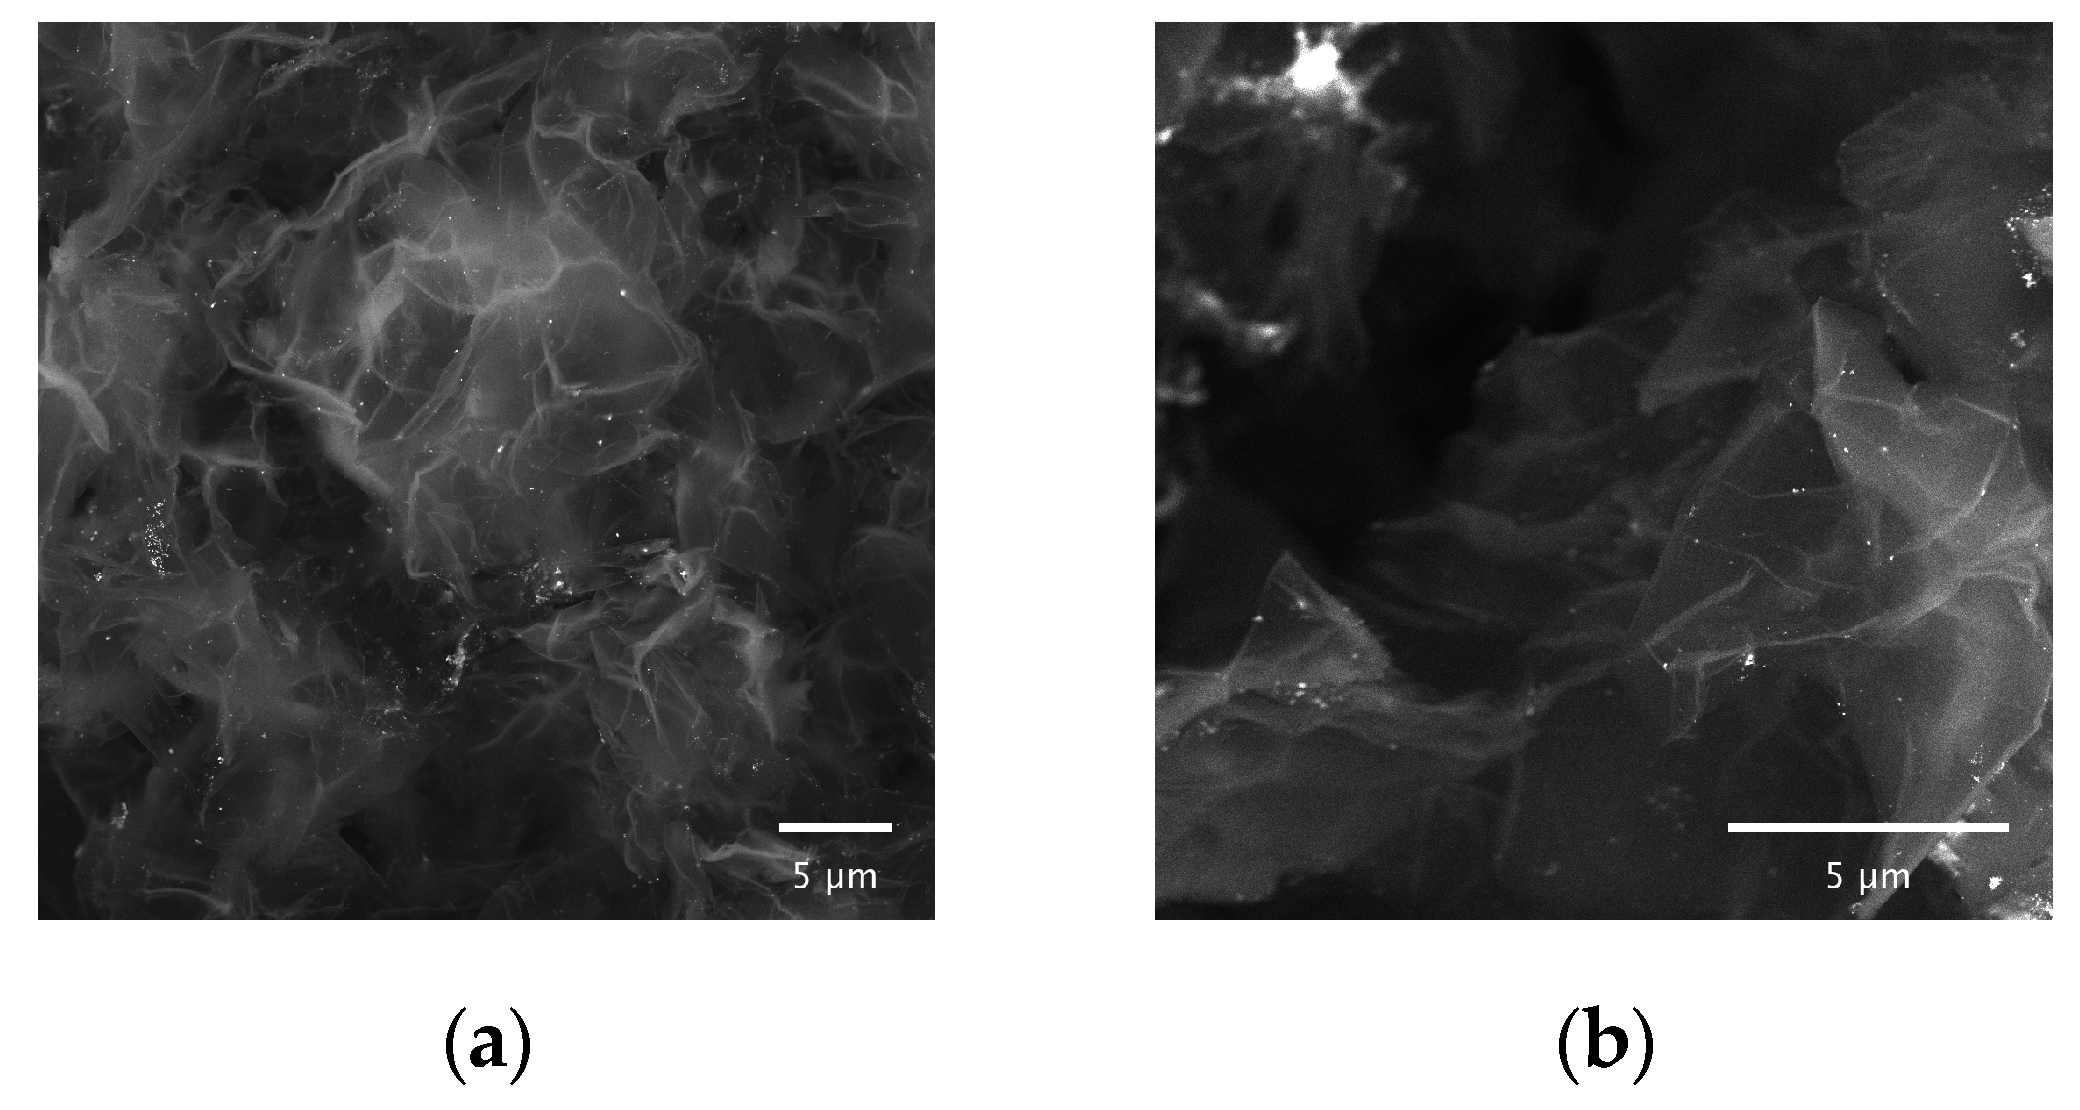
Looking at the surface morphology, a clear 2D structure typical for graphene oxides characterized by the presence of smooth sheets is detectable in all images measured for the catalysts prepared by modification of HUGO and TOGO (Figure 5, Figures S6–S10 in Supplementary Materials). No significant differences in the surface morphology of graphene oxides were determined after either the loading of metals or the reduction step.
SEM/EDS imaging of the reduced Pt-supported catalysts revealed the presence of well-dispersed Pt nanoparticles across all support types. In particular, Pt/rHUGO exhibited homogenous spectral maps, suggesting numerous small, uniformly distributed spherical Pt particles, with particle sizes near or below the resolution limit of the SEM (~15 nm). For Pt/rTOGO, slightly larger but still well-dispersed Pt nanoparticles were observed, averaging around 25 nm (range 15–50 nm). Pt/AC also showed fine dispersion of Pt over the surface, although some larger Pt clusters (80–120 nm) were visible. The EDS confirmed homogeneous distribution of Pt across all catalysts contains 1.1–2.1 wt.% of Pt, which corresponds well to the nominal content of 1 wt.%.
Reduced Pd-supported catalysts exhibited the presence of high amount of small metal nanoparticles on the surface of all three supports (Figure S7). Compared to the Pt catalysts, Pd NPs were slightly worse dispersed over the supports. Bigger clusters of Pd are again visible on the reduced Pd/AC, where clusters up to 200 nm can be detected. The content of Pd, determined using EDS mapping, again showed slightly higher Pd content (1.1–2.3 wt.%) than the nominal Pd loading (1 wt.%).
Almost no Rh particles can be detected by analyzing carbon-based materials supported by Rh reduced catalysts (Figure S8). Smaller Rh NPs present in the Rh-supported catalysts are below the detection limit of SEM, and therefore, only TEM can be used for their determination. EDS mapping revealed the presence of Rh on all measured samples detecting Rh content close to the nominal loading (1 wt.%) being 0.8–1.2 wt.%.
The reduced catalyst prepared by Ru impregnation of HUGO contained Ru nanoparticles with non-uniform size ranging from smaller NPs around 30 nm to bigger clusters up to 500 nm. The shape and positions of the Ru NPs were irregular (Figure S9).
SEM images of reduced Co catalysts revealed the presence of bigger Co particles (compared to Pt and Pd catalysts) (Figure S10). The surface of reduced Co/rHUGO catalyst contains rod-shaped nanoparticles with a size of 80–400 nm and additionally also big clusters ranging between 300 and 600 nm. The formation of clusters of Co NPs is even more noticeable in the case of reduced Co/AC, where huge Co clusters with a size of around 900 nm can be detected.

2.1.5. Transmission Electron Microscopy

In order to determine the size of small metals NPs supported on carbon-based materials, transmission electron microscopy was used (for reduced catalysts). Metal particles, as well as sheets of 2D graphene oxides, are clearly visible on the images of all tested catalysts (Figure 6a–m). The particle size measurement was performed using TEM images with a scale of 20–2000 nm, and the particle size distribution of all reduced catalysts is demonstrated in histograms in the Supplementary Materials (Figures S11–S15) and summarized in Table 2.
As can be seen from the Figure 6a–c and Table 2, Pt-reduced catalysts are characterized by narrow particle size distribution. Pt/rHUGO and Pt/rTOGO are characterized by the presence of well-dispersed particles with a size of 2–4 nm. Also, Pt supported on AC contained well-dispersed but slightly bigger Pt NPs with a size of around 8 nm.Alternatively, TEM images of reduced Pd-supported catalysts revealed the presence of significantly bigger NPs and also the particle size distribution was not narrow (Figure 6d–f; Table 2). Pd supported on rHUGO, rTOGO, and AC contained mainly Pd NPs with a size of around 16 nm (ranging 8–35 nm), 21 nm (ranging 6–30 nm), and 14 nm (ranging 7–26 nm), respectively. Additionally, some bigger clusters of NPs can be detected on Pd/AC.
Very small Rh NPs were detected for Rh/rTOGO and Rh/AC (Figure 6g–i; Table 2). These Rh NPs were characterized by an average size of around 3.5 nm ranging from 1 to 7 nm. Surprisingly, the biggest Rh NPs were found on rHUGO and also Rh NPs distribution was the widest ranging between 2 and 20 nm.
The smallest nanoparticles from all tested metals were observed on reduced Ru/rHUGO catalysts containing particles around 2 nm (Figure 6j,k; Table 2). Ru NPs exhibited also very narrow NPs distribution and the biggest Ru NPs that can be observed are characterized by size 4.6 nm. Ru supported on AC are characterized by the presence of slightly bigger Ru NPs being around 3.1 nm with NPs ranging 1–12 nm.
Opposite to Ru, Co NPs are characterized by the biggest metal NPs with wide-size distribution ranging between 10 and 50 nm in case of Co/rHUGO and 7 and 40 nm in case of Co/AC (Figure 6l,m; Table 2).

2.2. Cinnamaldehyde Hydrogenation

2.2.1. Catalyst Activities: Reaction Rates and Conversions of Cinnamaldehyde

Three different carbon-based supports have been modified by the typical hydrogenation metals and tested in hydrogenation of cinnamaldehyde (CAL). The activities and selectivities toward different products determined for the tested catalysts have been evaluated and correlated with their chemical–physical properties. Mainly, the influence of used metals and of using 2D versus conventional support was investigated.
The conversions of CAL as a function of time achieved over the prepared and reduced catalysts are depicted in Figure 7. As can be seen from the figure (Figure 7a), Pd-supported catalysts exhibited the highest activity in the CAL hydrogenation and the highest CAL conversion was achieved over Pd/rTOGO being 62% within 360 min of the reaction. CAL conversions above 20% were also achieved using Pt-supported catalysts. Other catalyst modified by Rh, Ru, and Co exhibited significantly lower activities in the tested hydrogenation reaction (Figure 7b,c). Very low CAL conversions were achieved using Co and Ru catalysts, being only around 5% and 14% within 360 min of reaction, respectively. Rh catalysts also exhibited very low activities and therefore the reaction temperature was raised after 120 min of the reaction from 80 °C to 110 °C which led to the increase of the final achieved conversions up to values around 30% over all three Rh-supported catalysts (Figure 7c).
It can be clearly concluded that the used active metals play crucial role in the activity of the catalysts and that mainly Pt and Pd catalysts show significant activity in CAL hydrogenation under the used reaction conditions.
Focusing on the influence of the used support on the activity of the catalyst, it can be concluded that the highest conversions of CAL were achieved using rTOGO as the support. The increase of the conversion by using rTOGO instead of conventional AC is clearly visible using Pd-supported catalysts. On the other hand, using HUGO instead of AC as the supports for Pd led just to negligible increase of the achieved conversion (from 30% over Pd/AC to 33% over Pd/rHUGO). Only negligible differences in hydrogenation activities were achieved using Pt, Rh, Ru, and Co supported catalysts on GOs and AC, showing that the parameter determining the catalyst’s activity is the choice of active metal.
As can be seen from most of the curves of CAL conversion in time, there are decrease in the activities during the reaction while the highest reaction rates are achieved within the first 30–60 min of the reaction. Therefore, the activities of the tested catalysts are additionally expressed as the reaction rates, specifically the initial reaction and the reaction rate calculated between 120 and 360 min of the reaction (Table 3). Initial reaction rates were calculated from CAL concentrations at 0 to 30 min. Although this time interval is relatively long, the conversion remained below 20% with most of the catalysts, indicating that the reaction proceeded in the initial kinetic regime. Therefore, the calculated rates are considered representative for comparing catalytic activity.
It is obvious that the reaction rate calculated for the higher reaction times (120–360 min) is significantly lower compared to the initial reaction rate using all tested catalysts suggesting some catalysts deactivation. The highest initial reaction rates were achieved using Pd-supported catalysts being the highest for Pd/rTOGO. On the other hand, also the most significant decrease in the rate for higher reaction time can be observed. This reaction rate (at 120–360 min) is approx. 12 times and 8 times lower over Pd/rHUGO and Pd/rTOGO, respectively, compared to the achieved initial reaction rates. The differences between Pd/rHUGO and Pd/rTOGO stem not only from particle size and dispersion but also from differences in the surface functional groups of the rGO supports. TOGO, rich in carboxyl groups, can induce stronger metal–support interactions and potentially influence the electronic density of the supported Pd nanoparticles. Such electronic modulation could affect adsorption energies of intermediates and thus alter activity and selectivity. It can be noted that the significance of the reaction rates can be observed also over Rh catalysts despite the increase in the reaction temperature, however these reaction rates are the highest comparing with other tested catalysts, confirming influence of the elevated reaction temperature.

2.2.2. Catalysts’ Selectivities: Formation of Hydrogenation and Side Products

As it is clear from the reaction scheme of the CAL hydrogenation, three main hydrogenation products can be formed. Namely, hydrocinnamaldehyde (HCAL) with hydrogenated olefinic double bond (C=C), cinnamic alcohol (COL) with hydrogenated carbonyl group (C=O), and hydrocinnamyl alcohol (HCOL) with both hydrogenated double bonds.
Using GC-MS analysis, the side product formed during the experiments was determined as ether, namely 3-isopropoxy-propan-1-yl benzene. This ether is most probably formed by the reaction of aldehyde(s) with isopropyl alcohol through reductive etherification (Figure 8). A similar reaction under comparable reaction conditions has been described previously by L. J. Gooßen et al. [62] who described the reductive etherification of ketones catalyzed by a heterogeneous platinum catalyst (commercial Pt/C) at ambient hydrogen pressure [62]. Reductive etherification of aldehydes had been described also by Kalutharage, N. et al. who published successful synthesis of 1-(sec-butoxymethyl)-4-methoxybenzene by catalyzed reaction of methoxybenzaldehyde with butan-2-ol under hydrogen pressure 0.1–0.2 MPa at 110 °C [63]. Since the reaction conditions as well as the nature of the catalysts are close to the described in the listed references, it is assumed, that the formation of this ether is highly probable. On the other hand, it is surprising that none from the long list of published works focused on CAL hydrogenation has revealed or discussed the formation of this product. To avoid this side reaction, other solvents were tested in CAL hydrogenation, including acetonitrile, dimethyl sulfoxide, diethyl ether, and dichloromethane. The side product, ether, was not formed. However, the CAL conversions achieved were significantly lower, with no hydrogenation occurring in DMSO.
Table 4 compares selectivities toward the main hydrogenation products as well as toward ether achieved at two conversion levels, 10% and 30% CAL conversion. Additionally, the sum of all products formed through hydrogenation (HCAL, COL, and HCOL) is listed. Also, selectivities toward unidentified products usually formed in small quantities are listed (Other).
As can been seen from the results, using any prepared catalysts, selective preparation of any hydrogenated product was not achieved, since the formation of one product was accomplished by the formation of the others.
Only HCAL and COL were formed during the reaction performed under tested reaction conditions using most of the prepared catalysts, in exception of Pd catalysts. HCOL was significantly (selectivities around 20%) formed only over Pd-supported catalysts and it was also determined in a small quantity using Rh/rTOGO (after temperature increase to 110 °C).
Pt-supported catalysts on GOs exhibited high selectivities toward hydrogenated products being over 90% (sum of HCAL and COL). On the other hand, almost no preference in hydrogenating either olefinic or carbonyl double bond can be observed. Especially, in the case of using Pt-supported catalysts on graphene oxides, both products are formed in comparable selectivities being around 46%. The hydrogenation of the C=C bond is more favorable based on thermodynamics as well as kinetics, on the other hand, most of the research focused on monometallic heterogeneous Pt catalysts has demonstrated high selectivity toward COL [25,26,27,41,64,65,66].
As mentioned above, the formation of all three possible hydrogenation products was achieved only over Pd-supported catalysts. Selectivities toward HCOL were comparable using Pd/rGOs as well as Pd/AC being slightly over 20% (at 30% conversion level). Formation of COL is suppressed over Pd-supported catalysts mainly using GOs as the supports resulting in COL selectivities around 3% and HCAL selectivities over 62%. Also using Pd/AC, significantly lower formation of COL (compared to other tested metals) was observed to be only 9% (at 30% conversion level). However, HCAL selectivity was only 43% (at 30% CAL conversion) which was caused by the higher formation of ether (26% selectivity to ether at 30% CAL conversion).
Selectivities toward all products differed over Rh-supported catalysts. Relatively low formation of COL was achieved over Rh/rHUGO, which was caused mainly by the formation of undesired ether. High ether formation (selectivity over 20% at 30% CAL conversion) was observed using all three Rh-supported catalysts leading therefore to lower formation of hydrogenation products.
It is difficult to compare the results obtained over Ru and Co catalysts with other hydrogenating metals since very low conversions of CAL were achieved. Using Ru catalysts, high formation of unidentified products and ether was observed, which caused low yields of hydrogenated products.
It can be generally noted that using conventional AC as the support, leads to significantly higher formation of undesired ether product independently on used active metal, resulting in lower selectivities toward hydrogenated products.
The presented results obtained over Pd catalysts correspond with the conclusions of one of the most recent review articles focused on CAL hydrogenation [26] where it is stated that Pd catalysts are mainly used for the preparation of HCAL because they prefer hydrogenation of C=C over hydrogenation of C=O. On the other hand, current results obtained over Pt catalyst exhibiting same formation of COL and HCAL are opposing of the conclusions of the mentioned review [26], where Pt catalysts are applied in preferential hydrogenation of C=O bond and therefore selective preparation of COL. Additionally, carbon materials used as the supports (namely carbon nanotubes and 3D hierarchical porous carbon framework) should transfer π-electrons from carbon to Pt nanoparticles which should even enhance selectivity toward hydrogenation of C=O bond [25,26,27]. Bulleted lists look like this:
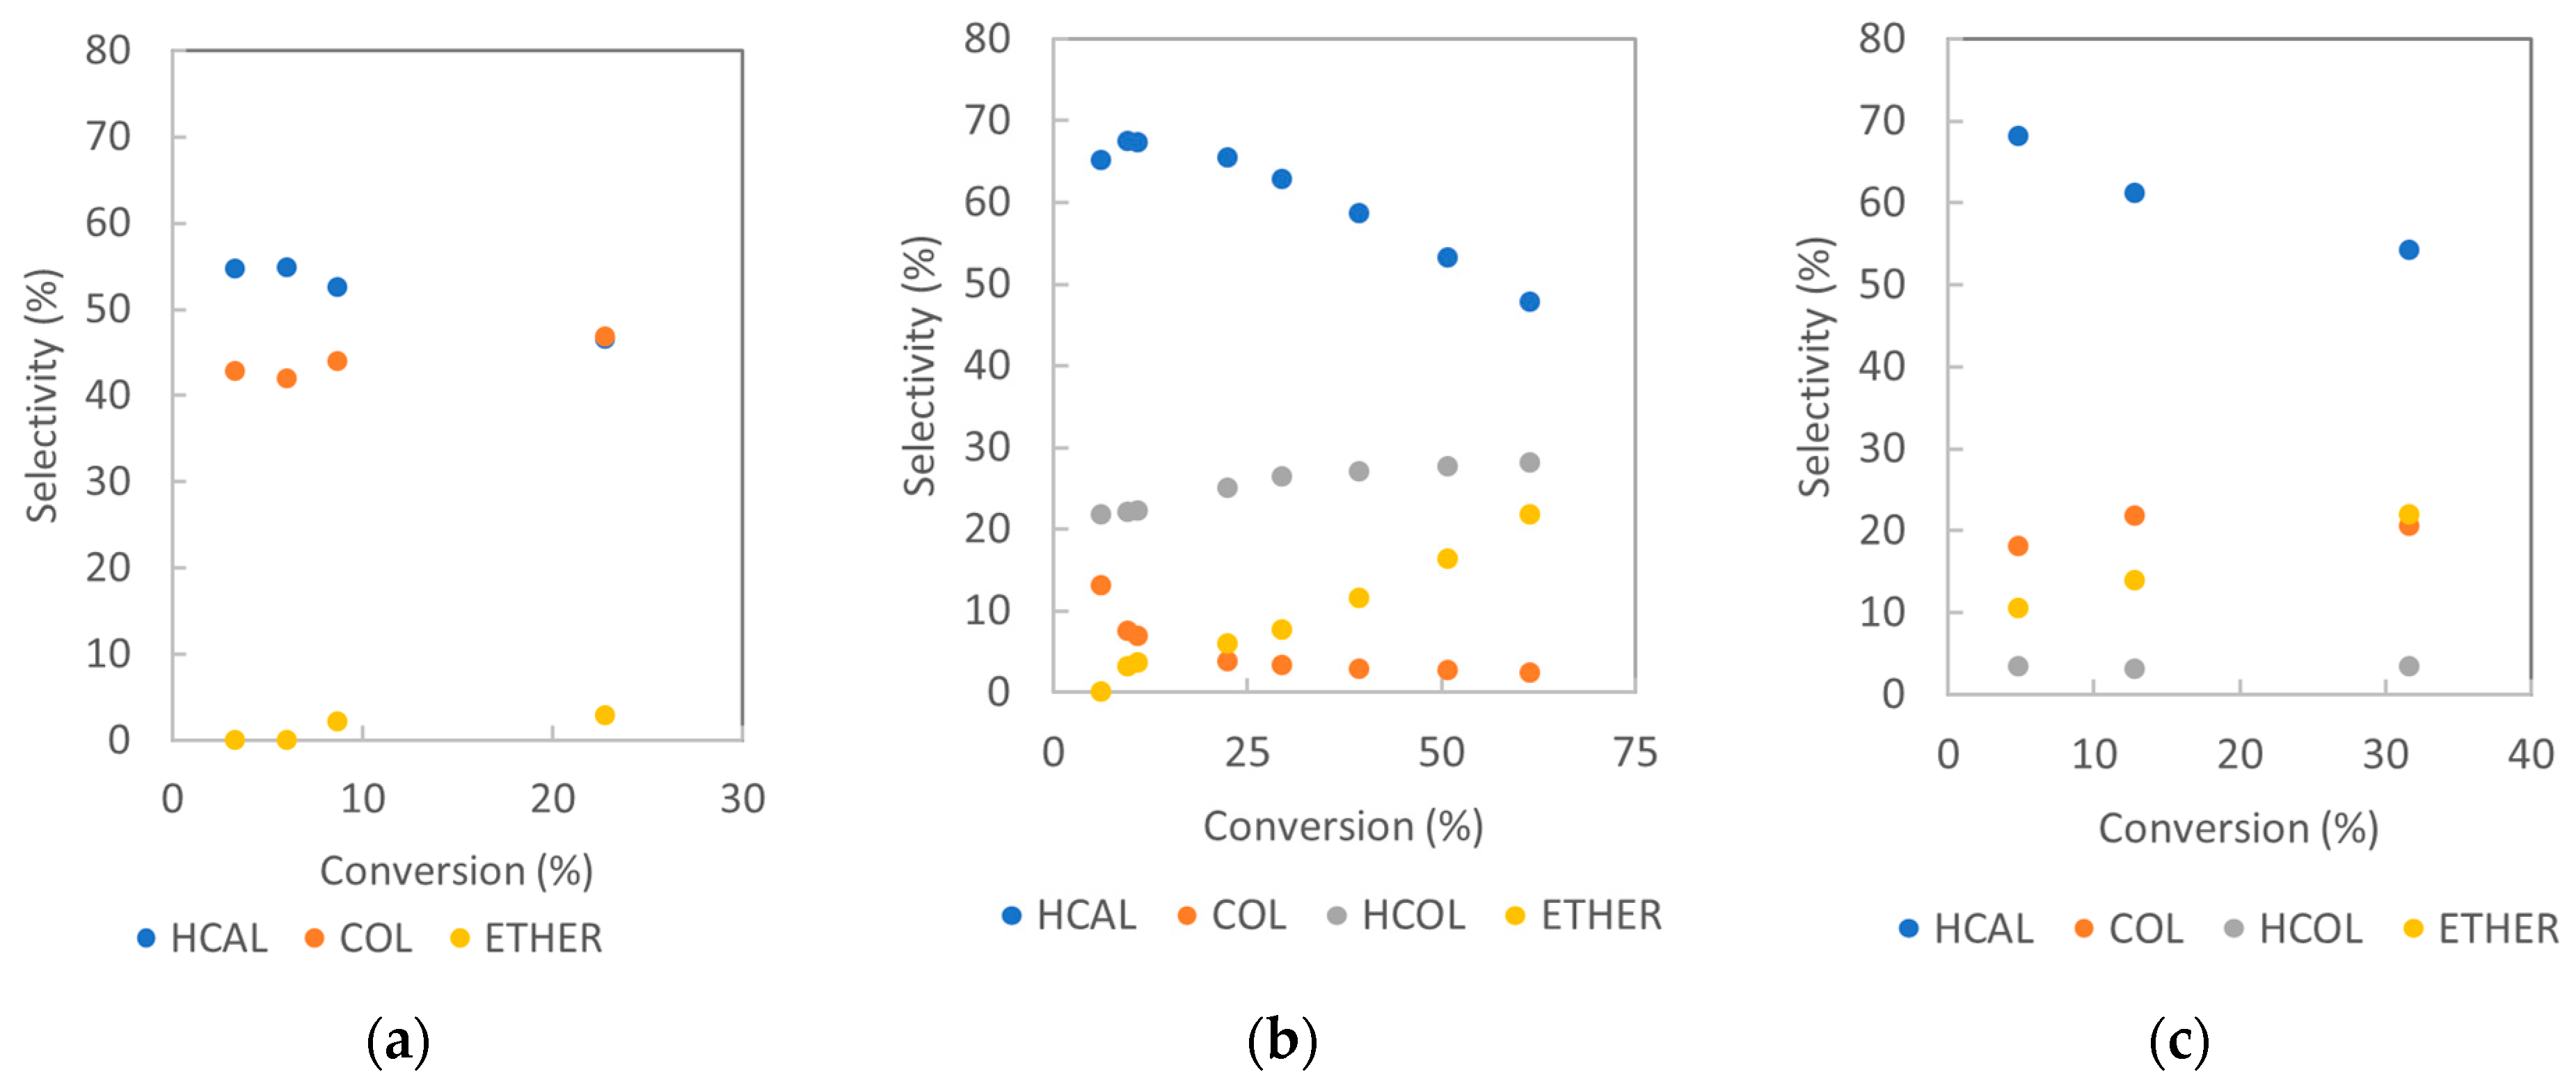
Selectivities toward the formed products as a function of CAL conversion achieved over Pt/rHUGO, Pd/rTOGO, and Rh/rTOGO (experiments with the highest formation of the hydrogenated products) are depicted in Figure 9. It can be observed in all three graphs, that the selectivity toward HCAL is decreasing with the increasing CAL conversion. It could be noted that the decrease in HCAL selectivity is most probably caused by its further transformation into undesired ether.
As mentioned above, COL formation (hydrogenation of C=O) is suppressed over Pd catalysts and selectivity toward this product is decreasing during the reaction while HCOL selectivity is increasing (Figure 9b). It can be suggested that almost all formed COL is further hydrogenated to HCOL. This subsequent hydrogenation of COL to HCOL is very fast since the presence of the HCOL was detected already in the very first samples taken (5 min of the reaction).
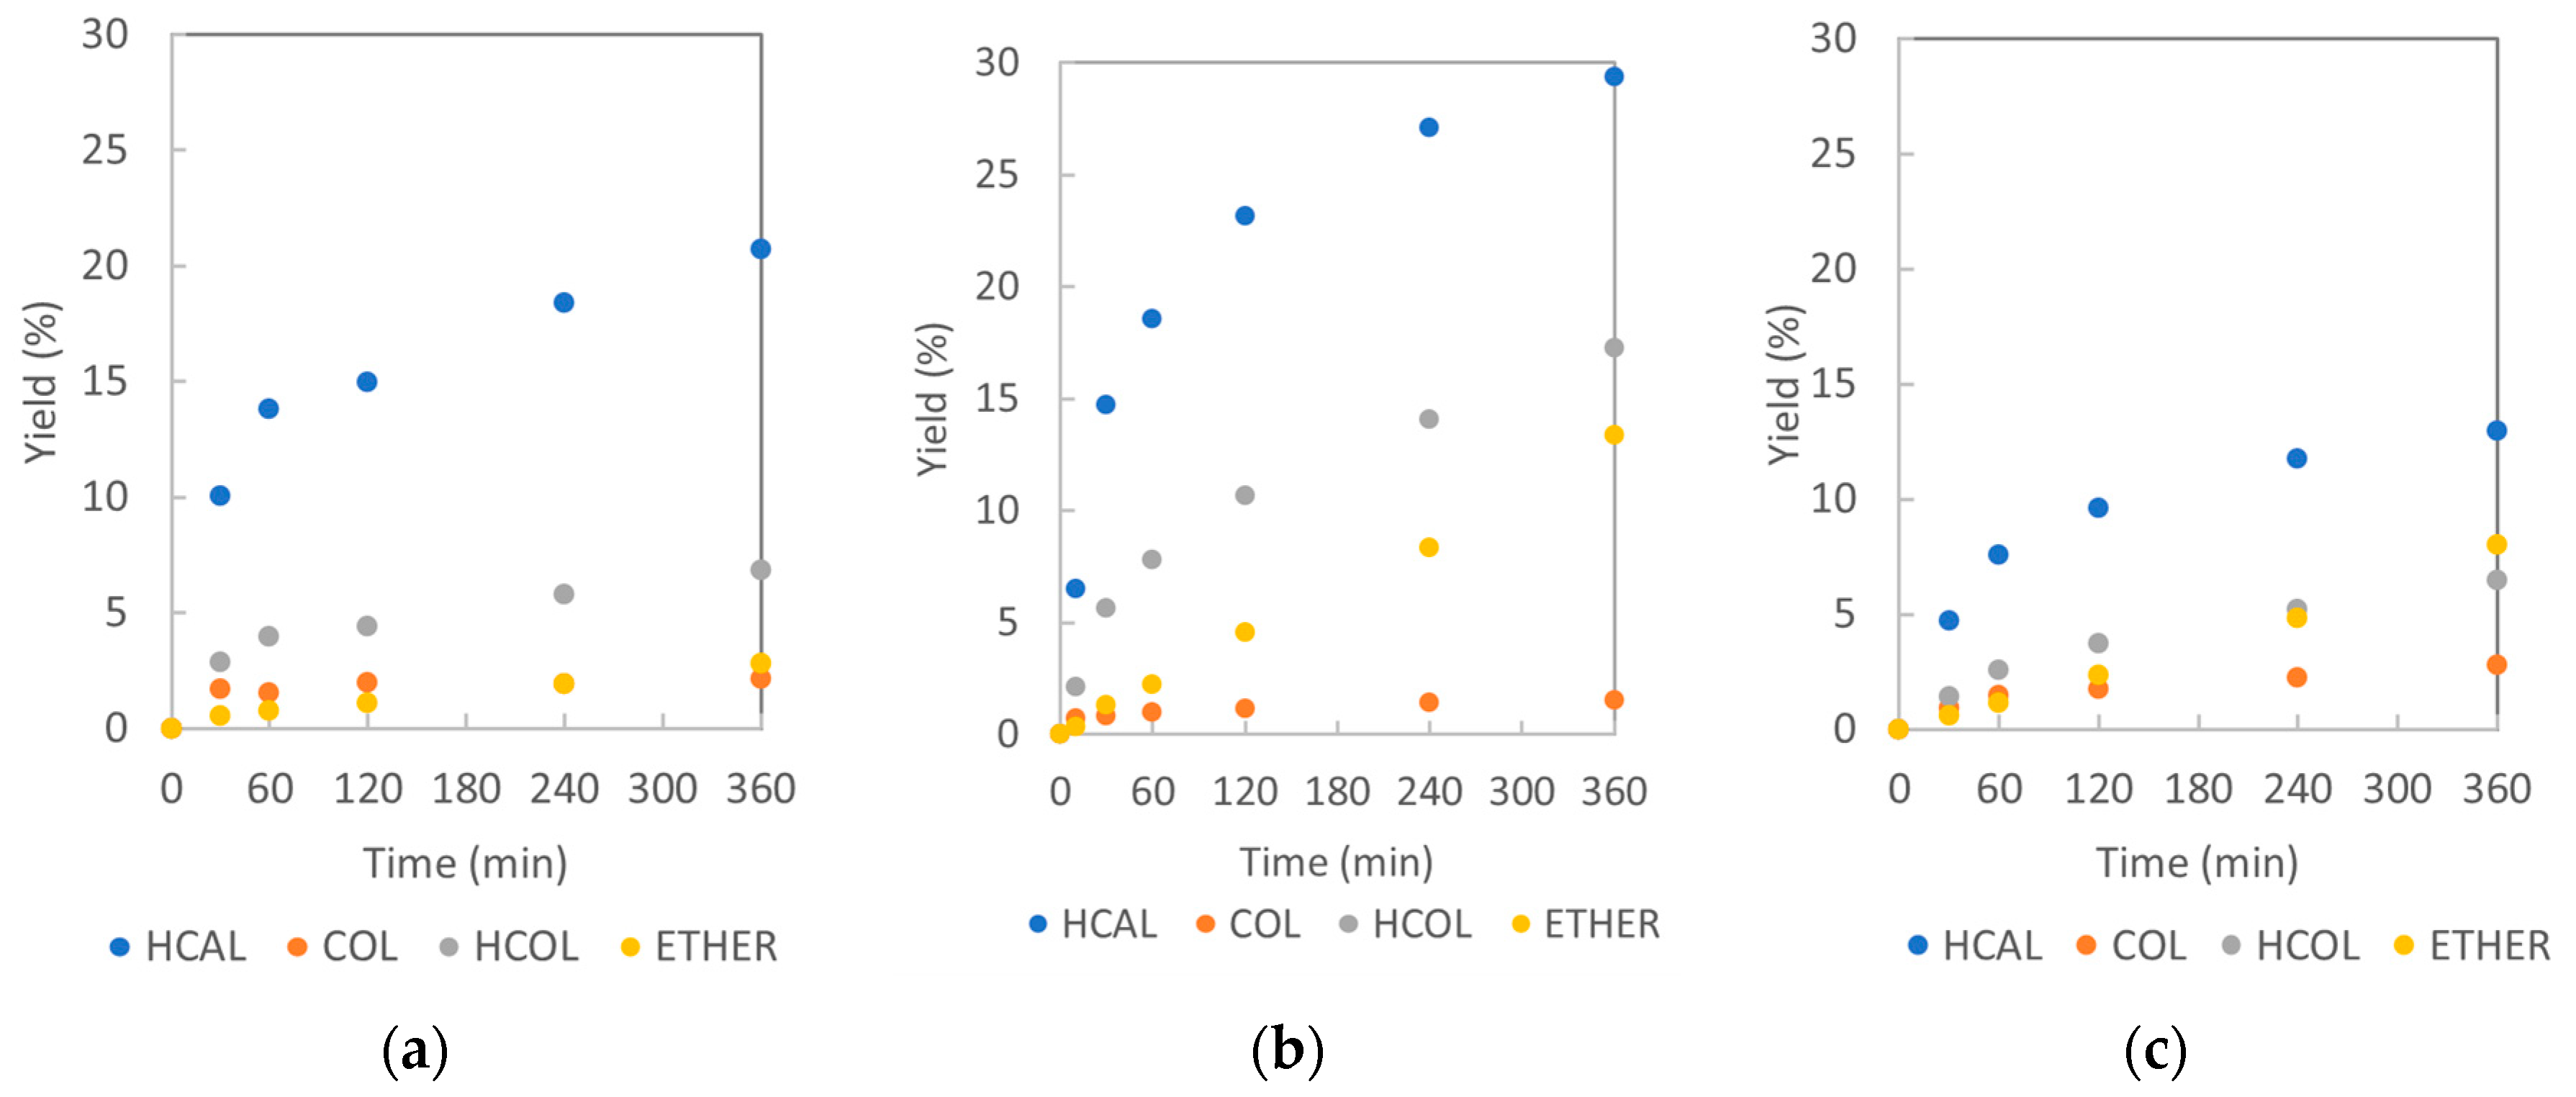
To demonstrate the formation of different products over Pd catalysts in more detail, the graphs depicting the yields of the products in time are attached (Figure 10). HCAL acts as the main product from the beginning of the reaction and its fast formation of HCAL mainly within the first 60 min of the reaction can be observed in experiments over all Pd catalysts. However, HCAL formation slowed down significantly with the reaction time. On the other hand, the concentration of undesired ether is increasing during the whole experiment. The formation of COL follows a similar pattern across all three Pd catalysts: COL is formed only during the first 30 min, after which it is assumed that the rate of COL formation reaches a maximum with its further hydrogenation to HCOL.

2.2.3. Reaction Pathway

Based on the obtained results, reaction pathways of formation of HCOL via COL hydrogenation and of ether via reductive etherification of HCAL could be suggested (Figure 11).
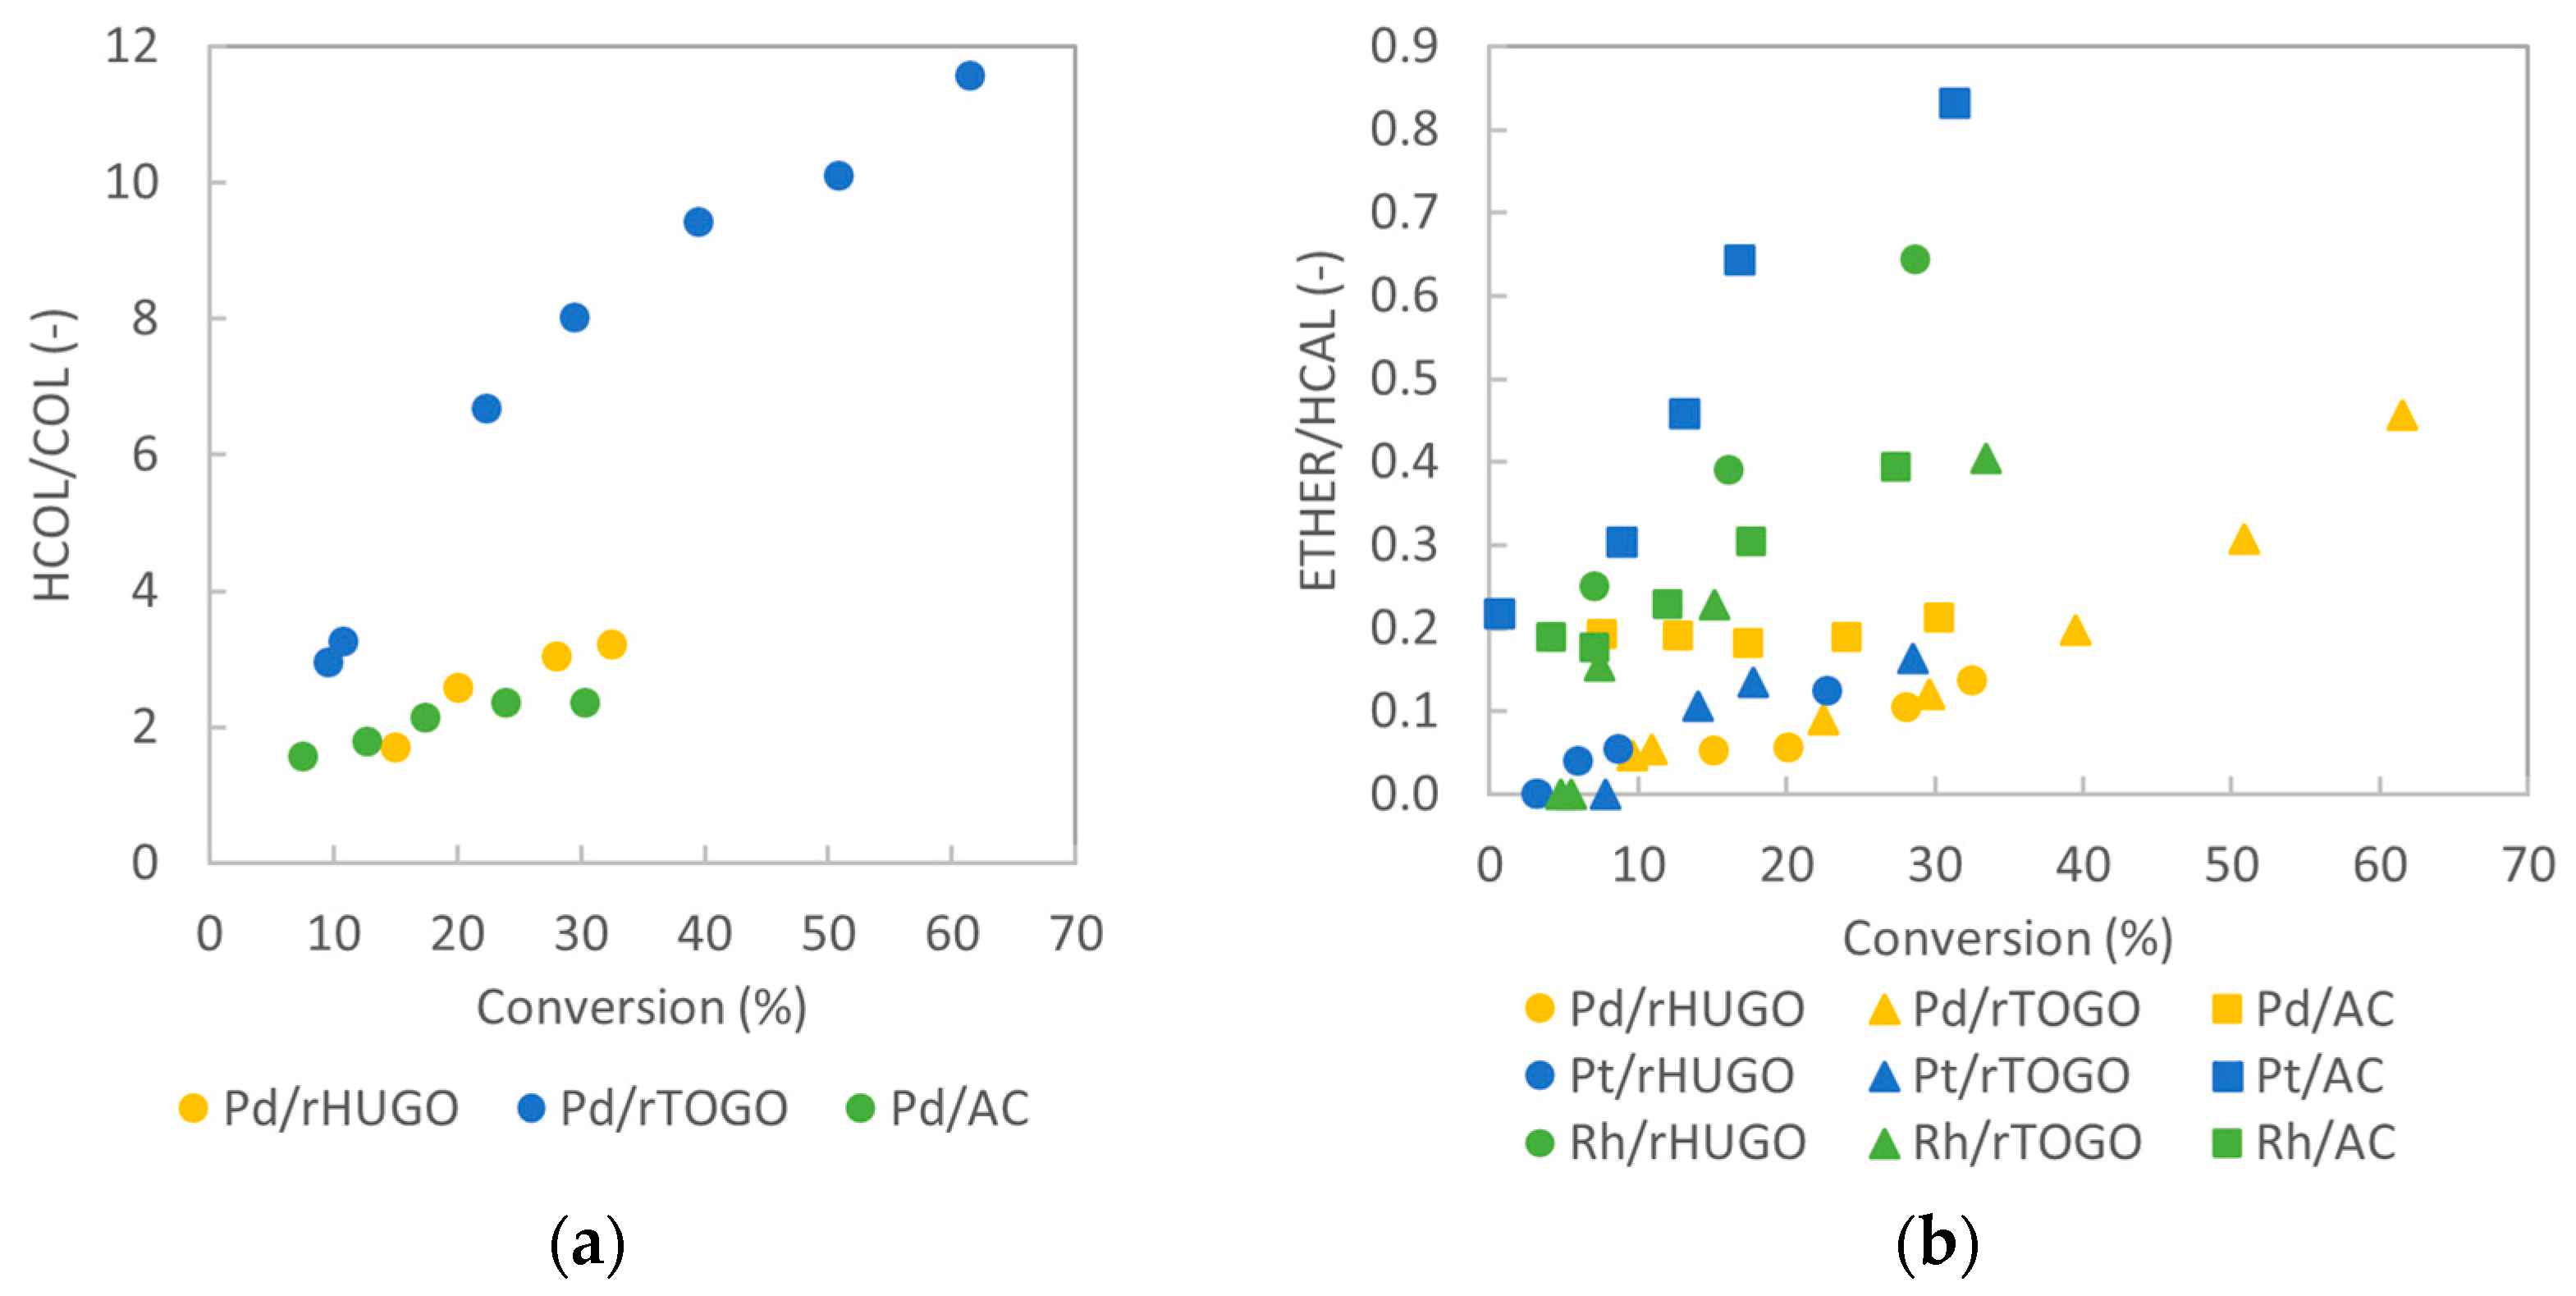
In order to demonstrate suggested reaction pathways, the ratios of selectivities of HCOL to COL and ether to HCAL as a function of CAL conversion are depicted in Figure 12. Both products, HCAL as well as COL, are formed from the beginning of the hydrogenation using Pd catalysts. Additionally, HCOL, the product with hydrogenated both, carbonyl as well as olefinic double bond, is also present in the reaction mixture from the very first sample (5 min, 6% conversion). This fact was surprising because it was expected that the fully saturated product HCOL should be formed via COL and therefore its formation should be at least slightly delayed. This suggests that the transformation of COL to HCOL proceeded very rapidly. The increase of the HCOL to COL ratio can be observed using all Pd catalysts (Figure 12a). In the case of Pd/rTOGO, the initial HCOL to COL ratio was approximately 3 (at 10% CAL conversion). This ratio increased over the course of the reaction, reaching a value where the reaction mixture contained almost 12 times more HCOL than COL. Figure 12b demonstrated formation of undesired ether. The increase of the following ratios can be observed using all catalysts in exception of Pd/AC where ether/HCAL ratio remained constant. A significant amount of formed ether was detected mainly over AC supported catalysts. In particular, ether formation was the most significant over Pt/AC, when ether was determined in the reaction mixture already in the first sample at 1% CAL conversion and also the HCAL ratio reached almost 1 within 360 min of the reaction. Using all other catalysts, formation of ether from HCAL is significant since their ratios are increasing with reaction time, however the ratios barely reach the value of 0.5.

2.3. Catalyst Regeneration and Reuse

The best performing catalyst in CAL hydrogenation, Pd/rTOGO, was further examined for its potential reuse. A comparison was made between the performance of a freshly prepared and reduced catalyst and the catalysts that were filtered after hydrogenation and regenerated by the reduction. The catalyst was subjected to two subsequent reuse cycles.

2.3.1. Regenerated Catalysts: Characterization

The regenerated catalysts were characterized using XRD, SEM with EDS, and TEM.
XRD spectra of the fresh and two regenerated catalysts (after the first and second cycle) are depicted in Figure 13. The diffraction peak observed at 24° 2θ, corresponding to the (002) reflection plane of graphene oxide (GO), confirms the reduction of GO to reduced graphene oxide (rGO) in all three spectra (for the fresh and two regenerated Pd/rTOGO catalysts). This peak appears in all three catalysts and shows a small shift toward higher angles with each catalytic cycle, suggesting a progressive reduction in the interlayer spacing of the rTOGO after each regeneration.
Diffraction peaks typical for Pd are observed in all three samples in positions 40.3°, 46.6°, and 68.5° 2θ at reflection planes Pd (111), (200), and (220), respectively. The diffraction peak at 2θ = 40.3° is sharp and well-defined in the spectrum of the fresh catalyst, indicating the presence of larger Pd particles. In the spectra of both regenerated catalysts, slight shifts in peak position, as well as small changes in peak width and intensity, are observed. The observed changes in peak position, width, and intensity after catalyst regeneration suggest modifications in the Pd particle size and structure, likely associated with partial particle redispersion or the introduction of lattice strain during the regeneration process which was confirmed also using TEM.
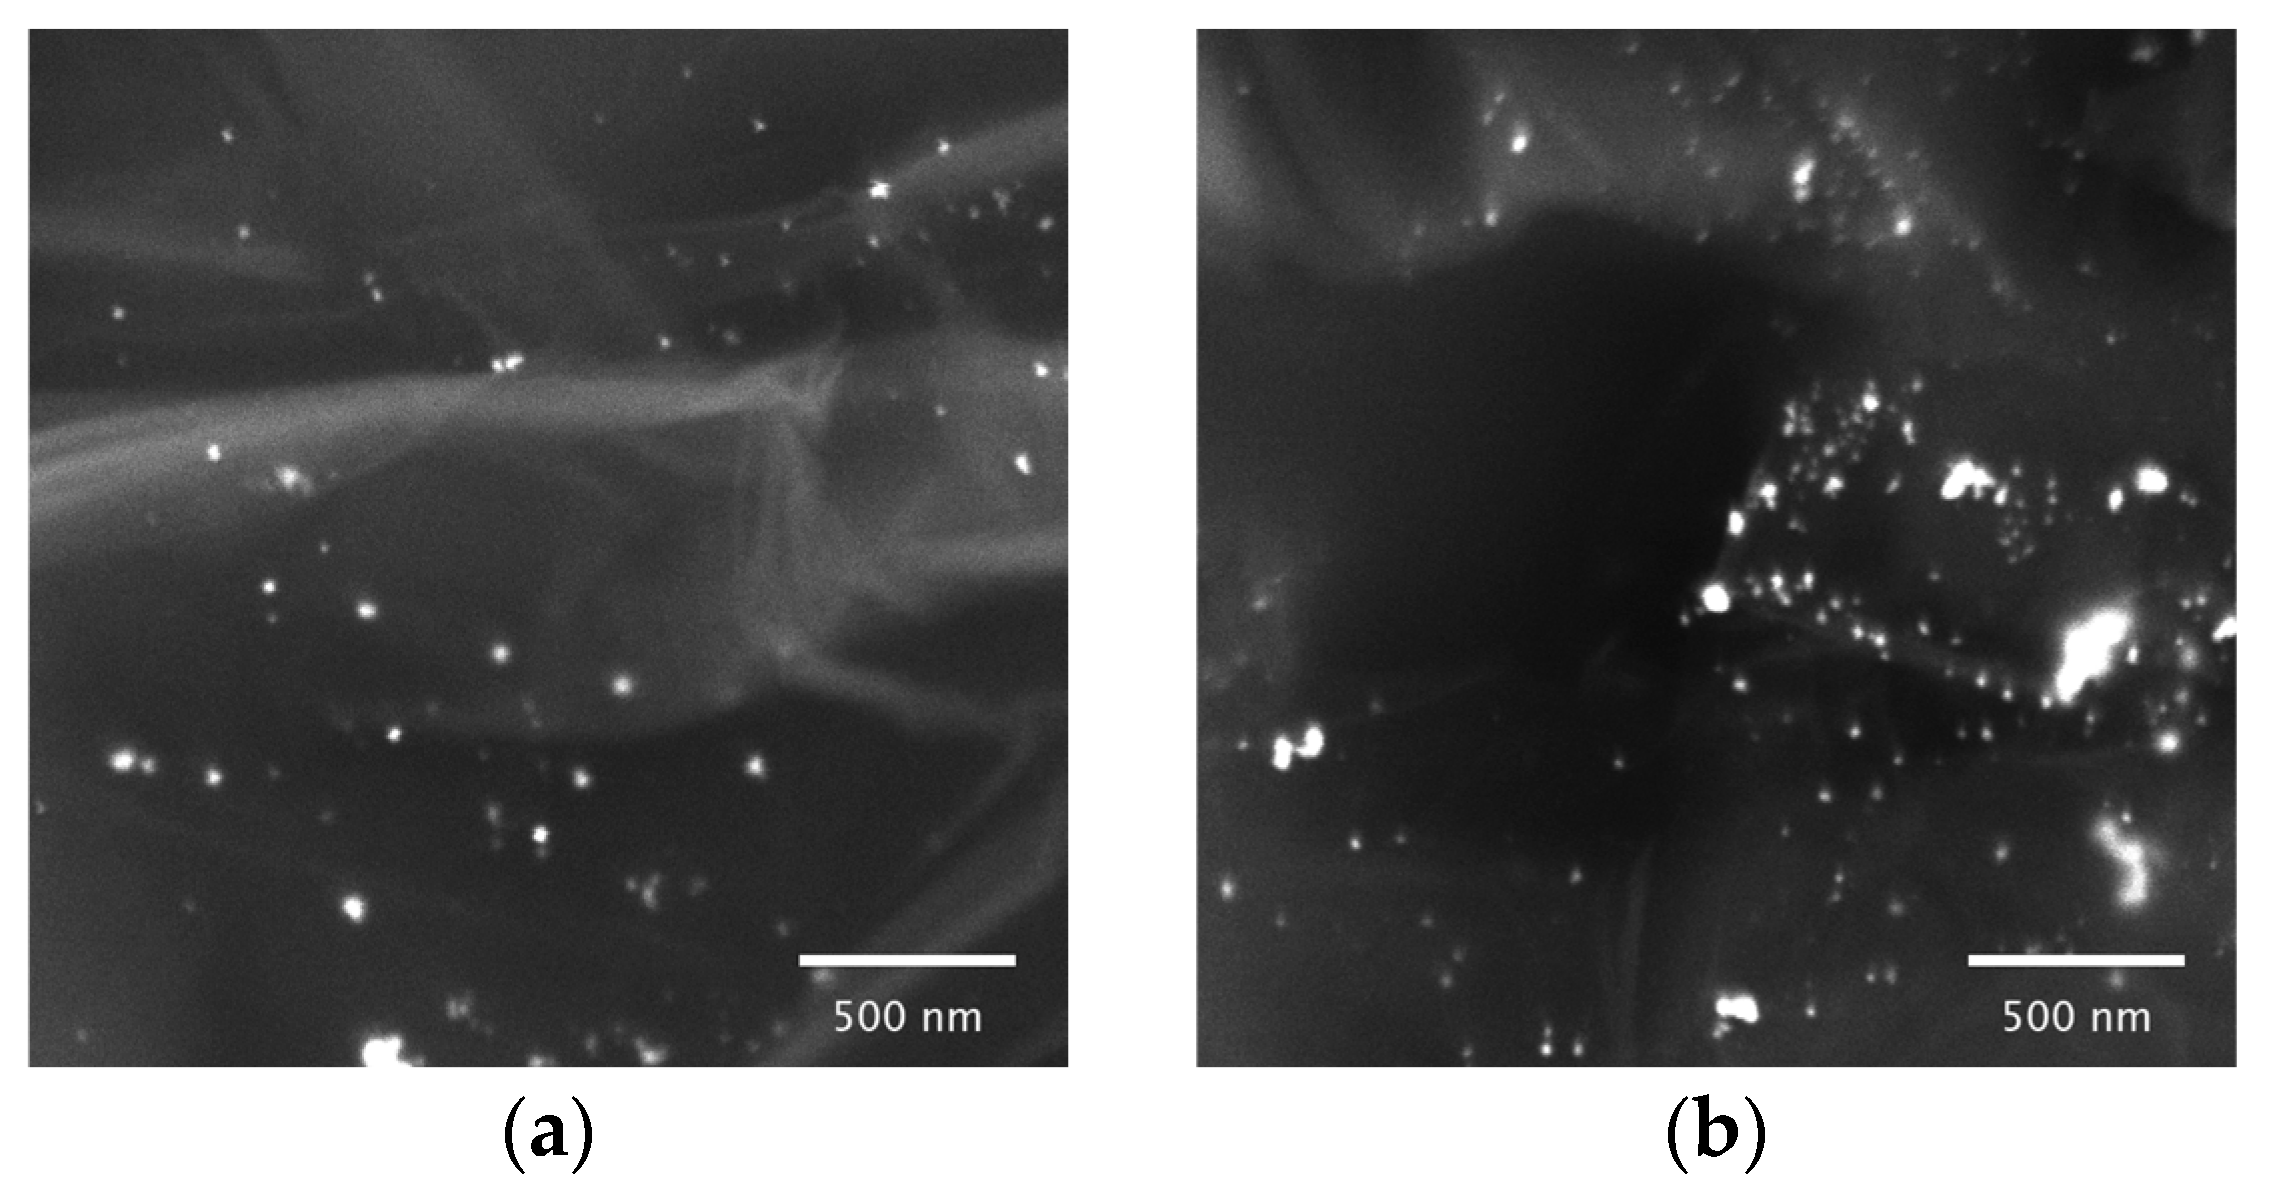
The surface morphology of both used and regenerated catalysts were studied using scanning electron microscopy (SEM, with BSE detector, Figure 14). Additionally, elemental composition of the samples was determined by energy-dispersive X-ray spectrometer (EDS, maps for carbon, oxygen, and Pd are attached in Supplementary Materials, Figure S16). Examination of the surface morphology of the regenerated catalysts reveals the characteristic sheets typical for the 2D structure of rGO and therefore, it can be concluded that no significant changes in surface morphology were observed following either the hydrogenation or the regeneration (reduction) step. As mentioned above, the resolution limit of the microscope is approximately 15 nm; therefore, only the morphology of larger metal nanoparticles (NPs) can be analyzed. Larger Pd particles are visible in the SEM images of all Pd/rTOGO samples (fresh and both regenerated), indicating the presence of particles above the resolution limit of SEM with no significant changes in the morphology of these Pd NPs.
SEM/EDS mapping of the Pd-supported catalysts confirmed the presence of well-dispersed Pd nanoparticles across the rTOGO support for both the fresh and regenerated catalysts (Supplementary Materials, Figure S16). In the case of the fresh catalyst, a few brighter spots were observed in the Pd elemental map, possibly indicating the presence of small Pd clusters or areas with slightly higher local Pd concentration. These features were not observed in the Pd maps of the regenerated catalysts. The Pd content determined by EDS mapping was slightly higher than the nominal loading in the case of the fresh catalyst, reaching 1.7 wt.%. A decrease in Pd content was observed for the regenerated catalysts, with values of 0.9 wt.% after one cycle and 0.7 wt.% after two cycles. This reduction may be attributed to partial leaching or loss of Pd during the catalytic reaction and subsequent regeneration steps, such as filtration and washing.
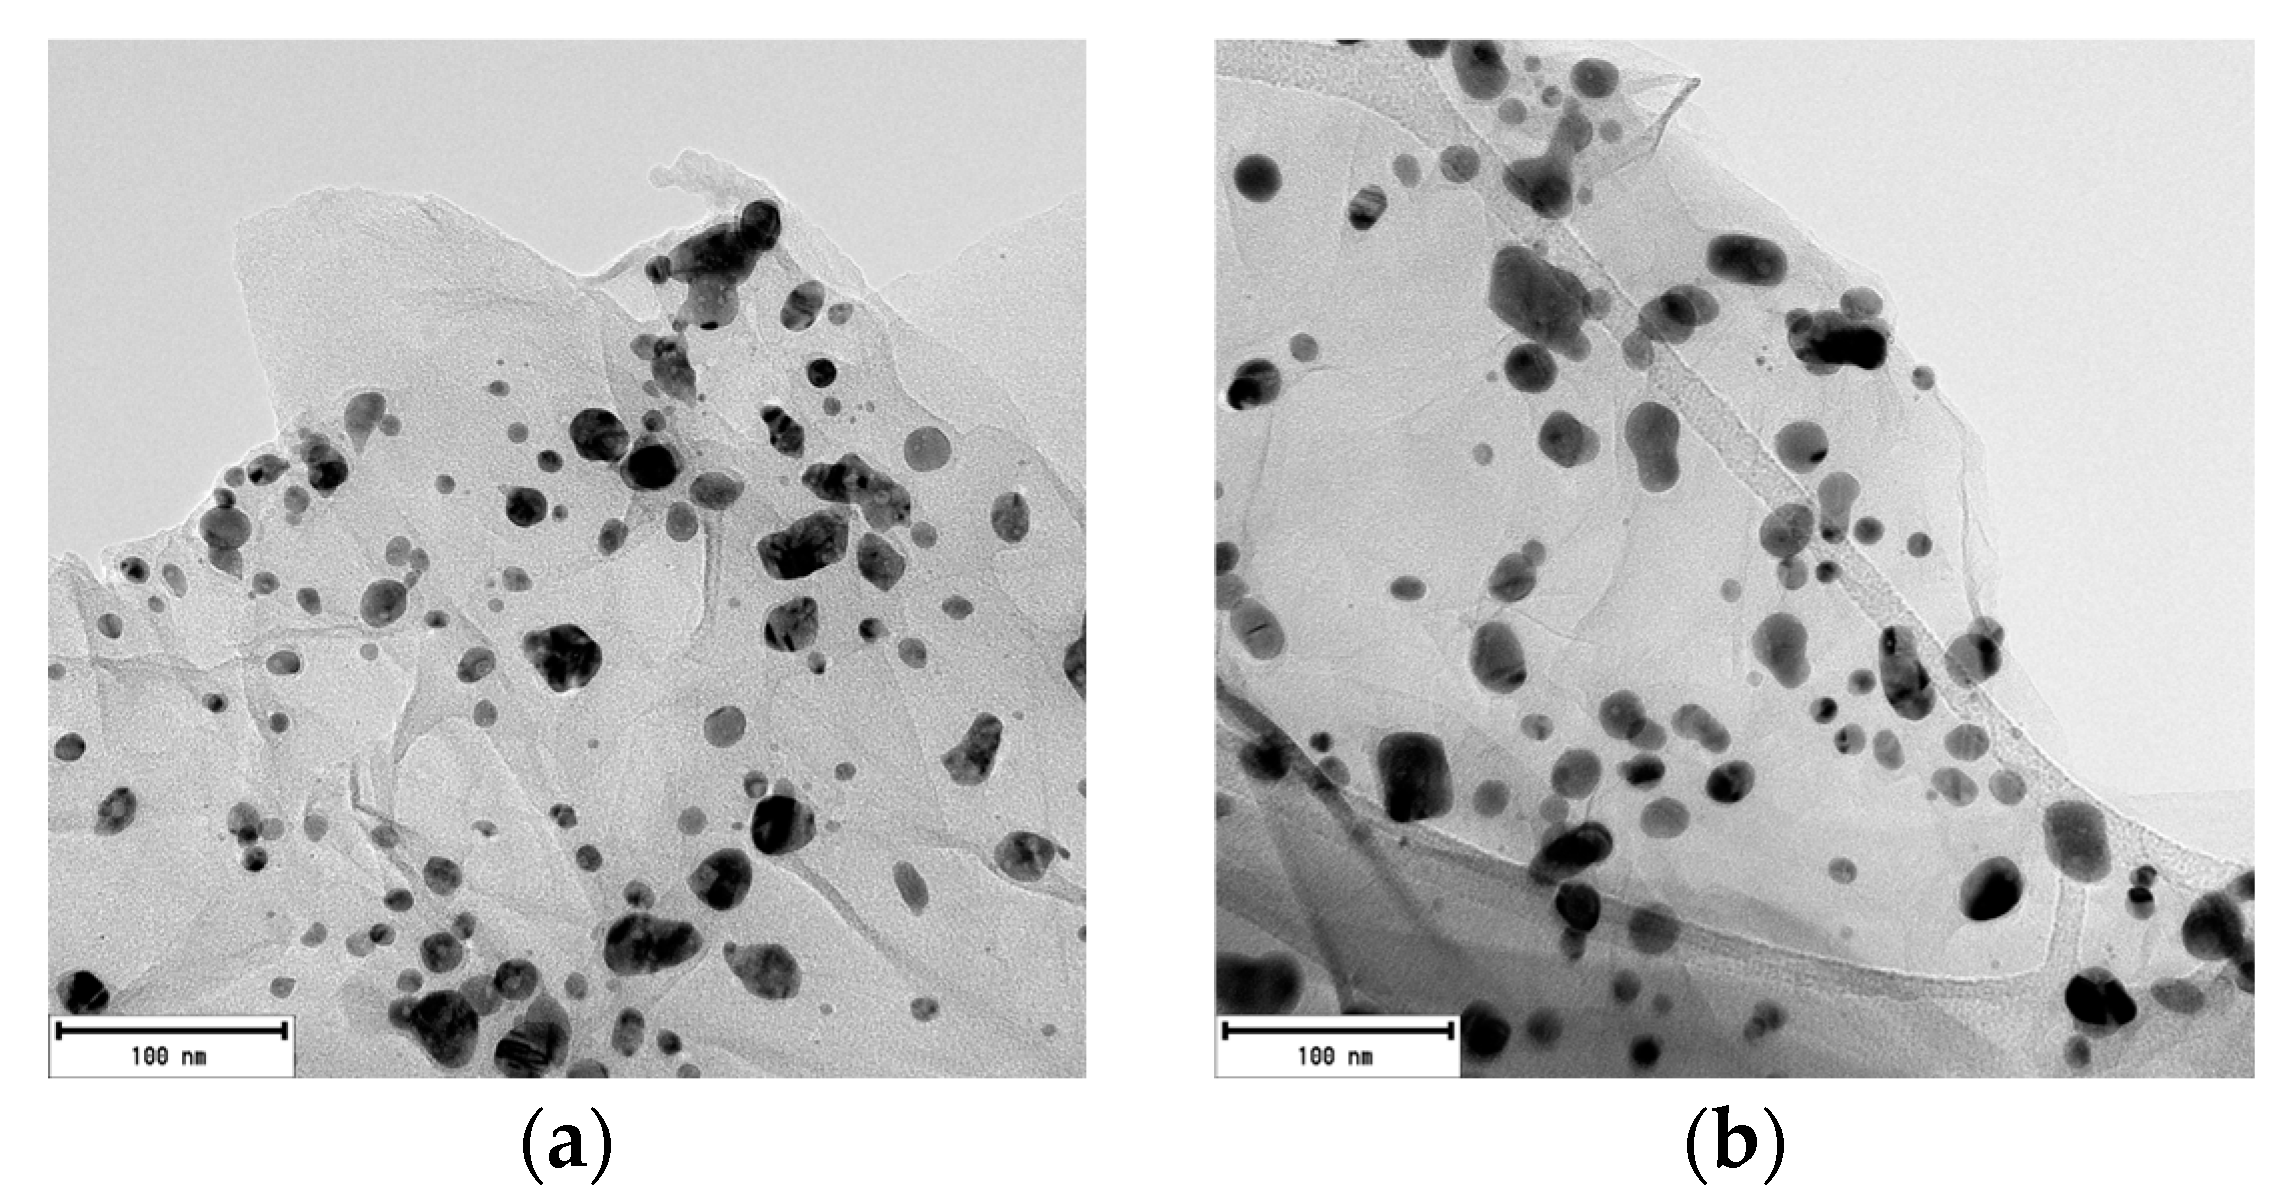
In order to study small Pd NPs in regenerated samples, transmission electron microscopy was used (Figure 15). Palladium NPs as well as 2D sheets of rTOGO are clearly visible on these images. Particle size distribution was calculated based on TEM images with the scale 20–2000 nm is presented in Table 5 and in histograms in Supplementary Materials (Figure S17).
As can be seen from Figure 15 and Table 5, Pd-supported catalysts revealed the presence of bigger NPs compared to Pt, Rh or Ru. The fresh (as-prepared and reduced) Pd/rTOGO catalyst predominantly contained Pd NPs with an average size of approximately 21 nm, ranging from 6 to 30 nm. Surprisingly, significantly smaller Pd NPs were observed on the regenerated catalyst after one catalytic cycle, with an average size of around 10 nm and a range of 2 to 22 nm. After two catalytic and regeneration cycles, the Pd NPs exhibited a slightly increased average size of about 14 nm, with particle sizes ranging from 3 to 30 nm. After one regeneration cycle, the Pd NPs were predominantly in the 2–12 nm range, accounting for approximately 73% of all detected particles. The observed decrease in Pd nanoparticle size from ~20 nm in the fresh catalyst to ~10 nm after one regeneration cycle may be attributed to partial redispersion of Pd species during the hydrogenation or reduction steps. Under reducing conditions in the presence of hydrogen at elevated temperatures, large Pd particles can partially dissolve into atomic Pd species or form mobile sub-nanometric clusters. These mobile species may then re-nucleate and grow into smaller, more dispersed nanoparticles upon cooling. Additionally, mechanical disruption during reaction or filtration and changes in the local chemical environment (e.g., interaction with surface functional groups on rTOGO) may further contribute to breaking up larger particles into smaller ones. The presence of smaller Pd NPs after regeneration was already suggested by XRD analysis. These observations may also explain the slightly larger Pd nanoparticles detected after the second cycle. It is likely that the initially redispersed Pd species gradually sintered or coalesced during the second reduction step, resulting in the formation of slightly larger particles. This suggests a dynamic restructuring of Pd nanoparticles during repeated regeneration, where redispersion in the first cycle is followed by partial particle growth in the subsequent cycle.

2.3.2. Regenerated Catalysts: Cinnamaldehyde Hydrogenation

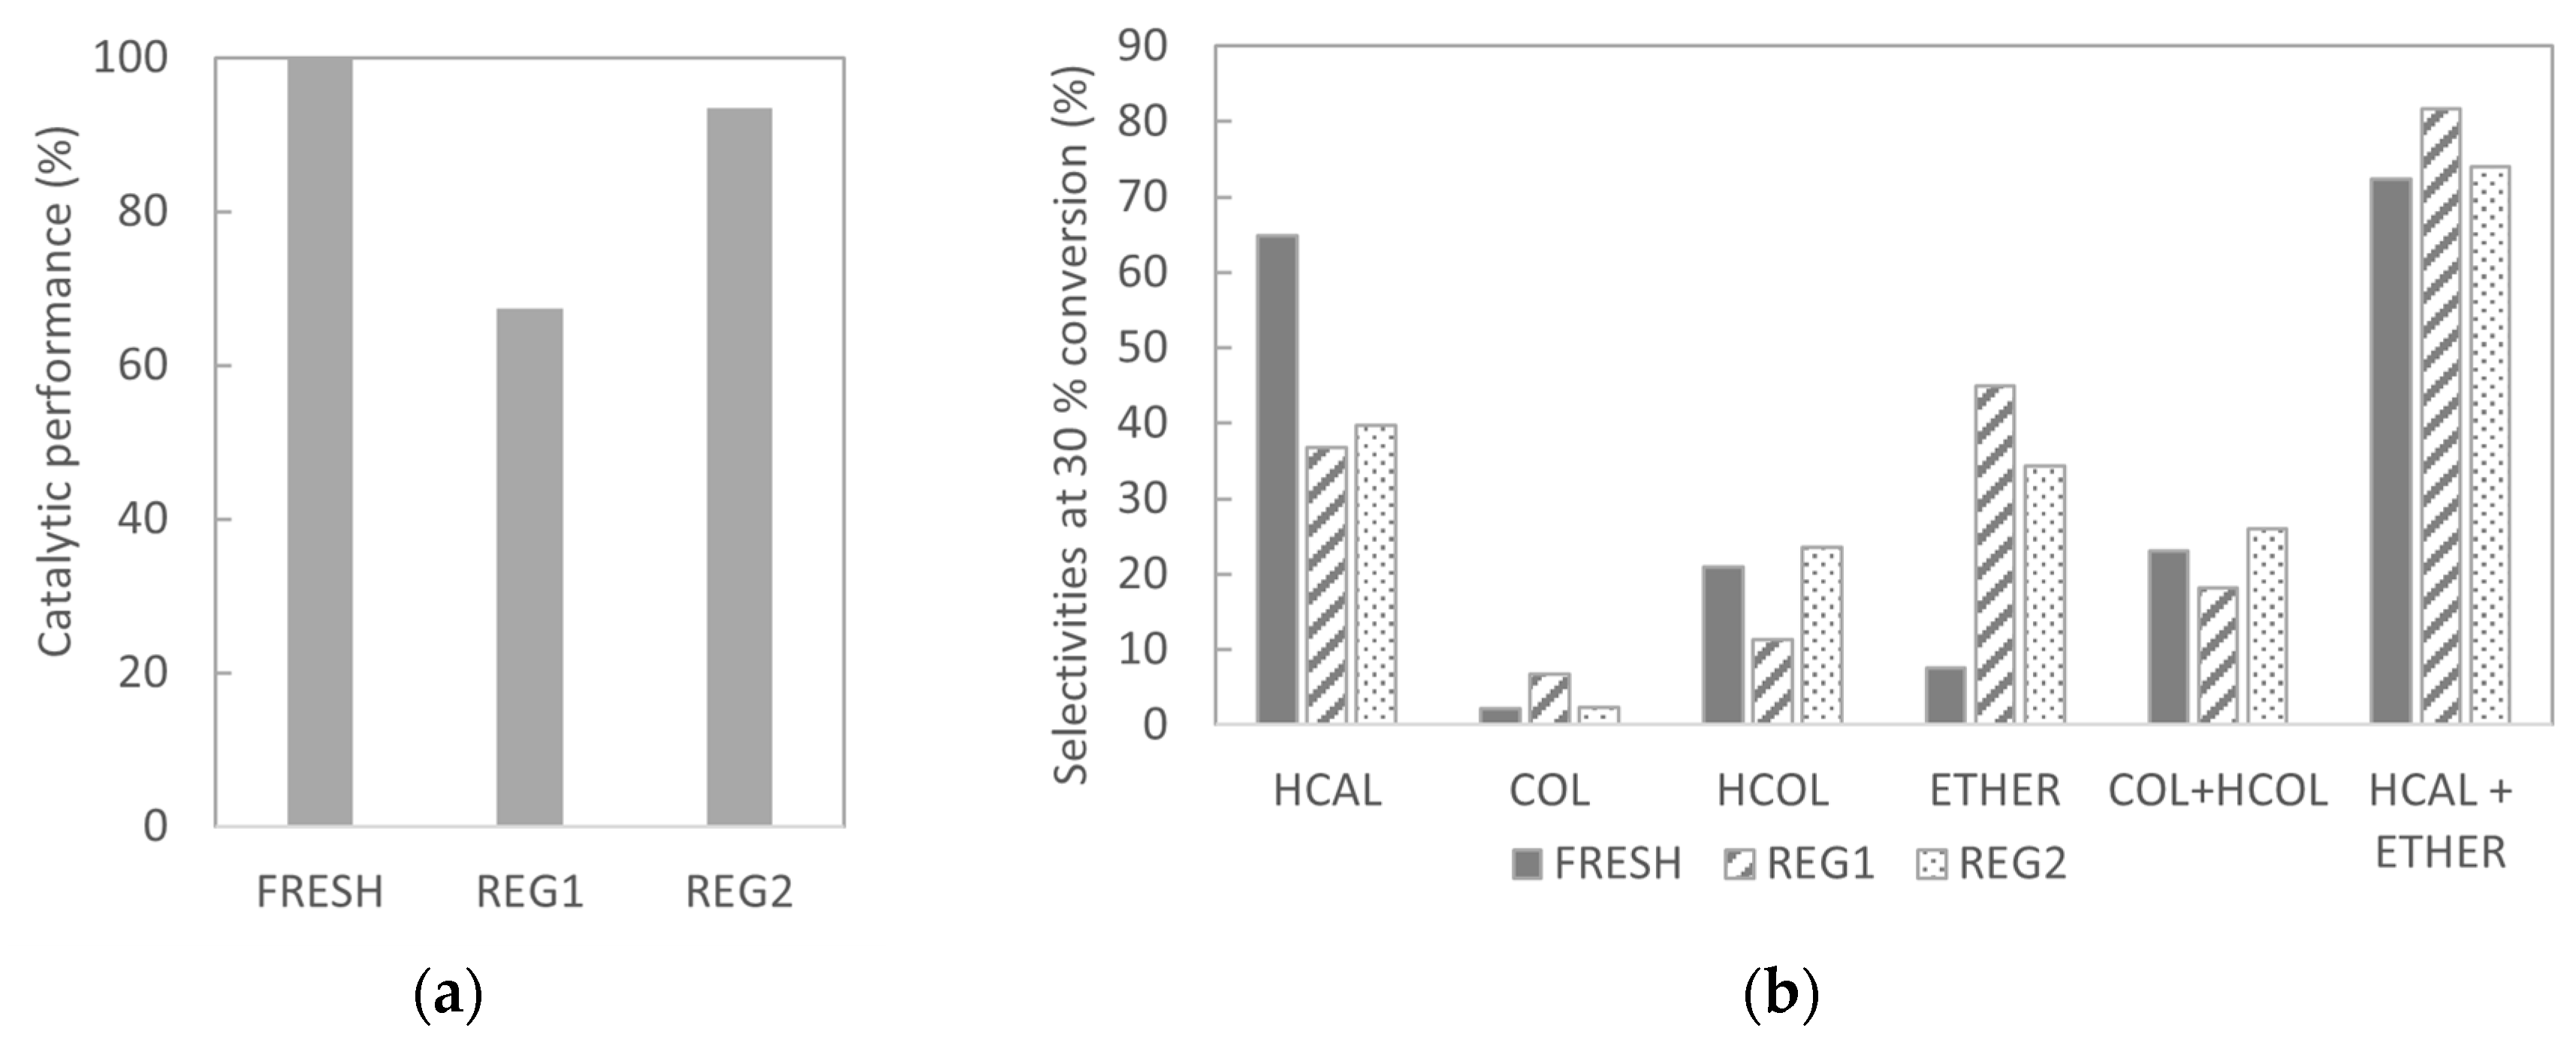
The catalytic performance of the fresh Pd/rTOGO catalyst and the two regenerated catalysts is compared in Figure 16. A significant decrease in activity, approximately 30%, is observed after one catalytic cycle followed by regeneration (Figure 16a). Interestingly, the catalyst performance improves in the second cycle, showing only a slight decrease in CAL conversion (about 7%) compared to the fresh catalyst. These differences in catalytic activity can be correlated with changes in Pd NPs size. Surprisingly, higher CAL conversion appears to be associated with the presence of larger Pd NPs. The fresh catalyst, which exhibited the highest activity, contained Pd NPs averaging around 20 nm. In contrast, the lowest activity was observed after the first regeneration, where the average Pd NP size was reduced to ~10 nm. After the second regeneration, the average particle size increased to ~14 nm, which is consistent with the observed recovery in catalytic activity.
The changes in reaction selectivities achieved were over regenerated catalysts, as depicted in Figure 16b (selectivities compared at a 30% conversion level). A significant decrease in the selectivity toward hydrocinnamaldehyde (HCAL) was observed after catalyst regeneration. The HCAL selectivity dropped from 65% for the fresh catalyst to approximately 38% for both regenerated catalysts. Additional differences in product distribution were also noted for the regenerated samples. However, based on the proposed reaction pathways, where hydrocinnamyl alcohol (HCOL) forms via hydrogenation of cinnamyl alcohol (COL), and ether is produced through the reductive etherification of HCAL, the product groups COL + HCOL and HCAL + ether were summed and are presented in Figure 16b. These groupings reveal only minor differences in the relative contributions of the two competing reaction pathways. The results clearly suggest that, in the case of the regenerated catalysts, the transformation of HCAL to ether proceeds more efficiently. Conversely, the hydrogenation of COL to HCOL occurs at comparable rates across the fresh and both regenerated catalysts. The most pronounced formation of ether was observed for the catalyst after one regeneration cycle. This may explain the notably lower CAL conversion for this sample, likely due to active catalytic sites being increasingly occupied by the secondary transformation of HCAL to ether. As a result, fewer sites remain available for the initial hydrogenation of CAL.
The observed correlation between Pd particle size and catalytic performance suggests that both activity and selectivity in CAL hydrogenation are size-dependent. Larger Pd NPS, such as those present in the fresh catalyst (~20 nm), exhibit higher activity, possibly due to a greater abundance of low-index crystalline facets that facilitate the activation of the C=C or C=O bonds in CAL. This structural feature may also contribute to higher selectivity toward the intermediate product HCAL. In contrast, after the first regeneration cycle, the average Pd particle size decreased to ~10 nm, which coincided with a significant drop in both CAL conversion and HCAL selectivity. This could be due to smaller Pd NPs providing a higher proportion of undercoordinated surface atoms, which may favor secondary reactions, such as the reductive etherification of HCAL to ether. This shift in reaction pathway could result in active site occupation by secondary transformation steps, reducing availability for CAL hydrogenation. After the second cycle, Pd particle size increased slightly (~14 nm), and a partial recovery in catalytic activity was observed, further supporting the size–performance relationship. Overall, these results indicate that Pd particle size plays a crucial role not only in determining the overall hydrogenation rate but also in influencing product distribution by selectively promoting or suppressing subsequent transformation steps.
The possibility of reusing the Pd/rTOGO catalyst was confirmed, as it retained significant catalytic activity and selectivity even after two hydrogenation–regeneration cycles; however, the control of Pd nanoparticle size is crucial for achieving high selectivity toward HCAL, which appears to be influenced probably by the conditions applied during the reduction of the reused catalyst.

3. Materials and Methods

Activated carbon (Norit SX2), cinnamaldehyde (trans-cinnamaldehyde, 97%) and metals precursors (H2PtCl6, PdCl2, RuCl3·3H2O, Co(NO3)2·6H2O, RhCl3) were supplied by Merck KGaA (Darmstadt, Germany) and used as obtained. Ethylene glycol (G. R.) and isopropyl alcohol (G. R., iso reagent) was supplied by Lach-Ner, s.r.o. (Neratovice, Czech Republic) and mesitylene (puriss., >99.0%) by Fluka (Buchs, Switzerland). All chemicals were used as obtained.

3.1. HUGO and TOGO Syntheses

HUGO was prepared by the common Hummer’s method [51]. Graphite powder (5.0 g) was mixed with sodium nitrate (2.5 g) and concentrated sulfuric acid (115 mL) at 0 °C and the mixture was stirred for 30 min. Then potassium permanganate (15 g) was added under stirring and cooling. The following step included stirring and heating up to 35 °C for 30 min to thicken the reaction mixture into the paste. Then deionized (DI) water (250 mL) was slowly added, and the obtained mixture was heated to 70 °C for 15 min. After that, the reaction was terminated by the addition of a large amount of DI water (1 L) and 3% of H2O2 solution. The color change from black to bright yellow was observed. The obtained material was washed in DI water in order to remove the metal ions and repeatedly centrifugated. The washing was repeated until a negative reaction on sulphate ions was confirmed. The final dry HUGO powder was obtained by lyophilization.
TOGO sheets were synthesized following Tour’s method [52]. Graphite powder (3.0 g) and potassium permanganate (18.0 g) were added to the mixture of concentrated sulfuric (360 mL) and phosphoric acids (40 mL). The reaction mixture was heated to 50 °C and stirred for 12 h. The mixture was then cooled down by transferring it into a flask with ice (400 mL) and H2O2 (3 mL). The final solid material was obtained by filtration followed by purification by multiple washing process with deionized water, hydrochloric acid, and ethanol. The final dry TOGO powder was obtained by drying in vacuum oven at room temperature.

3.2. Synthesis of Metal Supported Catalysts

Metal supported catalysts were prepared by wet impregnation with chemical reduction by ethylene glycol. Appropriate amount of 0.04 M solution (1 wt.% = metal nominal loading) of metal precursor (H2PtCl6, PdCl2, RuCl3·3H2O, Co(NO3)2·6H2O, RhCl3) was mixed with 0.2 g of supporting material (HUGO, TOGO or AC), 40 mL of ethylene glycol and 15 mL DI water. This mixture was then kept under ultrasound radiation for 4 h in order to achieve high exfoliation of graphene oxide sheets and high dispersion of metals nanoparticles. The mixture was then transferred into the oil bath and stirred under the reflux (120 °C) for 20 h. After cooling, the final catalyst was obtained by filtration, washing using DI water and drying in vacuum oven at 60 °C. Activation of all catalysts was performed by reduction in the oven in the stream of hydrogen and nitrogen. The reduction conditions for different metals were following: Pt catalysts 250 °C, pure H2, 2 h; Pd catalyst 350 °C, H2/N2 = 40/60, 2 h; Rh catalyst 150 °C, H2/N2 = 40/60, 1 h; Ru catalysts 350 °C, H2/N2 = 40/60, 2 h; Co catalyst 250 °C, pure H2, 2 h. Temperature ramp was 250 °C/h, only in the case of Rh catalysts it was 150 °C.

3.3. Catalyst Characterization

X-ray diffraction method was used to determine crystallinity of the prepared catalysts. The measurement was performed at room temperature using powder diffractometer Bruker-Phaser 2nd Generation equipped by CuKα radiation (λ [CuK-α1] = 1.54056 × 10⁻¹ nm, λ [CuK-α2] = 1.54443 × 10⁻¹ nm). Data were collected using ultrafast 1D detector PIXCEL in 2θ range 4.99–90.019° 2θ with time step 0.2 s and the total measurement time 886.4 s. Evaluation of the obtained data was done using program HighScore Plus 4.0.
Quantitative element analysis of prepared catalysts was performed using fully automatic sequential XRF spectrometer Axios (Malvern Panalytical B.V., Almelo, Netherlands). XRF spectrometer was equipped with Rh tube, 4 kW generator, 3 collimators, 8 crystals (PX1, PX4a, PX5, PX7, PE002, Ge 111, LiF 200, LiF 220), and 2 detectors- proportional and scintillation. Standardless analysis was done with program Omnian (version 5.0L).
The specific surface areas of the prepared catalysts were determined via nitrogen adsorption–desorption measurement using NOVA 2000e surface area and pore size analyser (Quantachrome Instruments, Anton Paar GmbH – Headquarters, GRAZ AUSTRIA). Helium was used for the calibration of the measuring cells. The samples were outgassed at 150 °C for 3 h before each measurement. The BET equation was used for calculating the specific surface area of the catalysts.
Morphology and elemental composition of the catalysts surface was studied scanning electron dual-beam microscope TESCAN LYRA3GMU (TESCAN, Brno, Czech Republic) with a field emission gun (FEG). Elemental analyses and radial profiles were determined using energy-dispersive X-ray spectrometer (EDS) with 80 mm2 SDD detector (X-MaxN, Oxford instruments, Abingdon, Oxfordshire, England) and AZtecEnergy software (version AZtech 3.3 SP1).
Particle size measurement was performed on images from a transmission electron microscope. Images were acquired at EFTEM Jeol 2200 FS (JEOL, Tokio, Japan) with electron source ZrO/W Schottky emitter (FEG) on TEM mode, under condition: 200 kV acceleration voltage, 10 kx, 25 kx, 50 kx, 100 kx, 250 kx, 500 kx, and 800 kx magnification. Particle size was measured using the ImageJ software (version 1.54 m). At least 50 particles were selected for each sample. Particle size distribution and mean size were calculated.

3.4. Cinnamaldehyde Hydrogenation

Hydrogenations were performed in a batch operated high pressure autoclave reactor Parr (volume 50 mL). A reaction mixture containing 1 g of cinnamaldehyde, 15 mL of isopropyl alcohol, 150 µL of mesitylene (internal standard) and 10 mg of the catalyst was closed in the autoclave and flushed three times by nitrogen and once by hydrogen. Hydrogenation reactions were performed under vivid stirring (800 rpm) at 80 °C and 1 MPa of hydrogen. Samples were taken in set reaction times (30, 60, 120, 240, and 360 min) via sampling capillary and analyzed using GC (SHIMADZU GC 2014, Kyoto, Japan, with FID detector a capillary column SPB5 with length 30 m, width 0.32 mm a stationary phase 0.25 µm). The GC oven temperature was initially set at 70 °C and held for 5 min. Subsequently, the temperature was increased at a rate of 20 °C/min to 250 °C, where it was held for an additional 1 min. Hydrogen was used as the carrier gas with constant flow 3.19 mL/min. Calibration for cinnamaldehyde (CAL), cinnamyl alcohol (COL), and hydrocinnamaldehyde (HCAL) was performed using mesitylene as an internal standard.
The tested catalysts were evaluated from the point of their activity (conversion after 360 min, reaction rates) and their selectivities toward hydrogenation products.
Conversion of cinnamaldehyde (%):
x t = c C A L ,   0 c C A L ,   t c C A L ,   0 · 100 %
Selectivity towards product (%):
S i = n i ,   t n p r o d u c t s , t · 100 %
Reaction rate (mmol·L−1·min−1):
r 0 = c C A L ,   0 c C A L , t 1 t 1 r t = c C A L ,   t 2 c C A L , t 3 t 3 t 2
In the equations cCAL,0 and cCAL,t are initial and actual concentration of cinnamaldehyde (mmol/L), ci,t is actual concentration of selected product (mmol/L), ni,t is actual number of moles of selected product (mmnol), t is reaction time (min), t1 is reaction time for calculating of initial reaction rate (30 min in this case, which is time of taking the first sample), ro is initial rection rate (mmol/(L·min)), and rt is reaction rate at higher reaction times (mmol/(L·min)). Neither catalysts mass, nor metal loading are taken into the account in calculations of the reaction rates, since these values were the same for all tested catalysts (being 10 mg of catalyst with 1 wt.% nominal metal loading).

3.5. Catalyst Regeneration

The best evaluated catalyst, Pd/rTOGO was subjected the regeneration tests. The catalyst used in the CAL hydrogenation was after the reaction filtrated from the reaction mixture, dried in vacuum oven overnight and reduced under the same reduction conditions as freshly prepared catalysts (oven, 350 °C, H2/N2 = 40/60, 2 h). In order to evaluate possible catalyst regeneration, this procedure was repeated in two cycles.
The regenerated catalysts were characterized using XRD, SEM/EDS, and TEM.
The hydrogenation reactions with regenerated catalysts were performed under the same reaction conditions as with the fresh catalysts.

4. Conclusions

A series of hydrogenation catalysts based on Pt, Pd, Rh, Ru, and Co supported on 2D reduced graphene oxide (rHUGO and rTOGO) and conventional activated carbon were prepared and characterized. Their catalytic activities and product selectivities in cinnamaldehyde (CAL) hydrogenation were evaluated and correlated with their physicochemical properties, with emphasis on metal selection and support type.
XRD confirmed the successful reduction of GO and structural differences between 2D and 3D supports. XRD and TEM revealed that Pt and Ru formed well-dispersed small nanoparticles (2–4 nm for Pt, ~2 nm for Ru), particularly on rGO, indicating strong metal–support interactions. Pd formed significantly larger particles (up to 24 nm), especially on rGO, suggesting weaker interactions. Rh formed 3–4 nm particles, while Co exhibited the largest particles (up to 50 nm), especially on rGO.
Catalytic testing demonstrated that metal choice strongly influenced activity, with Pd and Pt being the most active. Pd/rTOGO showed the highest CAL conversion (62% at 360 min), followed by Pt-supported catalysts (>20% conversion). Rh, Ru, and Co catalysts exhibited lower activity. Among supports, rTOGO yielded the highest conversions, especially for Pd. Pd/rTOGO showed superior initial activity over Pd/AC (62% vs. 30%), though this came with faster deactivation. Over time, the performance of Pd/rTOGO and Pd/AC became comparable. For Pt, Rh, Ru, and Co catalysts, support effects were minimal, suggesting support influences activity primarily for Pd.
All catalysts produced product mixtures of HCAL, COL, and, in the case of Pd, also HCOL. Pd/rTOGO and Pd/rHUGO were highly selective for HCAL (>62%), with minimal COL formation (~3%). Pt/rGO catalysts exhibited high overall selectivity (>90%) and produced nearly equal HCAL and COL (~46% each), a result that contrasts with literature reports that Pt typically favors COL formation via C=O hydrogenation [6,7,8,11,12]. The shift may be due to the electronic properties of the carbon supports, which have been reported to influence Pt selectivity through π–electron interactions [6,7,8].
GC-MS analysis revealed a minor side product—3-isopropoxy-propan-1-yl benzene, formed via reductive etherification with isopropanol. This ether product, rarely reported in CAL hydrogenation studies [6], was more prominent on AC than rGO, especially for Pd catalysts. Pd/AC formed 26% ether at 30% CAL conversion, reducing HCAL selectivity.
Observed product trends over time support proposed reaction pathways: COL hydrogenation to HCOL and HCAL reductive etherification to ether. These mechanistic hypotheses are supported by time-resolved selectivity profiles.
Catalyst reusability was confirmed for Pd/rTOGO. After two hydrogenation–regeneration cycles, it retained significant activity and selectivity. Structural analysis revealed that Pd particle size changes correlated with performance shifts, underscoring the importance of particle size control for maximizing HCAL selectivity and catalyst longevity.

Supplementary Materials

The following supporting information can be downloaded at: https://www.mdpi.com/article/10.3390/catal15050470/s1, Figure S1: XRD spectra of Pt/rHUGO (blue), Pt/rTOGO (orange), and Pt/AC (green).; Figure S2: XRD spectra of Pd/rHUGO (blue), Pd/rTOGO (orange), and Pd/AC (green); Figure S3: XRD spectra of Rh/rHUGO (blue), Rh/rTOGO (orange), and Rh/AC (green); Figure S4: XRD spectra of Ru/rHUGO (blue) and Ru/AC (green); Figure S5: XRD spectra of Co/rHUGO (blue) and Co/AC (green); Figure S6: SEM images of reduced (a) Pt/rHUGO, (b) Pt/rTOGO, and (c) Pt/AC; Figure S7: SEM images of reduced (a) Pd/rHUGO, (b) Pd/rTOGO, and (c) Pd/AC; Figure S8: SEM images of reduced (a) Rh/rHUGO, (b) Rh/rTOGO, and (c) Rh/AC; Figure S9: SEM images of reduced (a) Ru/rHUGO and (b) Ru/AC; Figure S10: SEM images of reduced (a) Co/rHUGO and (b) Co/AC; Figure S11: TEM images and Pt NPs size distribution of (a) Pt/rHUGO, (b) Pt/rTOGO, and (c) Pt/AC; Figure S12: TEM images and Pd NPs size distribution of (a) Pd/rHUGO, (b) Pd/rTOGO, and (c) Pd/AC; Figure S13: TEM images and Rh NPs size distribution of (a) Rh/rHUGO, (b) Rh/rTOGO, and (c) Rh/AC; Figure S14: TEM images and Ru NPs size distribution of (a) Ru/rHUGO and (b) Ru/AC; Figure S15: TEM images and Co NPs size distribution of (a) Co/rHUGO and (b) Co/AC; Figure S16: SEM/EDS mapping of Pd/rTOGO (a) fresh catalyst, (b) regenerated after 1st cycle and (c) 2nd cycle; Figure S17: TEM images and Pd NPs size distribution of regenerated Pd/rTOGO (a) after 1st cycle and (b) after 2nd cycle.

Author Contributions

Conceptualization, M.P. and M.V.; methodology, M.P. and M.V.; validation, M.P., I.D., T.H. and M.V.; formal analysis, M.P., I.D., L.K. and M.V.; investigation, M.P., I.D., A.S., T.H., M.K., B.S. and L.K.; resources, T.H.; data curation, M.P., L.K. and I.D.; writing—original draft preparation, M.P. and M.V.; writing—review and editing, M.P. and M.V.; visualization, M.P., I.D. and L.K.; supervision, M.P. and M.V.; funding acquisition, M.P. and M.V. All authors have read and agreed to the published version of the manuscript.

Funding

This research was supported by the Czech Science Foundation (GACR No. 23-08083M) and by the institutional support Dagmar Procházková Fund provided by University of Chemistry and Technology in Prague.

Data Availability Statement

The data presented in this study are available on request from the corresponding author.

Acknowledgments

The authors acknowledge the Czech Science Foundation (GACR No. 23-08083M) for financial support. M.P. further acknowledges Dagmar Procházková Fund provided by University of Chemistry and Technology in Prague. The authors acknowledge AI-based tools for language editing and grammar correction. The authors produced the scientific content and interpretations.

Conflicts of Interest

The authors declare no conflicts of interest.

Abbreviations

The following abbreviations are used in this manuscript:
CALcinnamaldehyde
COLcinnamylalcohol
HCALhydrocinnamaldehyde
HCOLhydrocinnamal alcohol
ETHER3-isopropoxy-propan-1-yl benzene
GOgraphene oxide
rGOReduced graphene oxide
HUGOgraphene oxide prepared by Hummer’s method
TOGOgraphene oxide prepared by Tour’s method

References

  1. Taylor, H.S. Fourth Report of the Committee on Contact Catalysis. J. Phys. Chem. 1926, 30, 145–171. [Google Scholar] [CrossRef]
  2. Kačer, P.; Červený, L. Structure effects in hydrogenation reactions on noble metal catalysts. Appl. Catal. A Gen. 2002, 229, 193–216. [Google Scholar] [CrossRef]
  3. Mao, S.; Wang, Z.; Chen, Z.; Wu, K.; Zhang, K.; Li, Q.; Yan, H.; Lü, G.; Huang, G.; Wang, Y. Towards the selectivity distinction of phenol hydrogenation on noble metal catalysts. Nano Mater. Sci. 2023, 5, 91–100. [Google Scholar] [CrossRef]
  4. Singh, U.K.; Vannice, M.A. Liquid-Phase Citral Hydrogenation over SiO2-Supported Group VIII Metals. J. Catal. 2001, 199, 73–84. [Google Scholar] [CrossRef]
  5. Corvaisier, F.; Schuurman, Y.; Fecant, A.; Thomazeau, C.; Raybaud, P.; Toulhoat, H.; Farrusseng, D. Periodic trends in the selective hydrogenation of styrene over silica supported metal catalysts. J. Catal. 2013, 307, 352–361. [Google Scholar] [CrossRef]
  6. Aramendía, M.A.; Borau, V.; Jiménez, C.; Marinas, J.M.; Porras, A.; Urbano, F.J. Selective Liquid-Phase Hydrogenation of Citral over Supported Palladium. J. Catal. 1997, 172, 46–54. [Google Scholar] [CrossRef]
  7. Wei, Z.; Shao, F.; Wang, J. Recent advances in heterogeneous catalytic hydrogenation and dehydrogenation of N-heterocycles. Chin. J. Catal. 2019, 40, 980–1002. [Google Scholar] [CrossRef]
  8. Kluson, P.; Cerveny, L. Selective hydrogenation over ruthenium catalysts. Appl. Catal. A Gen. 1995, 128, 13–31. [Google Scholar] [CrossRef]
  9. Mercadante, L.; Neri, G.; Milone, C.; Donato, A.; Galvagno, S. Hydrogenation of α,β-unsaturated aldehydes over Ru/Al2O3 catalysts. J. Mol. Catal. A Chem. 1996, 105, 93–101. [Google Scholar] [CrossRef]
  10. Jiang, W.; Cao, J.-P.; Zhu, C.; Zhao, M.; Ni, Z.-H.; Zhao, X.-Y.; Xie, J.-X.; Zhao, L.; Zhao, Y.-P.; Bai, H.-C. Catalytic hydrogenation of aromatic ring over ruthenium nanoparticles supported on α-Al2O3 at room temperature. Appl. Catal. B Environ. 2022, 307, 121137. [Google Scholar] [CrossRef]
  11. Yoshida, H.; Onodera, Y.; Fujita, S.-i.; Kawamori, H.; Arai, M. Solvent effects in heterogeneous selective hydrogenation of acetophenone: Differences between Rh/C and Rh/Al2O3 catalysts and the superiority of water as a functional solvent. Green Chem. 2015, 17, 1877–1883. [Google Scholar] [CrossRef]
  12. Yan, P.; Tian, P.; Li, K.; Cohen Stuart, M.A.; Wang, J.; Yu, X.; Zhou, S. Rh nanoclusters encaged in hollow mesoporous silica nanoreactors with enhanced catalytic performance for phenol selective hydrogenation. Chem. Eng. J. 2020, 397, 125484. [Google Scholar] [CrossRef]
  13. Audemar, M.; Ciotonea, C.; De Oliveira Vigier, K.; Royer, S.; Ungureanu, A.; Dragoi, B.; Dumitriu, E.; Jérôme, F. Selective Hydrogenation of Furfural to Furfuryl Alcohol in the Presence of a Recyclable Cobalt/SBA-15 Catalyst. ChemSusChem 2015, 8, 1885–1891. [Google Scholar] [CrossRef] [PubMed]
  14. Rösler, S.; Obenauf, J.; Kempe, R. A Highly Active and Easily Accessible Cobalt Catalyst for Selective Hydrogenation of C=O Bonds. J. Am. Chem. Soc. 2015, 137, 7998–8001. [Google Scholar] [CrossRef]
  15. Volf, J.; Pašek, J. Chapter 4 Hydrogenation of Nitriles. In Studies in Surface Science and Catalysis; Cerveny, L., Ed.; Elsevier: Amsterdam, The Netherlands, 1986; pp. 105–144. [Google Scholar]
  16. Mukherjee, A.; Srimani, D.; Chakraborty, S.; Ben-David, Y.; Milstein, D. Selective Hydrogenation of Nitriles to Primary Amines Catalyzed by a Cobalt Pincer Complex. J. Am. Chem. Soc. 2015, 137, 8888–8891. [Google Scholar] [CrossRef]
  17. Gallezot, P.; Richard, D. Selective Hydrogenation of α,β-Unsaturated Aldehydes. Catal. Rev. 1998, 40, 81–126. [Google Scholar] [CrossRef]
  18. Ide, M.S.; Hao, B.; Neurock, M.; Davis, R.J. Mechanistic Insights on the Hydrogenation of α,β-Unsaturated Ketones and Aldehydes to Unsaturated Alcohols over Metal Catalysts. ACS Catal. 2012, 2, 671–683. [Google Scholar] [CrossRef]
  19. Lan, X.; Wang, T. Highly Selective Catalysts for the Hydrogenation of Unsaturated Aldehydes: A Review. ACS Catal. 2020, 10, 2764–2790. [Google Scholar] [CrossRef]
  20. Englisch, M.; Jentys, A.; Lercher, J.A. Structure Sensitivity of the Hydrogenation of Crotonaldehyde over Pt/SiO2and Pt/TiO2. J. Catal. 1997, 166, 25–35. [Google Scholar] [CrossRef]
  21. Tamura, M.; Tokonami, K.; Nakagawa, Y.; Tomishige, K. Selective Hydrogenation of Crotonaldehyde to Crotyl Alcohol over Metal Oxide Modified Ir Catalysts and Mechanistic Insight. ACS Catal. 2016, 6, 3600–3609. [Google Scholar] [CrossRef]
  22. Mohr, C.; Hofmeister, H.; Claus, P. The influence of real structure of gold catalysts in the partial hydrogenation of acrolein. J. Catal. 2003, 213, 86–94. [Google Scholar] [CrossRef]
  23. Mohr, C.; Hofmeister, H.; Radnik, J.; Claus, P. Identification of Active Sites in Gold-Catalyzed Hydrogenation of Acrolein. J. Am. Chem. Soc. 2003, 125, 1905–1911. [Google Scholar] [CrossRef] [PubMed]
  24. Marinelli, T.B.L.W.; Ponec, V. A Study on the Selectivity in Acrolein Hydrogenation on Platinum Catalysts: A Model for Hydrogenation of α,β-Unsaturated Aldehydes. J. Catal. 1995, 156, 51–59. [Google Scholar] [CrossRef]
  25. Han, Q.; Liu, Y.; Wang, D.; Yuan, F.; Niu, X.; Zhu, Y. Effect of carbon nanosheets with different graphitization degrees as a support of noble metals on selective hydrogenation of cinnamaldehyde. RSC Adv. 2016, 6, 98356–98364. [Google Scholar] [CrossRef]
  26. Wang, X.; Liang, X.; Geng, P.; Li, Q. Recent Advances in Selective Hydrogenation of Cinnamaldehyde over Supported Metal-Based Catalysts. ACS Catal. 2020, 10, 2395–2412. [Google Scholar] [CrossRef]
  27. Hu, D.; Fan, W.; Liu, Z.; Li, L. Three-Dimensionally Hierarchical Pt/C Nanocomposite with Ultra-High Dispersion of Pt Nanoparticles as a Highly Efficient Catalyst for Chemoselective Cinnamaldehyde Hydrogenation. ChemCatChem 2018, 10, 779–788. [Google Scholar] [CrossRef]
  28. Plomp, A.J.; Vuori, H.; Krause, A.O.I.; de Jong, K.P.; Bitter, J.H. Particle size effects for carbon nanofiber supported platinum and ruthenium catalysts for the selective hydrogenation of cinnamaldehyde. Appl. Catal. A Gen. 2008, 351, 9–15. [Google Scholar] [CrossRef]
  29. Liu, Z.-T.; Wang, C.-X.; Liu, Z.-W.; Lu, J. Selective hydrogenation of cinnamaldehyde over Pt-supported multi-walled carbon nanotubes: Insights into the tube-size effects. Appl. Catal. A Gen. 2008, 344, 114–123. [Google Scholar] [CrossRef]
  30. Jung, A.; Jess, A.; Schubert, T.; Schütz, W. Performance of carbon nanomaterial (nanotubes and nanofibres) supported platinum and palladium catalysts for the hydrogenation of cinnamaldehyde and of 1-octyne. Appl. Catal. A Gen. 2009, 362, 95–105. [Google Scholar] [CrossRef]
  31. Lenz, J.; Campo, B.C.; Alvarez, M.; Volpe, M.A. Liquid phase hydrogenation of α,β-unsaturated aldehydes over gold supported on iron oxides. J. Catal. 2009, 267, 50–56. [Google Scholar] [CrossRef]
  32. Toebes, M.L.; Prinsloo, F.F.; Bitter, J.H.; van Dillen, A.J.; de Jong, K.P. Influence of oxygen-containing surface groups on the activity and selectivity of carbon nanofiber-supported ruthenium catalysts in the hydrogenation of cinnamaldehyde. J. Catal. 2003, 214, 78–87. [Google Scholar] [CrossRef]
  33. Hájek, J.; Kumar, N.; Mäki-Arvela, P.; Salmi, T.; Murzin, D.Y.; Paseka, I.; Heikkilä, T.; Laine, E.; Laukkanen, P.; Väyrynen, J. Ruthenium-modified MCM-41 mesoporous molecular sieve and Y zeolite catalysts for selective hydrogenation of cinnamaldehyde. Appl. Catal. A Gen. 2003, 251, 385–396. [Google Scholar] [CrossRef]
  34. Machado, B.F.; Gomes, H.T.; Serp, P.; Kalck, P.; Faria, J.L. Liquid-Phase Hydrogenation of Unsaturated Aldehydes: Enhancing Selectivity of Multiwalled Carbon Nanotube-Supported Catalysts by Thermal Activation. ChemCatChem 2010, 2, 190–197. [Google Scholar] [CrossRef]
  35. Breen, J.P.; Burch, R.; Gomez-Lopez, J.; Griffin, K.; Hayes, M. Steric effects in the selective hydrogenation of cinnamaldehyde to cinnamyl alcohol using an Ir/C catalyst. Appl. Catal. A Gen. 2004, 268, 267–274. [Google Scholar] [CrossRef]
  36. Zhang, X.B.; Zhang, Y.J.; Chen, F.; Xiang, Y.Z.; Zhang, B.; Xu, L.Y.; Zhang, T.R. Efficient selective hydrogenation of cinnamaldehyde over zeolite supported cobalt catalysts in water. React. Kinet. Mech. Catal. 2015, 115, 283–292. [Google Scholar] [CrossRef]
  37. Liu, X.; Cheng, S.; Long, J.; Zhang, W.; Liu, X.; Wei, D. MOFs-Derived Co@CN bi-functional catalysts for selective transfer hydrogenation of α,β-unsaturated aldehydes without use of base additives. Mater. Chem. Front. 2017, 1, 2005–2012. [Google Scholar] [CrossRef]
  38. Gutiérrez, V.S.; Diez, A.S.; Dennehy, M.; Volpe, M.A. Cu incorporated MCM-48 for the liquid phase hydrogenation of cinnamaldehyde. Microporous Mesoporous Mater. 2011, 141, 207–213. [Google Scholar] [CrossRef]
  39. Liu, Z.; Yang, Y.; Mi, J.; Tan, X.; Song, Y. Synthesis of copper-containing ordered mesoporous carbons for selective hydrogenation of cinnamaldehyde. Catal. Commun. 2012, 21, 58–62. [Google Scholar] [CrossRef]
  40. Tan, M.; Yang, G.; Wang, T.; Vitidsant, T.; Li, J.; Wei, Q.; Ai, P.; Wu, M.; Zheng, J.; Tsubaki, N. Active and regioselective rhodium catalyst supported on reduced graphene oxide for 1-hexene hydroformylation. Catal. Sci. Technol. 2016, 6, 1162–1172. [Google Scholar] [CrossRef]
  41. Wei, S.; Zhao, Y.; Fan, G.; Yang, L.; Li, F. Structure-dependent selective hydrogenation of cinnamaldehyde over high-surface-area CeO2-ZrO2 composites supported Pt nanoparticles. Chem. Eng. J. 2017, 322, 234–245. [Google Scholar] [CrossRef]
  42. Dai, Y.; Gao, X.; Chu, X.; Jiang, C.; Yao, Y.; Guo, Z.; Zhou, C.; Wang, C.; Wang, H.; Yang, Y. On the role of water in selective hydrogenation of cinnamaldehyde to cinnamyl alcohol on PtFe catalysts. J. Catal. 2018, 364, 192–203. [Google Scholar] [CrossRef]
  43. Chang, S.; Meng, S.; Fu, X.; Zhang, S.; Zheng, X.; Chen, S. Hydrogenation of Cinnamaldehyde to Hydrocinnamyl Alcohol on Pt/Graphite Catalyst. ChemistrySelect 2019, 4, 2018–2023. [Google Scholar] [CrossRef]
  44. Ma, H.; Wang, L.; Chen, L.; Dong, C.; Yu, W.; Huang, T.; Qian, Y. Pt nanoparticles deposited over carbon nanotubes for selective hydrogenation of cinnamaldehyde. Catal. Commun. 2007, 8, 452–456. [Google Scholar] [CrossRef]
  45. Xu, Z.; Duong-Viet, C.; Liu, Y.; Baaziz, W.; Li, B.; Nguyen-Dinh, L.; Ersen, O.; Pham-Huu, C. Macroscopic graphite felt containing palladium catalyst for liquid-phase hydrogenation of cinnamaldehyde. Appl. Catal. B Environ. 2019, 244, 128–139. [Google Scholar] [CrossRef]
  46. Pham-Huu, C.; Keller, N.; Ehret, G.; Charbonniere, L.c.J.; Ziessel, R.; Ledoux, M.J. Carbon nanofiber supported palladium catalyst for liquid-phase reactions: An active and selective catalyst for hydrogenation of cinnamaldehyde into hydrocinnamaldehyde. J. Mol. Catal. A Chem. 2001, 170, 155–163. [Google Scholar] [CrossRef]
  47. Nagpure, A.S.; Gurrala, L.; Gogoi, P.; Chilukuri, S.V. Hydrogenation of cinnamaldehyde to hydrocinnamaldehyde over Pd nanoparticles deposited on nitrogen-doped mesoporous carbon. RSC Adv. 2016, 6, 44333–44340. [Google Scholar] [CrossRef]
  48. Kumar, A.; Xu, Q. Two-Dimensional Layered Materials as Catalyst Supports. ChemNanoMat 2018, 4, 28–40. [Google Scholar] [CrossRef]
  49. Gusmão, R.; Veselý, M.; Sofer, Z. Recent Developments on the Single Atom Supported at 2D Materials Beyond Graphene as Catalysts. ACS Catal. 2020, 10, 9634–9648. [Google Scholar] [CrossRef]
  50. Niu, W.-J.; He, J.-Z.; Gu, B.-N.; Liu, M.-C.; Chueh, Y.-L. Opportunities and Challenges in Precise Synthesis of Transition Metal Single-Atom Supported by 2D Materials as Catalysts toward Oxygen Reduction Reaction. Adv. Funct. Mater. 2021, 31, 2103558. [Google Scholar] [CrossRef]
  51. Hummers, W.S., Jr.; Offeman, R.E. Preparation of Graphitic Oxide. J. Am. Chem. Soc. 1958, 80, 1339. [Google Scholar] [CrossRef]
  52. Marcano, D.C.; Kosynkin, D.V.; Berlin, J.M.; Sinitskii, A.; Sun, Z.; Slesarev, A.; Alemany, L.B.; Lu, W.; Tour, J.M. Improved Synthesis of Graphene Oxide. ACS Nano 2010, 4, 4806–4814. [Google Scholar] [CrossRef] [PubMed]
  53. Pei, S.; Cheng, H.-M. The reduction of graphene oxide. Carbon 2012, 50, 3210–3228. [Google Scholar] [CrossRef]
  54. Shin, H.-J.; Kim, K.K.; Benayad, A.; Yoon, S.-M.; Park, H.K.; Jung, I.-S.; Jin, M.H.; Jeong, H.-K.; Kim, J.M.; Choi, J.-Y.; et al. Efficient Reduction of Graphite Oxide by Sodium Borohydride and Its Effect on Electrical Conductance. Adv. Funct. Mater. 2009, 19, 1987–1992. [Google Scholar] [CrossRef]
  55. Stankovich, S.; Dikin, D.A.; Piner, R.D.; Kohlhaas, K.A.; Kleinhammes, A.; Jia, Y.; Wu, Y.; Nguyen, S.T.; Ruoff, R.S. Synthesis of graphene-based nanosheets via chemical reduction of exfoliated graphite oxide. Carbon 2007, 45, 1558–1565. [Google Scholar] [CrossRef]
  56. Shaban, M.; Mohamed, A.; Kordy, M.G.M.; AlMohamadi, H.; Eissa, M.F.; Hamdy, H. Design and Performance of CuNi-rGO and Ag-CuNi-rGO Composite Electrodes for Use in Fuel Cells. Catalysts 2024, 14, 551. [Google Scholar] [CrossRef]
  57. Saeed, M.; Albadran, F.H.; Zahoor, A.F.; Nisar, A.; Al-Mutairi, A.A.; Al-Hussain, S.A.; Irfan, A.; Zaki, M.E.A. Co3O4-rGO—Synthesis, Characterization, and Evaluation of Photocatalytic Activities. Catalysts 2024, 14, 96. [Google Scholar] [CrossRef]
  58. Nethravathi, C.; Rajamathi, M. Chemically modified graphene sheets produced by the solvothermal reduction of colloidal dispersions of graphite oxide. Carbon 2008, 46, 1994–1998. [Google Scholar] [CrossRef]
  59. Mishra, S.K.; Tripathi, S.N.; Choudhary, V.; Gupta, B.D. SPR based fibre optic ammonia gas sensor utilizing nanocomposite film of PMMA/reduced graphene oxide prepared by in situ polymerization. Sens. Actuators B Chem. 2014, 199, 190–200. [Google Scholar] [CrossRef]
  60. Liu, G.; Wang, L.; Wang, B.; Gao, T.; Wang, D. A reduced graphene oxide modified metallic cobalt composite with superior electrochemical performance for supercapacitors. RSC Adv. 2015, 5, 63553–63560. [Google Scholar] [CrossRef]
  61. Jose, P.P.A.; Kala, M.S.; Joseph, A.V.; Kalarikkal, N.; Thomas, S. Reduced graphene oxide/silver nanohybrid as a multifunctional material for antibacterial, anticancer, and SERS applications. Appl. Phys. A 2020, 126, 58. [Google Scholar] [CrossRef]
  62. Gooßen, L.J.; Linder, C. Catalytic Reductive Etherification of Ketones with Alcohols at Ambient Hydrogen Pressure: A Practical, Waste-Minimized Synthesis of Dialkyl Ethers. Synlett 2006, 2006, 3489–3491. [Google Scholar] [CrossRef]
  63. Kalutharage, N.; Yi, C.S. Chemoselective formation of unsymmetrically substituted ethers from catalytic reductive coupling of aldehydes and ketones with alcohols in aqueous solution. Org. Lett. 2015, 17, 1778–1781. [Google Scholar] [CrossRef] [PubMed]
  64. Seth, J.; Nepak, D.; Chaudhari, V.R.; Prasad, B.L.V. Preparation of MgO supported platinum nanoparticle catalyst using toluene dispersed platinum sol. Appl. Surf. Sci. 2017, 418, 87–91. [Google Scholar] [CrossRef]
  65. Xue, Y.; Xin, H.; Xie, W.; Wu, P.; Li, X. Pt nanoparticles supported on YCoxFe1−xO3 perovskite oxides: Highly efficient catalysts for liquid-phase hydrogenation of cinnamaldehyde. Chem. Commun. 2019, 55, 3363–3366. [Google Scholar] [CrossRef]
  66. Chen, L.; Zhan, W.; Fang, H.; Cao, Z.; Yuan, C.; Xie, Z.; Kuang, Q.; Zheng, L. Selective Catalytic Performances of Noble Metal Nanoparticle@MOF Composites: The Concomitant Effect of Aperture Size and Structural Flexibility of MOF Matrices. Chem. Eur. J. 2017, 23, 11397–11403. [Google Scholar] [CrossRef]
Figure 1. Scheme of hydrogenation of cinnamaldehyde (CAL) to cinnamylalcohol (COL), hydrocinnamaldehyde (HCAL) and hydrocinnamal alcohol (HCOL).
Catalysts 15 00470 g001
Figure 2. Schematic illustration of the structure of graphene, graphene oxide (GO), and reduced graphene oxide (rGO).
Catalysts 15 00470 g002
Figure 3. XRD spectra of (a) Pt/rHUGO, Pt/rTOGO, and Pt/AC and (b) Pd/rHUGO, Pd/rTOGO, and Pd/AC and of the pure supports HUGO, TOGO, and AC ((a,b), dotted line).
Catalysts 15 00470 g003
Figure 4. Nitrogen adsorption–desorption isotherms of (a) Pt, (b) Pd, (c) Rh, and (d) Ru and Co supported catalysts, full line = HUGO, dashed line = TOGO, dots = AC.
Catalysts 15 00470 g004
Figure 5. SEM images of prepared (a) Pd/rHUGO and (b) Pd/rTOGO.
Catalysts 15 00470 g005
Figure 6. TEM images of (a) Pt/rHUGO, (b) Pt/rTOGO, and (c) Pt/AC; (d) Pd/rHUGO, (e) Pd/rTOGO, and (f) Pd/AC; (g) Rh/rHUGO, (h) Rh/rTOGO, and (i) Rh/AC; (j) Ru/rHUGO and (k) Ru/AC; (l) Co/rHUGO and (m) Co/AC.
Catalysts 15 00470 g006
Figure 7. Conversions as a function of time over (a) Pt and Pd catalysts, (b) Co and Ru catalysts, and (c) Rh catalysts (empty dots indicate increase in reaction temperature from 80 °C to 110 °C after 60 min in case of testing Rh catalysts) (reaction conditions: CAL, isopropyl alcohol, 80/110 °C, 1 MPa, and 6 h).
Catalysts 15 00470 g007
Figure 8. Reductive etherification of alcohol and ketone or aldehyde and of cinnamaldehyde with isopropyl alcohol.
Catalysts 15 00470 g008
Figure 9. Selectivities toward all formed products as a function of CAL conversion achieved over (a) Pt/rHUGO, (b) Pd/rTOGO, and (c) Rh/rTOGO.
Catalysts 15 00470 g009
Figure 10. Yields of all formed products as a function of reaction time achieved over (a) Pd/rHUGO, (b) Pd/rTOGO, and (c) Pd/AC.
Catalysts 15 00470 g010
Figure 11. Scheme of cinnamaldehyde (CAL) hydrogenation to cinnamylalcohol (COL) and hydrocinnamaldehyde (HCAL) and their further transformations to hydrocinnamalcohol (HCOL) and 3-isopropoxy-propan-1-yl benzene (ether).
Catalysts 15 00470 g011
Figure 12. Ratios of formed products (a) HCOL/COL and (b) ether/HCAL as a function of CAL conversion achieved over tested catalysts.
Catalysts 15 00470 g012
Figure 13. XRD spectra of Pd/rTOGO-fresh, regenerated after one cycle and regenerated after two cycles.
Catalysts 15 00470 g013
Figure 14. SEM images of regenerated Pd/rTOGO (a) after first cycle and (b) after second cycle.
Catalysts 15 00470 g014
Figure 15. TEM images of regenerated Pt/rTOGO (a) after first cycle and (b) after second cycle.
Catalysts 15 00470 g015
Figure 16. Comparison of fresh and regenerated Pd/rTOGO catalysts: (a) catalytic activity and (b) selectivity toward the products at 30% conversion level.
Catalysts 15 00470 g016
Table 1. BET surface area of the pure supports as well as of reduced catalysts.
CATALYSTSBET (m2/g)
HUGOTOGOAC
Pure548559669
Pt8270743
Pd11081721
Rh8372418
Ru136x646
Co79x649
Table 2. Metal particle size distribution on different supports determined by TEM (determined for reduced catalysts).
MetalSupportMedian (nm)Particle Size Distribution (%)
0–2 nm2–4 nm4–6 nm6–8 nm8–10 nm10–12 nm12–14 nm14–16 nm16–18 nm18–20 nm>20 nm
PtrHUGO3.55632263020000
rTOGO3.925230113010000
AC7.8002134182150000
PdrHUGO15.500001011181316725
rTOGO21.4000344448963
AC13.900011121251411710
RhrHUGO6.6013292711727220
rTOGO3.015681620000000
AC3.70643340000000
RurHUGO1.86830200000000
AC3.166514123000000
CorHUGO24.00000022191176
AC18.0000610124106844
Table 3. Achieved CAL conversion within 360 min of the reaction and reaction rates achieved over the tested catalysts.
MetalSupportCAL Conversion (%)r0 (mmol·L−1·min−1)rt (mmol·L−1·min−1)
PtrHUGO22.80.570.37
rTOGO28.61.430.33
AC25.80.810.29
PdrHUGO32.62.830.23
rTOGO61.53.790.46
AC30.41.490.32
RhrHUGO28.80.540.35 *(110 °C)
rTOGO33.50.830.57 *(110 °C)
AC27.50.780.37 *(110 °C)
RurHUGO14.40.540.13
AC13.80.650.17
CorHUGO5.00.440.06
AC6.50.420.09
* Reaction temperature raised to 110 °C. NOTE: r0 = initial reaction rate; rt = reaction rate between 120 and 360 min; (reaction conditions: CAL, isopropyl alcohol, 80 °C, 1 MPa, 6 h). NOTE: catalysts mass not taken into the account in calculations of the reaction rates, since these values were same for all tested catalysts (being 10 mg of catalyst with 1 wt.% nominal metal loading).
Table 4. Selectivities toward formed products at two CAL conversion levels, 10% and 30%, achieved over the tested catalysts.
CATALYSTSelectivity at 10%/30% Conversion of CAL (%)
HCALCOLHCOLETHERSOtherSUM of H2 Products
10%30%10% 30%10%30%10%30%10%30%10%30%
Pt/rHUGO52.046.5 γ44.346.8 γ0.00.0 γ2.25.8 γ0.80.9 γ96.393.3 γ
Pt/rTOGO52.843.8 δ36.246.4 δ0.00.0 δ7.07.2 δ4.12.6 δ89.090.2 δ
Pt/AC49.039.027.126.60.00.017.131.77.02.976.165.6
Pd/rHUGO66.2 α64.811.1 α2.118.7 α20.93.5 α7.60.7 α0.496.0 α87.8
Pd/rTOGO67.362.76.83.322.226.43.77.60.00.096.392.4
Pd/AC60.642.611.79.119.121.38.026.40.90.691.473.0
Rh/rHUGO66.855.3 δ4.66.3 δ0.00.0 δ26.037.6 δ3.13.0 δ71.459.6 δ
Rh/rTOGO63.054.221.820.53.13.412.821.90.00.087.978.1
Rh/AC72.054.7 ε10.021.8 ε0.00.0 ε14.821.8 ε3.12.0 ε82.076.5 ε
Ru/rHUGO50.046.4 ζ5.115.5 ζ0.00.0 ζ14.57.0 ζ28.731.1 ζ55.161.9 ζ
Ru/AC59.347.3 ζ11.525.4 ζ0.00.0 ζ24.721.7 ζ4.85.6 ζ70.872.7 ζ
Co/rHUGO30.3 βx0.0 βx0.0 βx69.7 βx0.0 βx30.3 βx
Co/AC69.5 βx30.5 βx0.0 βx0.0 βx0.0 βx100 βx
NOTE: α at 15% conversion; β at 5% conversion; γ at 23% conversion; δ at 29% conversion; ε at 27% conversion; ζ at 14% conversion; x = not achieved; (reaction conditions: CAL, isopropyl alcohol, 80 °C, 1 MPa, and 6 h).
Table 5. Metal particle size distribution on different supports determined by TEM (determined for reduced catalysts, fresh = prepared + reduced, Reg1/2 = used in hydrogenation and reduced).
CatalystSupportMedian (nm)Particle Size Distribution (%)
0–2 nm2–4 nm4–6 nm6–8 nm8–10 nm10–12 nm12–14 nm14–16 nm16–18 nm18–20 nm>20 nm
Pd/rTOGOFresh21.4000344448963
Reg19.9020752020510723
Reg213.802554142175729
Disclaimer/Publisher’s Note: The statements, opinions and data contained in all publications are solely those of the individual author(s) and contributor(s) and not of MDPI and/or the editor(s). MDPI and/or the editor(s) disclaim responsibility for any injury to people or property resulting from any ideas, methods, instructions or products referred to in the content.