Article

Fabrication of a Novel Silica–Alumina-Based Photocatalyst Incorporating Carbon Nanotubes and Nanofiber Nanostructures Using an Unconventional Technique for Light-Driven Water Purification

1
Department of Physics, College of Science, King Faisal University, P.O. Box 400, Al-Ahsa 31982, Saudi Arabia
2
Clinical Laboratory, Sciences Department, Applied Medical Sciences College, University of Ha’il, Ha’il 55424, Saudi Arabia
3
Fab Lab Abdulmonem Al Rashed Humanitarian Foundation, Al-Ahsa 31982, Saudi Arabia
*
Author to whom correspondence should be addressed.
Catalysts 2025, 15(5), 452; https://doi.org/10.3390/catal15050452
Submission received: 26 March 2025 / Revised: 13 April 2025 / Accepted: 3 May 2025 / Published: 6 May 2025

Abstract

:
The advancement of optical materials has garnered significant interest from the global scientific community in the pursuit of efficient photocatalysts for the purification of water using light. This challenge, which cannot be addressed using traditional methods, is tackled in the present study utilizing unconventional approaches. This study presents the fabrication of an effective photocatalyst using an unconventional approach that employs explosive reactions. This method successfully produces 3D nanostructures composed of carbon nanotubes (CNTs), carbon nanofibers (CNFs), and silica–alumina nanoparticles at temperatures below 270 °C. Gold-supported silica–alumina–CNT–CNF nanostructures were synthesized and characterized using XRD, TEM, SEM, and EDX, in addition to mapping images. To study and determine the photoactivity of these produced nanostructures, two well-known photocatalysts—titanium dioxide and zinc oxide—were synthesized at the nanoscale for comparison. The results showed that the presence of CNTs and CNFs significantly reduced the band gap energy from 5.5 eV to 1.65 eV and 3.65 eV, respectively, after modifying the silica–alumina structure. In addition, complete degradation of green dye was achieved after 35 min of light exposure using the modified silica–alumina structure. Additionally, the surface properties of the modified silica–alumina had a positive role in accelerating the photocatalytic decomposition of the green dye NGB. A kinetic study confirmed that the modified silica–alumina functions as a promising additive for optical applications, accelerating the photocatalytic degradation of NGB to a rate three times faster than that of the prepared titanium dioxide and six times that of the prepared zinc oxide.

1. Introduction

Dyes represent a significant source of colored organic compounds that are released as waste during the textile dyeing process. The high levels of organic materials in wastewater, combined with the stability of contemporary synthetic dyes, render traditional biological methods for wastewater treatment inadequate for complete color removal and the degradation of organic pollutants [1]. Conventional techniques for removing color from water, such as coagulation, filtration, adsorption [2,3,4], and ozone treatment [5], have their own unique advantages and disadvantages. However, these standard methods exhibit several limitations and are not universally effective against all types of pollutants. As a result, photocatalysis has emerged as a promising solution for addressing water contamination, utilizing light as the driving force to eliminate pollutants. Numerous studies [6,7,8,9,10,11] have explored the use of light in photocatalytic degradation processes to purify water containing industrial contaminants. In these investigations, researchers have primarily aimed to develop efficient photocatalysts to enhance the effectiveness of photocatalytic processes [12,13,14,15,16,17]. However, the market potential of photocatalytic degradation techniques is limited due to the restricted applications and shortcomings of conventional photocatalysts such as titanium dioxide and zinc oxide. Therefore, there is a pressing need for alternative photocatalysts to overcome the challenges associated with traditional photocatalytic methods [18].
Silica–alumina structures are among the most well-known porous materials used in catalytic reactions. However, these structures are not sensitive to light and have not traditionally been applied in optical applications due to their large band gap energies, which typically range from 6.5 to 7.5 eV [19]. Therefore, the conversion of silica–alumina from non-optical materials to optical structures is a challenge for optical applications such as photocatalytic processes and solar cells. Previous studies have only considered silica–alumina structures and alumina–silicate-based systems, such as zeolite, as supporting materials for semiconductor photocatalysts. With reference to the cited literature and to the best of the authors’ knowledge, previous studies have rarely considered using silica–alumina nanoparticles for the photocatalytic degradation of dyes.
In 2024, Baha et al. [20] investigated the photocatalytic decomposition of MB dye using bayerite/zeolite with TiO2. In this study, 100% degradation efficiency was achieved after 4 h of light radiation. Additionally, in 2023, zeolite structures with different silica/alumina ratios were used to support titanium dioxide for the photocatalytic degradation of the pharmaceutical compound atenolol [21]. In this study, 50% photocatalytic degradation of atenolol was achieved after 70 min of light irradiation. Hutsul et al. [22] prepared ZnO-supported zeolite for the photocatalytic degradation of methylene blue dye. The dyes exhibited incomplete decomposition even after 1 h of UV irradiation. Recently, a copper oxide–carbon nitride–zeolite catalyst prepared by Ohn et al. [23] exhibited a high efficiency for degrading MB and CV dyes. In 2022, silica was used as a photocatalyst for the degradation of methylene blue dye, where 94% degradation efficiency was achieved after 5 h of light radiation [24].
The texture of silica–alumina structures plays an important role in catalytic processes, given their high thermal and chemical stability, high porosity, and large specific surface area. The mesoporous structure of silica–alumina plays a vital role for increasing the efficiency of photocatalysts by trapping pollutants inside. In addition, the high surface area of silica–alumina is suitable for creating new optical active sites through integration with carbon nanotubes and nanofibers in addition to supporting gold nanoparticles.
To enable optical applications of porous silica–alumina structures, gold nanoparticles can be introduced, as gold has a broad spectrum of light absorption and can function as an electron trap in photocatalysts. In addition, gold nanoparticles offer several benefits to photocatalysts, including functioning as light-trapping receptors due to their strong surface plasmon resonance (SPR) effect. A locally enhanced electric field is then produced close to the gold nanoparticles as a result of the photoexcitation of the SPR. Furthermore, SPR extends light absorption to longer wavelengths and increases light dispersion [10].
Using carbon nanofibers and nanotubes, three-dimensional (3D) porous silica–alumina nanocomposites were engineered to enhance photocatalytic efficiency by creating new optically active sites and lowering the optical band gap energy. In this study, explosive reactions of solid fuel were initiated within the porous silica–alumina matrix, leading to nanoscale structural development and the growth of carbon nanotubes (CNTs) and nanofibers (CNFs). Additionally, the high temperature and pressure generated from the explosive reactions create strong atomic-scale interactions between CNTs and CNFs in the silica–alumina framework. Crack bridging was achieved through the growth of CNTs and CNFs with Al2O3 during the explosive processes, according to the following equation: (2Al2O3 + 6C → Al4C3 + 3CO2). Crack bridging is supported by a strong CNT–Al2O3 interface, as suggested by many researchers [25,26]. Balani and Agarwal [25] confirmed the possibility of enhanced interfacial bonding between Al and C, indicating that crystals with high surface energy try to adhere to new surfaces to minimize their overall energy.
The growth of 1D nanostructures such as CNTs and CNFs with 0D silica–alumina nanoparticles to form 3D porous nanostructures presents a promising new additive for photocatalytic and catalytic applications. Therefore, X-ray diffraction, SEM, TEM, imaging mapping, and EDX were used to identify this novel nanocomposite. The surface characteristics and porous structures of the prepared nanocomposite were evaluated using N2 adsorption–desorption isotherms at −196 °C. Additionally, the specific surface area, pore volume, and average pore radius were determined using the Brunauer–Emmett–Teller (BET) equation and the t-method. The pore size distribution was analyzed using desorption data following the method of Barrett, Joyner, and Halenda. To determine the optical efficiency of this novel nanocomposite, well-known photocatalysts such as zinc oxide and titanium dioxide were prepared for comparative analysis. In addition, conventional silica–alumina structures were used to highlight the benefits of the explosive method. UV–Vis spectroscopy was employed to thoroughly investigate the optical properties of the synthesized nanomaterials. In addition, the photocatalytic activity of these materials was evaluated based on their ability to degrade green dye. Furthermore, the photocatalytic activity of the prepared materials was investigated using kinetic models of photocatalytic processes.

2. Results

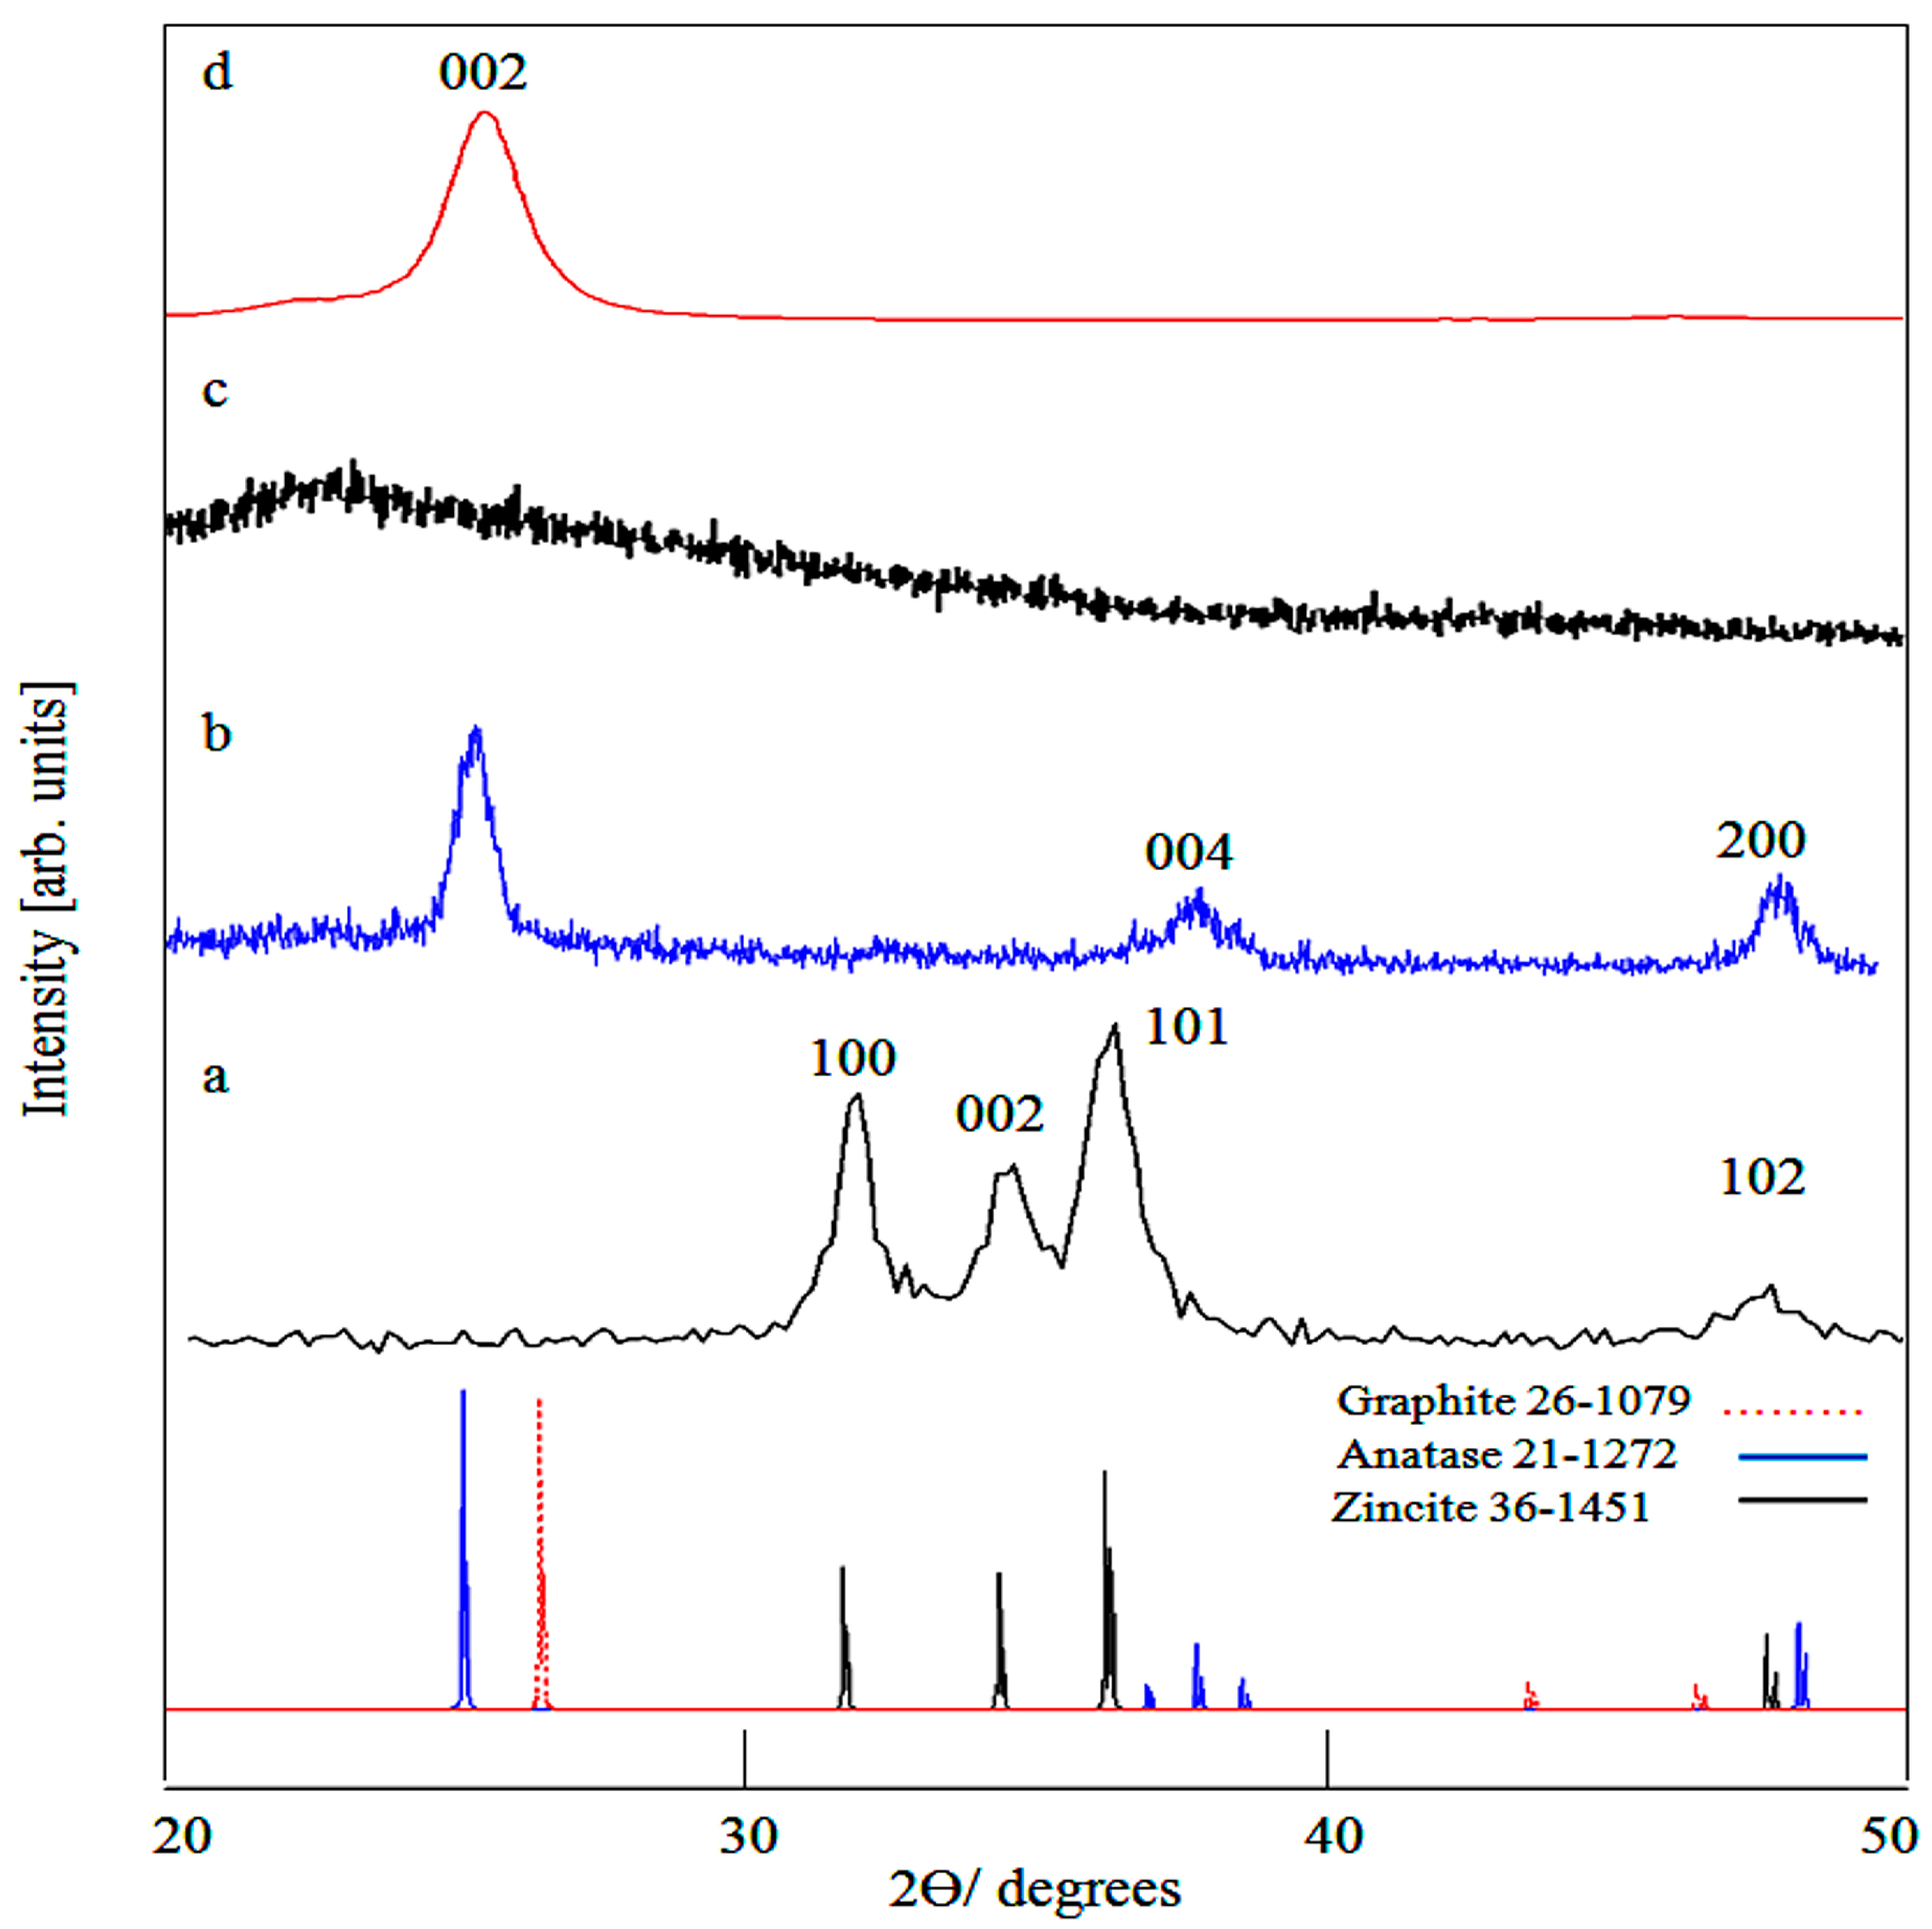
2.1. X-Ray Diffraction

The X-ray diffraction pattern of ZO-1 particles is displayed in Figure 1a. The X-ray diffraction pattern displayed four peaks at angles of 32.11°, 34.23°, 36.44°, and 47.67°. These diffraction lines were identified as wurtzite (JCPDS 36-1451) ZnO crystals by comparing them with the reflection patterns (100), (002), (101), and (102) of the zincite phase. The observed wurtzite crystal structure along with the broad diffraction peaks indicate that the ZnO particles are nanoscale in size.
Figure 1b depicts the X-ray diffraction pattern of TO-2. It exhibits three wide peaks at 2θ = 25.39°, 37.92°, and 48.11°. These peaks are due to the reflection planes (101), (004), and (200) of titanium dioxide. Furthermore, the observed diffraction patterns are consistent with the anatase phase, as confirmed by comparison with the full standard diffraction diagram of JCPDS 21-1272, as shown in Figure 1b. The broadness of the peaks suggests that the synthesized titanium dioxide particles are crystallized at the nanoscale.
The XRD pattern of the prepared silica–alumina sample SA-3 is shown in Figure 1c. A weak peak was observed at 2θ = 22.45°, indicating that SA-3 exhibits an amorphous structure, as shown in Figure 1c. Following explosive reactions, the crystalline structure of silica–alumina was modified as shown in Figure 1d. A prominent and broad peak for SAGC-3 is noted at 2θ = 25.55°. This peak corresponds to a d-spacing of 0.348 nm attributed to the plane reflection of graphite (002), which is characteristic of carbon nanotubes and nanofibers (CNTs and CNFs) [27,28]. Additionally, the faint peak at 2θ = 22.33° indicates the presence of an amorphous silica–alumina structure [29].

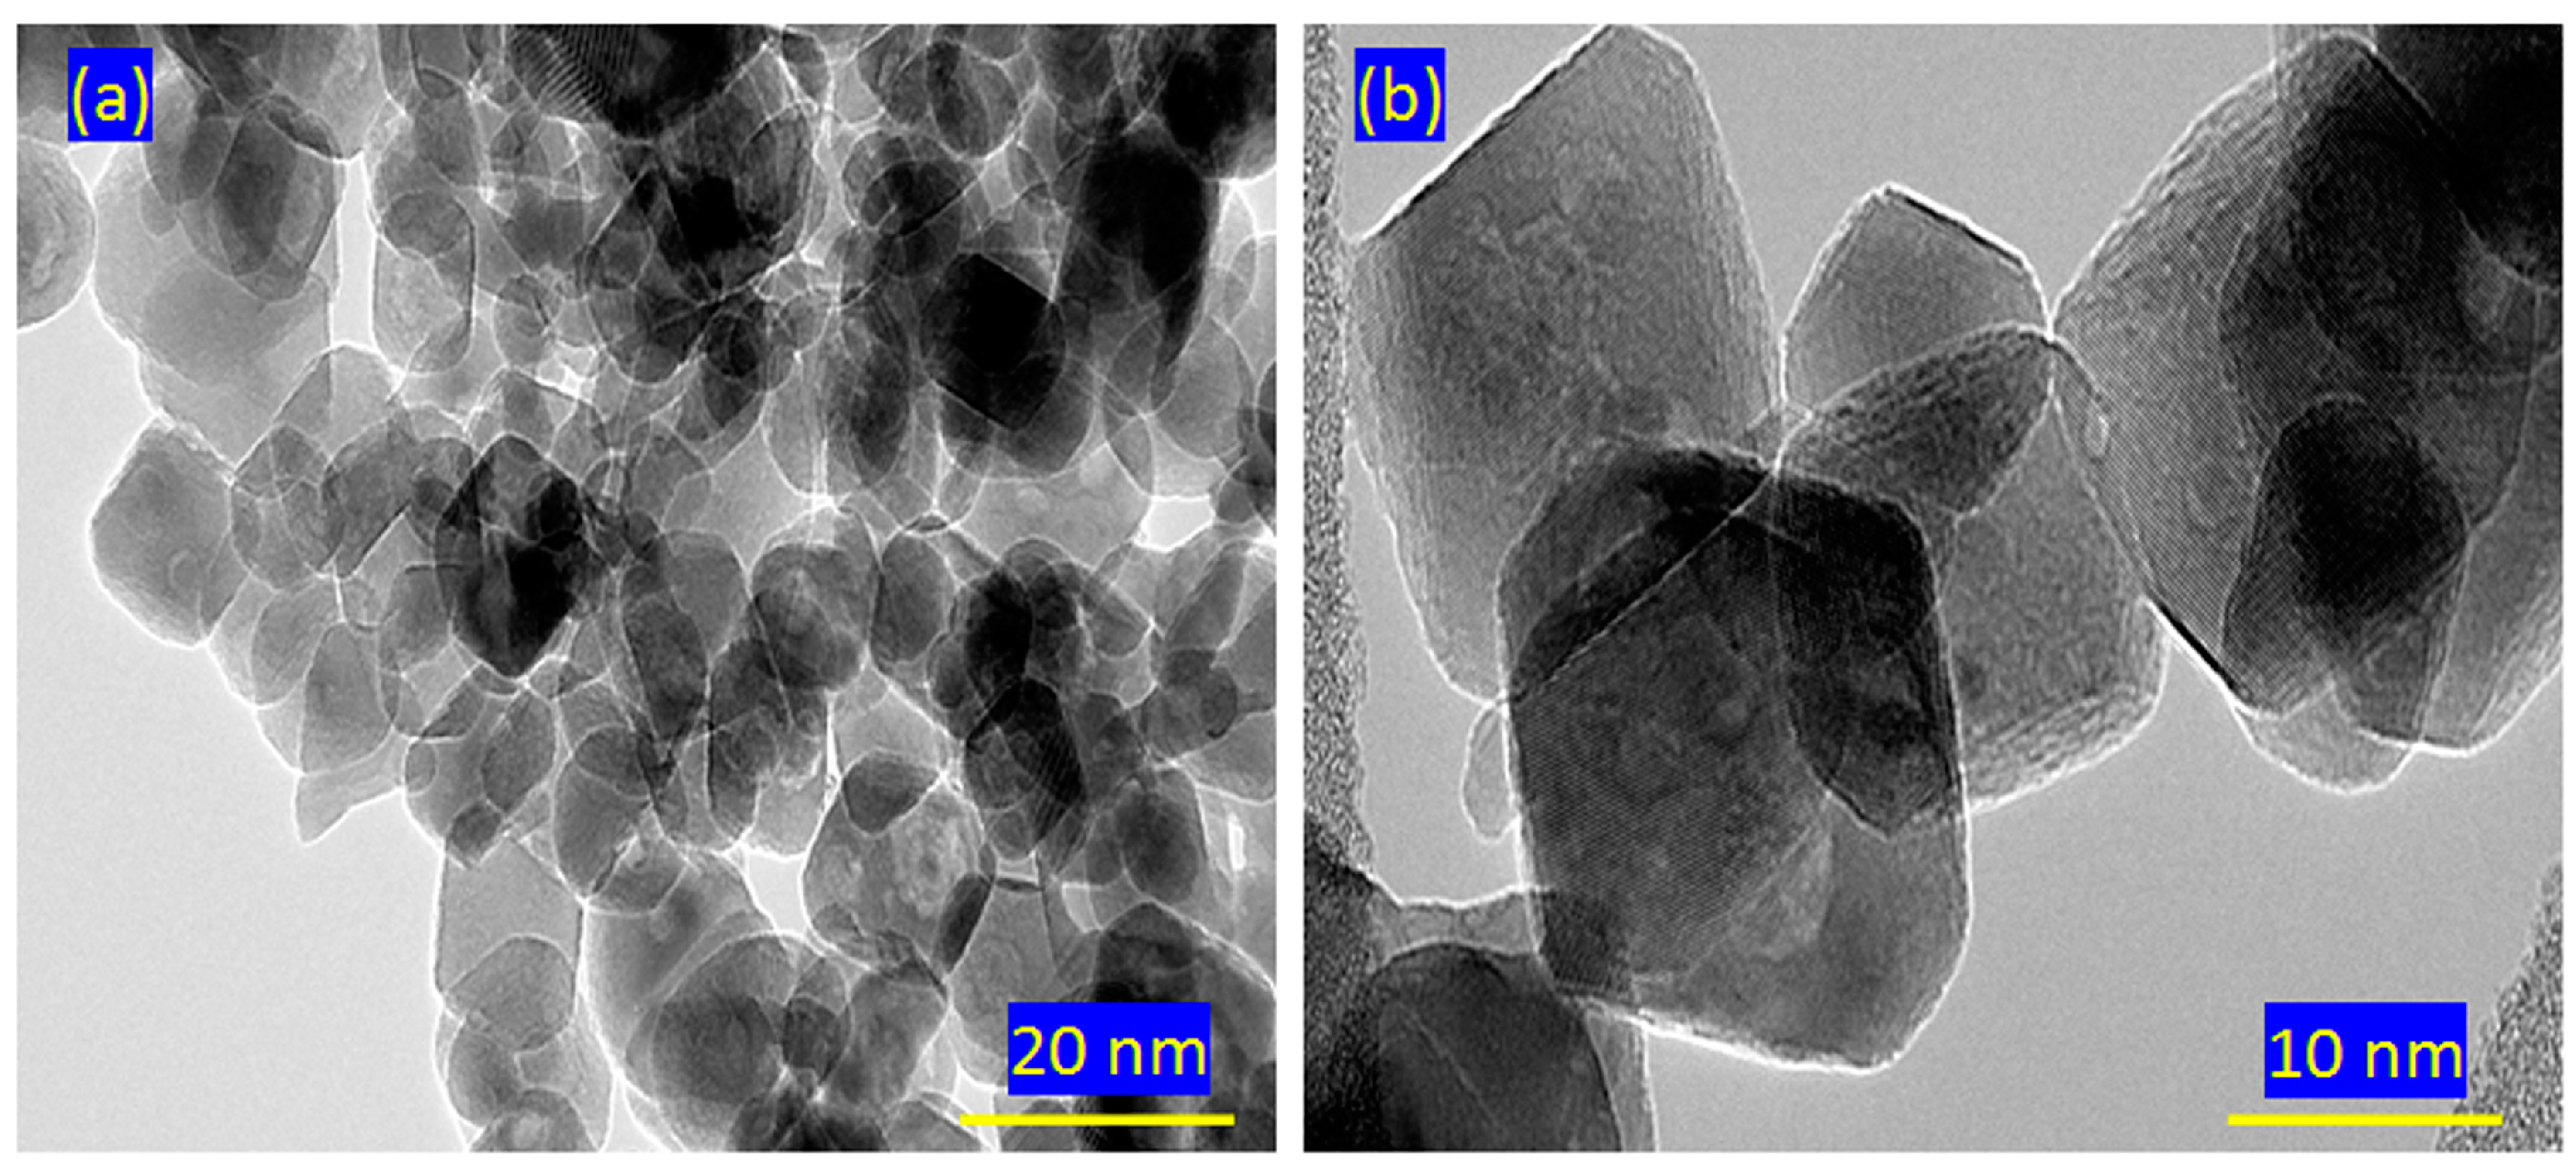
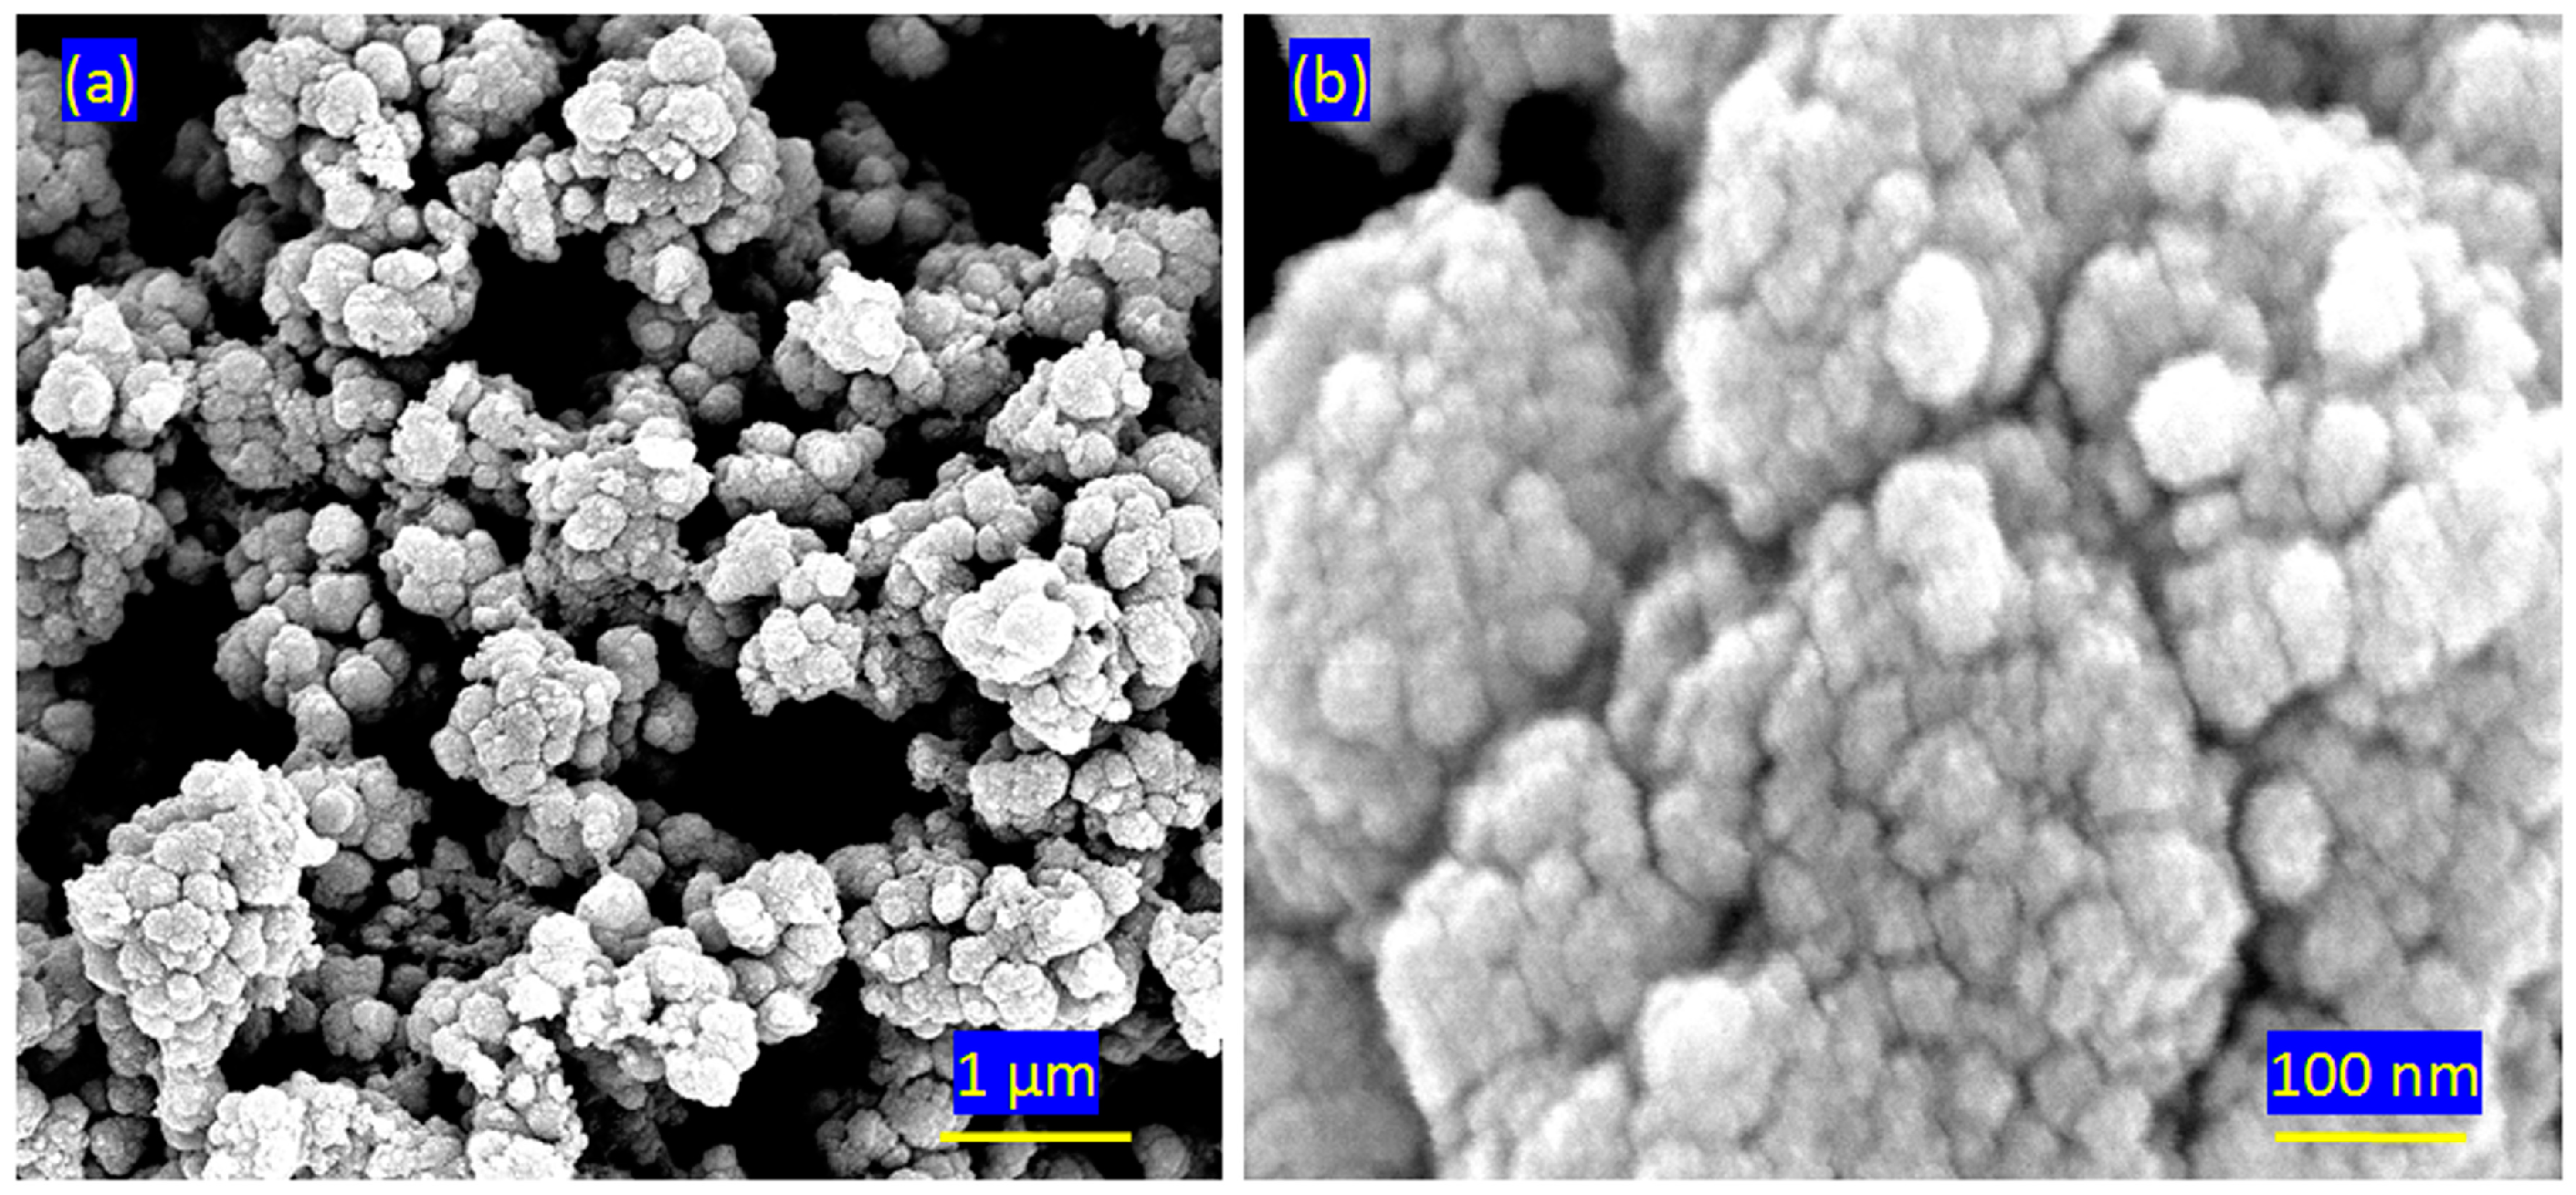
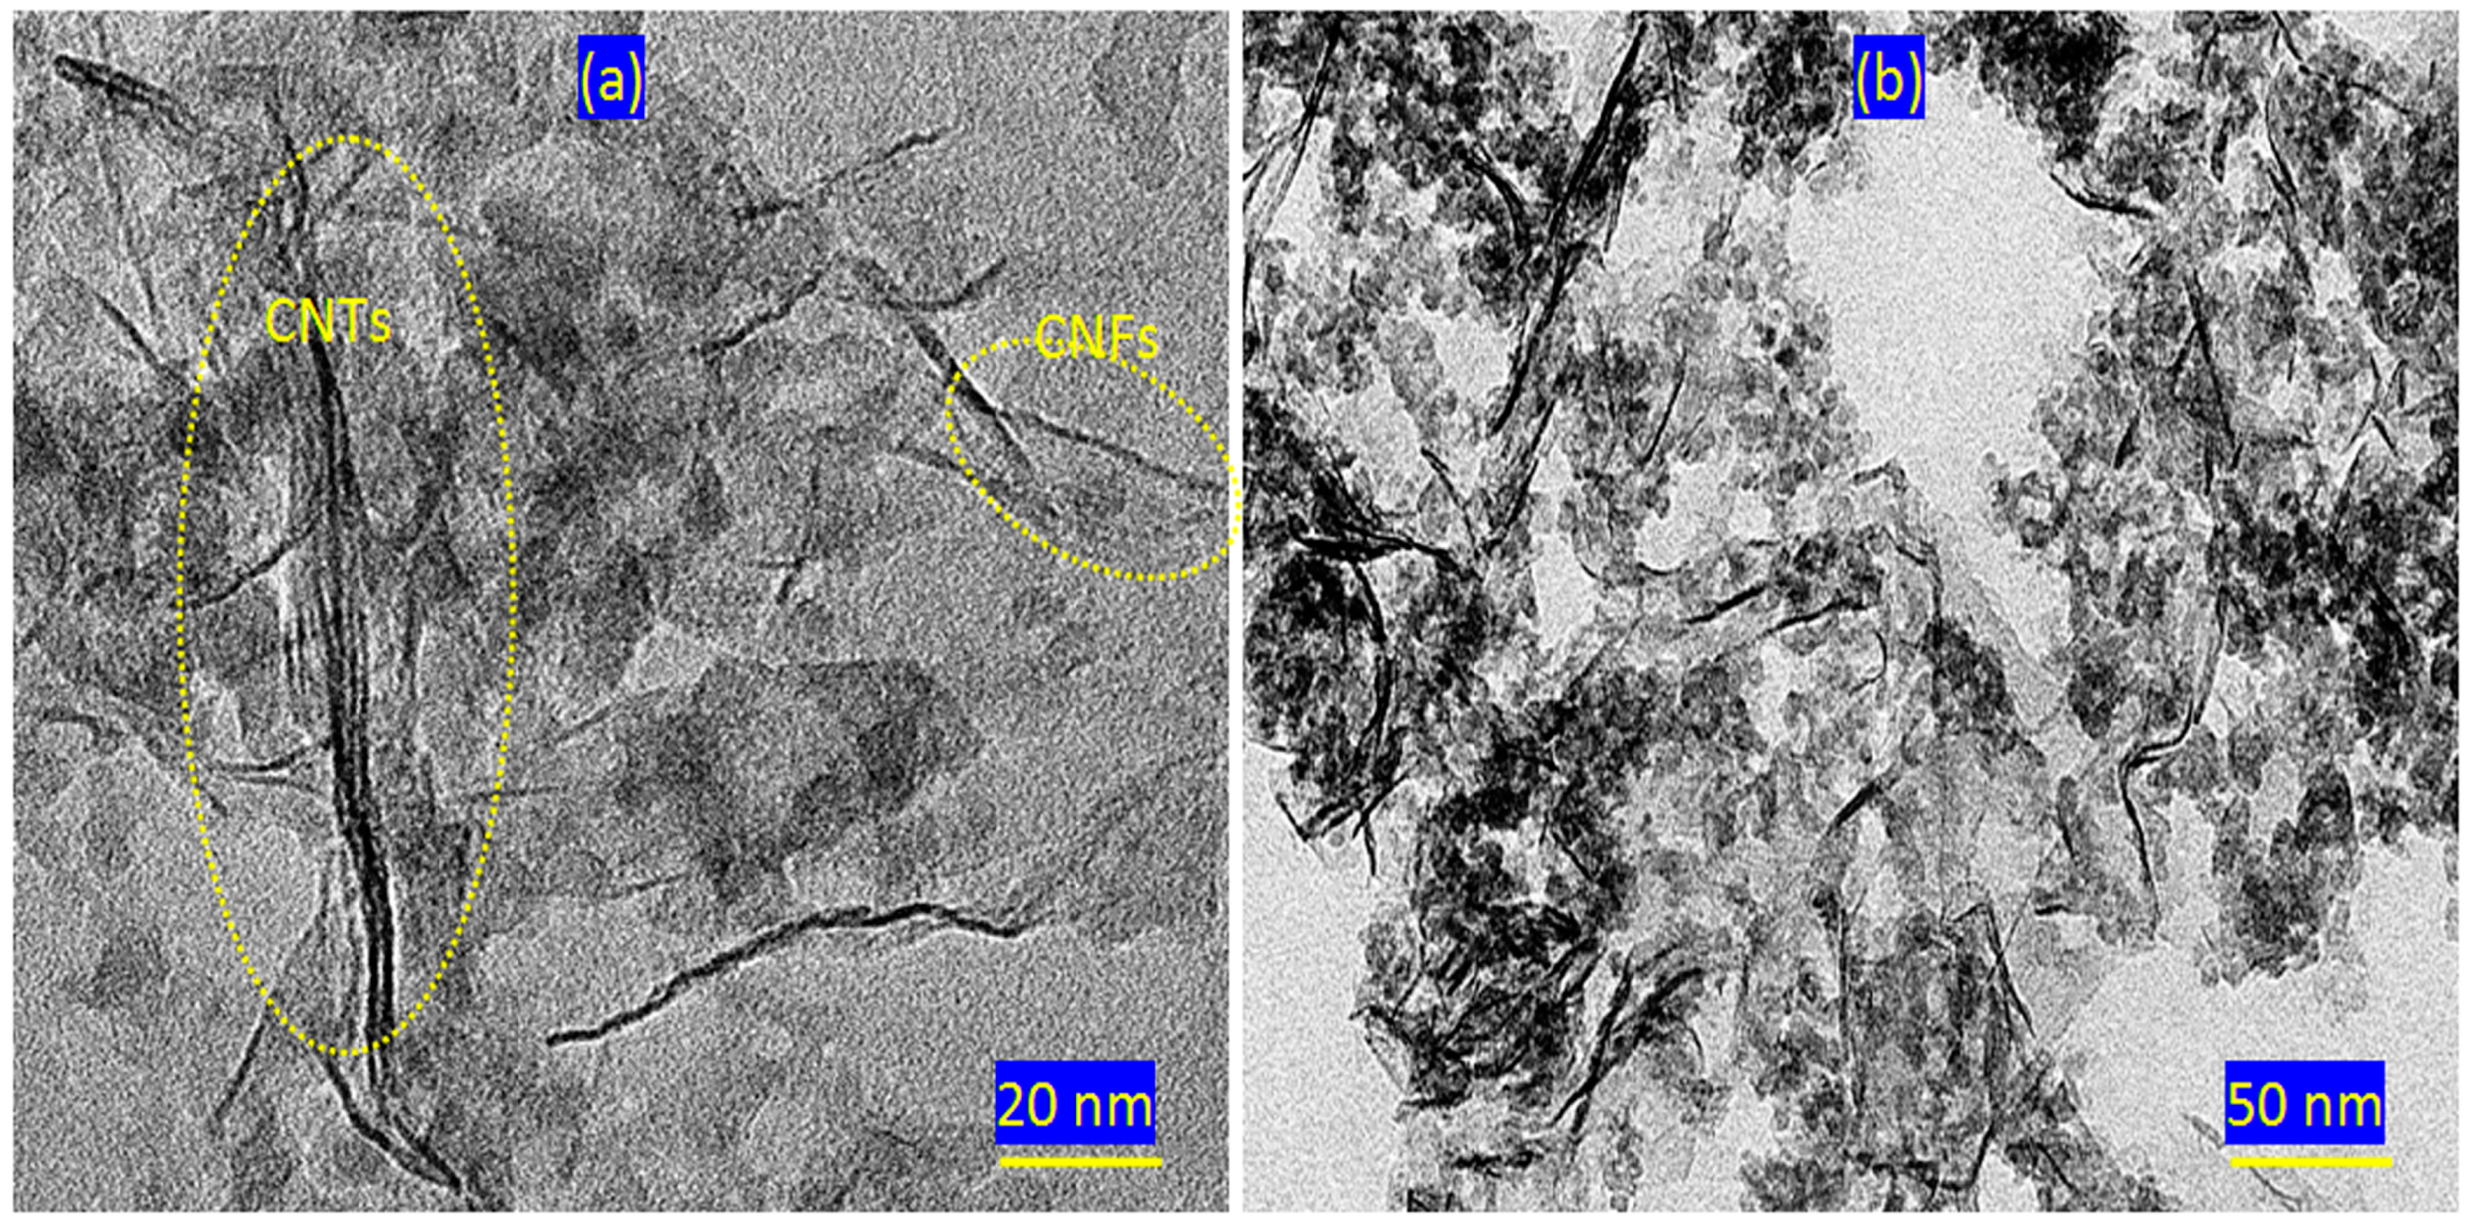
2.2. Scanning and Transmission Electron Microscopy

The morphology of the ZO-1 sample was observed using TEM. Figure 2a shows SEM images of ZO-1. TEM images of ZO-1 indicated that the zinc oxide particles are nanoscale, consistent with the XRD results. As shown in Figure 2b, the individual zinc oxide particles exhibited irregular shapes, with an average diameter of 20 nm. The morphology of the TO-2 sample was observed using SEM. Figure 3 shows SEM images of TO-2. A large collection of nanoparticles was observed for TO-2, as shown in Figure 3a. In addition, SEM images indicated that the titanium dioxide nanoparticles aggregate to create porous structures, as shown in Figure 3a. Figure 3b shows that the titanium dioxide nanoparticles are predominantly spherical in shape, with diameters less than 50 nm.
Figure 4 shows TEM images of the SAGC-3 sample. Carbon nanotubes and nanofibers were observed inside the silica–alumina matrix, as shown in Figure 4a. The average CNT diameter is 5 nm, whereas that of CNF is less than 5 nm. In addition, Figure 4b shows the dispersion and distribution of CNTs and CNFs in the silica–alumina matrix.

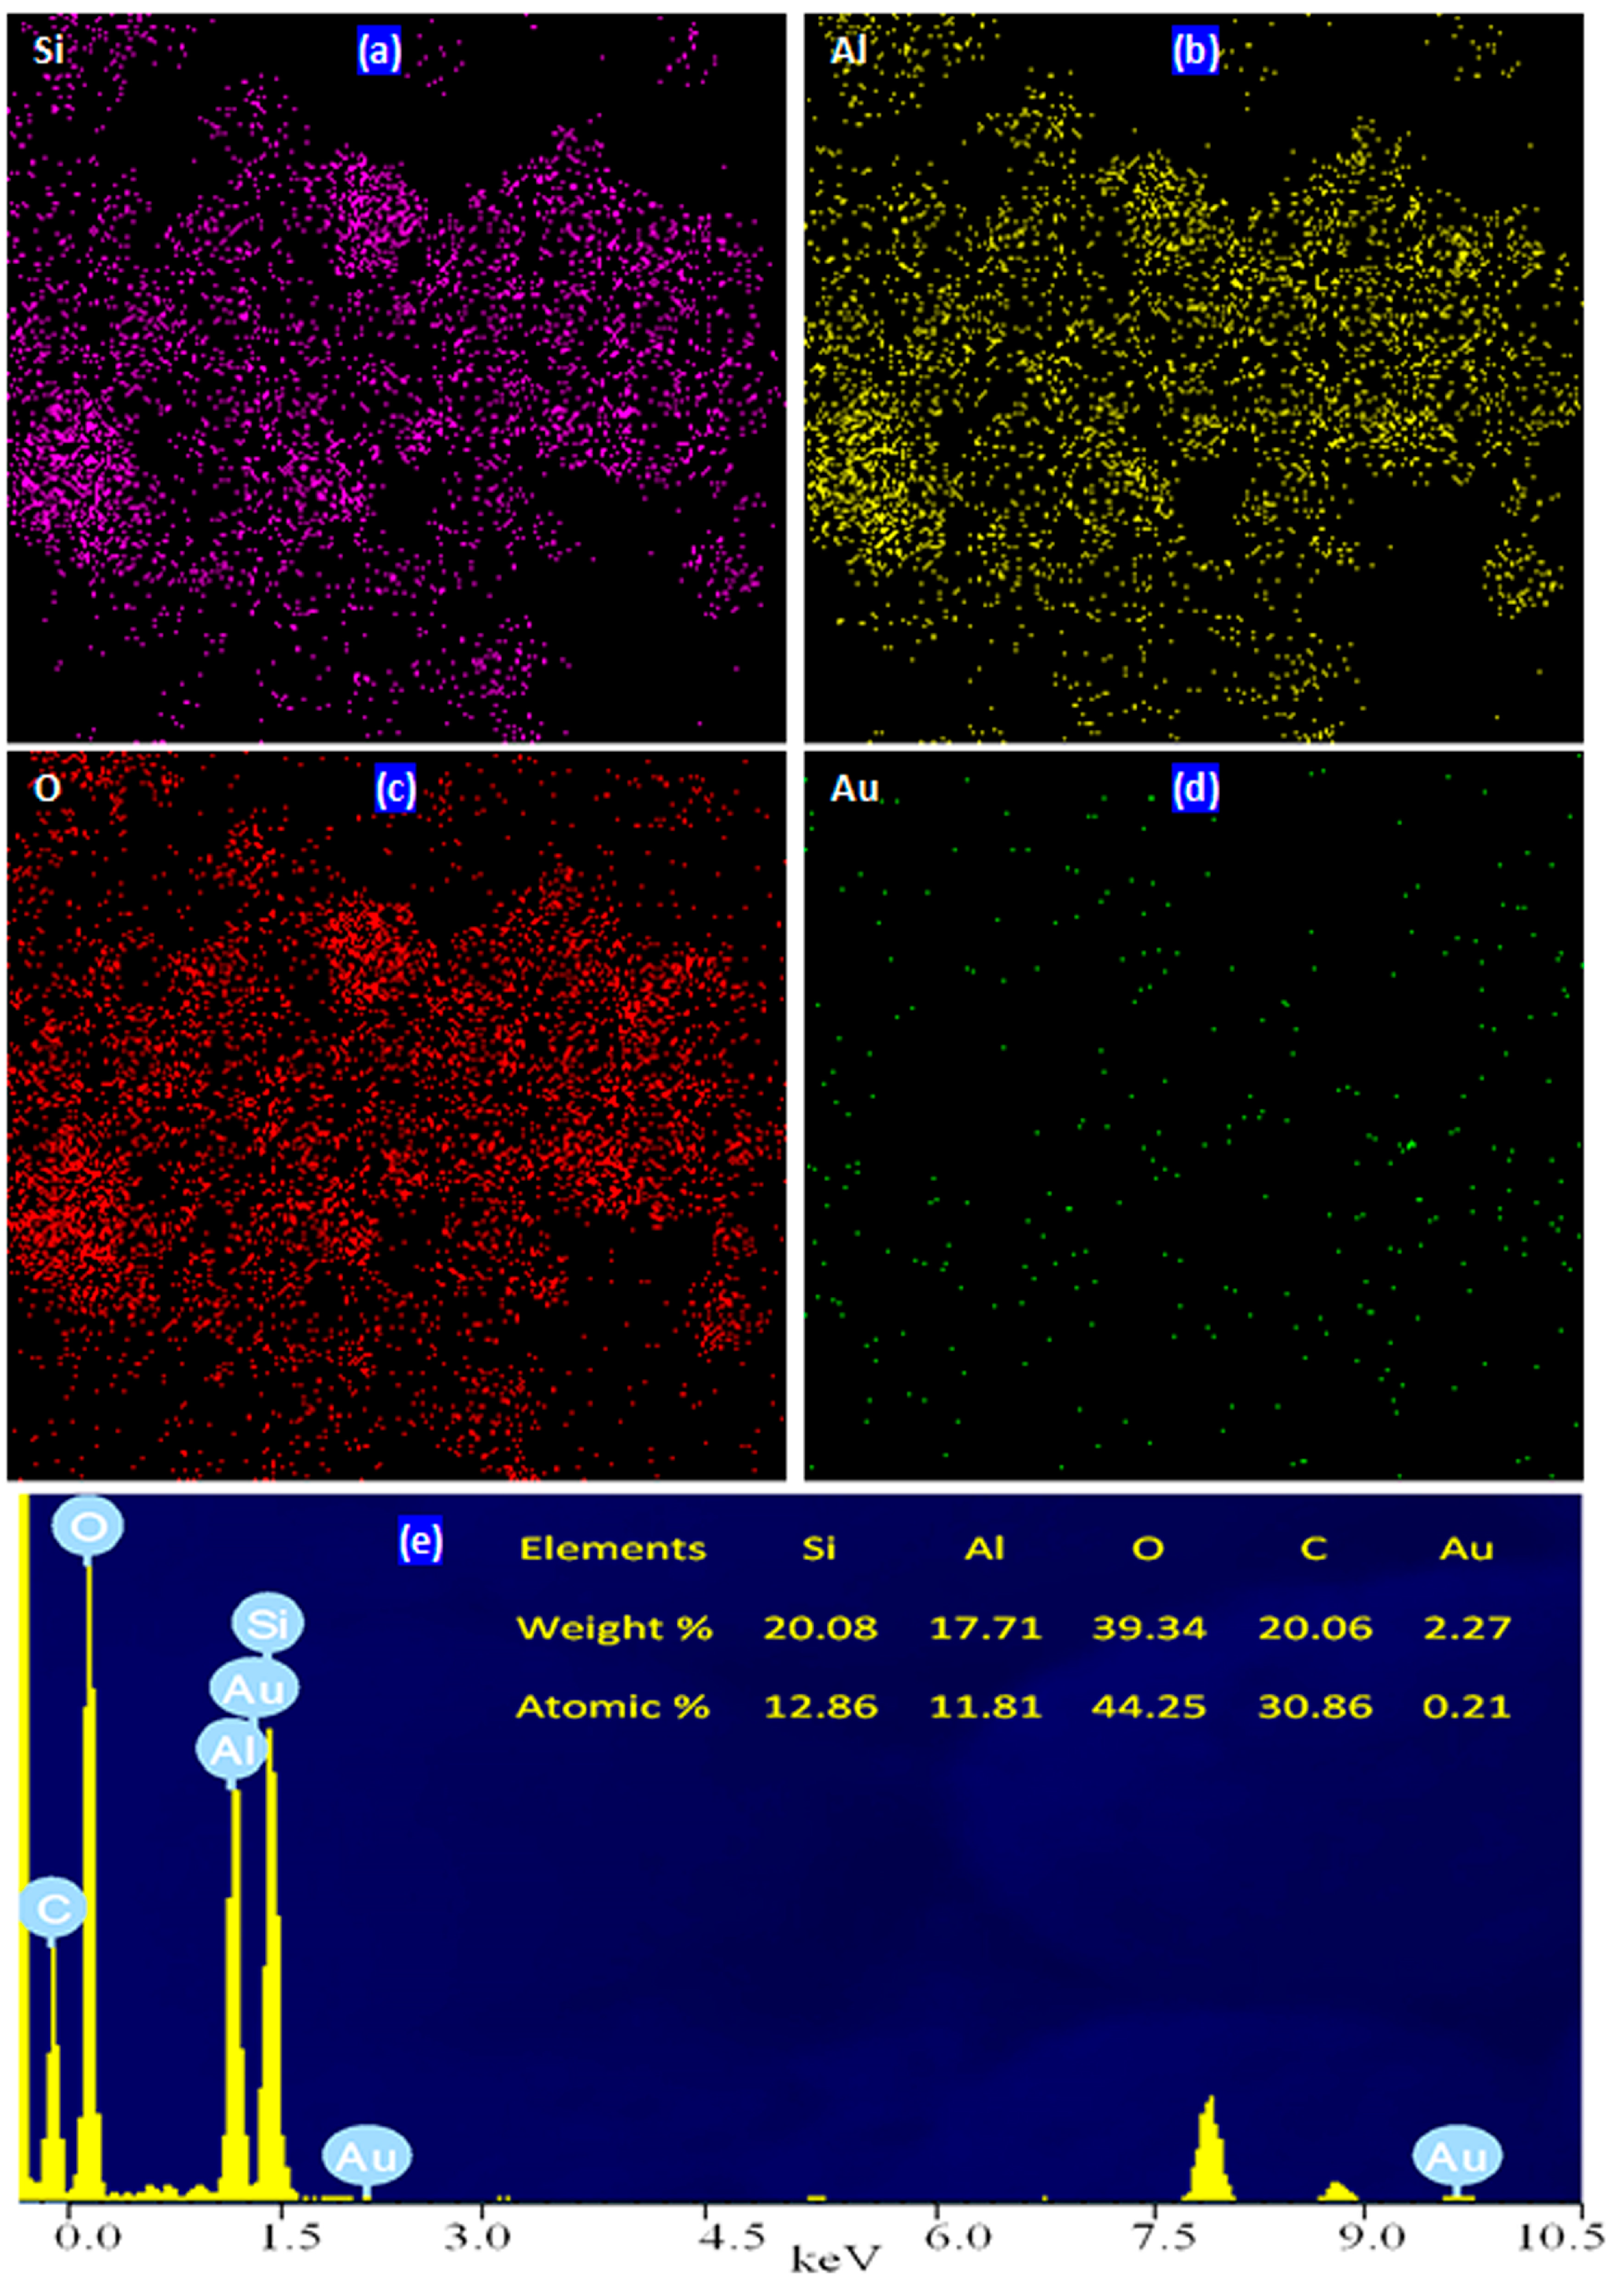
2.3. Mapping Images and EDX Analysis

The dispersed silicon, aluminum, oxygen, and gold molecules in the SAGC-3 sample are visible in the element mapping images shown in Figure 5. These elements are represented as colored dots dispersed across specific regions. Additionally, as seen in Figure 5a,b, the violet dots in the silicon chart match the yellow dots in the aluminum chart, indicating the formation of a united silica–alumina structure. Similarly, the red dots in the oxygen chart (Figure 5c) align with the silicon and aluminum distributions, indicating the formation of the silica–alumina structure. Furthermore, as shown in Figure 5d, the gold mapping image reveals the dispersion of gold nanoparticles, which are symbolized by green dots on the gold chart.
The elemental composition of SAGC-3 and its EDX spectrum are displayed in Figure 5e. The EDX spectrum showed sharp signals for silicon, aluminum, and oxygen nanoparticles, consistent with the TEM images. These findings indicate that the main matrix of SAGC-3 is a silica–alumina structure. In addition, small signals were observed for the gold nanoparticles in Figure 5e, indicating low gold content. Additionally, the presence of carbon nanotubes and nanofibers in the SAGC-3 sample was confirmed by the observation of a distinct signal at low energy.
The basic composition of SAGC-3 was determined using EDX analysis, as seen in Figure 5e (inset). The atomic percentages of both silicon and aluminum are approximately equal, consistent with the proportions used during synthesis. The atomic percentage of oxygen is nearly double that of Si and Al, confirming the formation of the silica–alumina structure. The atomic percentage of carbon is 30.86%, indicating a high content of CNTs and CNFs inside the silica–alumina matrix. Additionally, the measured gold content is approximately 2 wt.%, aligning with the intended composition during preparation.

2.4. Surface Characteristics of Au/Silica–Alumina–CNT–CNF Nanoparticles

The texture and porous structures of silica–alumina are crucial factors in enhancing its catalytic activity. Therefore, nitrogen adsorption–desorption isotherms at 77 K were obtained for SAGC-3, as shown in Figure 6.
The adsorption data for the SAGC-3 isotherm were analyzed using the BET, De Boer, and BJH methods to determine the total pore volume, the specific surface area, and the average pore size. According to Brunauer and Emmett’s classification, SAGC-3 exhibits a type IV isotherm, as illustrated in Figure 6a. However, due to the absence of a clear plateau at high p/po, this isotherm is classified as pseudo-type II or an intermediate between types II and IV. In addition, a hysteresis loop is observed and closes at a relative pressure of approximately 0.5.
The lower branch of the hysteresis loop represents nitrogen gas addition, while the upper branch corresponds to progressive withdrawal. This hysteresis loop is caused by the filling and emptying of mesopores, which occur as a result of capillary condensation. According to the IUPAC classification, the loop is classified as H3, indicating that SAGC-3 is made up of porous aggregates, with a lattice of cross-linked pores forming the interior free space. The computed surface characteristics from this isotherm revealed that SAGC-3 has a large specific surface area (SBET = 307.0 m2/g).
SAGC-3 has a total pore volume (Vp) of 1.39 cc/g and an average pore size (rp) of 7.78 nm. SAGC-3’s large total pore volume and pore size can be achieved by producing void surface area (pores) or clusters with a high surface-to-volume ratio. The Vl−t graph in Figure 6c verified SAGC-3’s mesoporous microstructure, with upward departure at t > 0.9. The Vl−t figure shows a linear segment with an upward deviation, indicating mesoporous texture. The presence of capillary condensation in the mesopores produces the upward deviation. Once the mesopores are filled with nitrogen adsorbate, further adsorption proceeds via a multilayer mechanism, resulting in a linear segment on the t-plot. The BJH method was applied to the desorption branch of the isotherm within the hysteresis region to determine the pore size distribution, surface area, and pore volume. The results indicate that the majority of SAGC-3 pores have diameters limited to the restricted range of 5 to 8 nm (radius), as seen in Figure 6b.

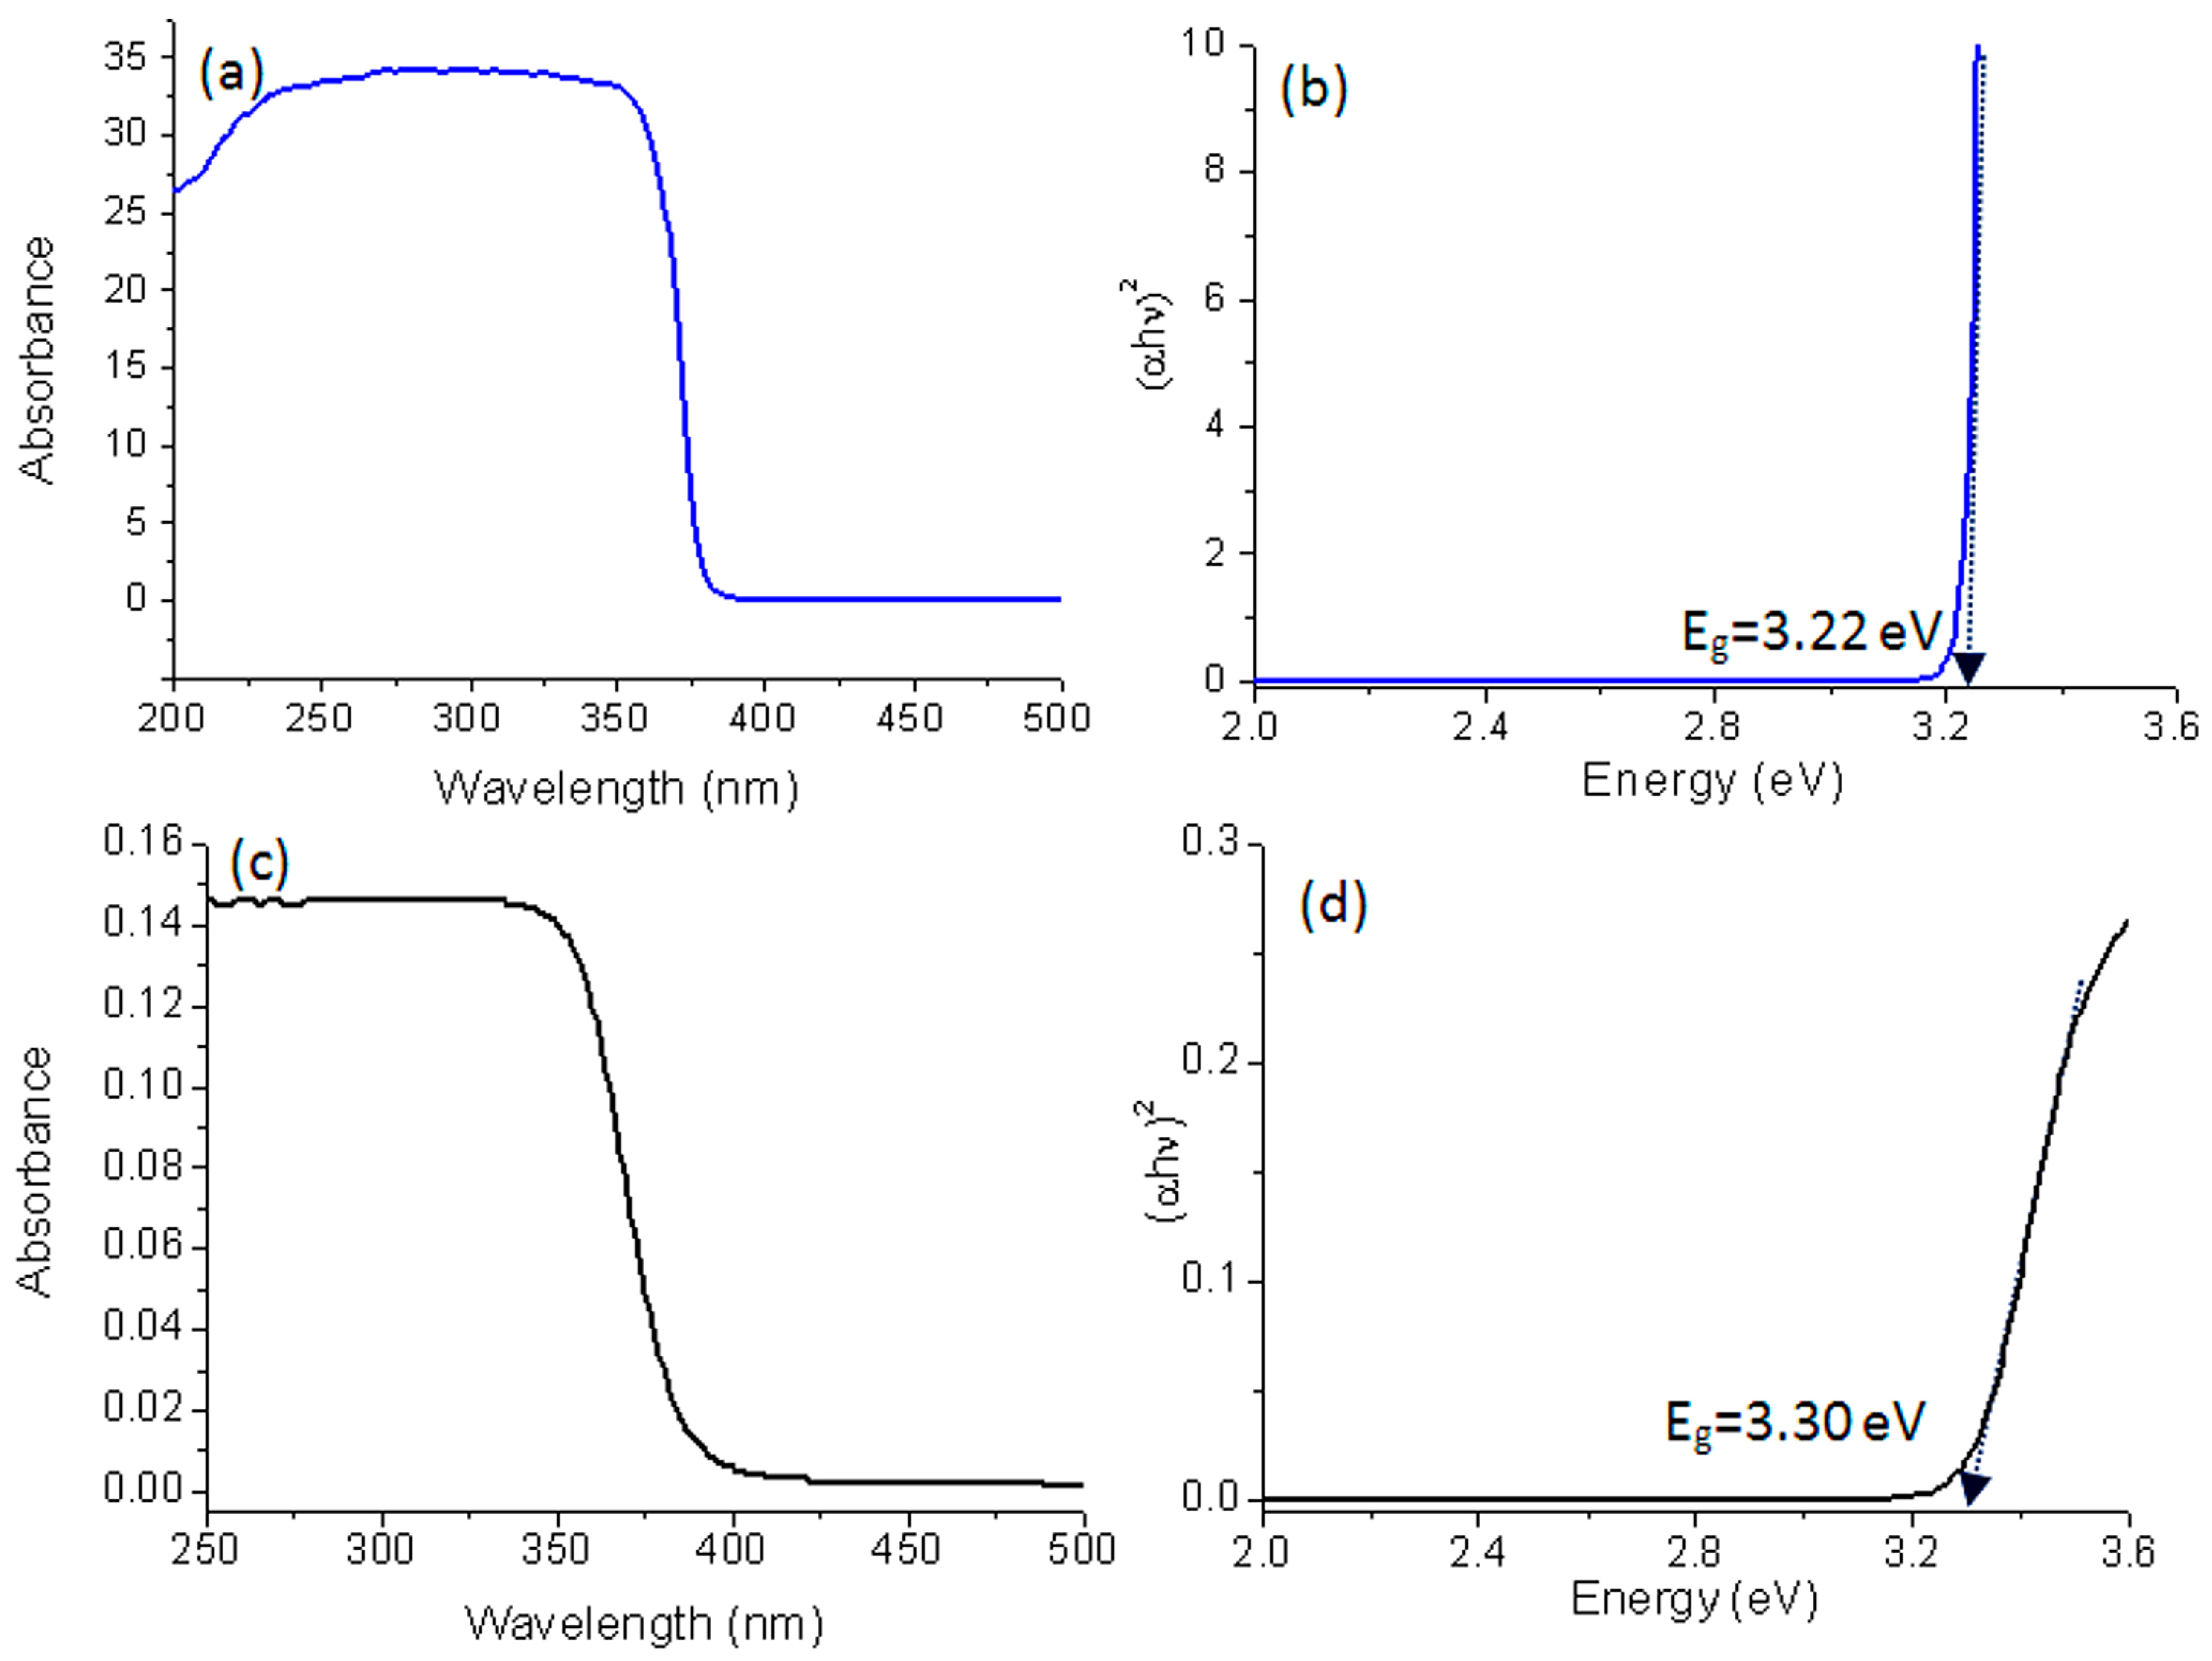
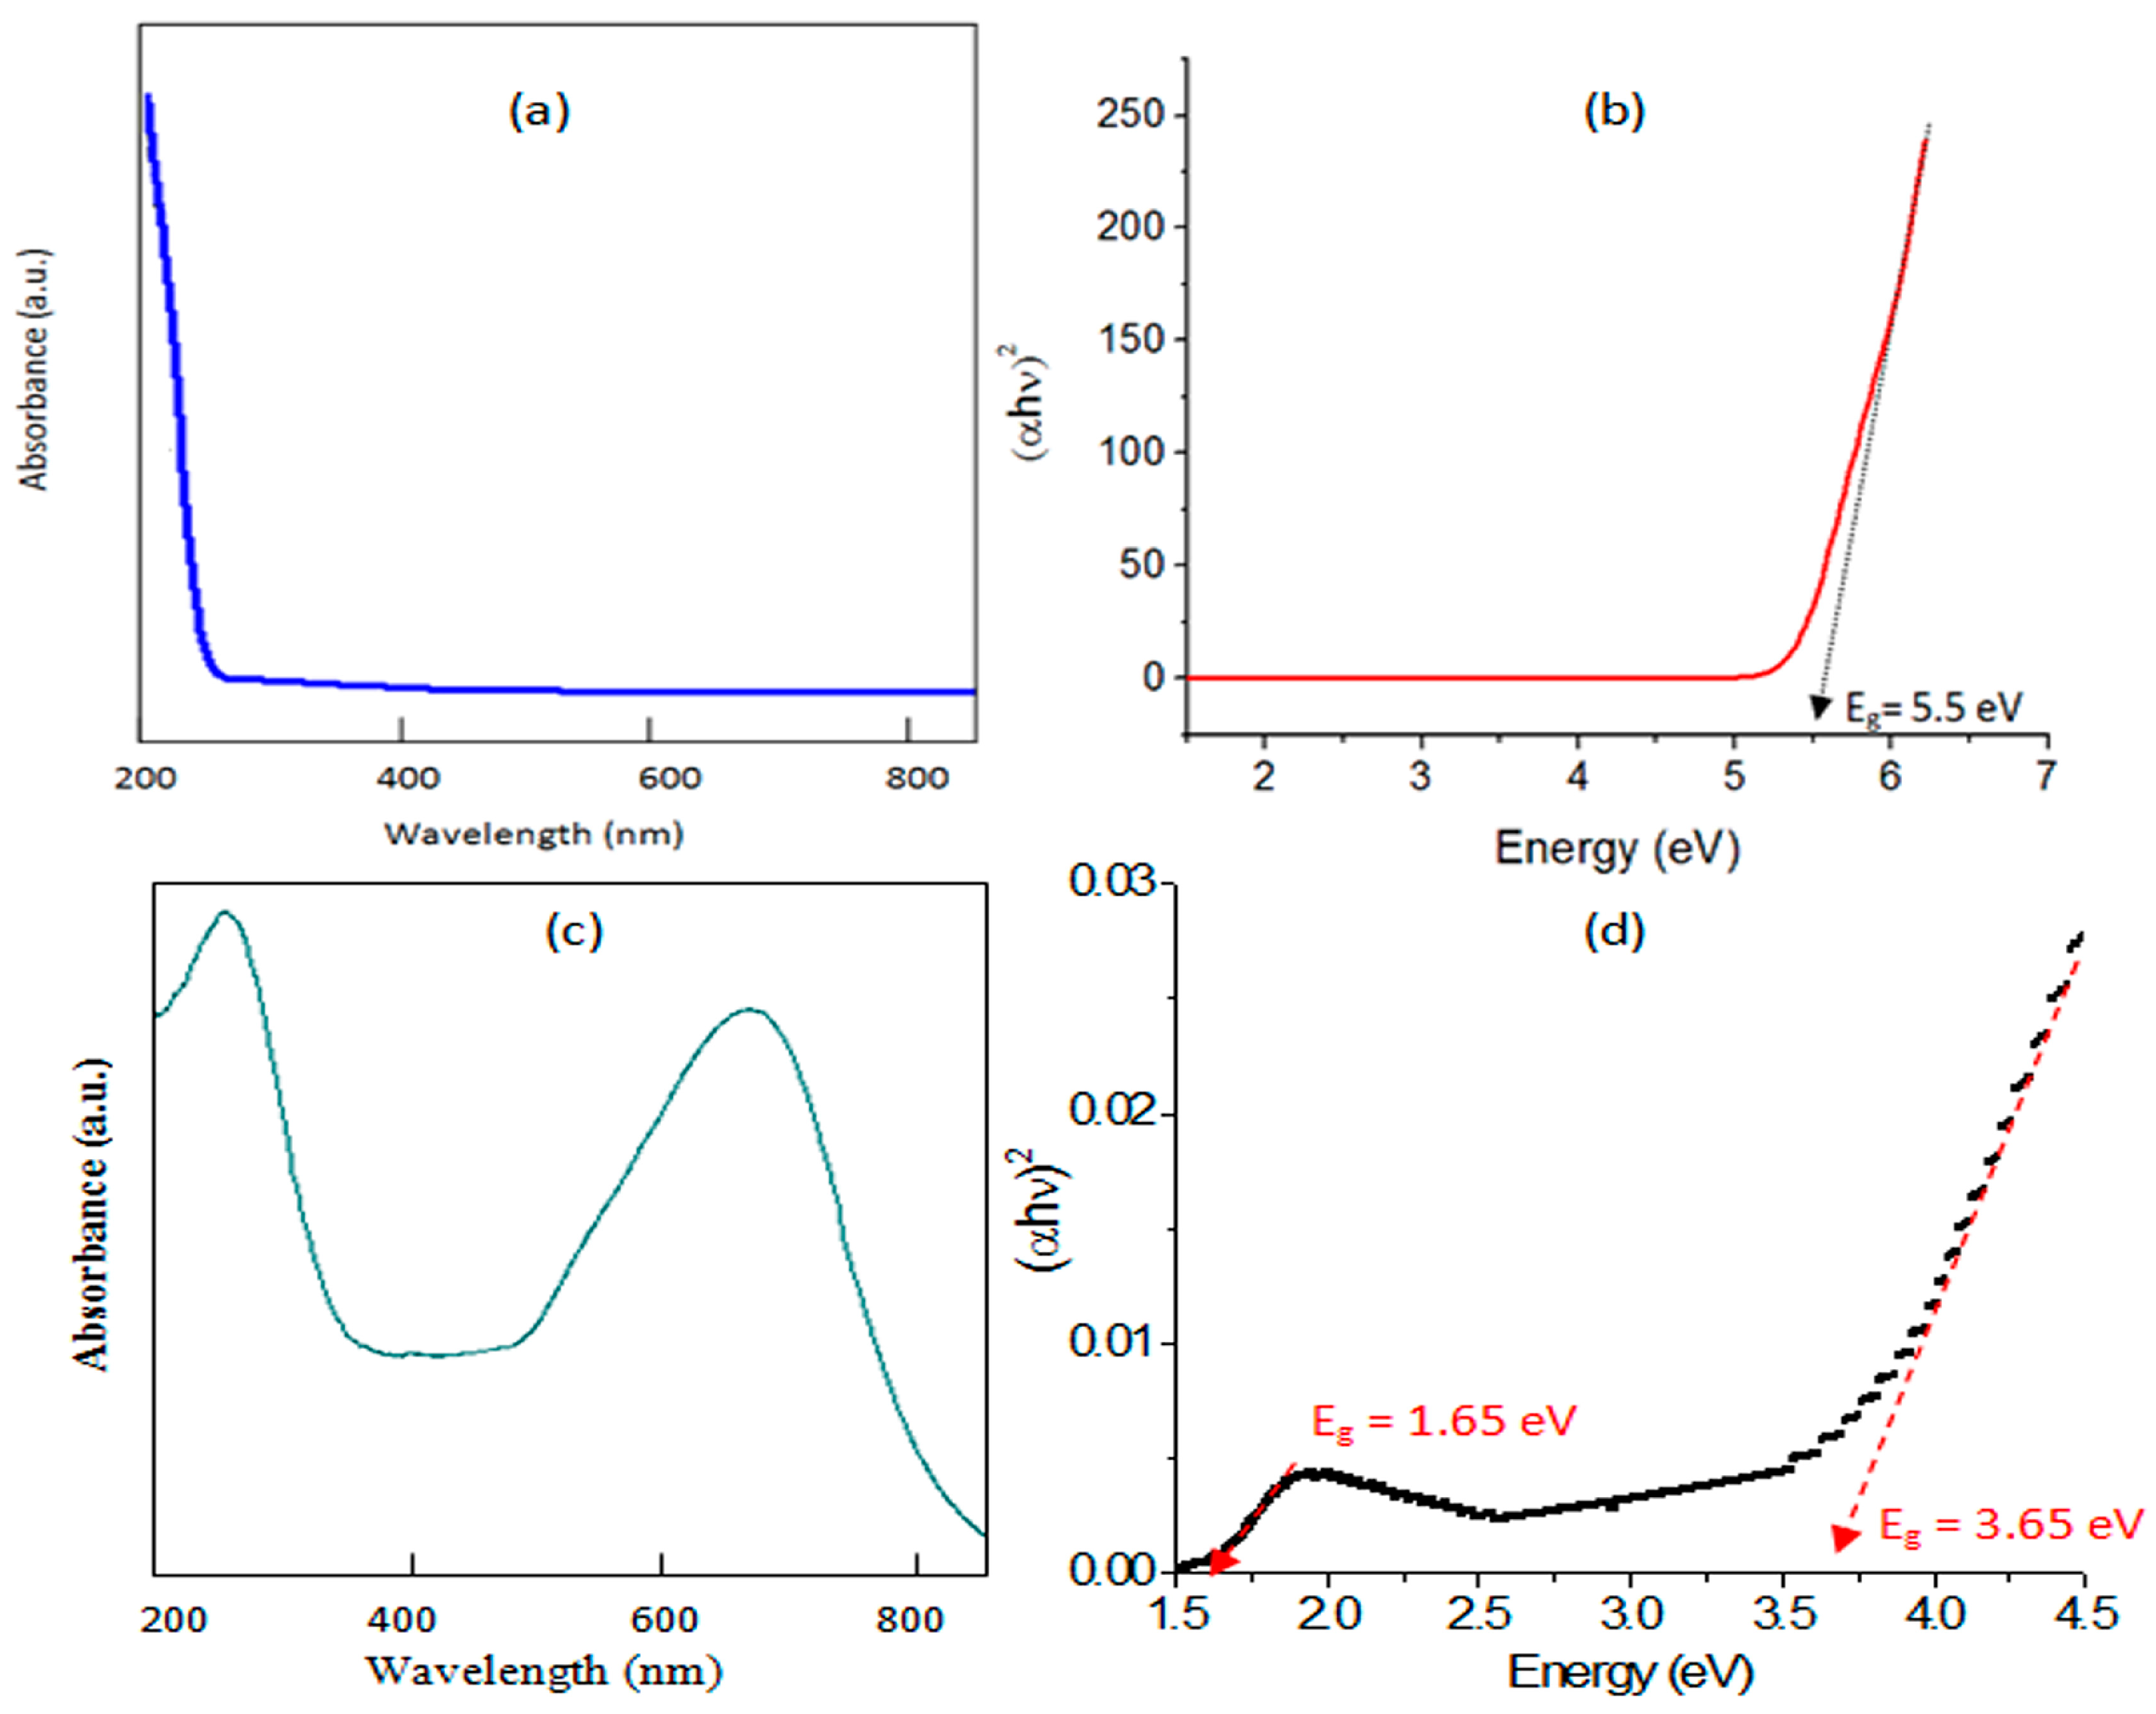
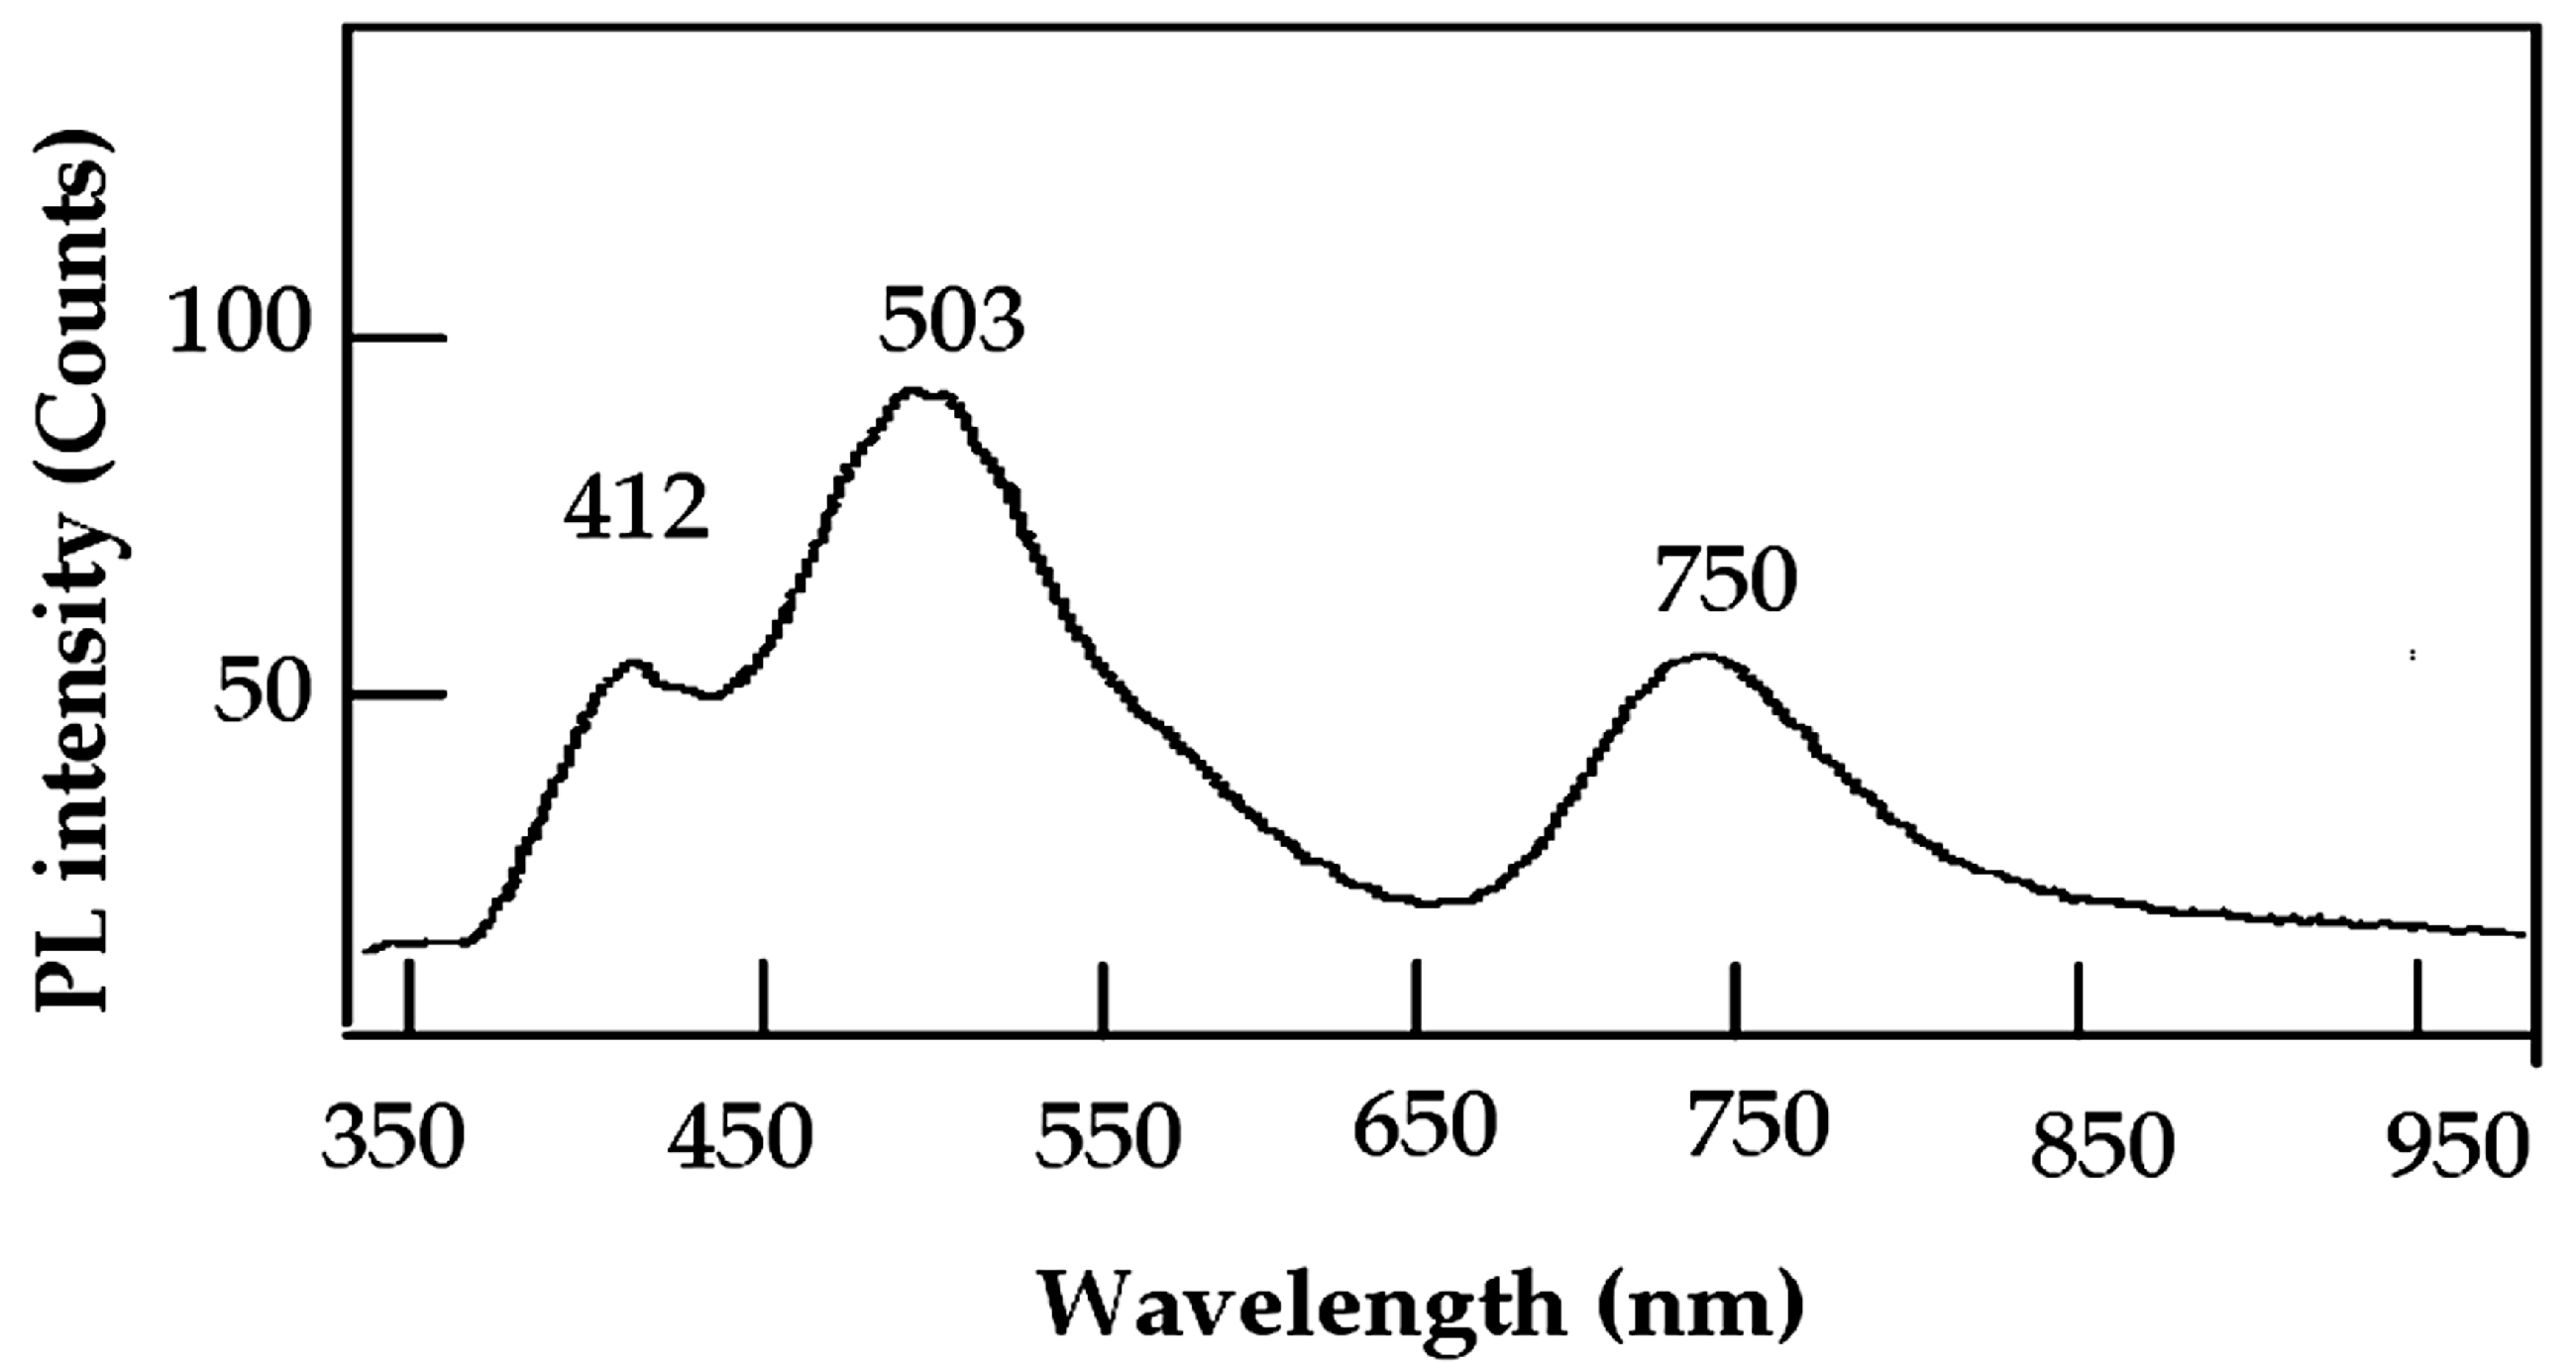
2.5. Optical Properties

A nondestructive technique was used to measure the optical characteristics of the produced samples with a UV–Vis–NIR spectrophotometer. ZnO is an oxide semiconductor with significant exciton binding energy (60 meV) and an optical band gap of approximately 3.37 eV [1]. The absorbance spectrum of the produced ZO-1 nanoparticles in the wavelength range of 220–360 nm is displayed in Figure 7a.
The excitonic transition is linked to the rapid rise in absorbance. Direct electronic transitions from the valence band to the conduction band determine the cut-off behavior at the blue end of the spectrum. As a result, the direct optical band gap, Eg, can be calculated using absorption data collected at short wavelengths. The theoretical relationship between Eg and the absorption coefficient for direct band gap energy is expressed as (αhν)2 = constant (hν−Eg)1/2. The absorbance factor is α, and the value (v) represents the frequency of radiation. Figure 7b depicts a plot of (αhν)2 versus photon energy (hν). The optical band gap, Eg, is calculated by extrapolating the plot’s linear section. The obtained value for Eg is 3.22 eV. A minimal shift from 3.37 eV to 3.22 eV was observed. This is feasible given the nanoscale dimensions of the synthesized zinc oxide and the quantum confinement area.
Figure 7c,d show the UV–visible absorbance spectrum and band gap energy of TO-2. Figure 7c depicts the absorbance spectrum of TO-2 between 250 nm and 340 nm. These findings indicate that the TO-2 nanoparticles are sensitive in the UV region, which is consistent with previously published titanium dioxide results. This conclusion was supported by computing the band gap energy for TO-2, as seen in Figure 7d. TO-2’s band gap energy was 3.30 eV. The band gap energies are comparable to those of bulk titanium oxide. This is acceptable given that the titanium dioxide nanoparticles generated in this study are much larger than the quantum confinement zone.
The conventional value Eg of silica–alumina is 7.5 eV [19]. This large band gap energy observed for silica–alumina indicates that these structures are not light-sensitive and, therefore, are not inherently suitable as optical materials. These data were confirmed by measuring the UV–Vis absorbance of the prepared silica–alumina nanoparticles (SA-3) as shown in Figure 8a. The UV–Vis absorbance spectrum of SA-3 exhibited an absorption cut-off below 275 nm. Also, the band gap energy of SA-3, shown in Figure 8b, was calculated to be 5.5 eV, which is characteristic of pure silica–alumina. To enhance light sensitivity, this study has used a new approach for preparing silica–alumina in the presence of explosive reactions. SAGC-3 was prepared and investigated using a UV–Vis absorption technique.
Figure 8c,d show the UV–Visible absorbance spectrum and the band gap energy of SAGC-3. Figure 8c shows significant absorption in both the visible and UV regions, with two pronounced maxima at 250 nm and 650 nm. Additionally, an absorption cut-off is observed near 800 nm. This finding indicates that, following modification via explosive reactions, the silica–alumina structure becomes sensitive to UV radiation and visible light. The enhancement in optical properties can be attributed to the incorporation of CNTs, CNFs, and gold nanoparticles.
The band gap energy was calculated to verify this improvement. SAGC-3’s band gap energy is displayed in Figure 8d. Two band gap energies were detected at 1.65 eV and 3.65 eV. From 5.5 eV to 1.65 eV and 3.65 eV, the band gap energy was reduced compared to conventional silica–alumina. The significant red shift and considerable narrowing of the band gap energy can be attributed to the introduction of new electronic states within the band gap, resulting from defects in CNFs and CNTs defects.
The absorption edge of the prepared materials is defined by the cut-off wavelength (λcut-off), which corresponds to the wavelength at which the material begins to absorb light. The energy of the band gap (Eg) can be used to compute the λcut-off, as indicated by the following expression: λcut-off = 1243/Eg [30,31]. The λcut-off of ZO-1 occurred at 386.0 nm, which is consistent with the pure zinc oxide value presented in Table 1.
For the pure titanium oxide, the λcut-off of TO-2 was observed at 376.7 nm. The cut-off wavelengths of both ZO-1 and TO-2 indicated that they are sensitive to light at the UV region. For SA-3, the cut-off wavelength was observed at a low value of 226 nm, indicating that the conventional silica–alumina is only responsive to a very narrow range of UV light. When modified via explosive reactions, the silica–alumina structure exhibited a strong red shift for λcut-off from 226.0 nm to 753.3 nm. According to Table 1, the λcut-off for SAGC-3 occurred at 753.3 nm and 340.6 nm, confirming that SAGC-3 is active in a wide range of light from the UV to the visible region, indicating that the optical characteristics of silica–alumina are significantly improved by the explosive reactions. The shift in the cut-off wavelength and the reduction in band gap energy enhanced the light sensitivity of the prepared nanocomposite SAGC-3 across the visible and ultraviolet spectra.

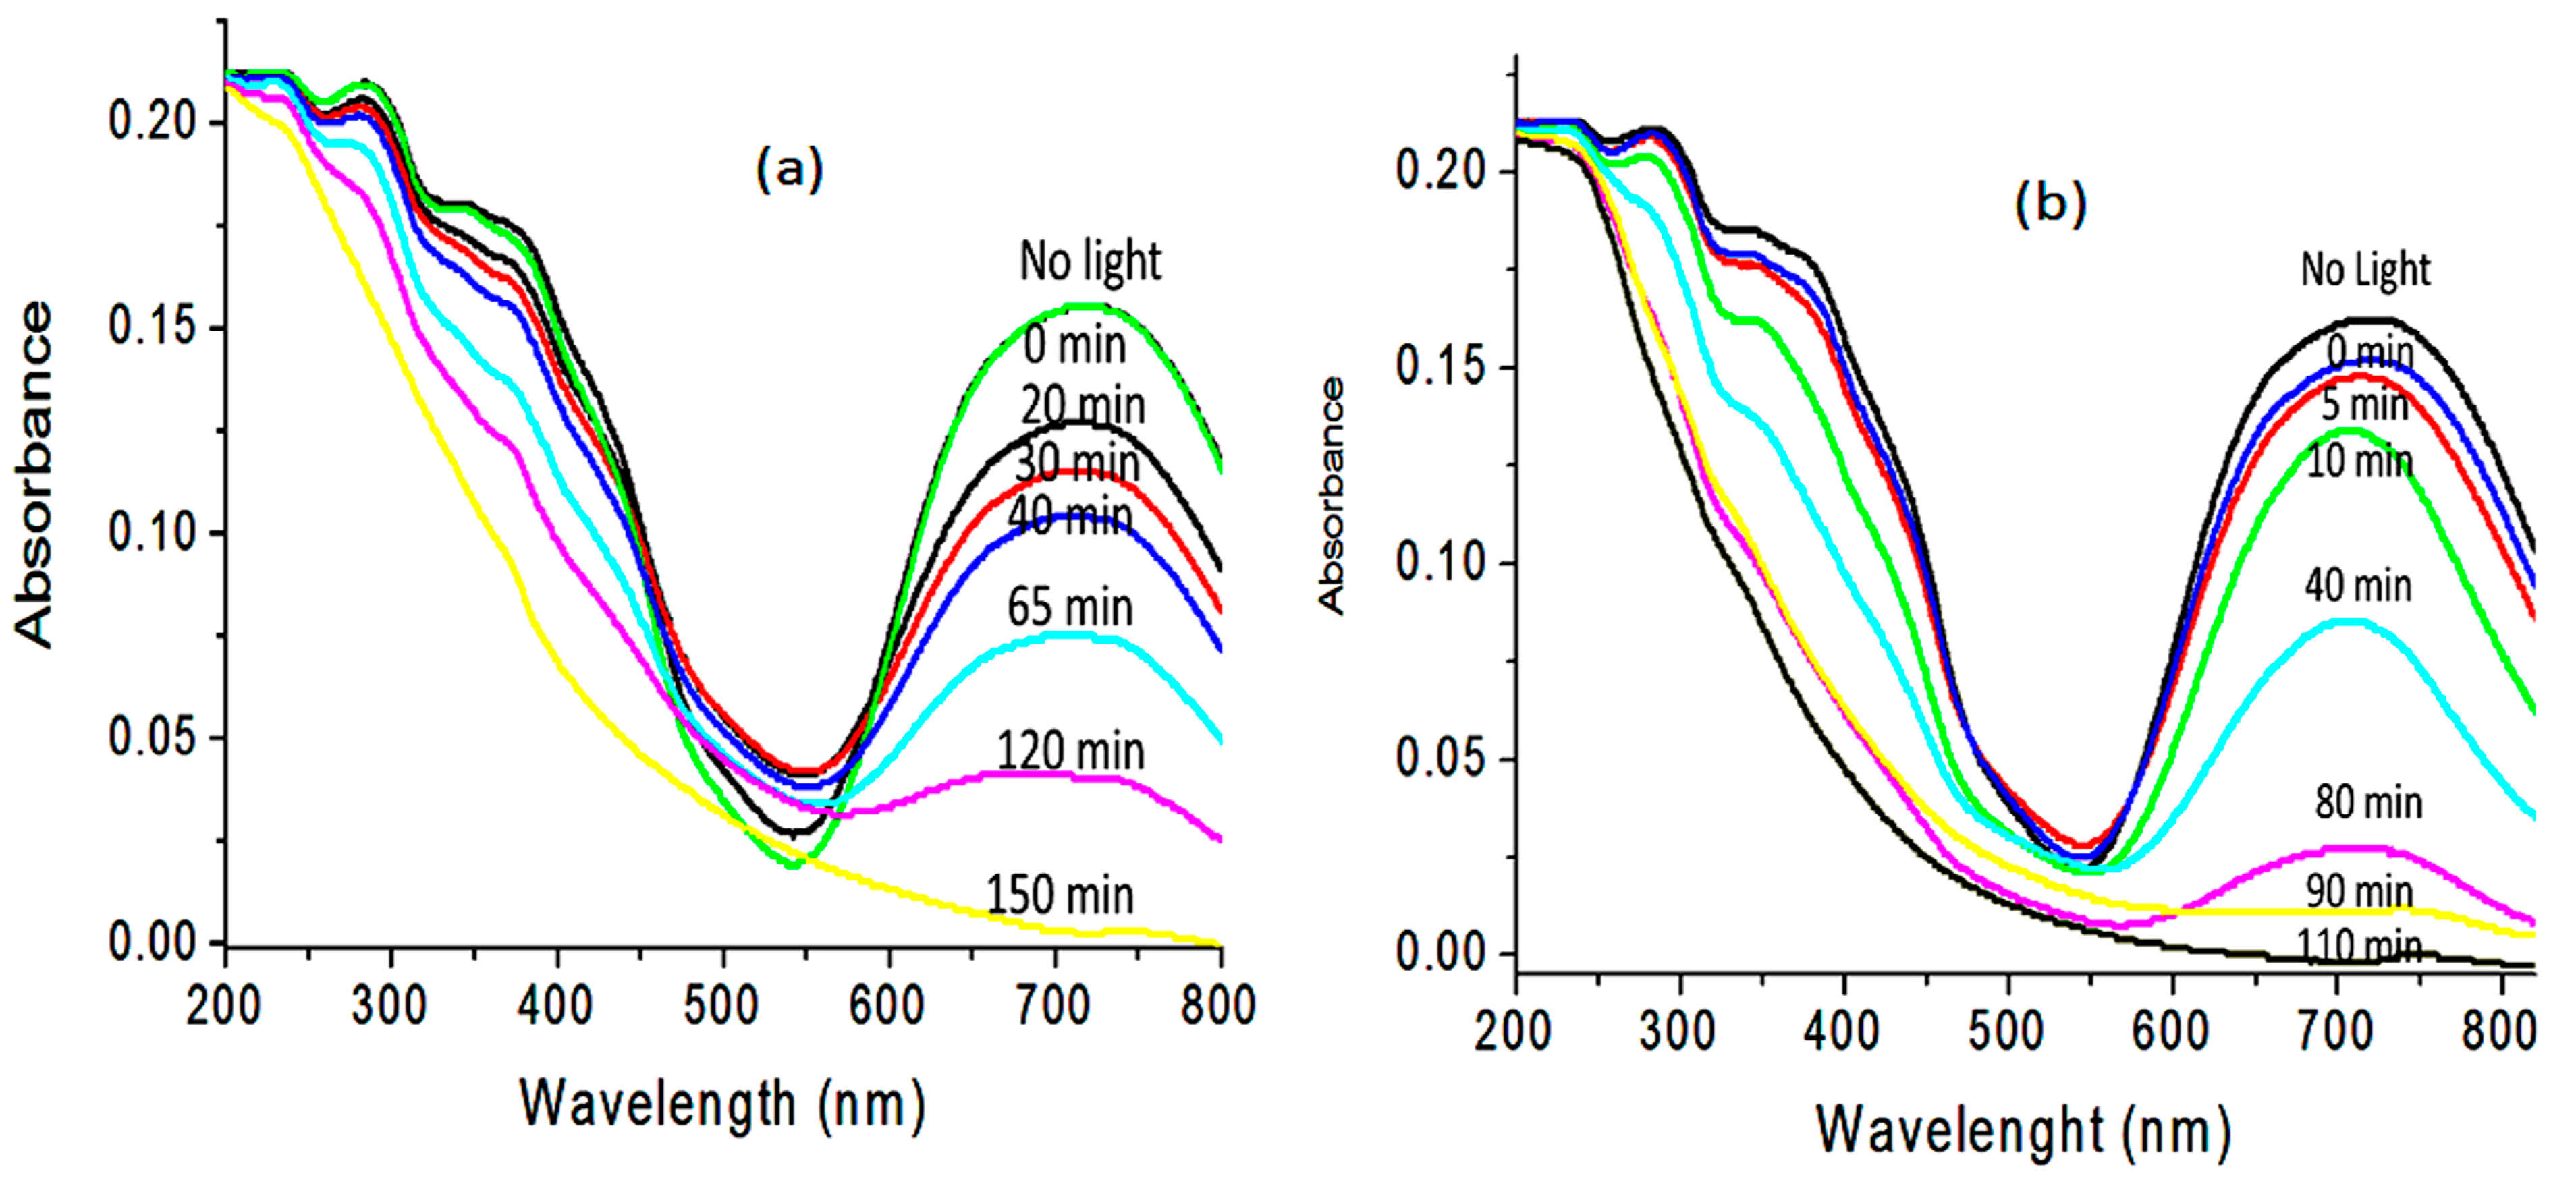
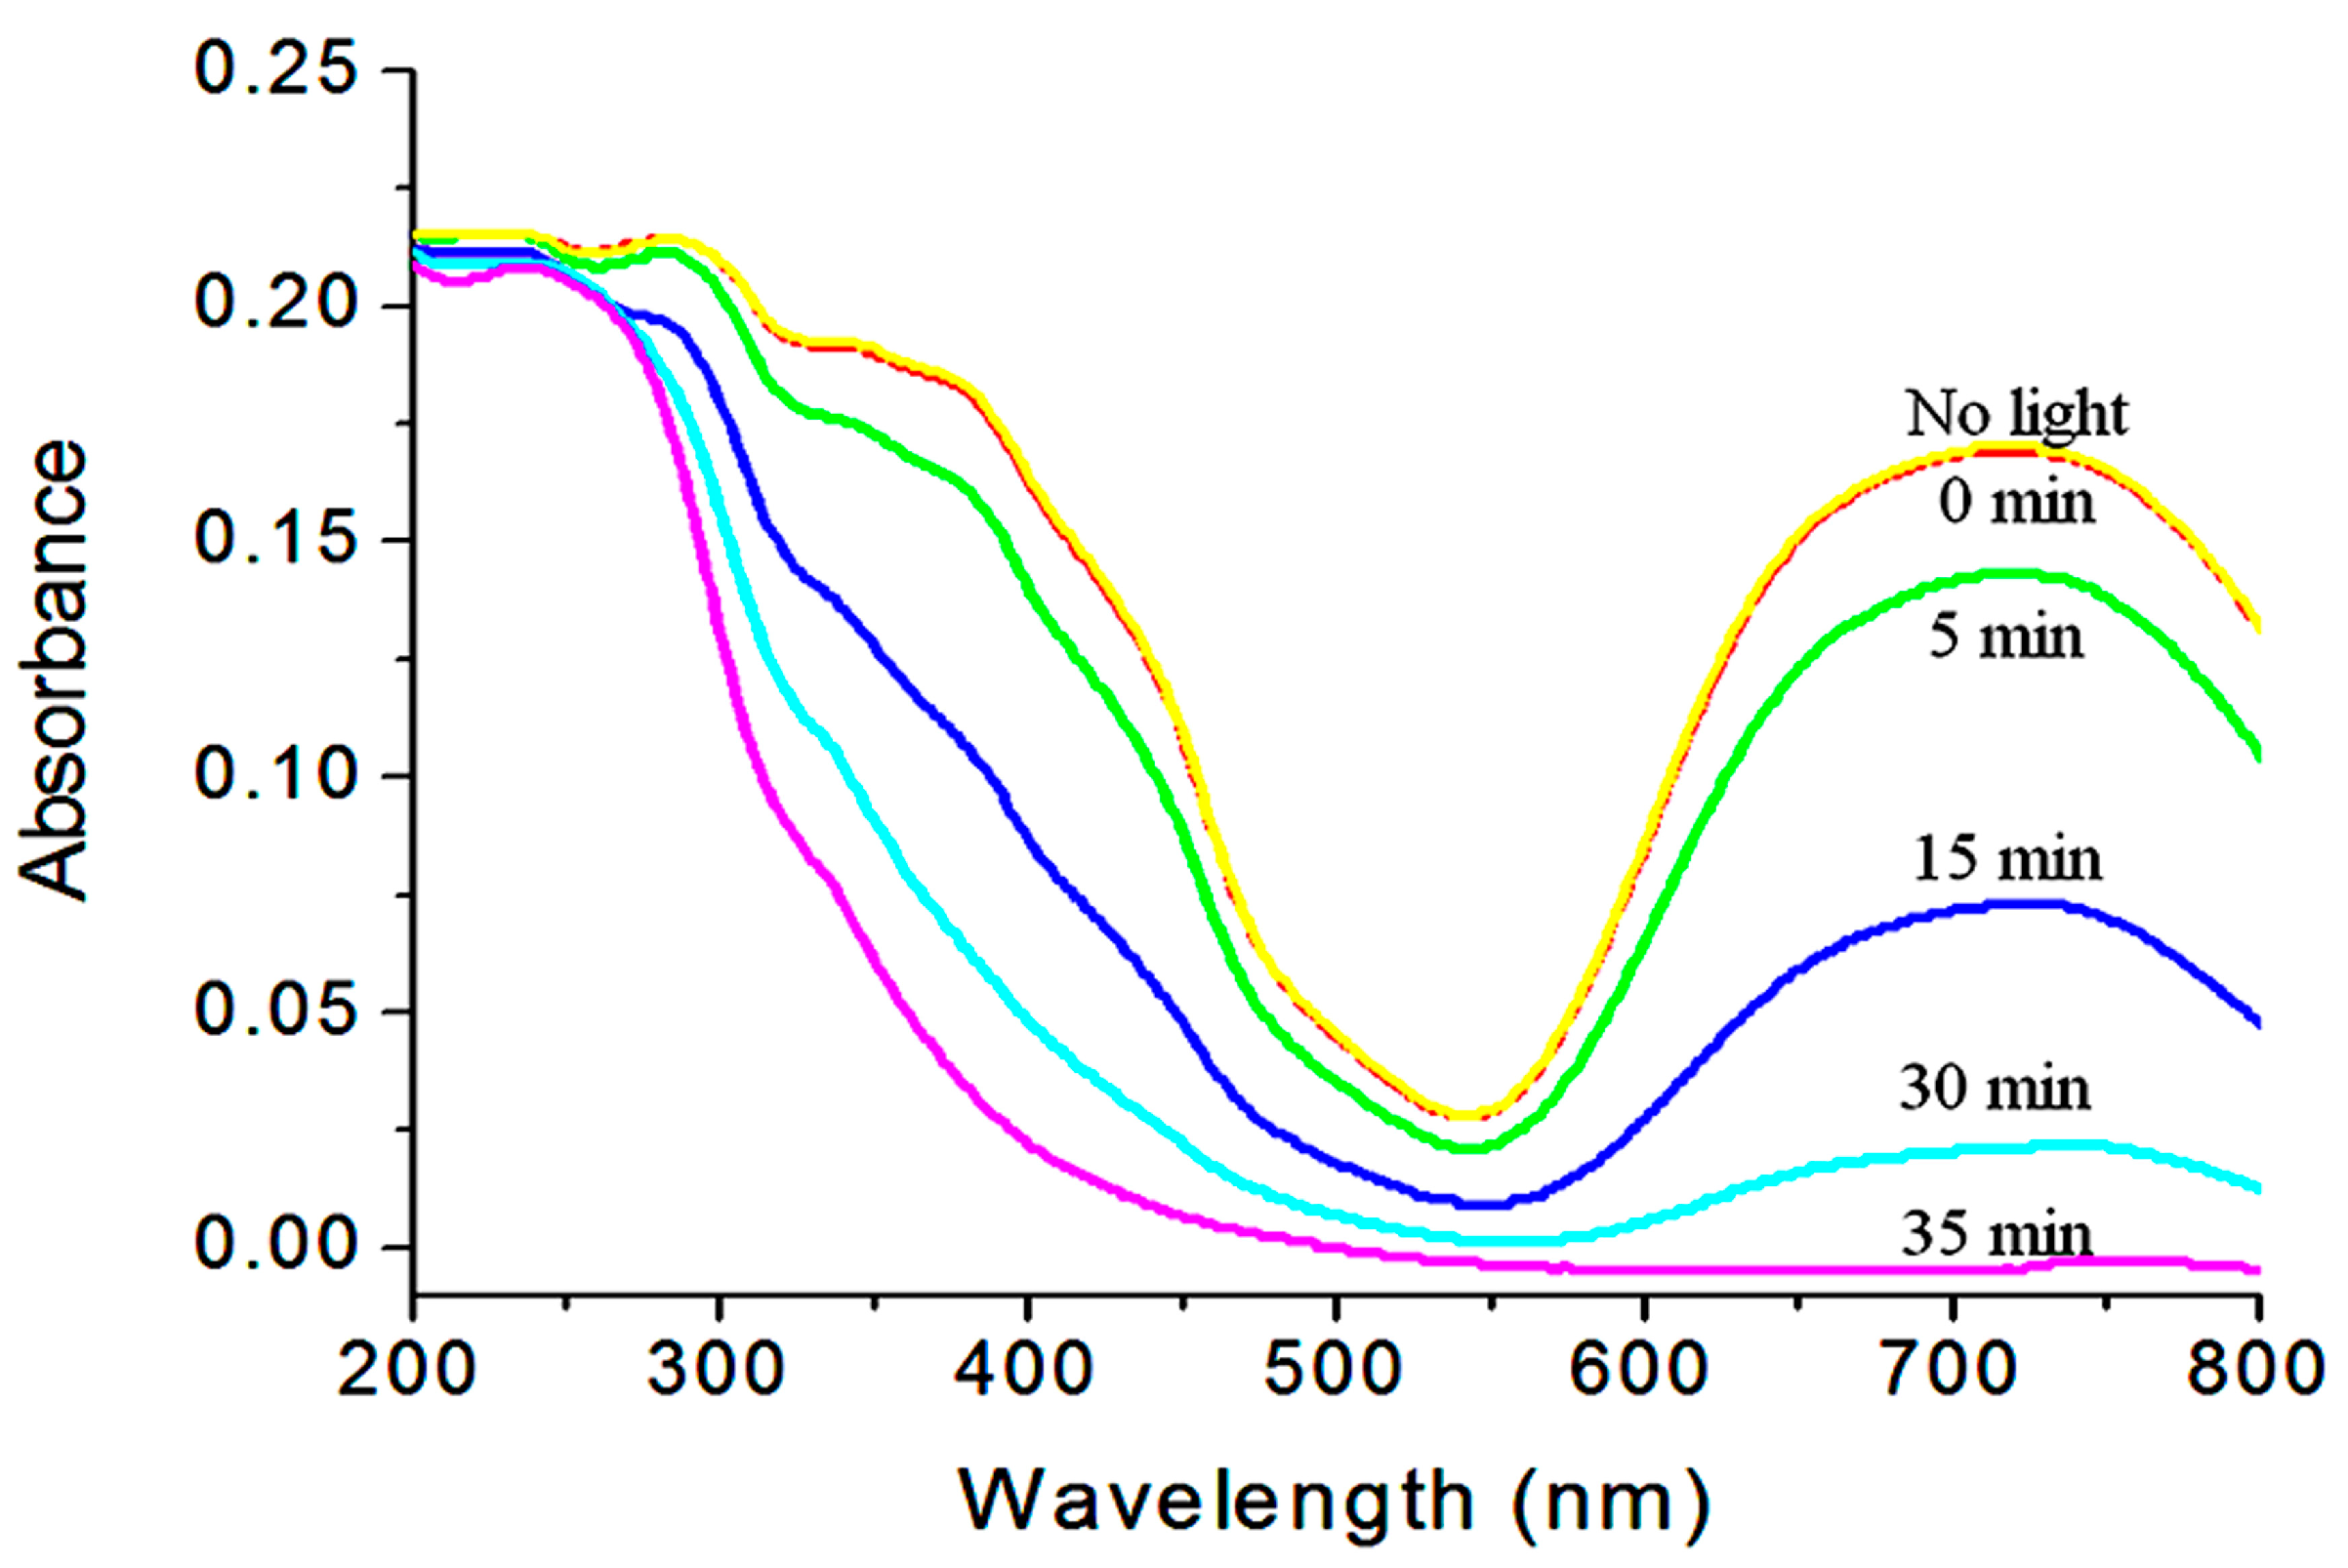
2.6. Water Purification
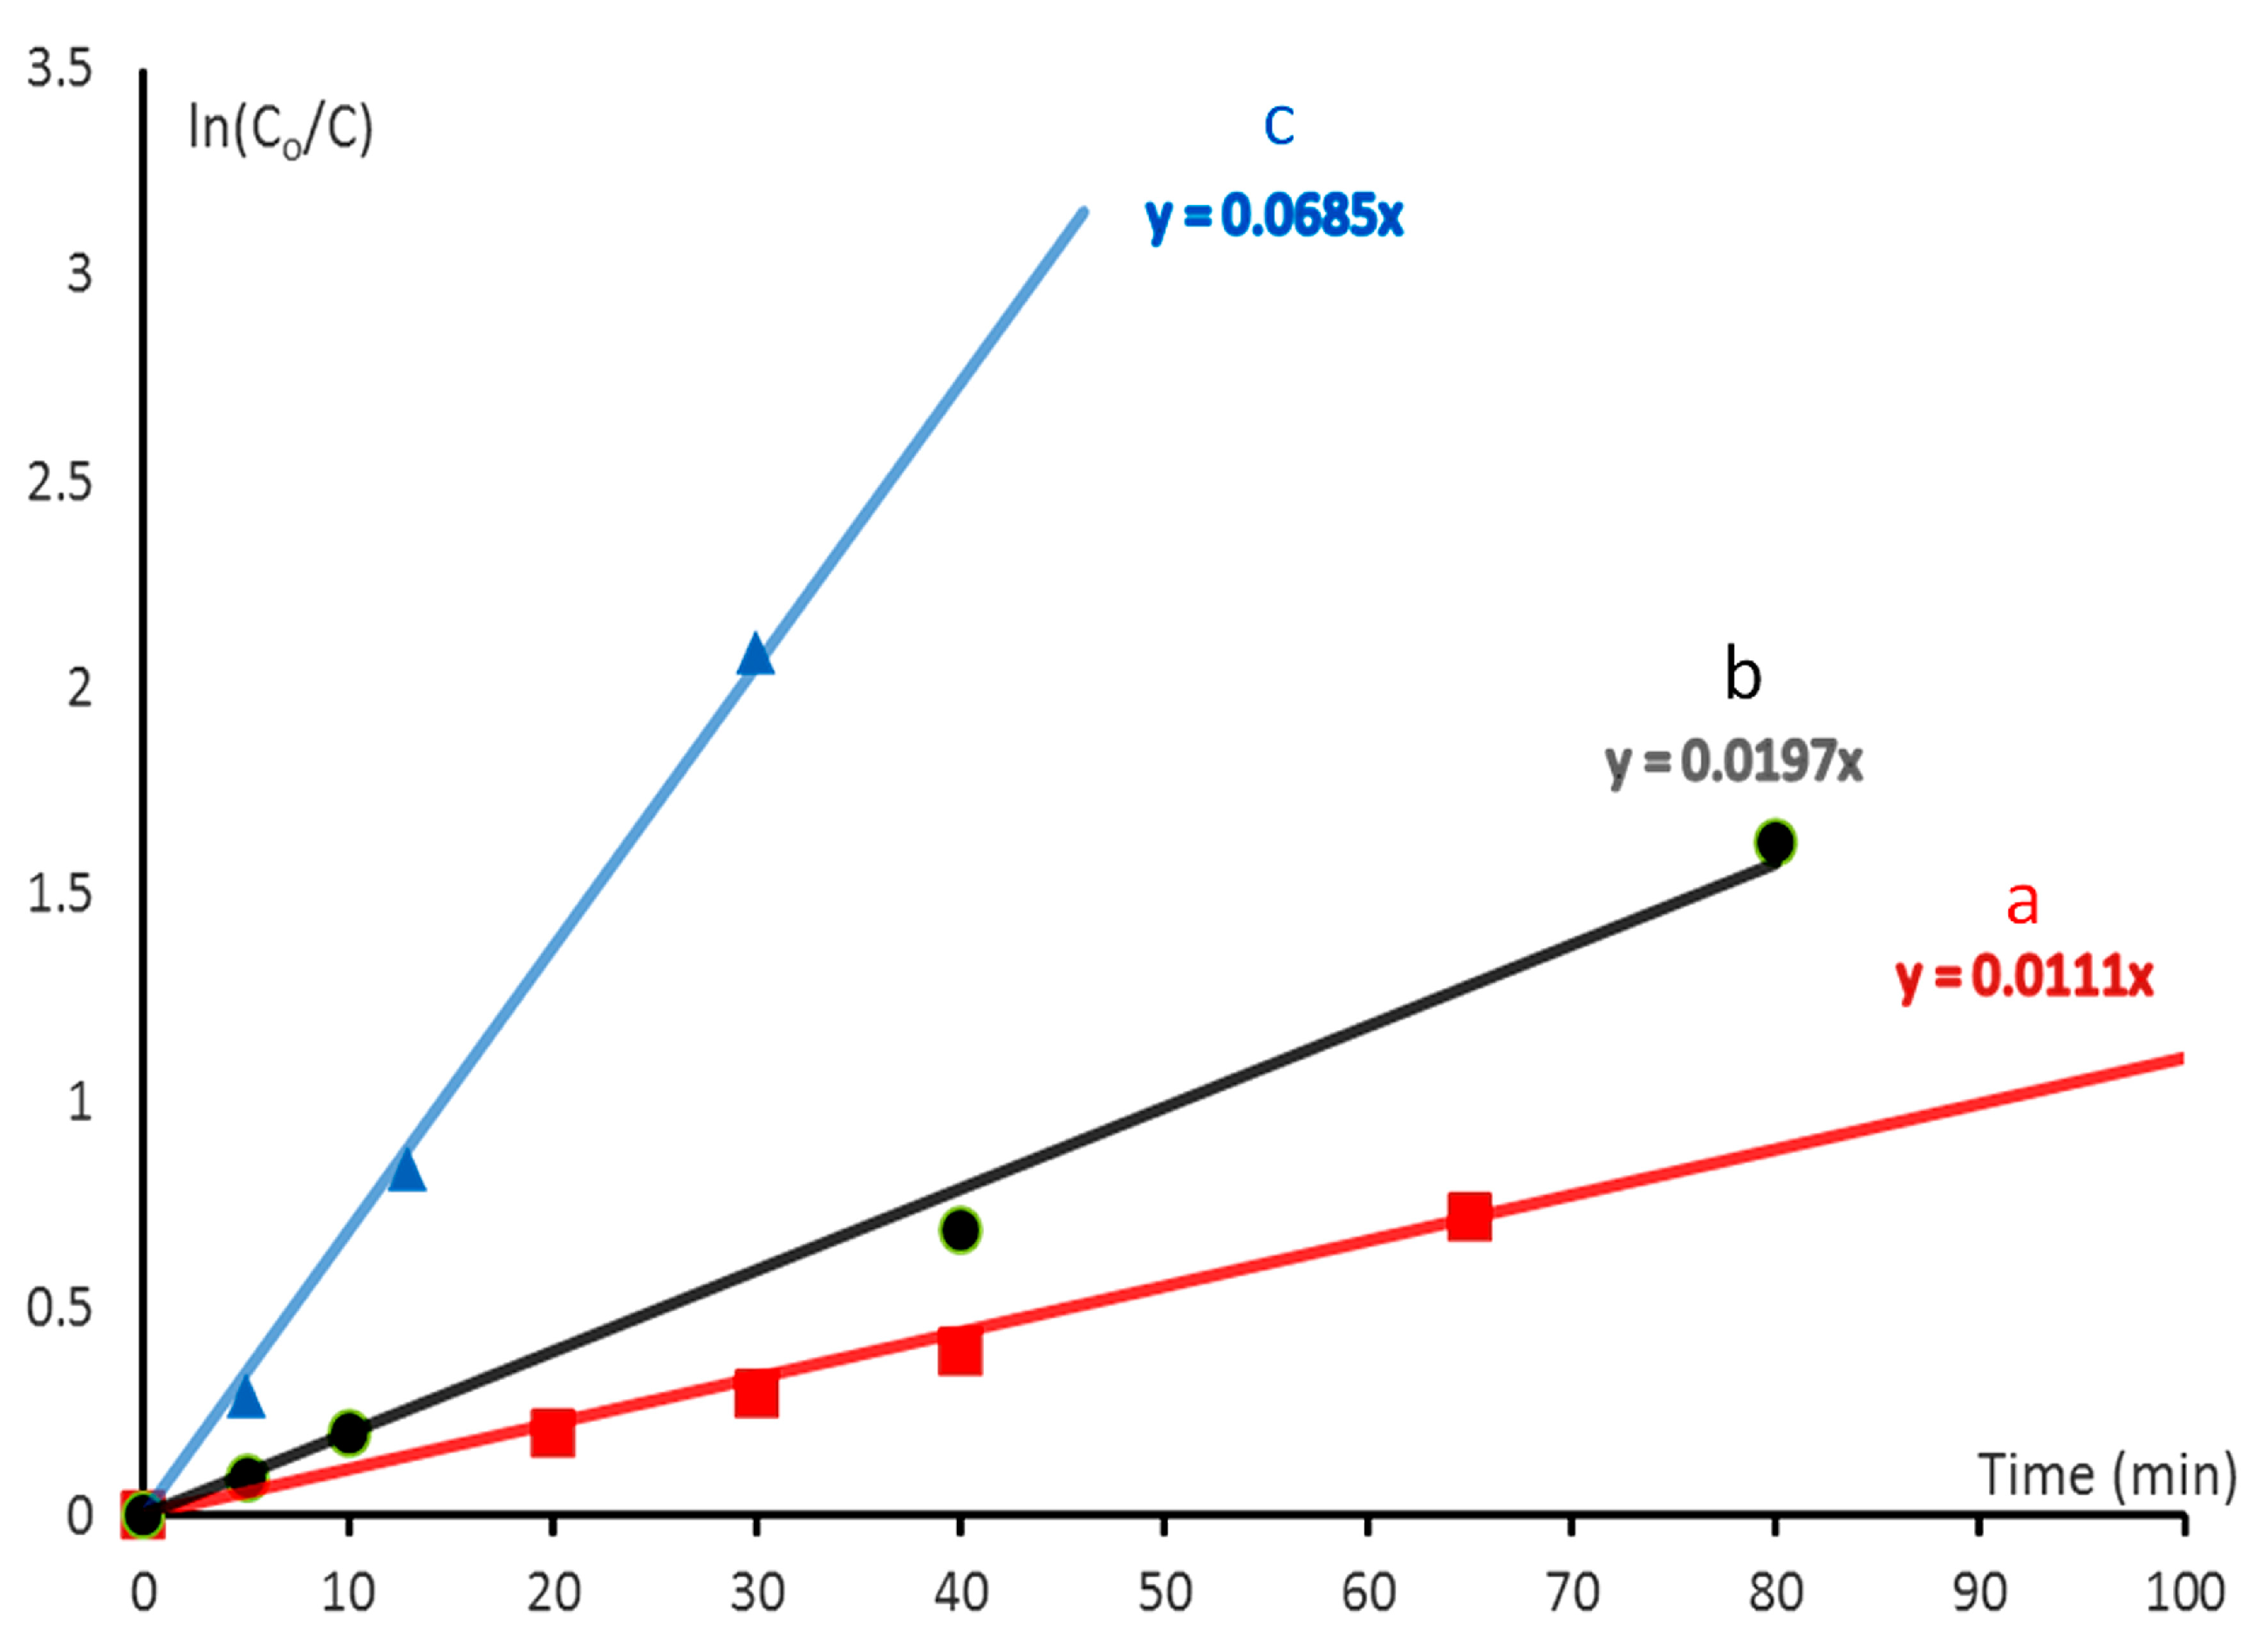
The optical activity of the modified silica–alumina was compared with that of conventional silica–alumina and the well-known photocatalysts ZnO and TiO2 through photocatalytic degradation of naphthol green B (NGB) dye in water. The photocatalytic degradation of NGB was examined while exposing the aqueous solution of NGB to UV light in the presence of the nanomaterials. The absorbance of the colored solution was measured at various intervals following light exposure. NGB degradation is shown by a decrease in absorption at λmax = 714 nm. Other absorption peaks at 320, 283, and 232 nm reveal degradation of naphthyl rings in NGB, as seen in Figure 9 and Figure 10. Blank controls were performed without a photocatalyst. NGB was stable under light irradiation. The photocatalytic degradation of NGB was studied as a function of light irradiation time in the presence of one of the nanomaterials (ZO-1, TO-2, SA-3, and SAGC-3). As shown in Figure 9a, minimal degradation was noted when the samples were combined with NGB solution and placed in a dark environment for 30 min. This time point is noted as 0 min irradiation and used for comparison. The photocatalytic degradation of NGB was detected upon light exposure in aqueous solutions of NGB that contained the synthesized nanomaterials. The results are presented in Figure 9 and Figure 10.
In the absence of light, Figure 9a illustrates how the adsorption ability of ZO-1 affects the NGB concentration. The dye concentration was not altered, suggesting that the adsorption process had no impact on the photocatalytic degradation of NGB. In the presence of light, the photocatalytic decomposition of NGB increased as the radiation time increased. After 150 min of exposure to light, 100% of NGB was degraded, as shown in Figure 9a.
As shown in Figure 9b, the TO-2 sample yielded minimal changes in the NGB concentration in the absence of light, indicating that only adsorption occurred under these conditions. With light, the photocatalytic degradation of NGB increased as shown in Figure 9b. Complete disappearance of the green color of the dye was observed after 110 min of light radiation.
In the presence of SAGC-3, fast photocatalytic degradation was observed as shown in Figure 10. Light radiation caused a clear reduction in the dye concentration after 5 min. This reduction continued to increase with ongoing light exposure, achieving 100% dye removal after 35 min. This indicates that the SAGC-3 sample accelerated the photocatalytic degradation of NGB. This acceleration was notable based on comparisons with the conventional silica–alumina SA-3. Figure 11 shows the photocatalytic degradation of NGB after 35 min of light radiation in the presence of the conventional silica–alumina SA-3 and the modified silica–alumina SAGC-3.
In the presence of SA-3, minimal variation in the dye concentration was noted after 35 min of light radiation. Figure 11 shows a low removal rate of green dye (2.4%). This indicates that the conventional silica–alumina is ineffective in the presence of light. A comparison between the results before and after modification reveals that the growth of CNTs and CNFs through explosive reactions plays a positive role in producing an efficient photocatalyst.
Additionally, Figure 11 presents a comparison between the photocatalytic decomposition of NGB after 35 min of light irradiation in the presence of the modified silica–alumina and the well-known photocatalysts titanium dioxide (TO-2) and zinc oxide (ZO-1). This comparison indicates that the modified silica–alumina is more effective under light irradiation than titanium dioxide and zinc oxide.

2.7. Kinetic Study

Kinetic models have been used to measure the rate of photocatalytic degradation. The Langmuir–Hinshelwood mechanism has been identified as a suitable model for heterogeneous photocatalysis. The photocatalytic degradation of NGB solutions in water is characterized as a bimolecular reaction. Throughout this process, the concentration of water remains constant, while the dye concentration varies significantly over time. Consequently, this reaction resembles a first-order (monomolecular) reaction. The kinetic reactions involved in the degradation of the NGB dye were analyzed using the following equation:
ln Co/Ct = kt
The initial concentration of the dye (Co) was recorded at time zero, while the concentrations at various subsequent times (Ct) were also measured. The variable (k) represents the reaction’s rate constant. Kinetic curves illustrating the photocatalytic breakdown of NGB with the synthesized photocatalysts ZO-1, TO-2, and SAGC-3 are presented in Figure 12.
Figure 12a illustrates the linear relationship observed in the decomposition of dyes when utilizing ZO-1, indicating that this process follows a pseudo-first-order kinetic reaction. Furthermore, the rate constant for this reaction is determined to be 0.0111 min−1. In Figure 12b, the linear relationship for the dye decomposition reaction using TO-2 is presented, with a rate constant of 0.0197 min−1. The decomposition reaction’s rate constant increased to 0.0685 min−1 for SAGC-3, as shown in Figure 12c. In addition to the support of gold, the kinetic parameters of SAGC-3 demonstrate the beneficial effects of CNTs and CNFs in accelerating the rate of photocatalytic degradation of NGB.
The analysis of the modified silica–alumina (SAGC-3) in relation to traditional photocatalysts, such as zinc oxide (ZO-1) and titanium dioxide (TO-2), demonstrated the successful development of a novel and efficient photocatalyst based on silica–alumina for the removal of colored contaminants from water. Furthermore, as illustrated in Figure 12, the modified silica–alumina significantly enhanced the photocatalytic degradation rate of NGB, achieving a speed three times greater than that of the synthesized titanium dioxide and six times faster than the synthesized zinc oxide.

3. Discussion

The modified silica–alumina SAGC-3 demonstrated outstanding photoactivity, as evidenced by its rapid photocatalytic degradation of NGB when exposed to light. The impressive performance of SAGC-3 can be attributed to three key factors that enhance the photocatalytic degradation reaction. The mechanism of these photocatalytic degradation reactions is driven by three essential processes as follows:
Separation: SAGC-3 + Light → h+ + e
Accumulation of electrons: e → Conduction band
Recombination: h+ + e → Catalyst
The first factor depends on the growth of CNTs and CNFs with silica–alumina nanoparticles based on explosive reactions. The effective incorporation of silicon and aluminum oxides with the crystalline structure of carbon species created new optically active centers within the photocatalysts, leading to a reduction in its band gap energy. This reduction enhances its effectiveness under light because of the low band gap energy of T-carbon (2.273 eV) [32]. Therefore, the band gap energy of aluminum oxide nanoparticles decreased from 5.5 eV (SA-3 pure silica–alumina nanoparticles) to 1.65 eV and 3.65 eV for SAGC-3. This factor accelerated the separation process (Equation (2)) between the electrons and holes. By accelerating the reaction described in Equation (2), the excited electrons are collected in the conduction band, as shown in Equation (3). In the presence of a large number of electrons in the conduction band, the electrons tend to return to the valance band due to their mutual repulsion. In the recombination process (Equation (4)), the electrons recombine with holes in the valance band, which slows down the photocatalytic process. Therefore, these electron accumulation and recombination processes must be prevented to accelerate photocatalytic reactions. The presence of CNTs and CNFs offers another advantage in this regard. CNTs and CNFs prevented the accumulation and recombination processes through a fast transfer of electrons from the conduction band to other spots over the surface of the photocatalyst because the carbon nanotubes and nanofibers are good conductors that function like electrical wires.
The second factor focuses on the mesoporous structure of silica–alumina and its high surface area. The nanopores of SAGC-3 (pore radius = 7.78 nm) serve as effective traps for capturing pollutants, facilitating rapid degradation. In addition, the high surface area of SAGC-3 (SBET = 307.0 m2/g) increases the available surface area for light exposure and enhances the efficiency of the photocatalytic reactions.
Gold is the third factor that accelerates photocatalytic degradation through several beneficial effects on the photocatalyst. Gold has a wide range of light absorption and can act as electron traps. Additionally, it possesses strong surface plasmon resonance (SPR), which functions as a light-trapping receptor. Image mapping of SAGC-3 revealed a high dispersion of gold nanoparticles over the photocatalyst surface.
Based on these factors, the fast photocatalytic degradation of NGB was achieved through the production of numerous oxidizing agents, as shown in Figure 13.
In Figure 13, the separation process was accelerated by lowering the band gap energy and creating new active sites in addition to the effect of gold nanoparticles. At the same time, the carbon nanotubes and nanofibers facilitate the transfer of excited electrons across the surface of the photocatalyst. These excited electrons then react with oxygen molecules, generating a significant number of oxidizing agents. Because of the high surface area and the mesoporous structure of SAGC-3, a significant number of NGB molecules were trapped on the catalyst’s surface, where they react with oxidizing agents. Through advanced oxidation reactions, the dye was degraded and converted to carbon dioxide and water after 35 min of exposure to light radiation.
This mechanism was confirmed by photoluminescence (PL) measurements, which are a useful technique for studying the efficiency of photogenerated electrons and hole migration and separation. In the PL spectrum of SAGC-3 (Figure 14), three emission peaks were observed at 412 nm, 503 nm, and 750 nm with low intensity. The emission peaks were related to the separation and recombination rate of the photogenerated carriers.
Consistent with the results of Zhu et al. [33] and Liu et al. [34], the low intensity of the peaks suggests a high separation efficiency of the photogenerated electrons and holes, with a low recombination rate. Additionally, in agreement with the results of Xiang et al. [35], these peaks indicated that the photogenerated carriers have a prolonged lifetime, which is favorable for the photocatalytic reaction. The low intensity of the emission peaks could be due to trapping states or oxygen vacancies within the aluminum and silicon oxide structure, which are saturated by the carbon nanotubes and nanofibers.
In addition, the kinetic study confirmed the mechanism behind the rapid degradation of pollutants, showing that the modified silica–alumina (SAGC-3) accelerated the photocatalytic degradation rate of NGB three times faster than the prepared titanium dioxide and six times faster than the prepared zinc oxide.

4. Materials and Methods

4.1. Synthesis of the Modified Silica–Alumina

The modified silica–alumina nanocomposite was prepared in three steps. The first step depended on the reaction of Al(NO3)3 with NH4HCO3 to produce aluminum hydroxide(Al(OH)3) saturated with ammonium nitrate (NH4NO3), which can be used as explosive material. Then, the explosive material was mixed with an alcoholic solution of tetraethyl orthosilicate. In the second step, explosive reactions were performed using the alcoholic mixture inside an autoclave, as shown in Figure 15. The last step focuses on supporting gold nanoparticles onto the prepared nanocomposite.

4.1.1. Synthesis of Explosive Compounds

Aluminum nitrate Al(NO3)3·9H2O and tetraethyl orthosilicate (TEOS) were provided from Sigma Aldrich and used as sources for producing silica and alumina, respectively. Cetyl tri-methyl ammonium bromide (CTAB) surfactant was used to control the nano-size of the products. Ammonium bicarbonate (NH4HCO3) was used as a source for fabricating the explosive material, namely ammonium nitrate. Using the sol–gel technique, aluminum hydroxide was produced and combined with ammonium nitrate to work as a solid fuel. Initially, aluminum nitrate (0.03 M) and CTAB (0.0003 M) were mixed to produce one liter of aqueous solution. This solution was reacted with ammonium bicarbonate (10 wt.% solution) to produce a gel at pH = 6.7 as shown in the following equation:
Al(NO3)3 + 3NH4HCO3 → 3NH4NO3 + Al(OH)3 + 3CO2
This white gel was mixed with an alcoholic solution of 0.03 mole of TEOS. This mixture was stirred for 6 h to form a homogenous mixture. The gel was separated by filtration and dried at room temperature.

4.1.2. Explosive Reactions for Silica–Alumina CNT and CNF Growth

An appropriate amount of the prepared gel, synthesized in the previous step, was stirred with 250 mL of ethyl alcohol. The resulting alcoholic mixture was thermally treated by gradually heating it inside a pressurized vessel (autoclave). Ammonium nitrate is sensitive to temperature and explodes at temperatures above 250 °C. At 260 °C, the pressure increased to 100 bar due to the explosion of ammonium nitrate, as shown in the following equations:
At explosion (260 °C):
8NH4NO3 (8 mole; P = 1 bar) → 5N2 + 4NO + 2NO2 + 16H2O (27 mole; P = 100 bar)
Al(OH)3 + Si(OC2H5)4 + C2H5OH→SiO2-Al2O3-CNT-CNF + H2O
By gradually releasing the gases from the autoclave, the pressure was reduced while introducing an inert gas (argon) to remove any remaining gases. The resulting product was calcined at 500 °C in the presence of air to produce silica–alumina–CNT–CNF nanocomposites.

4.1.3. Gold Support

To prepare gold nanoparticles, gold chloride was mixed with 50 mL of ethylene glycol. This solution was stirred with heating at 65 °C for 60 min. Then, sodium hydroxide was added until the solution became alkaline. After stirring 2 h, a few drops of hydrazine hydrate were added, and the temperature was maintained at 75 °C for 2 h.
The gold was supported on the prepared silica–alumina–CNT–CNF nanocomposites using the dry impregnation process. Typically, 1 g of the prepared nanocomposite was mixed with deionized water. The nanocomposite was weighted after water impregnation to determine the amount of water absorbed, calculated by the difference in the weight of titanium dioxide before and after water impregnation. Then, 20 mL of the aqueous gold solution, which was prepared in the previous step, was mixed with 2 g of the prepared SiO2–Al2O3–CNT–CNF nanocomposite to achieve a gold content of 2 wt.% in the final product. After stirring for 20 min, the product was kept under vacuum for 24 h. The resulting material was designated as SAGC-3.

4.2. Synthesis of Silica–Alumina Nanoparticles

Silica–alumina nanocomposites with comparable molar ratios were synthesized using the solvent thermal technique. Initially, specific quantities of aluminum tri-sec-butoxide and tetra-ethyl orthosilicate were dissolved in a surplus of ethyl alcohol. This mixture was stirred for two hours and subsequently transferred to a pressurized vessel (autoclave). The reaction occurred at a temperature of 260 °C and a pressure of 100 bars. After the reaction was complete, the solvent vapors were evacuated and replaced with an inert gas. The resulting product was then calcined at 500 °C in an air atmosphere, yielding the silica–alumina nanocomposite designated as SA-3.

4.3. Synthesis of Zinc Oxide Nanoparticles

Zinc oxide nanoparticles were synthesized using a solvent thermal method. Zinc acetate served as the zinc precursor, while methanol acted as the solvent. An adequate quantity of zinc acetate (16 g) was dissolved in a surplus of methanol (120 mL). The mixture was stirred for 12 h. Subsequently, the solution was transferred into a pressurized vessel. The processes of dehydroxylation and drying were conducted under supercritical conditions, specifically at a temperature of 260 °C and a pressure of 100 bar, utilizing 350 mL of ethanol. Supercritical drying was performed directly with the gel containing the solvent. The temperature of the autoclave was gradually increased until it exceeded the critical threshold.
As a result, the pressure exceeds the critical threshold. At this stage, the autoclave is vented by carefully opening its valve. Once the pressure inside the autoclave nears atmospheric levels, it is purged with an inert gas, specifically argon, to remove any remaining gases. Subsequently, the autoclave is allowed to cool to room temperature. This purging process can occur during the cooling phase, as long as the temperature remains sufficiently high to prevent liquid condensation in the smallest pores of the gel. Since the solvent vapor is replaced with an inert gas, liquid condensation does not occur. The product underwent thermal treatment at 450 °C for 4 h and was designated as ZO-1.

4.4. Synthesis of Titanium Dioxide Nanoparticles

The sol–gel method was used to create titanium dioxide nanoparticles based on alcohol-based procedures. A total of 20 milliliters of titanium isopropoxide and 125 milliliters of ethyl alcohol were reacted to create the alcoholic mixes. Titanium isopropoxide molecules are extremely reactive and polar due to the strong electronegativity between titanium and oxygen. Through simultaneous hydrolysis and condensation procedures, 125 mL of the deionized water was added to the alcoholic titanium isopropoxide mixtures to create the gel form. The white product was separated using filtration and washing procedures with ethyl alcohol and deionized water. The product was vacuum-dried for a full day at room temperature. For three hours, the product underwent heat treatment at 450 °C. The product was classified as TO-2.

4.5. Characterization of the Prepared Samples

To analyze the crystalline structures, X-ray powder diffraction (XRD) was conducted using a Rigaku RINT 2200 (Tokyo, Japan) with CuK (filtered) as the radiation source. The device was operated at a wavelength of 0.154 nm across a 2θ range of 20–50°. A JEOL JEM-2100F (Tokyo, Japan) was used to image the prepared samples using transmission electron microscopy (TEM) and to determine the elemental composition of the prepared samples using energy-dispersive X-ray spectroscopy (EDX). Scanning electron microscopy (SEM) was performed using a JEOL JSM-6330F at 15 kV and 12 mA. The porous structures and surface characteristics were evaluated based on the complete adsorption–desorption isotherm of nitrogen gas at 77 K. These processes were conducted using a Quanta-chrome Nova sorption system. The optical properties of the synthesized nanomaterials were assessed using the Shimadzu 3600 UV diffuse reflection method. Reflectance data were converted to absorption values using spectrophotometer UV 3600 software (Shimadzu, Columbia, MD, USA). For solid samples, an ISR-603 spectrophotometer equipped with an integrated ball attachment (Shimadzu, Columbia, MD, USA) was utilized. Liquid samples were analyzed for absorption coefficients using conventional UV–Vis techniques.

4.6. Photocatalytic Processes

The photocatalytic decomposition of naphthol green B (NGB) was employed to purify water contaminated by industrial pollutants using light. To assess the efficiency and photoactivity of the synthesized materials, photocatalytic reactions were conducted in a quartz immersion well reactor (RQ400) equipped with a 400 W mercury lamp, which emits a broad spectrum of wavelengths in both the visible and ultraviolet ranges. The 3040/PX0686 mercury lamp (Camberley, Surrey, UK), which has a 400 W medium pressure, was combined with a 400 mL standard reaction flask (model 3308) to perform the photocatalytic reactions. The major portion of the radiation for a medium pressure lamp focuses on the range from 365 to 366 nm. Moreover, it produces small amounts in the ultraviolet region at 254, 265, 270, 289, 297, 302, 313, and 334 nm. In addition, significant amounts of radiation are produced in the visible region at 405–408, 436, 546, and 577–579 nm.
The NGB concentration was 0.4 × 10⁻³ M. To study the adsorption effect of the photocatalyst, the experiment was performed in the absence of light before performing the standard test. In addition, the same experiment was performed without a photocatalyst in the presence of light to measure the stability of the dye in light. In the main experiment, the concentration of dye was followed by measuring and analyzing the absorption of NGB in accordance with the Beer–Lambert law. The change in concentration was tracked by monitoring the green band at 714 nm associated with NGB. Small samples of the contaminated water were taken after light radiation at various time intervals, and the UV spectrophotometer was used to measure and follow the concentration of the remaining dye.

5. Conclusions

The current study successfully met several objectives. The primary goal was to transform non-optical silica–alumina into a functional photocatalyst using explosive methods involving solid fuels, specifically, ammonium nitrate and aluminum hydroxide. This transformation was accomplished by reducing the band gap energy of silica–alumina from 5.5 eV to 1.65 eV and 3.65 eV through the growth of carbon nanofibers and nanotubes, respectively. The secondary objective centered on the synthesis of carbon nanotubes and nanofibers at a comparatively low temperature of 260 °C. The third goal was to enhance the degradation of industrial pollutants after brief exposure to light radiation. In this context, all green pollutants were eliminated after only 35 min of illumination. Consequently, the findings suggest that silica–alumina modified through explosive reactions serves as a novel additive for nanocomposites designed for optical applications, including photocatalysis. Furthermore, the zero-dimensional nanoparticles and one-dimensional carbon nanotubes and nanofibers are effective materials for constructing three-dimensional mesoporous nanostructures with a large surface area.

Author Contributions

Conceptualization, O.S. and A.O.; methodology, O.S., A.A., A.M.H. and N.M.S.; software, A.O. and F.K.A.; validation, O.S., A.A., A.M.H. and N.M.S.; formal analysis, O.S., A.O. and F.K.A.; investigation, O.S., A.O. and F.K.A.; resources, O.S., A.A., A.M.H. and N.M.S.; data curation, A.O. and F.K.A.; writing—original draft preparation, O.S., A.O. and F.K.A.; writing—review and editing, O.S., A.A., A.M.H. and N.M.S.; visualization, O.S. and A.A.; supervision, O.S., F.K.A. and A.O.; project administration, O.S.; funding acquisition, O.S. All authors have read and agreed to the published version of the manuscript.

Funding

This research was funded by King Faisal University (grant number KFU251262). The APC was funded by the grant number KFU251262.

Data Availability Statement

Data will be provided by the authors upon request.

Acknowledgments

The work was supported by the Deanship of Scientific Research, Vice Presidency for Graduate Studies and Scientific Research at King Faisal University (Grant No. KFU251262). The authors extend their appreciation to the Abdulmonem Alrashad Humanitarian Foundation (FSP-2 No. 0003).

Conflicts of Interest

The authors declare no conflicts of interest.

References

  1. Saber, O.; El-Brolossy, T.; Al Jaafari, A.A. Improvement of Photocatalytic Degradation of Naphthol Green B Under Solar Light Using Aluminum Doping of Zinc Oxide Nanoparticles. Water Air Soil Pollut. 2012, 223, 4615. [Google Scholar] [CrossRef]
  2. Gupta, V.K.; Gupta, B.; Rastogi, A.; Agarwal, S.; Nayak, A. A comparative investigation on adsorption performances of mesoporous activated carbon prepared from waste rubber tire and activated carbon for a hazardous azo dye Acid Blue. J. Hazard. Mater. 2011, 186, 891–901. [Google Scholar] [CrossRef] [PubMed]
  3. Gupta, V.K.; Jain, R.; Nayak, A.; Agarwal, S.; Shrivastava, M. Removal of the hazardous dye—Tartrazine by photodegradation on titanium dioxide surface. Mater. Sci. Eng. C 2011, 31, 1062–1067. [Google Scholar] [CrossRef]
  4. Gupta, V.K.; Jain, R.; Agarwal, S.; Shrivastava, M. Kinetics of photo-catalytic degradation of hazardous dye Tropaeoline 000 using UV/TiO2 in a UV reactor. Colloids Surf. A Physicochem. Eng. Asp. 2011, 378, 22–26. [Google Scholar] [CrossRef]
  5. Lorimer, J.P.; Mason, T.J.; Plattes, M.; Phull, S.S.; Walton, D.J. Degradation of dye effluent. Pure Appl. Chem. 2001, 12, 1957–1968. [Google Scholar] [CrossRef]
  6. Chen, N.; Xia, J.; Li, L.; Lv, Q.; Zhao, K.; Ahmad, M.; Xiao, Z.; Wang, S.; Ye, F.; Zhang, Q. Comprehensive enhancement of photocatalytic H2O2 generation and antibacterial efficacy on carbon nitride through a straightforward polydopamine coating strategy. Surf. Interfaces 2025, 56, 105566. [Google Scholar] [CrossRef]
  7. Saber, O.; Osama, A.; Shaalan, N.M.; Osama, M. Engineering the Integration of Titanium and Nickel into Zinc Oxide Nanocomposites through Nanolayered Structures and Nanohybrids to Design Effective Photocatalysts for Purifying Water from Industrial Pollutants. Catalysts 2024, 14, 340. [Google Scholar] [CrossRef]
  8. Saber, O.; Osama, A.; Shaalan, N.M.; Osama, M. Nanolayered Structures and Nanohybrids Based on a Ternary System Co/Ti/Zn for Production of Photo-Active Nanocomposites and Purification of Water Using Light. Nanomaterials 2024, 14, 93. [Google Scholar] [CrossRef]
  9. Saber, O.; Osama, M.; Alshoaibi, A.; Shaalan, N.M. Doaa Osama Designing inorganic–magnetic–organic nanohybrids for producing effective photocatalysts for the purification of water. RSC Adv. 2022, 12, 18282–18295. [Google Scholar] [CrossRef]
  10. Saber, O.; Awada, C.; Osama, A.; Shaalan, N.M.; Alshoaibi, A.; Mansour, S.A.; Osama, M.; Farha, A.H. Boosting the Efficiency of Titanium Oxides and Accelerating Industrial Pollutant Removal Through Triple-Action Effects to Purify Water by Light. Catalysts 2024, 14, 772. [Google Scholar] [CrossRef]
  11. Albeladi, A.; Khan, Z.; Al-Thabaiti, S.A.; Patel, R.; Malik, M.A.; Meht, S. A Fe3O4-CdO Nanocomposite for Organic Dye Photocatalytic Degradation: Synthesis and Characterization. Catalysts 2024, 14, 71. [Google Scholar] [CrossRef]
  12. Lau, G.E.; Abdullah, C.A.C.; Ahmad, W.A.N.; Assaw, W.S.; Zheng, A.L.T. Eco-Friendly Photocatalysts for Degradation of Dyes. Catalysts 2020, 10, 1129. [Google Scholar] [CrossRef]
  13. Hauser, K.; Hassou, S.O.; Riaz, U. Ultrasound-Assisted Photocatalytic Degradation of Azo Dyes under Visible Light Irradiation Using Polythiophene-Decorated CoFe2O4 Nanohybrids. Catalysts 2024, 14, 495. [Google Scholar] [CrossRef]
  14. Palma Soto, E.; Rodriguez Gonzalez, C.A.; Luque Morales, P.A.; Reyes Blas, H.; Carrillo Castillo, A. Degradation of Organic Dye Congo Red by Heterogeneous Solar Photocatalysis with Bi2S3, Bi2S3/TiO2, and Bi2S3/ZnO Thin Films. Catalysts 2024, 14, 589. [Google Scholar] [CrossRef]
  15. Mbuyazi, T.B.; Ajibade, P.A. Photocatalytic Degradation of Organic Dyes by Magnetite Nanoparticles Prepared by Co-Precipitation. Int. J. Mol. Sci. 2024, 25, 7876. [Google Scholar] [CrossRef]
  16. Kalaycıoğlu, Z.; Ozuğur Uysal, B.; Pekcan, O.; Erim, F.B. Efficient Photocatalytic Degradation of Methylene Blue Dye from Aqueous Solution with Cerium Oxide Nanoparticles and Graphene Oxide-Doped Polyacrylamide. ACS Omega 2023, 8, 13004–13015. [Google Scholar] [CrossRef]
  17. Khan, S.; Noor, T.; Iqbal, N.; Yaqoob, L. Photocatalytic Dye Degradation from Textile Wastewater: A Review. ACS Omega 2024, 9, 21751–21767. [Google Scholar] [CrossRef]
  18. Long, Z.; Li, Q.; Wei, T.; Zhang, G.; Ren, Z. Historical development and prospects of photocatalysts for pollutant removal in water. J. Hazard. Mater. 2020, 395, 122599. [Google Scholar] [CrossRef]
  19. Tahir, D.; Kwon, H.; Shin, H.; Oh, S.; Kang, H.; Heo, S.; Chung, J.; Lee, J.; Tougaard, S. Electronic and optical properties of Al2O3/SiO2 thin films grown on Si substrate. J. Phys. D Appl. Phys. 2010, 43, 255301. [Google Scholar] [CrossRef]
  20. Baha, A.A.; Ait-Karra, A.; Idouhli, R.; Tabit, K.; Zakir, O.; Dikici, B.; Khadiri, M.E.; Abouelfida, A. Synergistic Photocatalysis of Bayerite/Zeolite Loaded TiO2 Nanocomposites for Highly Efficient Degradation of Organic Pollutants in Aqueous Environments. Silicon 2024, 16, 4843–4856. [Google Scholar] [CrossRef]
  21. Stojanović, S.; Vranješ, M.; Šaponjić, Z.; Rac, V.; Rakić, V.; Ignjatović, L.; Damjanović-Vasilić, L. Photocatalytic performance of TiO2/zeolites under simulated solar light for removal of atenolol from aqueous solution. Int. J. Environ. Sci. Technol. 2023, 20, 1–16. [Google Scholar] [CrossRef]
  22. Hutsul, K.; Ivanenko, I.; Patrylak, L.; Pertko, O.; Kamenskyh, D. ZnO/Zeolite composite photocatalyst for dyes degradation. Appl. Nanosci. 2023, 13, 7601–7609. [Google Scholar] [CrossRef]
  23. John, A.; Rajan, M.S.; Thomas, J. Sunlight Driven Degradation of Drug Residues Using CuO Incorporated- Zeolite Supported- Graphitic Carbon Nitride. Catal. Lett. 2025, 155, 23. [Google Scholar] [CrossRef]
  24. Zarazúa-Morín, M.E.; Galindo-Luna, A.S.; Gallegos-Sánchez, V.J.; Juárez-Ramírez, I. Chemical exfoliation of silica filters used on methylene blue degradation by photocatalysis. Chem. Pap. 2022, 76, 5627–5642. [Google Scholar] [CrossRef]
  25. Balani, K.; Agarwal, A. Wetting of carbon nanotubes by aluminum oxide. Nanotechnology 2008, 19, 165701. [Google Scholar] [CrossRef]
  26. Keshri, A.K.; Huang, J.; Singh, V.; Choi, W.; Seal, S.; Agarwal, A. Synthesis of aluminum oxide coating with carbon nanotube reinforcement produced by chemical vapor deposition for improved fracture and wear resistance. Carbon 2010, 48, 431–442. [Google Scholar] [CrossRef]
  27. Fan, Y.Y.; Li, F.; Cheng, H.M.; Su, G.; Yu, Y.D.; Shen, Z.H. Preparation, morphology, and microstructure of diameter-controllable vapor-grown carbon nanofibers. J. Mater. Res. 1998, 8, 13. [Google Scholar] [CrossRef]
  28. Luhrs, C.C.; Moberg, M.; Maxson, A.; Brewer, L.; Menon, S. IF-WS2/Nanostructured Carbon Hybrids Generation and Their Characterization. Inorganics 2014, 2, 211–232. [Google Scholar] [CrossRef]
  29. Toyama, N.; Inoue, H.; Ohki, S.; Tansho, M.; Shimizu, T.; Umegaki, T.; Kojima, Y. Influence of hollow silica-alumina composite spheres prepared using various amount of L(+)-arginine on their activity for hydrolytic dehydrogenation of ammonia borane. Adv. Mater. Lett. 2016, 7, 339–343. [Google Scholar] [CrossRef]
  30. Sethi, R.; Ahmad, S.; Aziz, A.; Siddiqui, A.M. Structural, optical and electrical properties of tin oxide thin films for application as a wide band gap semiconductor. AIP Conf. Proc. 2015, 1675, 030039. [Google Scholar]
  31. Soumya, S.S. Optical, Dielectric and Structural Properties of SnO2 Nanoparticles via Sol-Gel Method. J. Phys. Conf. Ser. 2023, 2426, 012039. [Google Scholar] [CrossRef]
  32. Sun, P.; Bai, L.; Kripalani, D.R.; Zhou, K. A new carbon phase with direct bandgap and high carrier mobility as electron transport material for perovskite solar cells. Comput. Mater. 2019, 5, 9. [Google Scholar] [CrossRef]
  33. Zhu, X.; Yang, F.; Liu, J.; Zhou, G.; Chen, D.; Liu, Z.; Fang, J. Design and Architecture of P-O Co-Doped Porous g-C3N4 by Supramolecular Self-Assembly for Enhanced Hydrogen Evolution. Catalysts 2022, 12, 1583. [Google Scholar] [CrossRef]
  34. Liu, J.; Li, X.; Hou, H.; Zhou, M. Facile Synthesis of Anatase–Rutile Diphase N-doped TiO2 Nanoparticles with Excellent Visible Light Photocatalytic Activity. Catalysts 2020, 10, 1126. [Google Scholar] [CrossRef]
  35. Xiang, D.; Wang, Z.; Xu, J.; Shen, H.; Zhang, X.; Liu, N. Defective TiO2/MIL-88B(Fe) Photocatalyst for Tetracycline Degradation: Characterization and Augmented Photocatalytic Efficiency. Catalysts 2024, 14, 528. [Google Scholar] [CrossRef]
Figure 1. X-ray diffraction patterns of (a) ZO-1, (b) TO-2, (c) SA-3, and (d) SAGC-3.
Catalysts 15 00452 g001
Figure 2. Transmission electron microscopy (TEM) images of ZO-1: (a) 20 nm and (b) 10 nm.
Catalysts 15 00452 g002
Figure 3. Scanning electron microscopy (SEM) images of TO-2: (a) 1µm and (b) 100 nm.
Catalysts 15 00452 g003
Figure 4. Transmission electron microscopy (TEM) images of SAGC-3: (a) 20 nm and (b) 50 nm.
Catalysts 15 00452 g004
Figure 5. Mapping images of SAGC-3: (a) silicon, (b) aluminum, (c) oxygen, (d) gold, and (e) EDX spectrum with corresponding elemental composition.
Catalysts 15 00452 g005
Figure 6. Surface properties of SAGC-3 nanocomposite: (a) nitrogen adsorption–desorption isotherms, (b) pore size distribution, and (c) Vl−t plot.
Catalysts 15 00452 g006
Figure 7. Optical properties: (a) UV–Vis absorbance of ZO-1, (b) band gap energy of ZO-1, (c) UV–Vis absorbance of TO-2, and (d) band gap energy of TO-2.
Catalysts 15 00452 g007
Figure 8. Optical properties of (a) UV–Vis absorbance of SA-3, (b) band gap energy of SA-3, (c) UV–Vis absorbance of SAGC-3, and (d) band gap energy of SAGC-3.
Catalysts 15 00452 g008
Figure 9. Optical UV–Vis absorbance of NGB dye after exposure to UV-light radiation for different periods of time in the presence of (a) ZnO-1 and (b) TO-2.
Catalysts 15 00452 g009
Figure 10. Optical UV–Vis absorbance of NGB dye after exposure to UV-light radiation for different periods of time in the presence of SAGC-3.
Catalysts 15 00452 g010
Figure 11. Photocatalytic degradation percentages of NGB after 35 min of light radiation in the presence of the prepared materials.
Catalysts 15 00452 g011
Figure 12. Kinetic models of photocatalytic reactions of NGB dye in the presence of light with the following photocatalysts: (a) ZO-1, (b) TO-2, and (c) SAGC-3.
Catalysts 15 00452 g012
Figure 13. Schematic representation of the production of oxidizing agents and photocatalytic degradation of the dye in the presence of the optimal photocatalyst SAGC-3.
Catalysts 15 00452 g013
Figure 14. Photoluminescence measurements of SAGC-3.
Catalysts 15 00452 g014
Figure 15. Steps for the preparation of silica–alumina–carbon nanotubes and nanofibers through explosive reactions.
Catalysts 15 00452 g015
Table 1. Band gap energy and cut-off wavelength of the prepared photocatalysts.
SampleBang Gap Energy (eV)Cut-off Wavelength (nm)
ZO-13.22386.0
TO-23.30376.7
SA-35.50226.0
SAGC-31.65, 3.65753.3, 340.6
Disclaimer/Publisher’s Note: The statements, opinions and data contained in all publications are solely those of the individual author(s) and contributor(s) and not of MDPI and/or the editor(s). MDPI and/or the editor(s) disclaim responsibility for any injury to people or property resulting from any ideas, methods, instructions or products referred to in the content.

