Abstract
This study investigates the effect of potassium (K) promotion on Pt/m-ZrO2 catalysts in methanol steam reforming (MSR), revealing critical insights into reaction pathways and catalyst performance. While increasing K loading reduces catalytic activity, it selectively enhances the hydrogen-producing formate dehydrogenation and de-carboxylation pathway. Structural analyses using HR-TEM and DRIFTS show that higher K concentrations block Pt sites and promote agglomeration, reshaping catalytic behavior. Notably, the 3.1% K-promoted catalyst achieves high stability at 358 °C, with a CO2 selectivity exceeding 80% and minimal methane formation, outperforming the unpromoted catalyst in terms of CO and CH4 selectivity. Temperature studies further demonstrate reduced CO selectivity at higher temperatures, highlighting distinct advantages of K-doped catalysts. These findings underscore the role of K in enhancing surface basicity and its impact on formate interaction, offering valuable insights for optimizing MSR catalysts and advancing hydrogen production technologies.
1. Introduction
Methanol is being considered as an important fuel [1] and liquid chemical carrier of H2 [2] due to a number of favorable characteristics, including its practical volumetric energy density (e.g., 17.28 MJ/L versus just 0.0108 MJ/L for H2 (g) at 1 atm), its high H/C ratio of 4, its miscibility with H2O, its flexibility to be produced from CO/CO2 via syngas routes or from biobased processes [3], and its ability to undergo steam reforming without involving C-C scission, which remains an issue with ethanol. For PEM fuel cell applications for portable power, minimizing byproducts such as CO, a poison for fuel cell electrodes, remains a challenge [4].
The state of the art of the catalysis of methanol steam reforming was recently reviewed [4]. Copper-based catalysts, such as Cu/ZnO/Al2O3 [5,6,7], excel in cost-effectiveness and low-temperature activity but require enhanced stability using strategies to combat sintering and carbon deposition. The former has involved strategies such as improving uniformity of particle size [8], partially encapsulating Cu nanoparticles with Zn oxide [6], and adding Mg [9] or Zr [10,11] promoters to inhibit particle growth of both Cu and Zn oxide phases, while the latter has involved adding high oxygen storage materials such as ceria to remove carbon deposits [12,13]. Noble metal-based catalysts, like Pd/ZnO [14,15,16], offer superior thermal stability and lower deactivation rates, yet their high cost and undesired CO selectivity make them suitable for niche applications prioritizing durability. Hybrid Pd-Cu catalysts aim to merge the affordability of Cu with the stability of noble metals, and Pd/Cu alloy formation was deemed important for suppressing CO selectivity [17]. There has also been significant mechanistic work using microkinetics, in situ spectroscopy, and computational methods to determine the roles of intermediates like hydroxyl groups (*OH), methoxy (*OCH3), and formate (*OOCH) species, as well as the impact of metal–support interfaces on selectivity. For example, using in situ DRIFTS, Li et al. [6] showed that a mechanism involving the sequence methoxy species (*OCH3) → formaldehyde (*OCH2) → methylene dioxygen (*OOCH2) → formate (*OOCH) → CO2 and H2 likely occurs over a commercial Cu/ZnO/Al2O3 catalyst. A mechanism involving a formate route versus an HCOOCH3* route, detected recently using operando pulse experiments with mass spectrometry on a Cu/Cu(Al)OX catalyst by Meng et al. [18], was found earlier to depend on the methanol/steam ratio by microkinetics [19], with higher steam content favoring a formate pathway. With noble metal catalysts like the Pd/ZnO system, the higher CO selectivity was deemed to result from the formaldehyde decomposition step [14,20].
Over partially reducible oxide-supported noble metal catalysts, methoxy, formate, and carbonate species have been identified as important intermediates (e.g., Pd/ZnO [21] and Pt/ceria [22]. The two main pathways involve a H2-selective route involving formate dehydrogenation/decarboxylation (route 1) or an unselective route involving either dehydration/decarbonylation of formate or decarbonylation of its precursor, adsorbed dissociated formaldehyde (Route 2a and 2b, respectively). Routes 2a and 2b yield the same products.
Route 1
Route 2a
Route 2b
CH3OH + □ + OSupport → CH3O-□ + Osupport-H
CH3O-□ + Osupport-H → HCO-□ + H2 + Osupport-H
HCO-□ + Osupport-H + H2O* → HCOO-□ + Osupport-H + H2
HCOO-□ + Osupport-H → H2 + □ + Osupport-O2C
Osupport-O2C → CO2 + Osupport
HCO-□ + Osupport-H + H2O* → HCOO-□ + Osupport-H + H2
HCOO-□ + Osupport-H → H2O + CO + □ + Osupport
HCO-□ + Osupport-H + H2O* → H2 + CO + H2O + □ + Osupport
Because CO is a poison for PEM fuel cell electrode catalysts, minimizing the CO selectivity is of interest. At the same time, shifting more to Route 1 also improves the H2 selectivity. Recently, we have shown [23] that Na addition to Pt/YSZ catalysts significantly improved the formate dehydrogenation/decarboxylation selectivity (Route 1) as well as suppressed CH4 selectivity, but these promoting effects in selectivity came at the expense of a loss in some activity. For example, at 325 °C, doping 2%Pt/YSZ with 2.5%Na altered the CO selectivity from 70.5% to 7.6%, the CO2 selectivity from 28.5% to 92.2%, and the CH4 selectivity from 1.1% to 0.3%, while the methanol conversion decreased from 74.1% to 45.2%. These favorable effects in selectivity were proposed to be due to the effect of catalyst basicity in straining the formate intermediate in a favorable manner. That is, the CO2 part of the adsorbed formate molecule was bound more tightly to the catalyst surface, thereby straining the C-H bond and promoting dehydrogenation. In that work, there was a shift in the ν(CH) band from 2869 cm−1 to 2800 cm−1, in agreement with C-H bond weakening.
The choice of using Na as a promoter for a Pt/m-ZrO2 MSR catalyst stems from our earlier collaborative work with Honda Research USA, Inc. (Columbus, OH, USA) [24,25,26], as well as our more recent work on the Na loading effect [27], where Na promoted dehydrogenation of formate in a water–gas shift, which resulted in a step-change improvement in the rate, as C-H bond breaking of formate has been proposed to be the rate-limiting step for partially reducible oxide-supported metal catalysts (e.g., Rh/ceria [28], Pt/zirconia [29]). Because K showed a similar, although less dramatic, effect in improving the WGS rates for Pt/ZrO2 [30] and Pt/CeO2 [31] catalysts, it is of interest to examine whether K offers a similar promoting effect on the MSR selectivity as Na, and if so, whether these effects can be achieved at a practical conversion level.
To explore the effect of K on the surface basicity of Pt/m-ZrO2, CO2-TPD and an analysis of ν(OCO) band splitting in FTIR spectroscopy were conducted. To examine the effect of K on formate C-H bond strength, temperature-stepped MSR was carried out using in situ diffuse reflectance infrared Fourier transform spectroscopy. MSR reactivity was measured using temperature-programmed MSR reaction with mass spectrometry, as well as steady-state measurements as a function of temperature for the unpromoted catalyst and five K-promoted catalysts with different loadings. The most interesting catalyst formulation was also tested for catalyst stability in comparison with the undoped reference catalyst. This study uniquely explores the promoting effect of potassium on MSR selectivity and performance for Pt/m-ZrO2 catalysts, comparing it to earlier Na-based modifications. By employing advanced characterization techniques and reactivity measurements, this work provides new insights into promoter-induced changes in surface basicity and reaction mechanisms, addressing key challenges in catalyst design for hydrogen production.
2. Results and Discussion
The addition of potassium progressively decreased the surface area, suggesting that pore blocking occurred, especially at higher loading. This is shown in Table 1 by comparing the measured surface area and the expected BET surface area, assuming no pore blocking. In this calculation, m-ZrO2 was assumed to be the sole contributor to the surface area, with platinum oxide and potassium oxide or potassium carbonate being assumed to contribute to the mass but not the area in the calcined catalyst. The measured values of the BET surface area were lower than the expected values, suggesting that some pore blocking occurred. The difference between the average expected value and the measured value increased (Δ = 3.6, 3.8, 12.0, 22.5, 28.5, 46.2 m2/g) by adding Pt and increasing the loading of the K-promoter, suggesting that there was more pore blocking at the higher K-promoter levels. The average pore diameter was higher at 8.5% K loading, suggesting that pore blocking of the narrower pores was preferred.

Table 1.
BET surface area, porosity, and average pore diameter for the prepared catalysts.
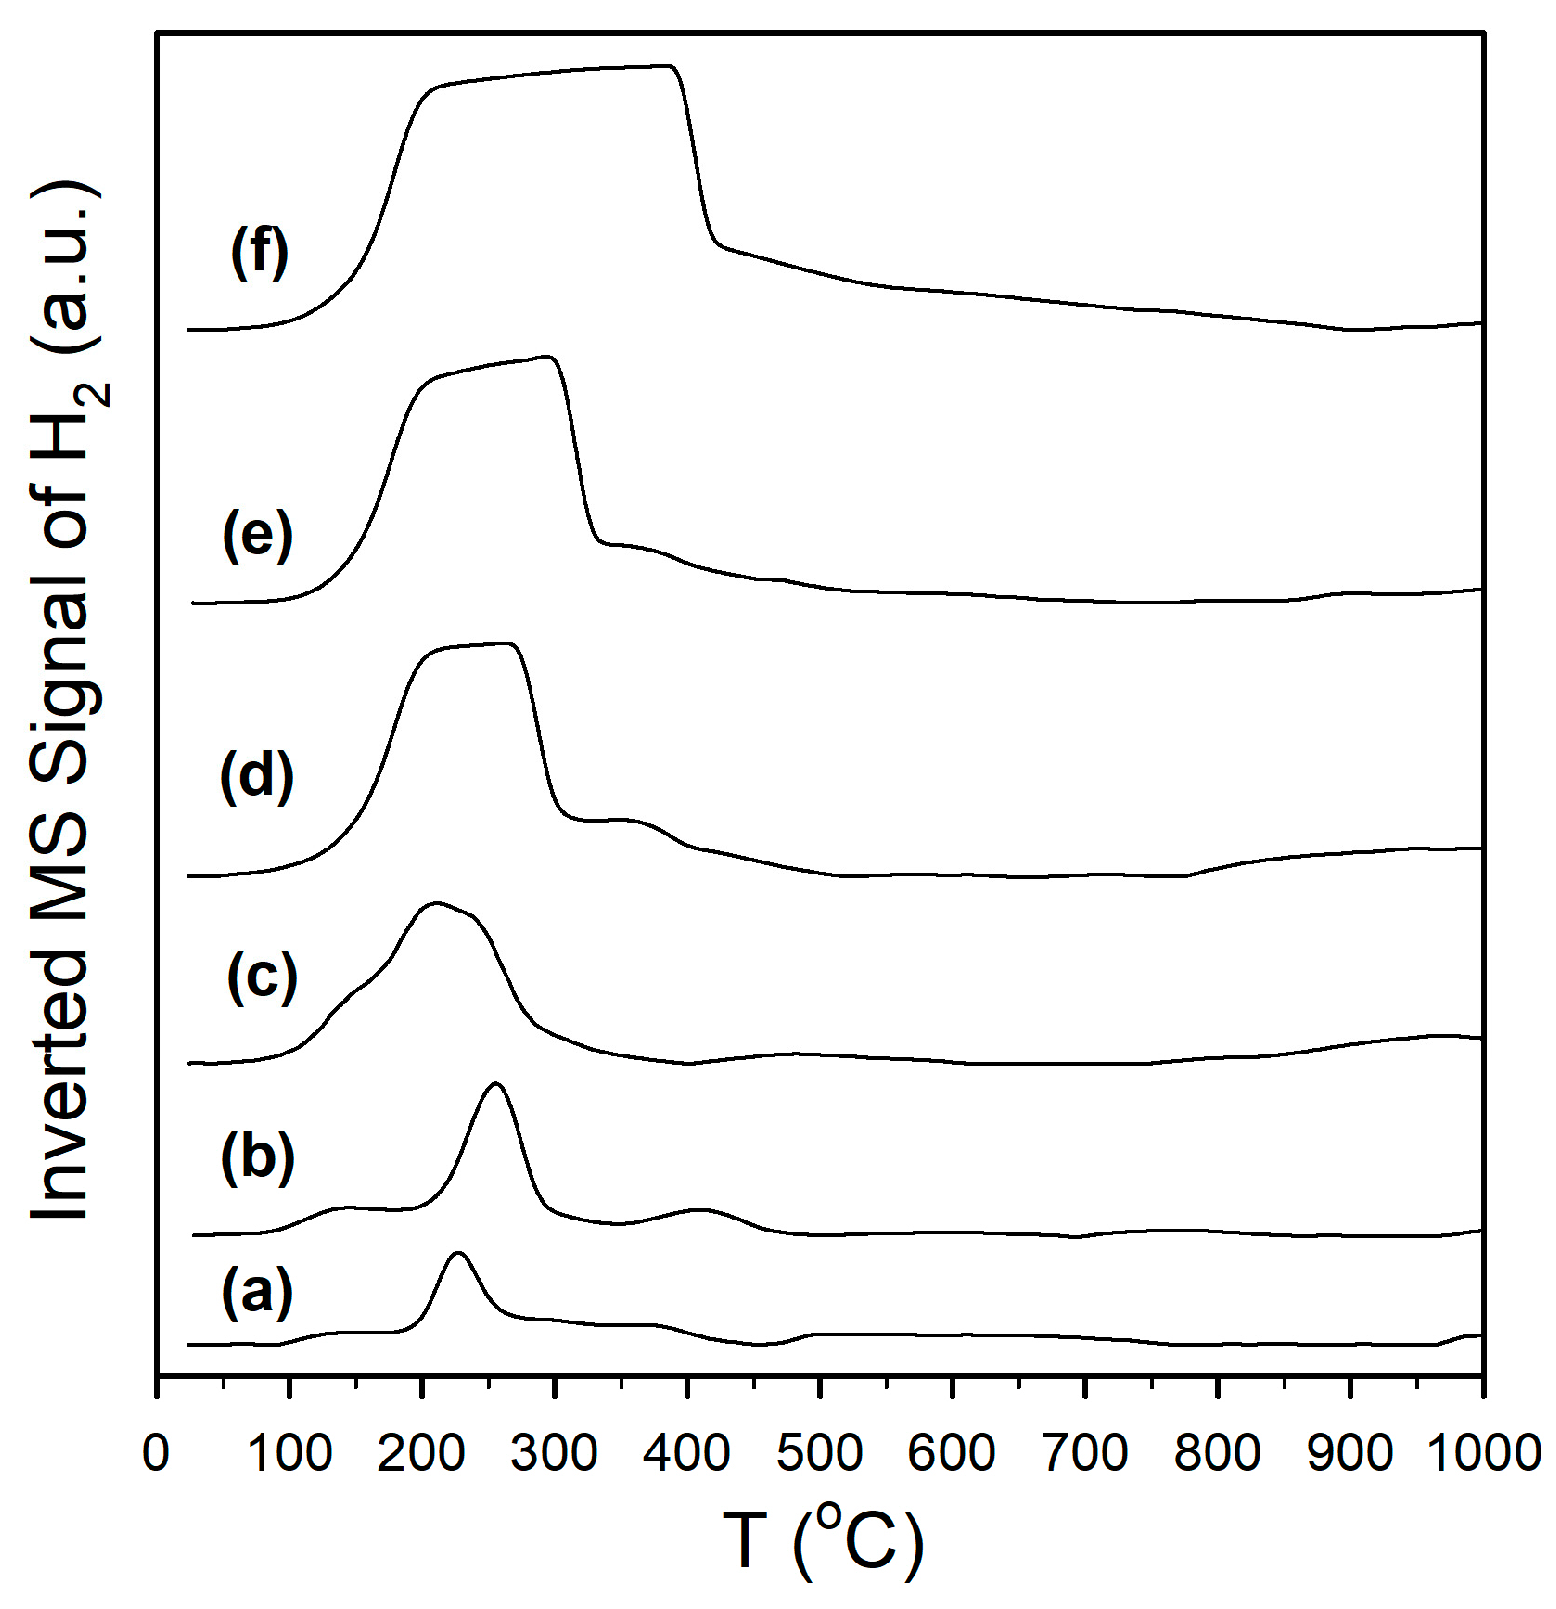
Catalyst activation was followed by H2-TPR-MS (Figure 1), H2-TPR/TPR-MS (Figure S1), and DRIFTS spectra recorded before and after H2 reduction. Reduction for partially reducible oxide supports is often ascribed to a surface reduction in the range of 450–550 °C, with higher temperature (e.g., >700 °C) peaks being assigned to bulk reduction. With the addition of a metal, peaks for metal oxide reduction (e.g., Pt oxide reduction) and Pt-catalyst surface reduction cause a shift in the first peak to a lower temperature, without having a significant effect on the higher temperature bulk reduction peaks. For example, Yao and Yao [32] favored O-vacancy formation on metal/ceria catalysts to describe the surface reduction process. However, we favored an alternative explanation, which is that the surface reduction occurred at least in part via H2 dissociation on the metal and spillover of H to the support to form defect-associated bridging OH groups or by O-vacancy plus H2O formation, with H2O dissociating at the vacancies to generate the bridging OH groups in this alternative manner (Pt/zirconia [29], Pt/ceria [33], and Pt/thoria [34]). Note that Type II bridging OH groups have been observed by others following surface reduction for ceria [35] and metal/ceria [36,37] materials. In addition, we observed that this process occurs with surface carbonate removal [29,33,34] for Pt supported on partially reducible oxides. A number of prior investigations have shown (e.g., using synchrotron radiation and infrared spectroscopy) that surface reduction of the partially reducible oxide occurs with bridging OH group formation [29,33,34,36,37,38], and that the active OH groups on thoria, ceria, and zirconia located at reduced defect sites form formates upon exposure to CO. In comparison with the TPR pattern of monoclinic zirconia [27], which hardly showed any surface reduction (i.e., a very-low-intensity broad signal in the 400 to 500 °C range), as shown in Figure 1 (profile a), adding 2%Pt resulted in a low-intensity broad signal at 125 °C, a sharp feature at 210 °C, and a broad feature at 350 °C, attributed to a reduction in Pt oxide, H2 dissociation, and spillover to the support (with surface carbonate decomposition, to be discussed) in close proximity to Pt nanoparticles, and reduction in the surface farther from Pt, respectively. Doping K+ to the catalyst (Figure 1, profile b) and increasing the K+ loading (Figure 1, profiles c through f) resulted in an increase in the peak areas, which tended to broaden and shift to higher temperatures above 1.7%K loading. The difference in DRIFTS spectra before and after activation (Figure 2, left) shows that increasing the K+ loading increased the amount of surface carbonate that decomposed during H2-activation, and this was responsible for the more intense peak intensities observed in H2-TPR-MS. In examining the more highly loaded K+ catalysts, Figure S1 shows that carbonate decomposition proceeded primarily via decarbonylation, as a significant peak for CO was observed; this is consistent with Pt-catalyzed decarbonylation, as the ν(CO) bands of Pt carbonyls increased and decreased during the activation process. Figure S2 (right) shows that activation was accompanied by bridging OH group formation, and it appears that higher K+ loadings tended to decrease their population due to increasing coverage by K+, as their band intensities decreased systematically.
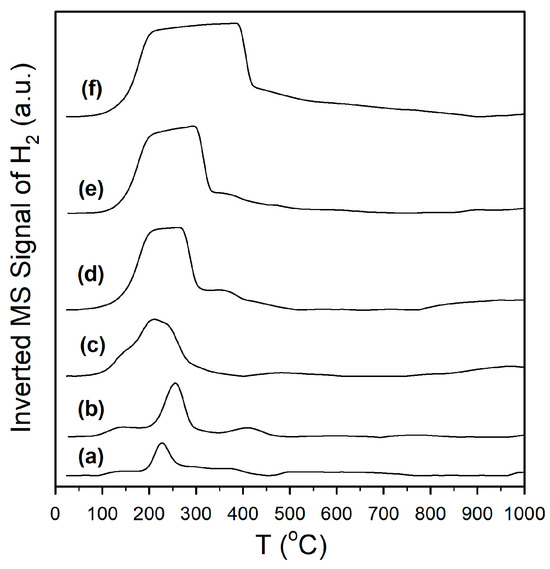
Figure 1.
H2 temperature-programmed reduction in mass spectrometry of (a) unpromoted Pt/m-ZrO2 and the same with (b) 0.85%K, (c) 1.70%K, (d) 3.06%K, (e) 4.25%K, and (f) 8.5%K. Note that the H2 uptake signal has been inverted for clarity.
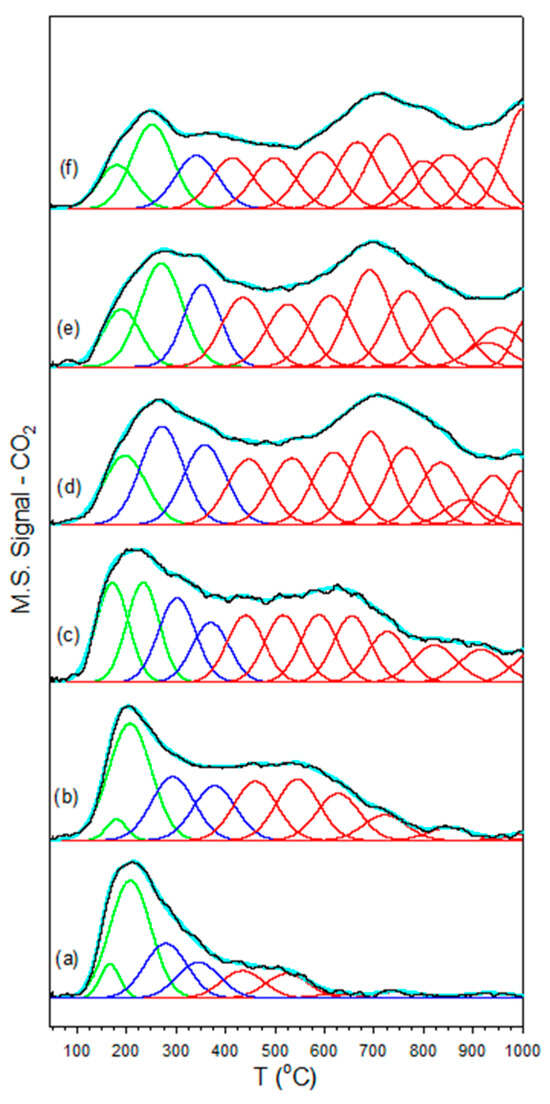
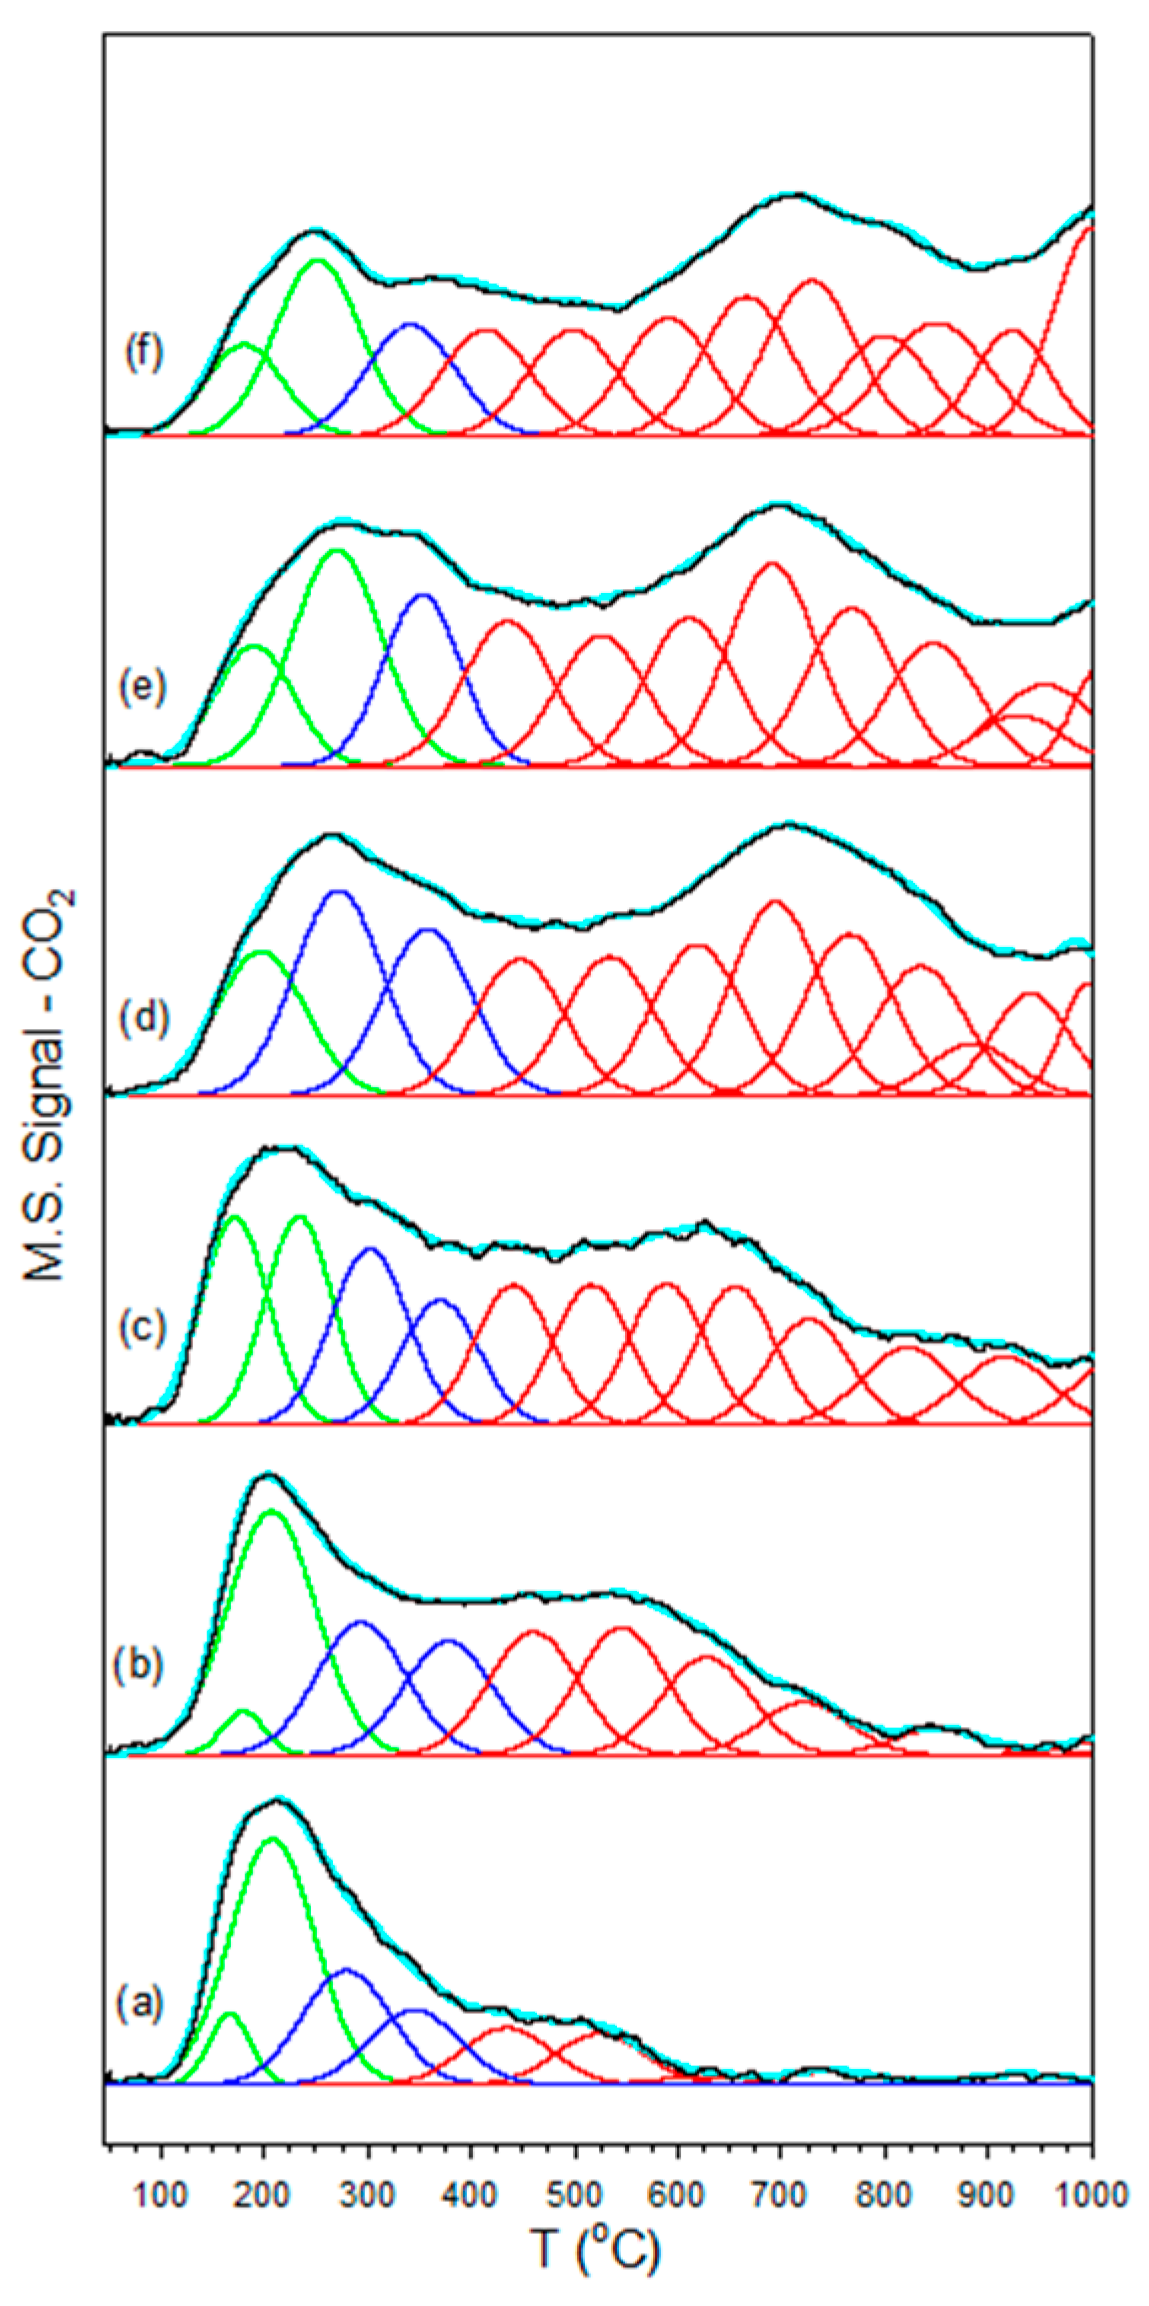
Figure 2.
CO2-TPD of (a) unpromoted 2%Pt/m-ZrO2 and the same with (b) 0.85% K, (c) 1.7% K, (d) 3.06% K, (e) 4.25% K, and (f) 8.5% K, including (solid black lines) data and (cyan) the result of the fitting with Gaussian peaks with maxima (green) below 250 °C, (dark blue) between 250 °C and 400 °C, and (red) greater than 400 °C.
CO2-TPD (Figure 3) confirmed that the K+ added basicity to the catalyst surface, as the surface carbonates formed exhibited greater stability. The fittings shown in Figure 2 and Table 2 of the desorption profiles using Gaussian peaks show that the fraction of peaks in the low temperature (<250 °C) range decreased, the fraction of peaks in the moderate temperature (250 < T < 400 °C) range passed through a maximum, and the fraction of peaks in the high temperature range (>400 °C) increased systematically with increasing the loading of K+. Increased binding of CO2 has direct consequences on the bonding of surface intermediates, to be discussed.
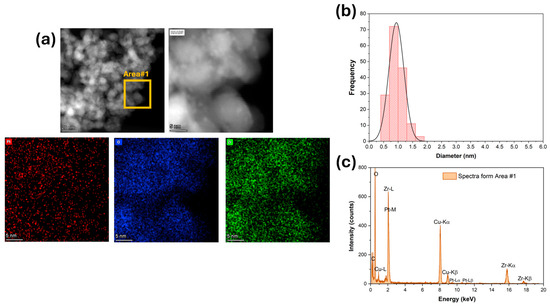
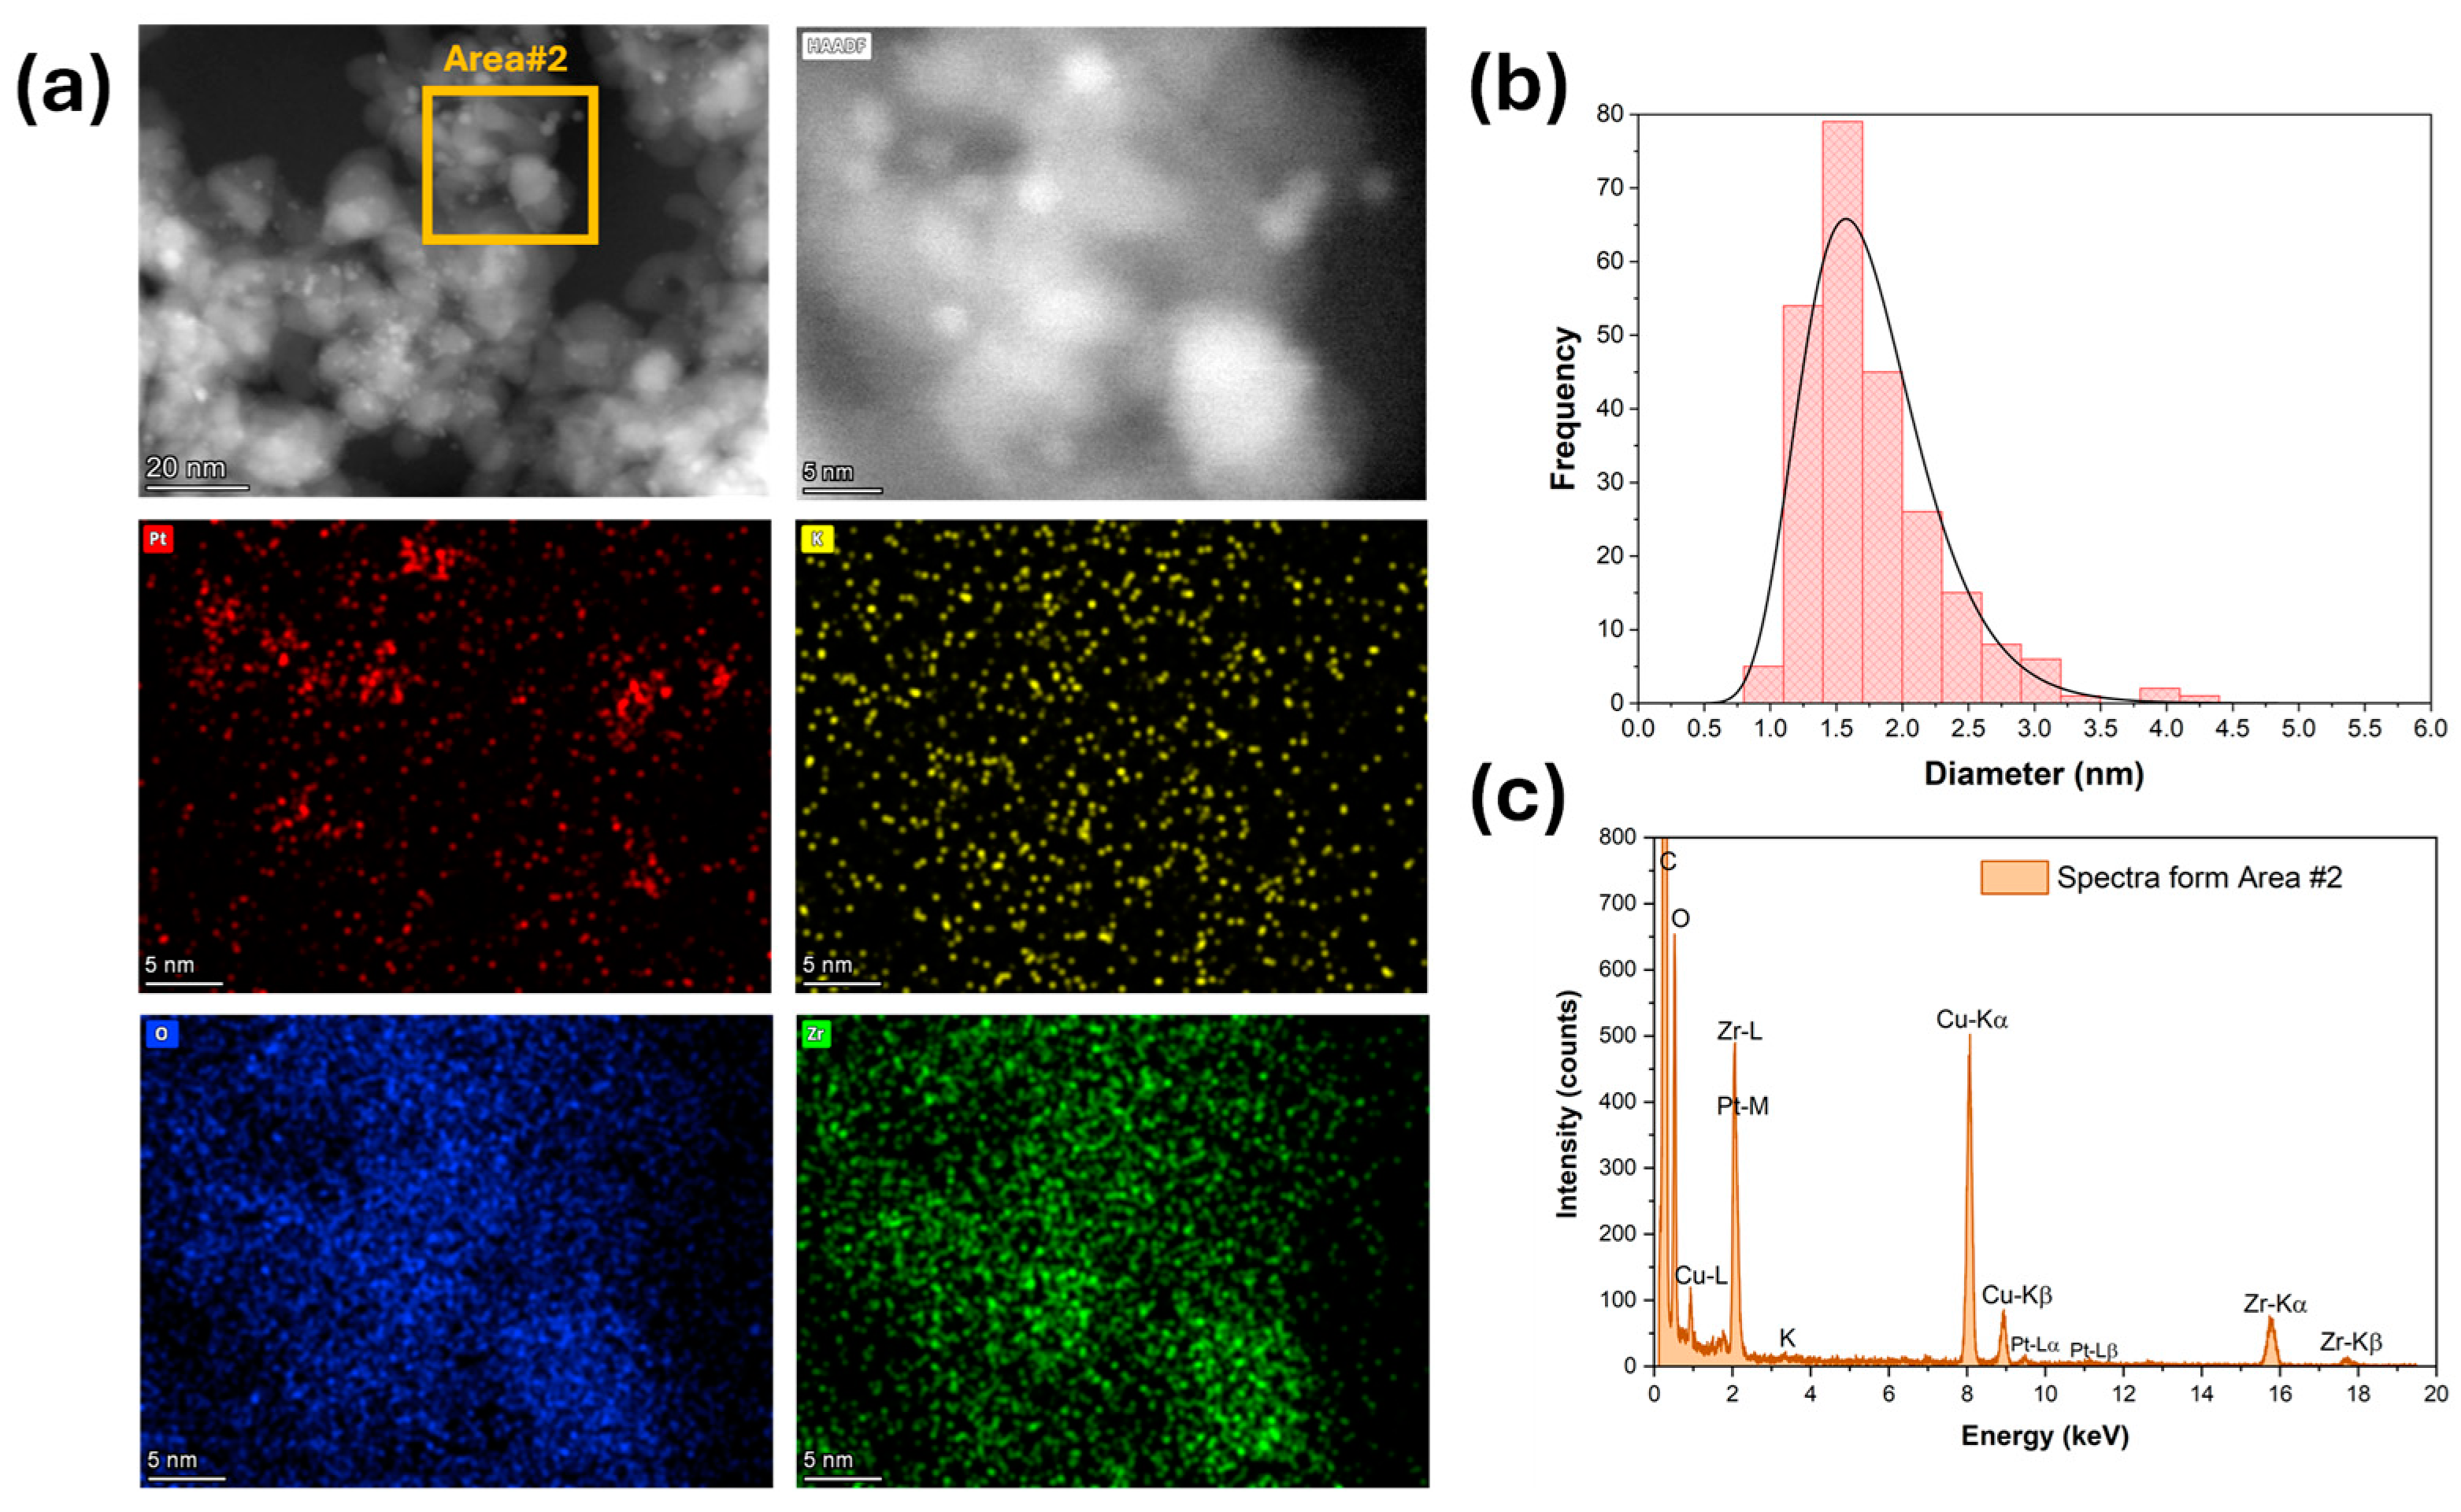
Figure 3.
(a) HAADF-STEM and EDS-mapping images, (b) Pt particle size distribution, and (c) ESD spectra for 2%Pt/ZrO2.
Table 2.
Results of fitting CO2-TPD profiles with Gaussian peaks. Gaussian peak area percentages with maxima within various temperature ranges are shown.
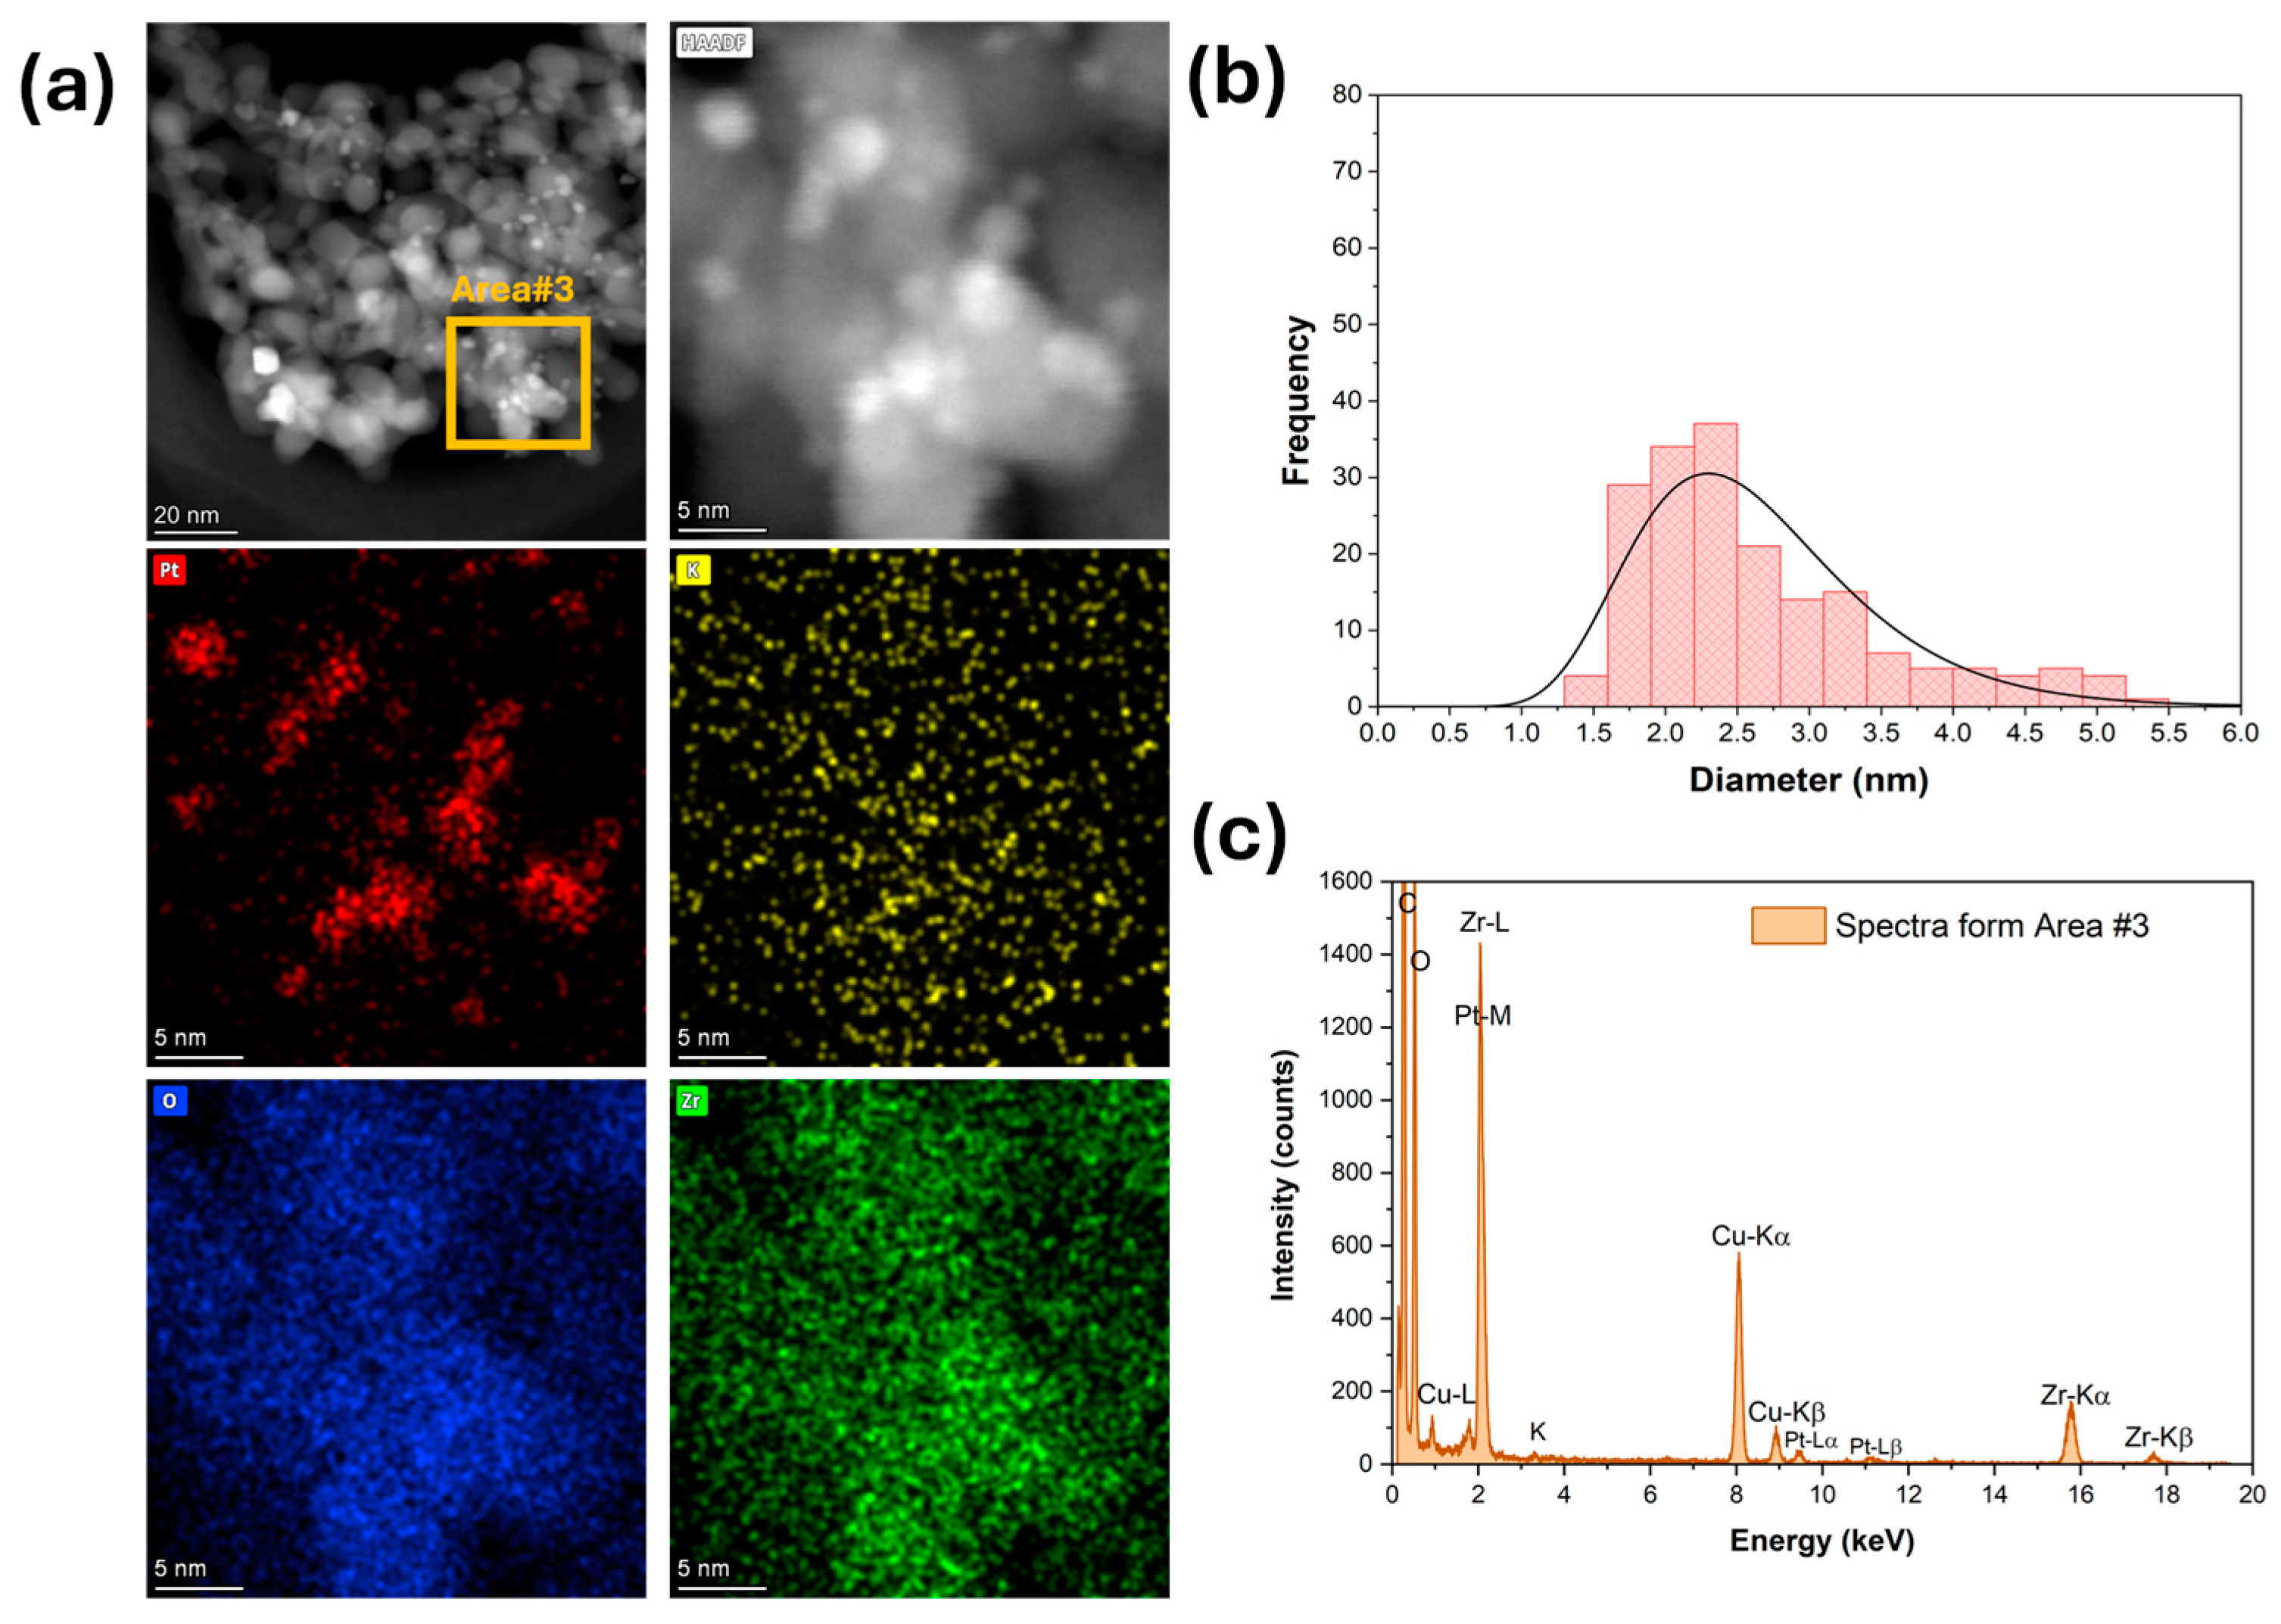
High-magnification HAADF-STEM images and EDS mapping and spectra show that platinum (Figure 3) was well dispersed for the unpromoted catalyst. The Pt particle size distribution was very narrow, with an average diameter of 1 nm (Figure 3b). The platinum was still well dispersed after adding 1.7% K (Figure 4), but the Pt particle size distribution was broader and shifted to higher values. The average Pt diameter was 1.8 nm, and some agglomerates of up to 4 nm were observed (Figure 4). However, only 2% of the counted Pt particles had diameters of larger than 3 nm. A further increase in potassium loading (3.06%) shifted the average Pt diameter to 2.6 nm and increased the number of agglomerates. Indeed, about 30% of the counted Pt particles had a diameter larger than 3 nm, and agglomerations of up to 5.5 nm were detected (Figure 5). In contrast, the potassium distribution was uniform at both loadings (1.7 and 3.06%). The CO2-TPD results show that the surface basicity increased by adding potassium, which could modify the metal–support interaction and consequently facilitate the agglomeration of Pt.
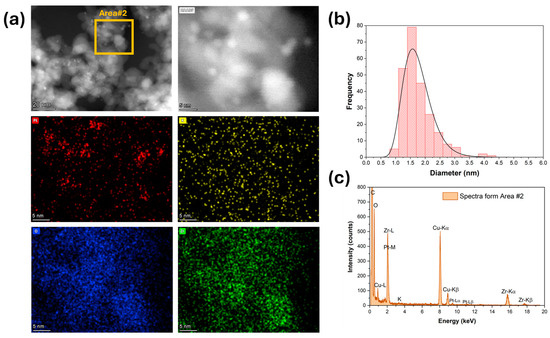
Figure 4.
(a) HAADF-STEM and EDS-mapping images, (b) Pt particle size distribution, and (c) EDS spectra for 1.7%K-2%Pt/ZrO2.

Figure 5.
(a) HAADF-STEM and EDS-mapping images, (b) Pt particle size distribution, and (c) EDS spectra for 3.06%K-2%Pt/ZrO2.
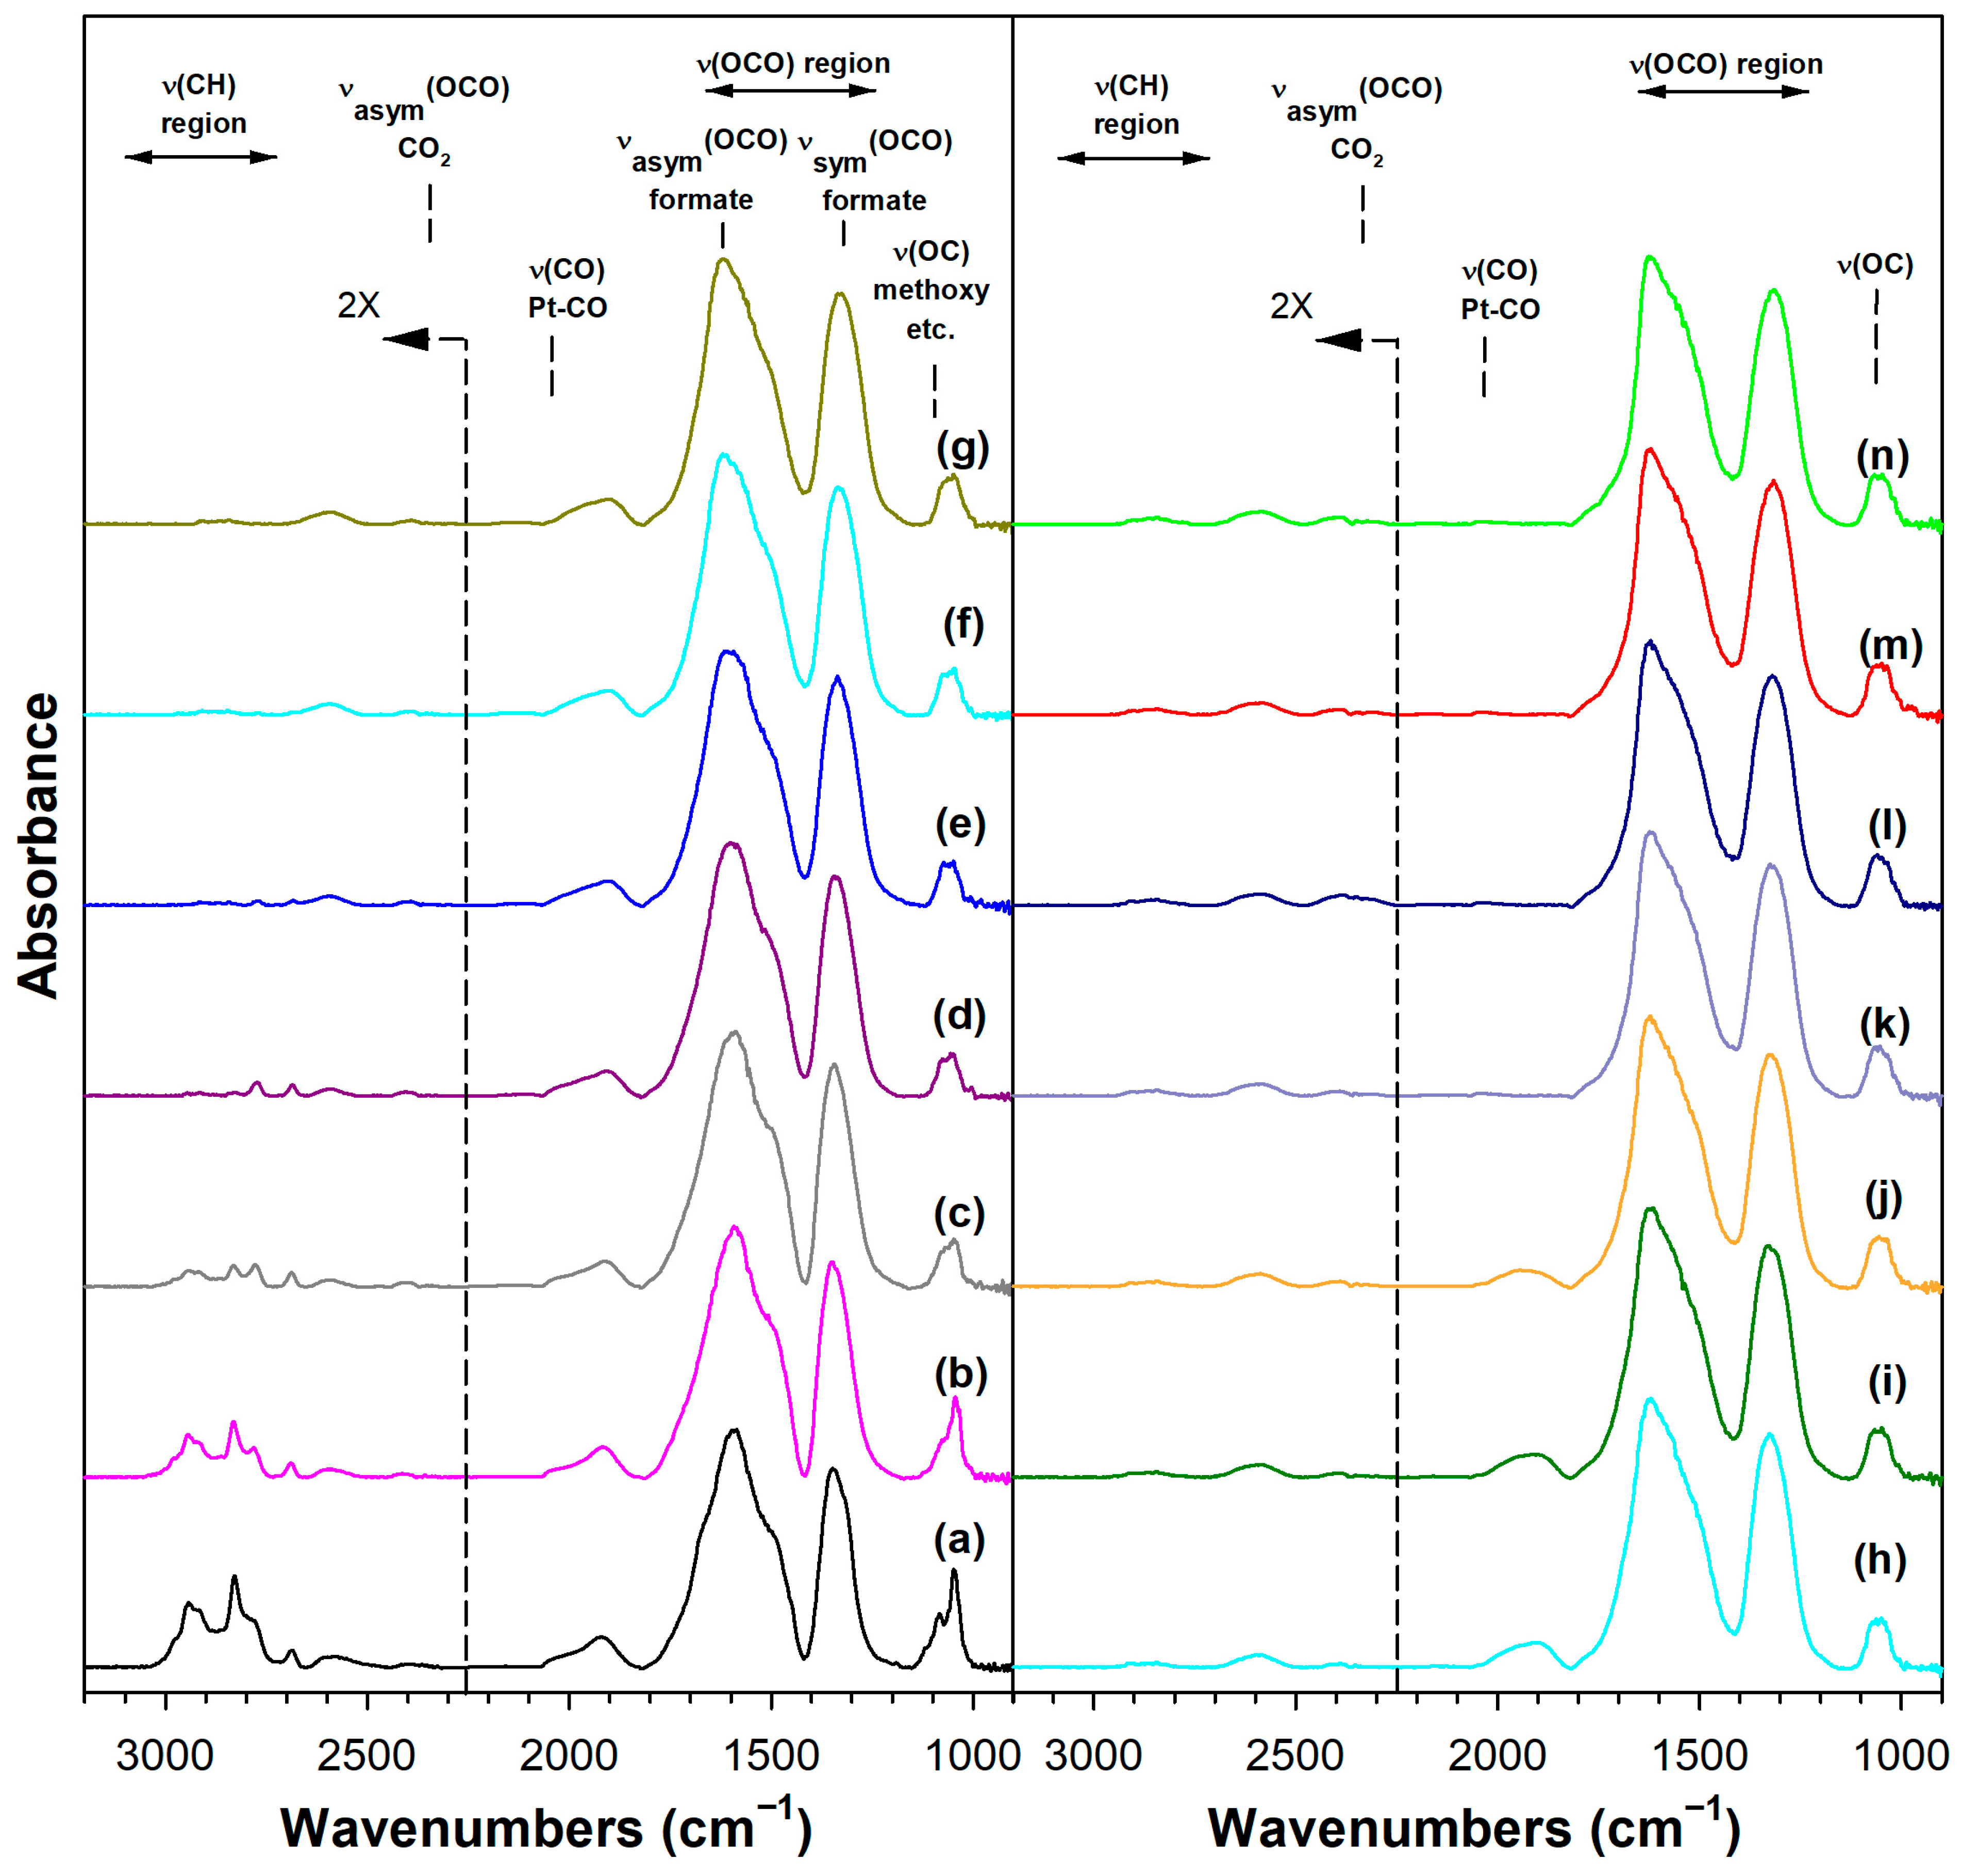
Figure 6 shows the DRIFTS spectra recorded during temperature-stepped MSR in flowing H2O vapor. As we observed in our earlier work with Pt/ceria [22], Pt/thoria [34], and Pt/zirconia [23] catalysts, adsorbing methanol displaced the defect-associated H2O, resulting in the formation of methoxy species and bridging Osupport-H groups, as follows:
□-OH + Osupport-H + CH3OH → □-O-CH3 + Osupport-H + H2O
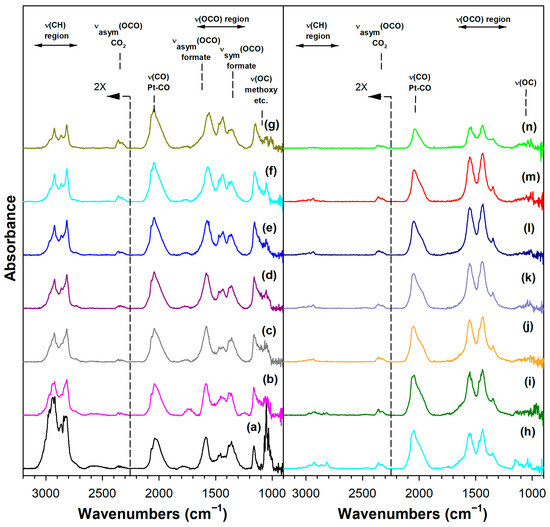
Figure 6.
DRIFTS of (a) adsorbed methanol at 50 °C, and temperature-stepped steam reforming of adsorbed methanol in 30 cm3/min of 4.4%H2O (balance He) over 2%Pt/m-ZrO2 at (a) 50 °C, (b) 75 °C, (c) 100 °C, (d) 125 °C, (e) 150 °C, (f) 175 °C, (g) 200 °C, (h) 225 °C, (i) 250 °C, (j) 275 °C, (k) 300 °C, (l) 325 °C, (m) 350 °C, and (n) 350 °C (He purge for 10 min).
Immediately, even at a low temperature of 50 °C, a fraction of the methoxy species was converted to formate by oxidative dehydrogenation, as previously discussed in Routes 1 and 2. Increasing the temperature increased the formation of formate up to ~150–175 °C, as the ν(OCO) bands increased in intensity and the ν(CH) bands resembled only the formate contribution (i.e., and not a significant contribution from methoxy species). By increasing the temperature further up to 275 °C, the formate bands diminished rapidly, as did the ν(OCO) bands of the carbonate species. Note that carbonate species located further from the periphery were more stable, and thus there were residual carbonates even at 350 °C. Note that we started with a clean surface, and therefore, a fraction of defect-associated carbonates remained that were unable to receive the catalytic effect of Pt. In contrast, rapidly reacting carbonates at the interface with Pt did decompose, especially in the presence of co-fed H2 (i.e., as we observed from DRIFTS experiments before and after activation). This interfacial effect was responsible for prolonged steady-state activity.
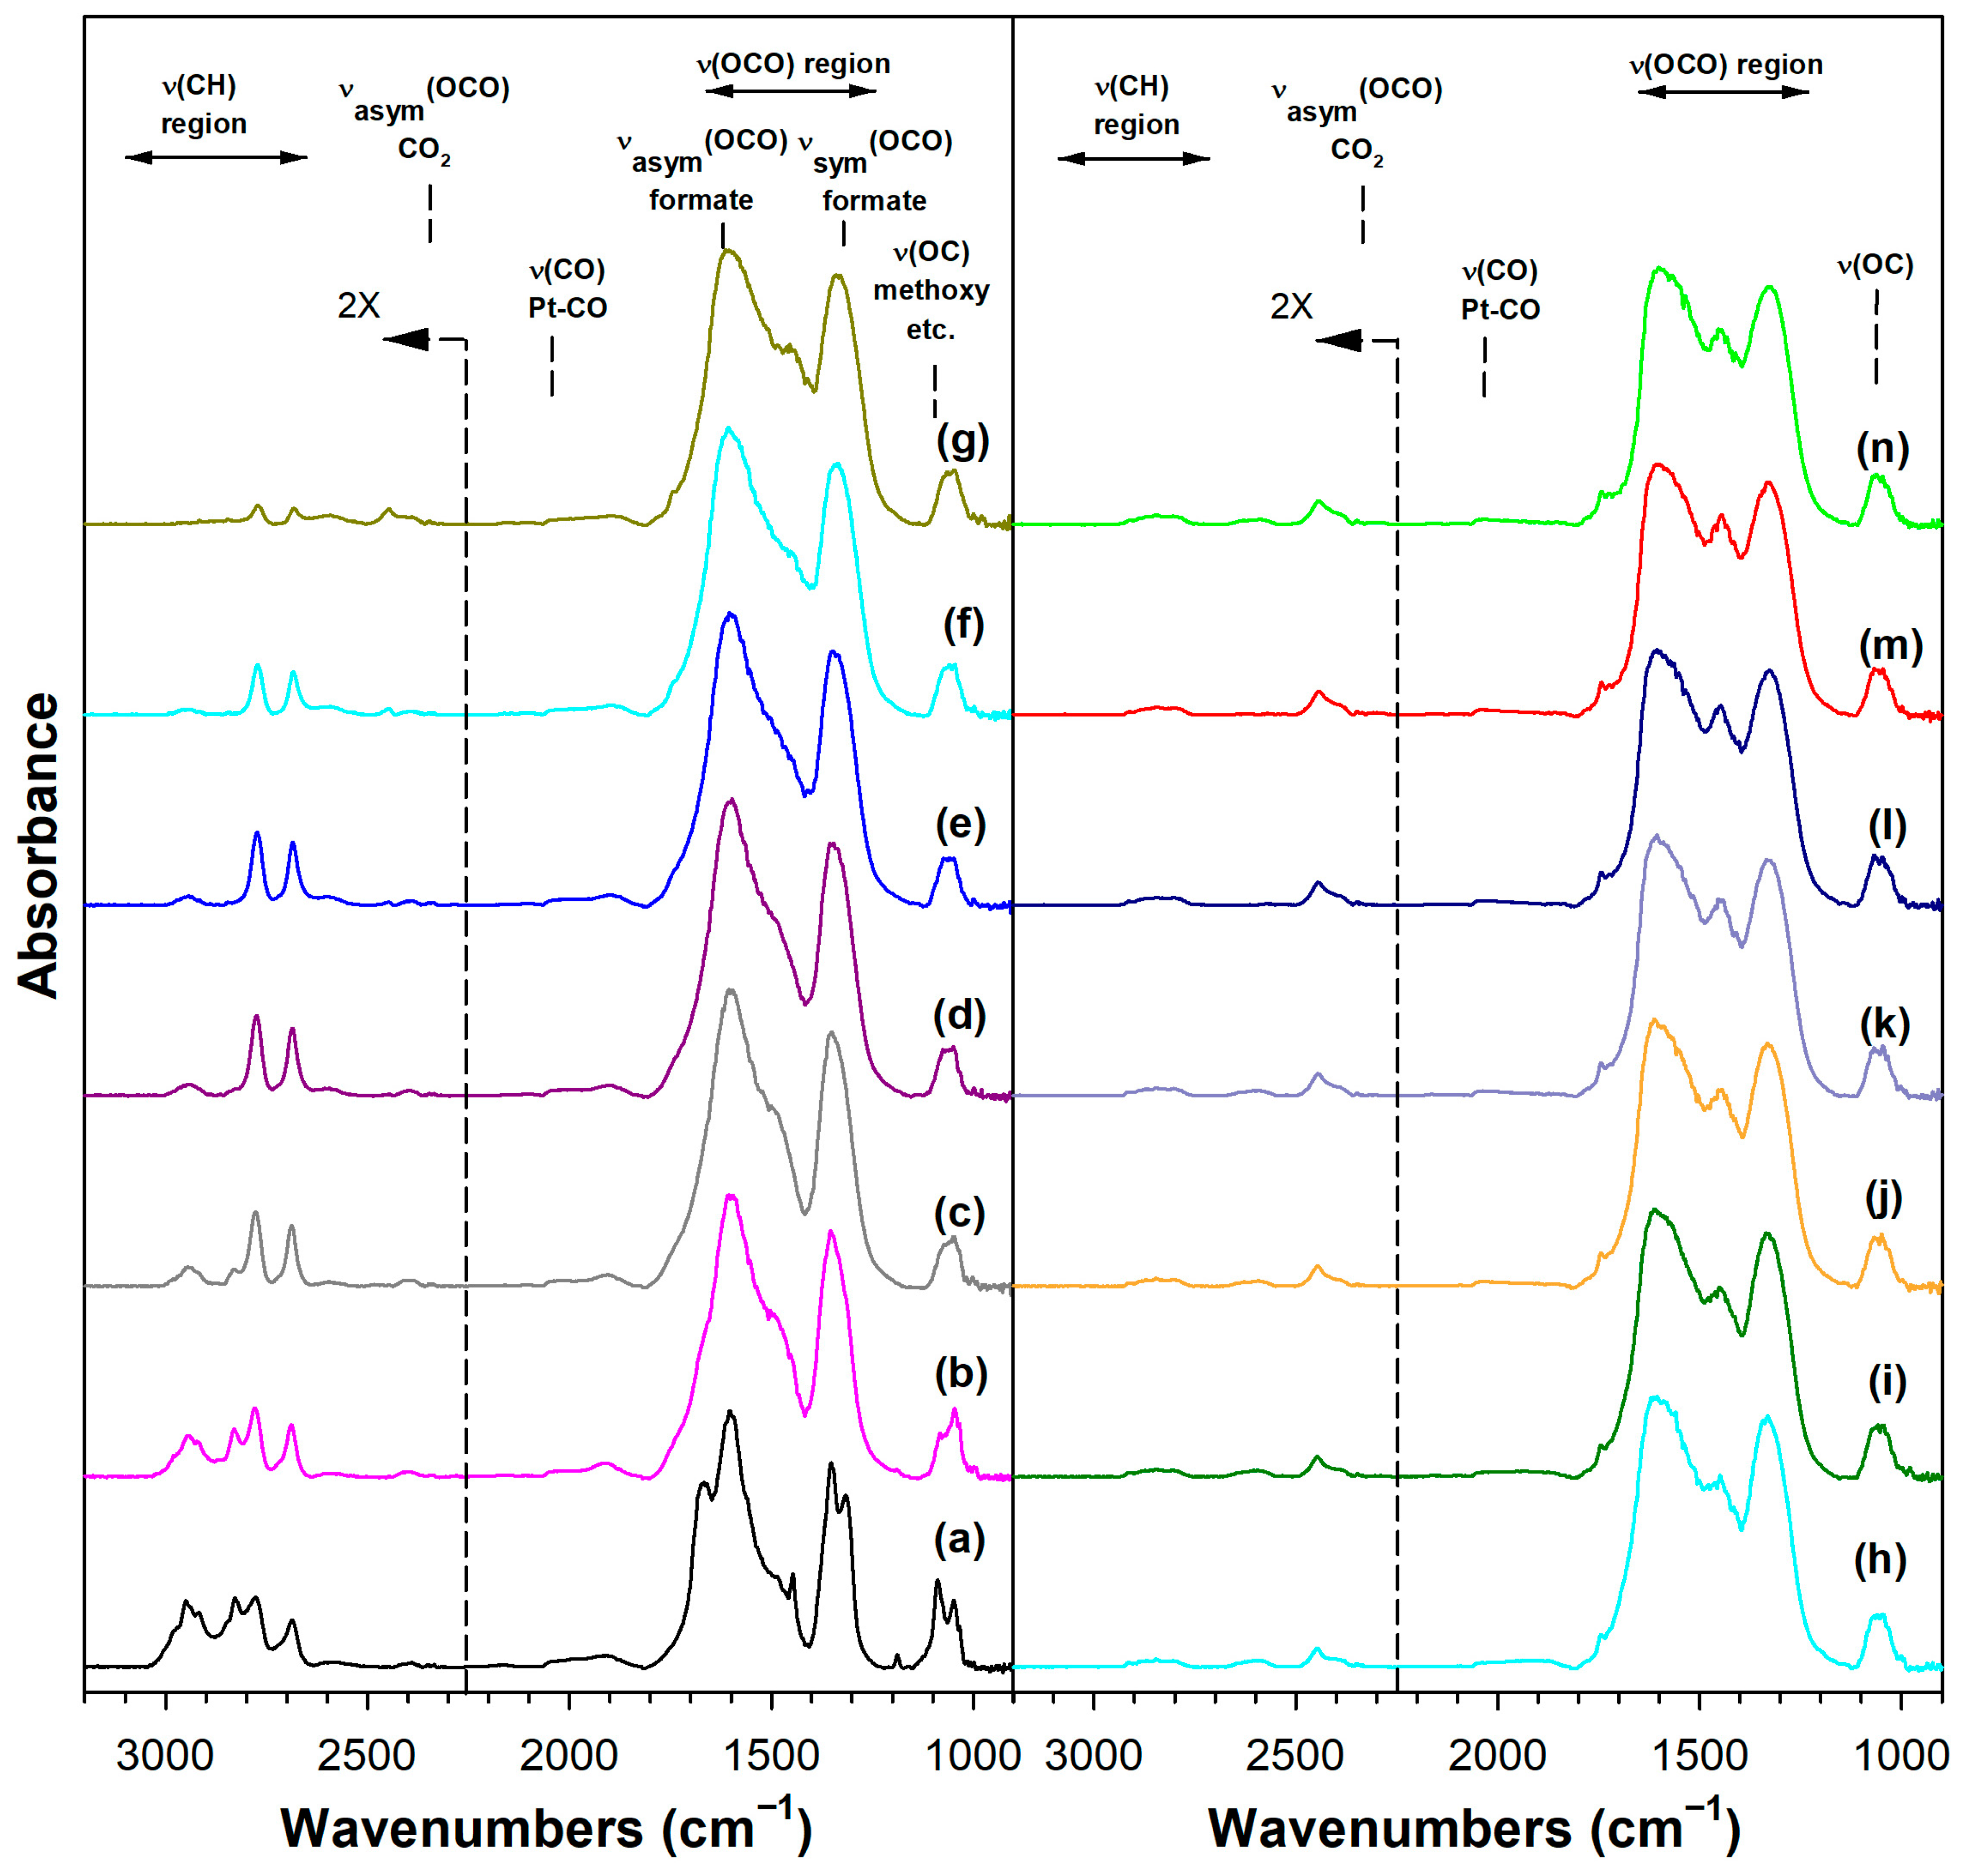
Adding K+ to the catalyst (Figure S3) and increasing the loading (Figures S4 and S5, Figure 7 and Figure 8) tended to shift the formate ν(CH) band to lower wavenumbers consistent with a weakening of this bond, destabilizing this intermediate. For the 3.06% K doping level, the formate had formed and decomposed by 150 °C. Also, the intensity of the residual carbonates increased systematically in agreement with their greater stability. Figure 9 and Table 3 show that the ν(CH) shifted progressively to lower wavenumbers as the loading was increased to 3.06% K (i.e., from 2814 to 2773 cm−1), and higher loadings did not result in further shifts.
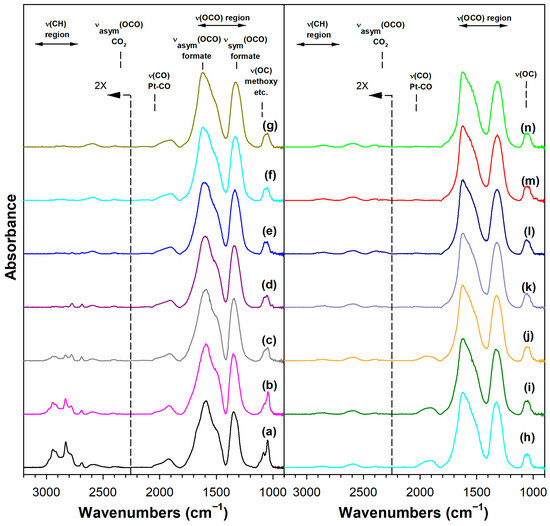
Figure 7.
DRIFTS of (a) adsorbed methanol at 50 °C, and temperature-stepped steam reforming of adsorbed methanol in 30 cm3/min of 4.4%H2O (balance He) over 3.06%K-2%Pt/m-ZrO2 at (a) 50 °C, (b) 75 °C, (c) 100 °C, (d) 125 °C, (e) 150 °C, (f) 175 °C, (g) 200 °C, (h) 225 °C, (i) 250 °C, (j) 275 °C, (k) 300 °C, (l) 325 °C, (m) 350 °C, and (n) 350 °C (He purge for 10 min).
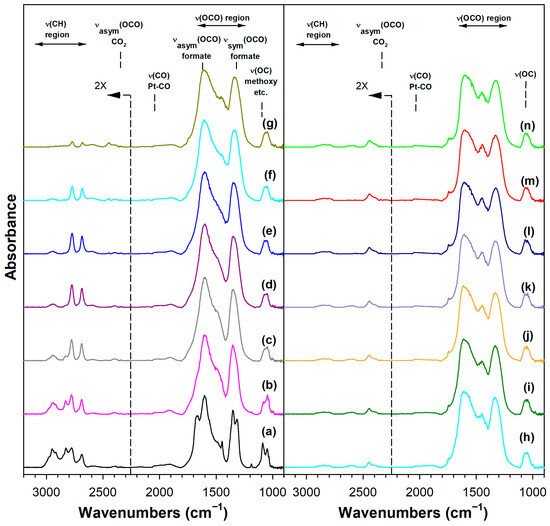
Figure 8.
DRIFTS of (a) adsorbed methanol at 50 °C, and temperature-stepped steam reforming of adsorbed methanol in 30 cm3/min of 4.4%H2O (balance He) over 4.25%K-2%Pt/m-ZrO2 at (a) 50 °C, (b) 75 °C, (c) 100 °C, (d) 125 °C, (e) 150 °C, (f) 175 °C, (g) 200 °C, (h) 225 °C, (i) 250 °C, (j) 275 °C, (k) 300 °C, (l) 325 °C, (m) 350 °C, and (n) 350 °C (He purge for 10 min).
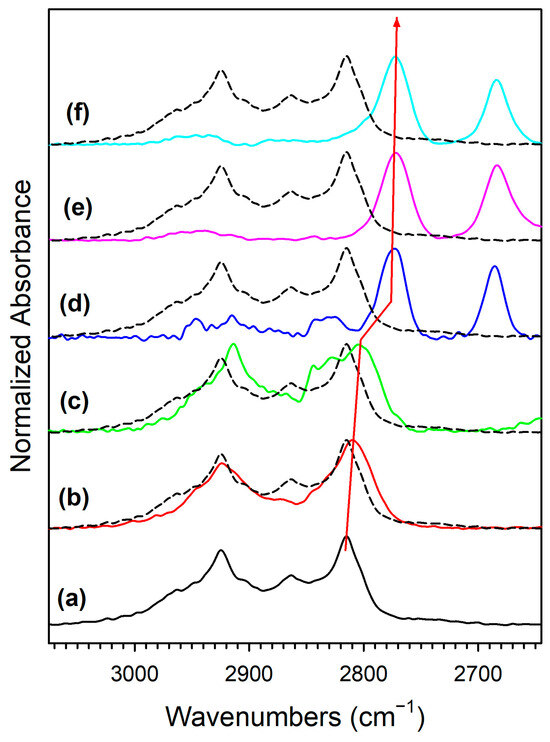
Figure 9.
DRIFTS of the formate ν(CH) stretching region in the 125–175 °C range during transient steam reforming of methanol, including (a, black) unpromoted 2%Pt/m-ZrO2, and the same promoted with (b, red) 0.85% K, (c, green) 1.70%KK, (d, blue) 3.06%K, (e, pink) 4.25%, and (f, cyan) 8.5%K. Note that spectra are normalized by peak height to emphasize peak displacements.
Table 3.
Formate ν(CH) band positions observed at maximum formate intensity (within the range of 125 °C to 175 °C, and ν(OCO) bands at 100 °C. Carbonate ν3(OCO) band positions and ν3(OCO) splitting at 250 °C.
Adding K+ also resulted in greater splitting of the ν(OCO) bands for both carbonate and formate, which is consistent with increased basicity [39]. Free carbonate possesses the following IR active bands [40]:
ν2(A2”) = ν2(A2’) = π(CO3) = out-of-plane wagging = 879 cm−1
ν3(E’) = ν3(E) = νas(OCO) = asymmetric stretching = 1415 cm−1
ν4(E’) = ν4(E) = δ(CO3) = in-plane deformation bending = 680 cm−1
ν1(A1’) is a molecular polarization that is only Raman active (1063 cm−1). The notation above varies based on the text. Lavalley’s [41] format is provided in bold text and is based on the notation of Nobel laureate Gerhard Herzberg [42]. A key to defining basicity using IR spectroscopy is the loss of D3h symmetry once adsorption occurs. Upon adsorption, the carbonate species formed presents two ν(CO) bands on either side of 1415 cm−1. Due to the loss of the D3h symmetry and the increasing character of C2V and CS, these two bands result from the splitting of the degenerate ν3 vibration. Surface chemists consider the Δν3 splitting as characterizing the structure of the species formed. For example, Busca and Lorenzelli have reviewed surface carbonates for a wide range of metal oxides and indicate that the splitting is approximately 100, 300, and 400 cm−1 for unidentate, bidentate, and bridged species, respectively [43]. In addition, they [43] have also considered the thermal stability of carbonate structures adsorbed on a surface. Based on the degree of coordination of each carbonate with the surface, it follows that unidentate carbonate should be less stable than bidentate structure, and bidentate should be less stable than bridged. There is some confusion in assigning polydentate carbonate, because often all three carbonate oxygens are bonded to metal ions, and on that basis, this results in a low degree of Δν3 splitting. But, by combining infrared spectroscopy with temperature-stepping, it is possible to decouple the signal of unidentate carbonate from polydentate carbonate. That is, polydentate carbonate has greater stability, only desorbing at higher temperatures. In Table 3, it is evident that the Δν3(OCO) band splitting for the carbonate species formed at 250 °C following formate conversion over the series from 0%K to 8.5%K (i.e., Δν3(OCO) 203, 313, 352, 289, 276, 231 cm−1) first increased, reached a maximum, and then decreased. The increase up to Δ = 352 cm−1 suggests an increase in the degree of bonding. The decrease after 352 cm−1 coupled with higher thermal stability suggests that an increasing fraction of the carbonate was polydentate in nature.
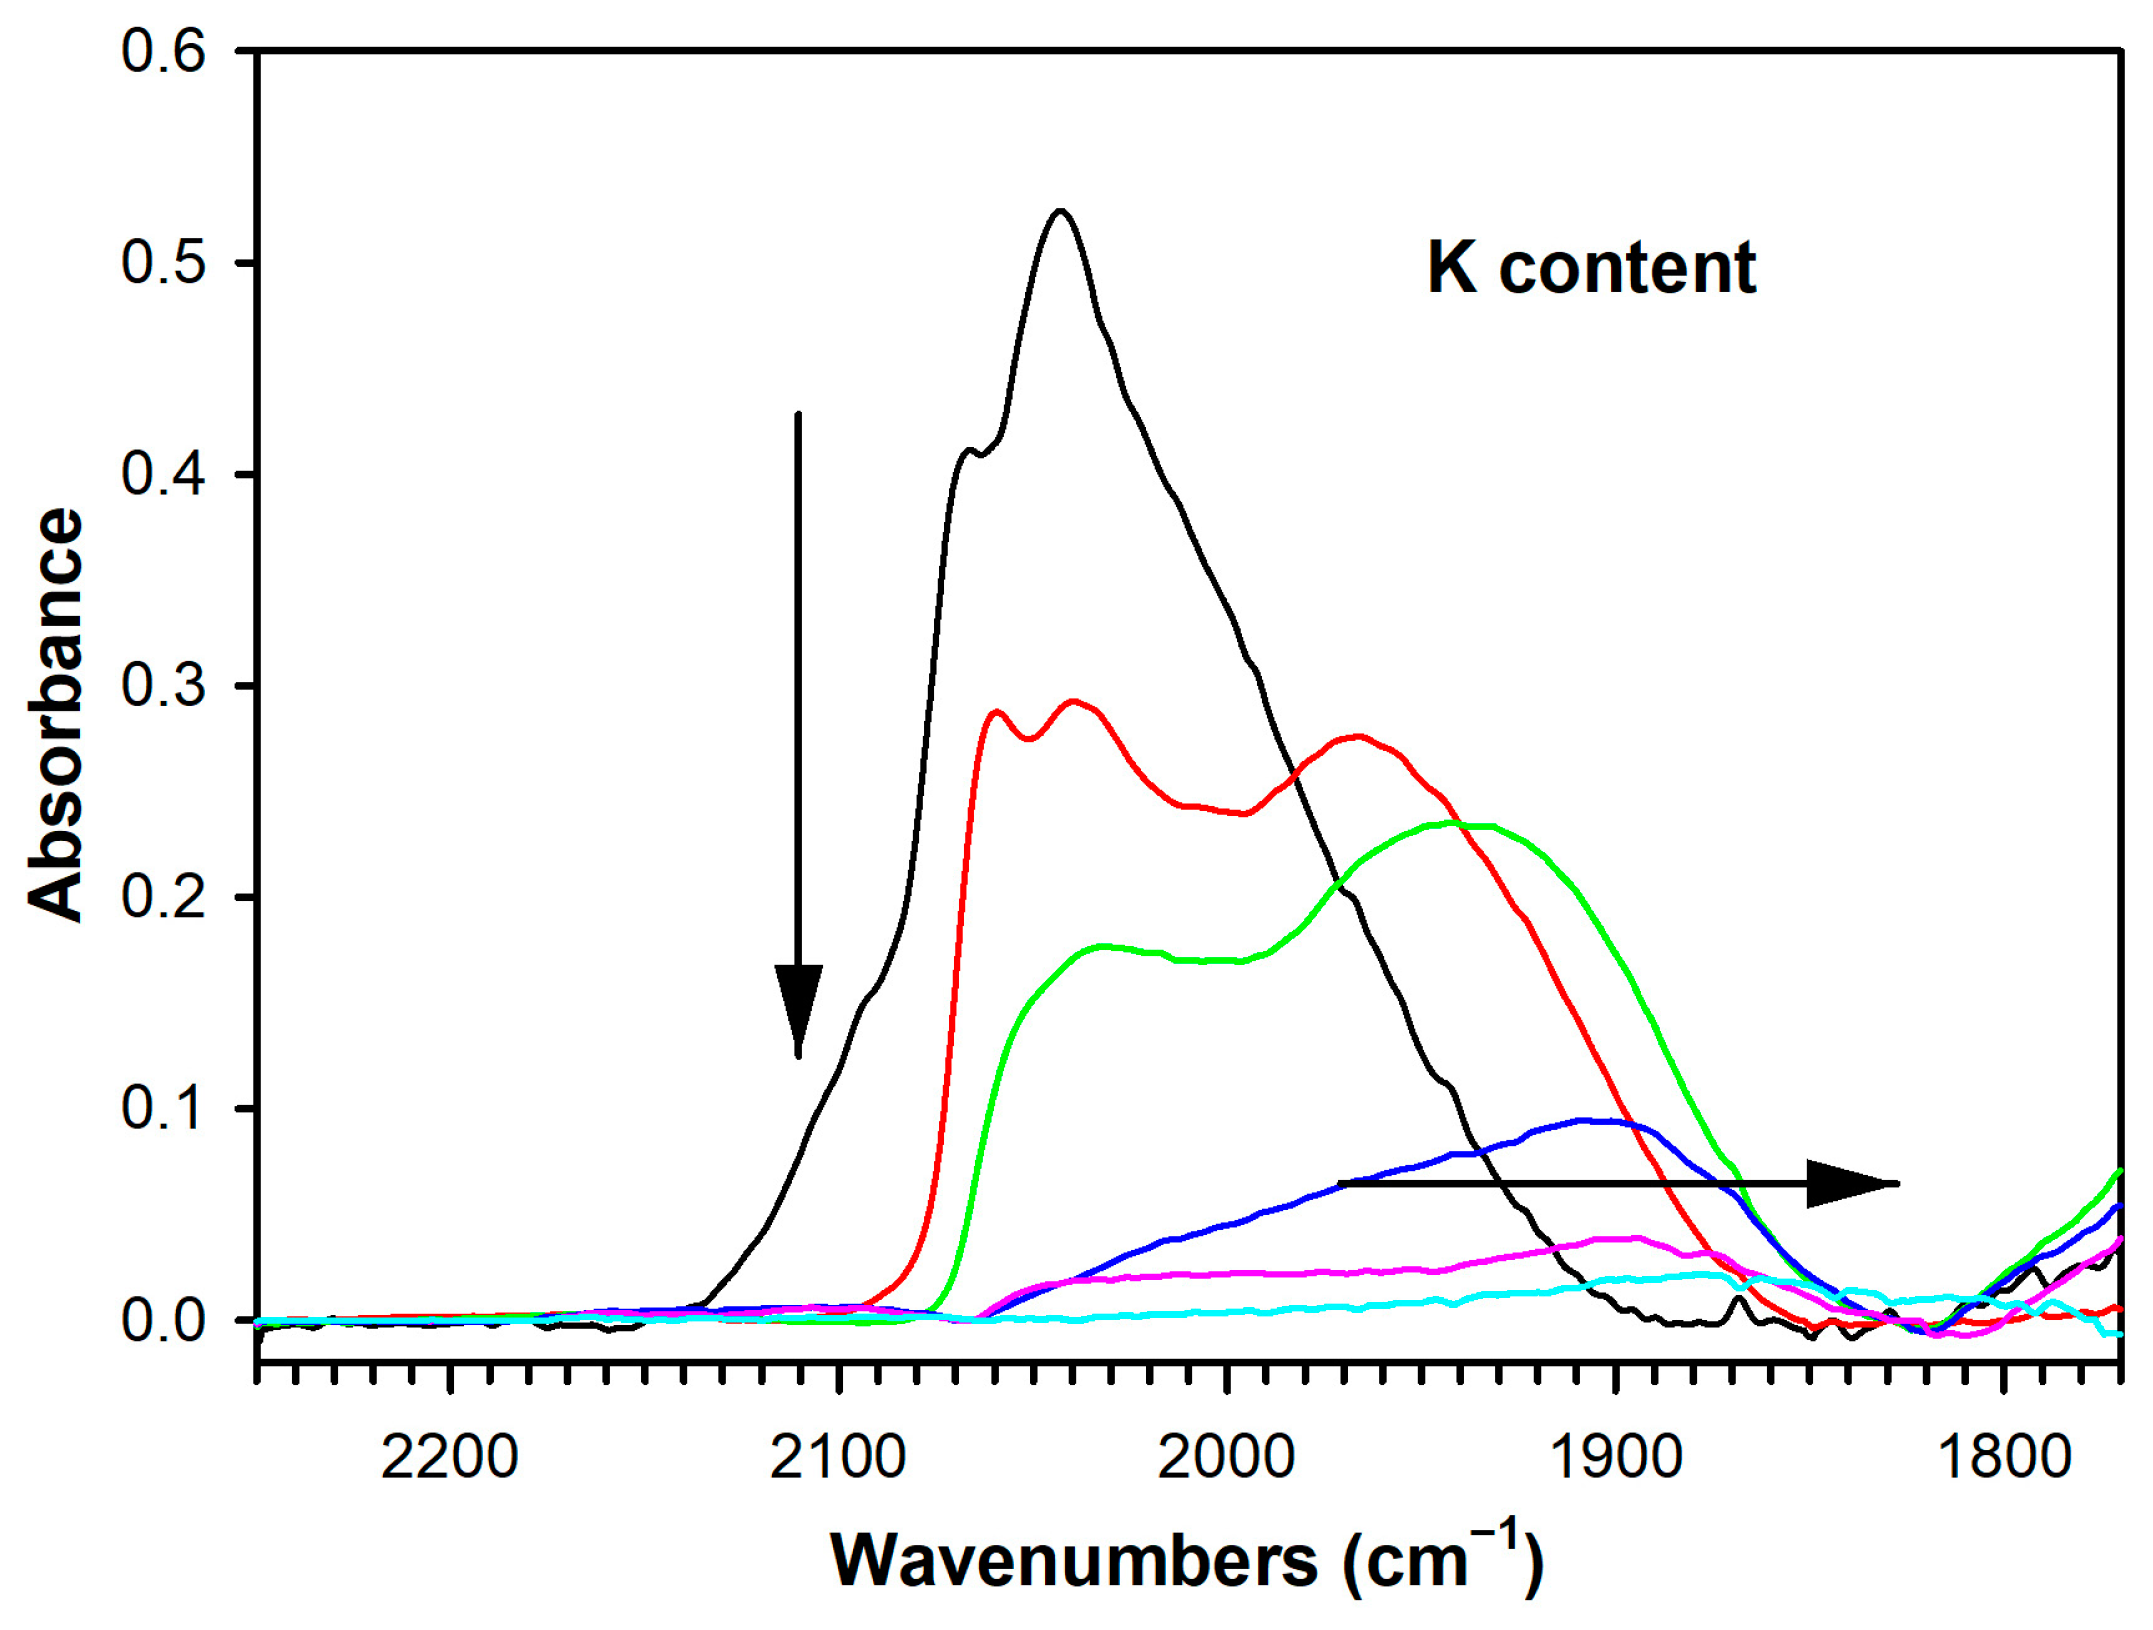
The splitting between the Δν(OCO) bands of formate followed a similar trend. As the -O2C part of the formate molecule (i.e., acidic, as CO2) became bound more tightly to the surface of the catalyst due to increased basicity from the added K, the formate C-H bond was weakened, promoting the dehydrogenation/decarboxylation Route 1 and boosting overall H2 selectivity. Another factor that must be considered is Pt-catalyzed carbonate decomposition. As shown in Figure 10 and Table S1, adding K+ attenuated the ν(CO) bands of Pt-carbonyls, which provided a measure of availability of the metallic function. Thus, in addition to increasing the stability of carbonate on the surface of the catalyst, adding K+ may exacerbate the problem by hindering Pt-catalyzed removal of carbonate. On the other hand, Pt-catalyzed methanation reactions are expected to be inhibited, which should result in a beneficial effect on selectivity.

Figure 10.
DRIFTS of the formate ν(CH) stretching region at 150 °C during transient steam reforming of methanol, including (black) unpromoted 2%Pt/m-ZrO2, and the same promoted with (red) 0.85% K, (green) 1.70% K, (blue) 3.06% K, (pink) 4.25%, and (cyan) 8.5% K.
Temperature-programmed MSR results (Figure 11 and Figure S6) confirm that straining the formate molecule by adding K+ resulted in a significant improvement in the dehydrogenation pathway (Route 1). As shown in Figure 11, the H2 evolution peak shifted from the 200–325 °C (max 260 °C) range to the 150–260 °C (max. 225 °C) range. Moreover, as shown in Figure S5, the CO and CH4 peaks were greatly suppressed with the addition of K+, as well as by increasing the loading of K+. Thus, Route 2 was suppressed and Route 1 became favored, as summarized in Figure 12.
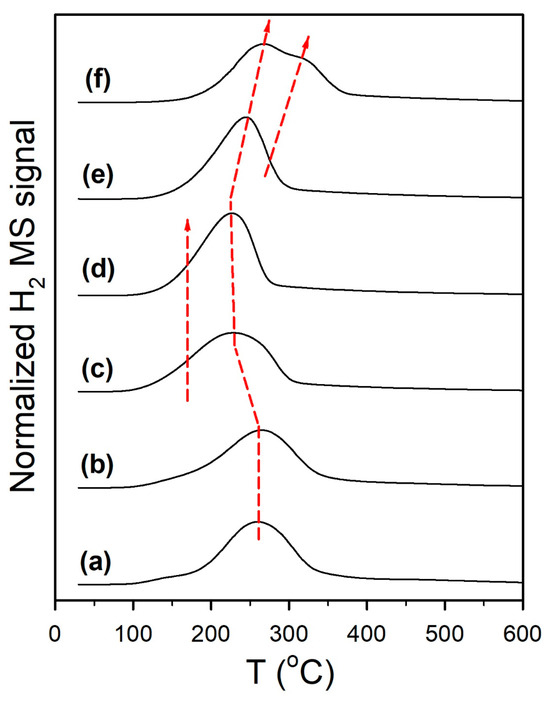
Figure 11.
H2 evolution during temperature-programmed surface reaction of methanol steam reforming, including (a) unpromoted 2%Pt/m-ZrO2, and the same with (b) 0.85% K, (c) 1.7% K, (d) 3.06% K, (e) 4.25% K, and (f) 8.5% K.
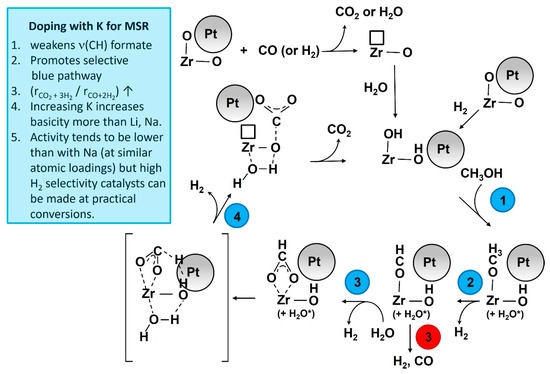
Figure 12.
Proposed catalytic action of K promotion.
The focus of this article is the effect of catalyst basicity on selectivity. As such, we have included two reaction testing scenarios to examine the basicity effect. The first scenario (co-fed H2 and high H2O/methanol ratio) was selected for three reasons. This work follows from investigations on low–temperature water–gas shift fuel processor catalysts, where alkali addition had a promoting effect on formate decomposition to H2 and CO2 [24,25,26,27]. Here, we mimic that condition and replace CO with CH3OH to determine whether a similar promoting effect on formate decomposition occurs that can lead to improvements in selectivity using the alkali effect. The second reason is that co-fed H2 and high steam/carbon ratios (here, H2O/CH3OH) are expected to promote stability by facilitating the removal of carbonaceous deposits. The third reason is that this scenario allows us to compare results of K-doped catalysts with those of Na-doped catalysts previously tested for MSR [23], since this catalyst series utilizes the same atomic ratio. Potassium is a more basic promoter than sodium and it is important to compare the differences between the two alkalis. The second scenario (CH3OH:H2O = 1:1) with no co-fed H2 was selected to test whether the alkali-promoting effect is still observable when the reaction is conducted using a stoichiometric feed.
Results of temperature-stepped steady-state MSR experiments for unpromoted and K-promoted catalysts are provided in Table 4 for the temperature range of 275 to 375 °C. As expected, adding K+ tended to diminish methanol conversion, and this was due to site suppression by K+ on both the Pt and the support. The decrease in the conversion could also have been due to the increases in the diameter of Pt particles when potassium was added. Indeed, the average Pt particle diameter was 1 nm for the unpromoted catalyst, whereas it increased to 1.7 nm for 1.7% K and to 2.6 nm for 3.06% K (Figure 3, Figure 4 and Figure 5). On the other hand, there was a remarkable shift in the selectivity towards less decarbonylation and less methanation. The greatest improvement in selectivity was observed with the 3.1%K catalyst, where CH4 was at or below 0.1% and CO selectivity was below 20% over the entire temperature range. Compare this to the unpromoted catalyst, which had CH4 selectivities of 1.3–1.6% and CO selectivities ranging from 32.2 (375 °C) to 73.9% (275 °C). To decouple the conversion effect on selectivity, some comparisons of interest are provided at a similar conversion level (20–28%) in Table 5. Once again, the effect of K-promotion on selectivity is clear. Adding 0.85% K and 1.7% K improved CO2 selectivity by more than a factor of five and cut the CH4 selectivity by more than half. Increasing the K level to 3.06% improved CO2 selectivity by a factor of more than nine, with the CH4 selectivity remarkably decreasing selectivity to below 0.1%.
Table 4.
Conversion and selectivities during MSR. Process conditions: P = 1 atm; GHSV = 381,000 h−1; 2.9% CH3OH: 4.3% N2: 29.9% H2: 26.1% H2O: 36.8% He.
Table 5.
Selectivities during MSR at similar conversion at 300 °C by changing GHSV. Process conditions: P = 1 atm; 2.9% CH3OH: 4.3% N2: 29.9% H2: 26.1% H2O: 36.8% He.
Some selectivity comparisons of the unpromoted catalyst with that of the 3.06% K loaded catalyst were also performed in the absence of co-fed H2 at three different temperatures of interest. Table S2 provides a comparison at the same space velocity, while Table S3 provides a comparison at a similar methanol conversion in order to decouple the effect of conversion on selectivity. Similar trends were obtained, as observed in the case of co-fed H2. Table S2 shows that while K-addition diminished the methanol conversion level, the CO2 selectivity was increased by a factor of about four (i.e., from a range of 10.7–12.2% for the unpromoted catalyst to a range of 40.5–52.0% for the 3.06% K-promoted catalyst. Table S3 shows that at similar conversion level, the selectivity of CO2 was completely altered from being a minor product (3.5–5.5%) for the unpromoted catalyst, to being the main product (59.0–68.5%) with 3.06% K addition.
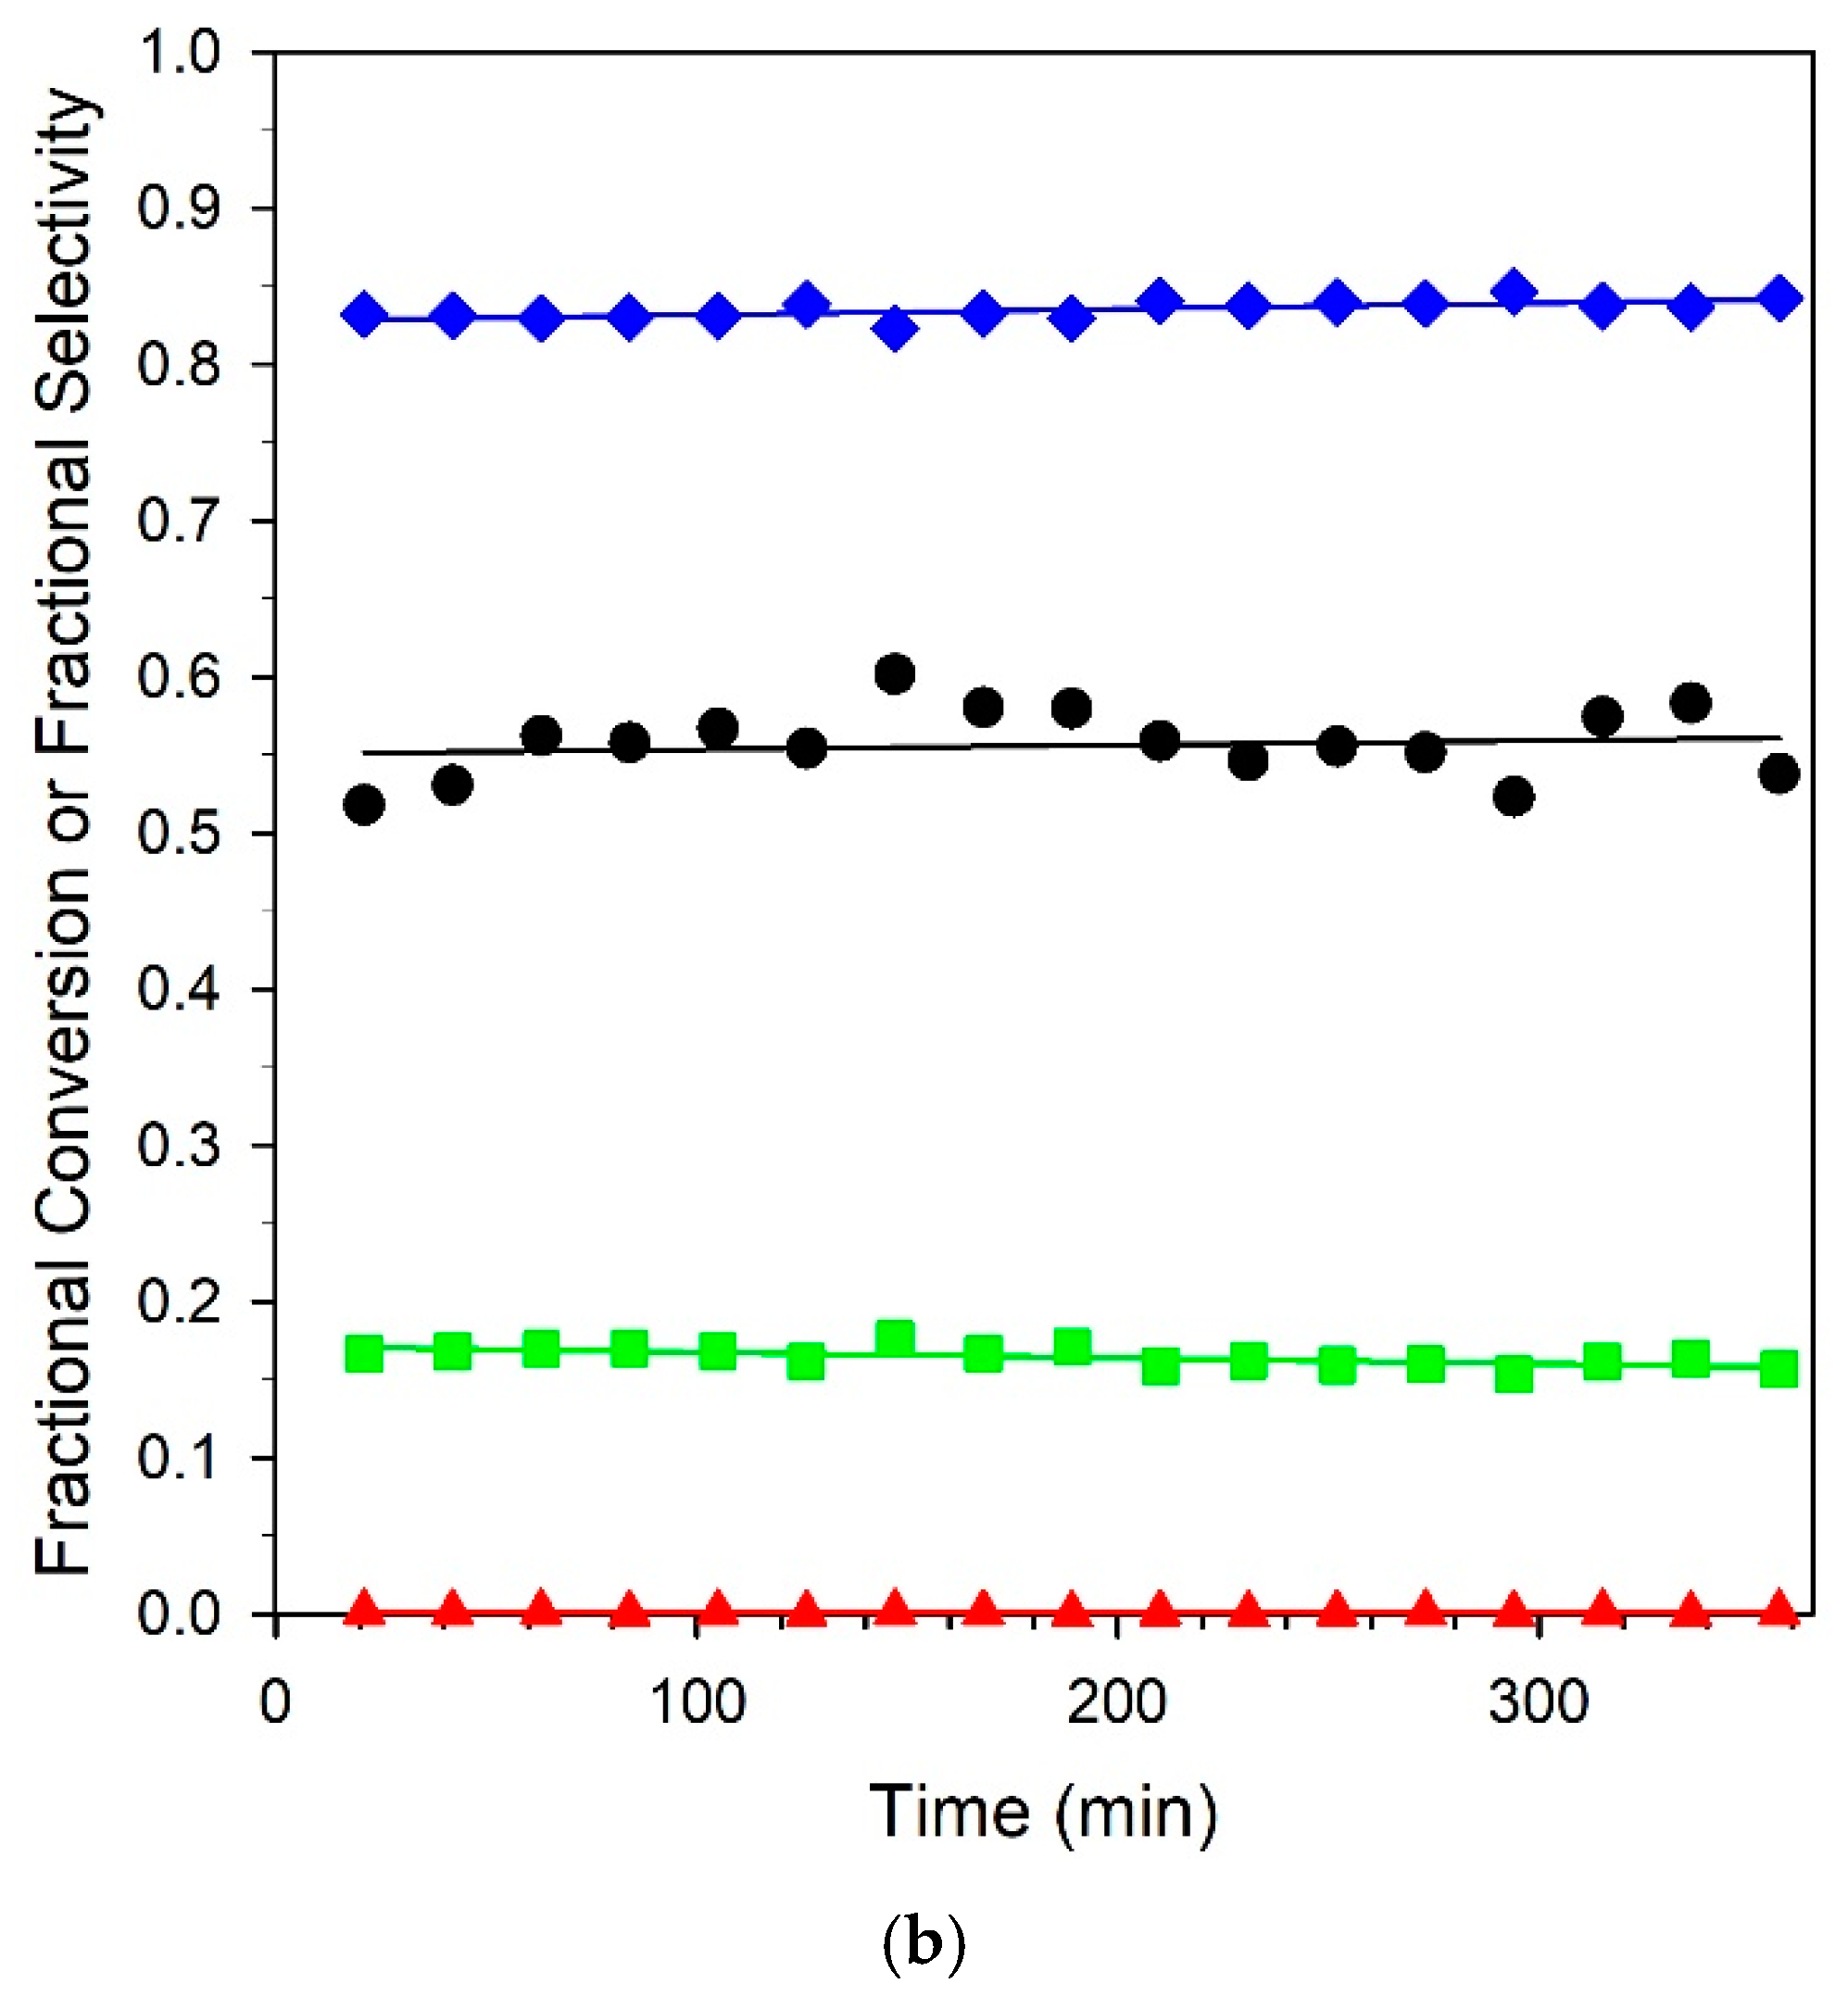
Six-hour stability tests of the unpromoted and 3.06% K-promoted catalysts are provided in Figure 13. Both catalysts offered good stability, and selectivities remained consistent for the duration of the runs. A comparison at 325 °C with our earlier work on Na promotion [23] at the optimal loading of 2.5% Na yielded an atomically equivalent loading of 4.25% K. While activity dropped from 74.1% to 45.2%, an equivalent loading of 4.25% K resulted in a steeper drop in conversion from 75.2 to 16.7%. This may have been due to a combination of the larger cation size of potassium, resulting in a larger footprint for blocking surface sites, and the higher basicity, which tended to hinder CO2 removal. The best loading from this work was 3.06% K, where the conversion was nearly double that of the 4.25% K loading of 35.2% at 325 °C, and the selectivities were above 80% at all temperatures. Even so, the optimum loading of Na produced selectivities of > 90% from 275 to 325 °C and was deemed to be an even better catalyst system than K+. Nevertheless, as shown from the stability test with the 3.06% K catalyst, selectivities that were significantly improved relative to the unpromoted catalyst could be obtained at practical conversions.
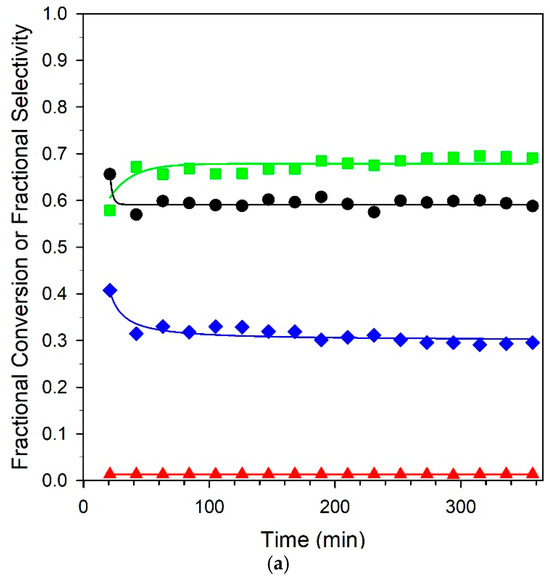
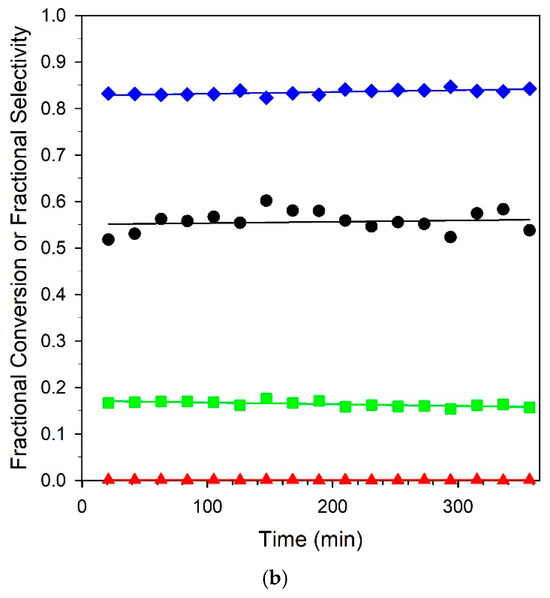
Figure 13.
Stability tests over (a) unpromoted 2%Pt/m-ZrO2 and (b) 3.06%K-2%Pt/m-ZrO2 catalysts. Conditions: 2.9% CH3OH: 4.3% N2: 29.9% H2: 26.1% H2O: 36.8% He, P = 1 atm; (a) GHSV = 422,000 h−1, 290 °C; (b) GHSV = 359,000 h−1, 358 °C. (Black circles) fractional CH3OH conversion, (green squares) fractional CO selectivity; (blue squares) fractional CO2 selectivity; and (red squares) fractional CH4 selectivity.
3. Materials and Methods
2%Pt/m-ZrO2 was prepared by loading monoclinic ZrO2 (1/8” pellets, Alfa Aesar, crushed and sieved to 63–106 μm) with an aqueous solution of tetraamine platinum (II) nitrate (Alfa Aesar, Haverhill, MA, USA) to the point of incipient wetness. The catalyst was dried and calcined in air at 350 °C for 4 h using a muffle furnace. This mother batch was divided into several batches for adding different weight% K loadings (0.85%, 1.7%, 3.06%, 4.25%, and 8.5%) with K(NO3) (Alfa Aesar, Haverhill, MA, USA) as the precursor. These loadings are atomically equivalent to 0.5%, 1.0%, 1.8%, 2.5%, and 5% Na loadings from our earlier work [23]. Aqueous incipient wetness impregnation was also used to add potassium nitrate, with drying and calcination at 350 °C for 4 h (muffle furnace).
BET surface area and porosity measurements were obtained using N2 physisorption with a Micromeritics 3-Flex instrument. The catalysts were degassed at 160 °C below 6.7 Pa for 12 h prior to acquiring the adsorption and desorption branches of the isotherm.
An Altamira AMI-300R (Pittsburgh, PA, USA) unit equipped with a thermal conductivity detector (TCD) was used to record H2 temperature-programmed reduction (H2-TPR) profiles of the catalysts. A 10% H2 in Ar mixture (UHP, Airgas, San Antonio, TX, USA) was flowed at 30 cm3/min, and the temperature was increased from 30 to 1000 °C at 10 °C/min. The thermocouple was located inside the catalyst bed, with approximately 200 mg of sample being used. Off-gases were analyzed using a quadrupole mass spectrometer (Hiden Instruments, Warrington, UK).
Prior to transmission electron microscopy (TEM) analysis, the samples were reduced in 25% H2 in helium at 350 °C for 1 h, cooled to room temperature, and passivated with a mixture of 1%O2 in nitrogen. The samples were dispersed in ethanol, sonicated, and then a droplet of the suspension was added to a carbon-coated copper grid (300 mesh) and dried in air overnight. TEM analysis was performed with an FEI Talos F200X instrument (Thermo Scientific, Waltham, MA, USA) equipped with BF, DF2, DF4, and HAADF detectors. The imaging was collected with a field emission gun using an accelerating voltage of 200 kV and a high-speed Ceta 16M camera (Thermo Scientific, Waltham, MA, USA), whereas the collected data were processed using Velox software (Version 2.16, Thermo Scientific, Waltham, MA, USA).
CO2 temperature-programmed desorption (CO2-TPD) was investigated using an Altamira AMI-300R instrument (Pittsburgh, PA, USA) connected to a Hiden mass spectrometer (Hiden Instruments, Warrington, UK). The catalyst was reduced at 300 °C using 10 cm3/min H2 (UHP, Airgas, San Antonio, TX, USA) and 20 cm3/min argon (UHP, Airgas, San Antonio, TX, USA) for 1 h, purged in 30 cm3/min flowing Ar for 20 min, and cooled to 30 °C. Then, the sample was saturated with CO2 using 25 cm3/min of 25% CO2 (balance helium) (UHP, Airgas, San Antonio, TX, USA) for 15 min, and finally the temperature was increased to 1000 °C (10 °C/min) in 30 cm3/min flowing Ar while the MS signal (m/z of 44) of CO2 was followed. TPD profiles often consist of overlapping signals from multiple desorption processes. Gaussian peaks were used to decompose the complex profile into individual contributions from each process, as they are ideal for modeling desorption events, approximating the broadening caused by experimental factors (e.g., temperature gradients), and resembling the natural shape of individual desorption signals.
A Nicolet iS-10 Fourier transform (Thermo Scientific, Waltham, MA, USA) infrared spectrometer coupled with an in situ Harrick Scientific Praying Mantis (Pleasantville, NY, USA) accessory was used to conduct temperature-stepped methanol steam reforming reaction experiments. First, 512 scans were taken of the calcined catalyst in 100 cm3/min of flowing helium at ambient temperature. The catalyst was reduced at 300 °C using a 1:1 mixture of H2:He (UHP, Airgas, San Antonio, TX, USA) at 200 cm3/min for 1 h and a background of 512 scans were taken. The catalyst was purged in 100 cm3/min of helium (UHP, Airgas, San Antonio, TX, USA) at 300 °C and cooled to 50 °C in flowing He, and another background of 512 scans was taken. Helium was used to bubble methanol (75 cm3/min) (Thermo Scientific, Waltham, MA, USA) for ~15 min. Then, 100 cm3/min of helium was used to remove the gas phase and weakly adsorbed methanol species, and a spectrum of 512 scans was taken. Helium was bubbled at 30 cm3/min through a saturator (located in a 31 °C water bath) containing deionized H2O (Thermo Scientific, Waltham, MA, USA) providing a H2O concentration of 4.4% with a flow rate of 30 cm3/min. This resulted in a reaction between adsorbed H2O and methoxy species, converting a fraction of them to formate. The temperature was stepped in 25 °C increments from 50 °C to 350 °C, and decarbonylation/decarboxylation of formate was observed at higher temperatures. The reaction chamber was purged in flowing He to assess the residual carbonates located at sites on the support away from metal nanoparticles.
Catalysts were activated by flowing 30 cm3/min of 33%H2 (balance argon) (UHP, Airgas, San Antonio, TX, USA) at 300 °C, purging for 20 min in flow argon (30 cm3/min) (UHP, Airgas, San Antonio, TX, USA), and cooling to ~30 °C. The catalyst surface was saturated by injecting 100 microliters of methanol and then purging in 50 cm3/min of argon for 15 min to remove weakly bound species. The H2O saturator was purged in Ar. Ar was bubbled at 30 cm3/min through the H2O saturator for 10 min, and then the catalyst was purged in 30 cm3/min Ar for 15 min. The catalyst was then heated at 10 °C/min to 1000 °C and the MS signals of H2, CO, CO2, and formaldehyde were followed to analyze the steps involved in converting methanol by steam, as well as to explore the effect of K promoter loading.
Catalytic tests were performed using a stainless-steel tubular microreactor (0.42 in. i.d.) with a fixed bed at steady state. In a typical run, 40 mg of catalyst sample (60–90 µm) diluted with 250 mg of SiO2 beads (60–90 µm) (Millipore-Sigma, St. Louis, MO, USA) was activated in hydrogen (100 cm3/min) (UHP, Airgas, San Antonio, TX, USA) at 350 °C for 1 h (ramp rate = 4 °C/min). Then, the gas was switched to a mixture containing, for one set of experiments, 2.9% CH3OH, 26.1% H2O, 29.9% H2, 4.3% N2 (balance He) (gases, UHP, Airgas, San Antonio, TX, USA and liquids, Thermo Scientific, Waltham, MA, USA) at P = 1 atm, GHSV = 381,000 h−1, and T = 275–375 °C. Other conditions were also used, as described in the manuscript. Products passed through a cold trap (cooled to 0 °C) to collect condensable compounds and the gas phase was analyzed by online GC. The SRI 8610 GC (SRI, Torrance, CA, USA) has two columns (i.e., a 3.658 m silica gel packed column and a 1.829 m molecular sieve packed column) as well as two detectors (i.e., FID and TCD). To improve the sensitivity of the CO and CO2 signals, the SRI GC includes a methanizer (SRI, Torrance, CA, USA) so that analysis could be conducted by FID. The carbon balance closed within ±3%.
4. Conclusions
This work introduces a significant advancement in the development of Pt/m-ZrO2 catalysts through potassium (K) promotion, enabling more selective hydrogen production via the formate dehydrogenation/decarboxylation pathway. By systematically varying K loading, we identified an optimal composition (3.1% K), achieving stable short-term operation at 358 °C with ~55% conversion, a remarkable CO2 selectivity (>80%), and minimal CH4 production (0.1%). In contrast, the unpromoted catalyst demonstrated higher CO selectivity (65–70%) and CH4 selectivity (~1.3%), underscoring the improved selectivity imparted by K. By increasing the loading of K on Pt/m-ZrO2 from 0.85 to 8.5 wt.%, a progressive decrease in activity and an increase in the H2-selective formate dehydrogenation/decarboxylation route was observed. The results of HR-TEM and DRIFTS of adsorbed CO reveal that increasing K content tended to block Pt sites and agglomerate Pt. Key mechanistic insights—supported by DRIFTS, CO2 TPD, and TP-MSR-rxn—reveal that K enhanced catalyst surface basicity, strengthened the formate interaction with the catalyst surface, and weakened C-H bonding, promoting desired H2-selective decarboxylation pathways. As compared with our previous studies using Na, K addition resulted in lower activity at atomically equivalent loadings and did not achieve CO selectivities as low as what we observed with Na addition. Nevertheless, this study presents a methodology for improving catalyst formulations to enable selective hydrogen production from methanol, a liquid chemical carrier with high volumetric energy density. Minimizing CO by-product formation is important for applications like PEM fuel cells for portable power systems.
Supplementary Materials
The following supporting information can be downloaded at: https://www.mdpi.com/article/10.3390/catal15050435/s1, Table S1: Attenuation of Pt-carbonyl bands with increasing K+ loading; Figure S1: H2 temperature-programmed reduction with mass spectrometry; Figure S2: Carbonate removal and bridging OH group formation from H2-reduction; Figure S3: DRIFTS of MSR over 0.85%K-2%Pt/m-ZrO2; Figure S4: DRIFTS of MSR over 1.7%K-2%Pt/m-ZrO2; Figure S5: DRIFTS of MSR over 8.5%K-2%Pt/m-ZrO2; and Figure S6: Temperature-programmed surface reaction of methanol steam reforming.
Author Contributions
Conceptualization, G.J. and M.M.; methodology, G.J. and M.M.; formal analysis, B.M., M.M., D.Q., P.M., F.P.M. and G.J.; investigation, B.M., M.M., D.Q., P.M., F.P.M. and G.J.; resources, G.J. and M.M.; data curation, G.J. and M.M.; writing—original draft preparation, G.J., M.M. and B.M.; writing—review and editing, B.M., M.M., P.M., F.P.M. and G.J.; supervision, G.J. and M.M.; funding acquisition, G.J. and M.M. All authors have read and agreed to the published version of the manuscript.
Funding
This research received no external funding.
Data Availability Statement
The original contributions presented in the study are included in the article; further inquiries can be directed to the corresponding authors.
Acknowledgments
The authors thank the State of Texas and the Commonwealth of Kentucky for their support.
Conflicts of Interest
The authors declare no conflicts of interest.
References
- Olah, G.A. After Oil and Gas: Methanol Economy. Catal. Lett. 2004, 93, 1–2. [Google Scholar] [CrossRef]
- Cheng, Y.; Zhang, J.; Lu, S.; Jiang, S.P. Significantly enhanced performance of direct methanol fuel cells at elevated temperatures. J. Power Sources 2020, 450, 227620. [Google Scholar] [CrossRef]
- Ghasemzadeh, K.; Tilebon, S.M.S.; Nasirinezhad, M.; Basile, A. Chapter 23: Economic Assessment of Methanol Production. In Methanol: Science and Engineering; Basile, A., Dalena, F., Eds.; Elsevier: Amsterdam, The Netherlands, 2018; pp. 613–632. ISBN 9780444639035. [Google Scholar] [CrossRef]
- Zhang, M.; Liu, D.; Wang, Y.; Zhao, L.; Xu, G.; Yu, Y.; He, H. Recent Advances in Methanol Steam Reforming Catalysts for Hydrogen Production. Catalysts 2025, 15, 36. [Google Scholar] [CrossRef]
- Mrad, M.; Gennequin, C.; Aboukaïs, A.; Abi-Aad, E. Cu/Zn-based catalysts for H2 production via steam reforming of methanol. Catal. Today 2011, 176, 88–92. [Google Scholar] [CrossRef]
- Li, D.; Xu, F.; Tang, X.; Dai, S.; Pu, T.; Liu, X.; Tian, P.; Xuan, F.; Xu, Z.; Wachs, I.E.; et al. Induced activation of the commercial Cu/ZnO/Al2O3 catalyst for the steam reforming of methanol. Nat. Catal. 2022, 5, 99–108. [Google Scholar] [CrossRef]
- Shokrani, R.; Haghighi, M.; Jodeiri, N.; Ajamein, H.; Abdollahifar, M. Fuel cell grade hydrogen production via methanol steam reforming over CuO/ZnO/Al2O3 nanocatalyst with various oxide ratios synthesized via urea-nitrates combustion method. Int. J. Hydrogen Energy 2014, 39, 13141–13155. [Google Scholar] [CrossRef]
- Dai, Y.; Lu, P.; Cao, Z.; Campbell, C.T.; Xia, Y. The physical chemistry and materials science behind sinter-resistant catalysts. Chem. Soc. Rev. 2018, 47, 4314–4331. [Google Scholar] [CrossRef]
- Cheng, Z.; Zhou, W.; Lan, G.; Sun, X.; Wang, X.; Jiang, C.; Li, Y. High-performance Cu/ZnO/Al2O3 catalysts for methanol steam reforming with enhanced Cu-ZnO synergy effect via magnesium assisted strategy. J. Energy Chem. 2021, 63, 550–557. [Google Scholar] [CrossRef]
- Sanches, S.G.; Flores, J.H.; da Silva, M.I.P. Cu/ZnO and Cu/ZnO/ZrO2 catalysts used for methanol steam reforming. Mol. Catal. 2018, 454, 55–62. [Google Scholar] [CrossRef]
- Siriruang, C.; Charojrochkul, S.; Toochinda, P. Hydrogen production from methanol-steam reforming at low temperature over Cu–Zn/ZrO2-doped Al2O3. Monatsh. Chem.-Chem. Mon. 2016, 147, 1143–1151. [Google Scholar] [CrossRef]
- Zhang, L.; Pan, L.; Ni, C.; Sun, T.; Zhao, S.; Wang, S.; Wang, A.; Hu, Y. CeO2–ZrO2-promoted CuO/ZnO catalyst for methanol steam reforming. Int. J. Hydrogen Energy 2013, 38, 4397–4406. [Google Scholar] [CrossRef]
- Phongboonchoo, Y.; Thouchprasitchai, N.; Pongstabodee, S. Hydrogen production with a low carbon monoxide content via methanol steam reforming over CuxCeyMgz/Al2O3 catalysts: Optimization and stability. Int. J. Hydrogen Energy 2017, 42, 12220–12235. [Google Scholar] [CrossRef]
- Iwasa, N.; Mayanagi, T.; Nomura, W.; Arai, M.; Takezawa, N. Effect of Zn addition to supported Pd catalysts in the steam reforming of methanol. Appl. Catal. A Gen. 2003, 248, 153–160. [Google Scholar] [CrossRef]
- Halevi, B.; Peterson, E.J.; Roy, A.; DeLariva, A.; Jeroro, E.; Gao, F.; Wang, Y.; Vohs, J.M.; Kiefer, B.; Kunkes, E.; et al. Catalytic reactivity of face centered cubic PdZnα for the steam reforming of methanol. J. Catal. 2012, 291, 44–54. [Google Scholar] [CrossRef]
- Zhang, H.; Sun, J.; Dagle, V.L.; Halevi, B.; Datye, A.K.; Wang, Y. Influence of ZnO facets on Pd/ZnO catalysts for methanol steam reforming. ACS Catal. 2014, 4, 2379–2386. [Google Scholar] [CrossRef]
- Azenha, C.; Lagarteira, T.; Mateos-Pedrero, C.; Mendes, A. Production of hydrogen from methanol steam reforming using CuPd/ZrO2 catalysts—Influence of the catalytic surface on methanol conversion and CO selectivity. Int. J. Hydrogen Energy 2021, 46, 17490–17499. [Google Scholar] [CrossRef]
- Meng, H.; Yang, Y.; Shen, T.; Yin, Z.; Wang, L.; Liu, W.; Yin, P.; Ren, Z.; Zheng, L.; Zhang, J.; et al. Designing Cu0−Cu+ dual sites for improved C−H bond fracture towards methanol steam reforming. Nat. Commun. 2023, 14, 7980. [Google Scholar] [CrossRef] [PubMed]
- Frank, B.; Jentoft, F.C.; Soerijanto, H.; Kröhnert, J.; Schlögl, R.; Schomäcker, R. Steam reforming of methanol over copper-containing catalysts: Influence of support material on microkinetics. J. Catal. 2007, 246, 177–192. [Google Scholar] [CrossRef]
- Lim, K.H.; Chen, Z.-X.; Neyman, K.M.; Rösch, N. Comparative theoretical study of formaldehyde decomposition on PdZn, Cu, and Pd surfaces. J. Phys. Chem. B 2006, 110, 14890–14897. [Google Scholar] [CrossRef]
- Yao, X.; Yuan, S.; Li, C.; Wang, L.; Yu, X.; Tian, P.; Tu, S.-T. ZnO-supported palladium catalysts via ball milling as an effective heterogeneous catalyst for methanol steam reforming. Fuel 2024, 358, 130133. [Google Scholar] [CrossRef]
- Jacobs, G.; Davis, B.H. In situ DRIFTS investigation of the steam reforming of methanol over Pt/ceria. Appl. Catal. A Gen. 2005, 285, 43–49. [Google Scholar] [CrossRef]
- Martinelli, M.; Jacobs, G.; Graham, U.M.; Davis, B.H. Methanol Steam Reforming: Na Doping of Pt/YSZ Provides Fine Tuning of Selectivity. Catalysts 2017, 7, 148. [Google Scholar] [CrossRef]
- Pigos, J.M.; Brooks, C.J.; Jacobs, G.; Davis, B.H. Low temperature water-gas shift: Characterization of Pt-based ZrO2 catalyst promoted with Na discovered by combinatorial methods. Appl. Catal. A Gen. 2007, 319, 47–57. [Google Scholar] [CrossRef]
- Pigos, J.M.; Brooks, C.J.; Jacobs, G.; Davis, B.H. Low temperature water–gas shift: The effect of alkali doping on the Csingle bondH bond of formate over Pt/ZrO2 catalysts. Appl. Catal. A Gen. 2007, 328, 14–26. [Google Scholar] [CrossRef]
- Pigos, J.M.; Brooks, C.J.; Jacobs, G.; Davis, B.H. Chapter 19: Low temperature water-gas shift: Assessing formates as potential intermediates over Pt/ZrO2 and Na doped Pt/ZrO2 catalysts employing the SSITKA-DRIFTS technique. In Advances in Fischer-Tropsch Synthesis, Catalysts and Catalysis; Davis, B.H., Occelli, M.L., Eds.; CRC Press, Taylor & Francis Group: Boca Raton, FL, USA, 2010; pp. 365–394. [Google Scholar] [CrossRef]
- Martinelli, M.; Alhraki, N.; Castro, J.D.; Matamoros, M.E.; Jacobs, G. Chapter 6: Effect of Na loading on Pt/ZrO2 catalysts for low temperature water-gas shift for the production and purification of hydrogen. In New Dimensions in Production and Utilization of Hydrogen; Nanda, S., Vo, D.-V., Tri, P.N., Eds.; Elsevier Books: Amsterdam, The Netherlands, 2020; pp. 143–160. ISBN 9780128195536. [Google Scholar] [CrossRef]
- Shido, T.; Iwasawa, Y. Reactant-Promoted Reaction Mechanism for Water-Gas Shift Reaction on Rh-Doped CeO2. J. Catal. 1993, 141, 71–81. [Google Scholar] [CrossRef]
- Chenu, E.; Jacobs, G.; Crawford, A.C.; Keogh, R.A.; Patterson, P.M.; Sparks, D.E.; Davis, B.H. Water-gas shift: An examination of Pt promoted MgO and tetragonal and monoclinic ZrO2 by in situ DRIFTS. Appl. Catal. B Environ. 2005, 59, 45–56. [Google Scholar] [CrossRef]
- Brooks, C.; Cypes, S.; Grasselli, R.K.; Hagemeyer, A.; Hogan, Z.; Lesik, A.; Streukens, G.; Volpe, A.F., Jr.; Turner, H.W.; Weinberg, W.H.; et al. High throughput discovery of CO oxidation/VOC combustion and water–gas shift catalysts for industrial multi-component streams. Top. Catal. 2006, 38, 195–209. [Google Scholar] [CrossRef]
- Evin, H.N.; Jacobs, G.; Ruiz-Martinez, J.; Graham, U.M.; Dozier, A.; Thomas, G.; Davis, B.H. Low Temperature Water–Gas Shift/Methanol Steam Reforming: Alkali Doping to Facilitate the Scission of Formate and Methoxy C–H Bonds over Pt/ceria Catalyst. Catal. Lett. 2008, 122, 9–19. [Google Scholar] [CrossRef]
- Yao, H.C.; Yao, Y.Y. Ceria in automotive exhaust catalysts: I. Oxygen storage. J. Catal. 1984, 86, 254–265. [Google Scholar] [CrossRef]
- Jacobs, G.; Graham, U.M.; Chenu, E.; Patterson, P.M.; Dozier, A.; Davis, B.H. Low-temperature water–gas shift: Impact of Pt promoter loading on the partial reduction of ceria and consequences for catalyst design. J. Catal. 2005, 229, 499–512. [Google Scholar] [CrossRef]
- Jacobs, G.; Patterson, P.M.; Graham, U.M.; Crawford, A.C.; Dozier, A.; Davis, B.H. Catalytic links among the water–gas shift, water-assisted formic acid decomposition, and methanol steam reforming reactions over Pt-promoted thoria. J. Catal. 2005, 235, 79–91. [Google Scholar] [CrossRef]
- Laachir, A.; Perrichon, V.; Badri, A.; Lamotte, J.; Catherine, E.; Lavalley, J.C.; El Fallah, J.; Hilaire, L.; le Normand, F.; Quemere, E.; et al. Reduction of CeO2 by hydrogen. Magnetic susceptibility and Fourier-transform infrared, ultraviolet and X-ray photoelectron spectroscopy measurements. J. Chem. Soc. Faraday Trans. 1991, 87, 1601–1609. [Google Scholar] [CrossRef]
- El Fallah, J.; Boujana, S.; Dexpert, H.; Kiennemann, A.; Majerus, J.; Touret, O.; Villain, F.; le Normand, F. Redox Processes on Pure Ceria and on Rh/CeO2 Catalyst Monitored by X-Ray Absorption (Fast Acquisition Mode). J. Phys. Chem. 1994, 98, 5522–5533. [Google Scholar] [CrossRef]
- Binet, C.; Daturi, M.; Lavalley, J.C. IR study of polycrystalline ceria properties in oxidised and reduced states. Catal. Today 1999, 50, 207–225. [Google Scholar] [CrossRef]
- Jacobs, G.; Ricote, S.; Patterson, P.M.; Graham, U.M.; Dozier, A.; Khalid, S.; Rhodus, E.; Davis, B.H. Low temperature water-gas shift: Examining the efficiency of Au as a promoter for ceria-based catalysts prepared by CVD of a Au precursor. Appl. Catal. A Gen. 2005, 292, 229–243. [Google Scholar] [CrossRef]
- Martinelli, M.; Marcelle, J.; Cronauer, D.C.; Kropf, A.J.; Jacobs, G. Isotope effect in formaldehyde steam reforming on Pt/m-ZrO2: Insight into chemical promotion by alkalis. Catal. Commun. 2023, 178, 106668. [Google Scholar] [CrossRef]
- Kong, F.; Wu, W.; Ji, N.; Calson, C.L. Chapter 4: The periodicity of molecules. In Advances in Mathematical Chemistry and Applications; Elsevier: Amsterdam, The Netherlands, 2015; Volume 2, pp. 74–95. [Google Scholar] [CrossRef]
- Lavalley, J.C. Infrared spectrometric studies of the surface basicity of metal oxides and zeolites using adsorbed probe molecules. Catal. Today 1996, 27, 377–401. [Google Scholar] [CrossRef]
- Herzberg, G. Infrared and Raman Spectra of Polyatomic Molecules; Van Nostrand: New York, NY, USA, 1945; Available online: https://archive.org/details/in.ernet.dli.2015.177114/page/n29/mode/2up (accessed on 11 November 2024).
- Busca, G.; Lorenzelli, V. Infrared spectroscopic identification of species arising from reactive adsorption of carbon oxides on metal oxide surfaces. Mater. Chem. 1982, 7, 89–126. [Google Scholar] [CrossRef]


Disclaimer/Publisher’s Note: The statements, opinions and data contained in all publications are solely those of the individual author(s) and contributor(s) and not of MDPI and/or the editor(s). MDPI and/or the editor(s) disclaim responsibility for any injury to people or property resulting from any ideas, methods, instructions or products referred to in the content. |
© 2025 by the authors. Licensee MDPI, Basel, Switzerland. This article is an open access article distributed under the terms and conditions of the Creative Commons Attribution (CC BY) license (https://creativecommons.org/licenses/by/4.0/).