Article

Nickel-Decorated Carbocatalysts for the UV-Driven Photodegradation of Rhodamine B

1
Unidad de Cambio Climático y Medio Ambiente (UCCMA), Instituto Iberoamericano de Desarrollo Sostenible (IIDS), Facultad de Arquitectura, Construcción y Medio Ambiente, Universidad Autónoma de Chile, Temuco 4780000, Chile
2
Department of Chemistry, Biochemistry, and Physics, Fairleigh Dickinson University, Madison, NJ 07940, USA
3
Unidad de Desarrollo Tecnológico (UDT), Universidad of Concepción, Barrio Universitario s/n, Concepción 4070386, Chile
4
Instituto de Química, Facultad de Ciencias, Universidad de Valparaíso, Valparaíso 2360102, Chile
5
Departamento de Ingeniería Química y Bioprocesos, Pontificia Universidad Católica de Chile, Avenida Vicuña Mackenna 4860, Macul, Santiago 7820436, Chile
*
Authors to whom correspondence should be addressed.
Catalysts 2025, 15(4), 385; https://doi.org/10.3390/catal15040385
Submission received: 2 March 2025 / Revised: 4 April 2025 / Accepted: 14 April 2025 / Published: 16 April 2025
(This article belongs to the Special Issue Hybrid Materials, Semiconductors and Carbon Photocatalysis)

Abstract

:
Nickel-decorated carbocatalysts were synthesized by the evaporation-induced self-assembly (EISA) method. The influence of the metal content and pyrolysis temperature upon the photoactivity was assessed through rhodamine B degradation under UV irradiation. The characterization revealed a mesoporous framework with a granular morphology composed of amorphous carbon, where the pyrolysis temperature influenced the metal dispersion on the carbon surface. The primary metallic phases consisted of elemental nickel crystallites and nickel carbide phases. The kinetic parameters for adsorption and dye photodegradation under UV irradiation were determined and compared to TiO2-P25. Correlations were found between the adsorption parameters, photocatalytic activity, and nickel content, the pyrolysis method (one-step vs. two-step pyrolysis), and the pyrolysis temperature. The sample with a 1:1:0.25 tannin/Pluronic®F-127/Ni weight ratio pyrolyzed at 700 °C exhibited the highest photoactivity, achieving rhodamine B degradation rates up to 68 and 2.5 times greater than photolysis and TiO2-P25. In terms of the normalized weight of the catalysts, it can be concluded that the present Ni-based catalysts are up to two orders of magnitude more photoactive than TiO2-P25 under UV irradiation, opening a door for indoor UV-driven photoreactors. These findings demonstrate that the EISA method is an effective, low-cost, and ecofriendly approach for synthesizing Ni-decorated carbocatalysts.

1. Introduction

Water pollution is one of the major environmental concerns of the 21st century, where industrialization, unsustainable practices, and continuous population growth greatly contribute to this pressing issue. There are many types of conventional and emerging water pollutants, including organic, inorganic, pathogenic, agricultural runoff, among others [1]. Polluted water causes adverse effects on humans, leading to various health problems, and disrupts the delicate balance of aquatic ecosystems, resulting in their eutrophication, depleted oxygen levels, destroyed habitats, and reduced biodiversity [2]. Although all types of water pollution are dangerous, organic pollutants are considered the most toxic, as they are non-biodegradable and accumulate in the fatty tissues of the human body, causing endocrine disruption, neurodegenerative disorders, immunodeficiency, and reproductive disorders, amid others [3]. Among organic pollutants, a significant contribution comes from synthetic dyes, most of which are produced by the textile industry [4]. These dyes degrade the esthetic quality of water by increasing the biochemical and chemical oxygen demand, impairing photosynthesis, inhibiting plant growth, and promoting toxicity, mutagenicity, and carcinogenicity [4]. All dyes are divided into categories based on their origin, structure, and application, with azo dyes representing the largest group (>60%) [4]. In this study, rhodamine B (RhB), a widely used cationic basic azo dye that is known to cause carcinogenic and neurotoxic effects in humans [5], was chosen as a dye of interest.
The search for the effective removal of azo dyes from wastewater has long been a subject of interest for many research groups. Recently, the removal of azo dyes by advanced oxidation processes (AOPs) [6] has received increasing interest, with heterogeneous photocatalysis as one of the most efficient methods [4,5,7,8,9,10,11,12,13]. AOPs are related to the in-situ generation of hydroxyl radicals as the powerful oxidizing agents used in the degradation of dye molecules in water. Among some commonly used heterogeneous photocatalysts are metal oxide-based semiconductors, such as TiO2, ZnO, CuO, SnO2, MoO3, NiO, etc., which exhibit high photocatalytic activity in the degradation of different dyes under UV–visible light irradiation [6,14,15,16,17,18,19,20,21,22,23,24,25,26]. However, it is well known that the doping of metal oxides with carbon-based nanoparticles can further increase their stability and improve their photocatalytic activity [7,8,9,10,11,17,27,28,29]. For instance, Lanfredi et al. [10] showed that the presence of amorphous carbon on ZnO enhanced its stability, photocatalytic activity (by a factor of 2.4), and regenerative ability, which is associated with the inhibited lixiviation of ZnO particles during irradiation. Furthermore, Muñoz-Flores and co-workers [8] reported an increased stability and a 4.4 times higher photocatalytic activity of carbon-doped Cu-based catalysts, which was attributed to the spherical carbon structure with an enhanced surface area and micropore volume. These authors showed an adequate stabilization of elemental and reduced Cu phases due to a protective carbon shell, which inhibited the oxidation and leaching of the active phase. Moreover, Song et al. [28] demonstrated an extension of the light absorption range of TiO2 to a visible range upon its loading onto the sawdust-derived carbon support. This fact has also been shown by Matos et al., who compared experimental and quantum-mechanical estimations [29]. Although TiO2 is considered the benchmark photocatalyst under UV light [7], it exhibits several limitations [30], and most recently has been reported as a suspected human carcinogen [31]. As such, a lot of current research focuses on the application of photocatalysts based on metal oxides other than TiO2. Thus, our group previously studied the photocatalytic degradation of RhB using a hybrid photocatalyst containing amorphous carbon and biogenic silica prepared from rice husks [32]. In the present work, Ni-decorated ordered mesoporous carbons (Ni/OMCs) prepared by a simple and green one-pot synthesis are used to study the photodegradation of RhB. In this sense, OMCs are well known for their uniform mesoporosity, high surface area, and large pore volume, which makes them suitable for the separation of large organic molecules though a fast mass transfer process to the active surface sites [11,33,34,35,36]. Accordingly, the one-pot evaporation-induced self-assembly (EISA) method is employed for the synthesis of the OMCs, where sustainable chestnut wood tannins are used as a carbon precursor and nickel ions are utilized as a crosslinker between the micelle composites of the tannins and a nontoxic triblock copolymer surfactant, Pluronic® F-127, followed by thermal curing and in situ carbothermal reduction [11,37]. Such materials are expected to be highly stable due to the space confinement effects of the carbon skeleton on the nickel particles, which is greatly advantageous over the commonly used methods of wet impregnation and co-precipitation that are known to suffer from lixiviation, complex operation procedures, and particle agglomeration [37]. Furthermore, some previous studies on Ni-doped OMCs prepared by the EISA technique have shown successful application in the quantitative hydrogenation of furfural to furfuryl alcohol [37] and the photodegradation of methylene blue [11]. Accordingly, the primary objective of this study is to investigate how the nickel content, pyrolysis method (one-step vs. two-step pyrolysis), and pyrolysis temperature influence the photocatalytic activity of the materials under UV irradiation.

2. Results and Discussion

2.1. Characterization of Catalysts

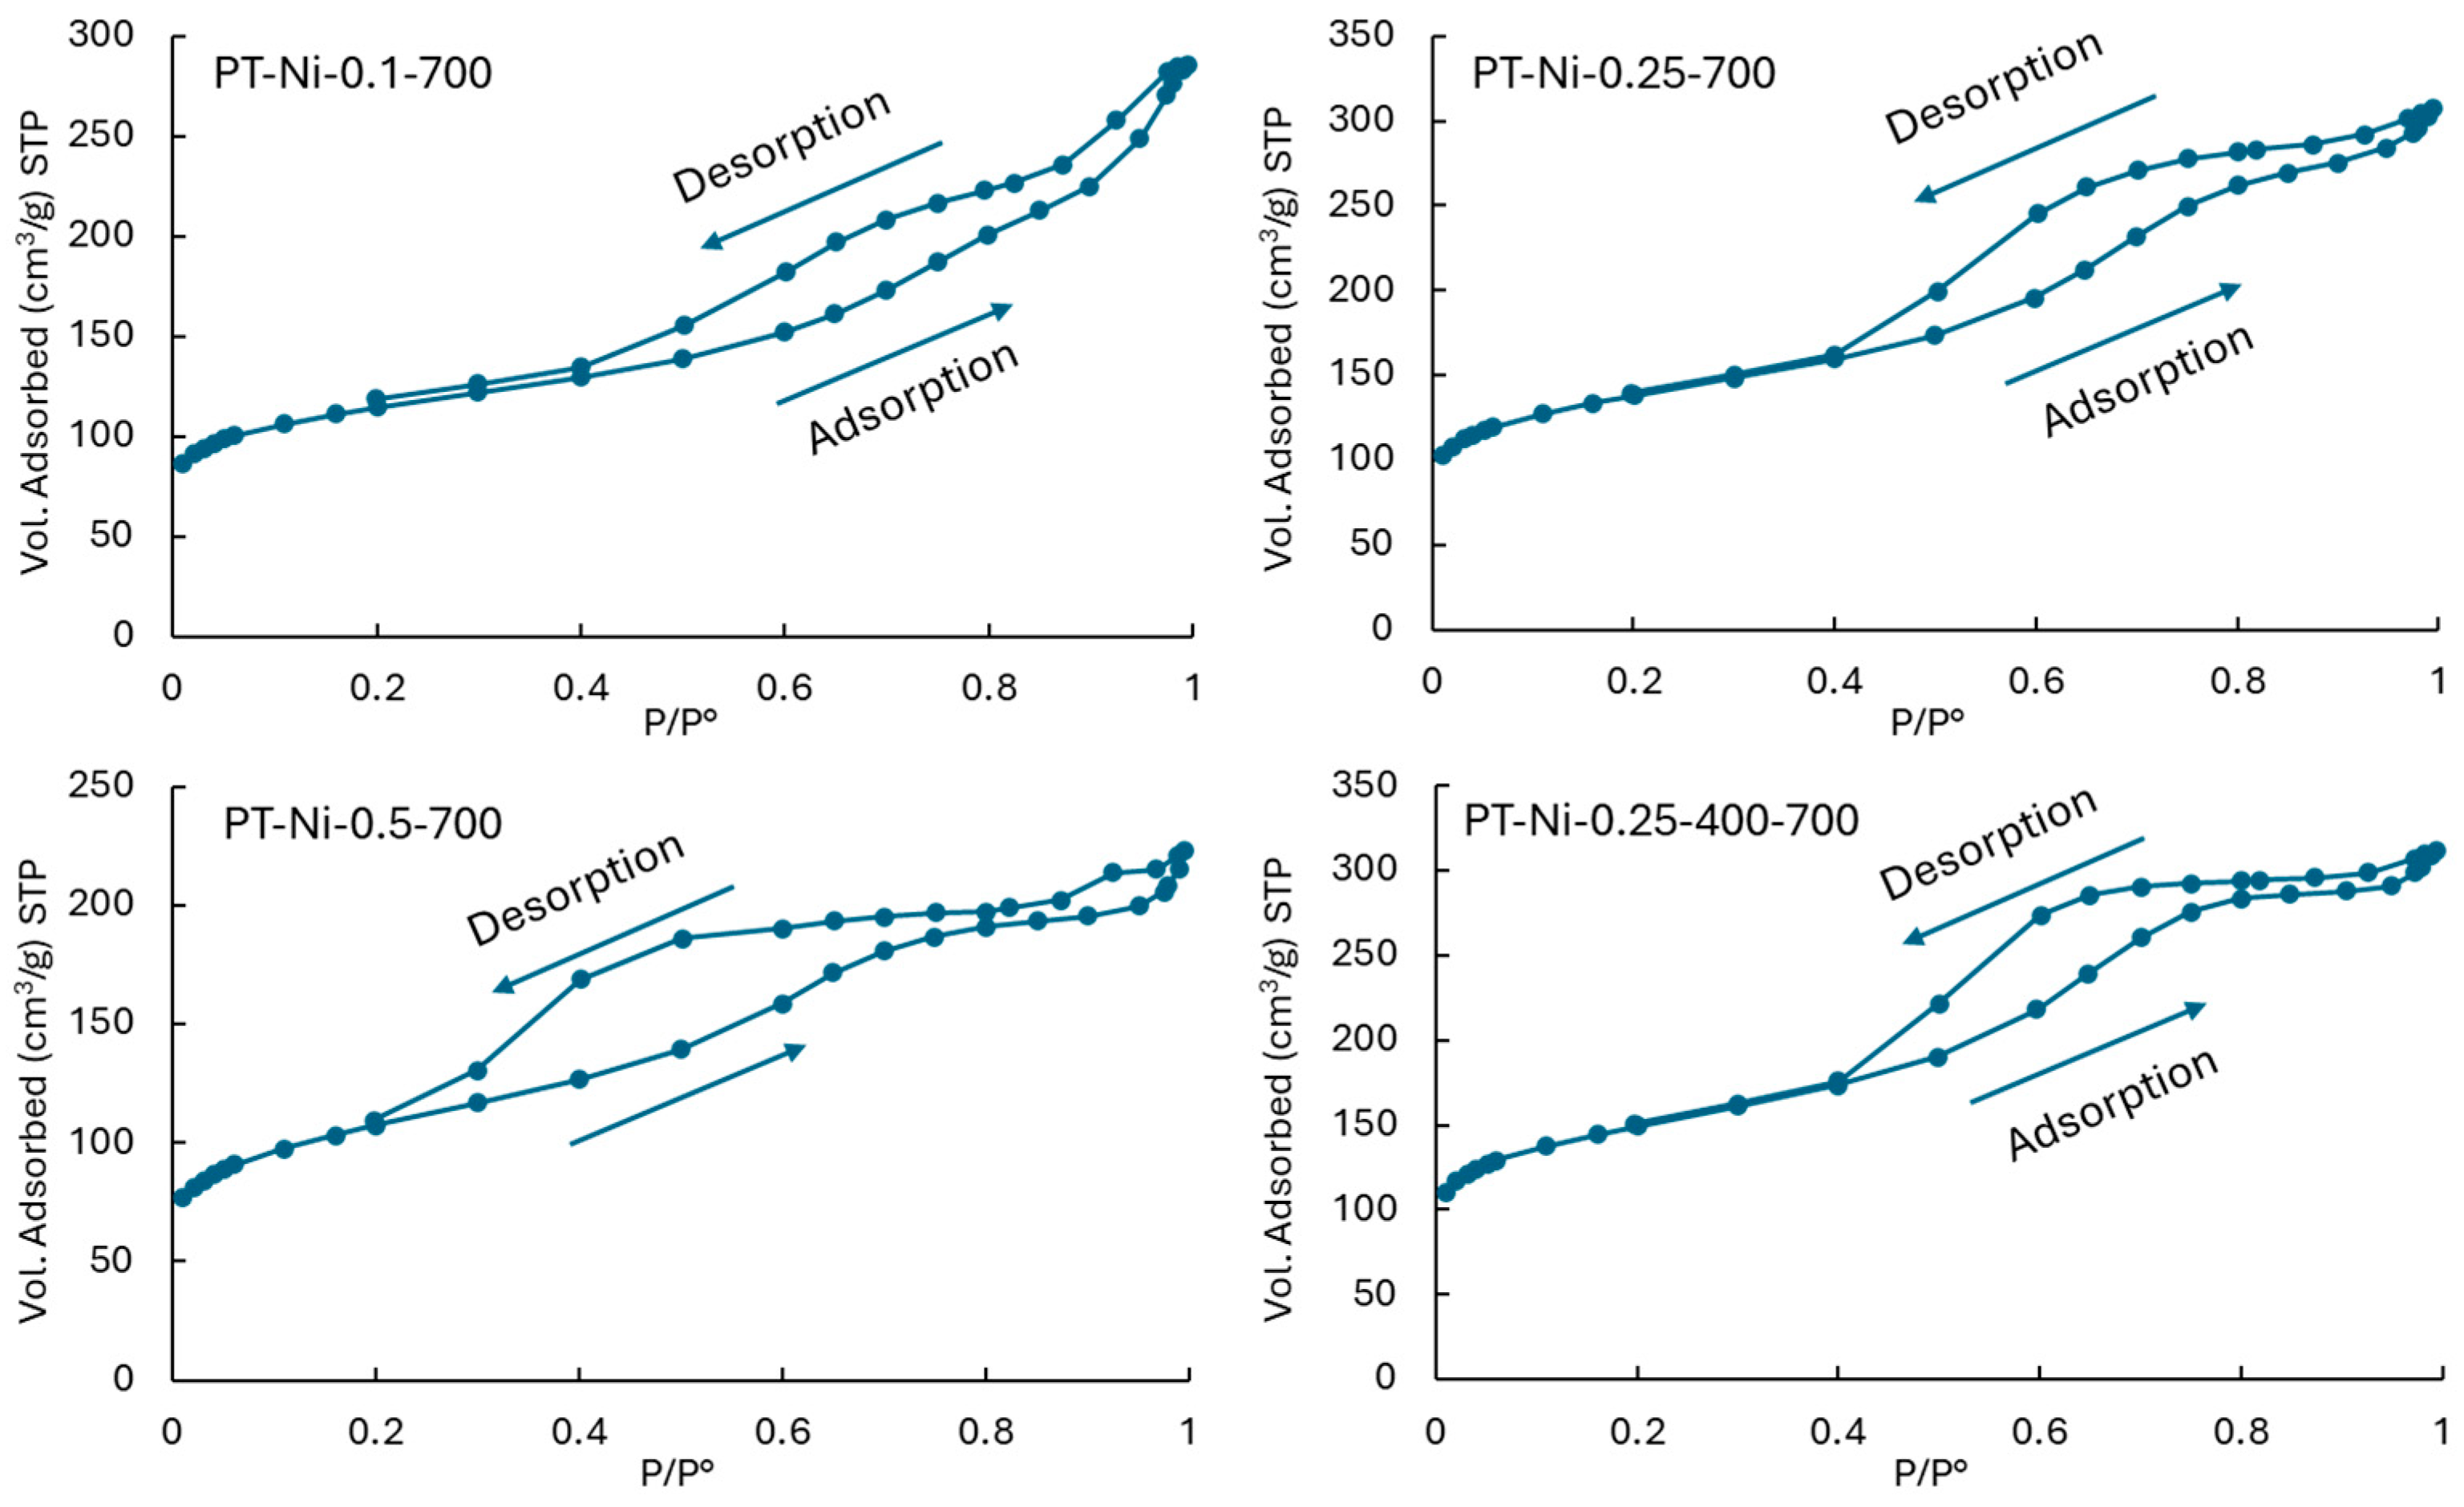
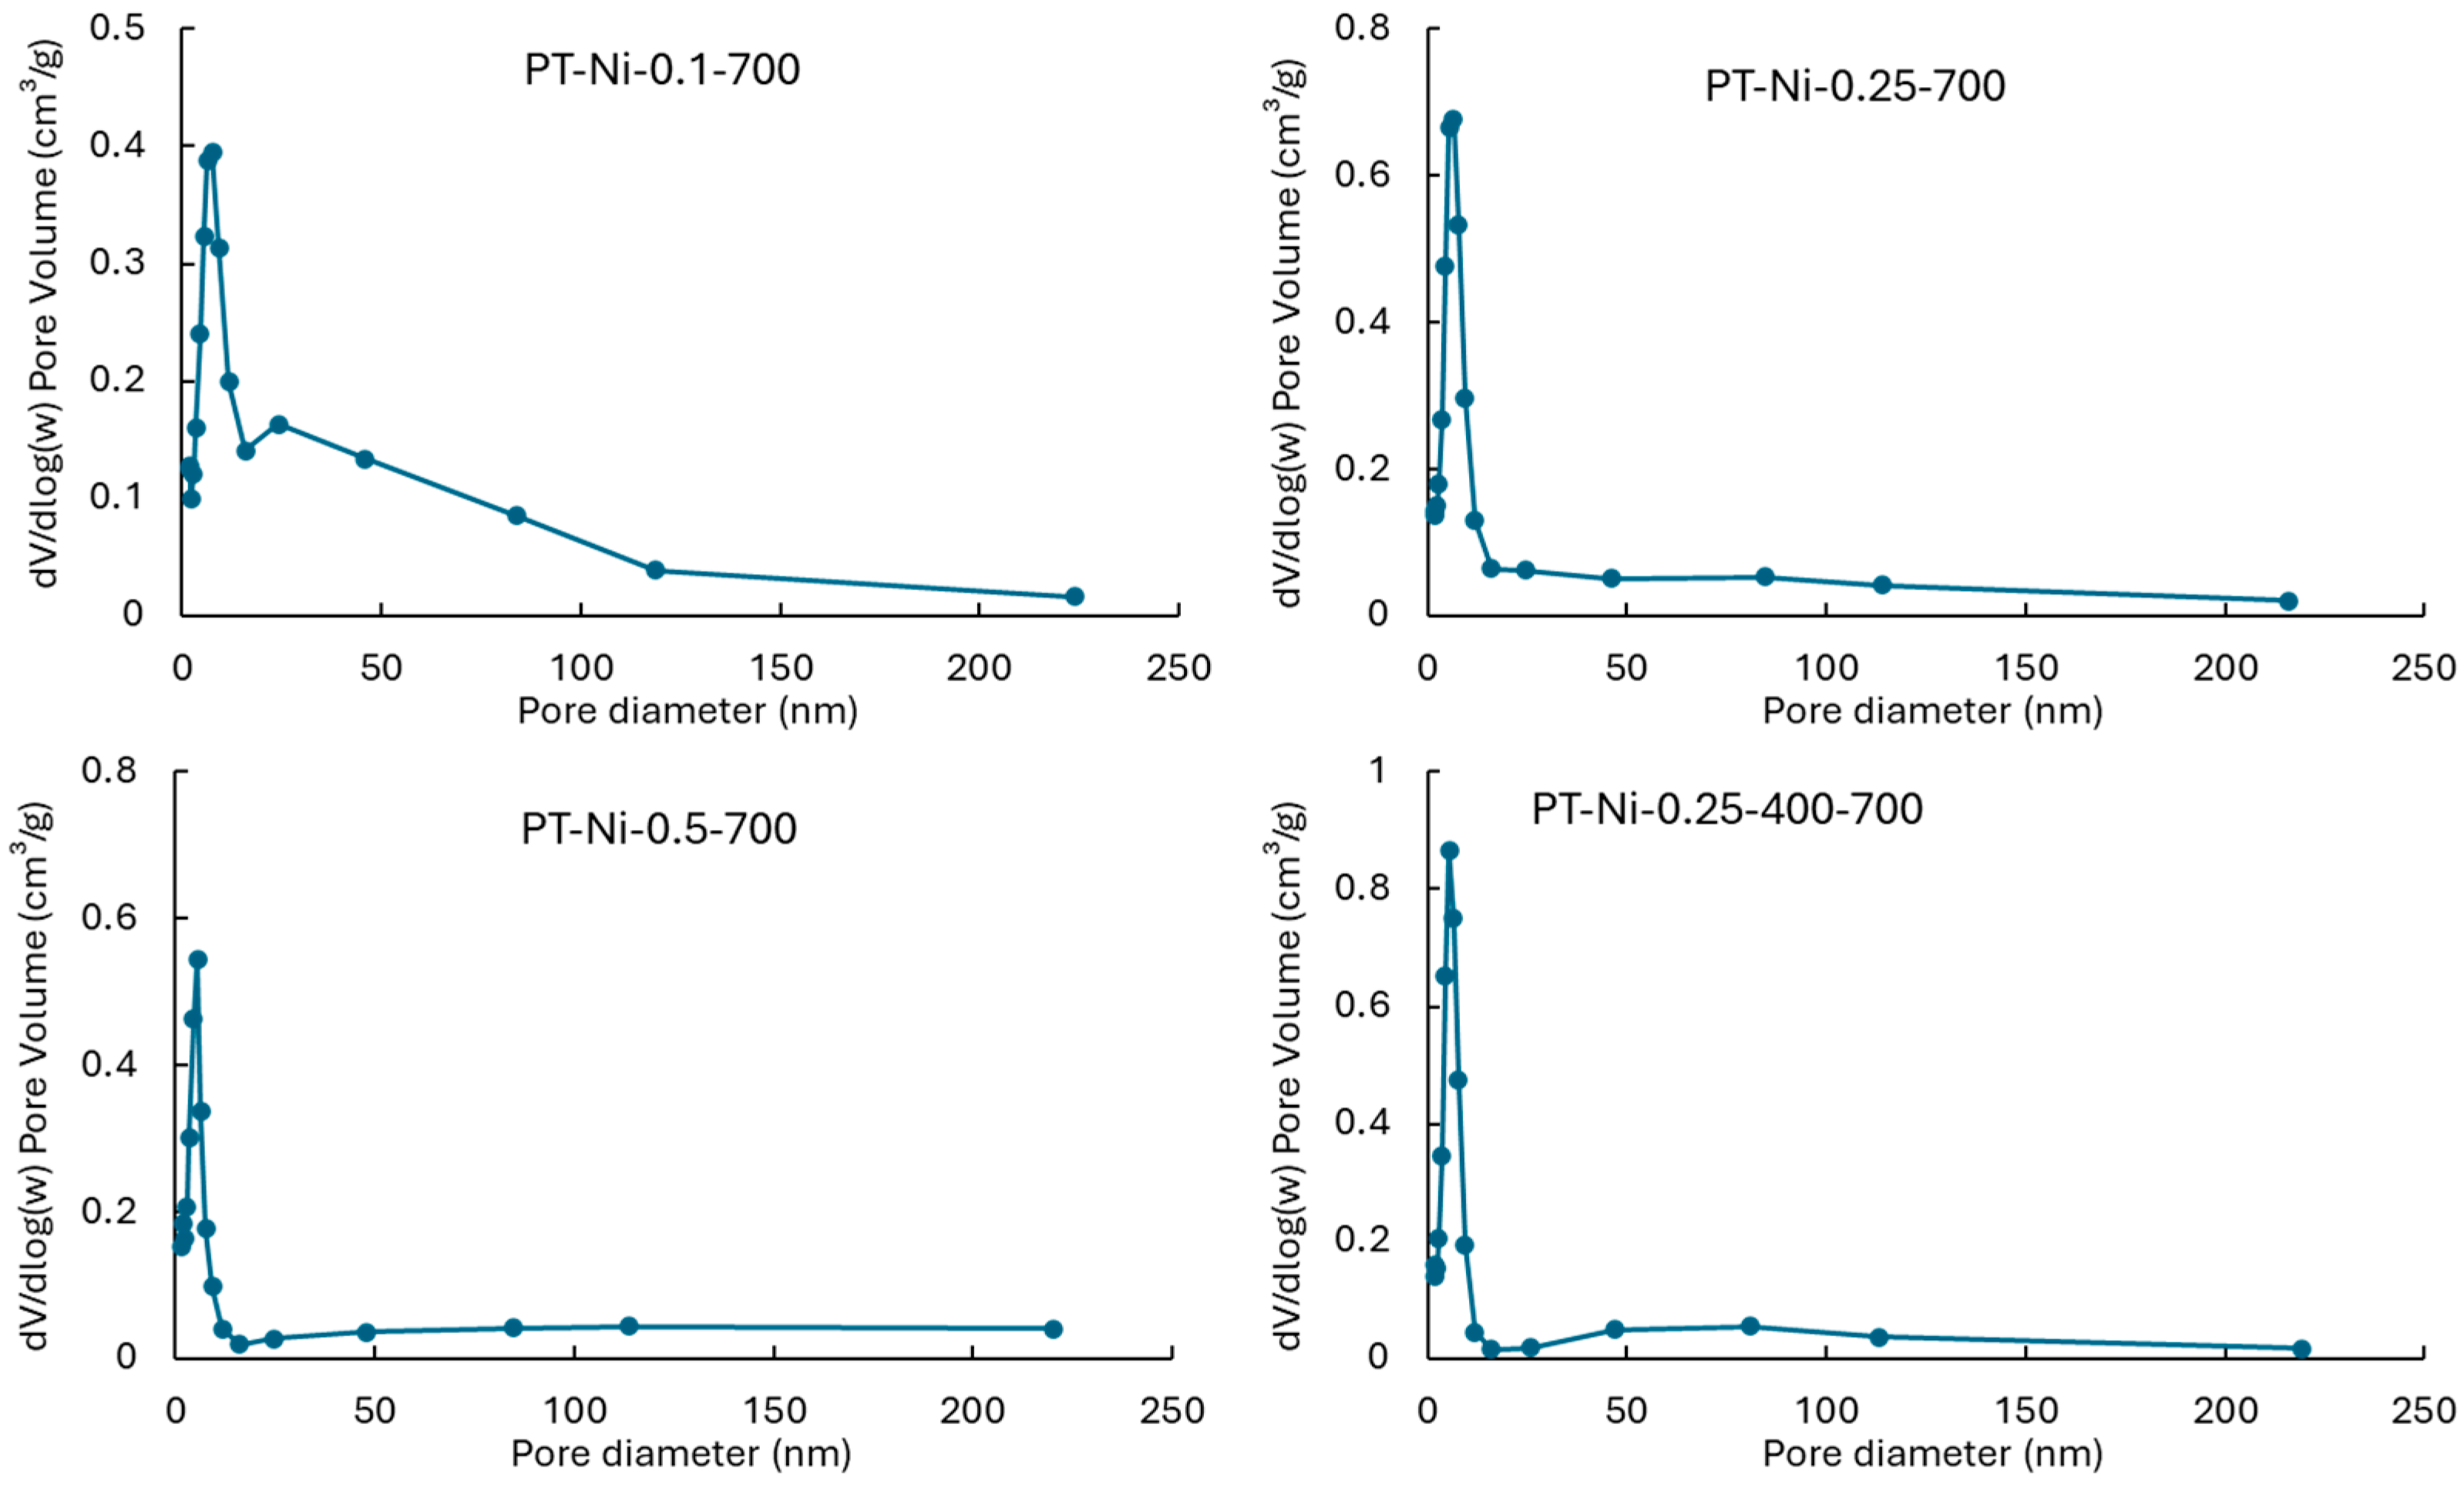
2.1.1. Textural and Porosimetry Properties

As a representative comparison of the catalysts, Figure 1 shows the adsorption/desorption isotherms of N2 at −196 °C for the samples prepared at 700 °C as a function of the Ni content and the type of synthesis (one- or two-step pyrolysis). According to the IUPAC classification [38], the N2 adsorption/desorption isotherms are of type IV, characteristic of materials with microporous and mesoporous frameworks. All of the catalysts showed a H4-type hysteresis loop in the desorption branch.
The pronounced hysteresis loop over a large relative pressure range indicates the occurrence of a wide distribution of mesopore sizes, which agrees with the expected structure for the OMCs. This fact is more pronounced for the sample with the highest Ni content (PT-Ni-0.5-700), where the desorption branch extends to lower relative pressures of ca. 0.2. Thus, it can be suggested that a higher metal content promotes pore blocking/percolation effects [39]. Figure 2 shows the pore size distributions (PDSs) for the same series of catalysts, while Table 1 shows a summary of the textural and porosimetry properties for all of the catalysts in the present work. The most significant contribution of pores in all of the samples lies within the mesopore range, particularly in the small mesopores (2–15 nm). However, for the sample with the lowest Ni content (PT-Ni-0-1-700), the PSD broadens and exhibits a bimodal pattern, suggesting a substantial presence of large mesopores and even macropores. It can be concluded that the present carbocatalysts exhibit an ordered distribution of mesopores. As shown in Table 1 for the series prepared at 700 °C, the specific surface area initially increases with a higher nickel content but subsequently decreases as the metal content continues to rise. In addition, it can be seen from Table 1 that the SBET of PT-Ni-0.25 series increased with the temperature from 600 to 700 °C, then decreased at 800 °C, and then increased again at 900 °C. These apparent contradictory results emphasize the noticeable impact of a high metal content on the reduction in the catalyst porosity, specifically the mesoporosity, as seen in the PSDs of these samples (Figure 2).
Thus, from PT-Ni-0.25-700 to PT-Ni-0.5-700, the volume of mesopores decreased by ca. 29%, while the volume of micropores increased by ca. 17%, suggesting that the metallic component is preferentially located in the small mesopores, contributing to the significant decrease in their average pore diameter. Moreover, a higher nickel content can lead to the formation of larger nickel agglomerates that further obstruct the pores. Furthermore, notable features can be observed in the other series of catalysts as well. A common trend in the series of samples prepared at different temperatures is that, as the pyrolysis temperature increases, the specific surface area (SBET) monotonically decreases. Thus, for the PT-Ni-0.25 series, the SBET shows a slight increase as the temperature rises from 600 °C to 700 °C, followed by a pronounced decrease when the samples are pyrolyzed at 800 °C and 900 °C. Similar results are observed for the PT-Ni-0.5 series, except that, here, the SBET consistently decreases as the temperature rises. As for the series of samples obtained through two-step pyrolysis, the maximum SBET value of 540 m2·g−1 is attained at a second-step pyrolysis temperature of 700 °C. As expected, these results suggest that the pore framework is highly dependent on the number of pyrolytic steps and the final temperature. As indicated by the porosimetry data in Table 1, the decrease in the specific surface area with an increasing temperature is a result of the reduction in the microporosity and some small mesoporosity. This can be inferred from the comparison of the Vmicro/Vtot ratios, where the PT-Ni-0.25 series shows a decrease from 4.2% micropores to 2.7% micropores as the temperature increases from 600 °C to 900 °C.
It is likely that, at higher temperatures, the agglomeration and sintering of nickel nanoparticles takes place, blocking the micropores and reducing their volume. Additionally, elevated temperatures may lead to the collapse of micropores or their merging into larger pores. The latter is further supported by the increase in the relative mesoporosity (Vmeso/Vtot) of the PT-Ni-0.25 series as the temperature rises from 600 °C to 900 °C. Similar trends are observed for the PT-Ni-0.5 series and the two-step pyrolysis series; however, the changes in relative micro- and mesoporosity are less pronounced. For the Ni-0.5 series, it is likely that the higher nickel content leads to the better dispersion of nickel particles throughout the carbon matrix, enhancing the stabilizing effect of nickel on the carbon structure and thereby preventing pore collapse. As for the samples obtained via the two-step pyrolysis process, it is possible that the first lower-temperature step likely stabilizes the carbon structure and minimizes the extent of pore collapse.

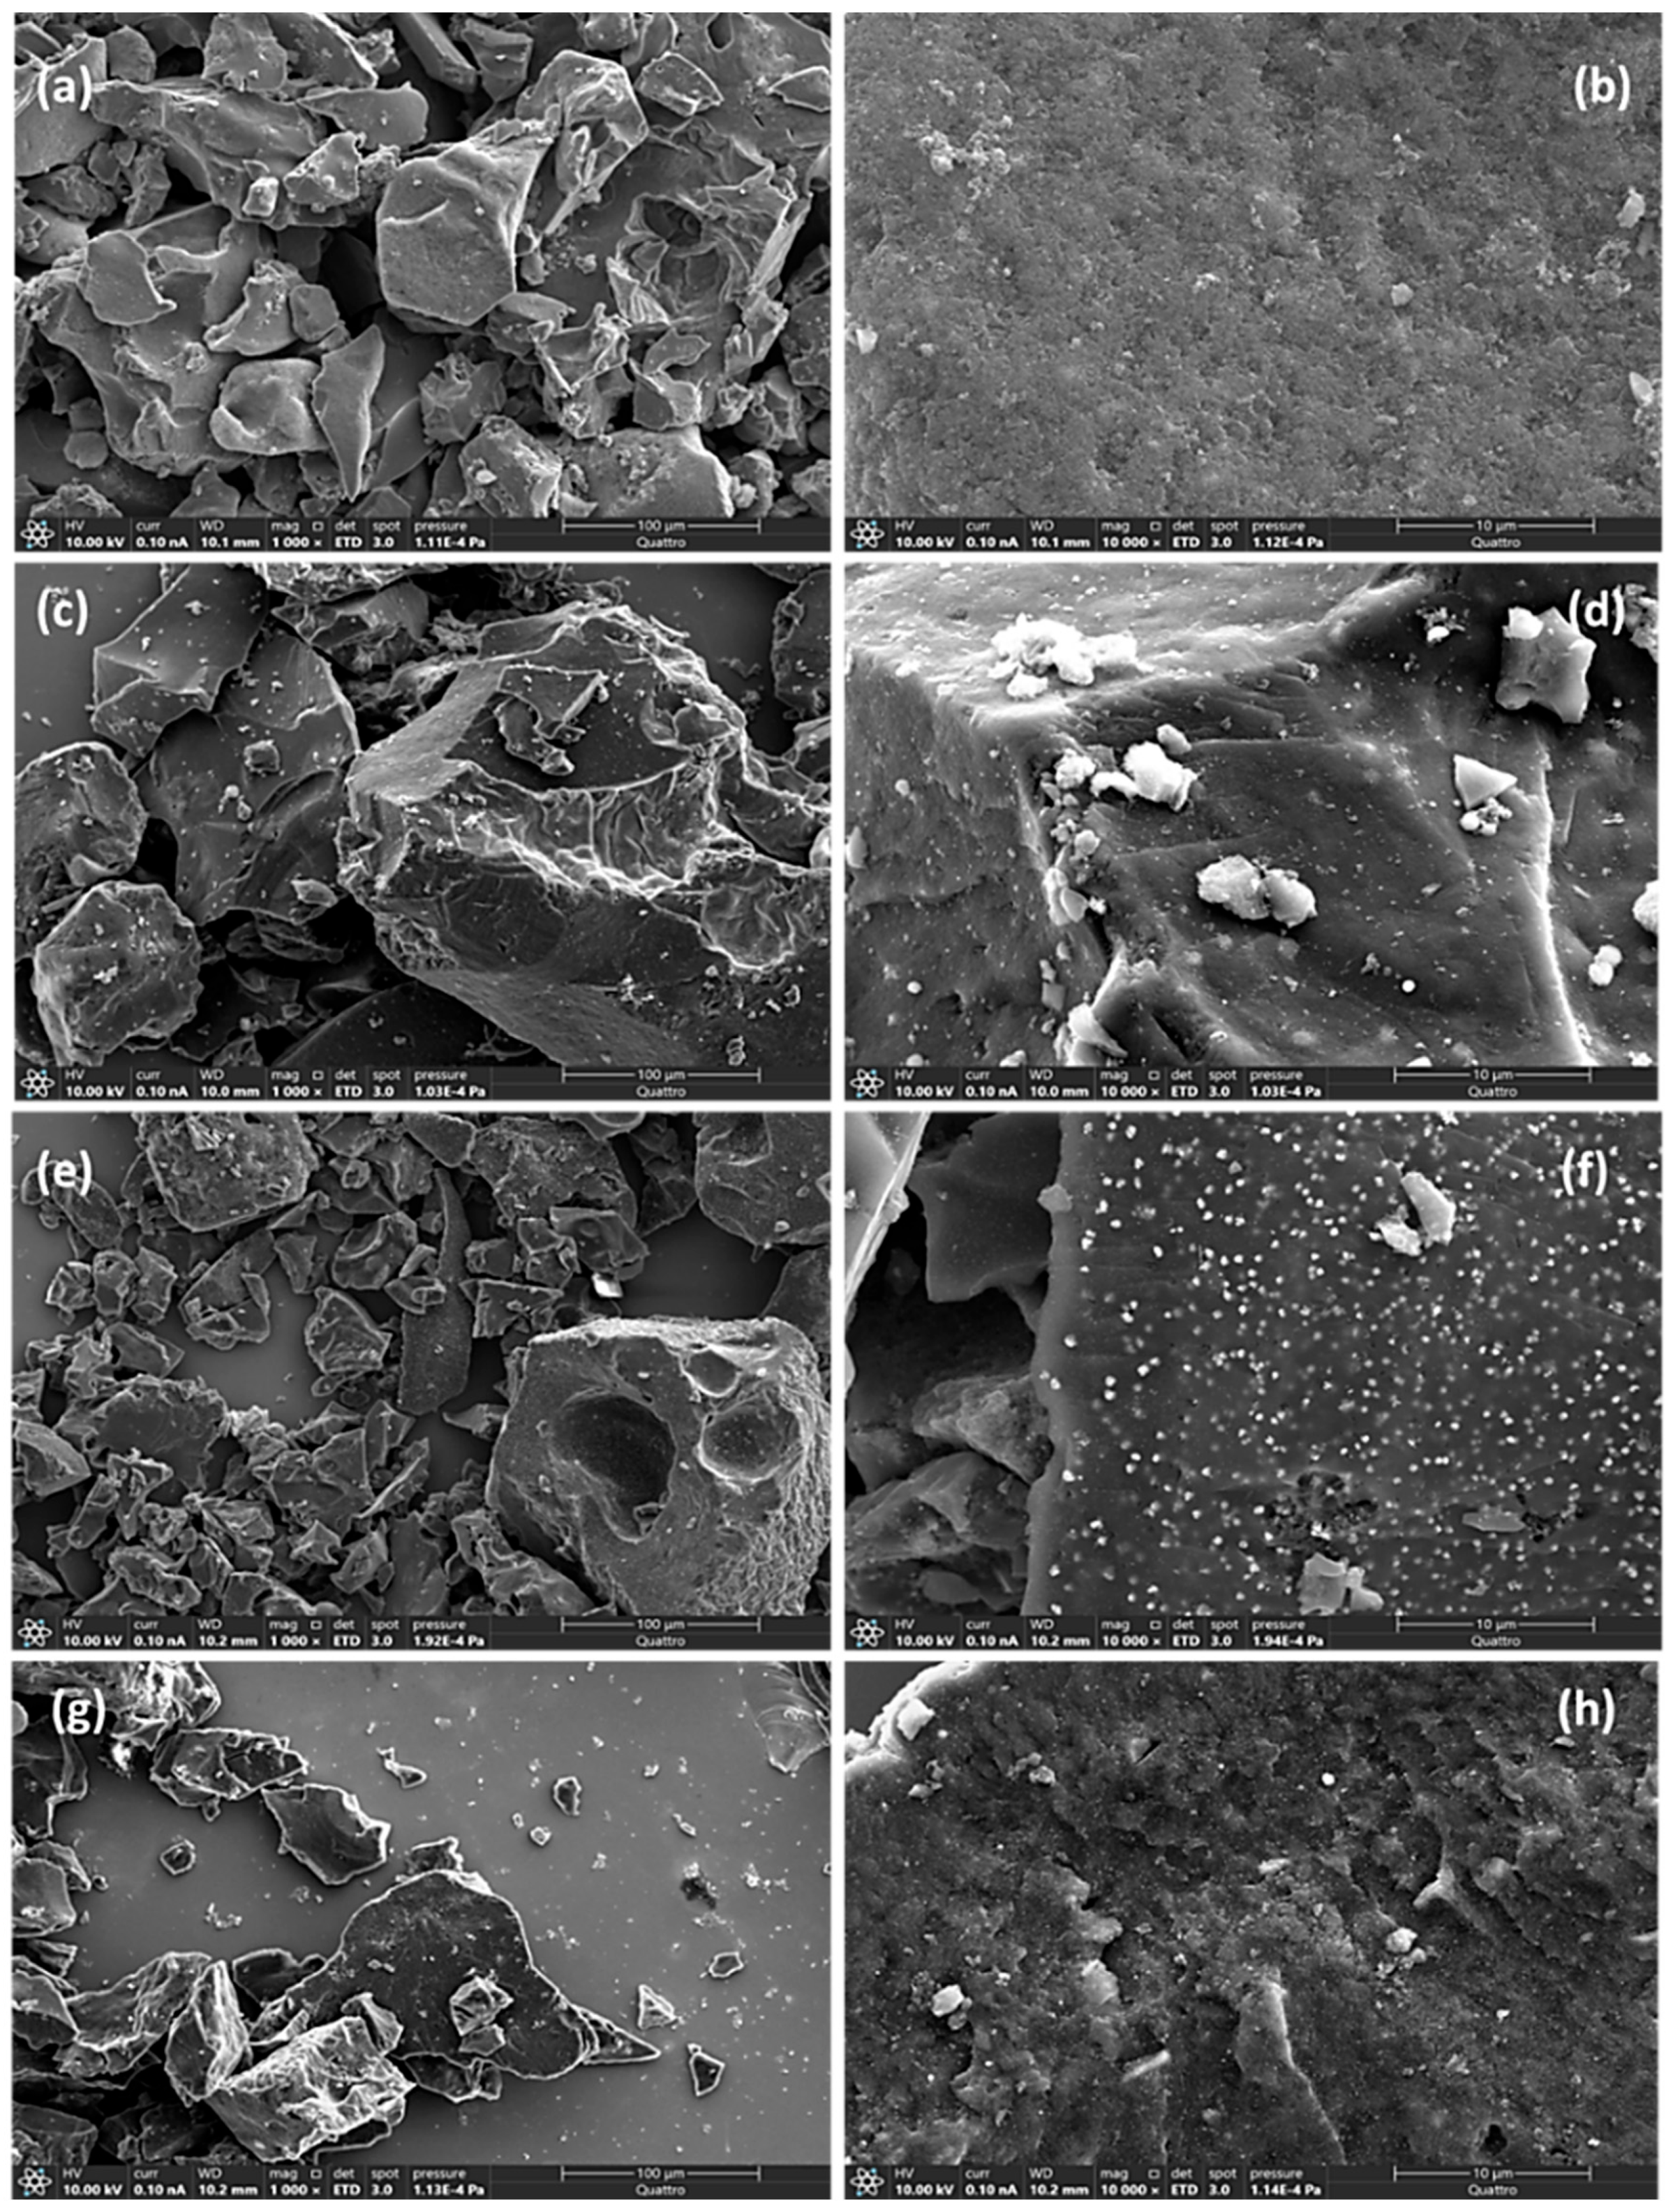
2.1.2. Morphology and Composition

Figure 3 presents a set of SEM images of samples prepared at 700 °C, illustrating the effects of the Ni content and synthesis method (one or two pyrolysis steps) at magnifications of 1.000× and 10.000×. Figures S1–S4 in the Supplementary Materials show higher-magnification images (50.000×) and the EDS composition analysis of selected areas and spots. It can be observed that the catalysts consist of grains in the form of micrometric-sized flakes, where the brighter crystallites correspond to Ni particles with sizes within 150–250 nm. The EDS analysis of the brighter dots reveals a higher nickel content, thus confirming this fact. Also, the images reveal a higher degree of particle agglomeration with the increase in the nickel content. In addition, when selecting the samples pyrolyzed at 700 °C for a more detailed analysis, interesting results are achieved. For instance, the sample PT-Ni-0.1-700 showed an average particle size of 38 nm, and fewer large aggregates were observed.
However, when the nickel content increases, it is seen that the samples present a bimodal distribution. For example, the PT-Ni-0.25-700 catalyst shows average particle sizes of 49 nm and some 110 nm aggregates, while, for the PT-Ni-0.5-700 catalyst, a mean particle size of 58 nm and many 329 nm aggregates were observed. In other words, as the nickel content increases, the nanoparticles clearly increase in size, and the presence of nanoaggregates also increase as a consequence of an important sintering effect during pyrolysis. Finally, and contrary to what was expected, the sample subjected to two pyrolysis steps, PT-Ni-0.25-400-700, showed a particle average size of 34 nm and aggregates larger than 82 nm, suggesting that the preliminary pyrolysis step seems to stabilize the material, thus inhibiting the sintering effect and, therefore, yielding particles with lower sizes than PT-Ni-0.25-700 (with average particle sizes of 49 nm and 110 nm aggregates). In a previous paper [11], a high-resolution TEM analysis was conducted for PT-Ni-0.5-400-900 catalysts, and a highly ordered mesoporous structure sample was clearly observed for this sample.
Table 2 provides a summary of the composition results obtained from the SEM-EDS analysis for all of the catalysts studied. Interestingly, the average atomic percent of Ni consistently increases with the temperature within each sample series, suggesting that the sintering or grain growth of Ni-based particles leads to larger, denser particles, and an increased concentration of nickel atoms in localized regions of the samples. These results are in good agreement with the decreasing trend observed in the BET surface area and relative microporosity (Table 1). Moreover, as shown in Table 2, the atomic percent of nitrogen in all of the samples remains relatively unaffected by the pyrolysis temperature, indicating the greater stability of the N-based functionalities. Conversely, as the pyrolysis temperature increases, the atomic percent of oxygen decreases, which may also contribute to the higher atomic percent of nickel observed at elevated pyrolysis temperatures.

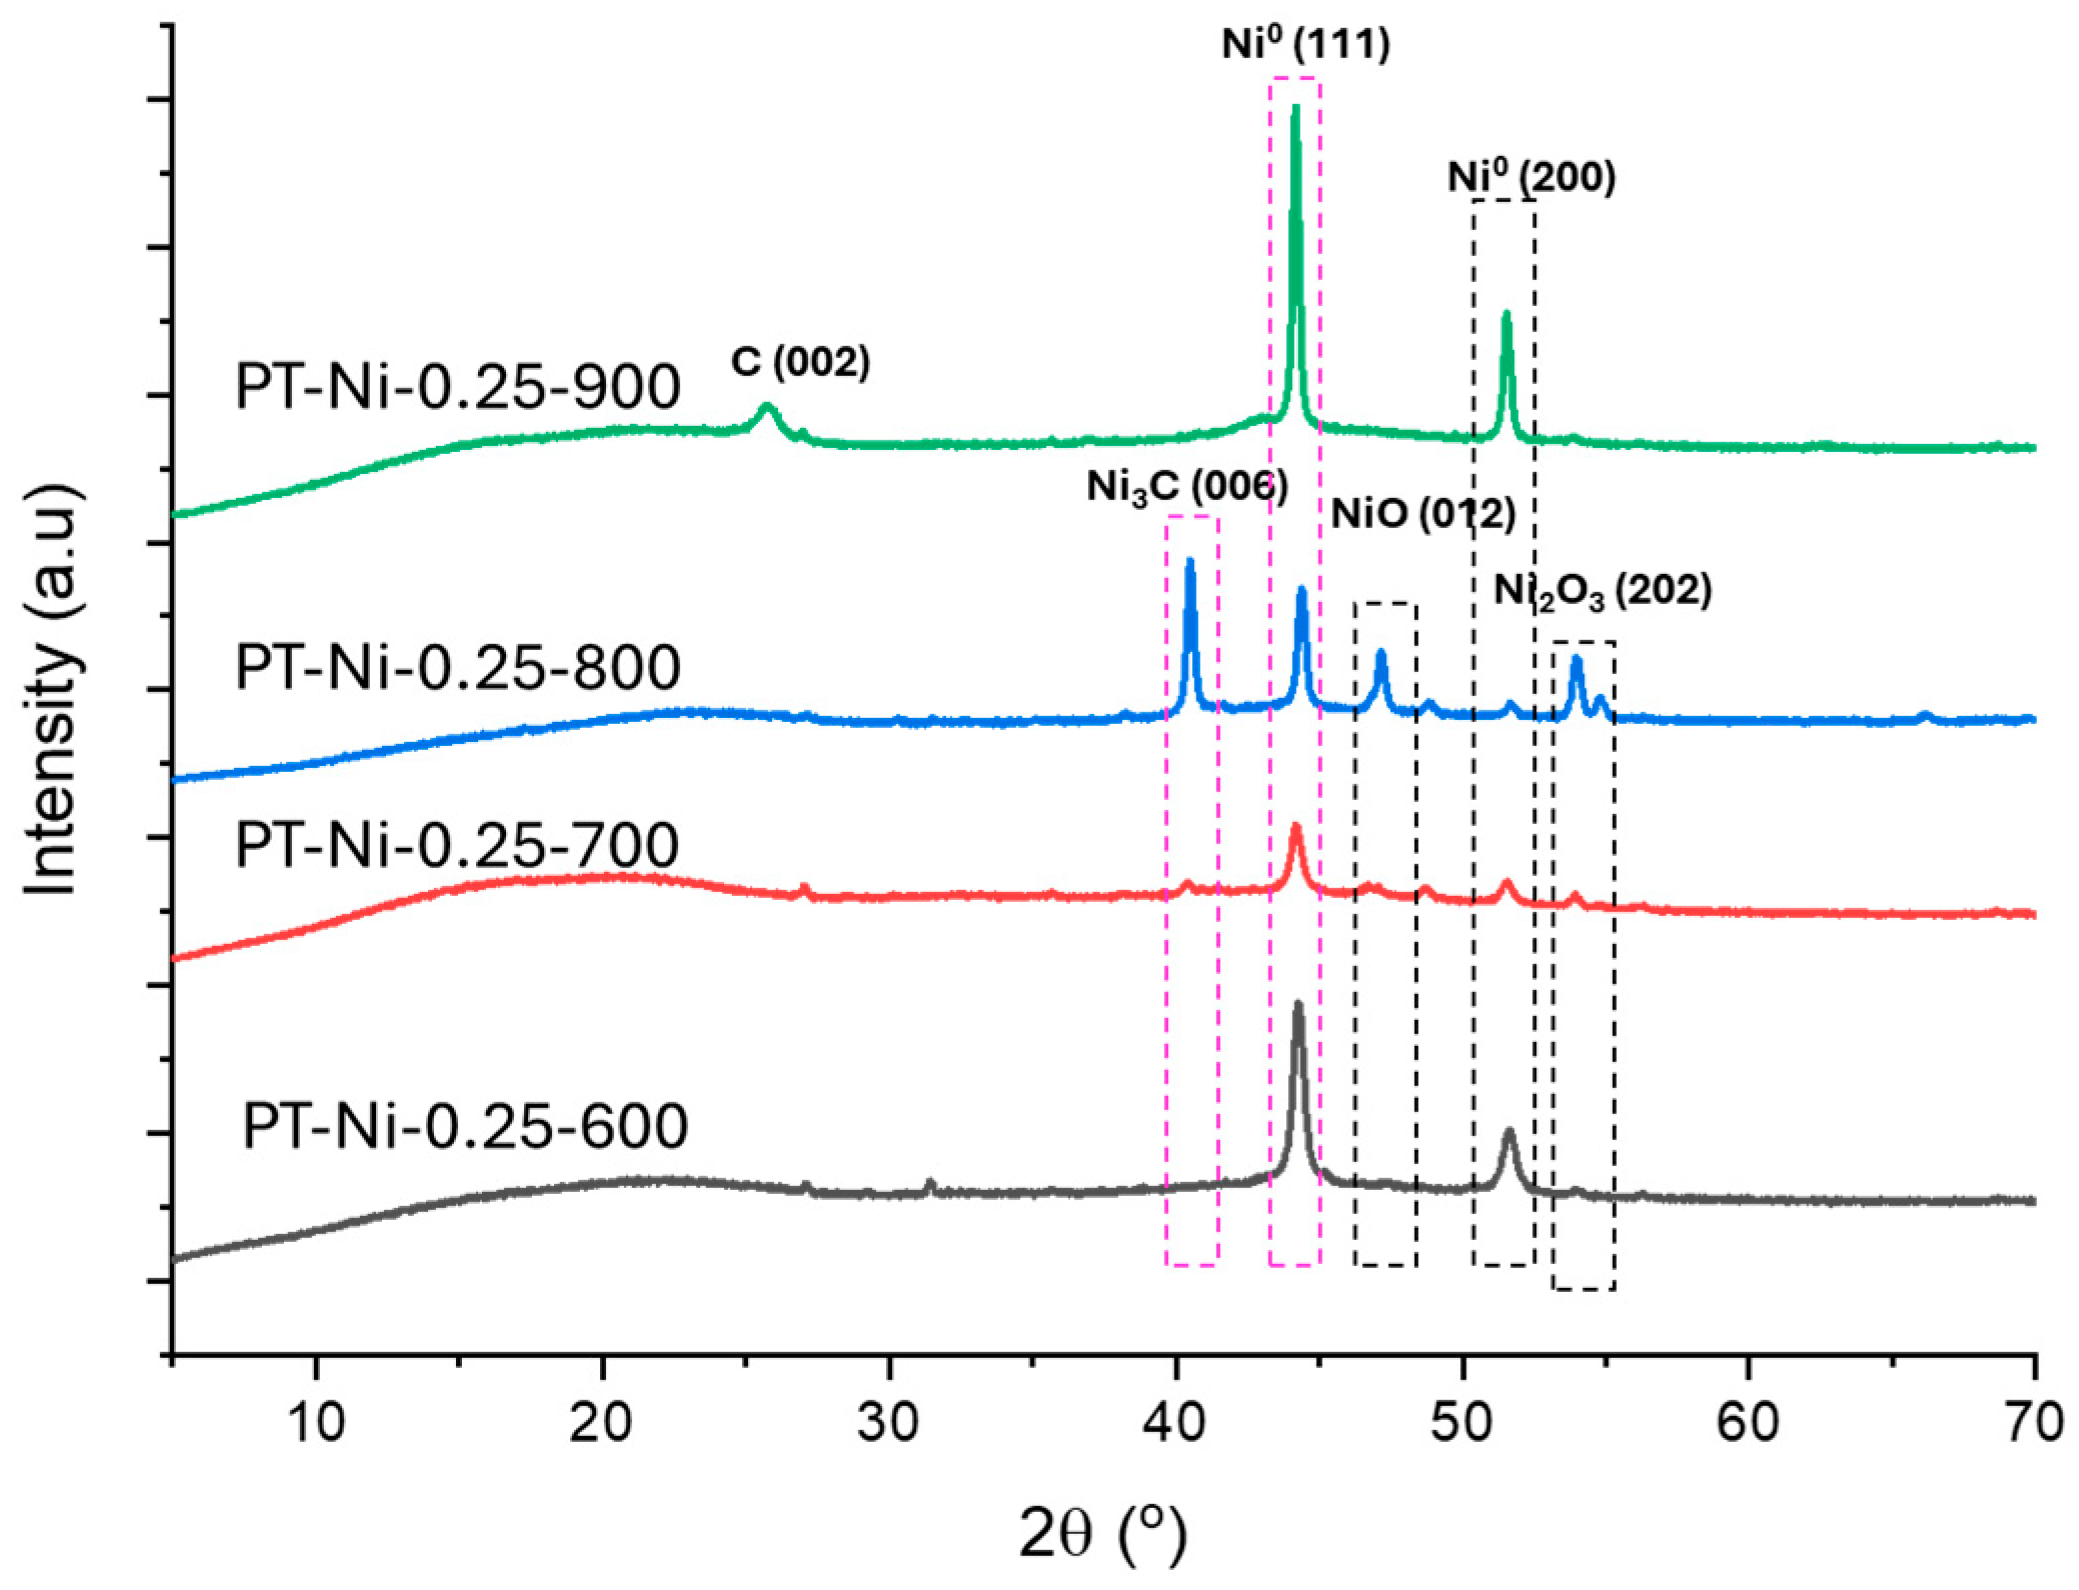
2.1.3. Structural Characterization

The change in the Ni-based crystalline phases as a function of the pyrolysis temperature was verified. Figure 4 shows the XRD patterns for the PT-Ni-0.25 series, while Figure S5 (Supplementary Materials) shows the XRD patterns for all of the catalysts series. Figure 4 shows a broad peak at ca. 24.0°, corresponding to the (002) plane of amorphous carbon [40] with a hexagonal phase (JCPDS, 41-1487), and an important peak at ca. 44.5°, attributed to Ni0 crystallites (111) [41].
Other representative peaks include one at ca. 47.3° [41], corresponding to the (012) plane of the NiO phase, and the one at ca. 54°, associated with the (202) plane of the unstable Ni2O3 [42]. The latter is observed only in the PT-Ni-0.25-800 sample but evolves into elemental Ni as the temperature increases to 900 °C (Figure 4). Another peak, which becomes more intense with an increasing temperature, is observed at 2θ ca. 52.5°. It is attributed to the (200) plane phase (JCPDS 04-0850) and confirms the formation of elemental Ni0 crystallites [41]. It is important to highlight the formation of the Ni3C (006) plane phase [43] in the PT-Ni-0.25-800 sample as the pyrolysis temperature increases to 700 °C and 800 °C. In summary, the XRD patterns in Figure 4 suggest that, as the temperature increases, nickel oxide phases (NiO and Ni2O3) first evolve into a mixture of elemental Ni0 crystallites and Ni3C phases, ultimately leading to the formation of only elemental Ni0 crystallites when the pyrolysis temperature reaches 900 °C. The formation of nickel carbide phases is attributed [44] to the strong interaction between NiO and the carbon support during thermal treatment under an inert atmosphere and is similarly observed in the PT-Ni-0.25 series prepared by two-step pyrolysis (Figure S5, Supplementary Materials).

2.2. Adsorption and Photodegradation of RhB

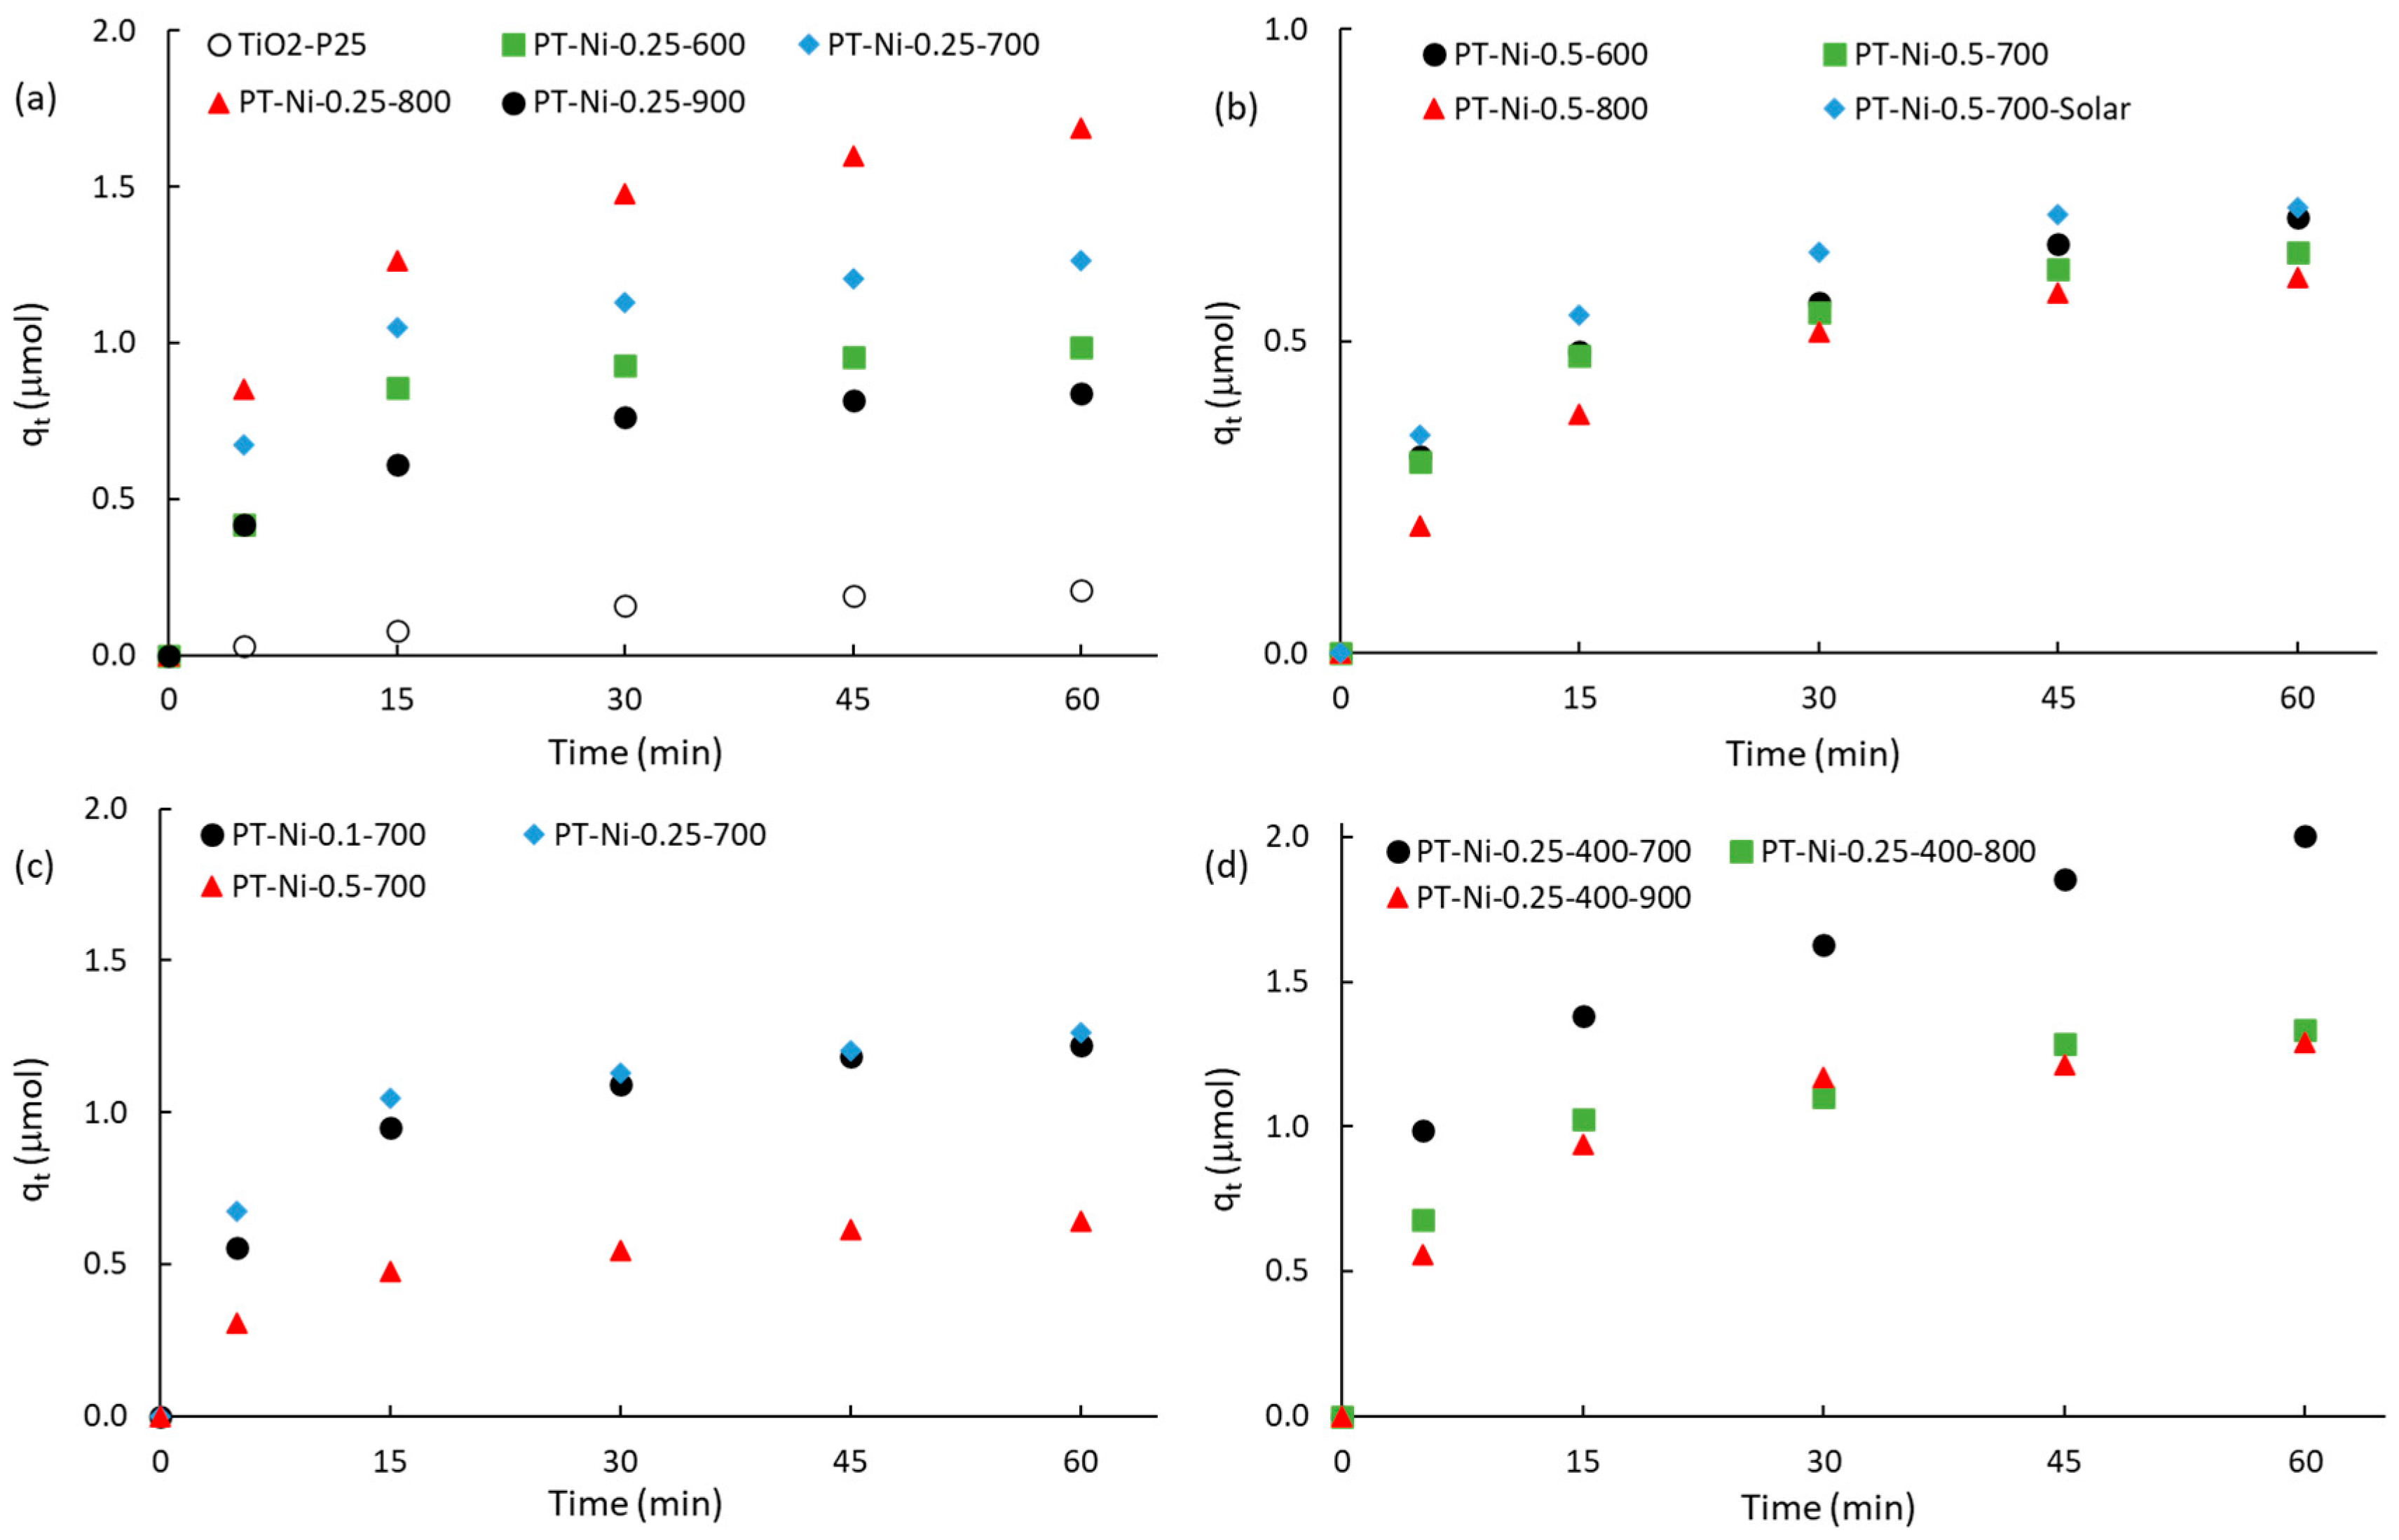
2.2.1. Kinetics of RhB Adsorption in the Dark

Figure 5 shows the kinetics of RhB adsorbed in the dark (qt) on the catalysts suspended within the immersion photoreactor. The influence of temperature (T) at constant Ni weight ratios of 0.25 and 0.5 are shown in Figure 5a,b, respectively. For the sake of comparison, Figure 5a contains the adsorption on TiO2-P25 and Figure 5b contains the adsorption on a batch reactor (PT-Ni-0.5-700-solar) used for the degradation test under artificial solar irradiation. The impact of the weight ratio at a constant temperature and the effect of the two-step pyrolysis were also examined, with the results presented in Figure 5c,d, respectively.
For the PT-Ni-0.25 series, Figure 5a illustrates that, after 60 min under equilibrium conditions, the RhB adsorption steadily increased from 0.986 mmol to 1.690 mmol when the pyrolysis temperature changed from 600 °C to 800 °C. The increase in adsorption over this temperature range is remarkable considering the decrease in the specific surface area (Table 1). This can likely be attributed to the formation of small Ni-based crystallites within the mesopore carbon framework, which provide additional adsorption sites and that remain unaffected by sintering. However, despite an increase in SBET as the temperature was raised from 800 °C to 900 °C, the RhB adsorption significantly decreased to 0.841 mmol. This decrease is most likely due to substantial sintering of elemental Ni0 crystallites, as suggested by the highest Ni content observed in the SEM-EDS analysis (Table 2) of PT-Ni-0.25-900, along with its reduced relative microporosity and increased average pore diameter (Table 1). In contrast, for the PT-Ni-0.5 catalyst series, Figure 5b shows that, after 60 min, the RhB adsorption is considerably lower than that of the PT-Ni-0.25 series, which is consistent with the sizably lower SBET values of the former (Table 1). This contrasting behavior suggests that increasing the Ni content makes the catalysts more susceptible to sintering, which affects both their textural properties and, consequently, their ability to adsorb RhB. This suggestion is further supported by the trend observed in Figure 5c, where the amount of RhB adsorbed after 60 min is nearly identical at 1.222 mmol and 1.264 mmol for the PT-Ni-0.1-700 and PT-Ni-0.25-700, respectively, but notably lower at 0.642 mmol for the PT-Ni-0.5-700 sample. It also worth noting that the PT-Ni-0.5-700 sample shows a slight increase in RhB adsorption (0.713 mmol) when a batch open reactor is used for the solar degradation test compared to the immersion flask photoreactor (Figure 5b). This can be attributed to the better dispersibility of the catalyst in the open flask reactor as opposed to the more constricted immersion reactor. Figure 5d shows that, for the PT-Ni-0.25 series prepared by two-step pyrolysis, the increase in the second-step temperature from 700 to 900 °C negatively impacts the RhB adsorption, reducing it from 2.006 mmol to 1.290 mmol. This decline can be ascribed to the considerable sintering of Ni crystallites, as indicated by the increase in the Ni content observed in the SEM-EDS analysis (Table 2) and by the reduction in the relative microporosity (Table 1).
To better understand the RhB adsorption on catalysts in terms of the synthesis parameters, pseudo-first-order [45,46,47,48,49], pseudo-second-order [45,46], and intraparticle diffusion (IPD) [45,47,48,49] adsorption models were applied to kinetic data using Equation (1)–(3), respectively. In these equations, qt is the amount of RhB adsorbed (μmol) at time t (min) and qeq is the amount adsorbed (μmol) at the equilibrium condition, k1 is the pseudo-first-order rate constant (min−1), k2 is the pseudo-second-order rate constant (μmol−1.min−1), kIPD is the IPD rate constant (μmol·min−1/2), and CIPD is the IPD capacity constant (μmol) attributed to the extension of the boundary layer thickness.
log(qeq − qt) = log(qt) − (k1/2.303)·t
[1/(qeq − qt)] = (1/qeq) + k2·t
qt = CIPD + kIPD·t1/2
Table S1 (Supplementary Materials) shows a summary of the kinetic models used for the analysis of the RhB adsorption, and Figures S6–S11 (Supplementary Materials) show the plots of the kinetic models for the different catalysts. The values obtained for qeq, k1, k2, kIPD, and CIPD are summarized in Table 3.
For the PT-Ni-0.25 and PT-Ni-0.5 series of catalysts, increasing the pyrolysis temperature leads to higher linear regression factors for the pseudo-first-order rate-constant (R2k1), approaching a value close to unity for the PT-Ni-0.25-900 catalyst. For the catalysts prepared through a single pyrolysis step at elevated temperatures, it can be suggested that RhB adsorption is predominantly governed by a physisorption mechanism [47,48,49], indicating a weak interaction between the dye molecules and the reduced Ni-based phases, including Ni3C and elemental Ni0, previously identified by XRD. Conversely, at lower one-step pyrolysis temperatures of 600 °C and 700 °C, as well as for the entire series of two-step pyrolysis catalysts, the adsorption mechanism is likely a competitive combination of physisorption and chemisorption [45,46], as suggested by the lower pseudo-first-order regression factors. Interestingly, for the two-step pyrolysis catalyst prepared at 900 °C, the linear regression factors for both the pseudo-first-order (R2k1) and pseudo-second-order (R2k2) models are similar, inferring a balanced contribution from both physisorption and chemisorption.
In addition, it is important to emphasize that, for the PT-Ni-0.25 and PT-Ni-0.5 catalyst series, the rate constant according to the interparticle diffusion model (kIPD) generally increases as the pyrolysis temperature rises. Considering that the IPD phenomenon serves as a descriptor of the effective diffusivity of the solute within the particle [45,47,48,49], higher pyrolysis temperatures seem to facilitate the diffusion of RhB molecules within the catalyst’s structure, which may further be attributed to the formation of larger, more interconnected pores and the reduction in surface groups at elevated temperatures. However, the decrease in kIPD from 0.211 μmol·min−1/2 for the PT-Ni-0.25-800 catalyst to 0.171 μmol·min−1/2 for the PT-Ni-0.25-900 catalyst suggests that pyrolysis temperatures above 800 °C may hinder RhB diffusion within the porous framework of the catalyst, likely caused by the sintering of Ni-based crystallites, as previously highlighted in the textural and SEM analyses. A similar decline in kIPD is noted in the two-step pyrolysis catalyst series when the second pyrolysis temperature increases from 700 °C to 800 °C. Additionally, an analogous trend is observed for the CIPD values, which represents the boundary layer thickness constant. CIPD is a measure of the adsorbed molecules near the interface between the bulk of solution and the solid [47,48,49], serving as an indicator of the electrostatic affinity of RhB molecules for adsorption. The decrease in CIPD at higher temperatures further corroborates the reduced proximity of molecules to the catalyst surface, the diminished adsorption efficiency, and the weakened interaction between RhB molecules and the catalyst surface. This behavior is likely attributed to the inhibited diffusivity of RhB molecules from the bulk of the solution to the surface.

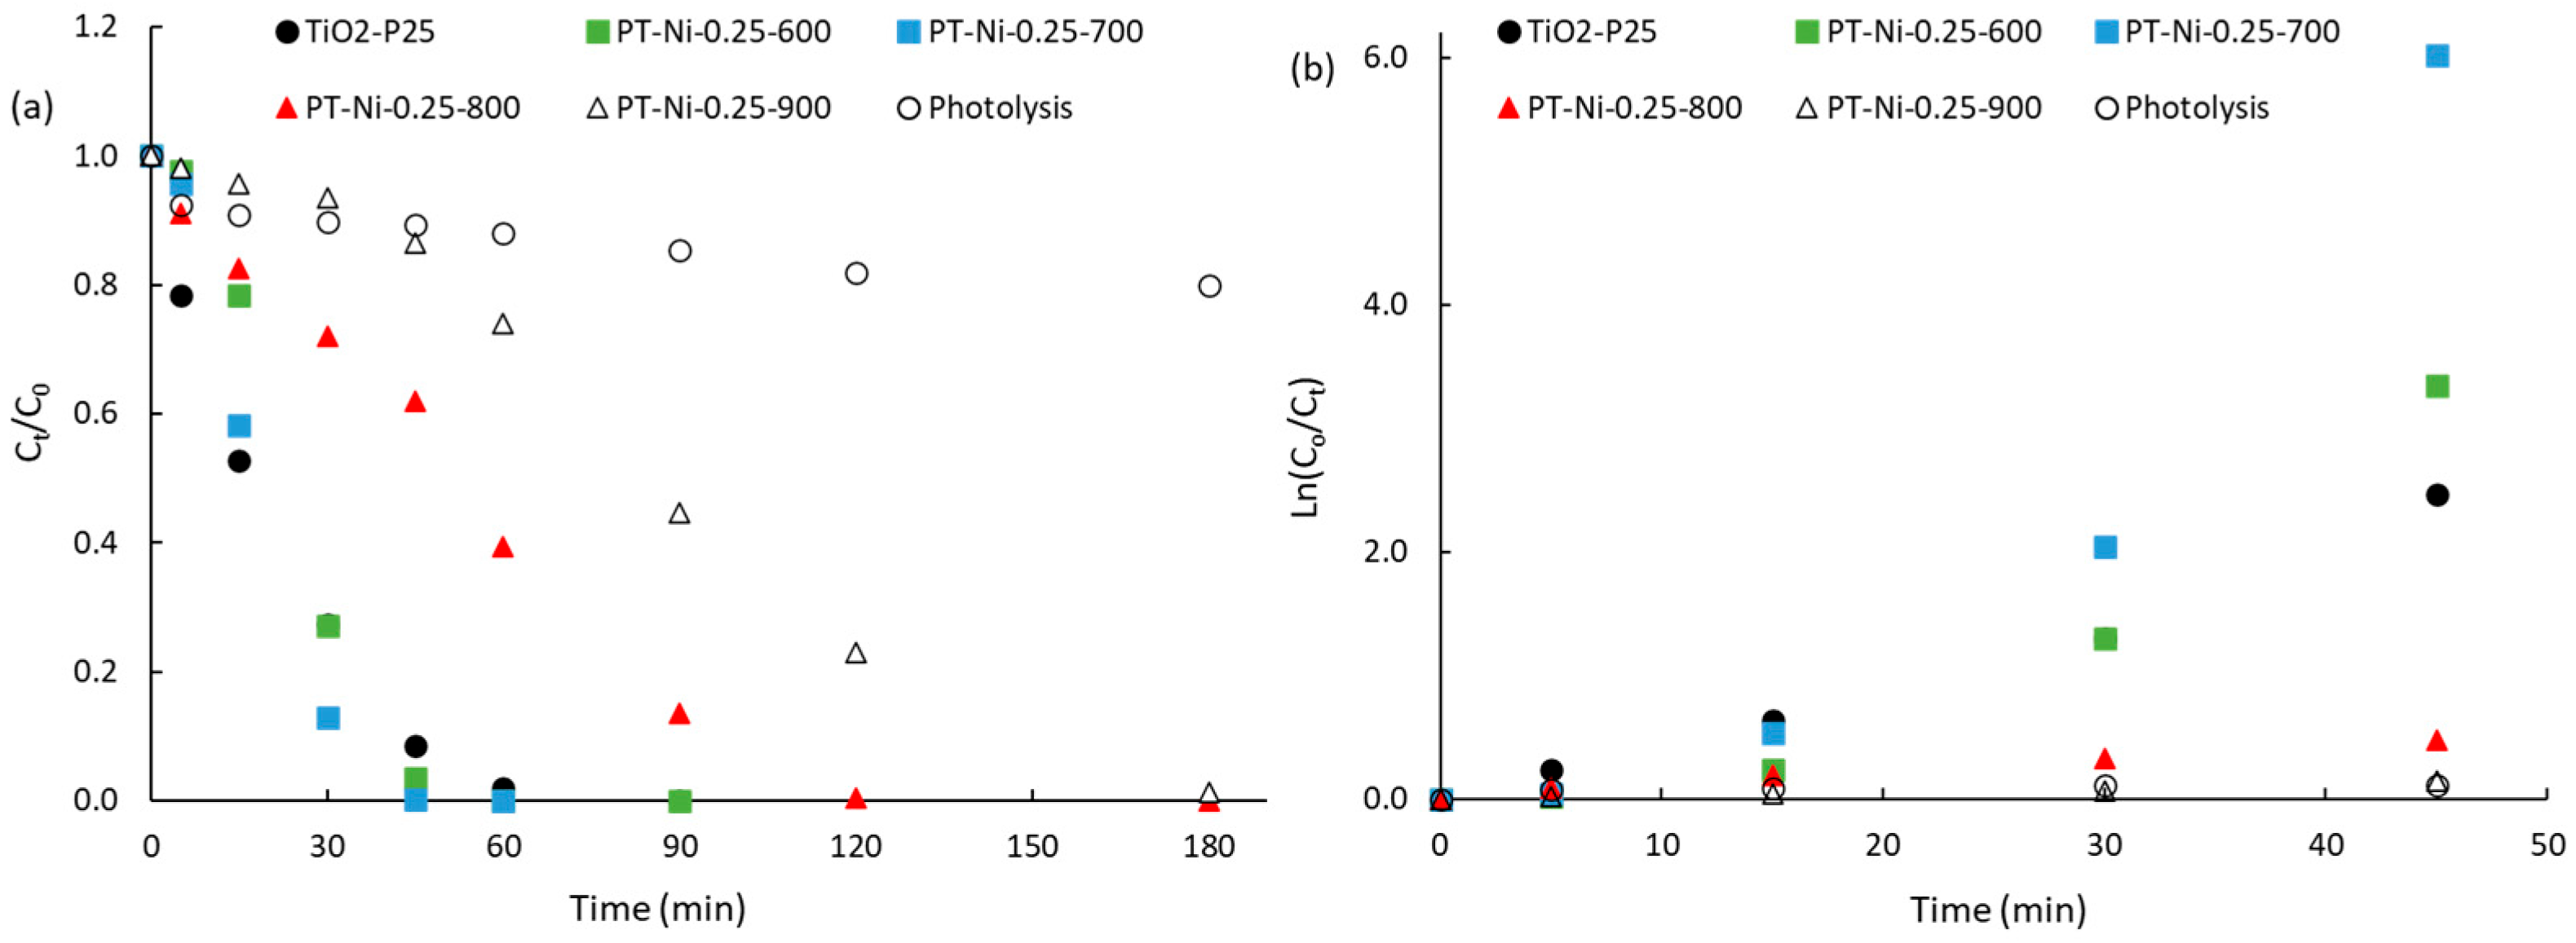
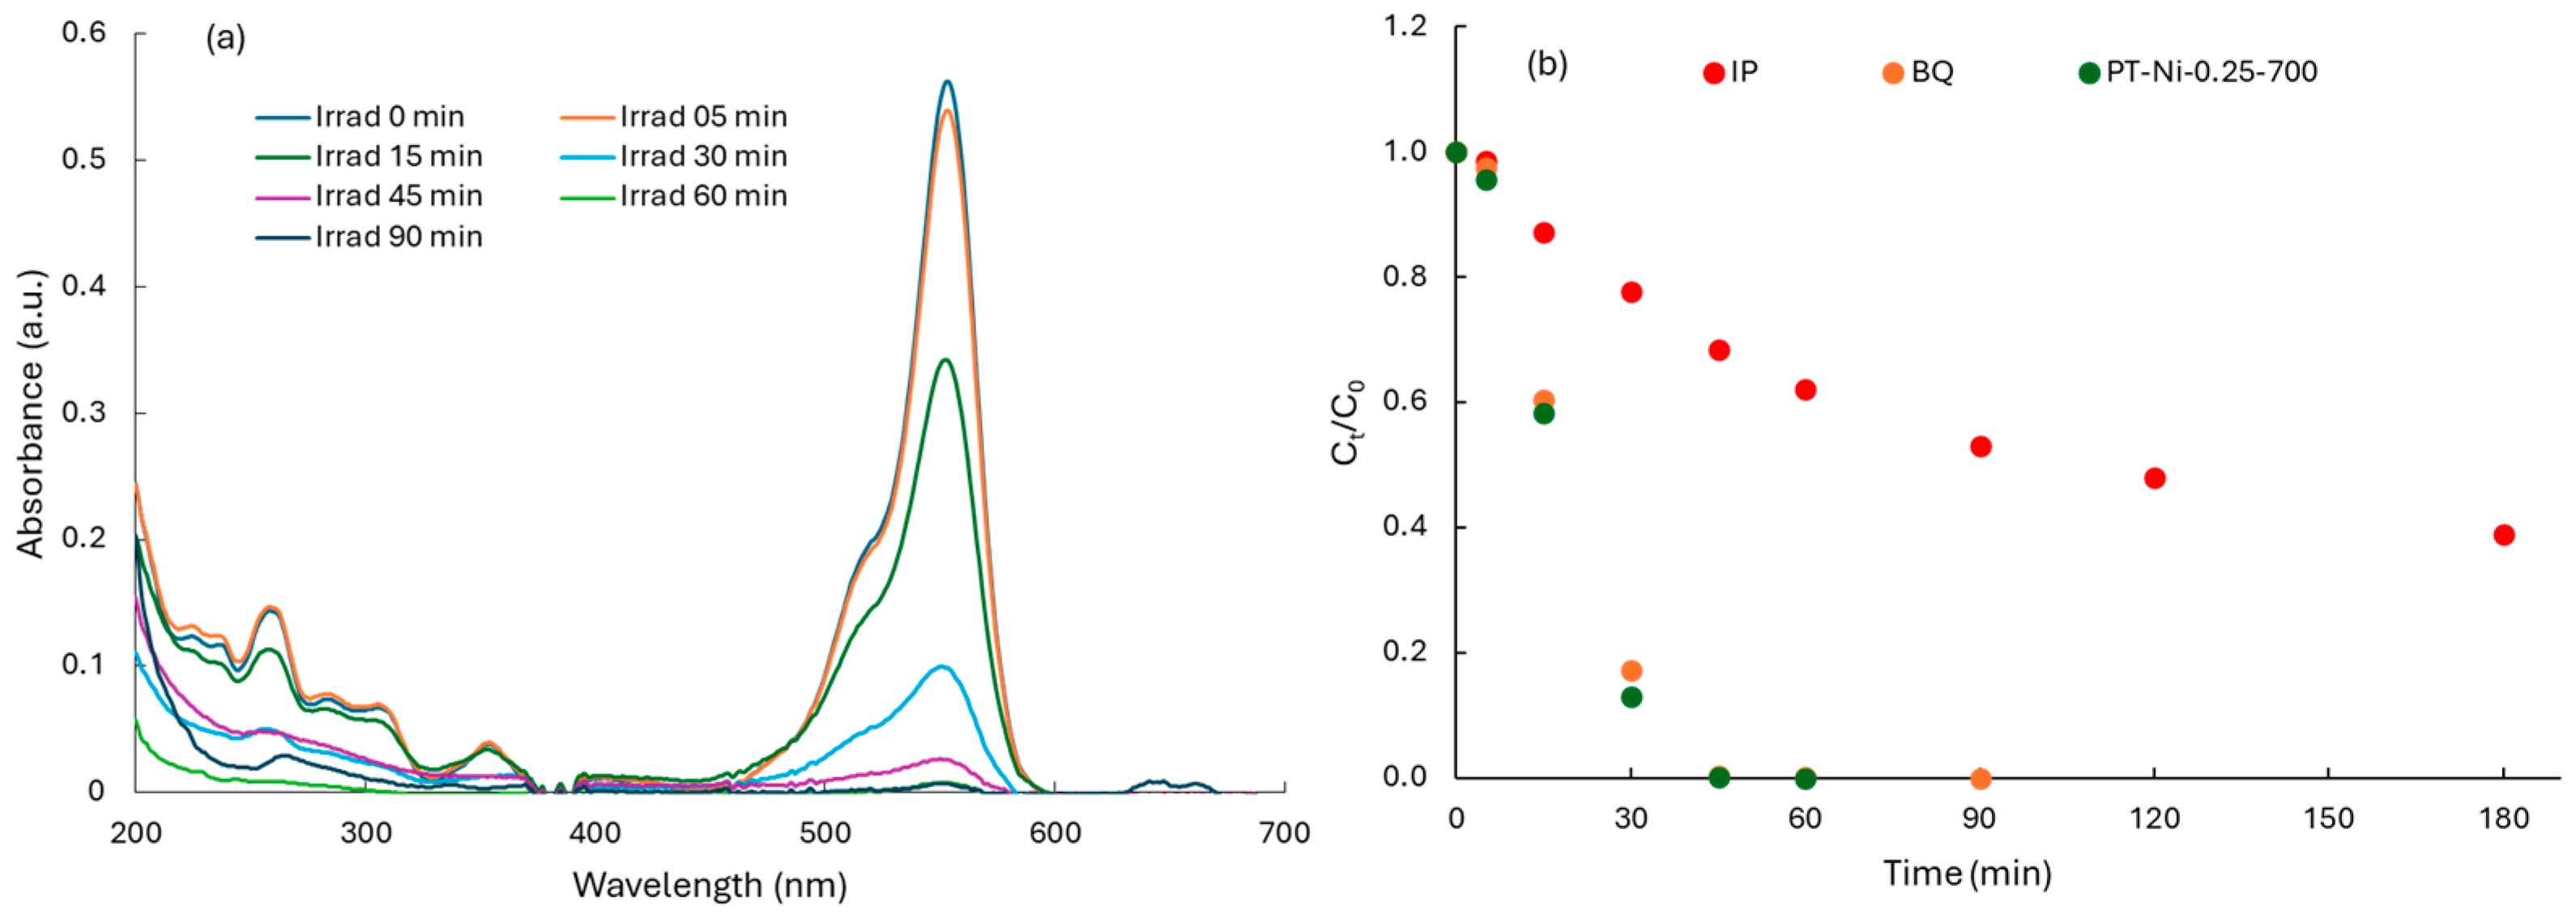
2.2.2. Photocatalytic Degradation of RhB

The photoactivity of the PT-Ni series of catalysts was evaluated under UV irradiation by monitoring the degradation of RhB. As a representative example, Figure 6a illustrates the kinetics of photocatalytic degradation of RhB on the UV-irradiated PT-Ni-0.25 series prepared at different pyrolysis temperatures. For comparison, Figure 6a also presents the results obtained with benchmark TiO2-P25 and the direct photolysis of RhB in the absence of a catalyst. As shown, direct photolysis accounts for only ca. 20% RhB conversion after a 3-h reaction, which is attributed to the UV immersion lamp used for the reactor irradiation. It is also noteworthy that the benchmark catalyst, commercial TiO2-P25, requires ca. 90 min to achieve total degradation of RhB. In contrast, Figure 6a demonstrates that PT-Ni-0.25-600 and PT-Ni-0.25-700 exhibited higher photoactivity than TiO2-P25, achieving complete dye degradation after 60 and 45 min of irradiation, respectively. Additionally, Figure S12 (Supplementary Materials) presents the kinetics of the RhB photocatalytic degradation and the linear regression data for the other catalyst series.
As an initial approach in comparing the photocatalytic activity of the materials, Figure 6b shows the first-order linear regression of the kinetic data shown in Figure 6a. The first-order apparent rate constant (kapp) can be estimated by Equation (4), where Ceq is the RhB concentration in solution after the adsorption equilibrium (60 min in the dark), and Ct denotes the concentration at time t.
Ln(Ceq/Ct) = kapp·t
To estimate kapp, the first 45 min were selected for all of the catalysts to ensure the optimal linear range. A summary of the kinetic parameters obtained from RhB photodegradation, along with a comparison of the catalysts, is presented in Table 4. As noted previously, PT-Ni-0.25-600 and PT-Ni-0.25-700 exhibited higher photocatalytic activity than TiO2-P25, and were significantly more effective than direct photolysis. Specifically, in terms of kapp, the photocatalytic activity of PT-Ni-0.25-600 and PT-Ni-0.25-700 was ca. 1.4 and 2.5 times greater than that on TiO2-P25, respectively. These catalysts also demonstrated remarkable photocatalytic activity, being ca. 39 and 68 times more efficient than direct photolysis in the absence of catalysts.
The other catalysts displayed lower photocatalytic activity than TiO2-P25 but still outperformed direct photolysis. This behavior is consistent with the known properties of NiO, a p-type semiconductor with an energy band gap of ca. 3.5 eV [24,25,26], which makes it photoactive under UV irradiation. This is further supported by the observation that, when PT-Ni-0.5-700 with a kapp of ca. 0.0262 min−1 under UV irradiation was exposed to artificial solar irradiation, its photoactivity significantly decreased by a factor of 19, resulting in a kapp of only 0.0014 min−1. However, it is important to note that catalysts with a higher Ni content (PT-Ni-0.5) exhibited a significant decrease in photoactivity. This is particularly evident for PT-Ni-0.1-700, PT-Ni-0.25-700, and PT-Ni-0.5-700, with kapp values of 0.0339 min−1, 0.1295 min−1, and 0.0262 min−1, respectively. The photoactivity of PT-Ni-0.25-700 was nearly four times higher than that of PT-Ni-0.1-700, despite both adsorbing similar amounts of RhB. Whereas, as the Ni content increased further (PT-Ni-0.5-700), the photocatalytic activity decreased by ca. five times, indicating important sintering effects that contributed to the reduction in performance, even at moderate pyrolysis temperatures such as 700 °C.
Notably, for all three series of materials prepared, the catalysts pyrolyzed at 700 °C showed the highest photocatalytic activity. It is clear, however, that when the pyrolysis temperature exceeds 700 °C, the photoactivity decreases significantly, with this effect being even more pronounced for the catalysts prepared using two-step pyrolysis. This is likely due to the prolonged heat treatment at higher temperatures, particularly in two-step pyrolysis, which not only intensifies the sintering but also facilitates the formation of previously observed reduced nickel phases, such as Ni3C and elemental Ni0. These phases are known to be less photoactive for oxidation reactions and instead promote electron donor reactions, as our group have previously reported in the case of Fe3C phases [9]. In contrast, one-step pyrolysis is more effective in preserving nickel in its active oxide form, which is essential for efficient photocatalysis. This is further supported by the kapp values, where PT-Ni-0.25-700 exhibits a value 10 times higher than PT-Ni-0.25-400-700. Moreover, the XRD patterns (Figure S5, Supplementary Materials) reveal that the peaks corresponding to elemental nickel are significantly more pronounced in PT-Ni-0.25-400-700 than in PT-Ni-0.25-700, further confirming the detrimental effect of excessive heat treatment.

2.3. General Discussion

We believe that the characterization presented in this work is enough to understand the behavior of the catalysts. The results obtained from the N2 adsorption/desorption isotherms, XRD patterns, and SEM-EDS analysis were clearly correlated with the adsorption kinetic tests and the photocatalytic tests. However, it is important to highlight that there is not necessary to perform an additional characterization of electronic behavior, including techniques such as electrochemical impedance spectroscopy (EIS), photoluminescence (PL), and photocurrent (PC) analysis. For the first point, EIS is a habitual technique used to characterize the electrochemical capacitance behavior of electrodes, and it is, indeed, a valuable technique to correlate the electrochemical behavior and micropore framework. However, as discussed above, the present materials are mainly constituted by mesopores, and, as reported elsewhere [50,51], EIS analysis presents important limitations when the framework of materials is mainly constituted by mesopores. Second, PL analysis is an interesting and valuable analysis to characterize quantum dots and films, but not bulk catalysts [52,53]. PL may be frequently misunderstood given the nature of carbon materials, which behave as black bodies absorbing most of incident radiation. The same type of contradictory results can be found in solid-state UV–vis spectroscopy, because the carbon material absorbs most of the UV–vis irradiation, and it is practically impossible to perform a proper Tauc plot to achieve the energy band gap of NiO. Thus, when carbon is the main component of hybrid catalysts, as in the present case (Table 1), the lack of reproducibility due to the large absorbance property of carbon materials led to tremendous inaccuracy in the UV–vis analysis [7,8]. Finally, photocurrent analysis is a good analysis method to characterize new materials and usually yields interesting data. However, this technique is more useful to characterize materials deposited in the form of thin-film electrodes, such as the case of solar cells. However, this is not the present case, because the materials are not pure, but rather hybrid spheres composed of carbon and Ni-based species which are suspended in an aqueous phase. Thus, photocurrent analysis is a good method to evaluate the answer of semiconductors in the visible range [52,54]; however, it should be mentioned that it is not useful for the present case because the photocatalytic tests were performed under pure UV irradiation, and only one test was performed under artificial solar irradiation exactly to show that the present hybrid materials are UV-photoactive.
In addition, the surface reaction rate (rsur-cat, μmol·mg−1·min−1) was estimated by Equation (5), where qeq is the RhB adsorbed in the dark (μmol), taken from Table 3, kapp is the first-order apparent rate constant (min−1), taken from Table 4, and mcat is the mass for each of the Ni-based catalysts, obtained from the product between the fractional atomic weight (at.%) of Ni, given in Table 2, and the weight of catalysts (62.5 mg) that, for the case of neat TiO2-P25, is 62.5 mg.
rsur-cat = qeq.kapp/mcat
The above expression permitted a clearer comparison between the catalysts, because it is normalized in terms of the weight of the Ni-based active sites at the surface of the hybrid photocatalysts. In terms of classical heterogenous photocatalysis, this comparison is fully acceptable because reactions occur at the surface of the catalysts. At the same time, the surface reaction rate permitted a direct comparison against the benchmark catalysts, TiO2-P25. As can be seen from Table 5, all of the present catalysts are more photoactive that TiO2-P25, estimating a maximum photocatalytic activity of ca. 0.053 μmol·mg−1·min−1 for the PT-Ni-0.25-700 catalyst, which corresponds to a factor up to ca. 301 times higher than the benchmark.
At the same time, the data in Table 5 reinforces the above discussion referring to the fact that the photoactivity achieved maximum value for moderate Ni contents and moderate temperatures of pyrolysis. In addition, it is clear with this comparison that the present catalysts are poorly photoactive under UV–vis artificial solar irradiation. For instance, the UV-irradiated PT-Ni-0.5-700 catalysts showed a rsur-cat value that was ca. 14 times higher than the same catalyst submitted to UV–vis artificial solar irradiation, PT-Ni-0.5-700-solar. Thus, it can be concluded that the present Ni-based catalysts are up to two orders of magnitude more photoactive than TiO2-P25 under UV irradiation, opening a door for close indoor photoreactors.
On the other hand, two mechanisms for the RhB degradation have been reported. One involves successive de-ethylation steps [55], and the second one involves direct chromophore cleavage followed by consecutive oxidations of the aromatic rings [56]. The de-ethylation route shows a hypochromic shift in the UV–vis spectra of the solution due to the formation of the intermediates [55]. However, no shifts in the UV–vis spectra as a function of the irradiation time were observed for any of the present Ni-based catalysts. For instance, Figure 7a shows the UV–vis spectra of aliquots analyzed from the degradation of RhB on PT-Ni-0.25-700, suggesting the degradation of RhB would proceed through the oxidation of the aromatic ring [56] induced by the reaction with reactive oxygen species (ROS). Accordingly, the PT-Ni-0.25-700 catalyst was selected to verify the mechanism of RhB degradation by the in situ-generated scavengers of the ROS along the reaction [57].
The qualitative assessment of ROS was carried out by the addition of benzoquinone (BQ) and isopropanol (IP) as scavengers of superoxide (O2•–) and hydroxyl (OH) radicals, respectively. Figure 7b shows the photodegradation of RhB in the presence of BQ and IP. In the presence of IP, the kinetics of the reaction are remarkably inhibited compared to the kinetics in the absence of the scavenger. Accordingly, the photodegradation of RhB is primarily mediated by the formation of OH radicals. The addition of BQ to the reaction medium shows a negligible change in the degradation of RhB (Figure 7b). Accordingly, the scavenger studies suggest that RhB degradation occurs by generating OH radicals and, therefore, that RhB is photodegraded by consecutive hydroxylation reactions of the aromatic ring, as reported earlier by our group on a biogenic SiO2-C hybrid catalyst [32].
It is important to mention that cycling photocatalytic degradation tests would establish the basis for the scaling up of the best photocatalyst. Our group has reported on consecutive photocatalytic runs of phenol degradation under UV irradiation [58,59]. However, due to the high-power UV lamp temperature within the photoreactor used in the present work, in spite of using a circulating water system, the temperature of the reaction achieved up to ca. 40 °C. Therefore, due to the consecutive opening/closing of the immersion photoreactor, it is a dangerous operation, and, thus, we decided not to perform such tests. However, it is also true that, through one of the glass connections of the reactor, we would be able to introduce a spike with a high concentration of RhB so to achieve the same initial RhB concentration. However, we elected to perform these tests in the next article, which will also study the influence of different UV conditions and types of photoreactors.
Finally, as can be seen from the data in Table 5, we explored the use of different UV light conditions. For instance, the PT-Ni-0.5-700 catalysts showed a 14 times higher photocatalytic activity under UV irradiation than under UV–vis artificial solar irradiation. Thus, it can be concluded that some of the present Ni-based catalysts are up to two orders of magnitude more photoactive than TiO2-P25 under UV irradiation. Thus, we believe that the results obtained in the present work open a door to study other types of close indoor photoreactors with different UV light conditions (wavelengths, intensities, and photon fluxes), as well as other variables like the pH and temperature. The influence of these factors upon the photoefficiency of the two best photocatalysts in the present work (PT-Ni-0.25-600 and PT-Ni-0.25-700) will be studied in the next work.

3. Materials and Methods

3.1. Sample Preparation

3.1.1. Two-Step Pyrolysis

Ni-decorated ordered mesoporous carbon (Ni/OMCs) samples were prepared using the following procedure. First, 2 g of chestnut wood tannins (LD Carlson Company, Tallmadge, OH, USA) were combined with 40 mL of ethanol (Sigma-Aldrich, St. Louis, MO, USA) and 1 mL of 1.0 M HCl (Sigma-Aldrich, St. Louis, MO, USA) in a beaker, while 2 g of Pluronic® F-127 (Sigma-Aldrich, St. Louis, MO, USA) was dissolved in 40 mL of ethanol in a separate beaker. The contents of both beakers were then mixed and continuously stirred for ca. 30 min. Next, 0.5 g of Ni(II) nitrate hexahydrate was dissolved in 5Thanks you. All the mL of ethanol, added to the Pluronic® F-127-tannin mixture, and stirred for an additional 30 min. The resulting mixture (1:1:0.25 weight ratio for tannin/Pluronic®F127/Ni) was then poured into an evaporating flask and left to evaporate overnight, followed by drying in an oven at 105 °C overnight. Finally, the dried mixture underwent pyrolysis in a horizontal tube furnace (Lindberg Blue M 1100C, Thermo Scientific, Waltham, MA, USA), following a specific procedure.
The sample was placed in a pyrolysis boat inside of a furnace and heated under a N2 flow (50 mL/min). Initially, it was heated to 400 °C at a rate of 1 °C/min and maintained at that temperature for 4 h. Next, the temperature was increased to 900 °C at a rate of 2 °C/min and held for 1 h. Finally, the sample was cooled to ambient temperature at a rate of 10 °C/min. The resulting catalysts were labeled as PT-Ni-0.25-400-900, where “PT” represents Pluronic® F-127 and tannins, and “Ni” denotes nickel. The same procedure was repeated by varying the final pyrolysis temperature to 800 °C and 700 °C. The resulting samples were labeled as PT-Ni-0.25-400-800 and PT-Ni-0.25-400-700, respectively.

3.1.2. One-Step Pyrolysis

A similar procedure was used to prepare eight additional samples. The first batch of four samples was prepared using the same method as previously described for a tannin/Pluronic®F-127/Ni weight ratio of 1:1:0.25. However, the pyrolysis step was modified to a one-step heating process, in which the samples were heated to different final temperatures ranging from 600 to 900 °C at a rate of 1 °C/min, and held at the target temperature for 2 h. The resulting samples were labeled as PT-Ni-0.25-600, PT-Ni-0.25-700, PT-Ni-0.25-800, and PT-Ni-0.25-900, corresponding to pyrolysis temperatures of 600 °C, 700 °C, 800 °C, and 900 °C, respectively.
The second batch of three samples was prepared using the same procedure, with the exception of increasing the amount of nickel to 1 g of Ni (II) nitrate hexahydrate dissolved in 10 mL of ethanol, resulting in a weight ratio of 1:1:0.5 tannin/Pluronic®F-127/Ni. The samples were then pyrolyzed in a one-step process, with the temperature raised to different levels ranging from 600 °C to 800 °C at a rate of 1 °C/min, holding each temperature for 2 h. The resulting samples were labeled as PT-Ni-0.5-600, PT-Ni-0.5-700, and PT-Ni-0.5-800, corresponding to pyrolysis temperatures of 600 °C, 700 °C, and 800 °C, respectively.
A third batch consisting of a single sample was prepared using the same procedure as described above, but with a reduced amount of nickel to 0.2 g of Ni (II) nitrate hexahydrate dissolved in 2 mL of ethanol, resulting in a weight ratio of 1:1:0.1 tannin/Pluronic®F-127/Ni. The sample was then heated to 700 °C at a rate of 1 °C/min and held at that temperature for 2 h. This sample was labeled PT-Ni-0.1-700.

3.2. Characterization

The adsorption/desorption isotherms of N2 at −196 °C were measured using 3Flex equipment (Micromeritics, Norcross, GA, USA). The samples were previously degassed at 300 °C under vacuum for 4 h by using a SmartVacPrep instrument (Micromeritics, Norcross, GA, USA). The textural and porosimetry properties of the catalysts were determined using the BET surface area (SBET) and the total pore volume (V0.99), which were obtained at a relative pressure of 0.99. The micropore volume (Vmicro) and average pore diameter (dpore) were derived from the t-plot and the pore size distribution (PSD), calculated using the BJH method for pores smaller than 370 nm. The mesopore volume (Vmeso) was estimated from V0.99 to Vmicro. Structural characterization was performed using X-ray diffraction (XRD) over an angular range of 5° ≤ 2θ ≤ 70°, with a scanning step of 0.02° and a fixed counting time of 10 s [60]. The measurements were carried out on a Bruker diffractometer (D4 ENDEAVOR model, Bruker, Billerica, MA, USA) with Cu-Kα radiation (λ = 1.54 Å) and a graphite monochromator. The morphology of the samples was analyzed using field emission scanning electron microscopy (FESEM) on a Quattro S ESEM system (Thermo Fisher Scientific, Waltham, MA, USA). The images were acquired using an Everhart-Thornley secondary electron detector (ETD) at an accelerating voltage of 10 kV and a working distance of 10 mm. Representative regions from each sample were selected for the atomic composition analysis of the catalysts using energy-dispersive spectroscopy (EDS UltraDry, 30 mm2, 129 eV Mn, Thermo Fisher Scientific, Waltham, MA, USA).

3.3. Photocatalytic Activity Tests

High-purity rhodamine B (RhB) from Sigma-Aldrich (St. Louis, MO, USA) was used for the adsorption and photodegradation tests. Kinetics studies were performed to assess the adsorption capacity of the catalysts in the dark. An RhB solution with an initial concentration of ca. 5.5 mg·L−1 (ca. 11.5 μmol·L−1, equivalent to 2.875 μmol) was mixed with the catalyst, and the adsorption kinetics were monitored for 90 min. Steady-state equilibrium was typically achieved within 45–60 min for most catalysts, so a 60-min period of adsorption in the dark was employed prior to UV irradiation. For the photocatalytic tests, a 350-mL Pyrex photochemical reaction vessel was used, with UV irradiation provided by a high-pressure Hg lamp (Sigma-Aldrich, 450 W, mainly emitting 250 W·m−2 at 360 nm). The lamp was vertically suspended inside of a cylindrical double-walled quartz jacket, which was cooled to 10 °C by a circulating water flow system immersed in the solution. Each test involved 250 mL of RhB solution and 62.5 mg of catalyst, maintaining a constant photocatalyst loading of ca. 0.25 g·L−1. The kinetics of the adsorption and photodegradation of RhB were monitored via UV–visible spectroscopy at 554 nm using a Spectroquant® Prove 300 UV/VIS spectrophotometer (Merck, Darmstadt, Germany). Commercial TiO2-P25 was used as a benchmark photocatalyst. Reactive oxygen species were evaluated by the addition of benzoquinone (BQ) and isopropanol (IP) as scavengers of superoxo anion (O2•–) and hydroxyl (OH) radicals, respectively [61,62]. The superoxide radicals were identified using a concentration of ca. 14 μmol·L–1 BQ, which was added to 250 mL of RhB with the same concentration as the original tests. For the identification of hydroxyl radicals, a concentration of 0.8 mol·L–1 IP was used. The catalytic reaction was carried out in the same conditions of UV irradiation after achieving the adsorption/desorption equilibrium in the dark for a period of 15 min. Aliquots were collected periodically, centrifuged, and measured by vibrational spectroscopy in the UV–vis region. All of the experiments were performed at least in duplicate, with an experimental accuracy of less than 2%.

4. Conclusions

It can be concluded that the synthesized materials feature a porous framework predominantly composed of mesopores. The pyrolysis temperature plays a crucial role in promoting the reduction of Ni phases to Ni3C and elementary Ni0. Notably, all of the catalysts exhibited remarkable photoactivity, achieving RhB conversions up to 68 times higher than those observed in direct photolysis. Among the three series of materials prepared, the catalysts pyrolyzed at 700 °C displayed the highest photoactivity. Exceeding this temperature and increasing the Ni content proved detrimental to the photocatalytic performance. The following two key factors contributed to this decline: first, the reduction of NiO phases to Ni3C and elemental Ni0, which are not photoactive for oxidation reactions; second, excessive heating, whether through two-step pyrolysis or pyrolysis at temperatures above 700 °C, which induced significant sintering effects even at low Ni contents. The present work provides an efficient, eco-friendly, and sustainable method for the synthesis of Ni-decorated carbocatalysts for the UV-driven degradation of rhodamine B, a highly dangerous organic pollutant that induces reproductive toxicity and is under continuous evaluation because of the possible carcinogenic behavior. The information included in this paper is highly valuable, because the results indicate that the photocatalysts prepared by this method are up to 68 and 2.5 times more efficient than direct photolysis and the benchmark based on TiO2-P25. Moreover, when the photoactivity is expressed in terms of the normalized weight of the catalysts, the sample with the 1:1:0.25 tannin/Pluronic®F-127/Ni weight ratio pyrolyzed at 700 °C exhibited up to two orders of magnitude more photoactivity than TiO2-P25 under UV irradiation, opening a door for close indoor photocatalytic applications.

Supplementary Materials

The following supporting information can be downloaded at: https://www.mdpi.com/article/10.3390/catal15040385/s1. Table S1. Kinetic models used for the analysis of the RhB adsorption on the catalysts. Figure S1. SEM-EDS analysis of the PT-Ni-0.1-700 catalyst. Figure S2. SEM-EDS analysis of the PT-Ni-0.25-700 catalyst. Figure S3. SEM-EDS analysis of the PT-Ni-0.5-700 catalyst. Figure S4. SEM-EDS analysis of the PT-Ni-0.25-400-700 catalyst. Figure S5. XRD patterns of the various Ni-based catalyst series. Figure S6. Kinetic analysis of the RhB adsorption on the PT-Ni.0.25-600 (a–c) and PT-Ni.0.25-700 (d–f) catalysts based on the pseudo-first-order adsorption model (a,d), pseudo-second-order adsorption model (b,e), and the intraparticle diffusion (IPD) model (c,f). Figure S7. Kinetics analysis of the RhB adsorption on the PT-Ni.0.25-800 (a–c) and PT-Ni.0.25-900 (d–f) catalysts based on the pseudo-first-order adsorption model (a,d), pseudo-second-order adsorption model (b,e), and the intraparticle diffusion (IPD) model (c,f). Figure S8. Kinetic analysis of the RhB adsorption on the PT-Ni.0.5-600 (a–c) and PT-Ni.0.5-700 (d–f) catalysts based on the pseudo-first-order adsorption model (a,d), pseudo-second-order adsorption model (b,e), and the intraparticle diffusion (IPD) model (c,f). Figure S9. Kinetic analysis of the RhB adsorption on the PT-Ni.0.5-800 (a–c) and PT-Ni.0.5-700-Solar (d–f) catalysts based on the pseudo-first-order adsorption model (a,d), pseudo-second-order adsorption model (b,e), and the intraparticle diffusion (IPD) model (c,f). Figure S10. Kinetics analysis of the RhB adsorption on the PT-Ni.0.1-700 (a–c) and PT-Ni.0.25-400-700 (d–f) catalysts based on the pseudo-first-order adsorption model (a,d), pseudo-second-order adsorption model (b,e), and the intraparticle diffusion (IPD) model (c,f). Figure S11. Kinetics analysis of the RhB adsorption on the PT-Ni.0.25-400-800 (a–c) and PT-Ni.0.25-400-900 (d–f) catalysts based on the pseudo-first-order adsorption model (a,d), pseudo-second-order adsorption model (b,e), and the intraparticle diffusion (IPD) model (c,f). Figure S12. Kinetics of the RhB photocatalytic degradation and linear regression analysis of the kinetic data for various catalyst series.

Author Contributions

R.A.S. and R.B. contributed to the synthesis of the catalysts. N.E., P.S.P. and R.S.-d.-R. contributed to the characterization and interpretation of the textural, XRD, and SEM-EDS data, and draft review. S.B. contributed to the conceptualization, writing of the original draft, and review. J.M. contributed to the conceptualization, photocatalytic tests, writing of the original draft, interpretation of data, and review. All authors have read and agreed to the published version of the manuscript.

Funding

S. Bashkova thanks the Grant-In-Aid Program and the Department of Chemistry, Biochemistry and Physics at Fairleigh Dickinson University. J. Matos thanks ANID-ANILLO ATE220014 and ANID-FONDECYT 1220228. P.S. Poon thanks ANID-FONDEF ID23I10085 and ANID-FONDECYT 1240641. N. Escalona thanks Fondequip N° EQM160070. R. Segura thanks ANID-Fondequip EQM 190179 and EQM 240162.

Data Availability Statement

Data and materials are available on request.

Conflicts of Interest

The authors declare that they have no known competing financial interests or personal relationships that could have appeared to influence the work reported in this paper.

References

  1. Mishra, R.K.; Mentha, S.S.; Misra, Y.; Wivedi, N. Emerging pollutants of severe environmental concern in water and wastewater: A comprehensive review on current developments and future research. Water-Energy Nexus 2023, 6, 74–95. [Google Scholar] [CrossRef]
  2. Kumar, R.; Kumar Singh, C.; Kamesh Misra, S.; Singh, B.P.; Bhardwaj, A.K.; Chandra, K.K. Water biodiversity: Ecosystem services, threats, and conservation. In Biodiversity and Bioeconomy; Singh, K., Ribeiro, M.C., Calicioglu, Ö., Eds.; Elsevier: Amsterdam, The Netherlands, 2024; pp. 347–380. [Google Scholar]
  3. Ojha, A.; Tiwary, D. Organic pollutants in water and its health risk assessment through consumption. In Contamination of Water; Ahamad, A., Siddiqui, S.I., Singh, P., Eds.; Academic Press: Cambridge, MA, USA, 2021; pp. 237–250. [Google Scholar]
  4. Al-Tohamy, R.; Ali, S.S.; Li, F.; Okasha, K.M.; Mahmoud, Y.A.G.; Elsamahy, T.; Jiao, H.; Fu, Y.; Sun, J. A critical review on the treatment of dye-containing wastewater: Ecotoxicological and health concerns of textile dyes and possible remediation approaches for environmental safety. Ecotoxicol. Environ. Saf. 2022, 231, 113160. [Google Scholar] [CrossRef] [PubMed]
  5. Al-Buriahi, A.K.; Al-Gheethi, A.A.; Kumar, P.S.; Mohamed, R.M.S.R.; Yusof, H.; Alshalif, A.F.; Khalifa, N.A. Elimination of rhodamine B from textile wastewater using nanoparticle photocatalysts: A review for sustainable approaches. Chemosphere 2022, 287, 132162. [Google Scholar] [CrossRef] [PubMed]
  6. Chan, S.H.S.; Wu, T.Y.; Juan, J.C.; Teh, C.Y. Recent developments of metal oxide semiconductors as photocatalysts in advanced oxidation processes (AOPs) for treatment of dye wastewater. J. Chem. Technol. Biotechnol. 2011, 86, 1130–1158. [Google Scholar] [CrossRef]
  7. Muñoz-Flores, P.; Poon, P.S.; Ania, C.O.; Matos, J. Performance of a C-containing Cu-based photocatalyst for the degradation of tartrazine: Comparison of performance in a slurry and CPC photoreactor under artificial and natural solar light. J. Colloid. Interface Sci. 2022, 623, 646–659. [Google Scholar] [CrossRef] [PubMed]
  8. Muñoz-Flores, P.; Poon, P.S.; Sepulveda, C.; Ania, C.O.; Matos, J. Photocatalytic performance of carbon-containing CuMo-Based catalysts under sunlight illumination. Catalysts 2022, 12, 46. [Google Scholar] [CrossRef]
  9. Matos, J.; Poon, P.S.; Montaña, R.; Romero, R.; Gonçalves, G.R.; Schettino, A.A.; Passamani, E.C.; Freitas, J.C.C. Photocatalytic activity of P-Fe/activated carbon nanocomposites under artificial solar irradiation. Catal. Today 2020, 356, 226–240. [Google Scholar] [CrossRef]
  10. Lanfredi, S.; Nobre, M.A.L.; Poon, P.S.; Matos, J. Hybrid material based on an amorphous-carbon matrix and ZnO/Zn for the solar photocatalytic degradation of basic blue 41. Molecules 2020, 25, 96. [Google Scholar] [CrossRef]
  11. Bello, R.; Rodríguez-Aguado, E.; Smith, V.A.; Grachev, D.; Rodriguez-Castellón, E.; Bashkova, S. Ni-doped ordered nanoporous carbon prepared from chestnut wood tannins for the removal and photocatalytic degradation of methylene blue. Nanomaterials 2022, 12, 1625. [Google Scholar] [CrossRef]
  12. Herrmann, J.M. Heterogeneous photocatalysis: Fundamentals and applications to the removal of various types of aqueous pollutants. Catal. Today 1999, 53, 115–129. [Google Scholar] [CrossRef]
  13. Das, B.; Dhara, H.N.; Dahiya, A.; Patel, B.K. Recent advances in photocatalytic degradation of dyes using heterogeneous catalysts. In Trends and Contemporary Technologies for Photocatalytic Degradation of Dyes. Environmental Science and Engineering; Dave, S., Das, J., Eds.; Springer: Berlin/Heidelberg, Germany, 2022. [Google Scholar]
  14. Konstantinou, I.K.; Albanis, A.T. TiO2-assisted photocatalytic degradation of azo dyes in aqueous solution: Kinetic and mechanistic investigations: A review. Appl. Catal. B Environ. 2004, 49, 1–14. [Google Scholar] [CrossRef]
  15. Hashimoto, K.; Irie, H.; Fujishima, A. TiO2 photocatalysis: A historical overview and future prospects. Jpn. J. Appl. Phys. 2005, 44, 8269–8285. [Google Scholar] [CrossRef]
  16. Xu, D.; Ma, H. Degradation of rhodamine B in water by ultrasound-assisted TiO2 photocatalysis. J. Clean. Prod. 2021, 313, 127758. [Google Scholar] [CrossRef]
  17. Krishnan, A.; Swarnalal, A.; Das, D.; Krishnan, M.; Saji, V.S.; Shibli, S.M.A. A review on transition metal oxides based photocatalysts for degradation of synthetic organic pollutants. J. Environ. Sci. 2024, 139, 389–417. [Google Scholar] [CrossRef]
  18. Yang, Y.; Yang, Y.; Wu, H.; Guo, S. Control of the formation of rod-like ZnO mesocrystals and their photocatalytic properties. CrystEngComm 2013, 15, 2608–2615. [Google Scholar] [CrossRef]
  19. Kozlov, Y.A.; Dorogov, M.V.; Chirkunova, N.V.; Sosnin, I.M.; Vikarchuk, A.A.; Romanov, A.E. CuO Nanowhiskers-based photocatalysts for wastewater treatment. Nano Hyb. Comp. 2017, 13, 183–189. [Google Scholar] [CrossRef]
  20. Huang, L.; Fang, W.; Yang, Y.; Wu, J.; Yu, H.; Dong, X.; Wang, T.; Liu, Z.; Zhao, B. Three-dimensional MoO3 nanoflowers assembled with nanosheets for rhodamine B degradation under visible light. Mater. Res. Bull. 2018, 108, 38–45. [Google Scholar] [CrossRef]
  21. Kumar, V.V.; Gayathri, K.; Anthony, S.P. Synthesis of α-MoO3 nanoplates using organic aliphatic acids and investigation of sunlight enhanced photodegradation of organic dyes. Mater. Res. Bull. 2016, 76, 147–154. [Google Scholar] [CrossRef]
  22. Elango, G.; Roopan, S.M. Efficacy of SnO2 nanoparticles toward photocatalytic degradation of methylene blue dye. J. Photochem. Photobiol. B Biol. 2016, 155, 34–38. [Google Scholar] [CrossRef]
  23. Rajput, R.B.; Jamble, S.N.; Kale, R.B. A review on TiO2/SnO2 heterostructures as a photocatalyst for the degradation of dyes and organic pollutants. J. Environ. Manag. 2022, 307, 114533. [Google Scholar] [CrossRef]
  24. Vilé, G.; Sharma, P.; Nachtegaal, M.; Tollini, F.; Moscatelli, D.; Sroka-Bartnicka, A.; Tomanec, O.; Petr, M.; Filip, J.; Pieta, I.S.; et al. An Earth-abundant Ni-based single-atom catalyst for selective photodegradation of pollutants. Solar RRL 2021, 5, 2100176. [Google Scholar] [CrossRef]
  25. Rafiq, A.; Ikram, M.; Ali, S.; Niaz, F.; Khan, M.; Khan, Q.; Maqbool, M. Photocatalytic degradation of dyes using semiconductor photocatalysts to clean industrial water pollution. J. Ind. Eng. Chem. 2021, 97, 111–128. [Google Scholar] [CrossRef]
  26. Akbari, A.; Sabouri, Z.; Hosseini, H.A.; Hashemzadeh, A.; Khatami, M.; Darroudi, M. Effect of nickel oxide nanoparticles as a photocatalyst in dyes degradation and evaluation of effective parameters in their removal from aqueous environments. Inorg. Chem. Commun. 2020, 115, 107867. [Google Scholar] [CrossRef]
  27. Negash, A.; Mohammed, S.; Weldekirstos, H.D.; Ambaye, A.D.; Gashu, M. Enhanced photocatalytic degradation of methylene blue dye using eco-friendly synthesized rGO@ZnO nanocomposites. Sci. Rep. 2023, 13, 22234. [Google Scholar] [CrossRef]
  28. Song, Y.; Li, H.; Xiong, Z.; Cheng, L.; Du, M.; Liu, Z.; Li, J.; Li, D. TiO2/carbon composites from waste sawdust for methylene blue photodegradation. Diam. Relat. Mater. 2023, 136, 109918. [Google Scholar] [CrossRef]
  29. Matos, J.; Ocares-Riquelme, J.; Poon, P.S.; Montaña, R.; García, X.; Campos, K.; Hernández-Garrido, J.C.; Titirici, M.M. C-doped anatase TiO2: Adsorption kinetics and photocatalytic degradation of methylene blue and phenol, and correlations with DFT estimations. J. Colloid. Inter. Sci. 2019, 547, 14–29. [Google Scholar] [CrossRef]
  30. Dong, H.; Zeng, G.; Tang, L.; Fan, C.; Zhang, C.; He, X.; He, Y. An overview on limitations of TiO2-based particles for photocatalytic degradation of organic pollutants and the corresponding countermeasures. Water Res. 2015, 79, 128–146. [Google Scholar] [CrossRef]
  31. European Scientist. Available online: https://www.europeanscientist.com/fr/sante/la-france-va-interdire-le-dioxyde-de-titane-a-compter-de-2020/ (accessed on 2 April 2025).
  32. Fernández de Cordoba, M.C.; Matos, J.; Montaña, R.; Poon, P.S.; Lanfredi, S.; Praxedes, F.R.; Hernández-Garrido, J.C.; Calvino, J.J.; Rodríguez-Aguado, E.; Rodríguez-Castellón, E.; et al. Sunlight photoactivity of rice husks-derived biogenic silica. Catal. Today 2019, 328, 125–135. [Google Scholar] [CrossRef]
  33. Ryoo, R.; Joo, S.H.; Kruk, M.; Jaroniec, M. Ordered mesoporous carbons. Adv. Mater. 2001, 13, 677–681. [Google Scholar] [CrossRef]
  34. Libbrecht, W.; Verberckmoes, A.; Thybaut, J.W.; Van der Voort, P.; Clercq, J.D. Soft templated mesoporous carbons: Tuning the porosity for the adsorption of large organic pollutants. Carbon 2017, 116, 528–546. [Google Scholar] [CrossRef]
  35. Gang, D.; Ahmad, Z.U.; Lian, Q.; Yao, L.; Zappi, M.E. A review of adsorptive remediation of environmental pollutants from aqueous phase by ordered mesoporous carbon. Chem. Eng. J. 2021, 403, 1385–8947. [Google Scholar] [CrossRef]
  36. Tanaka, S.; Nakatani, N.; Doi, A.; Miyake, Y. Preparation of ordered mesoporous carbon membranes by a soft-templating method. Carbon 2011, 49, 3184–3189. [Google Scholar] [CrossRef]
  37. Tang, Y.; Qiu, M.; Yang, J.; Shen, F.; Wang, X.; Qi, X. One-pot self-assembly synthesis of Ni-doped ordered mesoporous carbon for quantitative hydrogenation of furfural to furfuryl alcohol. Green Chem. 2021, 23, 1861–1870. [Google Scholar] [CrossRef]
  38. Thommes, M.; Kaneko, K.; Neimark, A.V.; Olivier, J.P.; Rodriguez-Reinoso, F.; Rouquerol, J.; Sing, K.S.W. Physisorption of gases, with special reference to the evaluation of surface area and pore size distribution (IUPAC Technical Report). Pure Appl. Chem. 2015, 87, 1051–1069. [Google Scholar] [CrossRef]
  39. Thommes, M.; Smarsly, B.; Groenewolt, M.; Ravikovitch, P.I.; Neimark, A.V. Adsorption hysteresis of nitrogen and argon in pore networks and characterization of novel micro- and mesoporous silicas. Langmuir 2006, 22, 756–764. [Google Scholar] [CrossRef]
  40. Matos, J.; Samudio-González, D.; Blanco, E.; Poon, P.S.; Escalona, N. Alkali-driven selectivity of products on carbon-supported Ni-based catalysts during the HDO of guaiacol. Fuel 2024, 374, 132442. [Google Scholar] [CrossRef]
  41. Yung, T.Y.; Huang, L.Y.; Chan, T.Y.; Wang, K.S.; Liu, T.Y.; Chen, P.T.; Chao, C.Y.; Liu, L.K. Synthesis and characterizations of Ni-NiO nanoparticles on PDDA-modified graphene for oxygen reduction reaction. Nanoscale Res. Lett. 2014, 9, 444. [Google Scholar] [CrossRef]
  42. Ding, K.; Chen, J.; Liu, Y.; Zhou, L.; Zhang, D.; Tian, W.; Sun, Y.; Pan, J.; Wang, H. Peony-shaped micron-sized NiO particles: Their excellent electrochemical performances as anode materials of lithium-ion batteries (LIBs). J. Solid State Electrochem. 2022, 26, 985–996. [Google Scholar] [CrossRef]
  43. Zhang, Y.; Zhu, Y.; Cao, Y.; Li, D.; Zhang, Z.; Wang, K.; Ding, F.; Wang, X.; Meng, D.; Fan, L.; et al. Size and morphology-controlled synthesis of Ni3C nanoparticles in a TEG solution and their magnetic properties. RSC Adv. 2016, 6, 81989–81994. [Google Scholar] [CrossRef]
  44. Matos, J.; Díaz, K.; García, V.; Cordero, T.C.; Brito, J.L. Methane transformation in presence of carbon dioxide on activated carbon supported nickel-calcium catalysts. Catal. Lett. 2006, 109, 163–169. [Google Scholar] [CrossRef]
  45. Matos, J.; Arcibar-Orozco, J.; Poon, P.S.; Pecchi, G.; Rangel-Mendez, J.R. Influence of phosphorous upon the formation of DMPO-•OH and POBN-O2•¯ spin-trapping adducts in carbon-supported P-promoted Fe-based photocatalysts. J. Photochem. Photobiol. A. Chem. 2020, 391, 112362. [Google Scholar] [CrossRef]
  46. Wu, F.-C.; Tseng, R.-L.; Juang, R.-S. Initial behavior of intraparticle diffusion model used in the description of adsorption kinetics. Chem. Eng. J. 2009, 153, 1–8. [Google Scholar] [CrossRef]
  47. McKay, G.; Otterburn, M.S.; Sweeney, A.G. The removal of color from effluent using various adsorbents—III. Silica: Rate processes. Water Res. 1980, 14, 15–20. [Google Scholar] [CrossRef]
  48. Ho, Y.S.; McKay, G.A. Comparison of chemisorption kinetic models applied to pollutant removal on various sorbents. Process Saf. Environ. Prot. 1998, 76, 332–340. [Google Scholar] [CrossRef]
  49. Wu, F.-C.; Tseng, R.-L.; Juang, R.-S. Kinetic modeling of liquid-phase adsorption of reactive dyes and metal ions on chitosan. Water Res. 2001, 35, 613–618. [Google Scholar] [CrossRef]
  50. Perez-Rodriguez, S.; Pinto, O.; Izquierdo, M.T.; Segura, C.; Poon, P.S.; Celzard, A.; Matos, J.; Fierro, V. Upgrading of pine tannin biochars as electrochemical capacitor electrodes. J. Coll. Interface Sci. 2021, 601, 863–876. [Google Scholar] [CrossRef] [PubMed]
  51. Pinto-Burgos, O.; Castro-Gutiérrez, J.; Poon, P.S.; Izquierdo, M.T.; Celzard, A.; Fierro, V.; Matos, J. Enhancing electrochemical capacitor performance of N-doped tannin-derived carbons by hydrothermal treatment in ammonia. J. Power Sources 2024, 602, 234332. [Google Scholar] [CrossRef]
  52. Rangel-Mendez, J.R.; Matos, J.; Cházaro-Ruiz, L.F.; González-Castillo, A.C.; Barrios-Yáñez, G. Microwave-assisted synthesis of C-doped TiO2 and ZnO hybrid nanostructured materials as quantum-dots sensitized solar cells. Appl. Surf. Sci. 2018, 434, 744–755. [Google Scholar] [CrossRef]
  53. Gonzalez-Vera, A.S.; Pineda-Arellano, C.A.; Matos, J.; Chazaro-Ruiz, L.F.; Ramírez-Monroy, A.; Rangel-Mendez, J.R.; Ania, C.O. Influence of the sequential purification of biomass-derived carbon dots on their colloidal and optical properties. Carbon Trends 2025, 19, 100460. [Google Scholar] [CrossRef]
  54. Fernandes, D.M.; Abdelkader-Fernandeza, V.K.; Fayad, A.; Ania, C.O.; Praxedes, F.R.; Lanfredi, S.; Rodríguez-Castellón, E.; Rodríguez-Aguado, E.; Hernández-Garrido, J.C.; Quintana-González, J.J.; et al. Ni and Co-based bifunctional electrocatalysts supported on TiO2@C for oxygen evolution and reduction reactions. Electrochim. Acta 2024, 506, 145030. [Google Scholar] [CrossRef]
  55. Merka, O.; Yarovyi, V.; Bahnemann, D.W.; Wark, M. pH-Control of the photocatalytic degradation mechanism of Rhodamine B over Pb3Nb4O13. J. Phys. Chem. C 2011, 115, 8014–8023. [Google Scholar] [CrossRef]
  56. Fu, H.; Pan, C.; Yao, W.; Zhu, Y. Visible-light-induced degradation of Rhodamine B by nanosized Bi2WO6. J. Phys. Chem. B 2005, 109, 22432–22439. [Google Scholar] [CrossRef] [PubMed]
  57. Praxedes, F.R.; Nobre, M.A.L.; Lanfredi, S.; Poon, P.S.; Matos, J. Influence of the structural properties and W/Nb ratio upon the photocatalytic activity of tungsten-doped potassium sodium niobate-based perovskites. Mater. Res. Bull. 2025, 184, 113256. [Google Scholar] [CrossRef]
  58. Matos, J.; Laine, J.; Herrmann, J.-M.; Uzcategui, D.; Brito, J.L. Influence of activated carbon upon Titania on aqueous photocatalytic consecutive runs of phenol photomineralization. Appl. Catal. B Environ. 2007, 70, 461–469. [Google Scholar] [CrossRef]
  59. Velasco, L.F.; Carmona, R.J.; Matos, J.; Ania, C.O. Performance of activated carbons in consecutive phenol photooxidation cycles. Carbon 2014, 73, 206–215. [Google Scholar] [CrossRef]
  60. Praxedes, F.R.; Nobre, M.A.L.; Olean-Oliveira, A.; Teixeira, M.F.S.; Poon, P.S.; Lanfredi, S.; Matos, J. W-doped niobate-based perovskites: Synthesis by ultrasonic spray pyrolysis and structural characterization. Ceram. Int. 2023, 49, 24004–24017. [Google Scholar] [CrossRef]
  61. Chu, C.Y.; Huang, M.H. Facet-dependent photocatalytic properties of Cu2O crystals probed by using electron, hole and radical scavengers. J. Mater. Chem. A 2017, 5, 15116–15123. [Google Scholar] [CrossRef]
  62. Praxedes, F.R.; Nobre, M.A.L.; Poon, P.S.; Matos, J.; Lanfredi, S. Nanostructured KxNa1-xNbO3 hollow spheres as potential materials for the photocatalytic treatment of polluted water. Appl. Catal. B Environ. 2021, 298, 120502. [Google Scholar] [CrossRef]
Figure 1. Adsorption/desorption isotherms of N2 at −196 °C for the samples prepared at 700 °C as a function of the Ni content and type of synthesis (one- or two-step pyrolysis).
Catalysts 15 00385 g001
Figure 2. Pore size distributions referring to the N2 adsorption branch of the isotherm for the samples prepared at 700 °C as a function of the Ni content and type of synthesis (one- or two-step pyrolysis).
Catalysts 15 00385 g002
Figure 3. SEM images of the catalyst series prepared at 700 °C. (a,b): PT-Ni-0.1-700; (c,d): PT-Ni-0.25-700; (e,f): PT-Ni-0.5-700; (g,h): PT-Ni-0.25-400-700.
Catalysts 15 00385 g003
Figure 4. XRD patterns of the PT-Ni-0.25 series as a function of the pyrolysis temperature.
Catalysts 15 00385 g004
Figure 5. Adsorption kinetics of RhB in the dark on various catalysts. (a): PT-Ni-0.25-T; (b): PT-Ni-0.5-T; (c): PT-Ni-Weight-700 °C; (d): PT-Ni-0.25-400-T.
Catalysts 15 00385 g005
Figure 6. (a): Kinetics of RhB photocatalytic degradation on the UV-irradiated PT-Ni-0.25 series as a function of the pyrolysis temperature. (b): First-order linear regression analysis of the kinetic data.
Catalysts 15 00385 g006
Figure 7. (a): Changes in the absorbance of the UV–vis spectra of the solution as a function of the reaction time for the UV-irradiated PT-Ni-0.25-700 catalyst. (b): Scavenger analysis of the kinetics of RhB photodegradation on the PT-Ni-0.25-700 catalyst.
Catalysts 15 00385 g007
Table 1. Summary of the textural and porosimetry properties of the catalysts.
CatalystsSBET
(m2·g−1)
Vtot
(cm3·g−1)
Vmicro
(cm3·g−1)
Vmeso
(cm3·g−1)
dpore
(nm)
PT-Ni-0.1-7004250.4410.0140.4277.6
PT-Ni-0.25-6004930.4250.0180.4075.5
PT-Ni-0.25-7005040.4740.0150.4596.4
PT-Ni-0.25-8003450.3770.0110.3665.5
PT-Ni-0.25-9003770.4440.0120.4326.4
PT-Ni-0.5-6004150.3170.0200.2975.5
PT-Ni-0.5-7003870.3430.0180.3255.5
PT-Ni-0.5-8002940.2400.0140.2264.4
PT-Ni-0.25-400-7005400.4810.0160.4655.5
PT-Ni-0.25-400-8004370.4170.0140.4035.5
PT-Ni-0.25-400-9004700.4820.0130.4695.5
Table 2. Average atomic composition (At.%) of the catalysts as determined by the SEM-EDS analysis.
CatalystsC
(At.%)
N
(At.%)
O
(At.%)
Ni
(At.%)
PT-Ni-0.1-70072.7 ± 0.414.4 ± 1.49.4 ± 0.43.6 ± 0.2
PT-Ni-0.25-60059.0 ± 0.315.1 ± 1.523.4 ± 0.52.5 ± 0.2
PT-Ni-0.25-70072.1 ± 0.413.1 ± 0.49.9 ± 0.44.9 ± 0.2
PT-Ni-0.25-80063.1 ± 0.412.5 ± 1.816.7 ± 0.87.6 ± 0.3
PT-Ni-0.25-90063.5 ± 1.418.9 ± 5.89.7 ± 1.78.0 ± 0.4
PT-Ni-0.5-60069.2 ± 0.614.4 ± 2.510.4 ± 0.86.0 ± 0.4
PT-Ni-0.5-70069.9 ± 0.215.2 ± 0.78.6 ± 0.36.3 ± 0.1
PT-Ni-0.5-80068.2 ± 0.414.5 ± 1.28.9 ± 0.48.4 ± 0.3
PT-Ni-0.25-400-70065.7 ± 0.317.4 ± 1.514.2 ± 0.72.7 ± 0.2
PT-Ni-0.25-400-80072.2 ± 0.414.1 ± 1.69.9 ± 0.53.8 ± 0.2
PT-Ni-0.25-400-90076.1 ± 0.413.6 ± 1.65.9 ± 0.54.4 ± 0.2
Table 3. Summary of the kinetic parameters obtained for the RhB adsorption in the dark.
Samplesqeq a
(μmol)
k1 b (min−1)R2k1 ck2 d
(μmol−1·min−1)
R2k2 ekIPD f
(μmol·min−1/2)
R2IPD gCIPD h
(μmol)
TiO2-P250.2080.0560.9821.0820.8620.0290.964−0.017
PT-Ni-0.1-7001.2220.0740.9870.5500.8320.1570.9190.152
PT-Ni-0.25-6000.9860.0780.9370.7230.9700.1290.8760.133
PT-Ni-0.25-7001.2640.0630.9360.3370.9320.1560.8770.212
PT-Ni-0.25-8001.6900.0610.9740.2190.9220.2110.9190.234
PT-Ni-0.25-9000.8410.0740.9930.7790.8550.1710.9260.109
PT-Ni-0.5-6000.6990.0570.9700.4410.8380.0880.9550.072
PT-Ni-0.5-7000.6420.0650.9740.7140.8230.0810.9310.081
PT-Ni-0.5-8000.6020.0690.9940.8100.8160.0810.9740.029
PT-Ni-0.5-700-Solar0.7130.0860.9801.7580.7360.0910.9190.096
PT-Ni-0.25-400-7002.0060.0520.9680.1270.8920.2470.9430.239
PT-Ni-0.25-400-8001.3350.0650.9440.3770.7740.1650.9150.187
PT-Ni-0.25-400-9001.2900.0630.9670.2860.9760.1670.9350.139
a RhB adsorbed at the equilibrium condition after 60 min. b k1 is the pseudo-first-order rate constant. c Quadratic linear factor for the first-order kinetic constant. d k2 is the pseudo-second-order rate constant. e Quadratic linear factor for the second-order kinetic constant. f kIPD is the rate constant according to the IPD model. g Quadratic linear factor for the IPD kinetic rate constant. h CIPD is the boundary layer thickness constant for the IPD model.
Table 4. Summary of the kinetic parameters obtained for the photodegradation of RhB.
Samplesqeq a
(μmol)
kapp b
(min−1)
R2k1 ckapp-i/kapp-TiO2 dkapp-i/kapp-Lysis e
TiO2-P250.2080.05280.9781.027.8
Photolysis00.00190.6890.041.00
PT-Ni-0.1-7001.2220.03390.9590.6417.8
PT-Ni-0.25-6000.9860.07310.8991.438.5
PT-Ni-0.25-7001.2640.12950.8792.568.2
PT-Ni-0.25-8001.6900.01020.9920.195.37
PT-Ni-0.25-9000.8410.00310.9470.061.63
PT-Ni-0.5-6000.6990.01870.8710.359.84
PT-Ni-0.5-7000.6420.02620.9690.5013.8
PT-Ni-0.5-8000.6020.0180.9630.339.26
PT-Ni-0.5-700-Solar0.7130.00140.9960.030.74
PT-Ni-0.25-400-7002.0060.01280.9890.246.74
PT-Ni-0.25-400-8001.3350.01060.9140.205.58
PT-Ni-0.25-400-9001.2900.00920.9750.174.84
a RhB adsorbed at the equilibrium condition after 60 min. b k1 is the pseudo-first-order rate constant. c Quadratic linear factor for the first-order kinetic constant. d Photocatalytic activity relative to TiO2-P25 in terms of kapp. e Photocatalytic activity relative to direct photolysis in terms of kapp.
Table 5. Comparison between the photoactivity of Ni-based catalysts and TiO2-P25 in terms of the surface atomic fraction on Ni.
Samplesmcat a
(mg)
vsur-cat b
(μmol.mg−1.min−1)
φi c
TiO2-P2562.50.000181.0
PT-Ni-0.1-7001.60.0184104.6
PT-Ni-0.25-6003.10.0461262.1
PT-Ni-0.25-7004.80.0530301.4
PT-Ni-0.25-8005.00.003620.6
PT-Ni-0.25-9003.80.00053.0
PT-Ni-0.5-6003.90.003519.8
PT-Ni-0.5-7005.30.004324.3
PT-Ni-0.5-8003.90.002011.5
PT-Ni-0.5-700-Solar2.30.00031.4
PT-Ni-0.25-400-7001.70.015286.4
PT-Ni-0.25-400-8002.40.006033.9
PT-Ni-0.25-400-9002.80.004324.5
a mcat is the mass of the Ni-based catalysts estimated from the product between the fractional atomic proportion at the surface (at.%) of Ni (Table 2) and the weight of the catalysts (62.5 mg). b rsur-cat is the surface reaction rate estimated by Equation (5). c ji = vsur-cat-i/vsur-TiO2 is the photocatalytic activity normalized against the surface weight of the catalysts and relative to the photoactivity of TiO2-P25.
Disclaimer/Publisher’s Note: The statements, opinions and data contained in all publications are solely those of the individual author(s) and contributor(s) and not of MDPI and/or the editor(s). MDPI and/or the editor(s) disclaim responsibility for any injury to people or property resulting from any ideas, methods, instructions or products referred to in the content.

