Article

Low-Temperature Hydrothermal Modification with Fe/C Catalysts for Enhancing Corn Stover Anaerobic Digestion Performance and Modeling Development for Predicting Biomethane Yield

1
State Key Laboratory of Chemical Resource Engineering, Department of Environmental Science and Engineering, Beijing University of Chemical Technology, Beijing 100029, China
2
Beijing Center for Environmental Pollution Control and Resources Recovery, Beijing University of Chemical Technology, Beijing 100029, China
*
Author to whom correspondence should be addressed.
Catalysts 2025, 15(4), 362; https://doi.org/10.3390/catal15040362
Submission received: 6 March 2025 / Revised: 2 April 2025 / Accepted: 5 April 2025 / Published: 8 April 2025
(This article belongs to the Section Environmental Catalysis)

Abstract

:
This study investigated the enhancement of corn stover (CS) anaerobic digestion (AD) performance through low-temperature hydrothermal modification (HM) with Fe/C catalysts and developed two predictive models for biomethane yield (BY). CS was modified with Fe/C at 50 °C and then anaerobically digested. The results indicated that Fe/C significantly improved CS hydrolysis efficiency, indicated by increasing concentrations of glucose, mannose, xylose, and volatile fatty acids (VFAs), which were 1.9, 1.7, 3.0, and 1.8 times higher than those of HM alone, respectively. The enhanced hydrolysis of CS effectively improved AD performance, leading to a BY increase of 25.5% as compared to the control group. The time to reach 90% of the maximum BY (T90) was also reduced by 7 days. Furthermore, the developed GM(1,N) gray system model effectively simulated multi-parameter coupling effects in AD processes under small-sample conditions (n < 20), demonstrating high accuracy (average percentage deviation [APD] = 4.50%) and enabling correlation analysis between modification parameters and BY. The ANN-GA model exhibited superior accuracy in BY prediction. This study demonstrated the effectiveness of low-temperature HM-Fe/C in enhancing BY and the accuracy of two models in predicting BY.

Graphical Abstract

1. Introduction

Corn stover (CS), a lignocellulosic biomass with abundant availability and renewable properties, presented significant potential for clean energy production through anaerobic digestion (AD). The conversion of CS into biomethane not only facilitates sustainable resource utilization but also mitigates fossil fuel dependence [1]. To improve AD performance, optimization strategies generally include substrate feeding regimes, process parameter control, additive supplementation, and substrate modification [2]. However, the inherent recalcitrance of CS structures specifically impedes microbial accessibility to organic components, rendering biomass hydrolysis the rate-limiting step [3]. To enhance CS hydrolysis, chemical, physical, physicochemical, thermal, and biological modification methods have been developed [2,4].
Hydrothermal modification (HM), an environmentally benign approach utilizing water as the sole solvent, has gained prominence due to its avoidance of chemical reagents and equipment corrosion risks. Deng et al. [5] reported that self-hydrolysis of wheat straw at 180 °C for 20 min produced xylan and arabinose oligosaccharides at concentrations of 4.3 g/L and 0.6 g/L, respectively. Nevertheless, conventional high-temperature HM implementations face challenges of excessive energy consumption and elevated capital costs [6]. In contrast, low-temperature HM could reduce the modification effect of biomass [7]. Recent advances have focused on the catalytic enhancement of HM processes. Fe/C catalysts, containing iron-based active components, demonstrate dual functionality: promoting biomass structural modification and directing saccharide conversion. The carbon matrix enhances active site dispersion while serving as an electron mediator to accelerate mass transfer. Jeong et al. [8] found that after Fenton oxidation of Mongolian oak, acacia, and chestnut, Fe remaining in the biomass had an ameliorating effect on the hydrothermal treatment, with a significant increase in the yield of simple sugars to 91.1%. Similarly, Wang et al. [9] improved the enzymatic hydrolysis efficiency of poplar to 77.0% using a magnetic carbon-based solid acid catalyst. Nevertheless, few studies have examined how non-precious metal catalysts affect AD performance after HM of biomass.
The optimization of modification parameters critically influences BY. AD modeling allows a deeper understanding of process dynamics. Some mechanistic models constructed using differential mass balance equations can provide an understanding of substrate degradation pathways and microbial interactions [10]. Kinetic models quantify reaction rates and inhibition effects, providing predictive power for biomethane production at different substrate compositions [11]. Phenomenological models, which prioritize empirical correlations over mechanistic details, are increasingly applied to simulate large-scale AD systems and integrate real-time operational data [12].
For optimization, deterministic frameworks (e.g., gradient-based algorithms and linear programming) leverage precise mathematical relationships to identify global maxima in AD performance [13], while stochastic methods (e.g., genetic algorithms (GA) and particle swarm optimization) accommodate uncertainty and non-linearity inherent in complex biological systems [14]. Response surface methodology (RSM) has been widely applied for AD parameter optimization. Zhan et al. [15] applied RSM to study the effects of the C/N ratio, total solids (TS, %), and biochar addition on the co-digestion of poultry litter and wheat straw. However, RSM was rarely used to optimize biomass modification conditions for hydrolysis enhancement. In addition to RSM, gray relational analysis-based GM (1, N) models require minimal samples for system prediction. Li et al. [16] predicted RS yield from corncob using GM (1, N) with limited experimental data. Artificial neural networks (ANNs) have also shown high prediction accuracy. Jacob et al. [14] optimized the anaerobic co-digestion of potato waste and Pistia stratiotes using an ANN coupled with genetic algorithms (GA), achieving 6% higher accuracy than RSM. However, existing models predominantly focus on AD operational parameters rather than establishing correlations between modification conditions and BY.
Previous studies rarely explored systematic applications of iron-based catalysts for mild biomass modification to enhance AD performance. Furthermore, few investigations established predictive correlations between modification parameters and biomethane yield (BY) that link catalyst-driven biomass alterations with AD outcomes. This study proposed HM-Fe/C for CS modification to improve AD performance and developed GM (1, N) and ANN-GA models to predict BY. The objectives of this study are to (1) evaluate HM-Fe/C-modified CS hydrolysis performance and determine optimal conditions with RSM; (2) evaluate AD performance of CS modified under optimal HM-Fe/C conditions; and (3) develop two models (GM (1, N) and ANN-GA models) to relate the modification parameters to BY predictions.

2. Results and Discussion

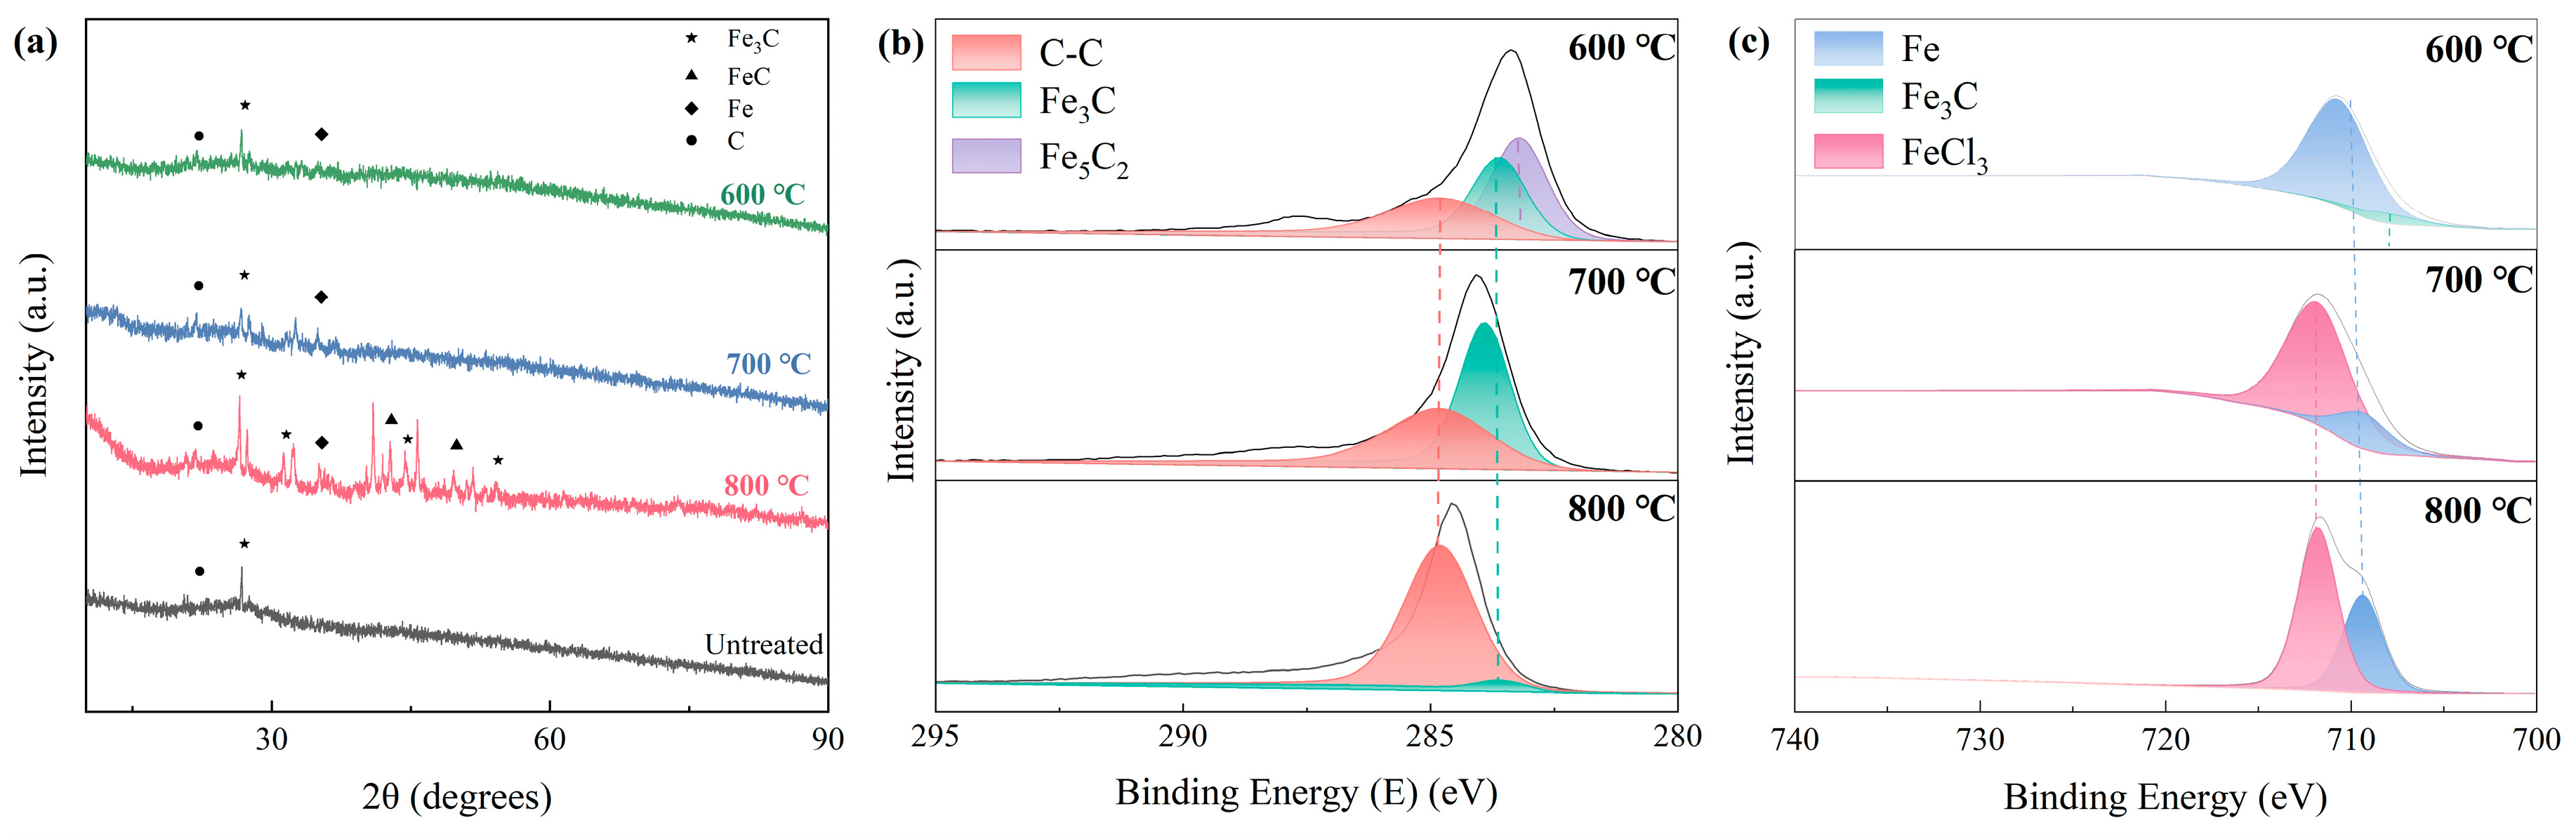
2.1. Characterization of Fe/C Catalysts

The catalysts prepared in this study were obtained by homogeneous deposition of precursors on carbon carrier materials followed by carbothermal reduction treatment, respectively. By varying the roasting temperature, catalysts with different properties can be obtained. The 2θ = 22° of the prepared Fe/C (Figure 1a) XRD shows diffraction peaks, which correspond to the (002) crystal plane of the carbon material. Diffraction peaks of Fe3C and FeC could be observed at 2θ = 27°, 42°, 44°, and 49° for the samples after carbothermal reduction [17]. This proved the successful preparation of Fe/C catalysts. Fe3C was usually the active phase in the catalytic modification of biomass due to its availability of acidic sites and electron transfer capability [18]. In addition, the intensity and sharpness of the diffraction peaks increased with the increase in the treatment temperature, which indicated a more adequate carbothermal reduction reaction and an increase in the crystallinity of Fe/C [19]. After roasting at 800 °C, more carbide phases were formed, but at the same time, the intensity of the diffraction peaks of Fe increased, indicating that the precursor was reduced to metallic Fe at 800 °C [20].
Further surface chemical analyses of Fe/C were performed to reveal the electronic states and chemical environments of the active components of the catalysts under different preparation conditions. By finely resolving the high-resolution spectra of C1s and Fe 2p orbitals, it was possible to clarify the binding energy shifts of the key elements in the catalysts, and thus their oxidation states and coordination environments were inferred, which were essential for understanding the activity and stability of the catalysts [20]. As shown in Figure 1b, the Fe/C catalysts showed significant differences at different carbothermal reduction temperatures, with the peaks of Fe5C2 gradually weakening with increasing temperature and the peaks of Fe3C firstly enhancing and then weakening, which may be due to the decomposition of the Fe5C2 and the formation of the Fe3C [17]. Fe3C and Fe5C2 moved toward lower binding energies with increasing temperature, which may be related to changes in the oxidation state of iron or the formation of carbides. In contrast, in the Fe 2p spectra of Fe/C catalysts (Figure 1c), the intensity of the peaks of FeCl3 was enhanced with increasing carbothermal reduction temperature, which may be attributed to the fact that the content of FeCl3 on the catalyst surface may increase with increasing temperature, allowing XPS to detect its presence more easily [21].

2.2. Hydrolysis Performance and Optimization of HM-Fe/C

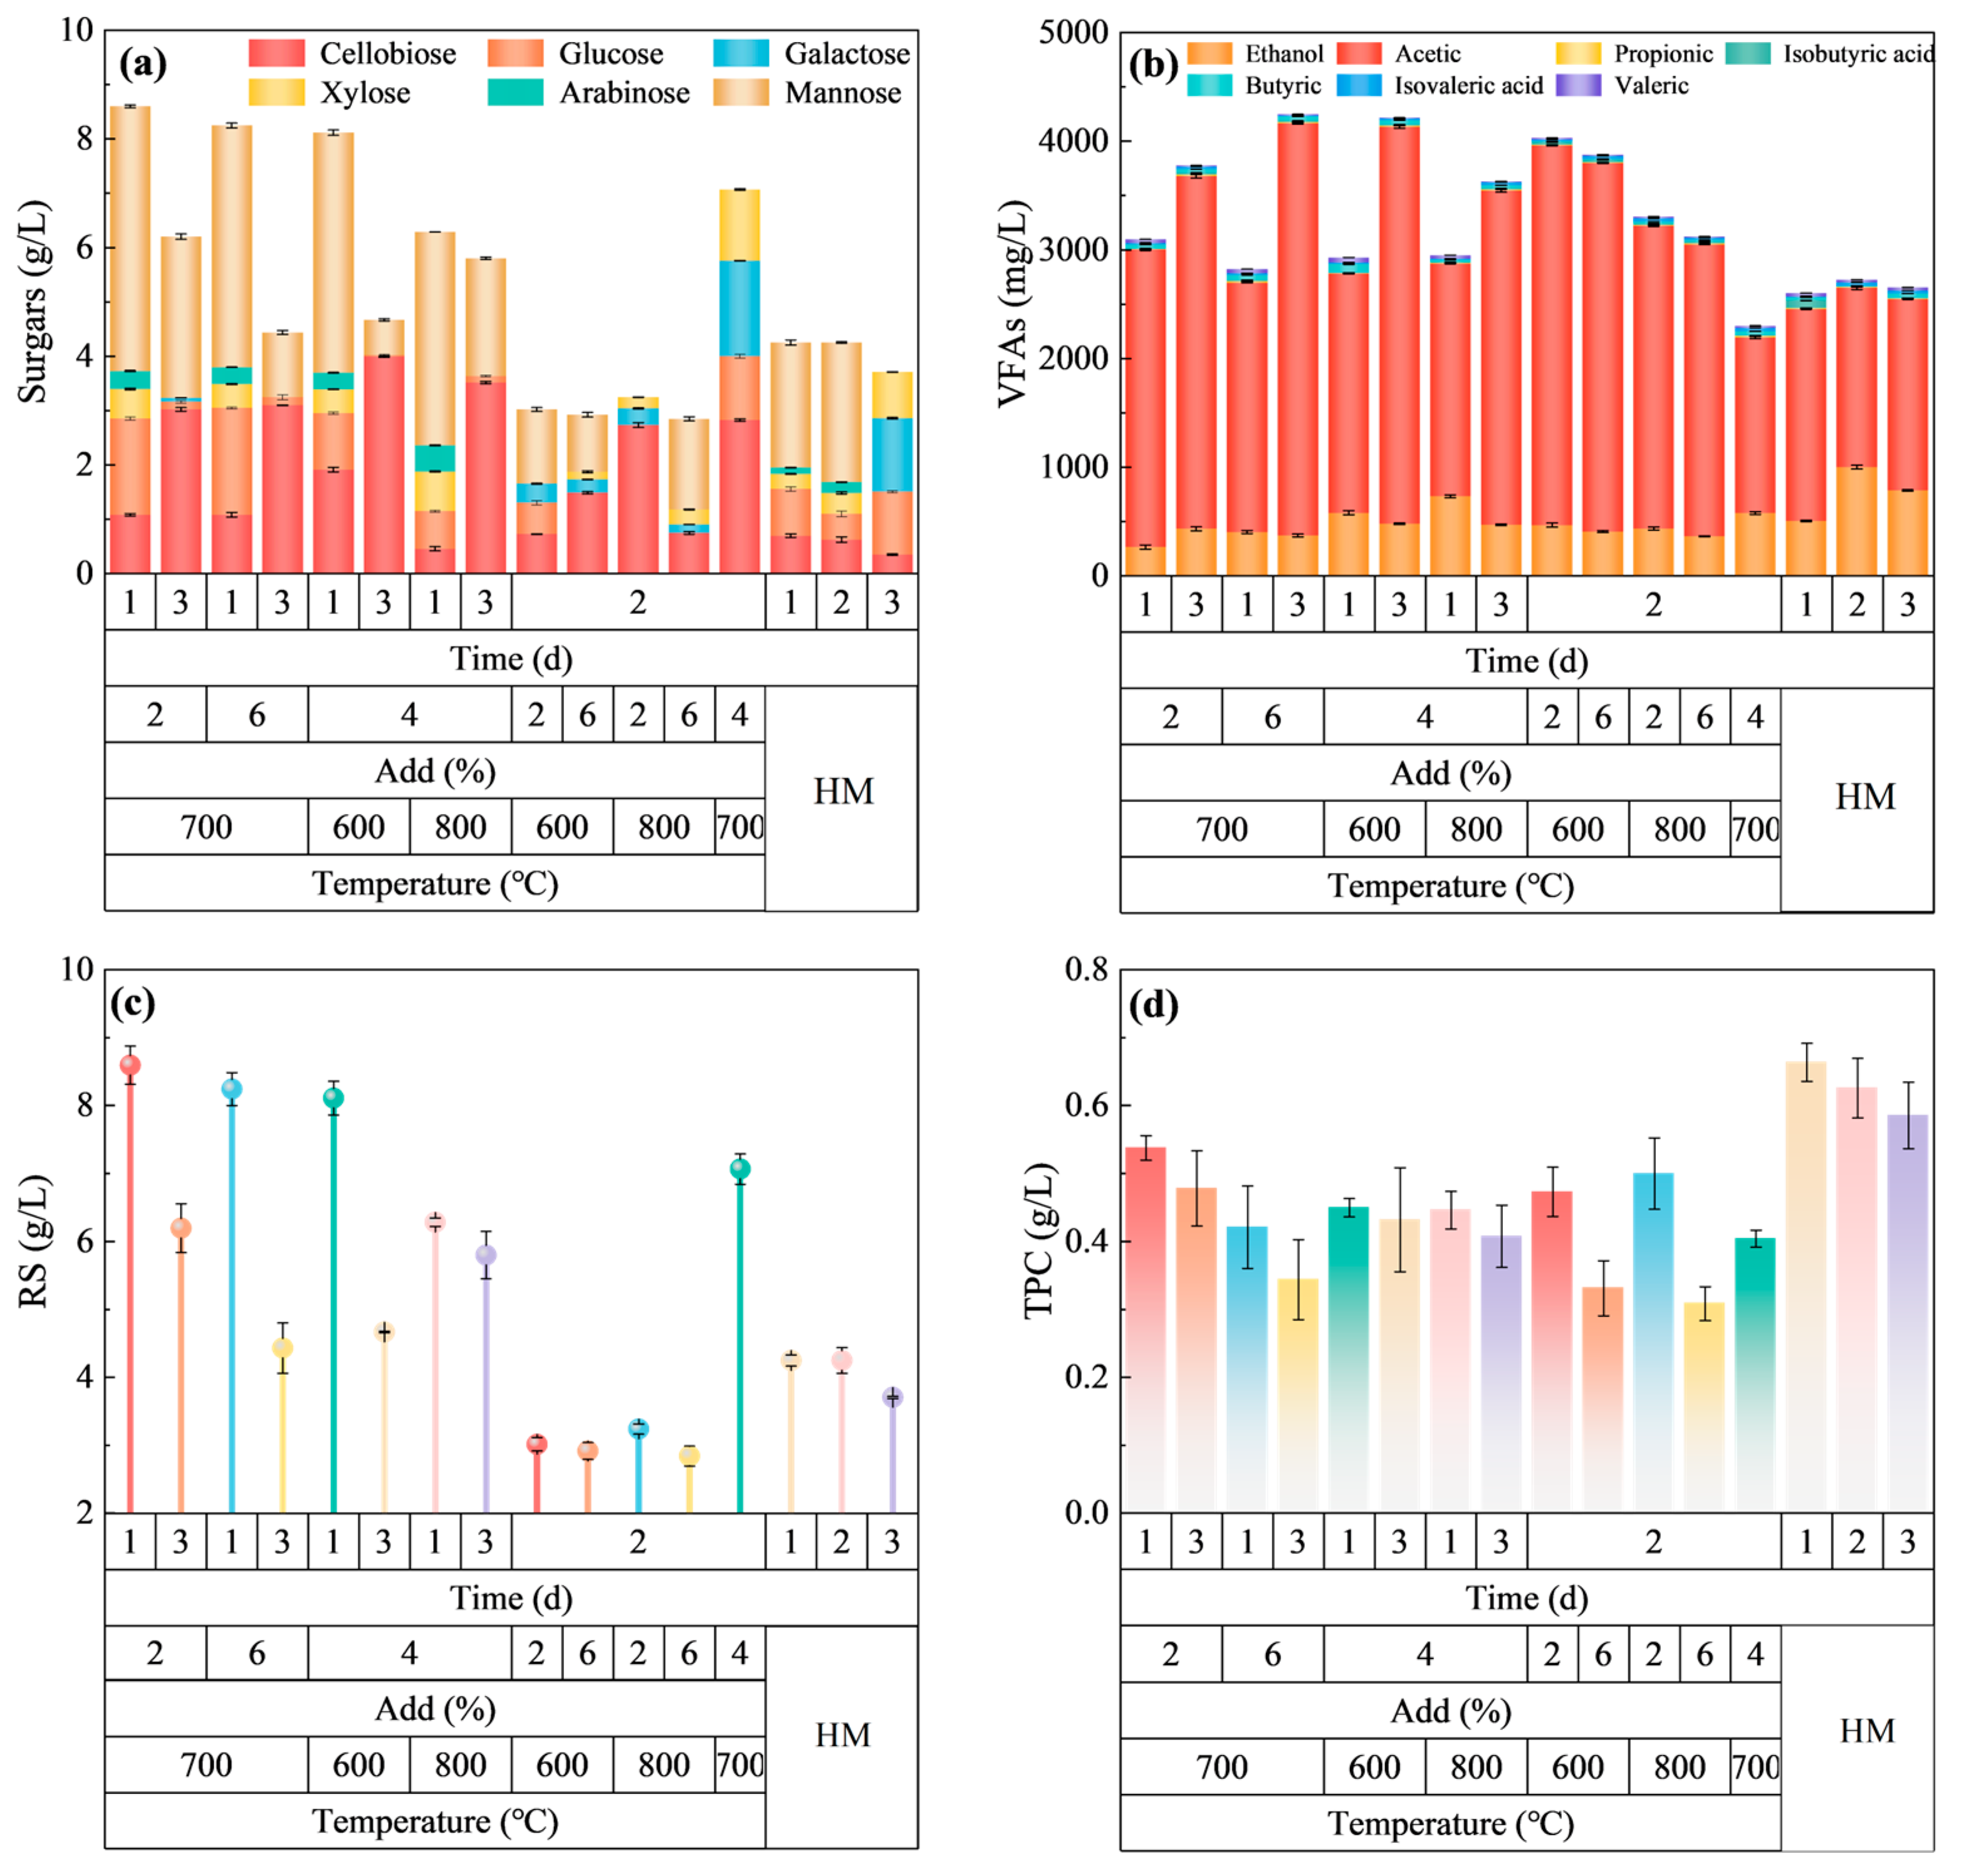
2.2.1. Hydrolysis Products After HM-Fe/C

Mild modification of CS before the AD process aimed to enhance cellulose exposure by Fe/C composites in aqueous systems [22]. This targeted bond disruption preferentially liberated hemicellulose fractions while preserving lignin structural integrity, thereby achieving dual objectives: enhancing cellulose accessibility for hydrolytic enzymes during subsequent AD and minimizing phenolic compound generation that could inhibit methanogenic archaea.
The main components of sugars in the hydrolysis products after mild modification are shown in Figure 2a. The concentration of the major monosaccharides, except for cellobiose, gradually decreased with increasing modification time. This observation aligned with the proposed catalytic mechanism. The Lewis acidic Fe sites facilitated glycosidic bond scission in hemicellulose via proton transfer pathways (see Section 2.1), effectively reducing hydrolysis activation energy [23]. It would preferentially modify the hemicellulose components and release monosaccharides such as glucose, xylose, mannose, galactose, and arabinose. Furthermore, as the treatment progressed, such sugars were more easily converted to short-chain acids in an acidic environment (H+ generated during hydrothermal processes), as illustrated in Figure 2b. The recalcitrance of cellulose to low-temperature hydrolysis primarily originated from its robust hydrogen-bonding network, where both intra- and inter-molecular hydrogen bonds collectively stabilize the crystalline structure, effectively suppressing glucose liberation below 200 °C [24]. This structural constraint rendered cellulose virtually non-hydrolyzable under the mild pretreatment conditions (50 °C), thereby significantly impeding cellobiose generation—a critical intermediate in cellulose modification [25,26]. The concentration of cellobiose after 3 d of modification with the addition of 4% Fe/C-600 amounted to 3.9 g/L, which was 12 times higher than that of the hydrothermal group (0.3 g/L), suggesting that the addition of catalysts has obvious promotion effects. The cellobiose yield achieved surpassed conventional hydrothermal systems requiring >180 °C (compared with Yu et al. [27]), demonstrating the energy efficiency advantage of this Fe-C catalytic strategy. This was attributed to the fact that the mesoporous structure of the carbon carrier provided a spatially confined environment, which induced the twisted deformation of the cellulose molecular chain and weakened the intramolecular hydrogen bonding [28]. Meanwhile, Fe/C could enhance cellulose C-O bond modification through interfacial charge transfer and promote glycosidic bond breaking [29].
In addition, during the modification of CS, the cleavage of acetyl groups on the side chains of hemicellulose would be converted to acetic acid, which in the solvent (water) would also act as a catalyst to promote the conversion of oligosaccharides to produce pentoses and hexoses, and these monosaccharides would be further converted to VFAs under the action of H+ [23]. The content was elevated with the prolongation of the modification time. The highest VFAs could be achieved by the addition of 6% Fe/C-700 for 3 d, up to 4243 mg/L, which was 1.6 times higher than that of the hydrothermal group (2650 mg/L). In addition, the percentage of acetic acid in the test group with added Fe/C was basically above 80.0%, with a maximum of 89.4%, which was higher than that of the hydrothermal group. The acetic acid could be rapidly converted into biomethane in the subsequent AD period, which could promote the process of substrate hydrolysis and acidification and alleviate the acidification phenomenon that occurred in raw materials due to the difficulty of decomposition [3].
Meanwhile, as shown in Figure 2d, the TPC was 0.3–0.5 g/L, which was lower than the inhibitory concentration of AD [22], suggesting that mild modification reduced the degradation of lignin, which would be beneficial for subsequent AD.

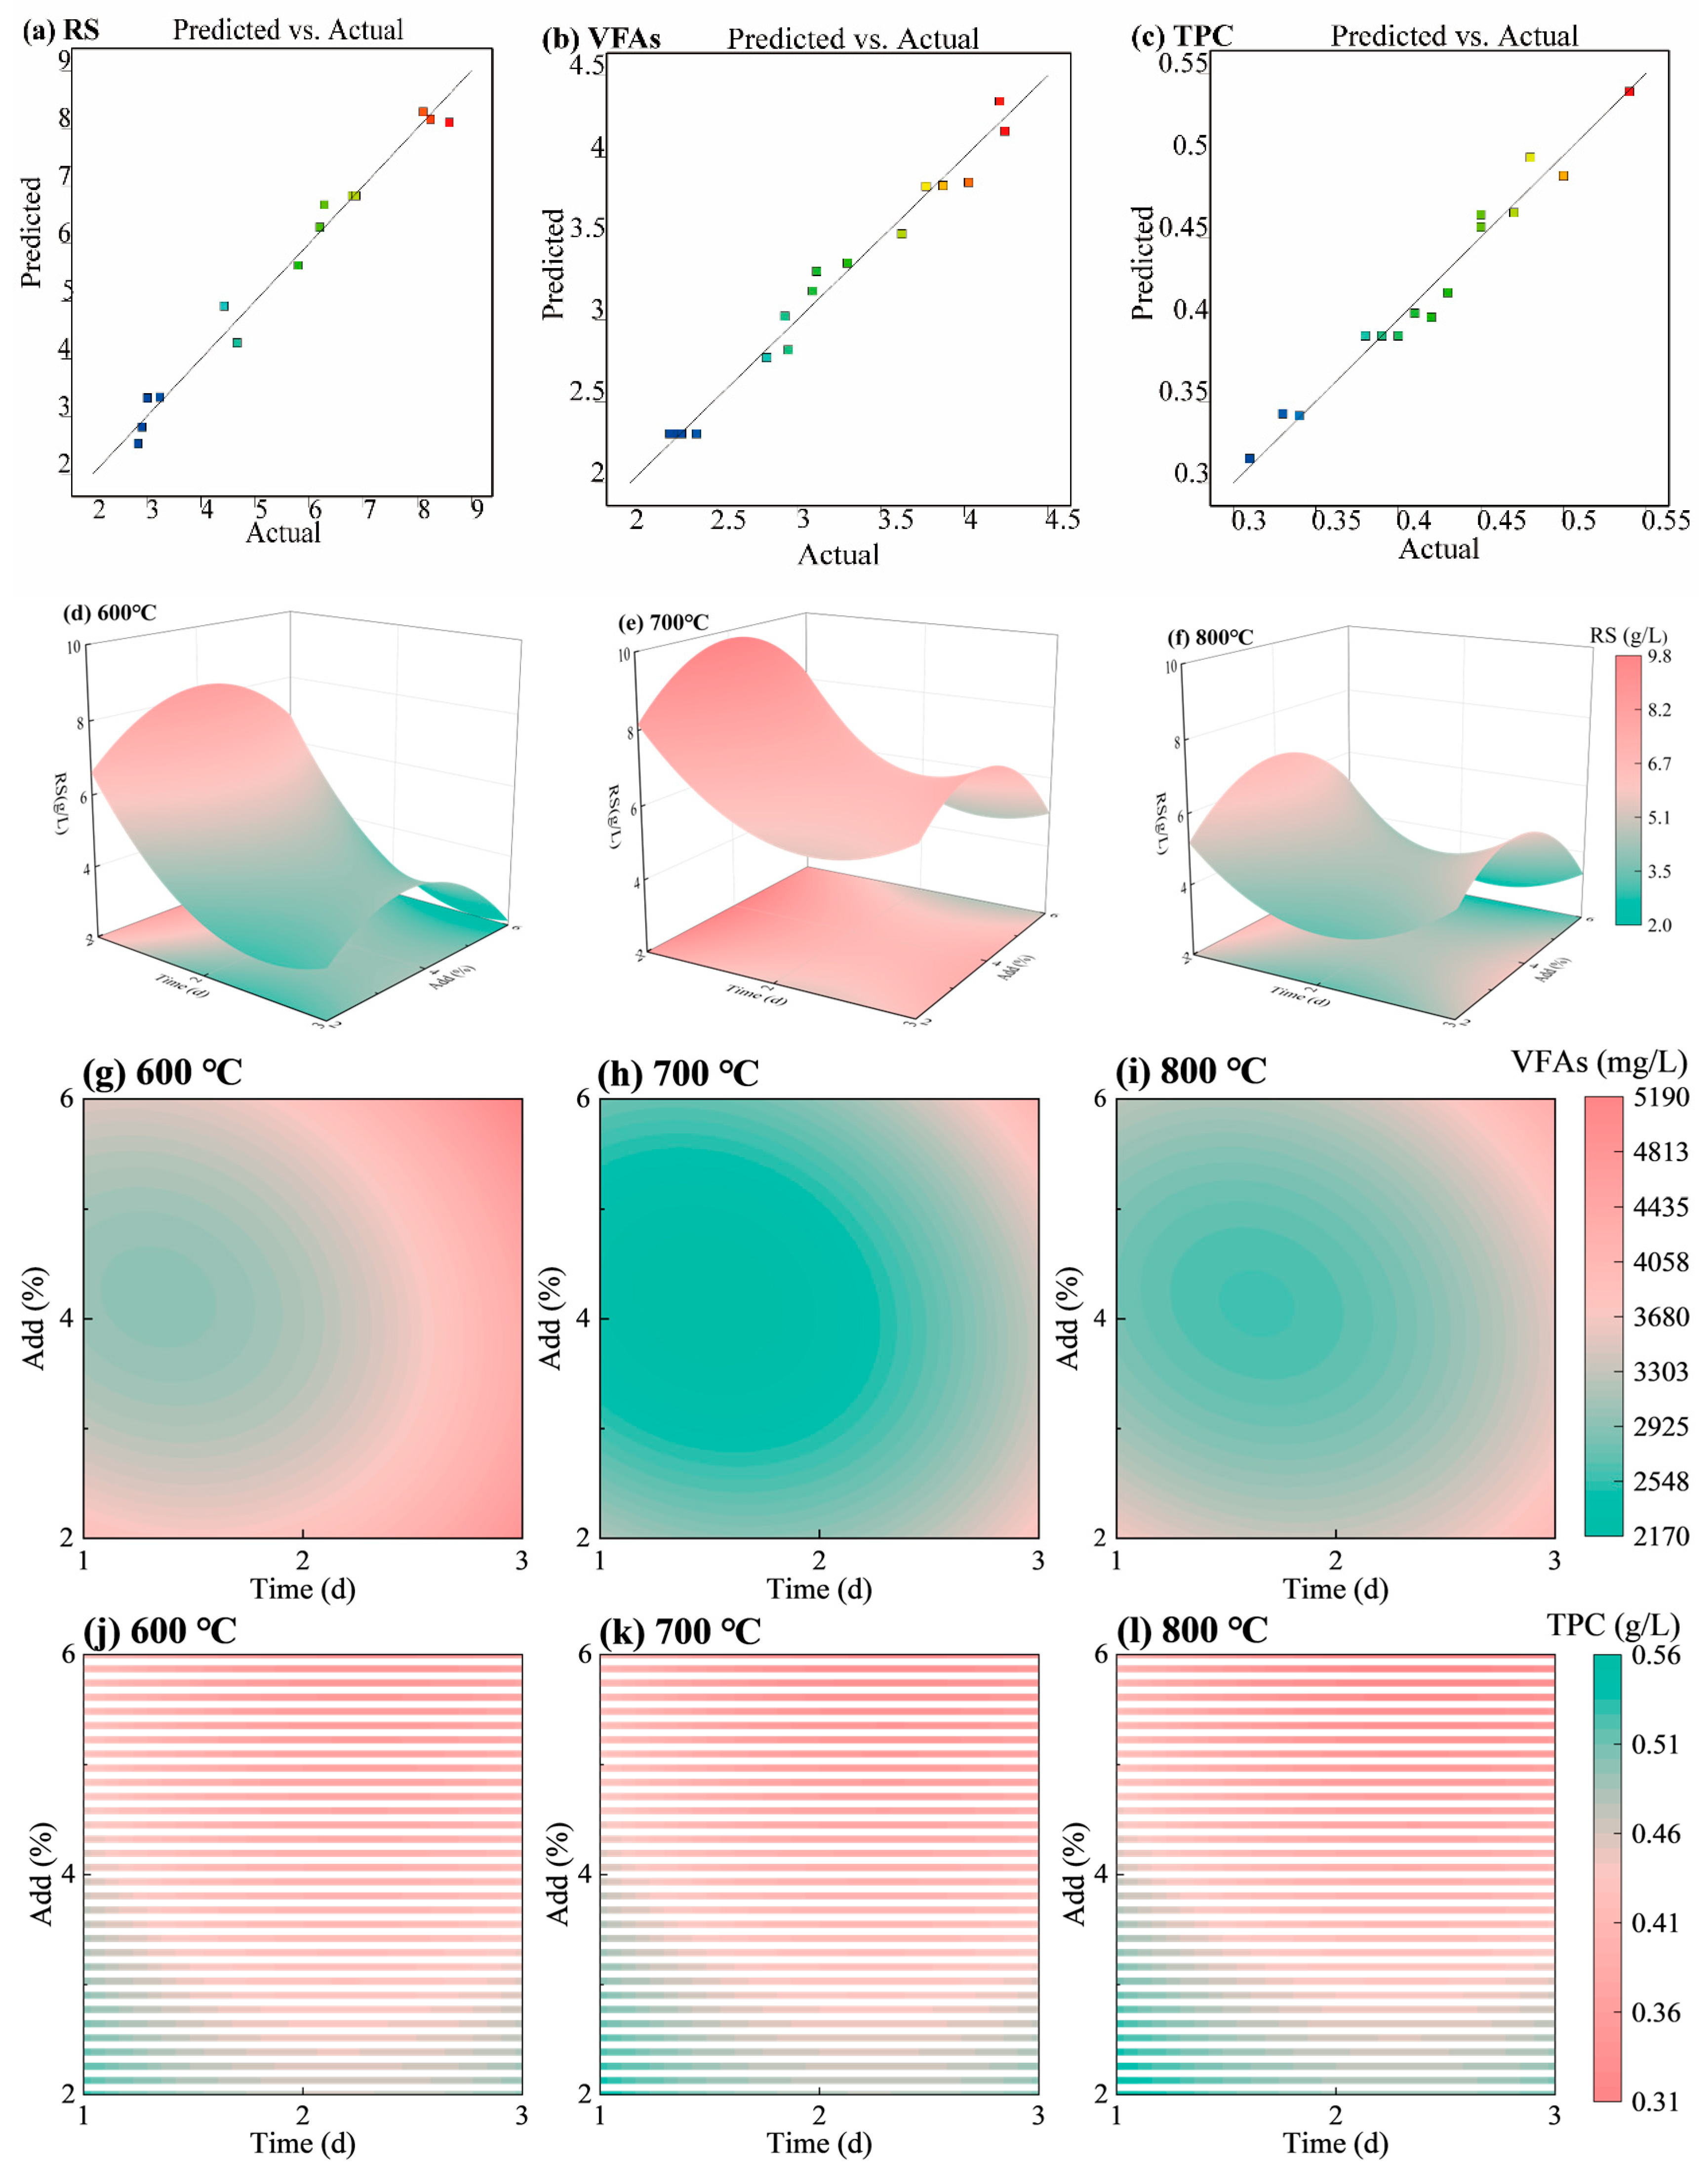
2.2.2. Optimization of HM-Fe/C Process by RSM

Based on the results of the response surface tests, a second-order quadratic regression model was constructed to fit the responses of RS, VFAs, and TPC, respectively, using Design Expert 12.0.3.0 software (Stat-Ease Inc., Minneapolis, MN, USA). The obtained models were described by the actual Equations (1)–(3).
R S = 91.85 12.19 × x 1 + 3.66 × x 2 + 0.30 × x 3 0.18 × x 1 × x 2 + 0.01 × x 1 × x 3 0.00038 × x 2 × x 3 + 0.16 × x 1 2 0.40 × x 2 2 0.000225 × x 3 2
V F A s = 36297.30 857.82 × x 1 1498.44 × x 2 84.96 × x 3 + 93.27 × x 1 × x 2 1.52 × x 1 × x 3 0.04 × x 2 × x 3 + 513.33 × x 1 2 + 166.35 × x 2 2 + 0.061 × x 3 2
where x1, x2, and x3 are modification time (d), Fe/C addition (%), and calcination temperature (°C), respectively.
Through ANOVA (see Table 1), it was observed that the F > 1 and p < 0.001 for the three models indicated that the regression effect of the models was highly significant. r2 > 0.9 indicated a high degree of fit between the models and the data with a small error. And, the C.V.% of the model < 10% and Adeq precision > 4 proved the high precision of the model. As shown in Figure 3a–c, the distribution of modeling data points that closely matched the experimental data indicated the same results. In summary, the model predictions were well fitted to the test values with high accuracy and confidence.
The interaction between modification time and Fe/C addition at different calcination temperatures and its effect on the target output (RS) was analyzed, as shown in the 3D surface plots in Figure 3d–f. The results showed that modification time had a significant effect on RS (p < 0.0001). As modification time increased, RS initially decreased and then slowly increased, reaching its lowest value around 2.5 d. This may be related to the gradual conversion of monosaccharides, derived from hemicellulose decomposition into VFAs. The increase in RS at 3 d was related to the conversion of a very small fraction of cellulose, as shown in Figure 3. The effect of the addition on RS was also significant (p < 0.05). As the added amount increased from 2% to 6%, RS first increased and then decreased, reaching the highest value around 4%, which was consistent with the study by Zhang et al. [6]. Moreover, the effect of different Fe/C calcination temperatures on the RS was in the following order: 700 °C > 600 °C > 800 °C.
During HM, the acetyl group on the hemicellulose chain was cleaved under the action of H+ generated by hydrolysis, forming acetic acid in an aqueous solution. Some of the monosaccharides formed by hemicellulose hydrolysis were also converted to VFAs dissolved in solution. Thus, VFAs may reflect the degree of dissociation of hemicellulose acetyl and ether linkages. As shown in Figure 3g–i, modification time had a significant effect on VFAs (p < 0.0001). VFAs gradually increased with increasing time, while the amount of Fe/C added had a smaller effect on VFAs. The effect of different calcination temperatures of Fe/C on VFAs followed in the order of 600 °C > 800 °C > 700 °C (p < 0.01). As shown in Figure 3j–l, modification time (p < 0.01) and Fe/C addition (p < 0.0001) had significant effects on TPC. Increasing Fe/C addition was conducive to stabilizing lignin degradation and TPC production.
In conclusion, when studying the effect of CS modification and its AD performance, the separation of cellulose, hemicellulose, and lignin, as well as the cleavage of ether and ester bonds, must be comprehensively considered.

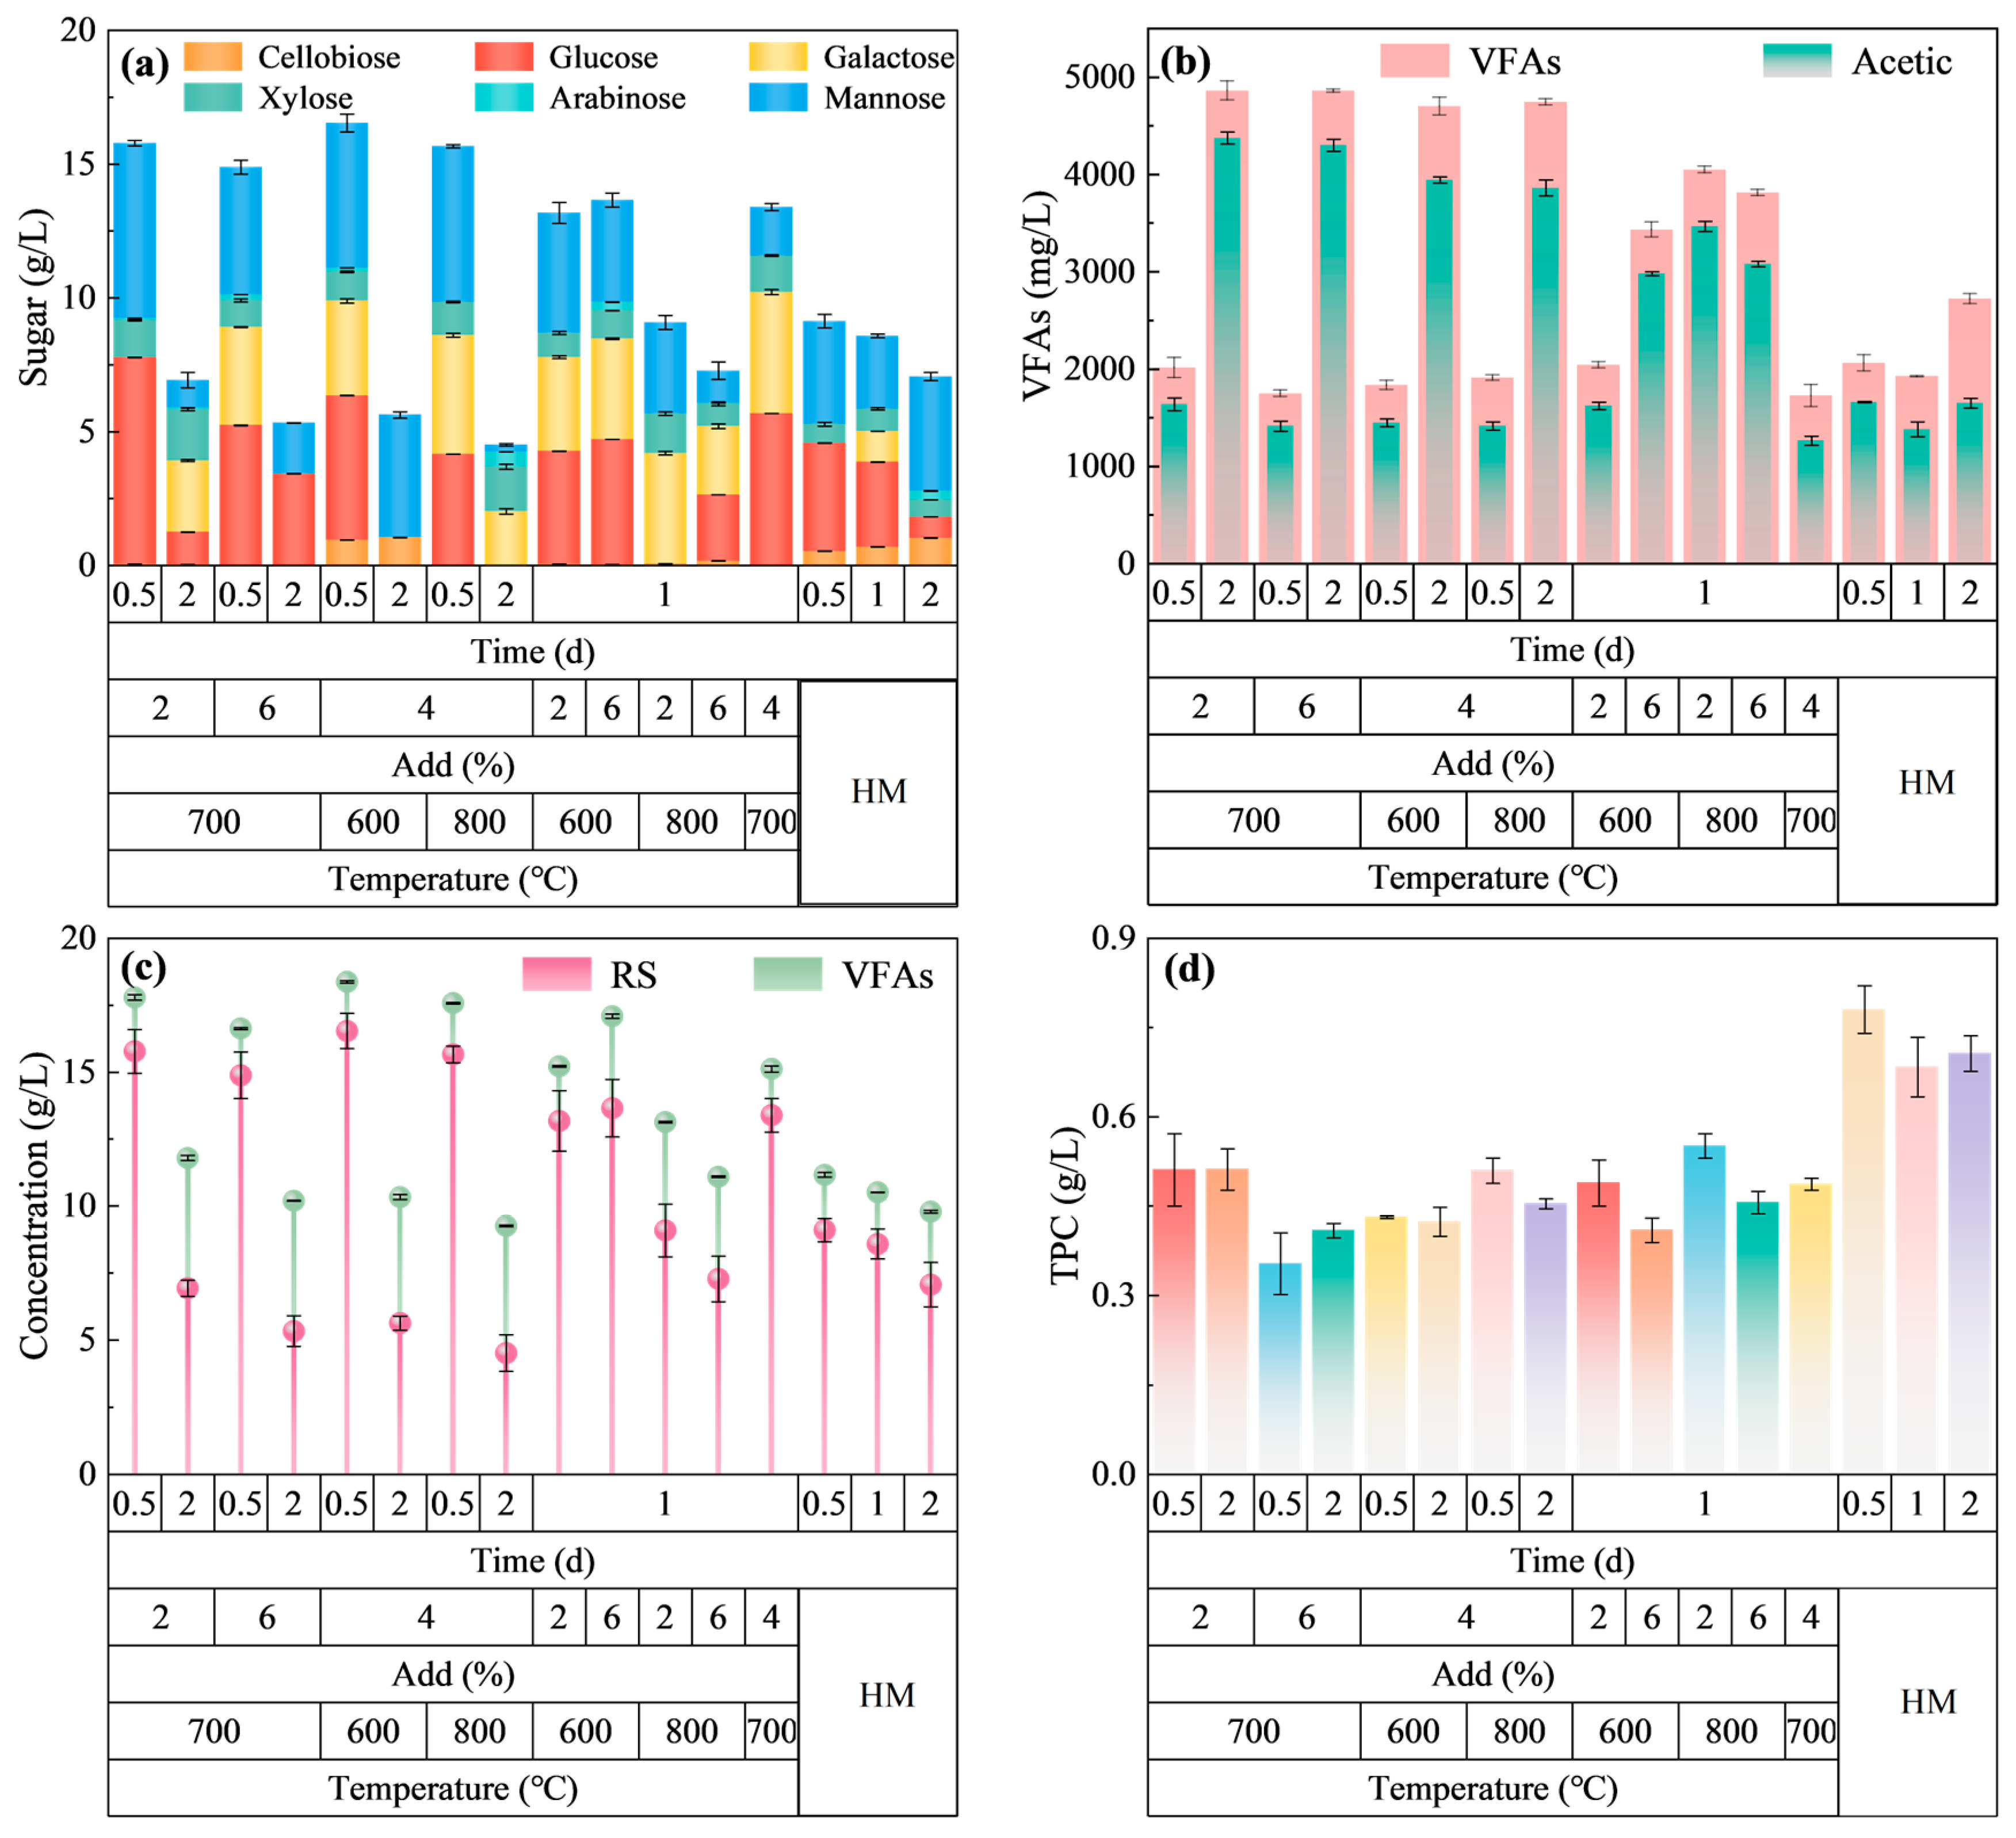
2.2.3. Hydrolysis Performance of HM-Fe/C After Optimization

RSM analysis in Section 2.2.2 revealed that modification time was the most statistically significant factor (F > 50, p < 0.0001). Consequently, the time parameters were optimized to maximize the yield of sugar (e.g., RS) and acids (VFAs) while minimizing the concentration of inhibitory compounds (e.g., TPC) in hydrolyzed products. The changes in the hydrolyzed products of CS after optimizing the mild modification time are depicted in Figure 4. After 0.5 d of modification with 2% Fe/C-700, the glucose (7.7 g/L) and mannose concentration (6.5 g/L) were the highest, which were 1.9 and 1.7 times those of HM-0.5d, respectively. After 2 days of modification with 2% Fe/C-700, the xylose concentration (1.9 g/L) reached its maximum value, which was 3.0 times that of HM-2d. This suggested that during the conversion of hemicellulose in CS, the glucose and mannose units connected by β-1,3 and β-1,4 glycosidic bonds on the side chains were rapidly converted, while the xylose units connected by β-1,4 glycosidic bonds on the main chain were converted slightly later. This was because short-chain polysaccharides are more easily degraded, and the H+ generated from their conversion also promoted the deconstruction of the main chain, thereby facilitating the generation of xylose. This finding was consistent with the studies of Chen [30] and Zhang et al. [31]. It was also observed that the sugar concentration in the modification group treated with Fe/C for 0.5 d was higher than that of HM-0.5 d, indicating that the addition of a catalyst helped the cleavage of glycosidic bonds and the conversion of hemicellulose.
During the modification of CS, the acetyl groups on the hemicellulose side chains were cleaved to form acetic acid, which acts as a catalyst in the solvent (water) to promote the conversion of oligosaccharides into pentoses and hexoses. These monosaccharides are further converted into short-chain fatty acids under the influence of H+. After 2 days of treatment with 2% Fe/C-700, the VFAs reached their highest value (4863 mg/L), which was 1.8 times that of HM-2d (2722 mg/L). After 2 days of treatment with 4% Fe/C-600 and 4% Fe/C-800, the VFA concentrations were 4702 and 4745 mg/L, respectively, which were 1.7 times that of HM-2d. This demonstrated that the addition of Fe/C had a significant effect on the mild modification process. Additionally, after 2 days of modification with 2% Fe/C-700, the acetic acid concentration accounted for as high as 90.0% of VFAs, which was 29.3 percentage points higher than that of HM-2d (60.7%). This indicated that the catalyst can also promote the conversion of short-chain fatty acids into acetic acid, which was beneficial for the rapid progression of the hydrolysis and acidogenesis stages in anaerobic digestion.

2.3. Anaerobic Digestion Performances of CS by HM-Fe/C

The BY, quantified as cumulative unit volatile solids (VS) biomethane production, intuitively reflected the efficiency with which raw materials were converted into biomethane during the AD process. Additionally, the T90 metric indicated the time (d) required for the cumulative biomethane yield to reach 90% of the maximum biomethane yield [4]. The biomethane yield, increase rate, and T90 are shown in Figure 5.
The gas production patterns of the mild modification groups, which varied by Fe/C calcination temperature, were fundamentally similar. As the mild modification time was shortened (from 2 d to 0.5 d) and the addition amount was increased (from 2% to 6%), the biomethane yield gradually increased. The highest biomethane yield was 183 mL/g VS, observed in the 700 °C-6%-0.5d and the 600 °C-4%-0.5d group. This represented a 25.5% and 13.1% increase compared to the control group (146 mL/g VS) and the hydrothermal group (162 mL/g VS), respectively. Lu et al. [4] reported a 19.6% enhancement in biomethane yield from CS using urea-assisted HM at 95 °C, which was lower than this study. This demonstrated the superior performance of the Fe/C-based approach compared to conventional acid/alkali modification methods, likely due to its synergistic catalytic effects while avoiding harsh chemical treatments. Moreover, as the Fe/C calcination temperature rose, the impact of addition amount and modification time on biomethane yield diminished, likely due to the deposition of Fe on activated carbon following the increase in calcination temperature [22]. This finding aligned with the catalyst analysis presented in Section 3.1.
As shown in Figure 5a, the T90 of the mild modification group was 16–22 d, which was 1–7 d earlier than that of the control group (23 d) and generally earlier than that of the hydrothermal group (21–24 d). The difference of the same additive amount in the mild modification group (2%: 22 d; 4%: 16–19 d; and 6%: 16–17 d) was relatively small. This indicated that the mild modification not only improved the biomethane production potential of CS but also effectively accelerated the AD process [32].

2.4. GM (1,N) and ANN-GA Modeling for BY Prediction

2.4.1. Construction of the GM (1, N) Model

A GM (1,6) gray system model was developed to characterize the relationship between biomethane yield (dependent variable) and five key process parameters (RS, VFAs, TPC, mannose, and cellobiose concentrations). Thereby, the model structure comprised six variables in total. The gray parameters were initially calculated based on the experimental data from samples 1 to 13. Subsequently, the experimental data from samples 1 to 10 and 1 to 12 were employed to assess the accuracy of the developed model. The derived system parameters governing the gray relationships are mathematically represented in Equation (4).
(a, b1, b2, b3, b4, b5) = (1.85, 17.95, 51.78, −72.78, −4.21, 28.67)
The GM (1,6) model predicted biomethane yield with an APD of 4.50%, indicating that the model showed high accuracy. a = 1.85 was the developmental parameter of the CS mild modification–AD system and bi (i = 1,2,3,4,5) was the driving parameter of the system that determined the effect of RS (b1), VFAs (b2), TPC (b3), and the mannose (b4) and cellobiose (b5) concentrations on biomethane yield. It could be found that the driving coefficients b1, b2, and b5 were greater than 0, indicating that these influences showed a positive effect on biomethane yield to some extent; whereas b3 and b4 were less than 0, indicating that they showed a negative effect on biomethane yield, which was in agreement with the results of Lu et al. [33]. In addition, |b3| (TPC) was greater than the other parameters, indicating that TPC was the most important parameter in the AD system of mild modification CS, followed by VFAs, RS, and cellobiose.
The effect of the number of test groups on the prediction accuracy of GM (1,6) in the CS mild modification–AD system was also analyzed. The gray parameters of the GM (1,6) model were calculated based on the data of groups 1–8, 1–10, and 1–12 to predict the biomethane yield for the last five samples, the last three samples, and the last one sample, respectively. The results of comparing the experimental and predicted values for different sample sizes are shown in Supplementary Materials Figure S1. The APDs of the GM (1,6) model obtained for the data of groups 1–8, 1–10, 1–12, and 1–13 were 5.69%, 5.79%, 5.28%, and 4.50%, respectively. The results of the gray parameters computed for groups 1–8, 1–10, and 1–12 are shown in Equations (5)–(7).
(a, b1, b2, b3, b4, b5) = (1.66, 16.53, 57.67, −197.41, 3.88, −7.42)
(a, b1, b2, b3, b4, b5) = (1.73, 13.26, 52.65, −106.70, 9.21, −6.80)
(a, b1, b2, b3, b4, b5) = (1.81, 15.64, −115.46, 3.90, 9.41)
It could be found that the relative effects of the three influencing factors (RS, VFAs, and TPC) on biomethane yield obtained from different numbers of samples were similar: |b3| > |b2| > |b1|. Thus, the GM (1,6) model developed in this study suggested that adjusting and controlling the concentrations of TPC, VFAs, and RS generated by mild modification can be effective in improving biomethane yield.

2.4.2. Construction of the ANN-GA Model

The ANN-GA modeling training was conducted by a neural network (ANN) in the MATLAB R2024a toolbox (MathWorks, Natick, MA, USA, 2024), followed by parameter optimization employing the genetic algorithm (GA), with the results depicted in Figure S2. The model was optimized for five mild modification parameters (RS, VFAs, TPC, mannose, and cellobiose) to fit the biomethane yield.
The ANN model used a 5-10-1 network topology, corresponding to the number of neurons in the input, hidden, and output layers, respectively. To better fit the biomethane yield through the ANN model, the parameters of the ANN neural network were optimized to reduce the bias using the GA algorithm, and the optimized neural network was trained and tested to evaluate the performance of the neural network [34]. As shown in Figure S2a–c, the regression correlation coefficients (R2) of the training, testing, and total sets were 0.9926, 1.0, and 0.9926, respectively, and the RMSEs were 0.6926, 0.333, and 0.6282, respectively. The tight linear relationship between the predicted values and the test values indicated that the model was very stable. Mougari et al. [35] used 369 sets of data to were fitted; thus, there may be overfitting in the test set in this fit, but the low RMSE values indicate that the prediction error of the model is still within acceptable limits.
In addition, the variation of the mean square error (MSE) with the number of iterations (epochs) during training (Figure S2d) showed that the best validation performance is reached at the first iteration, with an MSE of 0.00030445, which suggested that the model has already achieved good performance in the early iterations due to the fact that the GA algorithm, by optimizing the ANN structure and parameters, allowed the model to perform well in both training and testing phase with good performance.
Overall, the ANN-GA model performs well in the CS mild modification–AD performance system, which overcomes the cumbersome trial-and-error design process of the ANN and ensures the model’s generalization ability and robustness.

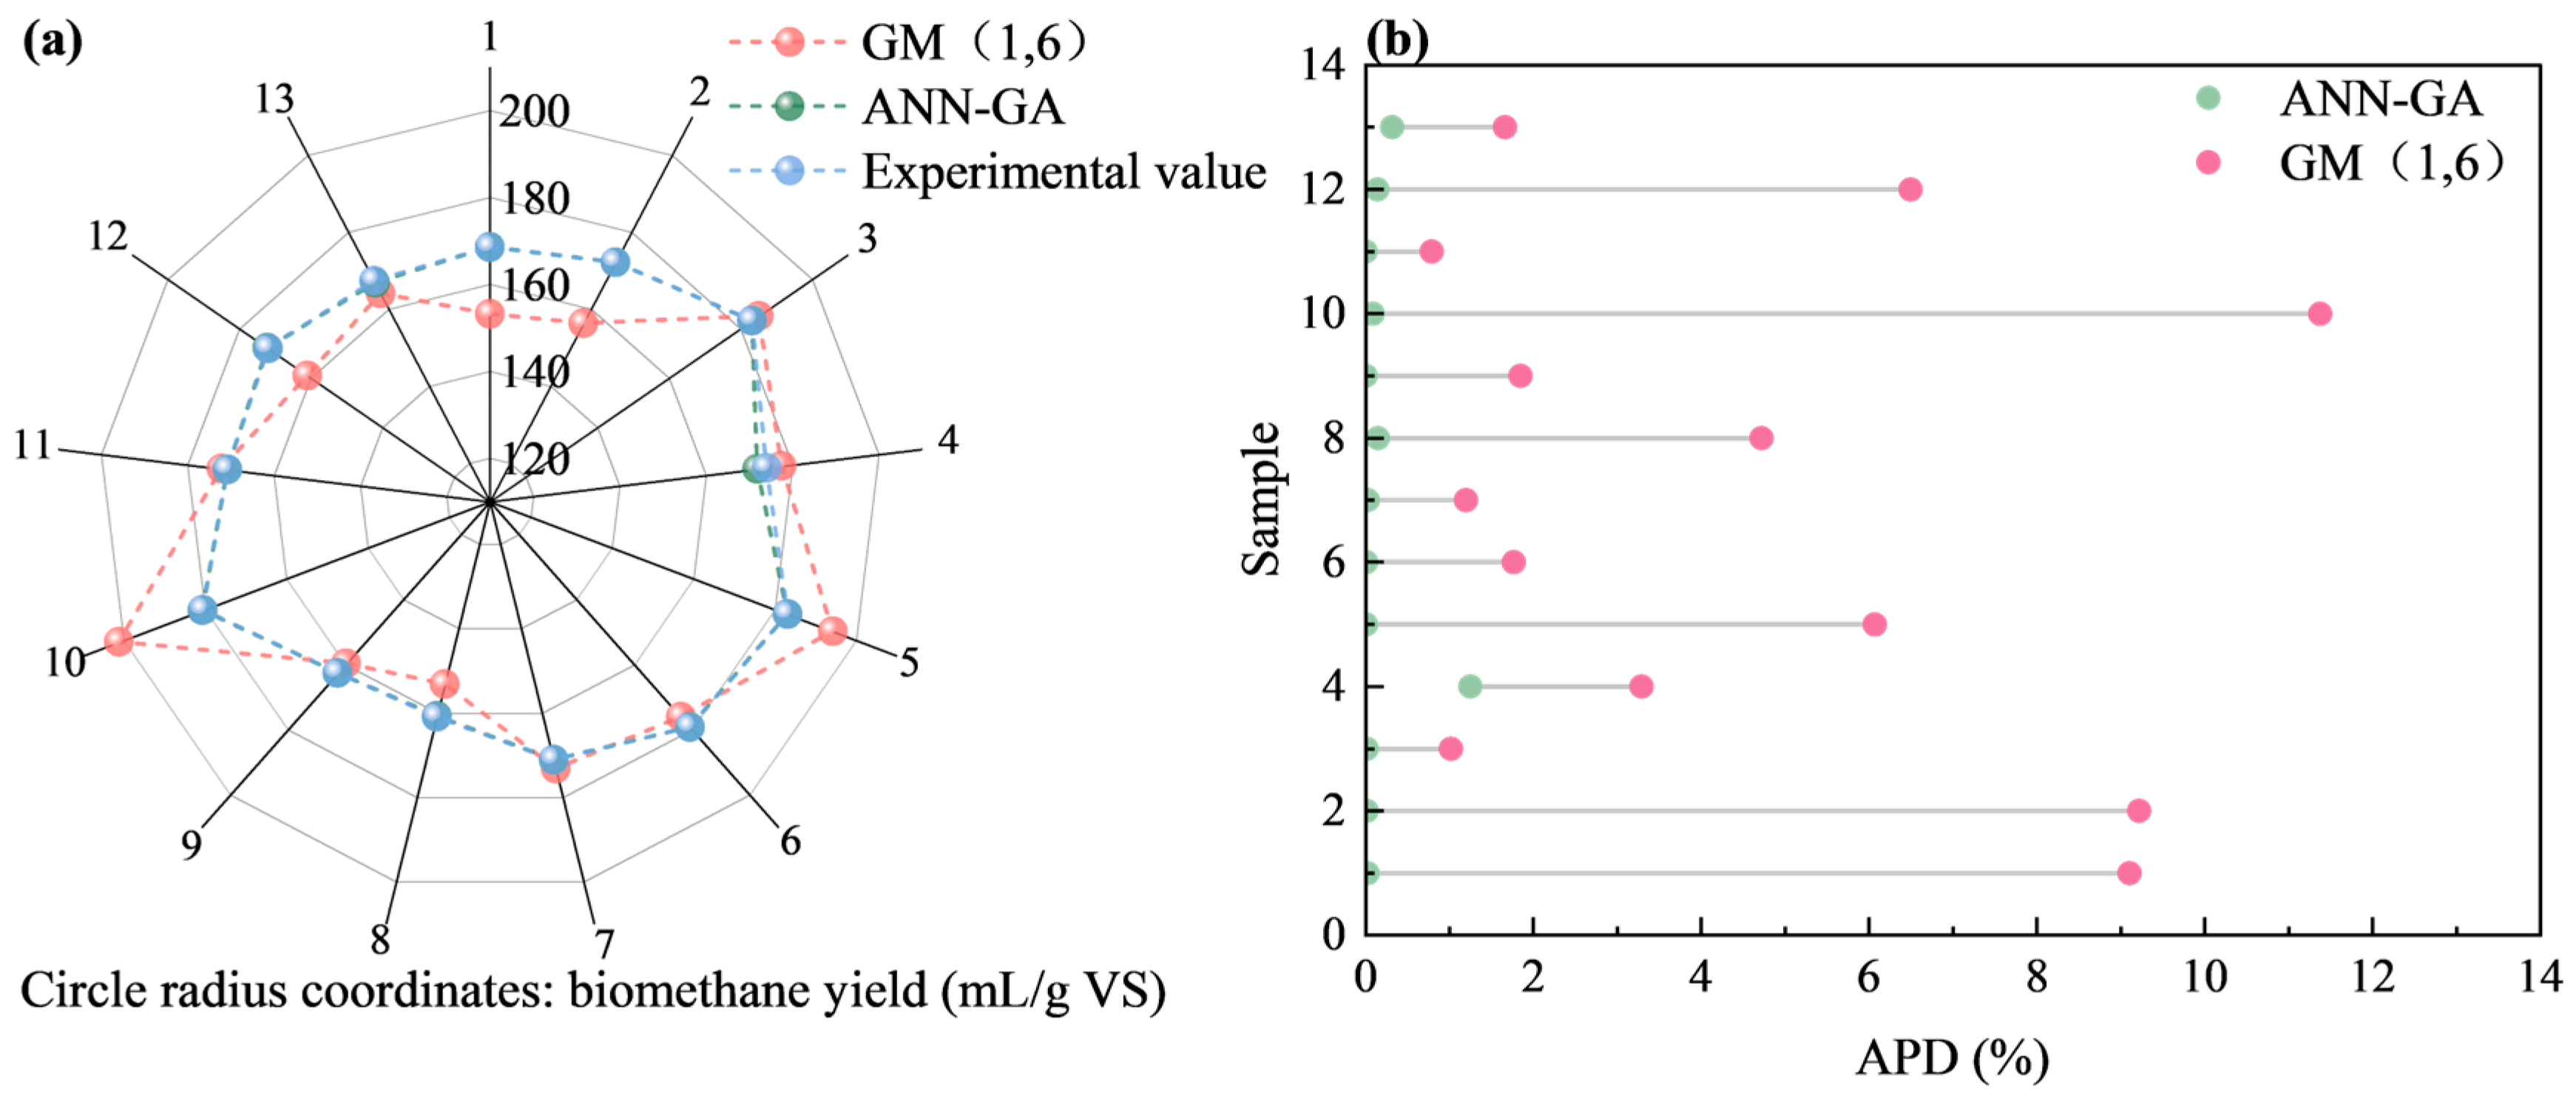
2.4.3. Comparison of the GM (1, N) and ANN-GA Models

The biomethane yield was modeled and optimized by GM (1,6) and ANN-GA based on the experimental data of CS mild modification–AD. The modeling results were compared and validated, as shown in Figure 6. Both the GM (1,6) and ANN-GA models were close to the experimental values in most dimensions, although some discrepancies were observed. The average absolute percentage deviation (APD) of the GM (1,6) model was 4.50%, which varied significantly across different samples. In contrast, the mean APD of the ANN-GA model was relatively small and stable at 0.15% and significantly higher than the prediction accuracy (17.80%) of the Li et al. [16] neural network model. This indicated that the ANN-GA model exhibited greater stability in its predictions.
The GM (1, N) model is a dynamical model based on gray system theory, which measures the influence relationship between factors through gray correlation and uses mathematical and statistical methods to predict and analyze the behavior of the system. On the other hand, the ANN-GA model, through artificial intelligence techniques, can understand the complex interrelationships (especially non-linear relationships) between the input and output data and model them without the need for prior knowledge and any complex solution mathematical equations. One of the limitations of this study was that the experimental data were tested and modeled under limited conditions within the design, which resulted in low prediction accuracy of the GM (1, N) model (Li et al. [16] had an APD of 5.35% in predicting RS production using GM (1, N)) and possible overfitting results of the ANN-GA model, with similar results found by Zhan et al. [15].
In general, the GM (1, N) model can be used to evaluate the polarity and magnitude of the influence of each driver and to make systematic predictions when the exact mechanism of the study system is unknown when there are relatively few sample trials, whereas robust predictions based on a large amount of sample data can be made with more accurate generalization of complex non-linear results through ANN-GA modeling.

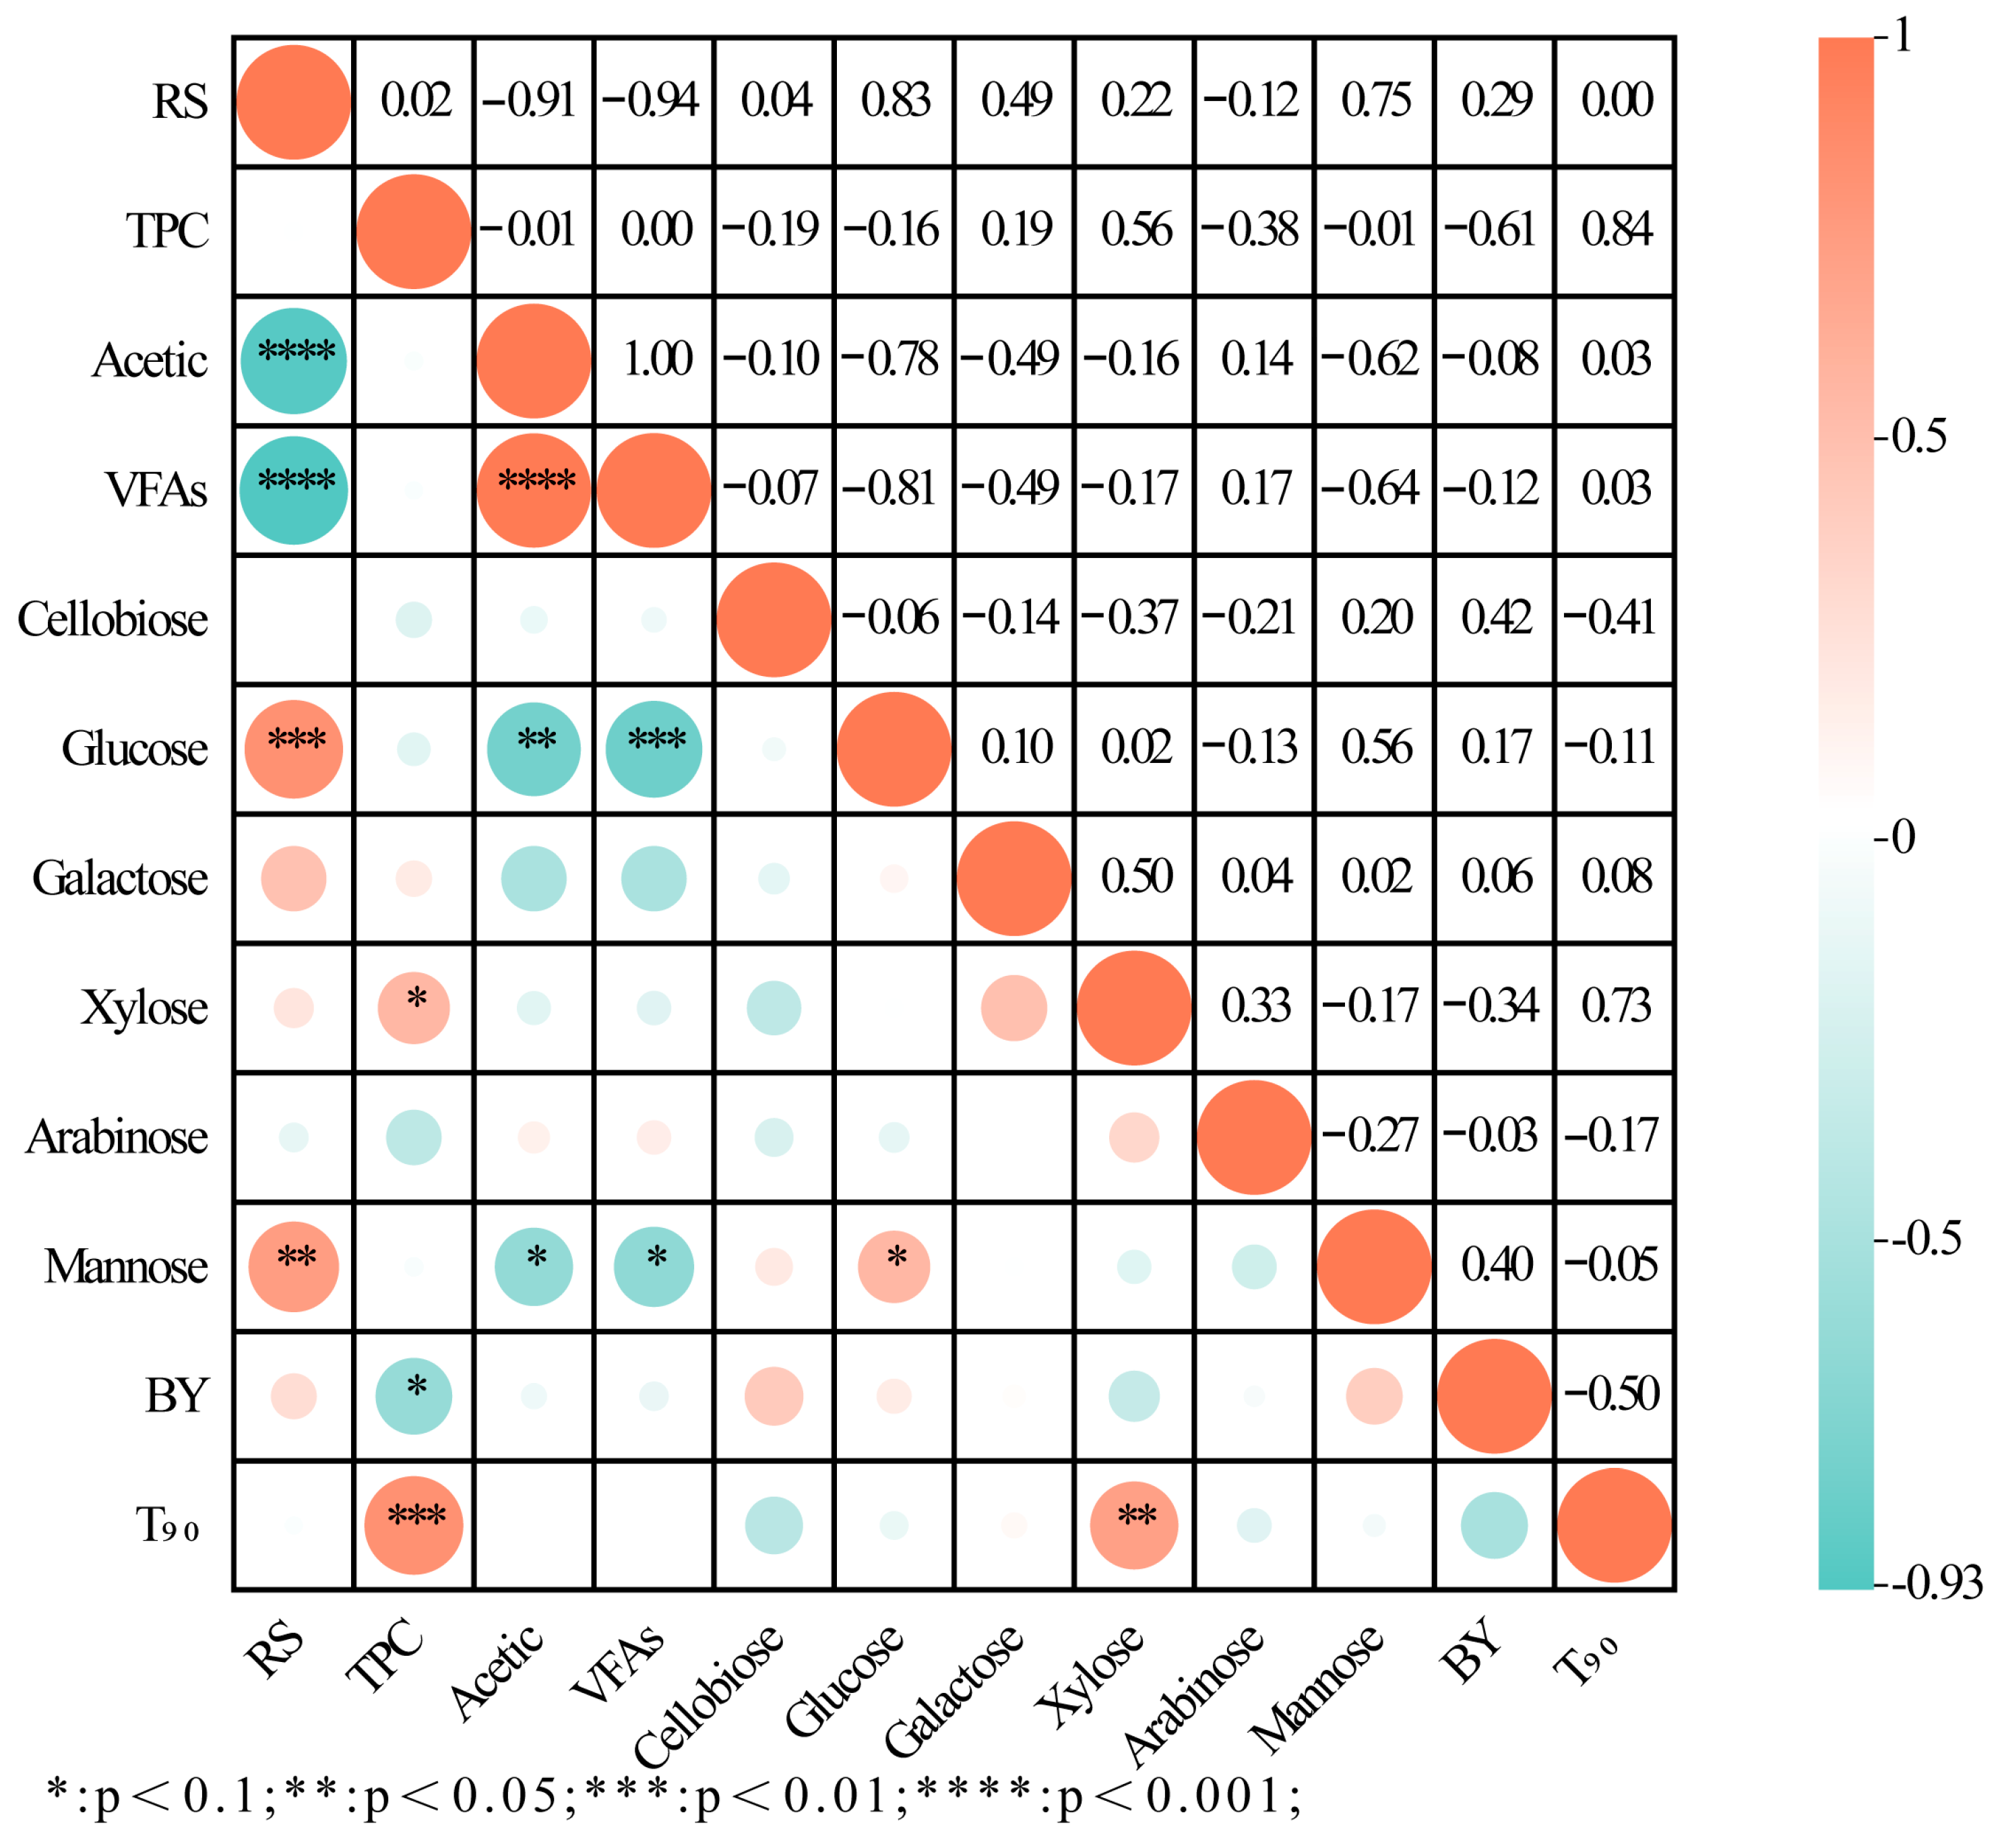
2.5. Correlation Analysis Between HM-Fe/C Parameters and BY

The liquid phase composition (RS, glucose, cellobiose, acetic acid, VFAs, galactose, xylose, arabinose, mannose, and TPC) and AD performance (biomethane yield (BY) and T90) of mild modification CS were correlated (shown in Figure 7). Acetic acid exhibited a strong positive correlation with VFAs (p < 0.001) and a negative correlation with RS (p < 0.001), glucose (p < 0.01), and mannose (p < 0.1). These correlations suggested that sugars were mainly converted to acetic acid during modification. Additionally, the negative correlation between VFAs and glucose (p < 0.01) was even stronger. This is because glucose, in the process of being converted to acetic acid, was not only directly converted but also undergoes conversion to other VFAs before being converted to acetic acid again. This finding is consistent with the analyses presented in Section 3.2. TPC showed a negative correlation with biomethane yield (p < 0.1) and a positive correlation with T90 (p < 0.01), indicating that TPC had a greater effect on biomethane yield. This is in agreement with the analysis of the GM (1,6) model in Section 2.4.1. Moreover, the positive correlations between cellobiose, mannose, and RS with biomethane yield were relatively small. This suggested that under different modification conditions, the production of TPC had a greater effect on AD performance.

3. Materials and Methods

3.1. Materials

The material in this study was CS, which was sourced from Yanqing, Beijing, China and then air dried in the open air. The air-dried stover was cut into small sections of approximately 10 cm, pulverized to 20 mesh, and sealed in self-sealing bags. CS was stored in a location that was both dry and light proof for future use.
The inoculum was obtained from the Recycling Economy Industrial Park in Fengtai District, Beijing, China. It was mixed with the sequential batch AD feed, left to stand for one week in a cool place away from light to pour off the supernatant, and stored for spare. The basic properties are shown in Table S1.
The Fe/C catalysts were synthesized using the wet impregnation–carbothermic method, as described by [22]. Activated carbon was initially oven dried at 105 °C for 12 h to remove any residual moisture. A precursor solution was prepared using FeCl3. The Fe was then loaded onto the active carbon support through isobaric impregnation, with a target loading of 10 wt%. The impregnated catalysts were subsequently dried for 12 h. Following this, the catalysts were calcination under a N2 atmosphere. The temperature was ramped at a rate of 5 °C/min up to the target temperatures (600, 700, and 800 °C). Each catalyst was held at its target temperature for 2 h before being cooled to room temperature with a nitrogen gas flow rate of 100 mL/min.

3.2. Mild Modification Methods

A Box–Behnken design was employed to evaluate the effects and interactions of three factors at three levels: Fe/C loading (2–6%, based on TS), reaction time (1–3 d), and calcination temperature of Fe/C (600–800 °C). The experimental design was created using Design Expert, as shown in Table S2. To investigate whether the addition of the catalyst had an impact on the hydrothermal process, a separate hydrothermal-only experimental group was included.
The optimized experimental design after response surface model analysis is shown in Table S3.

3.3. Batch AD Experiment

The organic loading of the raw material (CS) was 50 g TS/L, the inoculum was 30 g TS/L, and the AD time was 40 d. The optimized modified samples in Section 2.2 were transferred to 250 mL blue-capped bottles, and the inoculum was added and fixed to 200 mL, which was mixed well and then subjected to anaerobic digestion at a medium temperature (35 ± 1 °C). Three parallels were set up for each test group, and the results were averaged. During the AD process, the biogas production was recorded regularly, and the gas composition was determined; the resulting gas production was converted to the standardized volume by the ideal gas equation of state (PV = nRT). For the convenience of discussion, each experimental group was expressed in the format of “catalyst calcination temperature—addition—modification time”, and for the hydrothermal group alone, it was expressed as “HM—time”.

3.4. Construction of the Model

GM (1, N) denotes a first-order gray model, where N denotes the number of variables, consisting of a dependent variable (DV) and (N-1) independent variables. GM (1, N) can be built by gray theory with less test data. GM (1, N) model construction and validation is divided into five steps [16]: construction of cumulative generating series (1-AGO), construction of immediate mean series, construction of immediate mean series, model test, and model test. Excel was used for model construction and validation.
Based on the experimental results from the response surface test, the ANN model was constructed using the neural network toolbox of MATLAB R2024a, using Levenberg-Marquardt as training function, hyperbolic tangent Sigmoid as non-linear transfer function used in the hidden layer, and the linear transfer function used in the output layer. A total of 70% and 30% (15% + 15%) of the experimental data were used for training and testing validation, respectively [15]. A genetic algorithm (GA) was chosen as the optimization tool, and the optimized ANN was used as the adaptation function of the GA to evaluate the fitness of the individuals. With this in mind, the GA propagates the population through stochastic variations according to the survival of the fittest rule, which continues until the best combination of process parameters appears in the output [36]. Finally, based on the output of the GA, validation is performed to explore the model’s capabilities.
To evaluate the quality of the model, calculations were performed based on R2 (Equation (8)), average percentage deviation (APD, Equation (9)), and root mean square error (RMSPE, Equation (10)) [36].
R 2 = 1 i = 1 q E i P i 2 i = 1 q P i E i , a v e 2
A P D = 100 m i = 1 m P i E i E i
R M S E = i = 1 m E i P i 2 m
where Pi is the predicted biomethane yield (mL/g VS), Ei is the actual biomethane yield (mL/g VS), Ei,ave is the mean value, and m is the number of test sites.

3.5. Analytical Methods

The concentrations of biomethane were determined using a gas chromatograph (GC-2014; Shimadzu, Kyoto, Japan). The total solids (TS) and volatile solids (VS) of the raw materials were measured in accordance with the standard methods outlined by the American Public Health Association [37]. The total carbon (TC) and total nitrogen (TN) contents were quantified using an elemental analyzer (Vario EL/cube, Frankfurt, Germany). The pH values were measured with a pH meter (Five Easy Plus; Mettler Toledo, Zurich, Switzerland). The concentrations of total volatile fatty acids (VFAs) were also determined using the GC-2014 (Shimadzu, Kyoto, Japan). The reducing sugar content (RS) of the samples was quantified using the DNS method [38]. The total phenolic content (TPC) was assessed via the Folin phenol reagent method [39]. The concentrations of cellobiose, glucose, xylose, mannose, galactose, and arabinose were determined using a high-performance liquid chromatograph (1260 LC; Agilent Technologies, Santa Clara, CA, USA). X-ray diffraction (XRD) analysis was performed using a Rigaku D/Max-2500 X-ray diffractometer (Rigaku Corporation, Tokyo, Japan). X-ray photoelectron spectroscopy (XPS) analysis could provide detailed information, such as the chemical composition of the material surface. XPS was conducted using a Thermo Scientific K-Alpha instrument (Thermo Fisher Scientific, Waltham, MA, USA)
Data analyses were performed in Microsoft Excel 2019 (17.0, Microsoft, Redmond, WA, USA, 2018) and Design Expert 12.0.3.0 software (Stat-Ease Inc., Minneapolis, MN, USA), Spearman’s correlation data analyses were performed in SPSS 26.0 (IBM, Armonk, NY, USA, 2019), and all graphs were generated using MATLAB R2024a toolbox (MathWorks, Natick, MA, USA, 2024).

4. Conclusions

This study demonstrated that low-temperature HM with Fe/C catalysts could effectively enhance the AD performance of CS. The BY for the CS modified with HM-Fe/C reached 183 mL/g VS, representing a 25.5% increase compared to the control group, while reducing the T90 by 7 days. These improvements were related to enhanced hydrolytic efficiency, as the CS modified under the condition optimized with RSM achieved substantial increases in CS conversion products, such as glucose (1.9×), mannose (1.7×), xylose (3.0×), and VFAs (1.8×), compared to HM. The developed predictive models exhibited complementary strengths. The GM(1,N) gray system model provided reliable small-sample predictions (n < 20) with 4.50% APD without knowing the exact mechanism of the research system, while the ANN-GA hybrid model showed superior accuracy in modeling complex non-linear relationships. This study demonstrated the effectiveness of low-temperature HM-Fe/C in enhancing the biomethane yield and accuracy of two models in predicting BY.

Supplementary Materials

The following supporting information can be downloaded at https://www.mdpi.com/article/10.3390/catal15040362/s1, Figure S1: Comparison of experimental and predicted values based on the GM (1,6) model for (a) the first 8 samples, (b) the first 10 samples, (c) the first 12 samples, and (d) 13 samples; Figure S2: Experimental validation and predictive model regression plots for the ANN-GA model; Table S1: Characteristics of raw materials; Table S2: Response surface design; Table S3: Optimized responsive surface design.

Author Contributions

Conceptualization, X.L.; methodology, X.L.; validation, X.L.; formal analysis, X.W.; investigation, X.W.; resources, H.Y.; data curation, X.W.; writing—original draft preparation, X.W.; writing—review and editing, X.L.; supervision, X.L. and H.Y.; project administration, X.L.; funding acquisition, X.L. All authors have read and agreed to the published version of the manuscript.

Funding

This research was funded by the fund support from the National Key Research and Development Program of China (No. 2024YFC3909101).

Data Availability Statement

The original contributions presented in this study are included in the article. Further inquiries can be directed to the corresponding author.

Conflicts of Interest

The authors declare no conflicts of interest. The funders had no role in the design of the study; in the collection, analyses, or interpretation of data; in the writing of the manuscript; or in the decision to publish the results.

Abbreviations

The following abbreviations are used in this manuscript:
CSCorn stover
ADAnaerobic digestion
HMHydrothermal modification
BYBiomethane yield
T90The time to reach 90% of the maximum BY
RSReducing sugar
VFAsVolatile fatty acids
TPCTotal phenolic content
APDAverage percentage deviation
RSMResponse surface methodology
RMSPERoot mean square error
TSTotal solids
VSVolatile solids
TCTotal carbon
TNTotal nitrogen
XRDX-ray diffraction
XPSX-ray photoelectron spectroscopy

References

  1. Wang, X.; Song, X.; Yuan, H.; Li, X.; Zuo, X. Two-Step pretreatment of hydrothermal with ammonia for cow bedding: Pretreatment characteristics, anaerobic digestion performance and kinetic analysis. Waste Biomass Valoriz. 2021, 12, 5675–5687. [Google Scholar] [CrossRef]
  2. Kegl, T. Consideration of biological and inorganic additives in upgraded anaerobic digestion BioModel. Bioresour. Technol. 2022, 355, 127252. [Google Scholar] [CrossRef]
  3. Xiang, C.; Tian, D.; Hu, J.; Huang, M.; Shen, F.; Zhang, Y.; Yang, G.; Zeng, Y.; Deng, S. Why can hydrothermally pretreating lignocellulose in low severities improve anaerobic digestion performances? Sci. Total Environ. 2021, 752, 141929. [Google Scholar] [CrossRef]
  4. Lu, Y.; Yuan, H.; Yan, B.; Zuo, X.; Li, X. Improved performance of corn stover anaerobic digestion by low-temperature hydrothermal pretreatment with urea enhancement. Biomass Bioenerg. 2022, 164, 106553. [Google Scholar] [CrossRef]
  5. Deng, Z.; Xia, A.; Zhang, Z.; Zhu, X.; Huang, Y.; Zhu, X.; Liao, Q. A continuous hydrothermal pretreatment system for efficient sugar production from wheat straw. Chem. Eng. J. 2025, 508, 160867. [Google Scholar] [CrossRef]
  6. Zhang, H.; Wu, J. Statistical optimization of aqueous ammonia pretreatment and enzymatic hydrolysis of corn cob powder for enhancing sugars production. Biochem. Eng. J. 2021, 174, 108106. [Google Scholar] [CrossRef]
  7. Luo, T.; Huang, H.; Mei, Z.; Shen, F.; Ge, Y.; Hu, G.; Meng, X. Hydrothermal pretreatment of rice straw at relatively lower temperature to improve biogas production via anaerobic digestion. Chin. Chem. Lett. 2019, 30, 1219–1223. [Google Scholar] [CrossRef]
  8. Jeong, S.-Y.; Lee, J.-W. Catalytic effect of iron on sequential Fenton oxidation, hydrothermal treatment, and enzymatic hydrolysis to produce monosaccharide from lignocellulosic biomass. Ind. Crop Prod. 2020, 158, 112953. [Google Scholar] [CrossRef]
  9. Wang, Q.; Liu, Y.; Zhang, Y.; Chen, Y.; Feng, Q.; Wang, W.; Liang, C.; Hu, Y.; Qi, W. Enhanced enzymatic hydrolysis of poplar cellulosic residue fractionated by a magnetic carbon-based solid-acid catalyst in the γ-valerolactone-water system. Ind. Crop Prod. 2022, 176, 114397. [Google Scholar] [CrossRef]
  10. Kegl, T.; Kovač Kralj, A. An enhanced anaerobic digestion BioModel calibrated by parameters optimization based on measured biogas plant data. Fuel 2022, 312, 122984. [Google Scholar] [CrossRef]
  11. Karki, R.; Chuenchart, W.; Surendra, K.C.; Sung, S.; Raskin, L.; Khanal, S.K. Anaerobic co-digestion of various organic wastes: Kinetic modeling and synergistic impact evaluation. Bioresour. Technol. 2022, 343, 126063. [Google Scholar] [CrossRef]
  12. Long, F.; Wang, L.; Cai, W.; Lesnik, K.; Liu, H. Predicting the performance of anaerobic digestion using machine learning algorithms and genomic data. Water Res. 2021, 199, 117182. [Google Scholar] [CrossRef] [PubMed]
  13. Kegl, T.; Paramasivan, B.; Maharaj, B.C. Mathematical model-based optimization of trace metal dosage in anaerobic batch bioreactors. Bioengineering 2025, 12, 117. [Google Scholar] [CrossRef]
  14. Jacob, S.; Banerjee, R. Modeling and optimization of anaerobic codigestion of potato waste and aquatic weed by response surface methodology and artificial neural network coupled genetic algorithm. Bioresour. Technol. 2016, 214, 386–395. [Google Scholar] [CrossRef]
  15. Zhan, Y.; Zhu, J. Response surface methodology and artificial neural network-genetic algorithm for modeling and optimization of bioenergy production from biochar-improved anaerobic digestion. Appl. Energ. 2024, 355, 122336. [Google Scholar] [CrossRef]
  16. Li, Y.; Zhang, Z.; Jing, Y.; Liu, T.; Fan, X.; Zhu, S.; Jiang, D.; Lu, C.; Zhang, H.; Yue, J.; et al. Forecasting of reducing sugar yield from corncob after ultrafine grinding pretreatment based on GM(1,N) method and evaluation of biohydrogen production potential. Bioresour. Technol. 2022, 348, 126836. [Google Scholar] [CrossRef]
  17. Ding, C.; Zhong, W.; Cao, Y.; Ma, T.; Ye, H.; Fang, Z.; Feng, Y.; Zhao, S.; Yang, J.; Li, Y.; et al. Fe-MOF-based catalysts for oxygen evolution reaction: Microenvironment regulated by organic ligands, metals and carbonization synergistically. Chem. Eng. Sci. 2025, 302, 120888. [Google Scholar] [CrossRef]
  18. Cheng, J.; Tu, X.; Zhang, L.; Han, M.; Zhou, R.; Luo, S.; Zeng, H.; Li, T.; Zou, J. A novel bifunctional particle electrode with abundant Fe/Fe3C and Fe-N-C sites to enhance the performance of electro-Fenton in degrading organic pollutant. J. Environ. Chem. Eng. 2024, 12, 112902. [Google Scholar] [CrossRef]
  19. Ashmath, S.; Rajeshkhanna, G.; Koyyada, G.; Pandiaraj, S.; Liu, C.; Peera, S.G.; Lee, T.-G. Biomass derived Fe3C/Fe-Nx-C as cathode catalyst for oxygen reduction reaction in dual chamber microbial fuel cells. Int. J. Hydro. Energy 2024. [Google Scholar] [CrossRef]
  20. Qiu, S.; Wang, M.; Fang, Y.M.; Tan, T.W. Reductive catalytic fractionation of lignocellulose: When should the catalyst meet depolymerized lignin fragments? Sustain. Energ. Fuels 2020, 4, 5588–5594. [Google Scholar] [CrossRef]
  21. Grosvenor, A.P.; Kobe, B.A.; Biesinger, M.C.; McIntyre, N.S. Investigation of multiplet splitting of Fe 2p XPS spectra and bonding in iron compounds. Surf. Interface Anal. 2004, 36, 1564–1574. [Google Scholar] [CrossRef]
  22. Wang, X.; Zhu, C.; Yuan, H.; Li, X. Enhanced hydrothermal depolymerization with Fe/Ni Loaded C catalysts for improving anaerobic digestion performance of corn stover. Energies 2025, 18, 192. [Google Scholar] [CrossRef]
  23. Ding, C.; Hu, X.; Sun, W.; Hailili, R.; Liao, F.; Shu, C.; Huang, J.; Huang, L.; Wang, N. Interface of Ni-MgCr2O4 spinel promotes the autothermal reforming of acetic acid through accelerated oxidation of carbon-containing intermediate species. ACS Catal. 2023, 13, 4560–4574. [Google Scholar] [CrossRef]
  24. Sun, D.; Lv, Z.-W.; Rao, J.; Tian, R.; Sun, S.-N.; Peng, F. Effects of hydrothermal pretreatment on the dissolution and structural evolution of hemicelluloses and lignin: A review. Carbohydr. Polym. 2022, 281, 119050. [Google Scholar] [CrossRef]
  25. Sun, S.-C.; Sun, D.; Wang, H.-M.; Li, H.-Y.; Cao, X.-F.; Sun, S.-N.; Yuan, T.-Q. Effect of integrated treatment on improving the enzymatic digestibility of poplar and the structural features of isolated hemicelluloses. Carbohydr. Polym. 2021, 252, 117164. [Google Scholar] [CrossRef] [PubMed]
  26. Yu, X.; Fan, K.; Yao, X.; Wang, M.; Wang, K. Physicochemical and morphological variation of bamboo cell wall during hydrothermal pretreatment. Pap. Biomater. 2022, 7, 1–8. [Google Scholar] [CrossRef]
  27. Yu, Y.; Wu, H. Evolution of primary liquid products and evidence of in situ structural changes in cellulose with conversion during hydrolysis in hot-compressed water. Ind. Eng. Chem. Res. 2010, 49, 3919–3925. [Google Scholar] [CrossRef]
  28. Zha, X.; Travesset, A. Thermodynamic equilibrium of binary nanocrystal superlattices. J. Phys. Chem. C 2021, 125, 18936–18945. [Google Scholar] [CrossRef]
  29. Yu, H.; Xi, Z.; Zhang, Y.; Xu, R.; Zhao, C.; Wang, Y.; Guo, X.; Huang, Y.; Mi, J.; Lin, Y.; et al. High performance additional mass enhanced film structure triboelectric nanogenerator for scavenging vibration energy in broadband frequency range. Nano Energy 2023, 107, 108182. [Google Scholar] [CrossRef]
  30. Chen, L.; Li, J.; Lu, M.; Guo, X.; Zhang, H.; Han, L. Integrated chemical and multi-scale structural analyses for the processes of acid pretreatment and enzymatic hydrolysis of corn stover. Carbohydr. Polym. 2016, 141, 1–9. [Google Scholar] [CrossRef]
  31. Zhang, P.; Dong, S.-J.; Ma, H.-H.; Zhang, B.-X.; Wang, Y.-F.; Hu, X.-M. Fractionation of corn stover into cellulose, hemicellulose and lignin using a series of ionic liquids. Ind. Crop Prod. 2015, 76, 688–696. [Google Scholar] [CrossRef]
  32. Wei, Y.; Yuan, H.; Wachemo, A.C.; Li, X. Impacts of modification of corn stover on the synergistic effect and microbial community structure of co-digestion with chicken manure. Energy Fuels 2019, 34, 401–411. [Google Scholar] [CrossRef]
  33. Lu, Y.; Sun, Y.; Zhang, L.; Zuo, X.; Li, X.; Yuan, H. Substance bioconversion, hydrolases activity, and metagenomic analysis to unravel the enhanced biomethanation of corn stover with urea-hydrothermal pretreatment. J. Environ. Manag. 2023, 333, 117466. [Google Scholar] [CrossRef]
  34. Ahmad, F.; Mat-Isa, N.A.; Hussain, Z.; Boudville, R.; Osman, M.K. Genetic algorithm-artificial neural network (GA-ANN) hybrid intelligence for cancer diagnosis. In Proceedings of the 2010 2nd International Conference on Computational Intelligence, Communication Systems and Networks, Washington, DC, USA, 28–30 July 2010; pp. 78–83. [Google Scholar]
  35. Mougari, N.E.; Largeau, J.F.; Himrane, N.; Hachemi, M.; Tazerout, M. Application of artificial neural network and kinetic modeling for the prediction of biogas and methane production in anaerobic digestion of several organic wastes. Int. J. Green. Energy 2021, 18, 1584–1596. [Google Scholar] [CrossRef]
  36. Zhang, X.; Zhang, Q.; Li, Y.; Zhang, H. Modeling and optimization of photo-fermentation biohydrogen production from co-substrates basing on response surface methodology and artificial neural network integrated genetic algorithm. Bioresour. Technol. 2023, 374, 128789. [Google Scholar] [CrossRef]
  37. APHA. Standard Methods for the Examination of Water and Wastewater, 21st ed.; American Public Health Association: Washington DC, USA, 2005. [Google Scholar]
  38. Zeng, Z.; Li, Y.; Yang, R.; Liu, C.; Hu, X.; Luo, S.; Gong, E.; Ye, J. The relationship between reducing sugars and phenolic retention of brown rice after enzymatic extrusion. J. Cereal Sci. 2017, 74, 244–249. [Google Scholar] [CrossRef]
  39. Puangbanlang, C.; Sirivibulkovit, K.; Nacapricha, D.; Sameenoi, Y. A paper-based device for simultaneous determination of antioxidant activity and total phenolic content in food samples. Talanta 2019, 198, 542–549. [Google Scholar] [CrossRef]
Figure 1. XRD (a) and XPS C1s (b) Fe 2p (c) results of Fe/C at different calcination temperatures.
Catalysts 15 00362 g001
Figure 2. Changes in (a) sugar fractions, (b) VFAs concentration and content of each fraction, (c) RS content, and (d) TPC concentration after mild modification.
Catalysts 15 00362 g002
Figure 3. RSM results (ac) comparison of actual and predicted values, the interaction effect of calcination roasting temperature, addition and modification time on (df) RS, (gi) VFAs, (jl) TPC.
Catalysts 15 00362 g003
Figure 4. The changes of (a) sugar, (b) VFAs, (c) RS+VFAs, and (d) TPC after mild modification.
Catalysts 15 00362 g004
Figure 5. The effect of Fe/C calcination temperature, addition, and calcination time on (a) biomethane yield and (b) increase rate.
Catalysts 15 00362 g005
Figure 6. GM (1,6) and ANN-GA comparison of (a) predicted vs. experimental values and (b) APD.
Catalysts 15 00362 g006
Figure 7. Correlation between modified parameters and AD performance.
Catalysts 15 00362 g007
Table 1. ANOVA and fit statistics of the quadratic model for the RS, VFAs, and TPC.
SourceR2F Valuep ValueC.V.%Adeq Precision
RS0.981942.23<0.00016.7619.1632
VFAs0.980539.16<0.00014.7417.7680
TPC0.968023.540.00023.9817.5922
Disclaimer/Publisher’s Note: The statements, opinions and data contained in all publications are solely those of the individual author(s) and contributor(s) and not of MDPI and/or the editor(s). MDPI and/or the editor(s) disclaim responsibility for any injury to people or property resulting from any ideas, methods, instructions or products referred to in the content.

