Article

Electro-Refinery in Organics to Produce Energy Carriers: Co-Generation of Green Hydrogen and Carboxylic Acids by Glycerol Electrooxidation Using Dimensionally Stable Anode

by
Letícia M. G. da Silva
1,
Letícia G. A. Costa
1,
José E. L. Santos
1,
Emily C. T. de A. Costa
1,
Aruzza M. de Morais Araújo
1,
Amanda D. Gondim
1,
Lívia N. Cavalcanti
1,
Marco A. Quiroz
1,
Elisama V. dos Santos
1,2,* and
Carlos A. Martínez-Huitle
1,*
1
Renewable Energies and Environmental Sustainability Research Group, Institute of Chemistry, Federal University of Rio Grande do Norte, Campus Universitário, Av. Salgado Filho 3000, Lagoa Nova, Natal CEP 59078-970, RN, Brazil
2
School of Science and Technology, Federal University of Rio Grande do Norte, Campus Universitário, Natal CEP 59078-970, RN, Brazil
*
Authors to whom correspondence should be addressed.
Catalysts 2025, 15(4), 333; https://doi.org/10.3390/catal15040333
Submission received: 6 February 2025 / Revised: 20 March 2025 / Accepted: 24 March 2025 / Published: 31 March 2025

Abstract

:
The urgency to decarbonize fuels has contributed to a rise in biofuel production, which has culminated in a significant increase in the waste quantity of glycerol produced. Therefore, to convert glycerol waste into high-value products, electrochemical oxidation (EO) is a viable alternative for the co-generation of carboxylic acids, such as formic acid (FA) and green hydrogen (H2), which are considered energy carriers. The aim of this study is the electroconversion of glycerol into FA by EO using a divided electrochemical cell, driven by a photovoltaic (PV) system, with a dimensionally stable anode (DSA, Ti/TiO2-RuO2-IrO2) electrode as an anode and Ni-Fe stainless steel (SS) mesh as a cathode. To optimize the experimental conditions, studies were carried out evaluating the effects of applied current density (j), electrolyte concentration, electrolysis time, and electrochemical cell configuration (undivided and divided). According to the results, the optimum experimental conditions were achieved at 90 mA cm−2, 0.1 mol L−1 of Na2SO4 as a supporting electrolyte, and 480 min of electrolysis. In this condition, 256.21 and 211.17 mg L−1 of FA were obtained for the undivided and divided cells, respectively, while the co-generation of 6.77 L of dry H2 was achieved in the divided cell. The electroconversion process under the optimum conditions was also carried out with a real sample, where organic acids like formic and acetic acids were co-produced simultaneously with green H2. Based on the preliminary economic analysis, the integrated-hybrid process is an economically viable and promising alternative when it is integrated with renewable energy sources such as solar energy.

Graphical Abstract

1. Introduction

An important step in energy conversion and storage technologies, including fuel cell applications, is the hydrogen evolution reaction (HER) and oxygen evolution reaction (OER) by water splitting [1,2,3]. Despite the +1.23 V thermodynamic standard potential variance between these reactions, their actual potential tends to exceed this value substantially owing to kinetic barriers [4,5]. As a result, a strategy in which OER is substituted with a certain alternative oxidation reaction that takes place at a lower overpotential has been developed and it is receiving growing research interest [6,7]. These innovative electrochemical strategies include the following: (i) the use of sacrificial substances, which undergo oxidation but do not yield highly valuable byproducts [8]; (ii) the utilization of pollutants amenable to electrochemical degradation [9]; or (iii) the use of substances that, under controlled EO conditions, may generate compounds with higher added value [3,10,11], named “electro-refinery in organics” [12] or “electro-catalytic refinery in organics” [13].
The glycerol electrooxidation reaction (GEOR) emerges as a viable reaction to replace OER and generate chemistries of enhanced value [10]. Glycerol, a byproduct stemming from the biodiesel industry via the transesterification of fatty acids, represents approximately 10% of the total biodiesel by weight [14]. Due to its low purity and the presence of impurities (the impurities usually contained in the crude glycerol are methanol, soap, catalysts, salts, non-glycerol organic matter, and water [15,16]), a significant portion of the glycerol obtained during the synthesis of biodiesel is sold at a cheap cost, rendering it a byproduct with an industrial or economic value [17,18]. While refining residual glycerol could potentially heighten its value, this refinement process, compared to conventional production methods, increases significantly the cost of the process [17,19,20,21,22].
An alternative approach towards valorizing this residual would be to convert it into other products with greater application potential through reactions of dehydration, oxidation, etherification, esterification, cracking, hydrogenolysis, and C-C and C-O cleavages leading to H2, CO, or alkanes/alkenes, respectively [23]. Among these reactions, EO emerges as an attractive and sustainable alternative that has shown excellent performance in obtaining value-added products such as dihydroxyacetone (DHA), glyceraldehyde (GALD), as well as glycolic (GA), tartronic (TA), glyceric (GLA), oxalate (OA), glyoxylic (GLOA), lactic (LA), and formic (FA) acids [24,25].
These glycerol oxidation products have a variety of industrial uses, including in the food industry, the pharmaceutical sector (from the manufacture of antiviral drugs to diabetes medications), the cosmetics industry, the metallurgical sector, the synthesis of biodegradable polymers, and surfactants [26]. For example, DHA is used as a primary component of many sunless tanning skincare products, which fall under the category of topical sunless tanners or temporary bronzers. Unlike bronzers that employ pigment to cover the skin, DHA bronzers color the skin’s outermost layer and are difficult to remove. Nowadays, sunless tanners come in the form of cosmetic wipes, gels, mousses, sprays, and lotions. GA is also used in skincare products to treat acne, hyperpigmentation, and signs of aging [15,16,26]. It is also used to exfoliate the skin. Instead, GALD is used in nutrition, biochemical research, and the production of adhesives, polyesters, and leather [26]. GALD serves as a reference chemical for comparison with other compounds, including sugars and amino acids [15,16,26]. Scientists use d-glyceraldehyde’s conformation to assess the structure of other simple sugars. TA is used as a pharmaceutical for the treatment of osteoporosis because of its positive effects on bone metabolism as well as being used to prevent oxidative decomposition in the food industry and corrosion in boilers and in other high-temperature applications [26]. Oxalic acid and OA are used in the treatment of anxiety and depression and are used as anticoagulants in blood specimens [26]. Meanwhile, GLOA is used as an exfoliant and skin-brightening agent. It helps remove dead skin cells and improve skin texture. It is also used in the production of pharmaceuticals, including amoxicillin and atenolol [26]. LA is used as a preservative which prevents discoloration and kills bacteria in foods like bread, jams, and olives [16]. Other uses of LA include as an acidulant and for dyeing and printing [26]. In the case of FA, it is utilized in the pharmaceutical and textile sectors, but it is currently important for energetic sectors; in particular, it can be used to power direct fuel cells or as hydrogen carrier [26,27,28]. For this reason, it is important to develop novel routes and recovery strategies for producing these organic acids.
EO is a process in which the type of electrode directly affects the performance of the operation [29]. One of the most widely used electrodes are dimensionally stable anodes (DSAs) [30], which are classified as active electrodes in the electrocatalysis for wastewater treatment. DSA has low overpotentials for OER, promoting a controlled production of hydroxyl radicals (•OH) from water discharge on the electrode surface (M) (Equation (1)). These oxidative species strongly interact with M to form metal oxides (MO) (Equation (2)) or are transformed into molecular oxygen (Equation (3)) [31,32]. These MO species may facilitate partial oxidation (Equation (4)) of the organic compounds in water (Raq), usually named electrochemical conversion [33].
M + H2O → M(•OH) + e + H+
M(•OH) → MO + e + H+
M(•OH) → M + ½ O2 + e + H+
MO + Raq → M + RO
DSAs are electrocatalytic materials with an electroactive layer predominantly composed of mixed metal oxides (MMOs) which are typically deposited on titanium substrate, such as RuO2, IrO2, Ta2O5, TiO2, or SnO2 [32,34] and their combined mixtures. Titanium support is used due to several advantages, including its excellent catalytic performance and stability, good electrical conductivity, resistance to corrosion, and lightweight nature [35,36,37]. Their features like excellent electrocatalytic activity, chemical stability, low anode overpotential, no surface changes at different currents, exceptionally long service life, ease of use and versatility in production, favorable design in industrial cells, durability, and low cost are some of the benefits of these electrodes in electrochemical applications [36,38].
Within the new concept of the electro-refinery in organics, DSA materials have been slightly investigated to produce carboxylic acids or carboxylates from synthetic and real effluents [39,40]. Only a couple of examples can be mentioned since this new concept started to be investigated [39]. On the one hand, Ti/(RuO2)80(SbO2)20 anodes, which were synthesized by the ionic liquid (IL) method, promoted higher phenol electrochemical conversion rates, resulting in a greater generation of carboxylates during electrolysis, yielding primarily oxalate and achieving up to 40% conversion [40]. On the other hand, a selective production of acetic acid as high as 11.7% from the electrochemical conversion of the pollutants contained in the technical liquid of the cashew nutshell waste (t-CNSL) was achieved by using Ti/RuO2IrO2TiO2 anode [41].
In this context, this work aims to promote the conversion of glycerol into value-added commodities through EO using a dimensionally stable anode (DSA, Ti/TiO2-RuO2-IrO2), in different electrochemical cells, driven by a photovoltaic (PV) system, to evaluate the applied current density (j), electrolyte concentration, electrolysis time, and electrochemical cell configuration (undivided and divided). For practical application of the integrated-hybrid electrolysis to real samples, a washing biodiesel effluent was electrochemically treated under the optimum conditions, where organic acids were co-produced simultaneously with green H2. Preliminary economic analysis, Capital Expenditure (CAPEX) and Operational Expenditure (OPEX) evaluations were performed to determine if the integrated-hybrid process is an economically viable and promising alternative when it is integrated with renewable energy sources such as solar energy.

2. Results and Discussion

2.1. Polarization Curves

The profiles of OER and GEOR (0.1 mol L−1 of glycerol concentration) were registered by LSV to understand their performance in Na2SO4 0.1 mol L−1 (red line), Na2SO4 0.5 mol L−1 (blue line), and Na2SO4 1.0 mol L−1 (black line) as supporting electrolyte measurements, at a potential range from 0 V to +1.5 V at a scan rate of 5 mV s−1 at 298 K. Figure 1a shows the LSV curves for water splitting (continuous line) and GEOR (dashed line) in different Na2SO4 concentrations. As can be observed, the performance of the GEOR is better than OER when the supporting electrolyte concentration is about 0.1 mol L−1 (as shown in Figure 1a) since the GEOR is shifted to lower potential values. Conversely, as the concentration of sulfate increases (Figure 1a) in the solution, the onset potential of the OER shifts to higher potential values while the GEOR current decreases. This behavior can be attributed to the generation of organic intermediate products (see Figure S2 in the SM) that tend to be adsorbed on the anode surface blocking it and partially causing a decrease in the current density. For lower Na2SO4 concentrations, a controlled production of organic intermediates is attained, avoiding the adsorption of these byproducts, which block the anode surface. Within this framework, the polarization curve of the real glycerol effluent is also registered at lower Na2SO4 concentrations (0.1 mol L−1), then, as shown in Figure 1b, the GEOR is also significantly favored.

2.2. Reactor Characterization

Figure 2 exhibits the polarization curves for the different electrochemical cell configurations (non-divided (Figure 2a) and divided (Figure 2b) cells). The data were obtained at a constant flow rate by using K3[Fe(CN)6]/K4[Fe(CN)6] protocol [42]. As can be seen, a plateau region was reached at all current–potential curves, which allowed us to experimentally estimate the limiting current values. Thus, a linear dependence of ferro-ferricyanide concentration on the limiting current values was determined to calculate the mass transfer coefficient (k) for divided and undivided cells, using Equation (10). The k values were about 5.95 × 10⁻⁶ m s−1 and 5.54 × 10⁻⁶ m s−1 for divided and undivided cells, respectively. The slightly higher k value for the divided cell indicates that the transport of the chemical species to the electrode surface is more efficient.

2.3. EO of Glycerol

The operating parameters evaluated in the electrolysis of glycerol to FA were the current density, supporting electrolyte concentration, and electrolysis time.

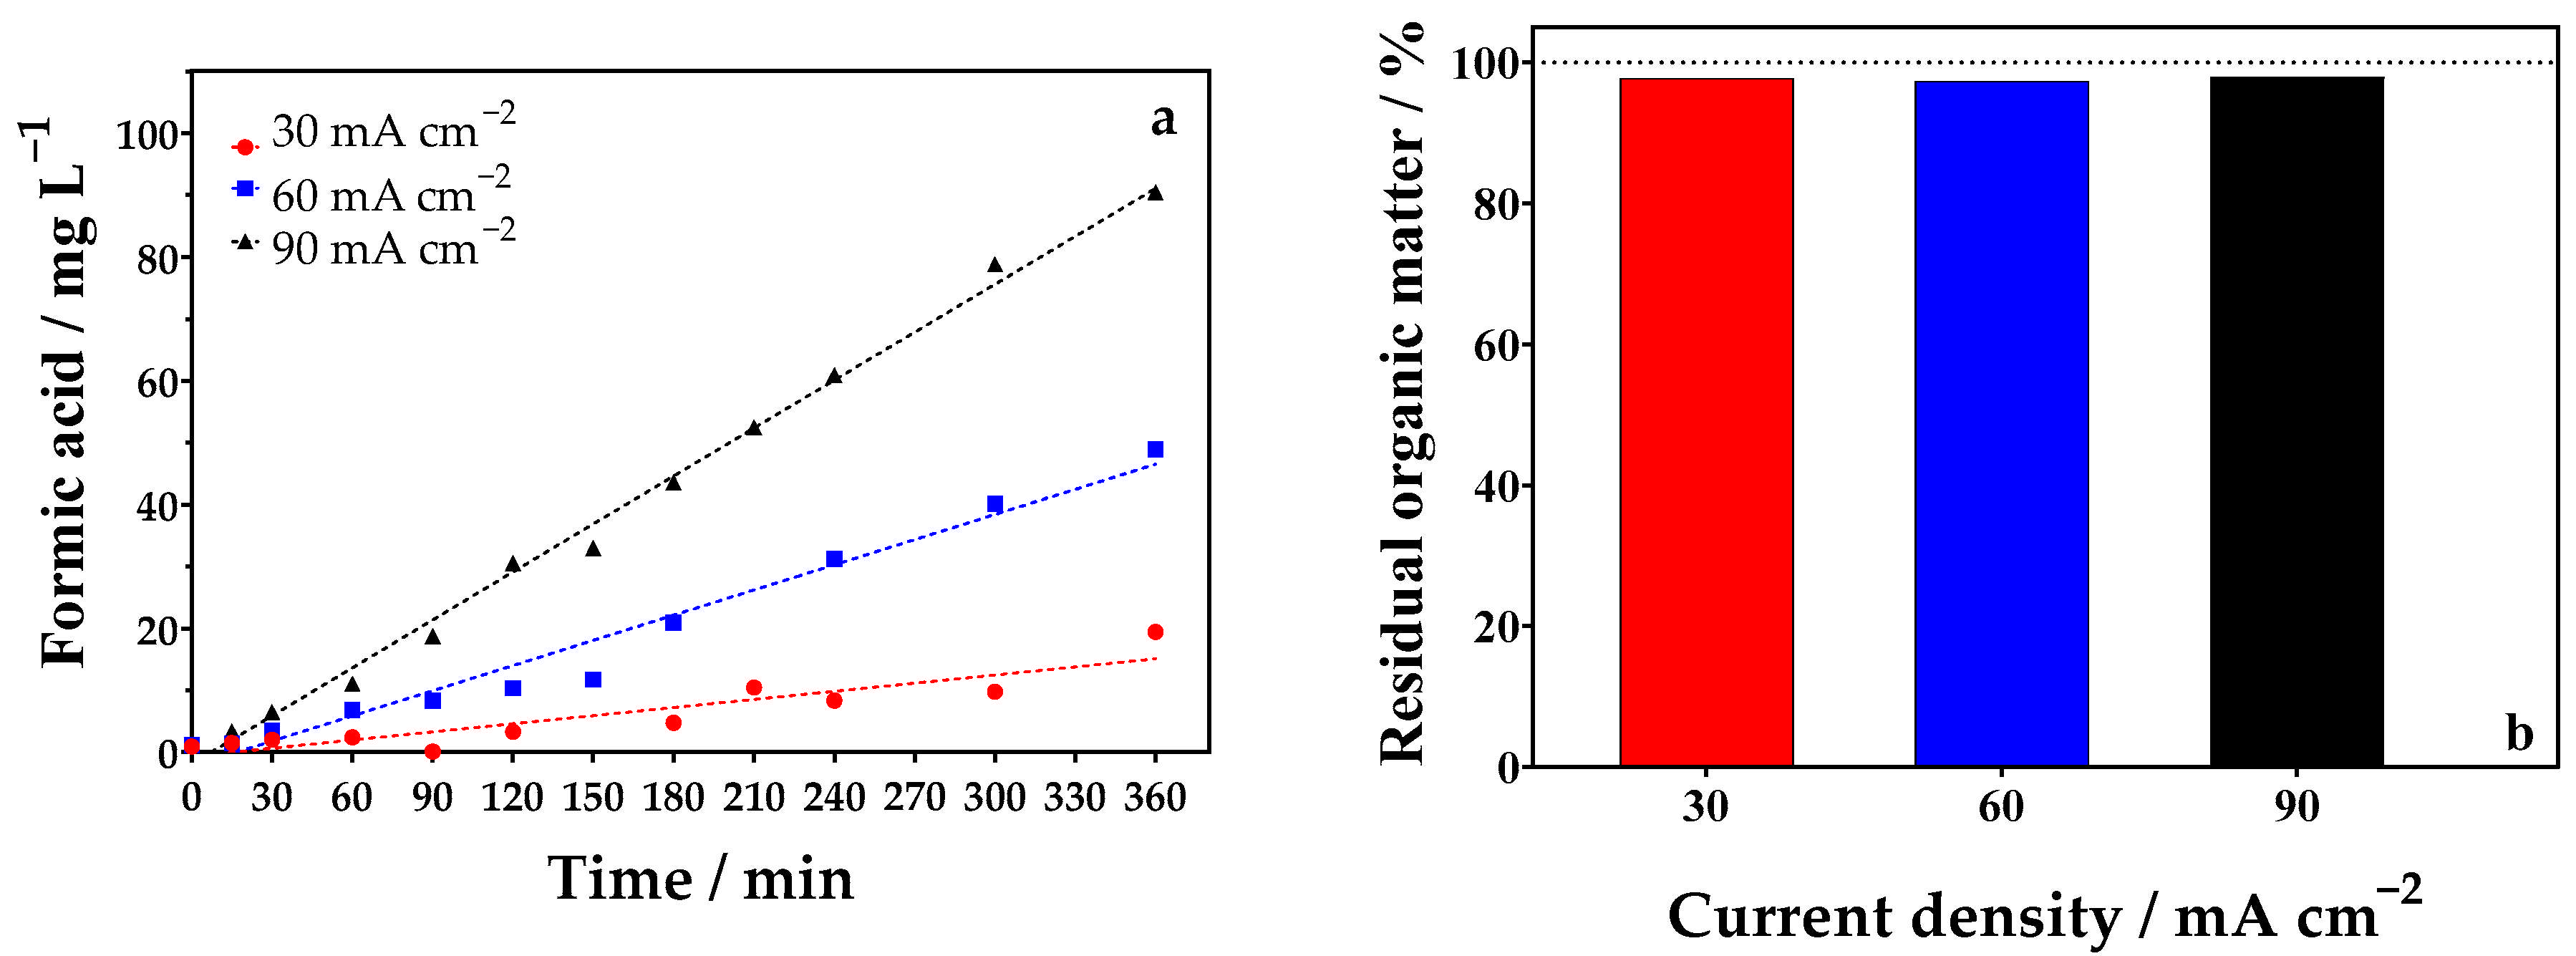
2.3.1. Influence of Current Density

Since current density controls the reaction rate, it might be the most commonly studied parameter in an electrochemical process, mainly in the proposed electro-refinery in organics where no mineralization is desired. Figure 3 illustrates the production of FA (Figure 3a) and TOC removal (Figure 3b) when a synthetic glycerol solution was electrochemically transformed in 360 min by applying different j at the DSA anode in the undivided cell. As can be seen, the concentration of FA increased linearly as a function of the electrolysis time in all j investigated; an increase in j favors the production of higher accumulated concentrations of FA. This behavior agrees with Faraday’s law, which states that the increase in applied current and/or time is proportional to the amount of product generated during electrolysis [7,43]. In fact, 19.47, 48.96, and 90.45 mg L−1 of FA were produced at the end of 360 min of electrolysis by applying 30, 60, and 90 mA cm−2, respectively.
Furthermore, the residual organic matter content at current densities of 30, 60, and 90 mA cm−2 was about 99.77%, 97.33%, and 98.92%, respectively, indicating that the organic matter removal rates for all j were controlled (Figure 3b). These results and COD analysis (Figure S3 in the SM) suggest that the electrochemical conversion of glycerol into other products is preferred over the mineralization process.
When the cell was used in divided configuration, a similar behavior was observed when the effect of j was investigated on the production of FA from the electrolysis of 0.1 mol L−1 glycerol in 0.5 mol L−1 Na2SO4 (Figure 4a). It can be seen that the concentration of FA increases linearly with electrolysis time and as j values increase, according to Faraday’s law [7]. Thus, the most significant FA production (83.45 mg L−1) occurred at high j. Also, the residual organic matter content decreased as j increased, as can be seen in Figure 4b. This indicates that increasing j favors mineralization over conversion. In order to maximize the production of FA, 90 mA cm−2 was chosen as the optimal condition for further experiments.

2.3.2. Influence of the Concentration of the Supporting Electrolyte

Another parameter evaluated was the concentration of the supporting electrolyte. When working with DSA anodes, it is common to use NaCl as the supporting electrolyte [29]. The presence of NaCl in the medium can lead to the formation of strong oxidants such as chlorine radical, hypochlorous acid (HClO), and hypochlorite ion (ClO) during electrolysis [29]. These oxidants are responsible for promoting accelerated degradation of organic compounds. However, the use of NaCl as a supporting electrolyte favors the formation of organochlorine compounds (RCl) during electrolysis [31]. Thus, sodium sulfate was used as the supporting electrolyte to avoid the formation of organochlorine species. Three different concentrations of sodium sulfate (0.1, 0.5, and 1.0 mol L−1) were studied by applying 90 mA cm−2 (as previously determined for undivided cell configuration), as shown in Figure 5.
It can be seen that the high concentrations of FA were obtained when a lower concentration of Na2SO4 was used as the supporting electrolyte (Figure 5a). At the end of the electrolysis time, 188.93, 87.98, and 88.49 mg L−1 of FA were obtained when concentrations of about 0.1, 0.5, and 1.0 mol L−1 of Na2SO4 were added, respectively. These results corroborate the behavior of the polarization curves recorded at the same Na2SO4 concentrations. This behavior is also confirmed by COD decay, which was practically slight from the beginning of the electrolysis until the end of the experiment, not decreasing significantly (Figure S4 in the SM). In the case of organic matter, in terms of TOC, similar behavior was observed when the Na2SO4 increased (Figure 5b), indicating that lower mineralization is attained as a function of the increase in the sulfate concentration. Then, the electroconversion of organic matter was achieved.
By changing the configuration of the cell, no significant variations were observed in relation to the effect of variation in the concentration of the supporting electrolyte for the co-generation of FA. Figure 6a shows the results of the experiments carried out in the divided cell where 189.92 mg L−1 of FA was obtained at the end of the electrolysis process by applying 90 mA cm−2 in Na2SO4 0.1 mol L−1. Based on these results, the amount of FA electroproduced was similar regardless of the cell configuration. In the case of COD removal, the divided cell was slightly superior to the undivided configuration (Figure S5 in the SM); however, no significant organic matter removal was attained. This behavior agrees with the TOC decay.
Since the aim of this study was to optimize the parameters for producing high value-added products from the electroconversion of glycerol, a lower concentration of supporting electrolyte (0.1 mol L−1) was considered the best operating condition.

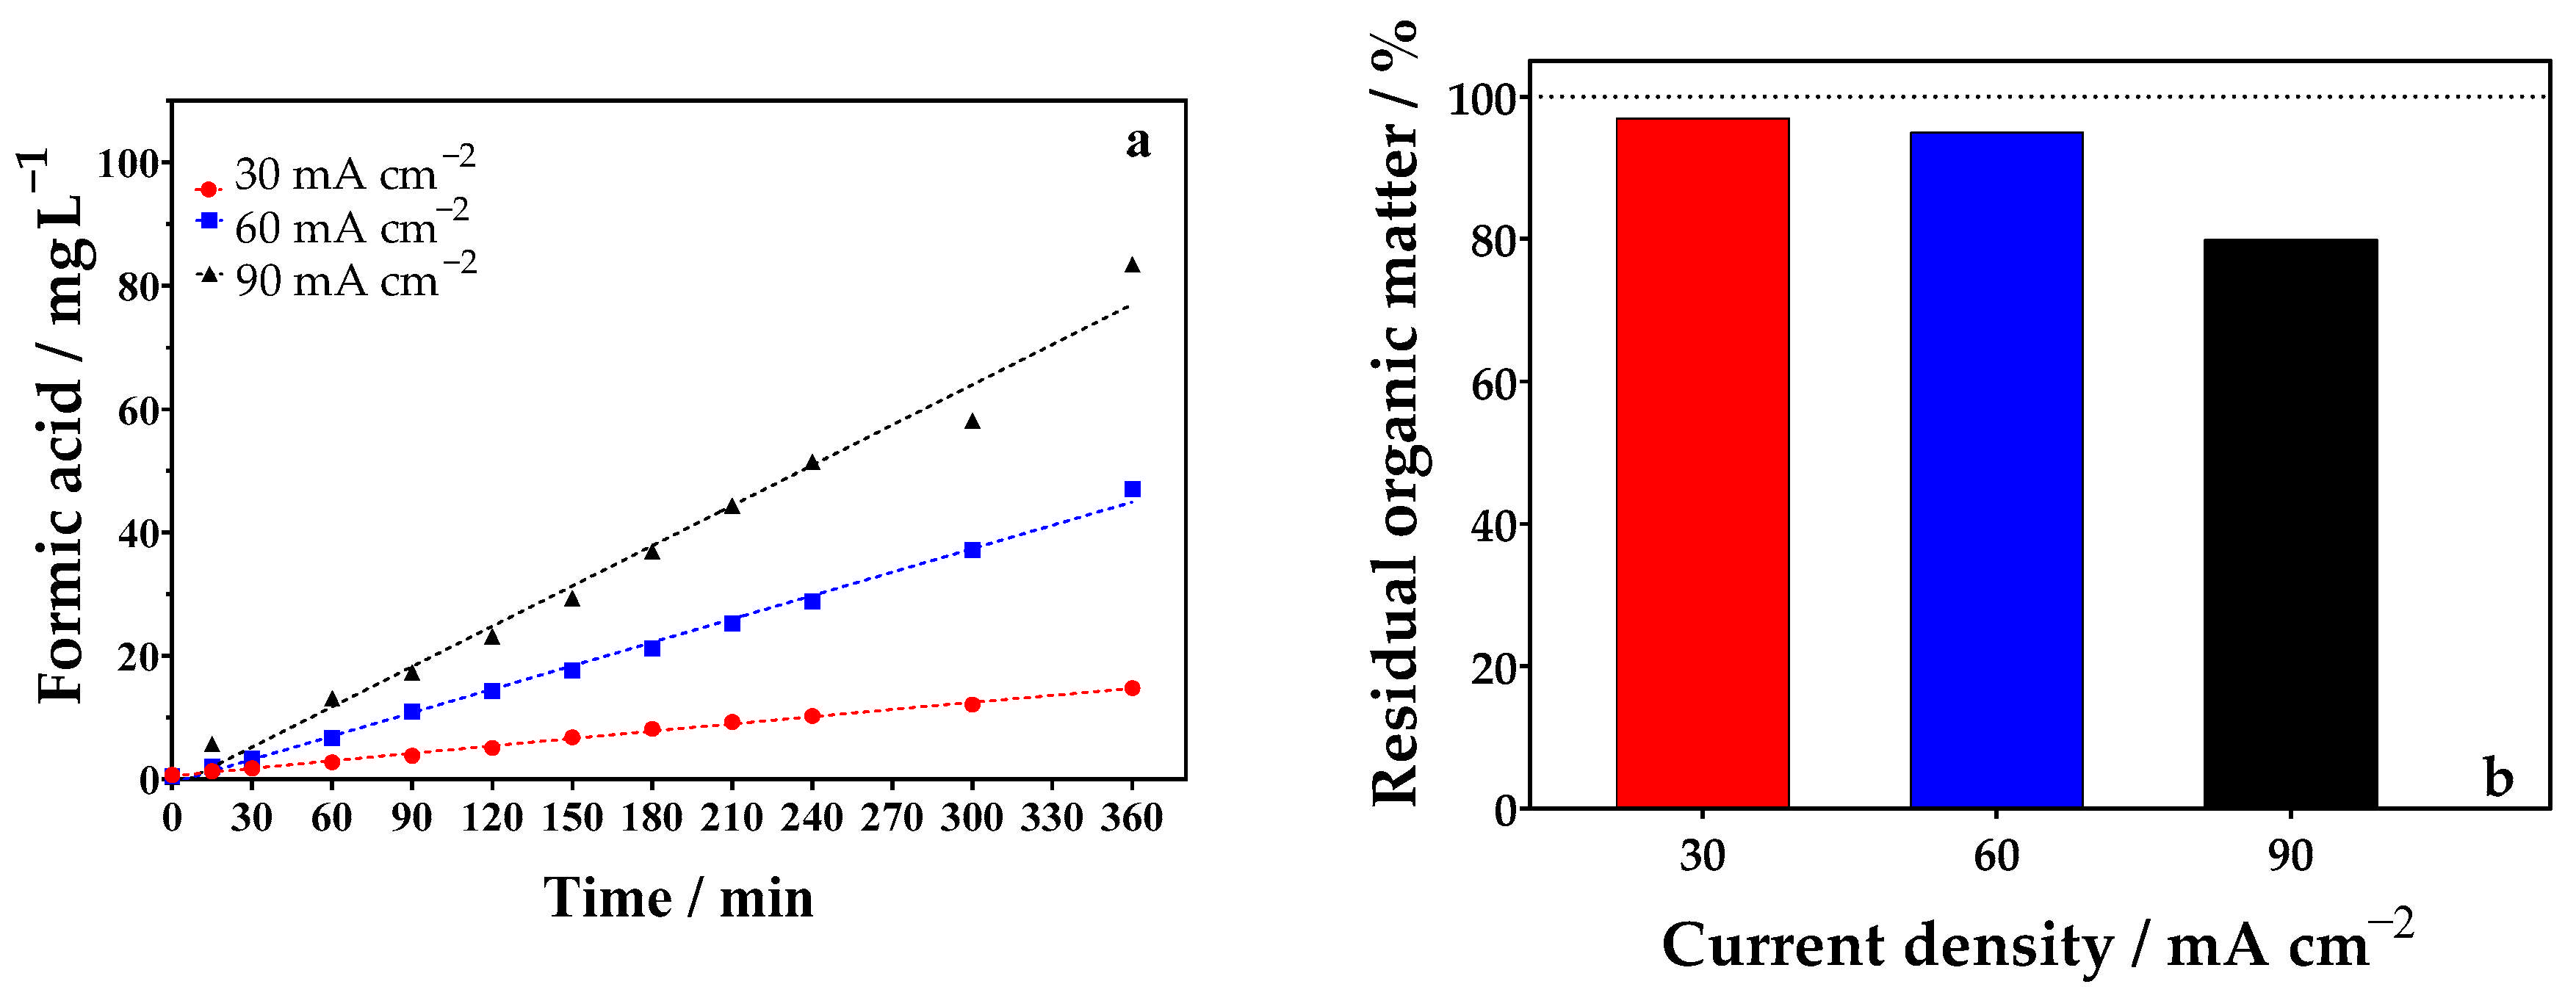
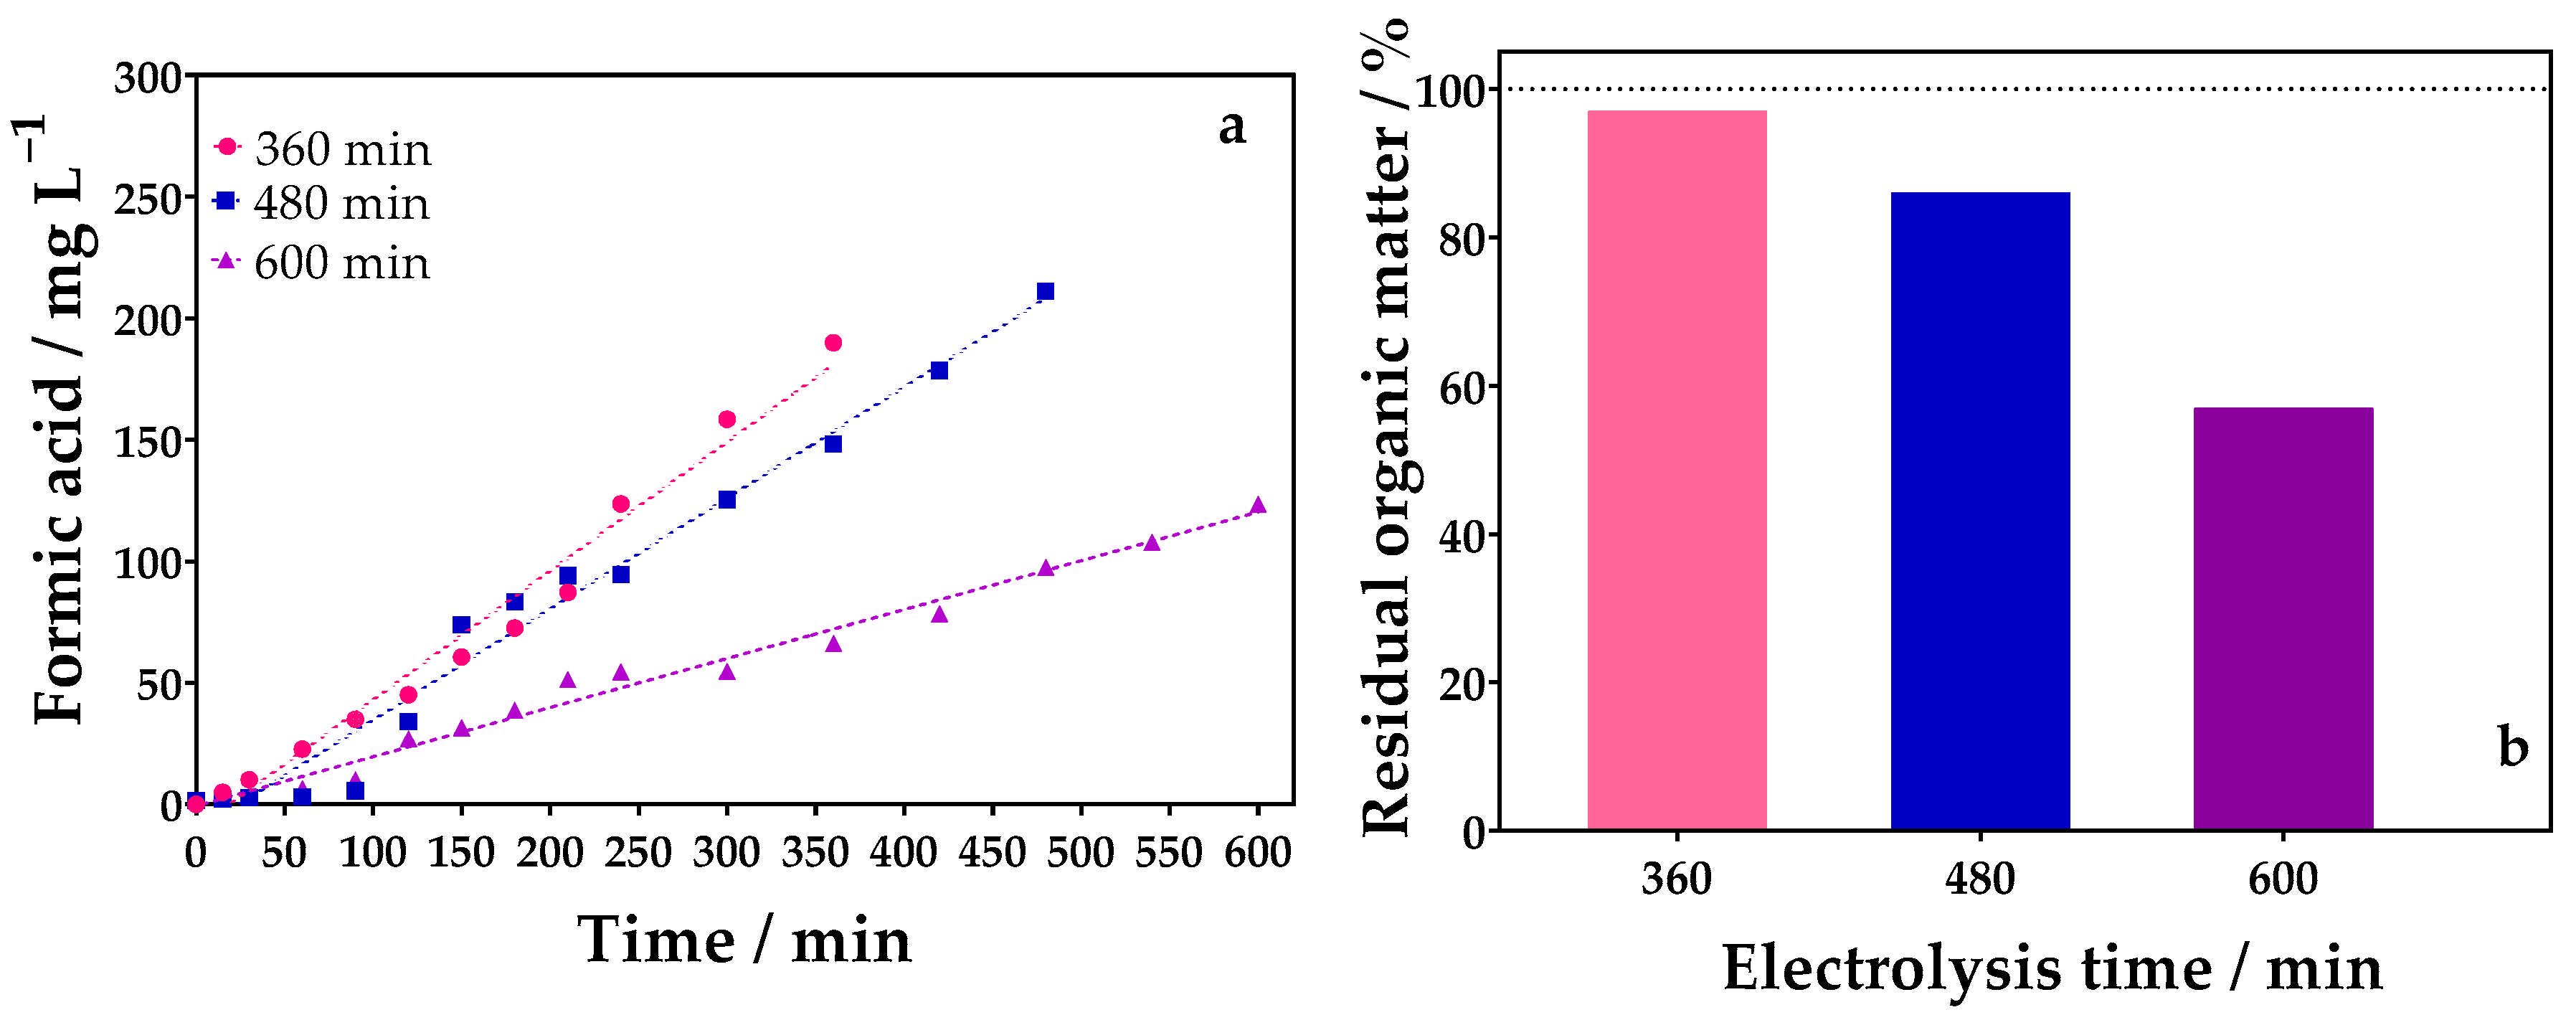
2.3.3. Influence of Treatment Time

Electrolysis time was another parameter studied. According to Faraday’s law, the longer the electrolysis time, the greater the amount of product. However, during the electrolysis of organic substances, the co-product generated can be completely oxidized in prolonged electrolysis times, so its concentration will not increase linearly with the electrolysis time.
To verify these two hypotheses, electrolysis times of 360, 480, and 600 min were evaluated. As can be seen in Figure 7a, longer electrolysis times led to the generation of high FA concentrations, obtaining 188.93, 256.21, and 297.06 mg L−1 of FA for 360, 480, and 600 min of electrolysis, respectively. Although the concentration of FA increases for longer electrolysis times, the increase from 480 min to 600 min is not really significant. This suggests that the FA is being oxidized to CO2 or competing for active sites on the electrode surface, which would prevent the oxidation of more glycerol molecules to FA. This result is confirmed by the TOC figures reported in Figure 7b.
Meanwhile, the effect of electrolysis time was more evident in the divided cell experiments, as shown in Figure 8. Higher FA concentrations of about 189.92, 211.16, and 123.67 mg L−1 were obtained for 360, 480, and 600 min of electrolysis, respectively. These results are in line with Faraday’s law which correlates the total charge, Q = it, passing through a cell with the amount of product, n (mol) [44]. As the charge is proportional to the amount of product generated, the higher the current or time, the higher the concentration of the chemical species generated. However, when the electrolysis time is increased to 600 min, the concentration of FA decreases significantly, indicating that the mineralization process is favored since it can be oxidized directly at the electrode surface or indirectly by OH radicals and subsequently converted into CO2. This result was confirmed by the TOC analysis (Figure 8b), which reveals that the residual organic matter content decreased at longer electrolysis times.

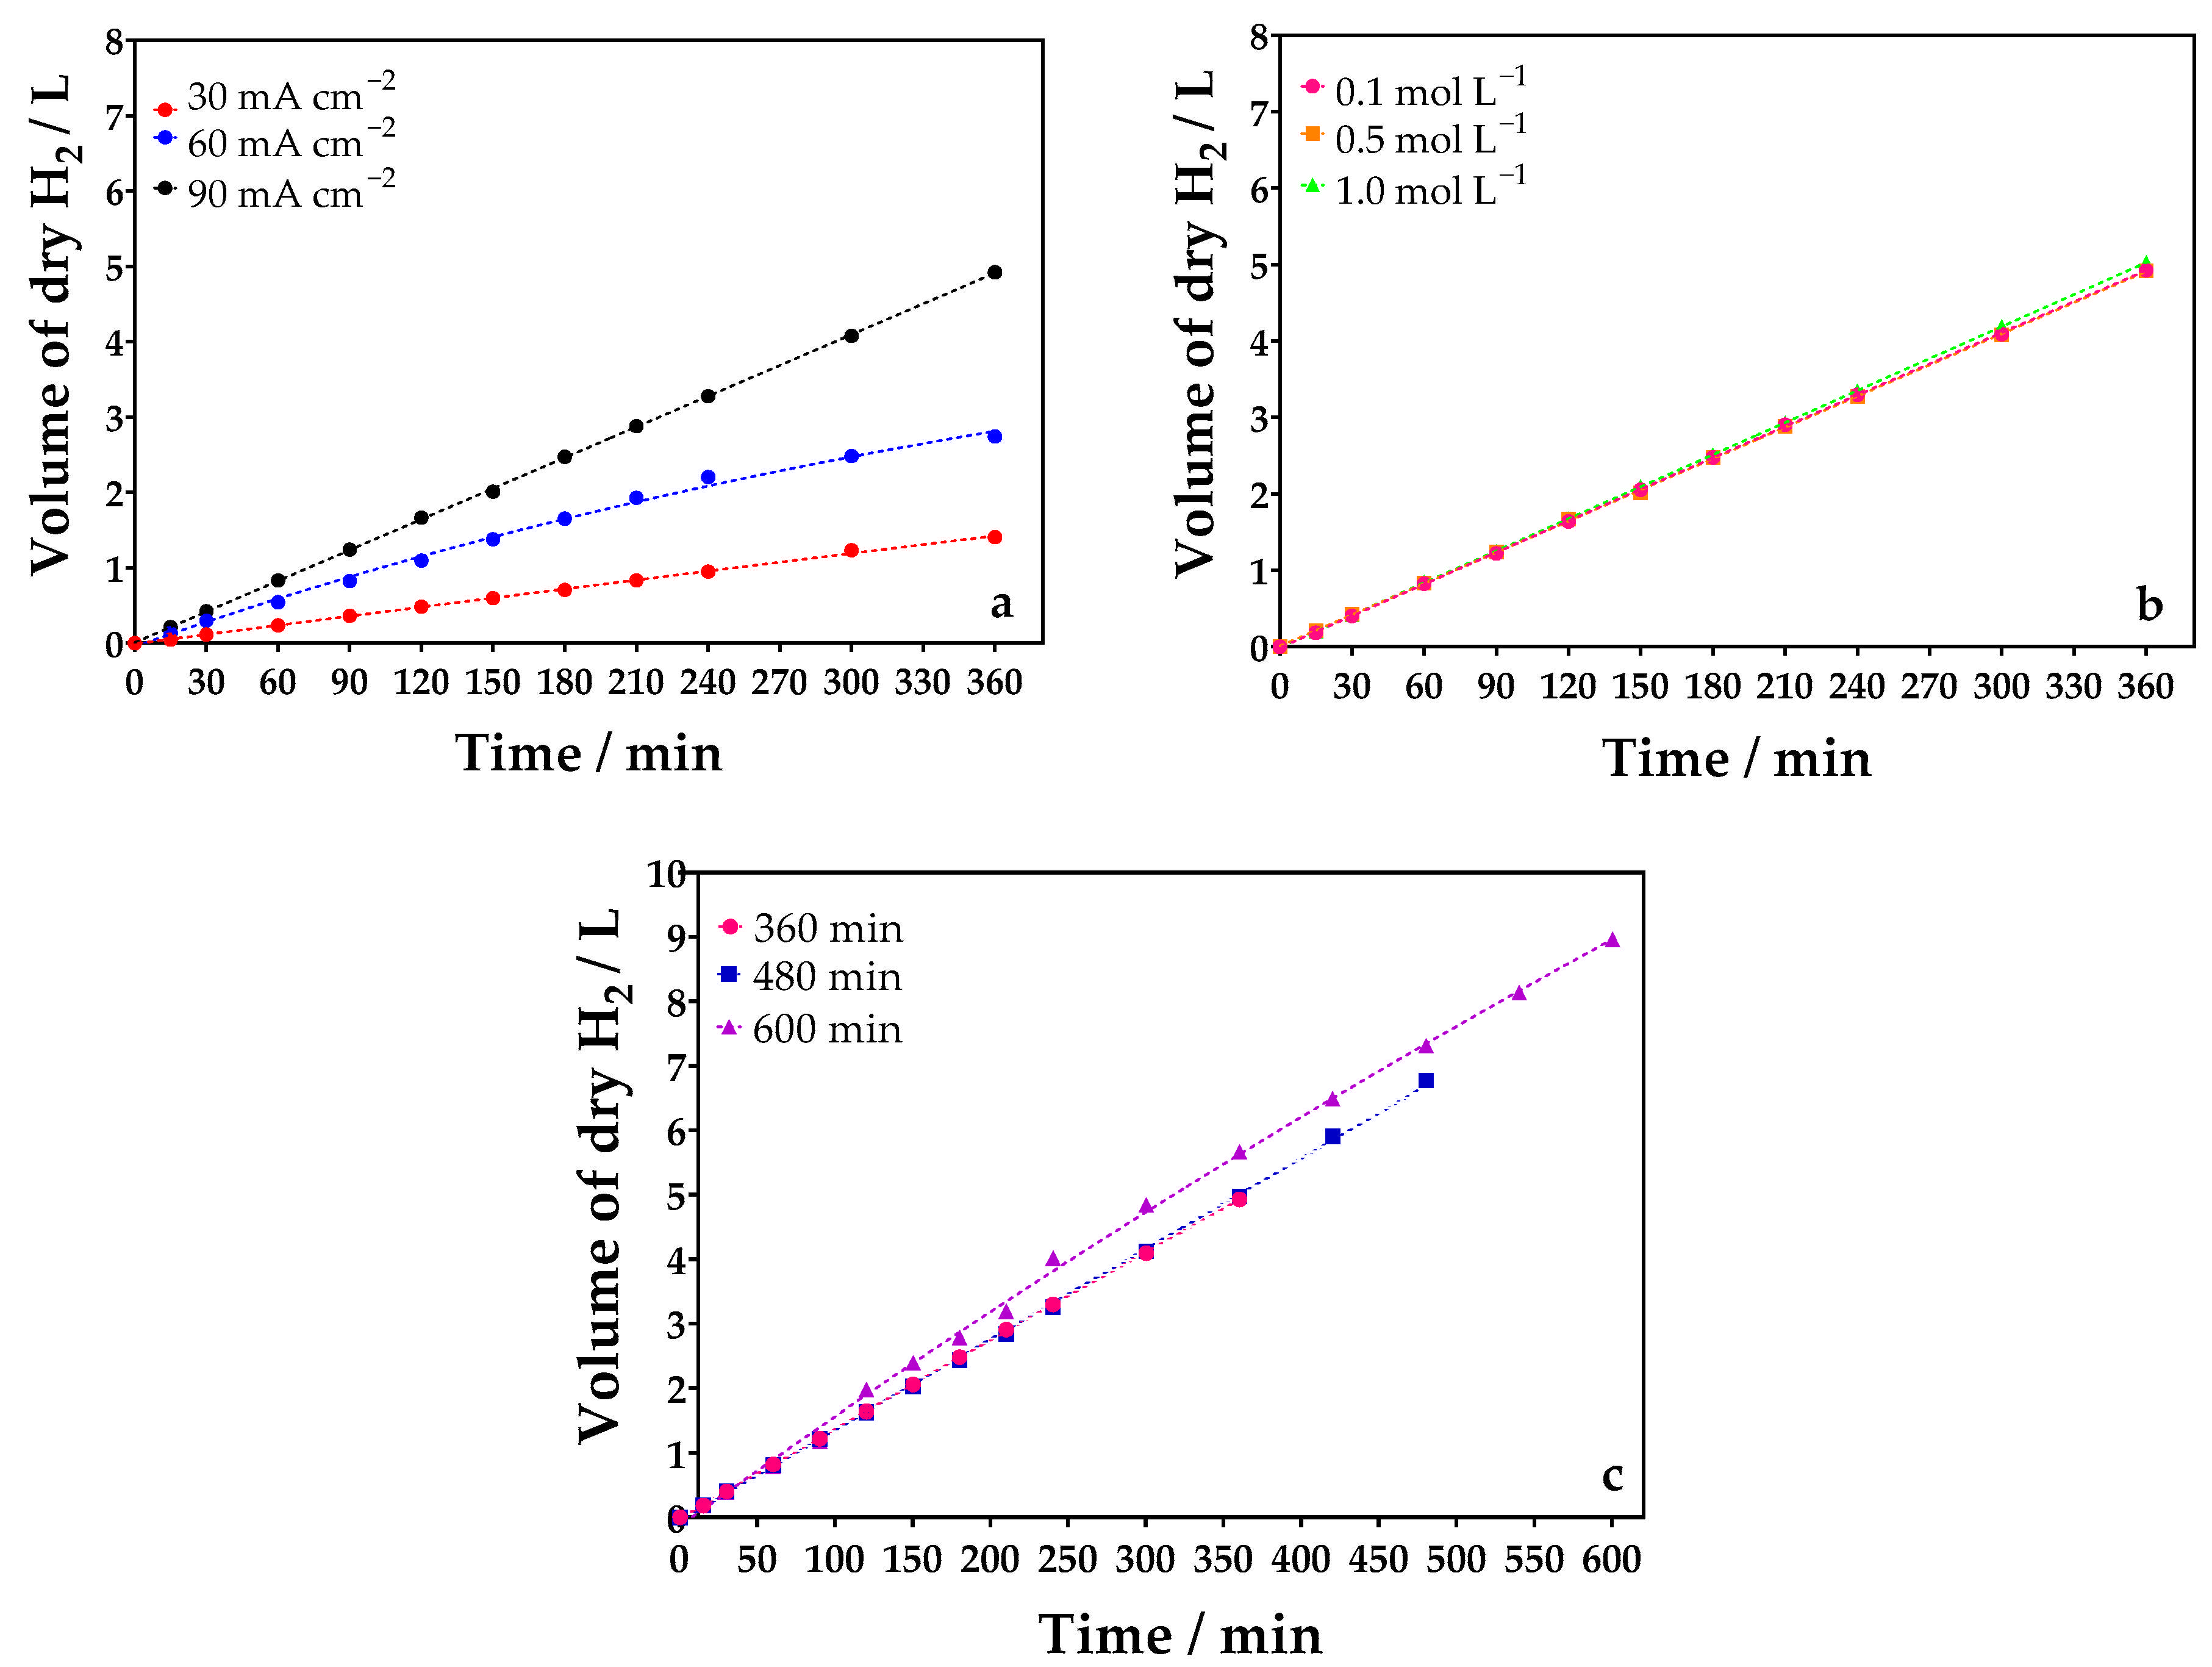
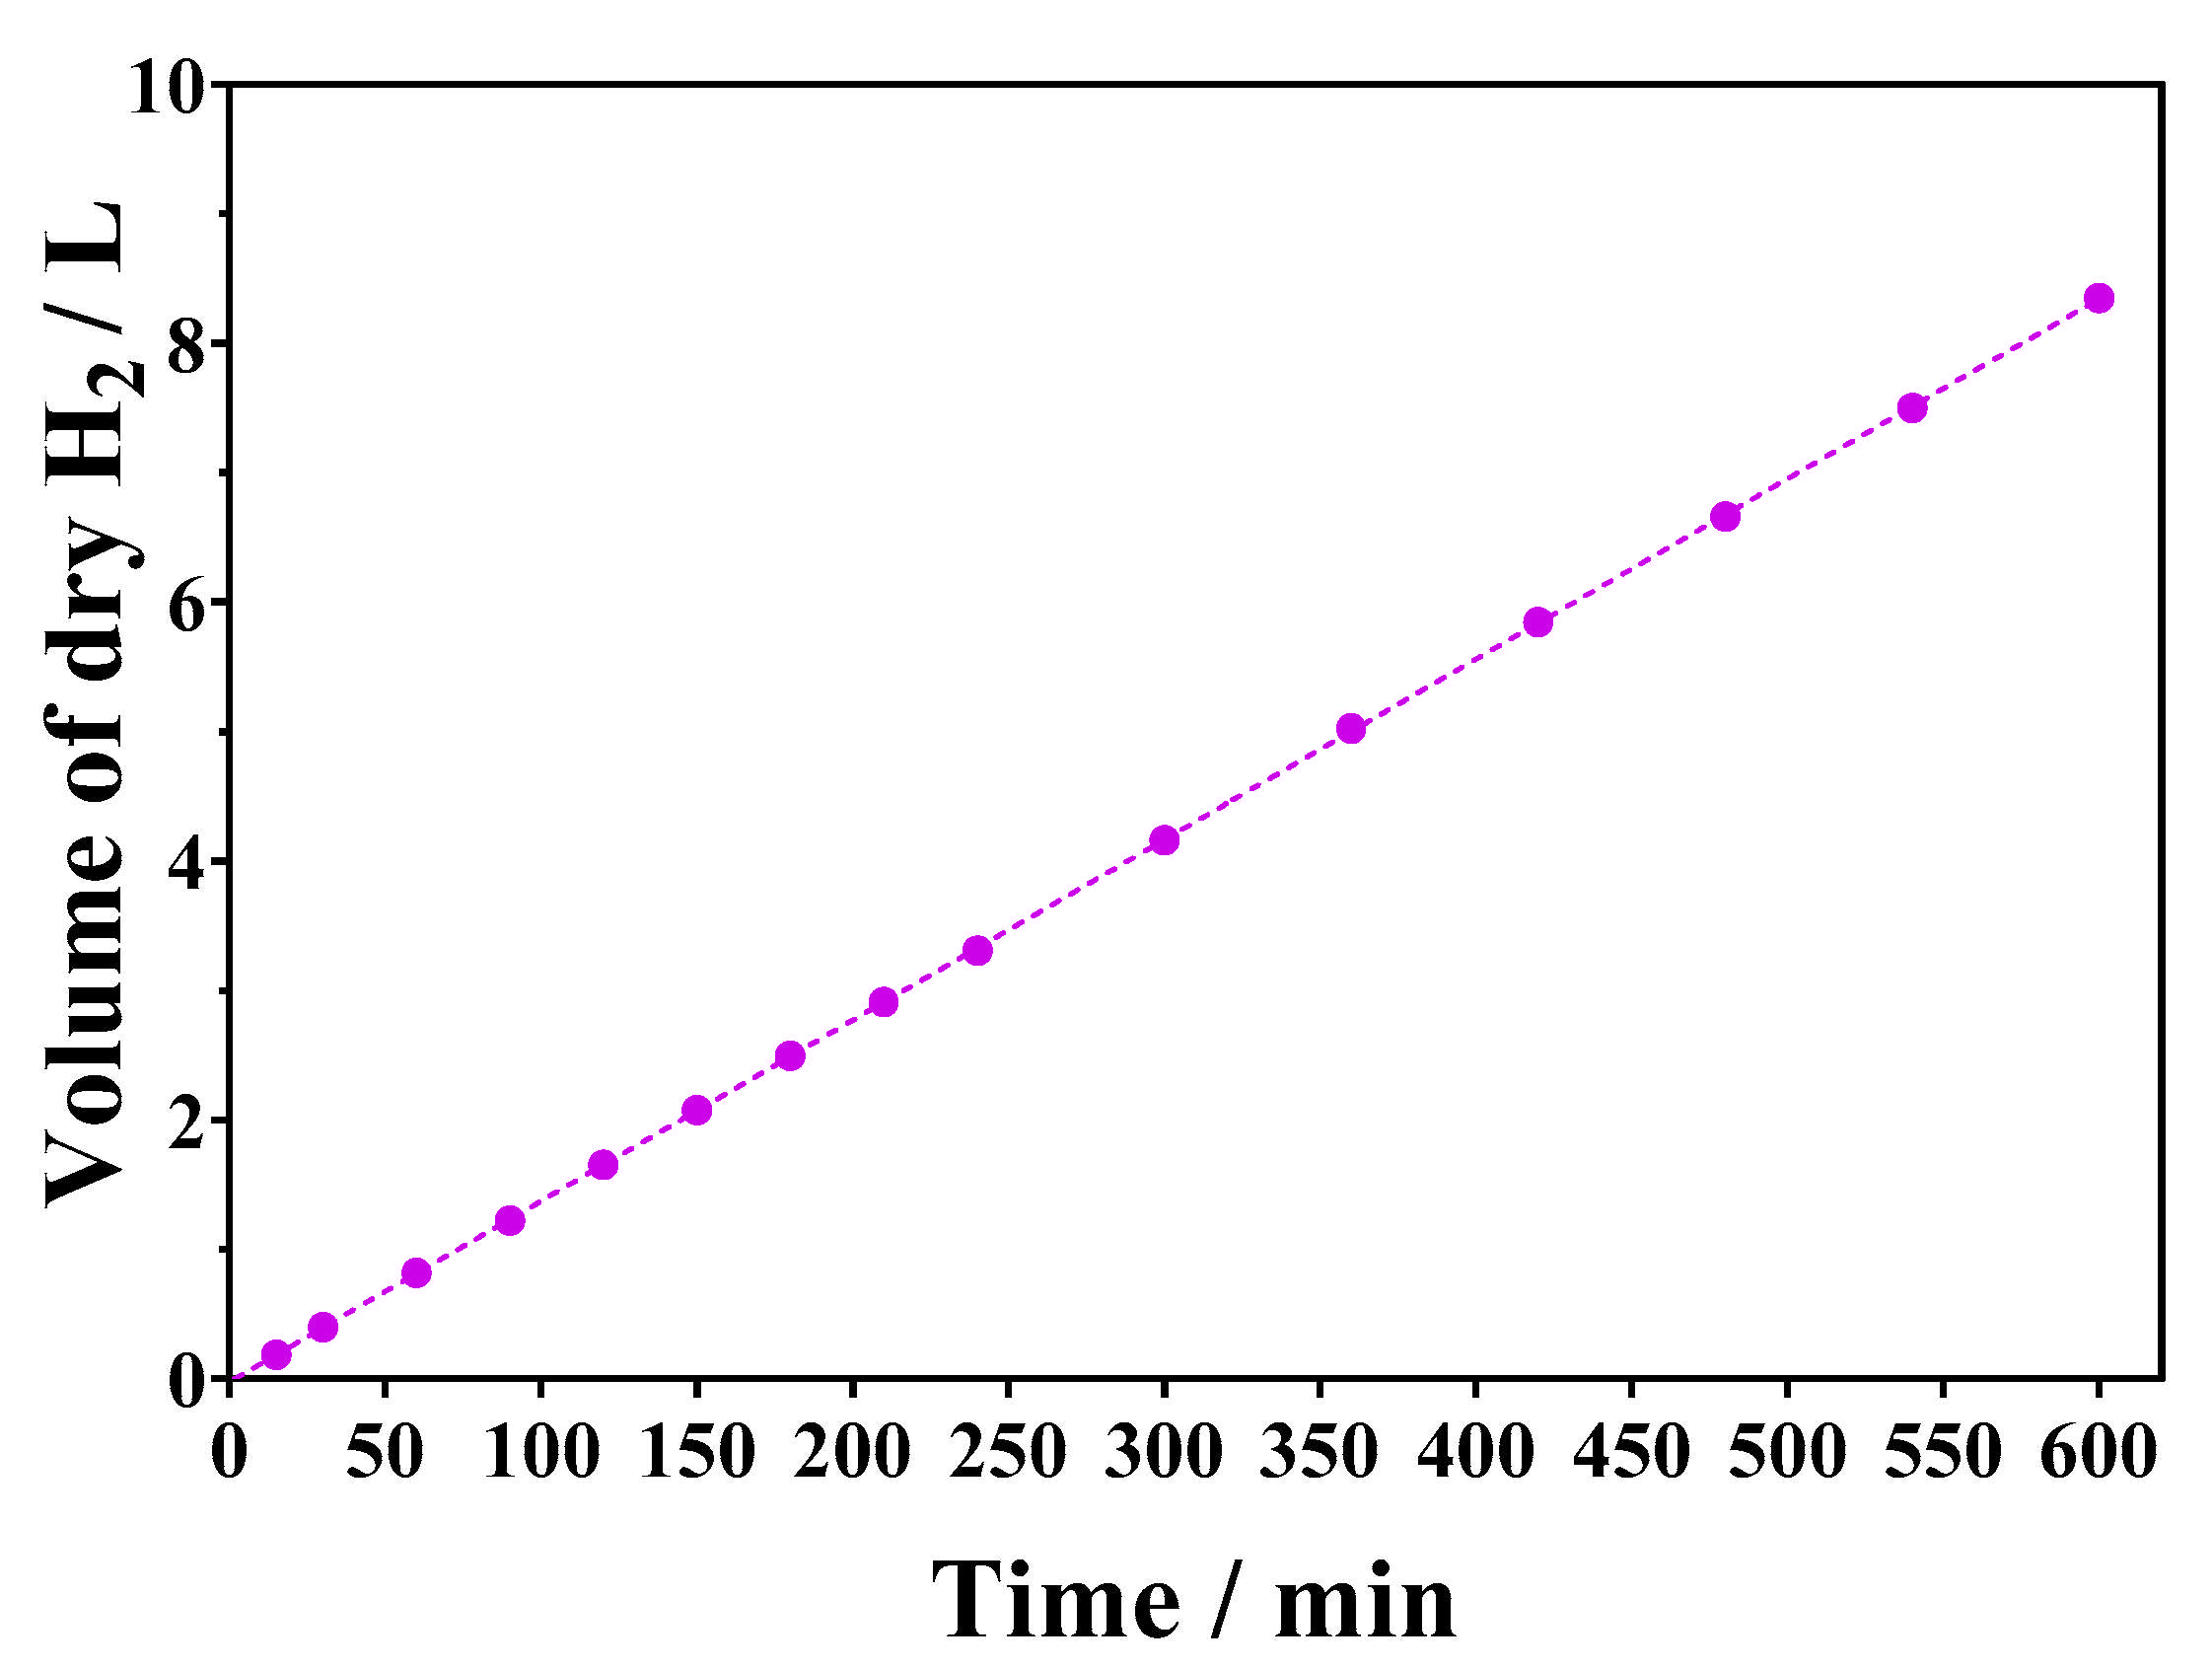
2.4. Production of Hydrogen

When divided electrochemical cells are employed, H2 electrochemically produced in the cathodic compartment by the hydrogen evolution reaction (HER), as shown in Equation (5), can be obtained with a higher purity and efficiency without the need for additional purification procedures and separation from other gases [45]. The advantages of electrolysis over other H2 production methods are as follows [45]: (i) H2 is not mixed with other gases, (ii) higher H2 volume is produced in short-times, (iii) the required electricity is obtained from an emission-free method such as wind, solar, geothermal, or tidal systems, (iv) H2 produced can be directly used on demand strategies, (v) modular electrolyzers reduce the plant dimensions, among others.
2H2O + 2e → H2 + 2OH
So, with the use of divided cells, it is possible to work with a different anode/anolyte from the cathode/catholyte, to obtain the products in isolation and to avoid unwanted reactions and the formation of explosive mixtures, such as H2/O2, and toxic ones, such as H2/Cl2. The effect of the current density, the concentration of the supporting electrolyte, and the electrolysis time were also investigated on the cathodic production of H2 when a divided electrochemical reactor was used.
In the cathodic compartment, thermodynamically, the only possible product is H2, since at pH < 7, the H3O+ reduction potential is 0.0 V. On the other hand, the reduction potential of the sulfate ion is much more negative, making this reaction practically impossible to compete with the production of H2 [46]. Therefore, as there are no parallel reactions to compete with the reduction of H3O+ to generate H2 and considering that the reagents and water used to prepare the solution are of high purity, it is expected that only j and electrolysis time should influence HER. In fact, these assertions are confirmed by the results reported in Figure 9a,c. As higher j is applied, green H2 production increases in conformity with Faraday’s law. Therefore, after 360 min, 1.41, 2.74, and 4.92 L of green H2 are collected by applying 30, 60, and 90 mA cm−2. Additionally, a linear relationship can be observed between green H2 production and electrolysis time. Meanwhile, the concentration of Na2SO4 did not influence green H2 production (Figure 9b). Finally, the longer the electrolysis time, the higher the H2 production (Figure 9c).
The primary findings of the DSA anode-based glycerol electroconversion experiments, in which the following parameters were investigated: cell design, electrolysis time, supporting electrolyte concentration, and j, are summarized in Table 1. Figures related to the amount of dry green H2 co-produced simultaneously to the conversion of glycerol into FA, in terms of efficiency, are also included in the table. The Faraday efficiency for FA production was determined according to Equation (6) [47,48,49]:
% FE = 8   ×   n FA   ×   F 3   ×   Q × 100  
where 8/3 means eight electrons are required to convert a glycerol molecule to three FA molecules, n(FA) is the total amount (in units of moles) of FA obtained from EO, F is the Faraday constant (F = 96485 C mol−1), and Q is the total charge passed through the electrochemical cell. All the EFs for FA were lower than 3%, which demonstrates the low capacity of the DSA electrode for the EO of glycerol (Table 1). However, only FE about 2.66% was obtained for FA production by applying 90 mA cm−2 in 0.1 mol L−1 Na2SO4 during 480 min of electrolysis in the undivided cell. According to the literature (see Table S1 in the SM), other electrocatalysts have achieved better performances in electroconverting glycerol into FA; however, the electrodes were modified with expensive metallic catalysts and no real effluent has been used to prove the concept. Therefore, our investigations have been extended to treat a real water matrix containing glycerol and to convert it into FA.

2.5. EO of a Real Sample

A real effluent sample from the washing stage of biofuel production was electrolyzed by using undivided and divided cells under optimized conditions (j, electrolyte concentration, and electrolysis time) from the production of FA during the EO of the glycerol-based synthetic effluent. The physical–chemical characterization of the real sample before and after the electrochemical process is shown in Table 2. This real effluent sample presented similar values of COD and TOC to those measured for the synthetic effluent previously studied. However, as the real sample is composed of chemical species other than glycerol, FA may be generated depending on the chemical stability of these species.
Furthermore, in the non-divided cell configuration, the oxidation products can be reduced, which would prolong the time needed to convert the reduced oxidation products to valuable compounds. On the other hand, it is expected that the production of FA in the divided cell configuration will be greater since the oxidation products will not have contact with the cathode. By analyzing the COD removal results (Figure S6 in the SM), it can be seen that organic matter removal was higher in the undivided cell configuration and TOC decay (Figure S7 in the SM) was also higher in this configuration. Consequently, FA production was lower in the undivided cell than that achieved in the divided cell configuration where 490 mg L−1 (Figure 10a) and 567.39 mg L−1 (Figure 10b) were produced, respectively, after 600 min of electrolysis. In addition to FA, the co-production of acetic acid was attained in lower concentrations in both cell configurations.
Simultaneously to the production of carboxylic acids in the anodic compartment of the divided cell from the residue of the biofuel washing step, green H2 was co-generated in the cathodic compartment. The results of H2 production, as a function of electrolysis time, can be seen in Figure 11. As previously discussed, the volume of H2 linearly increased with the electrolysis time according to Faraday’s law, obtaining a volume of 8.43 L after 600 min of electrolysis, which is about 99.5% of the current efficiency.

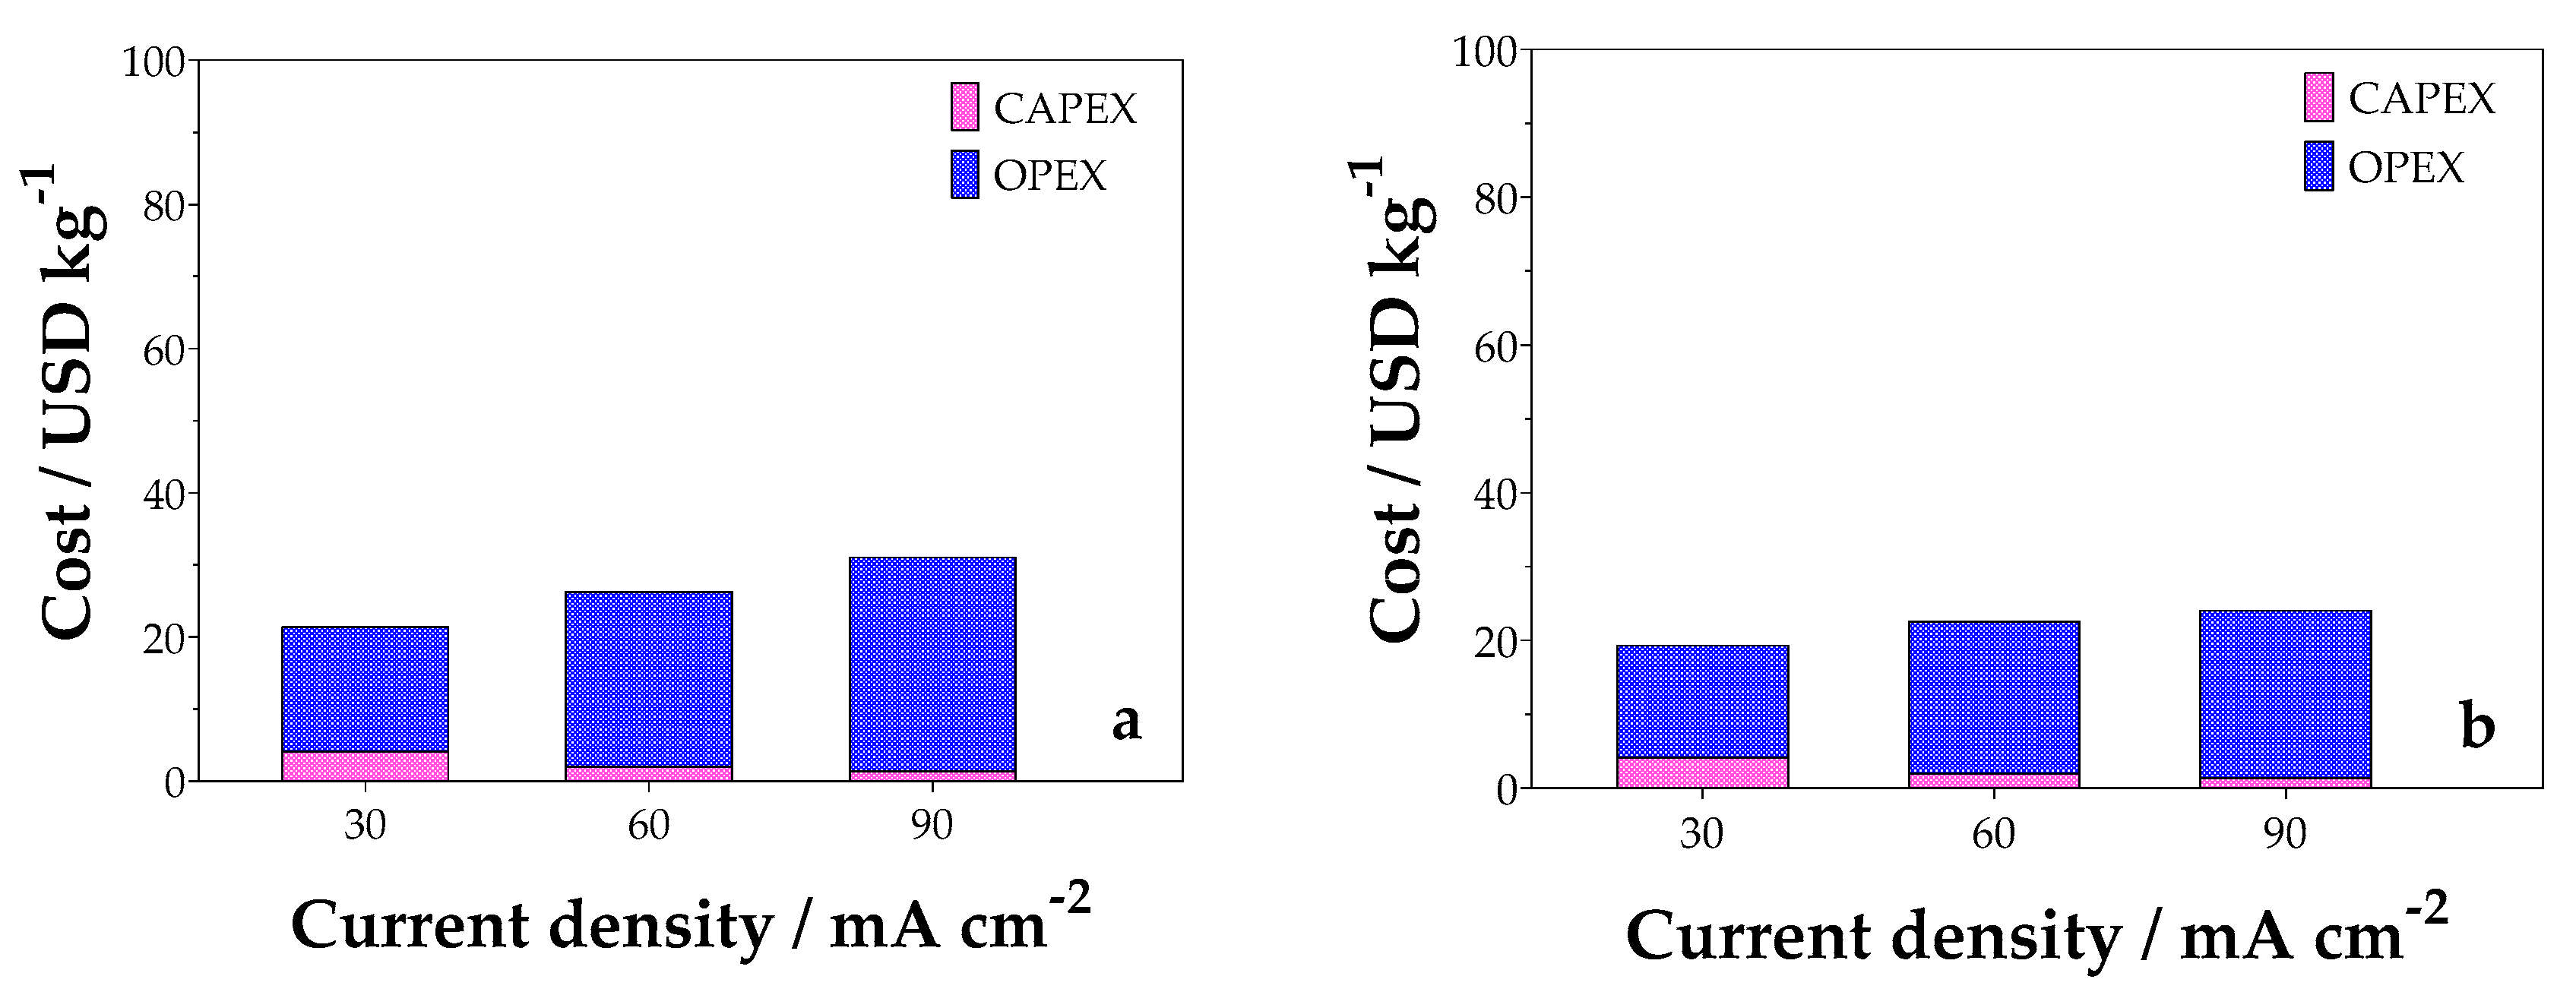
2.6. Preliminary Economic Analysis

Finally, a preliminary economic analysis was performed to estimate the capital and operating expenses, CAPEX and OPEX, respectively. Figure 12 shows the CAPEX and OPEX costs obtained for the undivided and divided cell configurations, respectively, as a function of the variation in j. For CAPEX, the most significant contribution is associated to the electrochemical cell, since the estimated cost of the DSA anode is significant due to the manufacturing material process. As for the operating costs, the most significant contribution is the cost of electricity, followed by the cost of reagents [26,50].
It was also observed that for both cell configurations studied, there is a relationship between j and CAPEX values (Equation (12)). The higher the j, the lower the CAPEX, obtaining values of about 4.14, 2.07, and 1.38 USD/kg−1 H2 for 30, 60, and 90 mA cm−2, respectively, in the undivided cell. Meanwhile, the operating costs increase with j since the energy consumption of the cell is high, as shown in Figure 12.
Figure 13 shows the process cost as a function of electrolyte concentration. Then, considering that j = 90 mA cm−2, no large variations in CAPEX were observed. As can be observed in Figure 13, when an increase in the concentration of the supporting electrolyte is attained, the value of the operating cost decreases, although the cost related to the consumption of raw materials increases. In the case of the undivided cell, OPEX corresponds to 97.12% of the total cost when Na2SO4 0.1 mol L−1 is used as the electrolyte condition. By increasing the concentration of supporting electrolyte from 0.5 to 1.0 mol L−1 of Na2SO4, OPEX is reduced to 50.41% and 60.37% of the total cost, respectively. For the divided cell, OPEX is about 96.19% (0.1 mol L−1), 93.92% (0.5 mol L−1), and 93.12% (1.0 mol L−1) of the total process cost, at different supporting electrolyte concentrations.
The CAPEX and OPEX decays, in both cell configurations, are due to the fact that as the electrolyte concentration increases, the conductivity of the medium increases, decreasing the cell potential. Even though 0.1 mol L−1 Na2SO4 increased the cost of the process, this concentration was the best condition for the glycerol electroconversion and green H2 cogeneration processes. Concerning the variation in the electrolysis time, a slight increase in OPEX estimation was observed for both configurations investigated (Figure S8 in the SM).
Figure 14 shows the cost per kg of green H2 produced, using the optimized experimental conditions (90 mA cm−2; 0.1 mol L−1 Na2SO4 and 600 min) and biofuel washing effluent as the real sample.
The cost analysis shows that the divided cell process is the most economical. This analysis, together with the experimental results, indicates that the electroconversion of glycerol not only provides an increase in green H2 production capacity, but it also helps to produce value-added carboxylic acids, such as formic and acetic acids, which serve as raw materials for several industries (raw material for cosmetics, food, paints, and pharmaceutical industries) [26]. It is important to remark that CAPEX and OPEX values estimated here are close to the economical considerations analyzed by Grigoriev and co-workers [5] for an alkaline water electrolyzer and PEM cells, which range from 12.48 to 40.50 EUR/kg−1. In addition, when coupled with a renewable energy source such as PV solar power, the process would promote a significant reduction in energy consumption, making the investment advantageous despite the initial cost of purchasing, installing, and maintaining the PV panels [51,52]. Biodiesel production reached 56 billion liters in 2022, with a 7% increase predicted over the next decade. The sustainability of biodiesel production is crucial, as 10 kg of crude glycerol, a byproduct, is generated for every 100 kg of biodiesel. Large production increases lead to large amounts of waste glycerol, requiring research on its valorization [53]. Among the processes used in glycerol valorization, EO is notable for providing excellent selectivity and control over the generation of certain products, such as ketones, aldehydes, and carboxylic acids. Additionally, it could allow compact reactors, mild operating conditions, sustainable H2 generation, simple integration with other technologies, and it has no chemical needs or secondary waste [54,55].

3. Experimental Section

3.1. Chemicals

The chemical reagents used in this study were of analytical grade or high purity. The sodium sulfate used as the supporting electrolyte was supplied by Synth (São Paulo, Brazil). The glycerol used to prepare the synthetic effluent was supplied by CRQ (São Paulo, Brazil).

3.2. Electrochemical System

The electrochemical system was studied in two configurations: divided and non-divided cells (Figure S1 in the Supplementary Material (SM)). The cells consisted of two electrodes (DSA® commercial electrode, which was purchased by De Nora elettrodi SpA (Milan, Italy), Ti/TiO2-RuO2-IrO2 electrode as anode and Ni-Fe stainless steel (SS) as cathode, which have 20.8 cm2 of geometrical area), protected inside an acrylic box (10.0 × 7.5 × 1.7 cm), with pre-drilled holes for the solution inlet, outlet, and for electrical connections. Electrolysis of the synthetic effluent containing 0.1 mol L−1 glycerol was carried out using Na2SO4 as the supporting electrolyte at 298 K by applying 30, 60, and 90 mA cm−2, and this solution was recirculated by reaction compartment in the cells with a peristaltic pump with a constant flow of 3.32 × 10⁻⁶ m3 s−1. All experiments were performed in duplicate, in atmospheric circumstances, and under galvanostatic conditions. In the case of the divided cell, a membrane (cationic or anionic, depending on the pH of the medium) was used to separate the cathodic and anodic compartments of the cell. The cathodic compartment produces H2, while the anodic compartment electrolyzes the effluent. The anodic compartment was filled with synthetic glycerol effluent, while the cathodic compartment was filled with the supporting electrolyte solution at the same concentration as the anodic compartment. A new set of experiments was carried out to explore the effects of the concentration of the supporting electrolyte (0.1, 0.5, and 1.0 mol L−1 of Na2SO4) and the electrolysis time (6, 8, and 10 h) on the EO of glycerol by applying the best j. The green H2 produced was collected in an inverted beaker using the water displacement method connected directly to the cathodic compartment that contained the electrolyte used in the experiment in the same concentration as the anodic compartment. The EO tests were driven by a solar photovoltaic (PV)-battery system (it is described in detail elsewhere [9,56]), which contains two Canadian CS6U-325p polycrystalline silicon solar PV modules connected in series with a combined peak output of 640 Wp and an MPPT (VictronBluesolar 150/45-MC-4, Almere, The Netherlands) between the two 12 V batteries (Solar Freedom, 12 V/240 Ah each, São Paulo, Brazil), installed on the roof of the Núcleo de Estudos em Petróleo e Energias Renováveis (NUPER) at the Federal University of Rio Grande do Norte Natal in Brazil (W 35°12′, S 05°54′), inclined at 5°, and facing south (20° W). The intensity of the current increases until reaching a daily peak of 16.8 A around midday and lasting about 3.5–4 h a day with an almost constant voltage of 27 V. The electrical energy stored in the batteries is used to supply the necessary current to the electrochemical system during the decontamination of the effluent while the simultaneous electrochemical production of H2 is achieved. Due to the use of renewable energy, the energy carriers generated are called green H2 and green FA.

3.3. Polarization Curves

Polarization curves were obtained by linear sweep voltammetry measurements that were carried out in a conventional three-electrode electrochemical cell by using an Autolab model PGSTAT302N potentiostat/galvanostat in Na2SO4 electrolyte solution at concentrations of 0.1, 0.5, and 1 mol L−1 in the absence and presence of 0.1 mol L−1 glycerol, in the potential range from 0 V to +1.5 V, with a scan rate of about 5 mV s−1 at 298 K. A platinum electrode was used as the counter electrode, Ag/AgCl (KCl, 3 mol L−1) as the reference electrode in a capillary Luggin to avoid the resistance variations, and Ti/TiO2-RuO2-IrO2 as the working electrode.

3.4. Electrochemical Cells Characterization

The reactors were characterized by using a K3[Fe(CN)6]/K4[Fe(CN)6] protocol [42] with different cell configurations connected to a potentiostat/galvanostat model PGSTAT302N from Autolab with anodic and cathodic materials described above. Linear voltammetries were registered in the potential range from 0 V to 0.8 V, with a scan rate of 5 mV s−1 at 298 K by using K3[Fe(CN)6]/K4[Fe(CN)6] solutions (with concentrations ranging from 1 mmol L−1 to 10 mmol L−1 for K4 [Fe(CN)6] and 5 mmol L−1 to 50 mmol L−1 for K3[Fe(CN)6]) in 1 mol L−1 NaOH. Triplicate measurements were performed to avoid significant discrepancies. Mass transfer coefficients were obtained by diffusion-limiting current estimations from the value of the limiting current using an expression based on Fick’s law, expressed as follows [57,58]:
N A A = D C b C i δ
where  N A  is moles/unit of time which can be replaced by  i nF  (i is the current, n is the number of electrons transferred from the electrochemical reaction, and F is the Faraday constant), A is the electrode area, D is the diffusion coefficient, Cb is the concentration of the species in the bulk of the solution, Ci is the concentration of the species on the electrode surface, and δ is the thickness of the diffusion layer [59]. Thus, the previous equation (Equation (7)) can be rewritten as follows:
i nAF = D C b C i δ
Under current-limiting conditions, the species are consumed on the electrode surface so that their concentration on the surface, Ci, becomes less than the value in the bulk of the solution, Cb, i.e., it tends to zero, and so the value of Cb becomes much greater than the value of Ci [57,60]. We can therefore ignore the value of Ci in Equation (8) and rewrite it as follows:
i lim nAF = k C b
where ilim is the limiting current and k = D/δ is the mass transfer coefficient [59,60]. Equation (9) can be rearranged to obtain the following:
i lim = knAF C b
Using the angular coefficient of the plot of the limiting current versus the bulk concentration of an electroactive species, it is possible to estimate the mass transfer coefficient, an important parameter that is affected by the configuration of the cell.

3.5. Analytical Techniques

The organic matter content was monitored through the chemical oxygen demand (COD) and total organic carbon (TOC) analyses. For the COD analysis, 0.2 mL samples were added in vials with pre-dosed reagents (HANNA® vials, Woonsocket, RI, USA). Then the samples were digested in a thermal reactor at 150 °C for 2 h. After digestion, the samples were analyzed by using the smartphone protocol at 25 °C [61,62]. TOC determination was performed using a TOC analyzer (Analytikjena, Jena, Germany), for the initial and final samples, according to the EPA 9060a method (U.S. EPA Office of Solid Waste Methods). The determinations of organic acids in the collected samples were carried out with a Dionex Ion Chromatography System, model ICS 2000 (Sunnyvale, CA, USA), equipped with an integrated eluent (potassium hydroxide) generator, model RFIC-EG (EGC III KOH cartridge), and an ADRS 600 2 mm membrane suppressor. Conductivity signals were measured with a DS6 heated conductivity cell, and the chromatograms were acquired and registered using Chromeleon software, version 6.8 (Dionex). Separation was performed with an Ion-Pac AS19 analytical column (2 × 250 mm) and an IonPacAG19 guard column (2 × 50 mm) to protect the analytical column. The eluent was pumped at a flow rate of 0.25 mL min−1 using a gradient program with a potassium hydroxide solution: 0–12 min (5 to 10 mmol L−1); 12 to 30 min rising linearly to 30 mmol L−1; and in 30 min change to 40 mmol L−1 remaining at this concentration until 32 min, where it was returned to the initial concentration to balance the column for the next injection. The sample solutions were injected using an AS40 autosampler and a 10 μL loop injector. A current of 31 mA was applied to the suppressor device. Under these conditions, acetate and formate peaks appeared at 6.35 and 7.01 min, respectively.

3.6. Application to Real Sample

The investigations were extended to the applicability of the electrocatalytic refinery strategy in organics to real samples by using divided and non-divided cells once the best operating conditions were established. A well-known amount of sodium sulfate (achieving a concentration of about 0.1 mol L−1) was added to real effluent as a supporting electrolyte. The real sample was provided by NUPPRAR/LABPROBIO research center, and it was collected during the washing phase of the production of biofuels.

3.7. Economic Analysis

For the economic analysis, the fixed Capital Expenditure (CAPEX) represents the cost of the investment, and the Operational Expenditure (OPEX) represents the cost during the operation of the electrolyzer. The CAPEX is focused on electrode acquisition. The DSA price, according to the information obtained by the authors from the supplier, can be estimated at 4250 USD/m−2 [52]. The OPEX depends on the cell voltage and the cost of electricity. CAPEX and OPEX were calculated using Equations (11) and (12) [52].
OPEX = V cell   F 3600   EC
CAPEX = 2 F ICs t M H 2 1 j
where Vcell is the cell voltage in V, F is Faraday’s constant in A s mol−1, EC is the energy cost in USD/kW h−1, ICs can be considered as the cost of electrode per unit area in USD/m−2 (to be a general estimation of the initial cost), t is the electrolyzer lifespan in s, and MH2 is the molar mass in kg mol−1. The determination of the adopted kWh cost considered the rates charged by NEOENERGIA COSERN (Rio Grande do Norte’s energy enterprise) for projects related to public water, sewage, and sanitation (0.12 USD/kWh−1). The life of the electrolyzer is estimated at approximately 90,000 h [5].

4. Conclusions

In summary, EO is a potential alternative for developing an integrated-hybrid strategy for electroconverting glycerol into valuable compounds with co-generation of green H2. The electrochemical transformation of glycerol was mainly influenced by j, supporting electrolyte concentration, electrolysis time, as well as the configuration of the electrochemical cell. Increasing the j, the production of FA increased in both electrochemical cell configurations (divided and undivided), but the accumulation was superior in the divided cell (90.45 and 83.45 mg L−1 for the divided and undivided cells, respectively, by applying 90 mA cm−2). Electrochemical mineralization was more effective in the divided cell as j increased, reaching approximately 20% of the TOC decay at 90 mA cm−2, justifying the decrease in the FA production. Increasing the concentration of Na2SO4 used as a supporting electrolyte inhibited the electrochemical conversion of glycerol and, thus, FA production and mineralization decreased in both electrochemical cell configurations. By using an undivided cell, 188.93 mg L−1 was produced with 0.1 mol L−1 of Na2SO4 by applying 90 mA cm−2 after 360 min, while the production of FA was about 182.92 mg L−1 by using an undivided cell under the same experimental conditions. The effect of treatment time was more evident in the divided cell, in which FA production increased up to 480 min and decreased for longer times. However, FE for FA formation was lower than 3%. Mineralization, on the other hand, increased as longer conversion times were used. Conversely, green H2 production, simultaneously with co-electroconversion of glycerol in the divided cell, was only influenced by j and electrolysis time.
When a real glycerol effluent sample was electrolyzed in 0.1 mol L−1 of Na2SO4 with the DSA anode by applying 90 mA cm−2 for 600 min, formic and acetic acids were generated in the divided and undivided cells. However, the concentration of these organic acids in the non-divided cell was 47.51 and 490.65 mg L−1, respectively, and in the divided cell, it was about 384.03 and 567.39 mg L−1, respectively. Then, the mineralization of organic matter was higher in the undivided cell than the other one. After 600 min of electrolysis of a real glycerol effluent in a divided cell, a volume of about 8.43 L of green H2 was co-produced with an efficiency of 99%.
Finally, the preliminary cost analysis showed that the divided cell integrated-hybrid process is the most economical. However, no cost considerations about the sale of energy carriers like green H2 and FA were considered, which serve as raw materials for various industries and thus these contribute to making the electrochemical process more sustainable. This should also be considered for the electro-production of acetic acid. Also, the extra-electrical energy produced by PV panels is a gain that should be considered as a positive value.
There are a number of difficult problems facing water electrolysis science and technology, but in the case of this novel strategy, the goals of the majority of R&D projects could be achieved by enhancing efficiency (to lower OPEX) and increasing the operating current density (to lower CAPEX) [45]. Concurrently, the electrolyzer with a synthesis compartment, H2 compressor, and recovery of valuable compound systems must be optimized to enable the cost-effective and safe on-site delivery of H2 as well as the storage of byproducts.

Supplementary Materials

The following supporting information can be downloaded at: https://www.mdpi.com/article/10.3390/catal15040333/s1, Figure S1: Schematic diagram of the complete electrochemical system. In a system with an undivided cell composed of: (1) solar PV–battery power system, (2) power supply, (3) electrochemical cell, (4) reservoir of compound to be oxidized (1 L), (5) peristaltic pump. In b, divided cell system composed of: (1) solar PV–battery power system, (2) power supply, (3) electrochemical cell, (4) reservoir of compound to be oxidized (1 L), (5) peristaltic pump and (6) H2 collector; Figure S2: Mechanism of the electrochemical oxidation of glycerol; Figure S3: %COD removal at the end of EO using (a) undivided and (b) divided reactors for different j (30 (), 60 (), and 90 (▲) mA cm−2). Experimental conditions: 0.1 mol L−1 of glycerol using 0.1 mol L−1 of Na2SO4 as supporting electrolyte with DSA (20.8 cm2) as anode, and Ni-Fe steel stainless (SS) as cathode at 298 K; Figure S4: % COD removal at the end of oxidation using (a) undivided, and (b) divided reactors for different Na2SO4 concentrations (0.1 (), 0.5 (), and 1.0 () mol L−1) at 90 mA cm−2. Experimental conditions: 0.1 mol L−1 of glycerol using 0.1 mol L−1 of Na2SO4 as supporting electrolyte with DSA (20.8 cm2) as anode, and Ni-Fe steel stainless (SS) as cathode at 298 K; Figure S5: %COD removal at the end of EO using (a) undivided and (b) divided reactors for different electrolysis times (360 (), 480 () and 600 () min). Experimental conditions: 0.1 mol L−1 of glycerol using 0.1 mol L−1 of Na2SO4 as supporting electrolyte DSA (20.8 cm2) as anode, and Ni-Fe steel stainless (SS) as cathode at 298 K; Figure S6: %COD removal at the end of oxidation of the real glycerol sample according to the electrochemical cell used. Experimental conditions: supporting electrolyte Na2SO4 0.1 mol L−1, DSA (20.8 cm2), electrolysis time: 600 min; Figure S7: %TOC removal at the end of electrolysis of the real glycerol effluent sample. Experimental conditions: supporting electrolyte Na2SO4 0.1 mol L−1, DSA (20.8 cm2), electrolysis time: 600 min; Figure S8: CAPEX and OPEX costs for (a) undivided and (b) divided cells in relation to variation in electrolysis time; Table S1: Performances of recently reported anode materials used in electrolysers for glycerol electroreforming and H2 co-generation. Refs [63,64,65,66,67,68,69] are cited in Supplementary Materials.

Author Contributions

Conceptualization, J.E.L.S., M.A.Q., E.V.d.S. and C.A.M.-H.; Methodology, L.M.G.d.S., L.G.A.C., J.E.L.S. and E.C.T.d.A.C.; Software, A.D.G. and E.V.d.S.; Validation, L.M.G.d.S., L.G.A.C., J.E.L.S., E.V.d.S. and C.A.M.-H.; Formal analysis, L.M.G.d.S., L.G.A.C., J.E.L.S. and A.M.d.M.A.; Investigation, L.M.G.d.S., L.G.A.C., E.C.T.d.A.C., A.M.d.M.A., L.N.C., M.A.Q., E.V.d.S. and C.A.M.-H.; Resources, A.D.G., L.N.C., M.A.Q., E.V.d.S. and C.A.M.-H.; Data curation, J.E.L.S., E.C.T.d.A.C., A.M.d.M.A., A.D.G., L.N.C., M.A.Q. and E.V.d.S.; Writing—original draft, L.M.G.d.S., L.G.A.C., J.E.L.S., E.C.T.d.A.C., A.D.G., L.N.C., M.A.Q. and C.A.M.-H.; Writing—review & editing, E.V.d.S. and C.A.M.-H. All authors have read and agreed to the published version of the manuscript.

Funding

Financial support from Conselho Nacional de Desenvolvimento Científico e Tecnológico (CNPq, Brazil) (408110/2022-8, 317075/2023-3, 315879/2021-1, 402736/2022-2, 421313/2023-4, 403008/2022-0), and from Fundação de Amparo à Pesquisa do Estado de São Paulo (Brazil), FAPESP 2014/50945-4 and 2019/13113-4 is gratefully acknowledged.

Data Availability Statement

The data that support the findings of this study are available from the corresponding author upon reasonable request.

Conflicts of Interest

The authors declare no conflicts of interest.

References

  1. Ji, J.; Lou, W.; Shen, P. Modular Design in Metal-Organic Frameworks for Oxygen Evolution Reaction. Int. J. Hydrogen Energy 2022, 47, 39443–39469. [Google Scholar] [CrossRef]
  2. Cano, Z.P.; Banham, D.; Ye, S.; Hintennach, A.; Lu, J.; Fowler, M.; Chen, Z. Batteries and Fuel Cells for Emerging Electric Vehicle Markets. Nat. Energy 2018, 3, 279–289. [Google Scholar] [CrossRef]
  3. Ma, N.; Gong, C.; Xie, H.; Shi, C.; Sha, J.; He, C.; He, F.; Zhao, N.; Liu, E. Metal-Oxygen Bonding Nanoarchitectonics for Regulation of Oxygen Evolution Reaction Performance in FeNi-Codoped CoOOH. Int. J. Hydrogen Energy 2022, 47, 29762–29770. [Google Scholar] [CrossRef]
  4. Suen, N.T.; Hung, S.F.; Quan, Q.; Zhang, N.; Xu, Y.J.; Chen, H.M. Electrocatalysis for the Oxygen Evolution Reaction: Recent Development and Future Perspectives. Chem. Soc. Rev. 2017, 46, 337–365. [Google Scholar] [CrossRef]
  5. Grigoriev, S.A.; Fateev, V.N.; Bessarabov, D.G.; Millet, P. Current Status, Research Trends, and Challenges in Water Electrolysis Science and Technology. Int. J. Hydrogen Energy 2020, 45, 26036–26058. [Google Scholar] [CrossRef]
  6. Du, L.; Sun, Y.; You, B. Hybrid Water Electrolysis: Replacing Oxygen Evolution Reaction for Energy-Efficient Hydrogen Production and Beyond. Mater. Rep. Energy 2021, 1, 100004. [Google Scholar] [CrossRef]
  7. Guenot, B.; Cretin, M.; Lamy, C. Clean Hydrogen Generation from the Electrocatalytic Oxidation of Methanol inside a Proton Exchange Membrane Electrolysis Cell (PEMEC): Effect of Methanol Concentration and Working Temperature. J. Appl. Electrochem. 2015, 45, 973–981. [Google Scholar] [CrossRef]
  8. Wang, T.; Cao, X.; Jiao, L. Progress in Hydrogen Production Coupled with Electrochemical Oxidation of Small Molecules. Angew. Chem. Int. Ed. 2022, 61, e202213328. [Google Scholar] [CrossRef]
  9. de Araujo, D.M.; Barbosa Segundo, I.D.; Cardozo, J.C.; Santos, J.E.L.; Nascimento, J.H.O.; Gondim, A.D.; dos Santos, E.V.; Martínez-Huitle, C.A. Produced Water Electrolysis with Simultaneous Green H2 Generation: From Wastewater to the Future of the Energetic Industry. Fuel 2024, 373, 132369. [Google Scholar] [CrossRef]
  10. Xavier, F.F.S.; Cunha, A.C.; Napporn, T.W.; Olivi, P. Replacing Oxygen Evolution Reaction by Glycerol Electrooxidation on Rh Modified Ni(OH)2/C for Energy-Efficient Hydrogen Production. Int. J. Hydrogen Energy 2023, 48, 31091–31100. [Google Scholar] [CrossRef]
  11. Campos da Paixão, I.; Cardozo, J.C.; Sales Monteiro, M.K.; Gondim, A.D.; Cavalcanti, L.N.; Fabiano de Santana Souza, D.; Martínez-Huitle, C.A.; Vieira dos Santos, E. A Sustainable Solar-Driven Electrochemical Process for Reforming Lignocellulosic Biomass Effluent into High Value-Added Products: Green Hydrogen, Carboxylic and Vanillic Acids. RSC Adv. 2023, 13, 35755–35765. [Google Scholar] [CrossRef] [PubMed]
  12. dos Santos, E.V.; Martínez-Huitle, C.A.; Rodrigo, M.A. The Electro-Refinery in Organics: A New Arising Concept for Valorization of Wastes. Curr. Opin. Electrochem. 2023, 39, 101267. [Google Scholar] [CrossRef]
  13. Tang, C.; Zheng, Y.; Jaroniec, M.; Qiao, S.Z. Electrocatalytic Refinery for Sustainable Production of Fuels and Chemicals. Angew. Chem. Int. Ed. 2021, 60, 19572–19590. [Google Scholar] [CrossRef]
  14. Pirzadi, Z.; Meshkani, F. From Glycerol Production to Its Value-Added Uses: A Critical Review. Fuel 2022, 329, 125044. [Google Scholar] [CrossRef]
  15. Yang, F.; Hanna, M.A.; Sun, R. Value-Added Uses for Crude Glycerol—A Byproduct of Biodiesel Production. Biotechnol. Biofuels 2012, 5, 13. [Google Scholar] [CrossRef]
  16. Zhang, M.; Wu, H. Effect of Major Impurities in Crude Glycerol on Solubility and Properties of Glycerol/Methanol/Bio-Oil Blends. Fuel 2015, 159, 118–127. [Google Scholar] [CrossRef]
  17. Marshall, A.T.; Haverkamp, R.G. Production of Hydrogen by the Electrochemical Reforming of Glycerol–Water Solutions in a PEM Electrolysis Cell. Int. J. Hydrogen Energy 2008, 33, 4649–4654. [Google Scholar] [CrossRef]
  18. Brix, A.C.; Morales, D.M.; Braun, M.; Jambrec, D.; Junqueira, J.R.C.; Cychy, S.; Seisel, S.; Masa, J.; Muhler, M.; Andronescu, C.; et al. Electrocatalytic Oxidation of Glycerol Using Solid-State Synthesised Nickel Boride: Impact of Key Electrolysis Parameters on Product Selectivity. ChemElectroChem 2021, 8, 2336–2342. [Google Scholar] [CrossRef]
  19. Ahmad, M.S.; Cheng, C.K.; Kumar, R.; Singh, S.; Saeed, K.A.; Ong, H.R.; Abdullah, H.; Khan, M.R. Pd/CNT Catalysts for Glycerol Electro-Oxidation: Effect of Pd Loading on Production of Valuable Chemical Products. Electroanalysis 2020, 32, 1139–1147. [Google Scholar] [CrossRef]
  20. Sankar, J.; Onyeozili, E.N.; Kalu, E.E. Oxidation of Glycerol with Unactivated Electroless CuNiMoP Catalyst. ChemEngineering 2017, 1, 11. [Google Scholar] [CrossRef]
  21. Yu, X.; Campos, E.; Santos, D.; White, J.; Salazar-Alvarez, G.; Pettersson, L.G.M.; Cornell, A.; Johnsson, M.; Yu, X.; Johnsson, M.; et al. Electrocatalytic Glycerol Oxidation with Concurrent Hydrogen Evolution Utilizing an Efficient MoOx/Pt Catalyst. Small 2021, 17, 2104288. [Google Scholar] [CrossRef] [PubMed]
  22. Schwengber, C.A.; Alves, H.J.; Schaffner, R.A.; Da Silva, F.A.; Sequinel, R.; Bach, V.R.; Ferracin, R.J. Overview of Glycerol Reforming for Hydrogen Production. Renew. Sustain. Energy Rev. 2016, 58, 259–266. [Google Scholar] [CrossRef]
  23. Bastan, F.; Kazemeini, M.; Larimi, A.; Maleki, H. Production of Renewable Hydrogen through Aqueous-Phase Reforming of Glycerol over Ni/Al2O3MgO Nano-Catalyst. Int. J. Hydrogen Energy 2018, 43, 614–621. [Google Scholar] [CrossRef]
  24. Wu, J.; Yang, X.; Gong, M. Recent Advances in Glycerol Valorization via Electrooxidation: Catalyst, Mechanism and Device. Chin. J. Catal. 2022, 43, 2966–2986. [Google Scholar] [CrossRef]
  25. Rahim, S.A.N.M.; Lee, C.S.; Abnisa, F.; Aroua, M.K.; Daud, W.A.W.; Cognet, P.; Pérès, Y. A Review of Recent Developments on Kinetics Parameters for Glycerol Electrochemical Conversion—A by-Product of Biodiesel. Sci. Total Environ. 2020, 705, 135137. [Google Scholar] [CrossRef]
  26. Braun, M.; Santana, C.S.; Garcia, A.C.; Andronescu, C. From Waste to Value—Glycerol Electrooxidation for Energy Conversion and Chemical Production. Curr. Opin. Green Sustain. Chem. 2023, 41, 100829. [Google Scholar] [CrossRef]
  27. Jeon, H.; Jeong, B.; Choun, M.; Lee, J. In-Situ Electrochemical Extended X-Ray Absorption Fine Structure Spectroscopy Study on the Reactivation of Pd Electrocatalyst in Formic Acid Oxidation. Electrochim. Acta 2014, 140, 525–528. [Google Scholar] [CrossRef]
  28. Fan, L.; Liu, B.; Liu, X.; Senthilkumar, N.; Wang, G.; Wen, Z. Recent Progress in Electrocatalytic Glycerol Oxidation. Energy Technol. 2021, 9, 2000804. [Google Scholar] [CrossRef]
  29. Martínez-Huitle, C.A.; Rodrigo, M.A.; Sirés, I.; Scialdone, O. A Critical Review on Latest Innovations and Future Challenges of Electrochemical Technology for the Abatement of Organics in Water. Appl. Catal. B Environ. 2023, 328, 122430. [Google Scholar] [CrossRef]
  30. Espinoza, L.C.; Sepúlveda, P.; García, A.; Martins de Godoi, D.; Salazar, R. Degradation of Oxamic Acid Using Dimensionally Stable Anodes (DSA) Based on a Mixture of RuO2 and IrO2 Nanoparticles. Chemosphere 2020, 251, 126674. [Google Scholar] [CrossRef]
  31. Aquino Neto, S.; de Andrade, A.R. Electrooxidation of Glyphosate Herbicide at Different DSA® Compositions: PH, Concentration and Supporting Electrolyte Effect. Electrochim. Acta 2009, 54, 2039–2045. [Google Scholar] [CrossRef]
  32. Salazar-Banda, G.R.; Santos, G.d.O.S.; Duarte Gonzaga, I.M.; Dória, A.R.; Barrios Eguiluz, K.I. Developments in Electrode Materials for Wastewater Treatment. Curr. Opin. Electrochem. 2021, 26, 100663. [Google Scholar] [CrossRef]
  33. Comninellis, C.; Chen, G. Electrochemistry for the Environment; Springer: Berlin/Heidelberg, Germany, 2010; pp. 1–563. [Google Scholar] [CrossRef]
  34. Kaur, R.; Kushwaha, J.P.; Singh, N. Electro-Oxidation of Amoxicillin Trihydrate in Continuous Reactor by Ti/RuO2 Anode. Sci. Total Environ. 2019, 677, 84–97. [Google Scholar] [CrossRef]
  35. Kim, S.; Lee, T.; Han, S.; Lee, C.; Kim, C.; Yoon, J. Ir0.11Fe0.25O0.64 as a Highly Efficient Electrode for Electrochlorination in Dilute Chloride Solutions. J. Ind. Eng. Chem. 2021, 102, 155–162. [Google Scholar] [CrossRef]
  36. Li, C.; Tian, L.; Yuan, X.; Jiang, H.; Hu, Z.; Yin, Y. Review of Acidic Titanium-Based Oxygen Evolution Anode Catalyst Design: Mechanistic, Compositional Design, and Research Status. J. Alloys Compd. 2024, 979, 173576. [Google Scholar] [CrossRef]
  37. Santos, G.O.S.; Eguiluz, K.I.B.; Salazar-Banda, G.R.; Sáez, C.; Rodrigo, M.A. Understanding the Electrolytic Generation of Sulfate and Chlorine Oxidative Species with Different Boron-Doped Diamond Anodes. J. Electroanal. Chem. 2020, 857, 113756. [Google Scholar] [CrossRef]
  38. Duarte, J.L.S.; Meili, L.; Gomes, L.M.; Melo, J.M.O.; Ferro, A.B.; Tavares, M.G.; Tonholo, J.; Zanta, C.L.P.S. Electrochemical Degradation of 17-α-Methyltestosterone over DSA® Electrodes. Chem. Eng. Process. Process Intensif. 2019, 142, 107548. [Google Scholar] [CrossRef]
  39. Medeiros, M.C.; dos Santos, E.V.; Martínez-Huitle, C.A.; Fajardo, A.S.; Castro, S.S.L. Obtaining High-Added Value Products from the Technical Cashew-Nut Shell Liquid Using Electrochemical Oxidation with BDD Anodes. Sep. Purif. Technol. 2020, 250, 117099. [Google Scholar] [CrossRef]
  40. Castro, R.S.S.; Santos, G.O.S.; Lanza, M.R.V.; Salaza-Banda, G.R.; Eguiluz, K.I.B.; Rodrigo, M.A.; Sáez, C. New MMO Coatings for Electro-Refinery Applications: Promoting the Production of Carboxylates. Chemosphere 2024, 363, 142941. [Google Scholar] [CrossRef]
  41. Medeiros, M.C.; Castro, S.S.L.; dos Santos, E.V.; Rodrigo, M.A.; Martínez-Huitle, C.A. A Proof of Concept for the Electro-Refinery: Selective Electroproduction of Acetic Acid from t-CNSL Waste by Using DSA Electrode. Electrochem. Commun. 2022, 141, 107356. [Google Scholar] [CrossRef]
  42. Quiroz, M.A.; Martínez-Huitle, U.A.; Martínez-Huitle, C.A. Mass Transfer Measurements in a Parallel Disk Cell Using the Limiting Current Technique. J. Mex. Chem. Soc. 2005, 49, 279–283. [Google Scholar]
  43. Quiroz, M.A.; Córdova, F.; Lamy-Pitara, E.; Barbier, J. Electrocatalytic Hydrogenation of M-Xylene on Platinized-Platinum Electrodes. Electrochim. Acta 2000, 45, 4291–4298. [Google Scholar] [CrossRef]
  44. Ciobanu, M.; Wilburn, J.P.; Krim, M.L.; Cliffel, D.E. Fundamentals. In Handbook of Electrochemistry; Elsevier: Amsterdam, The Netherlands, 2007; pp. 3–29. [Google Scholar] [CrossRef]
  45. dos Santos, E.V.; Cardozo, J.C.; Feijoó Zambrano, T.N.; Quiroz Alfaro, M.A.; Martínez-Huitle, C.A. Towards Win-Win Electrochemical Alternative for Depolluting Water and Producing Green H2: Understanding and Unrevealing the Participation of Sacrificial Organic Compound on H2 Production. Int. J. Hydrogen Energy 2024, 110, 598–608. [Google Scholar] [CrossRef]
  46. Harris, D.C. Quantitative Chemical Analysis, 8th ed.; W.H. Freeman and Co.: New York, NY, USA, 2010; ISBN 1429239891. [Google Scholar]
  47. Yan, Y.; Hao, P.; Fu, Y.; Chen, W.; Shi, Q.; Zhou, H.; Kong, X.; Li, Z.; Shao, M.; Duan, X. Selective Electrooxidation Glycerol to Lactic Acid Coupled with Hydrogen Production over a Cooperative BiOx/Au Catalyst. AIChE J. 2024, 70, e18370. [Google Scholar] [CrossRef]
  48. Song, Y.; Wan, X.; Miao, Y.; Li, J.; Ren, Z.; Jin, B.; Zhou, H.; Li, Z.; Shao, M. Blocking Oxygen Evolution Reaction for Efficient Organic Electrooxidation Coupling Hydrogen Production by Using Layered Double Hydroxide Rich in Active Oxygen. Appl. Catal. B Environ. Energy 2023, 333, 122808. [Google Scholar] [CrossRef]
  49. Xu, Y.; Liu, M.; Wang, S.; Ren, K.; Wang, M.; Wang, Z.; Li, X.; Wang, L.; Wang, H. Integrating Electrocatalytic Hydrogen Generation with Selective Oxidation of Glycerol to Formate over Bifunctional Nitrogen-Doped Carbon Coated Nickel-Molybdenum-Nitrogen Nanowire Arrays. Appl. Catal. B Environ. 2021, 298, 120493. [Google Scholar] [CrossRef]
  50. Wenderich, K.; Nieuweweme, B.A.M.; Mul, G.; Mei, B.T. Selective Electrochemical Oxidation of H2O to H2O2Using Boron-Doped Diamond: An Experimental and Techno-Economic Evaluation. ACS Sustain. Chem. Eng. 2021, 9, 7803–7812. [Google Scholar] [CrossRef]
  51. Khan, M.A.; Al-Attas, T.A.; Yasri, N.G.; Zhao, H.; Larter, S.; Hu, J.; Kibria, M.G. Techno-Economic Analysis of a Solar-Powered Biomass Electrolysis Pathway for Coproduction of Hydrogen and Value-Added Chemicals. Sustain. Energy Fuels 2020, 4, 5568–5577. [Google Scholar] [CrossRef]
  52. Le Bideau, D.; Chocron, O.; Mandin, P.; Kiener, P.; Benbouzid, M.; Sellier, M.; Kim, M.; Ganci, F.; Inguanta, R. Evolutionary Design Optimization of an Alkaline Water Electrolysis Cell for Hydrogen Production. Appl. Sci. 2020, 10, 8425. [Google Scholar] [CrossRef]
  53. Bansod, Y.; Crabbe, B.; Forster, L.; Ghasemzadeh, K.; D’Agostino, C. Evaluating the Environmental Impact of Crude Glycerol Purification Derived from Biodiesel Production: A Comparative Life Cycle Assessment Study. J. Clean. Prod. 2024, 437, 140485. [Google Scholar] [CrossRef]
  54. Xie, Y.; Sun, L.; Pan, X.; Zhou, Z.; Zheng, Y.; Yang, X.; Zhao, G. Carbon Paper Supported Gold Nanoflowers for Tunable Glycerol Electrooxidation Boosting Efficient Hydrogen Evolution. Carbon 2023, 203, 88–96. [Google Scholar] [CrossRef]
  55. dos Santos, E.C.; Araujo, R.B.; Valter, M.; Salazar-Alvarez, G.; Johnsson, M.; Bajdich, M.; Abild-Pedersen, F.; Pettersson, L.G.M. Efficient Screening of Bi–Metallic Electrocatalysts for Glycerol Valorization. Electrochim. Acta 2021, 398, 139283. [Google Scholar] [CrossRef]
  56. Barreto, J.P.d.P.; Santos, J.E.L.; Cardozo, J.C.; de Santana Souza, D.F.; Cavalcanti, L.N.; Gondim, A.D.; Martínez-Huitle, C.A.; dos Santos, E.V. Energy-Saving Electrochemical Green Hydrogen Production Coupled with Persulfate or Hydrogen Peroxide Valorization at Boron-Doped Diamond Electrodes. J. Environ. Chem. Eng 2024, 12, 114837. [Google Scholar] [CrossRef]
  57. Jagannadha Raju, G.M.; Sarma, G.V.S.; Ramesh, K.V.; Bhaskara Sarma, C. Mass Transfer at the Confining Wall of an Electrochemical Cell in Annular Flow with a Rotating Central Rod. Indian Chem. Eng. 2021, 63, 512–521. [Google Scholar] [CrossRef]
  58. Scott, K.; Lobato, J. Determination of a Mass-Transfer Coefficient Using the Limiting-Current Technique. Chem. Educ. 2002, 7, 214–219. [Google Scholar] [CrossRef]
  59. González, J.; Laborda, E.; Molina, Á. Voltammetric Kinetic Studies of Electrode Reactions: Guidelines for Detailed Understanding of Their Fundamentals. J. Chem. Educ. 2023, 100, 697–706. [Google Scholar] [CrossRef]
  60. De França Neta, L.S.; Borges, C.P.; Habert, A.C. Evaluation of Mass Transfer in a Novel Hollow Fiber Module Design Using an Electrochemical Technique. Braz. J. Chem. Eng. 2017, 34, 789–798. [Google Scholar] [CrossRef]
  61. de Castro, C.M.; Olivi, P.; de Freitas Araújo, K.C.; Barbosa Segundo, I.D.; dos Santos, E.V.; Martínez-Huitle, C.A. Environmental Application of a Cost-Effective Smartphone-Based Method for COD Analysis: Applicability in the Electrochemical Treatment of Real Wastewater. Sci. Total Environ. 2023, 855, 158816. [Google Scholar] [CrossRef]
  62. Cardozo, J.C.; Barbosa Segundo, I.D.; Galvão, E.R.V.P.; da Silva, D.R.; dos Santos, E.V.; Martínez-Huitle, C.A. Decentralized Environmental Applications of a Smartphone-Based Method for Chemical Oxygen Demand and Color Analysis. Sci. Rep. 2023, 13, 11082. [Google Scholar] [CrossRef]
  63. Ren, H.; Huang, Z.; Cai, G.; Guo, J.; Sun, Y.; Yao, W.; Ye, D.; Qian, H.; Zhang, J.; Zhao, H. Cobalt (II) Oxide for Efficient Glycerol Electrooxidation for Formic Acid Coupled with Hydrogen Production. J. Alloys Compd. 2024, 996, 174781. [Google Scholar] [CrossRef]
  64. Feng, X.; Liu, B.W.; Guo, K.X.; Fan, L.F.; Wang, G.X.; Ci, S.Q.; Wen, Z.H. Anodic Electrocatalysis of Glycerol Oxidation for Hybrid Alkali/Acid Electrolytic Hydrogen Generation. J. Electrochem. 2023, 29, 2215005. [Google Scholar] [CrossRef]
  65. Wu, G.; Dong, X.; Mao, J.; Li, G.; Zhu, C.; Li, S.; Chen, A.; Feng, G.; Song, Y.; Chen, W.; et al. Anodic Glycerol Oxidation to Formate Facilitating Cathodic Hydrogen Evolution with Earth-Abundant Metal Oxide Catalysts. Chem. Eng. J. 2023, 468, 143640. [Google Scholar] [CrossRef]
  66. Fan, L.; Ji, Y.; Wang, G.; Chen, J.; Chen, K.; Liu, X.; Wen, Z. High Entropy Alloy Electrocatalytic Electrode toward Alkaline Glycerol Valorization Coupling with Acidic Hydrogen Production. J. Am. Chem. Soc. 2022, 144, 7224–7235. [Google Scholar] [CrossRef] [PubMed]
  67. Chang, J.; Song, F.; Hou, Y.; Wu, D.; Xu, F.; Jiang, K.; Gao, Z. Molybdenum, Tungsten Doped Cobalt Phosphides as Efficient Catalysts for Coproduction of Hydrogen and Formate by Glycerol Electrolysis. J. Colloid Interface Sci. 2024, 665, 152–162. [Google Scholar] [CrossRef]
  68. Li, Y.; Wei, X.; Chen, L.; Shi, J.; He, M. Nickel-Molybdenum Nitride Nanoplate Electrocatalysts for Concurrent Electrolytic Hydrogen and Formate Productions. Nat. Commun. 2019, 10, 5335. [Google Scholar] [CrossRef]
  69. Fang, Y.; Dai, C.; Liu, X.; Wang, Y.; Ju, C.; He, S.; Shi, R.; Liu, Y.; Zhang, J.; Zhu, Y.; et al. Sulfur-Doped Manganese-Cobalt Hydroxide with Promoted Surface Reconstruction for Glycerol Electrooxidation Assisted Hydrogen Production. Nano Energy 2024, 127, 109754. [Google Scholar] [CrossRef]
Figure 1. Polarization curves of DSA electrode (1 cm2 of geometrical area) recorded at 5 mV s−1 in a potential range from 0 to +1.5 V at 293 K of (a) different concentrations of Na2SO4 in the presence (continuous line) and absence (dashed line) of glycerol and (b) of the real glycerol effluent sample in the presence and absence of supporting electrolyte.
Catalysts 15 00333 g001
Figure 2. LSV profiles for mass transfer characterization of different electrochemical cell configurations using ferri/ferrocyanide protocol (using 1/10 mmol L−1 in 0.5 mol L−1 NaOH): (a) undivided and (b) divided cells. Pt electrode was used as counter, Ag/AgCl (KCl, 3 mol L−1) as the reference electrode, and DSA (20.8 cm2) was used as the working electrode, in a potential range of 0 to +0.8 V and a scan rate of 5 mV s−1 at 298 K. Inset: variation in the limiting current (A) as a function of the ferrocyanide concentration (mol m−3).
Catalysts 15 00333 g002
Figure 3. (a) Evolution of FA concentration over oxidation time using an undivided reactor for different values of (a) j (30 (), 60 (), and 90 (▲) mA cm−2) and (b) percentage of residual organic matter obtained by TOC analysis at the final step of oxidation process of 0.1 mol L−1 of glycerol solution with 0.1 mol L−1 of Na2SO4 as supporting electrolyte with DSA (20.8 cm2) as anode, and Ni-Fe stainless steel (SS) as cathode at 298 K using an undivided reactor.
Catalysts 15 00333 g003
Figure 4. (a) Evolution of FA concentration over oxidation time using a divided reactor for different values of (a) j (30 (), 60 (), and 90 (▲) mA cm−2) and (b) percentage of residual organic matter obtained by TOC analysis at the final step of oxidation process of 0.1 mol L−1 of glycerol solution with 0.1 mol L−1 of Na2SO4 as supporting electrolyte with DSA (20.8 cm2) as anode, and Ni-Fe stainless steel (SS) as cathode at 298 K using a divided reactor.
Catalysts 15 00333 g004
Figure 5. (a) Evolution of FA concentration over electrolyte concentration using an undivided reactor for different Na2SO4 concentrations: 0.1 (), 0.5 (), and 1.0 () mol L−1 by applying 90 mA cm−2, and (b) percentage of residual organic matter obtained by TOC analysis at the end of the electrolysis of 0.1 mol L−1 of glycerol using 0.1 (), 0.5 (), and 1.0 () mol L−1 of Na2SO4 as supporting electrolyte with DSA (20.8 cm2) as anode, and Ni-Fe stainless steel (SS) as cathode at 298 K using an undivided reactor.
Catalysts 15 00333 g005
Figure 6. (a) Evolution of FA concentration over electrolyte concentration using a divided reactor for different Na2SO4 concentrations: 0.1 (), 0.5 (), and 1.0 () mol L−1 by applying 90 mA cm−2, and (b) percentage of residual organic matter obtained by TOC analysis at the end of the electrolysis of 0.1 mol L−1 of glycerol using 0.1 (), 0.5 (), and 1.0 () mol L−1 of Na2SO4 as supporting electrolyte with DSA (20.8 cm2) as anode, and Ni-Fe stainless steel (SS) as cathode at 298 K using a divided reactor.
Catalysts 15 00333 g006
Figure 7. (a) Evolution of FA concentration over electrolysis time (360 (), 480 (), and 600 () min) by applying 90 mA cm−2 in 0.1 mol L−1 of Na2SO4 as supporting electrolyte using an undivided reactor, and (b) percentage of residual organic matter obtained by TOC analysis at the final step of the oxidation process at different electrolysis times (360 (), 480 (), and 600 () min), using DSA (20.8 cm2) as anode, and Ni-Fe stainless steel (SS) as cathode at 298 K in an undivided reactor.
Catalysts 15 00333 g007
Figure 8. (a) Evolution of FA concentration over oxidation time (360 (), 480 (), and 600 () min) by applying 90 mA cm−2 in 0.1 mol L−1 of Na2SO4 as supporting electrolyte using a divided reactor, and (b) percentage of residual organic matter obtained by TOC analysis at the final solution of the oxidation process at different electrolysis times (360 (), 480 (), and 600 () min), using DSA (20.8 cm2) as anode, and Ni-Fe stainless steel (SS) as cathode at 298 K in a divided reactor.
Catalysts 15 00333 g008
Figure 9. Volume of dry green H2 electrochemically produced as a function of (a) j (30 (), 60 (), and 90 (●) mA cm−2); (b) supporting electrolyte concentration (0.1 (), 0.5 (), and 1.0 () mol L−1 of Na2SO4), and (c) electrolysis time (360 (), 480 (), and 600 () min), using DSA (20.8 cm2) as anode, and Ni-Fe stainless steel (SS) as cathode at 298 K in a divided reactor.
Catalysts 15 00333 g009
Figure 10. Evolution of carboxylic acids concentration over oxidation time to electroconvert a real effluent sample by applying 90 mA cm−2 in 0.1 mol L−1 of Na2SO4 as supporting electrolyte: (a) undivided and (b) divided cells. DSA (20.8 cm2) as anode, and Ni-Fe stainless steel (SS) as cathode at 298 K in a divided reactor.
Catalysts 15 00333 g010
Figure 11. Volume of dry green H2 produced, as a function of electrolysis time, during the integrated-hybrid process to electroconvert a glycerol residue in a divided cell by applying 90 mA cm−2 in Na2SO4 0.1 mol L−1 using DSA (20.8 cm2) as anode, and Ni-Fe stainless steel (SS) as cathode at 298 K.
Catalysts 15 00333 g011
Figure 12. CAPEX and OPEX costs for (a) undivided and (b) divided cells in relation to variation in j.
Catalysts 15 00333 g012
Figure 13. CAPEX and OPEX estimations for (a) undivided and (b) divided cells in relation to variation in electrolyte concentration.
Catalysts 15 00333 g013
Figure 14. CAPEX and OPEX costs for undivided and divided cell for glycerol electroconversion using a real effluent sample.
Catalysts 15 00333 g014
Table 1. Main results of the electroconversion of glycerol experiments carried out in undivided and divided cell configurations.
Entryj/mA cm−2Oxidation Time/minUndivided ReactorDivided Reactor
Compartment[FA]/mg L−1FE/%Compartment[FA]/mg L−1FE/%Volume of Dry Green H2/L
AnodicCathodic
1303600.1 mol L−1 glycerol + 0.5 mol L−1 Na2SO419.470.810.1 mol L−1 glycerol + 0.5 mol L−1 Na2SO40.5 mol L−1 Na2SO414.790.611.406
2603600.1 mol L−1 glycerol + 0.5 mol L−1 Na2SO448.961.020.1 mol L−1 glycerol + 0.5 mol L−1 Na2SO40.5 mol L−1 Na2SO447.080.982.744
3903600.1 mol L−1 glycerol + 0.5 mol L−1 Na2SO490.451.250.1 mol L−1 glycerol + 0.5 mol L−1 Na2SO40.5 mol L−1 Na2SO483.451.154.922
4903600.1 mol L−1 glycerol + 0.1 mol L−1 Na2SO4188.932.610.1 mol L−1 glycerol + 0.1 mol L−1 Na2SO40.1 mol L−1 Na2SO4189.932.634.927
5903600.1 mol L−1 glycerol + 0.5 mol L−1 Na2SO487.981.220.1 mol L−1 glycerol + 0.5 mol L−1 Na2SO40.5 mol L−1 Na2SO483.451.154.922
6903600.1 mol L−1 glycerol + 1.0 mol L−1 Na2SO488.491.220.1 mol L−1 glycerol + 1.0 mol L−1 Na2SO41.0 mol L−1 Na2SO444.410.615.033
7903600.1 mol L−1 glycerol + 0.1 mol L−1 Na2SO4188.932.610.1 mol L−1 glycerol + 0.1 mol L−1 Na2SO40.1 mol L−1 Na2SO4189.932.634.927
8904800.1 mol L−1 glycerol + 0.1 mol L−1 Na2SO4256.212.660.1 mol L−1 glycerol + 0.1 mol L−1 Na2SO40.1 mol L−1 Na2SO4211.172.196.769
9906000.1 mol L−1 glycerol + 0.1 mol L−1 Na2SO4245.882.040.1 mol L−1 glycerol + 0.1 mol L−1 Na2SO40.1 mol L−1 Na2SO4123.671.037.603
Table 2. Results of physical-chemical characterization of the real sample before and after the electrochemical process.
Real Sample ParametersBefore TreatmentAfter Treatment
Undivided ReactorDivided Reactor
pH4.132.661.37
Electrical Conductivity
(μS cm−1)
2755.01793.03828.0
Apparent color
(units PtCo)
164037103
True color
(units PtCo)
845553
Turbidity
(NTU)
188.05.028.37
Suspended solids
(mg L−1)
283.03336
Total dissolved solids
(mg L−1)
1377.08690.01964.0
Free Chlorine
(mg L−1)
0.06<LD<LD
Residual Chlorine
(mg L−1)
0.13<LD<LD
Total Nitrogen
(mg L−1)
32.8<LD<LD
COD
(mg L−1)
2238.01460.01942.0
TOC
(mg L−1)
3268.02467.02063.0
Phenol
(mg L−1)
0.0721.021.38
Anionic Surfactant
(mg L−1)
5.173.633.52
LD = Limit of detection.
Disclaimer/Publisher’s Note: The statements, opinions and data contained in all publications are solely those of the individual author(s) and contributor(s) and not of MDPI and/or the editor(s). MDPI and/or the editor(s) disclaim responsibility for any injury to people or property resulting from any ideas, methods, instructions or products referred to in the content.

