Article

Modified Resazurin Ink Testing and the Fluorescence Probe Method for Simple and Rapid Photocatalytic Performance Evaluation

1
Kawasaki Technical Support Department, Local Independent Administrative Agency Kanagawa Institute of Industrial Science and Technology (KISTEC), Ground Floor East Wing, Innovation Center Building, Kanagawa Science Park, 3-2-1 Sakado, Takatsu, Kawasaki, Kanagawa 213-0012, Japan
2
Mechanical and Materials Engineering Department, Local Independent Administrative Agency Kanagawa Institute of Industrial Science and Technology (KISTEC), 705-1 Shimoimaizumi, Ebina, Kanagawa 243-0435, Japan
*
Authors to whom correspondence should be addressed.
Catalysts 2025, 15(3), 288; https://doi.org/10.3390/catal15030288
Submission received: 31 January 2025 / Revised: 14 March 2025 / Accepted: 15 March 2025 / Published: 19 March 2025
(This article belongs to the Special Issue TiO2 Photocatalysts: Design, Optimization and Application)

Abstract

:
Evaluating the air purification performance of photocatalytic materials typically requires complex gas decomposition tests involving expensive analytical equipment and lengthy testing periods. In this study, photocatalytic performance evaluation methods involving resazurin (Rz) ink and fluorescence probe techniques were investigated as alternatives to conventional gas decomposition tests. TiO2 films with varying performance levels were fabricated by controlling TiO2 slurry concentration and the amount of photocatalyst deposited through spin coating. Photocatalytic performances of the synthesised films were then evaluated using the acetaldehyde decomposition method, Rz ink test, and fluorescence probe method for measuring OH radical generation. The acetaldehyde decomposition rate constants showed high correlation with both the Rz colour change rate in modified-pH ink (R2 = 0.91) and the OH radical concentration (R2 = 0.98). Conventional Rz ink testing for high-performance materials showed rapid colour changes, indicating its limited applicability. Our modified-pH Rz ink enabled facile analysis by ensuring controlled reactivity. Both the modified Rz ink method, which enables quantitative evaluation within five minutes even for high-performance materials, and the fluorescence probe method are suitable as reliable screening tools for photocatalytic air purification materials. These simplified evaluation methods will aid in developing more efficient photocatalysts and advancing environmental purification technologies.

Graphical Abstract

1. Introduction

Since the discovery of the water-splitting reaction (known as the Honda–Fujishima effect) in 1972, titanium dioxide (TiO2) has been widely used as an environmental purification material [1,2,3]. The superhydrophilic and oxidative decomposition properties of TiO2 enable the fabrication of self-cleaning exterior walls and tiles, while its strong oxidative decomposition capability is utilised in air purifiers [4,5]. With the increasing severity and diversification of indoor environmental issues, modern air purification technologies are expected to meet significantly high standards. Accurate performance evaluation is essential for healthy markets and product development. However, air purification performance assessments require precisely controlled gas concentrations and humidity along with specialised measurement equipment. These factors create significant resource barriers in product development. Therefore, developing rapid and simple evaluation methods is critical and urgent [6].
The resazurin (Rz) ink-based evaluation method for photocatalysts has been standardised by ISO (ISO21066) [7]. Unlike this method [6], the conventional evaluation methods using organic dyes, such as methylene blue, require several hours for measurement and are susceptible to oxygen interference [8,9]. Rz exhibits a distinct colour change from blue to pink upon photocatalytic reduction, showing a half-life of approximately 1 min under UVA (~365 nm) irradiation. The photocatalytic reduction of Rz, which follows zero-order kinetics (with a concentration-independent reaction rate), enables predictable reaction progress and reproducible measurements [10]. Moreover, the reaction rate remains consistent under both aerobic and anaerobic conditions [11], enabling its practical evaluation independent of the measurement environment [6]. The applicability of the conventional Rz ink test, which is typically used for thin films and low-performance photocatalytic materials [12,13], is limited to moderate-performance materials; Rz-based protocols for evaluating high-performance materials, such as those for gas decomposition, require significant refinement and standardisation.
As many of the photocatalytic decomposition processes occur through OH radical attack, estimating the amount of OH radicals formed on the excited photocatalyst surface is a reasonable method for evaluating photocatalytic performance [14,15]. The generated OH radicals have extremely high reactivity and a shorter lifetime [16,17], making direct detection difficult. Therefore, indirect detection methods using trapping agents have become mainstream approaches [18,19,20]. Conventional OH radical measurement by ESR spin trapping uses 5,5-dimethyl-1-pyrroline-N-oxide (DMPO) and requires specialised equipment and careful handling [19,21]. Additionally, owing to ESR equipment specifications, only samples of limited shapes and sizes can be analysed, reducing versatility. The fluorescence probe method provides a simpler approach to OH radical measurement. Organic molecules such as terephthalic acid and coumarin effectively react with OH radicals to form products with strong fluorescence [22,23]. The fluorescence probe method used in our study involved sodium terephthalate (NaTA), which specifically reacts with OH radicals to produce 2-hydroxyterephthalic acid (HTA). As HTA emits blue fluorescence under ultraviolet irradiation, the amount of HTA and OH radicals that have reacted can be indirectly quantified from its fluorescence intensity. This simple reaction mechanism enables the evaluation of photocatalytic performance without the need for specialised equipment. An advantage of using terephthalic acid in the fluorescence probe method is that a single isomer is formed in the reaction with OH radicals [15]. Additionally, terephthalic acid does not react with other reactive oxygen species such as superoxide anion, ozone, or HO2 radicals [24,25,26]. Measurements can be made with simpler equipment and reagents that are easier to handle compared to those used in ESR [27]. As terephthalic acid dissolves only in alkaline solutions [28], there is a challenge that experimental conditions such as pH and solution conductivity change but by using disodium terephthalate, it can be dissolved even in neutral solutions [29,30,31]. Because of its simplicity and versatility, the fluorescence probe method has been widely used in studies related to plasma decomposition [32,33,34] and the photocatalytic decomposition [35,36,37] of persistent organic pollutants in water. In this method, the calculated amount of OH radicals represents the amount that reacted with the reagent and not the total amount [38]. In experiments under specific conditions, the HTA reaction rate in the presence of oxygen has been reported as 35% [39,40]. However, this value may fluctuate depending on environmental conditions and experimental parameters. As the amount of OH radicals calculated by the fluorescence probe method is not an absolute value, it is used for relative evaluations such as comparing photocatalytic performances.
Conventional photocatalyst evaluation methods, particularly, the Rz ink method, face challenges in rapidly and accurately evaluating high-performance materials. In this study, we developed a pH–modified Rz ink method that enables quantitative evaluation of high-performance photocatalytic materials within a short time. Additionally, we systematically verified for the first time the correlation between the fluorescence probe method, which is a simple OH radical detection technique, and acetaldehyde decomposition performance, demonstrating the effectiveness of both methods for evaluating air purification performance. This combined approach significantly streamlines the performance screening process for photocatalytic materials.
The purpose of this study is to verify the effectiveness of the Rz ink test and fluorescence probe method as alternative methods for air purification performance evaluation. Specifically, we conducted the following experiments: (1) fabrication of TiO2 films with different performance levels by controlling spin-coating conditions and TiO2 slurry concentration, (2) standard performance evaluation using the conventional acetaldehyde decomposition test, (3) measurement of colour change rate using the modified-pH Rz ink test, (4) measurement of OH radical generation by the fluorescence probe method, and (5) correlation analysis between these methods. Using standard photocatalyst samples with varying performance levels, strong positive correlations between both methods and acetaldehyde decomposition testing were confirmed. Furthermore, the applicability of modified Rz ink for experimentation with high-performance photocatalytic materials was confirmed. This study provides crucial foundational knowledge that is expected to expedite the application of the Rz ink test and fluorescence probe method in preliminary photocatalyst evaluations, such as in screening high-performance materials.

2. Results

2.1. Fabrication and Performance Evaluation of Standard TiO2 Films

Scanning electron microscopy (SEM) was used for cross-sectional observations of TiO2 films after exposure to a focused ion beam (FIB) [41]. Film thickness increased with decreasing spin-coating speed and increasing slurry concentration (Figure 1). The average film thickness, measured at six different locations, was 1.82 μm at 1000 rpm (T1), 1.29 μm at 2000 rpm (T1), 1.02 μm at 4000 rpm (T1), 0.36 μm at 4000 rpm (T2), 0.13 μm at 4000 rpm (T5), and 0.07 μm at 4000 rpm (T10). All samples contained internal voids, indicating the formation of porous TiO2 films. Notably, the observed pores were significantly larger than the crystallite size of TiO2 in the commercial slurry TKD-701 (6 nm), indicating the formation of secondary particles owing to the aggregation of TiO2 particles in the slurry during film formation.
X-ray diffraction (XRD) analysis indicated a broad amorphous peak within 15–35° corresponding to the glass substrate (Figure 2a). Analysis of the XRD patterns using the Hanawalt method [42,43] revealed characteristic peaks of anatase TiO2 at 25.3° (101), 37.8° (004), and 48.0° (200). No rutile peaks were detected, indicating the formation of a pure anatase phase (Figure 2b). These results are consistent with the specifications provided by the slurry manufacturer. Moreover, the intensity of the main diffraction peak at ~25° decreased with decreasing spin-coating speed and solution concentration, consistent with the film thickness variations shown in Figure 1. Notably, because crystalline peaks were below the detection limit, only the amorphous peak corresponding to the glass substrate was detected in the spectrum of the thinnest film (4000 rpm-T10, ~70 nm thick).
Photocatalytic performances of the fabricated films were evaluated through acetaldehyde decomposition tests using the six TiO2 film samples described in Section 2.1 and Section 2.2. While a minimal reduction in acetaldehyde concentration was observed in the control experiment without TiO2, significant photocatalytic activity was observed in all systems containing TiO2 films. Decomposition efficiency increased with decreasing spin-coating speed and increasing slurry concentration (Figure 3a). The most active sample (1000 rpm-T1) decomposed ~90% of the initial acetaldehyde concentration after 60 min, while the thinnest film (4000 rpm-T10) showed ~30% acetaldehyde decomposition. Decomposition kinetics were analysed assuming a pseudo-first-order reaction model for the initial 30 min and a rate constant k1 (C = C0 exp(−k1 t)). High correlation coefficients (R2 > 0.99) were observed under all conditions, indicating a consistent reaction mechanism. Furthermore, strong positive correlations were observed between rate constant k1 and both TiO2 film thickness (Figure 3b) and anatase TiO2 (101) peak intensity (Figure 3c).

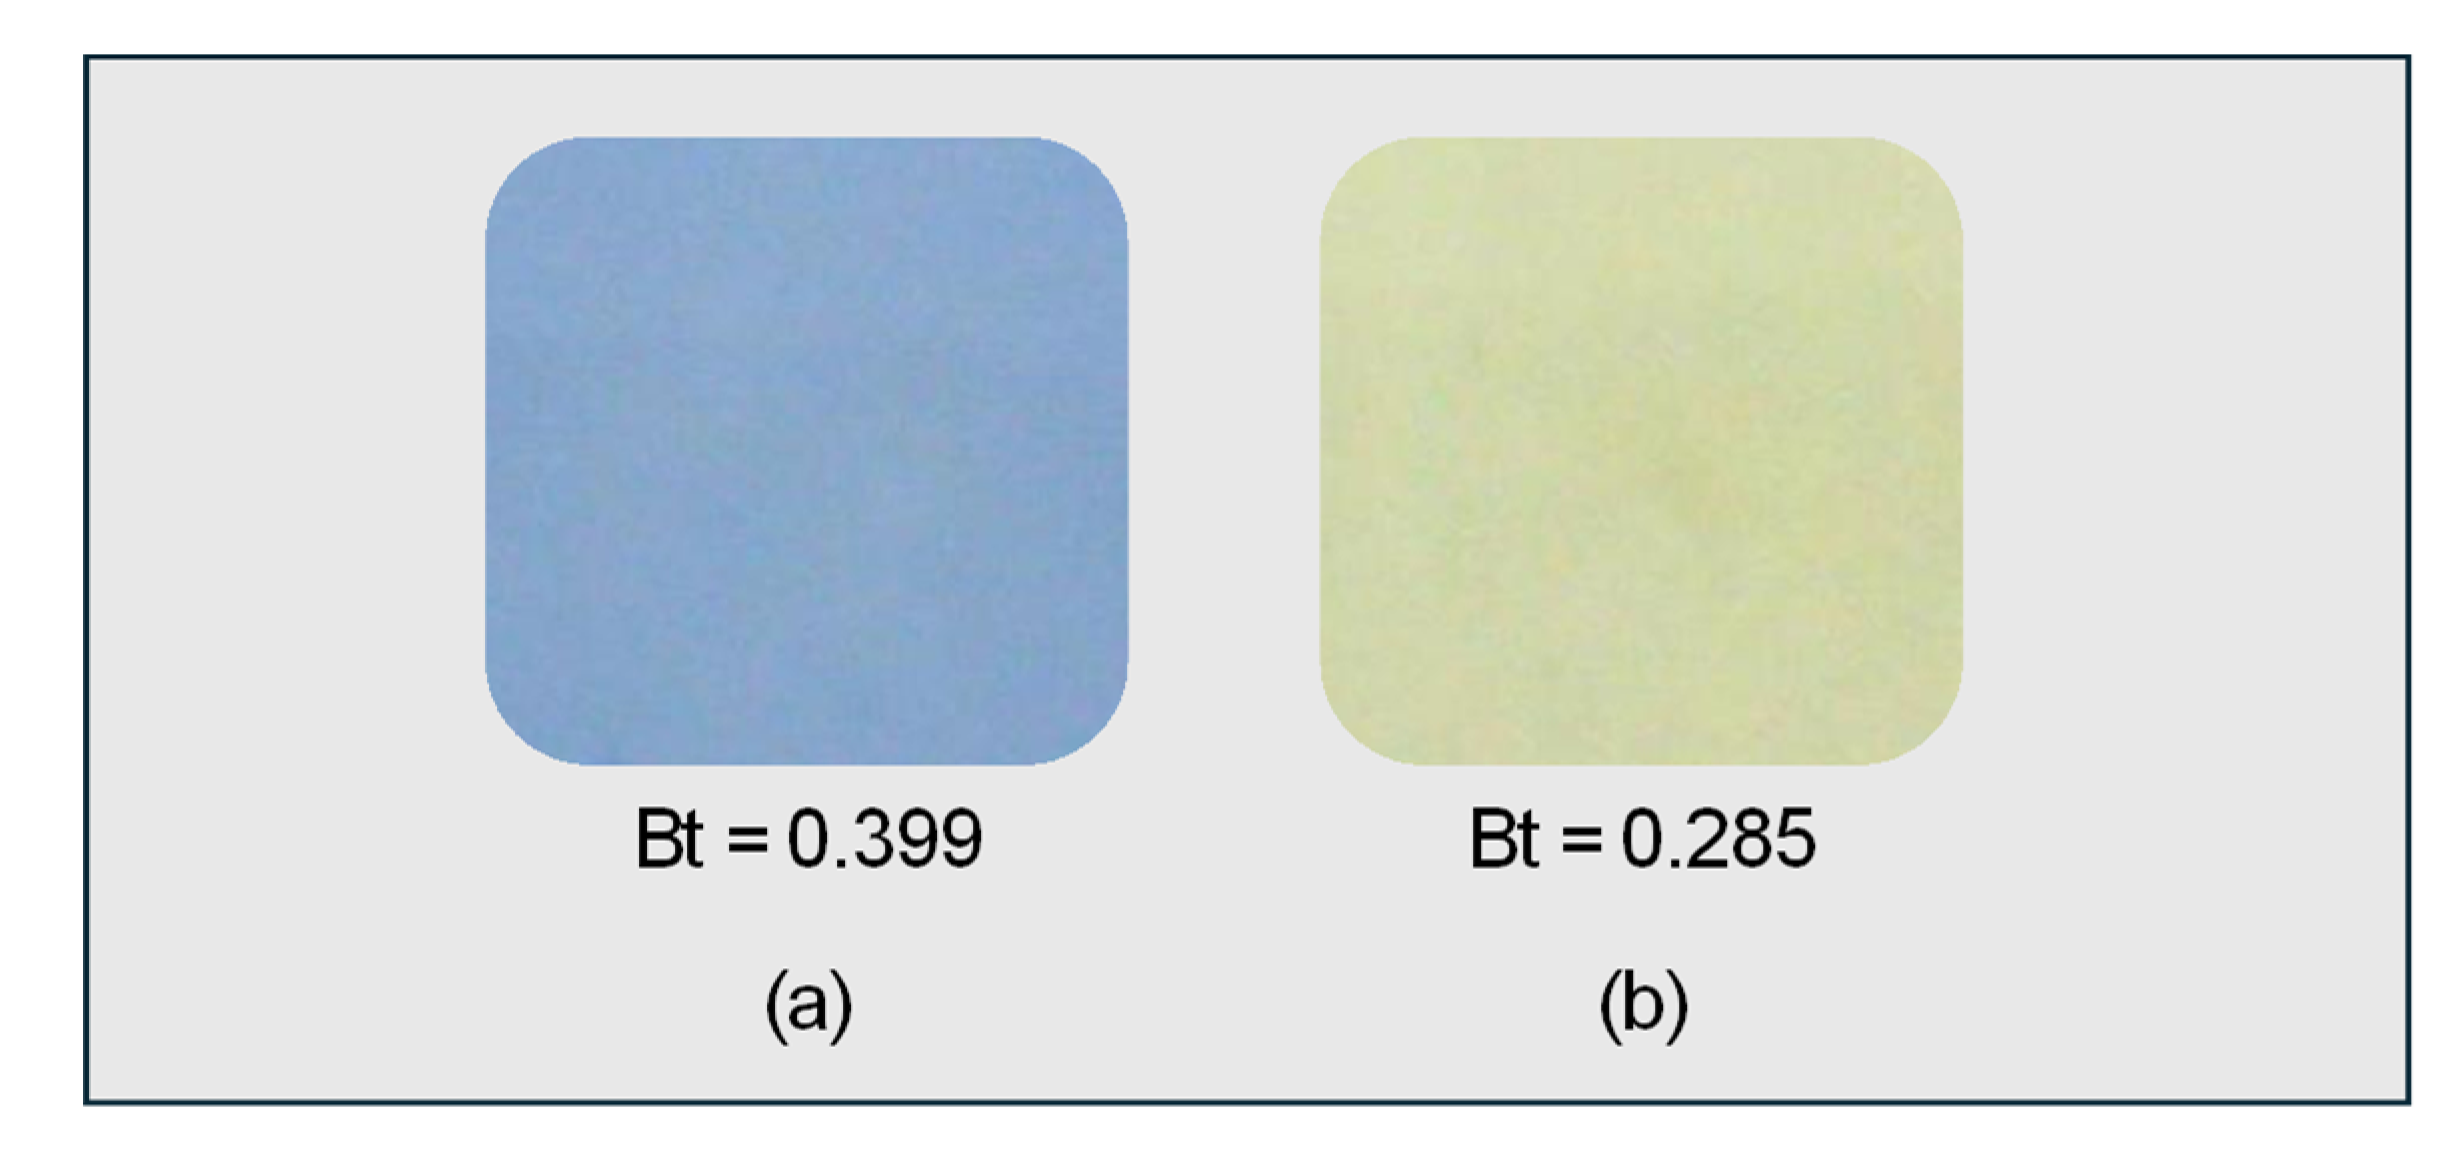
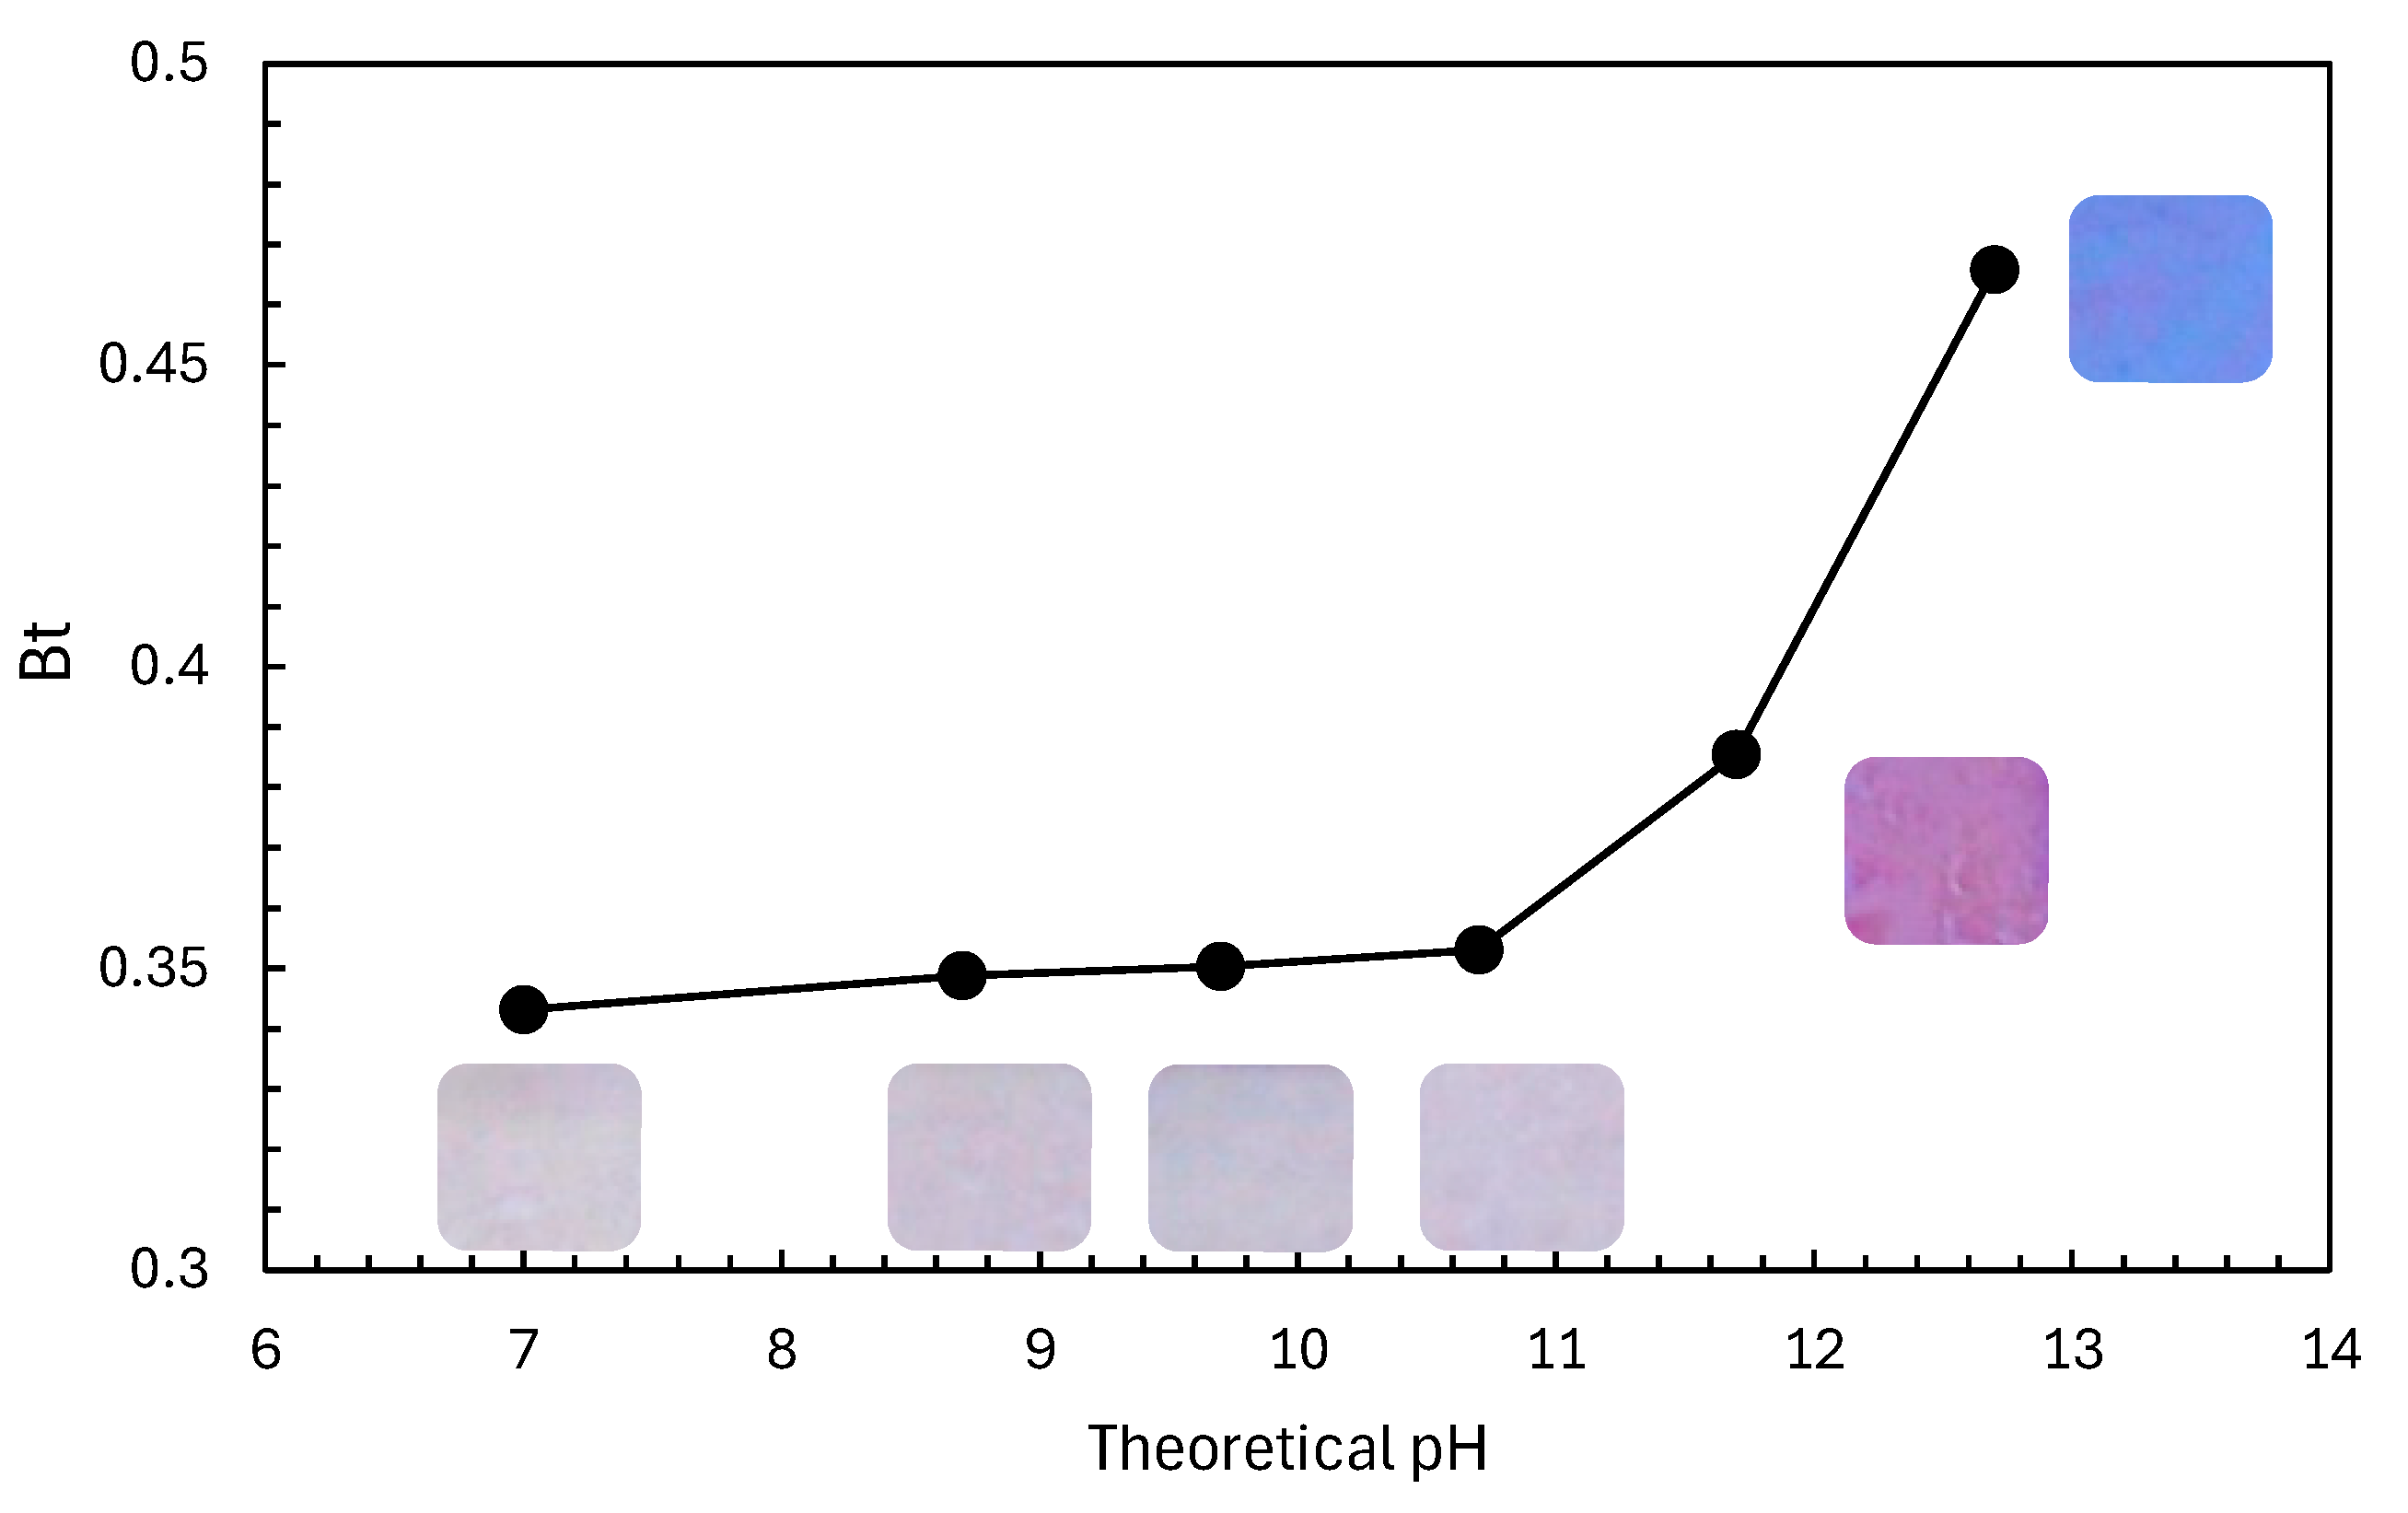
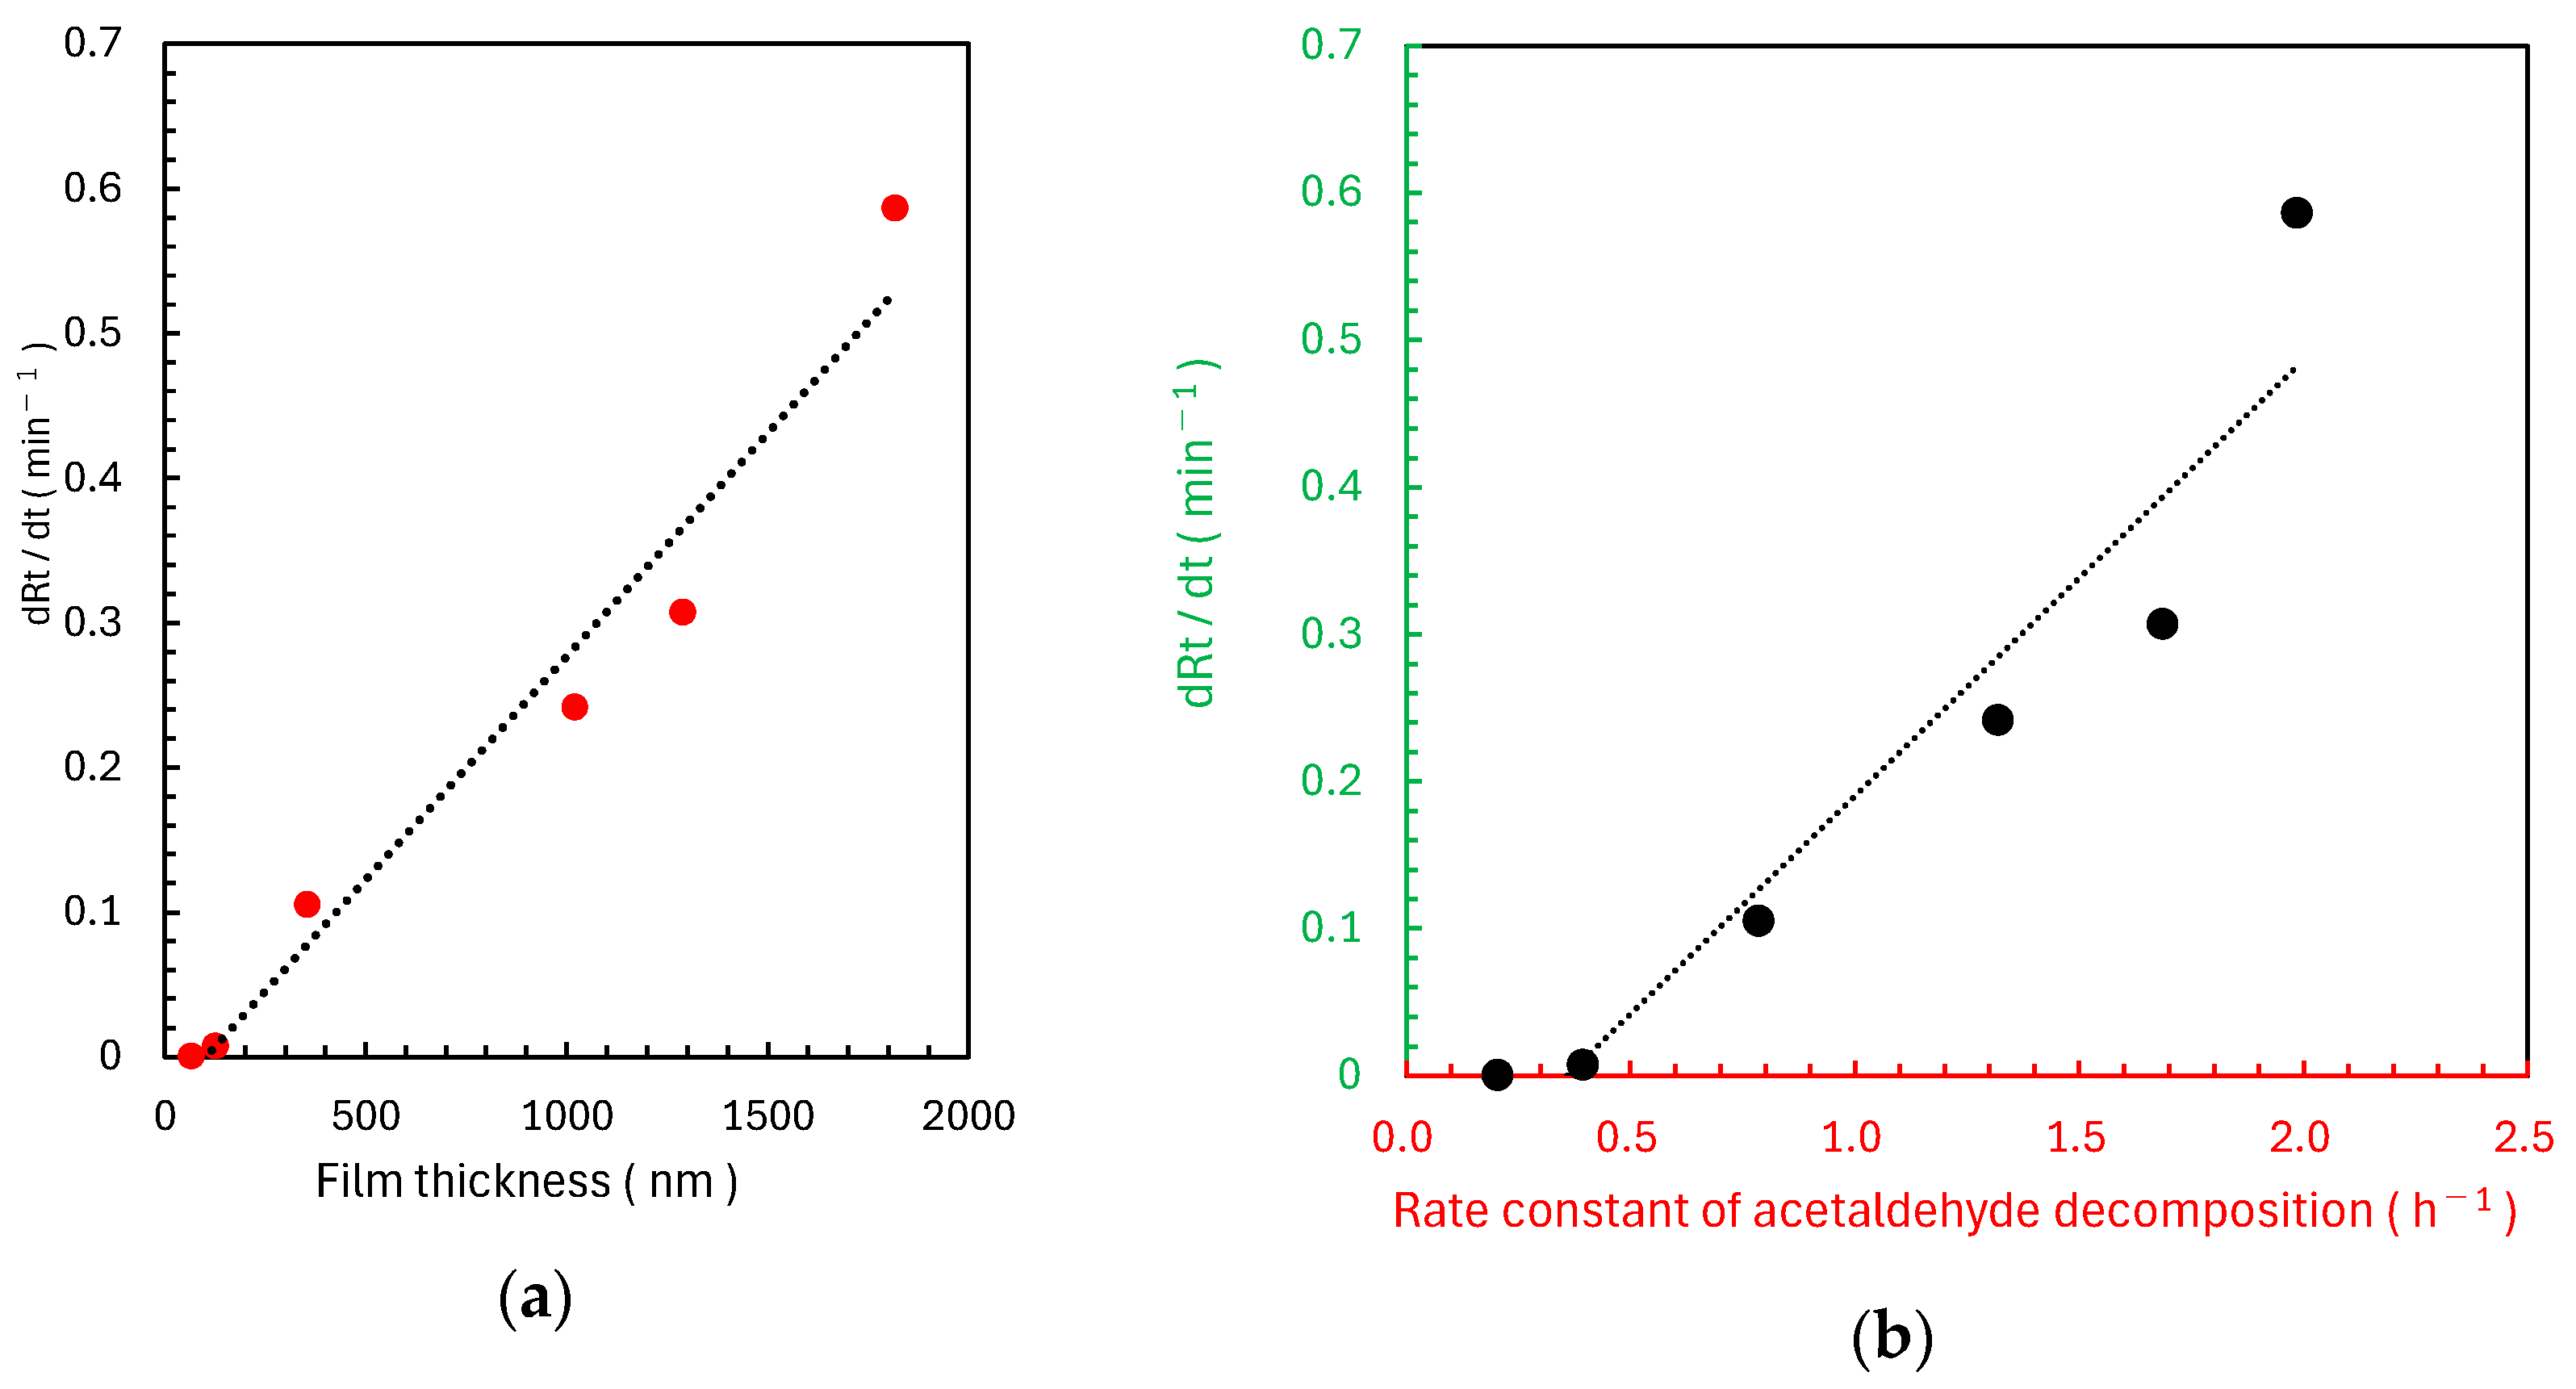
2.2. Evaluation Method of Photocatalytic Performance Using Rz Ink Tests

The ISO–standardised Rz ink test was used to evaluate the photocatalytic performance of the synthesised samples during acetaldehyde decomposition. Rz ink prepared using standard methods was applied to both samples. While the blue colour remained visible on the bare glass substrate (Figure 4a), it disappeared from the 1000 rpm-T1 sample (Figure 4b). The proportion of the blue component Bt, calculated from recorded images, decreased by ~30% in the 1000 rpm-T1 sample compared with that in the glass substrate. During the ~10 s spin-coating process without UV irradiation, the colour of the sample film changed from blue to pink to colourless, suggesting reduction of the Rz ink on the TiO2 substrate.
Based on the results shown in Figure 4, the Rz ink used for testing was modified by adding NaOH solution to intentionally slow the photocatalytic reaction rate. Subsequently, the colour of the 1000 rpm-T1 sample, which showed the highest performance in the acetaldehyde decomposition test, was evaluated after ink application. The blue component increased at a pH > 11 (Figure 5). Notably, the sample exhibited the highest Bt value at pH 12.7 and maintained its blue colour for more than 1 h after ink application.
Experiments were conducted with six TiO2 films of different thicknesses. The Rz ink with added NaOH (pH 12.7) maintained its blue colour regardless of film thickness. In contrast, without NaOH addition, the Bt value of Rz ink decreased with increasing TiO2 film thickness, leading to progressive decolourisation (Figure 6a,b).
After applying pH–adjusted Rz ink (pH 12.7), the colour changes of the six different TiO2 samples were monitored under UV irradiation. An analysis of the relationship between the UV irradiation time and red component ratio Rt (Figure 7a–f) showed that the rate of colour change (slope of the fitted line) increased with decreasing spin-coating speed and increasing slurry concentration. This trend is consistent with the results of acetaldehyde decomposition tests. For the 1000 rpm-T1 and 2000 rpm-T1 samples, the Rt increased and then decreased after 15–30 s, indicating a colour transition from blue to pink to colourless. The other samples did not exhibit complete decolourisation. Strong positive correlations were observed between TiO2 film thickness and the rate of Rz ink colour change (Figure 8a) as well as between the rate constant k1 of acetaldehyde decomposition and the rate of Rz ink colour change (Figure 8b).

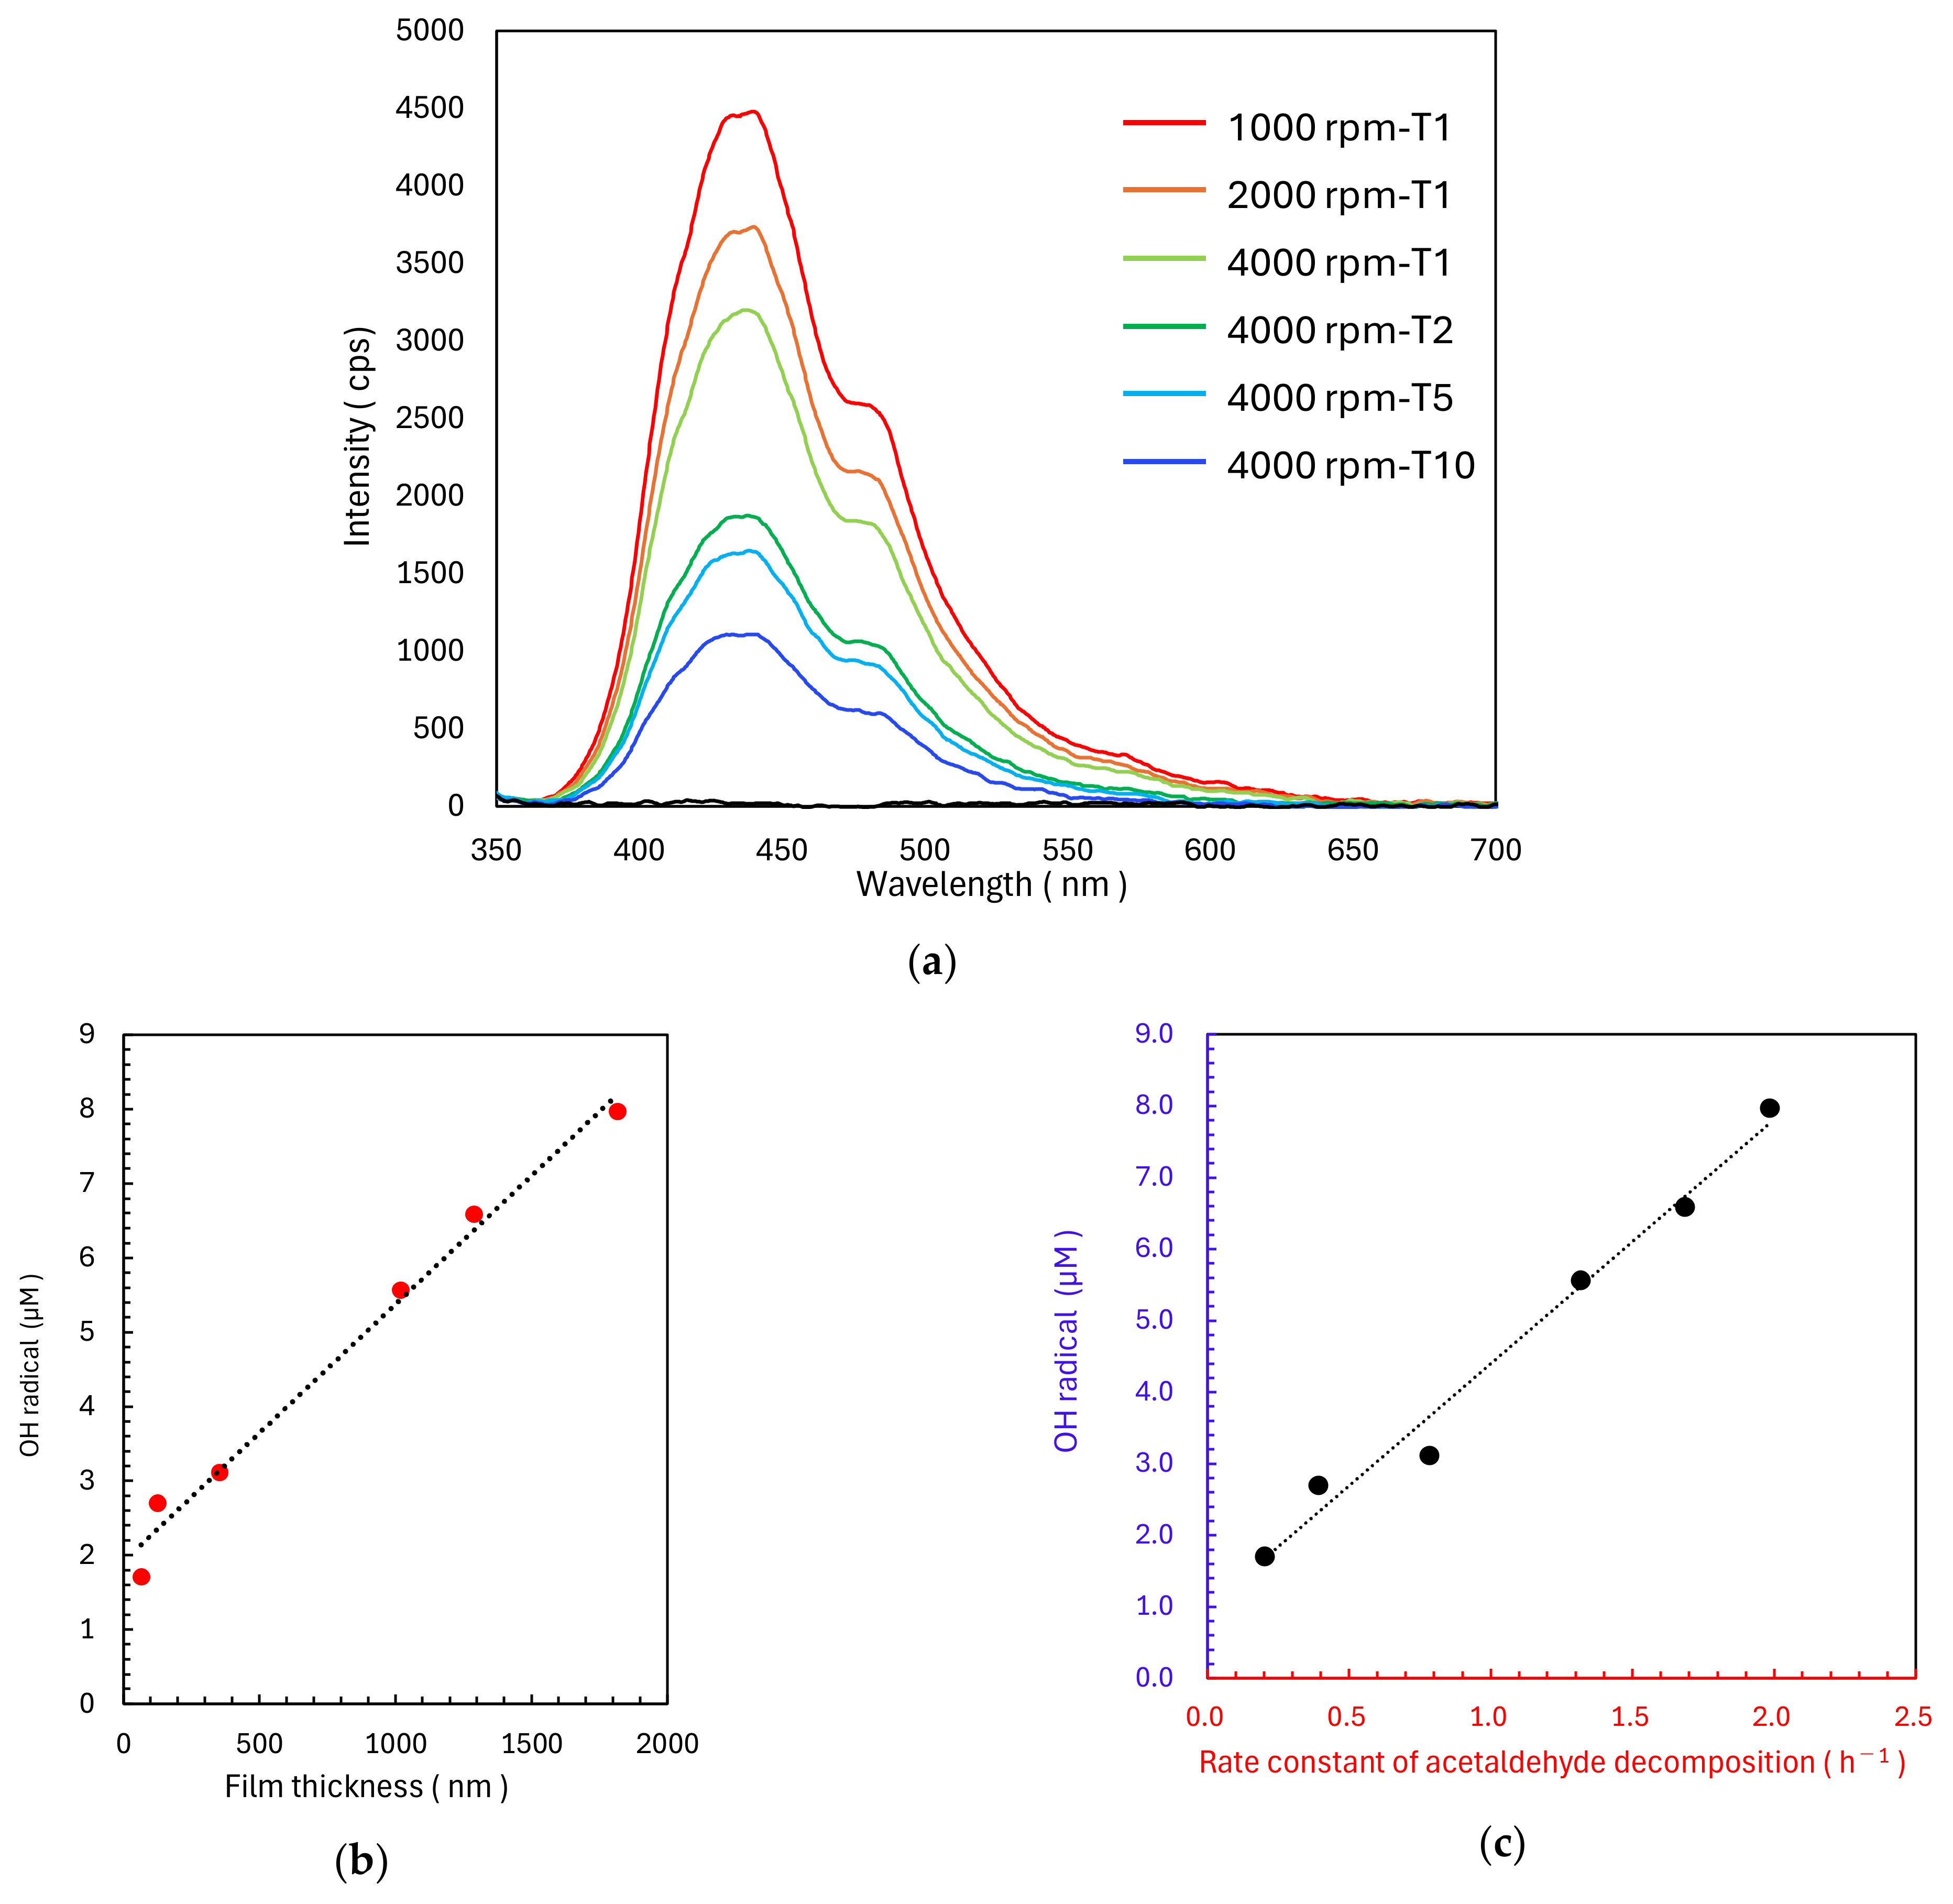
2.3. Evaluation Method of Photocatalytically Generated OH Radicals

Fluorescence measurements using disodium terephthalate (NaTA) were conducted on the six TiO2 samples. After 1 h of UV irradiation, the fluorescence peaks of the samples showed increasing intensity with decreasing spin-coating speed and increasing slurry concentration (Figure 9a). Moreover, a consistent spectral shape was observed across all conditions, suggesting a uniform reaction mechanism. The OH radical concentrations calculated from the fluorescence intensities exhibited strong positive correlations with both TiO2 film thickness (Figure 9b) and the rate constant of acetaldehyde decomposition (k1) (Figure 9c).

3. Discussion

In this study, the photocatalytic performance of TiO2 films was assessed using acetaldehyde decomposition tests, a modified Rz ink method, and OH radical generation tests.
Cross-sectional observations of the TiO2 films by FIB-SEM indicated film thicknesses, controlled by the spin-coating speed and slurry concentration, within 70–1820 nm (Figure 1) along with the formation of secondary particles through primary particle aggregation, resulting in porous film formation. This porous structure likely contributes toward photocatalytic activity enhancement through improved reactant diffusion and light scattering/absorption.
XRD analysis confirmed the formation of a pure anatase TiO2 phase in the synthesised films (Figure 2). The intensity of the main diffraction peak (at ~25°) was correlated with TiO2 film thickness, indicating that film thickness varied with the deposition conditions, whereas the crystal structure remained constant.
In acetaldehyde decomposition tests, the six TiO2 films exhibited different reaction rate constants (k1 values), which showed strong positive correlations with both film thickness and (101) peak intensity (Figure 3). Considering the porous structure of the TiO2 films, the variation in their acetaldehyde decomposition performance was attributed to their increased effective surface area with increasing film thickness.
Unlike standard Rz ink, which shows limited utility in the evaluation of high-performance photocatalytic materials, Rz ink with a pH of 12.7 enables the quantitative evaluation of such materials by controlling the reaction rate (Figure 4, Figure 5, Figure 6 and Figure 7). An increased pH likely reduces the redox potential of Rz, lowering its reduction rate. This modification enables colour-change tracking under UV irradiation, even for samples with high acetaldehyde decomposition performance. The strong positive correlation between the colour change rate of modified Rz ink and acetaldehyde decomposition activity demonstrates the effectiveness of this method as a simple evaluation technique for air purification (Figure 8). Notably, the correlation coefficient for linear fitting in Figure 8b (R2 = 0.91) is slightly lower than that for OH radical measurement (R2 = 0.98), which may be attributed to measurement errors inherent to the simplified coating and image capture procedure of the Rz ink method. Notably, the 1000 rpm-T1 and 2000 rpm-T1 samples showed a colour change from blue to pink to colourless. Rz undergoes an irreversible reduction to pink resorufin [44,45], which is further reduced to colourless dihydroresorufin [12,44]. Thus, the second colour change observed in these samples likely results from the formation of dihydroresorufin. Because this is a consecutive reaction, analysing the colouration of the intermediate species (resorufin) may be challenging during high-performance photocatalyst testing. Therefore, while testing such materials, the initial slope shown in Figure 7 may include the secondary transformation from resorufin (pink) to dihydroresorufin (colourless). This secondary transformation could lead to an overestimation of dRt/dt for high-performance samples such as 1000 rpm-T1, contributing to the slightly lower correlation coefficient observed in Figure 8b.
OH radical generation measurements also indicated strong correlations between film thickness and crystallinity (Figure 9). The strong correlation between the acetaldehyde decomposition rate constant and OH radical generation suggests that OH radicals function as the primary active species in the decomposition reaction. Notably, the fluorescence probe method enables simpler measurements than ESR and can be applied to samples of various shapes and sizes. When using the fluorescence probe method, it is important to consider that measurement values may fluctuate due to light-scattering effects. If the NaTA solution used in the test contains TiO2 particles or fine air bubbles, the excitation light and fluorescence may be reduced by scattering, potentially affecting the accuracy of HTA concentration measurements. However, as measurements with the probe are conducted under static conditions, bubble formation is considered minimal. In this study, TiO2 was sufficiently immobilised on the glass substrate surface, making light scattering from detached TiO2 particles unlikely. These considerations suggest that the fluorescence probe method is particularly effective for TiO2 fixed on substrates such as glass, while special attention must be paid to fluorescence values when analysing powder samples. For powder photocatalyst evaluation, potential solutions include centrifuging the NaTA solution after the photocatalytic reaction to remove particles before fluorescence measurement, or preparing dedicated calibration solutions by dispersing the same amount of TiO2 powder in the HTA solution used for calibration, followed by centrifugation.
These findings indicate that analyses involving modified Rz ink and fluorescence probe testing can function as highly reliable, effective, and simple alternative evaluation techniques for photocatalytic air purification. Therefore, this study provides meaningful insights regarding photocatalytic performance analysis and proposes evaluation methods with high potential for application in material screening and quality control during photocatalytic product development.

4. Materials and Methods

4.1. Fabrication of TiO2 Films on Glass Substrates

Microslide glass (S1111, Matsunami Glass Ind., Ltd., Osaka, Japan) was cut into 25 mm × 25 mm pieces and used as the substrate. Four different concentrations of a TiO2 photocatalytic dispersion (TKD-701, Tayca Corporation, Osaka, Japan), namely, undiluted (T1), 2-fold (T2), 5-fold (T5), and 10-fold (T10), were prepared by dilution with 2-propanol. These TiO2 solutions were deposited on glass substrates using a two-step spin-coating process; the first step was conducted at 500 rpm for 5 s, and the second step was conducted at 1000, 2000, or 4000 rpm for 10 s. By combining different solution concentrations and spin-coating conditions, six types of TiO2 films were fabricated, namely, 1000 rpm-T1, 2000 rpm-T1, 4000 rpm-T1, 4000 rpm-T2, 4000 rpm-T5, and 4000 rpm-T10. After deposition, the samples were dried at room temperature (20 ± 5 °C) and pretreated with UV irradiation (1.0 mW/cm2) for 12 h. The UV pretreatment was performed to remove potential organic contaminants from the sample surface and to standardise the initial conditions before testing. This pretreatment was conducted in accordance with JIS and ISO standard testing methods. Under these fabrication conditions, the amount of TiO2 deposited on glass substrates could be controlled to produce six samples with different photocatalytic performances.

4.2. Structural Analysis of TiO2 Films

An SEM instrument equipped with an FIB component (FEI Company, Ltd., Hillsboro, OR, USA) was used for the cross-sectional sample preparation and structural analyses of the TiO2 films fabricated. For cross-sectional analysis, a thin carbon coating was applied onto the sample surface before machining to avoid damage. Subsequently, TiO2 film cross-sections were prepared by FIB milling of the sample surface at an accelerating voltage of 30 kV. Structural observations were carried out under an accelerating voltage of 2 kV, dwell time of 1 μs, and 32 frame integrations. The θ–2θ scanning XRD patterns of the TiO2 films were recorded on a Rigaku SmartLab using the Cu Kα line (λ = 1.5406 Å) over a 2θ range of 15–75° with a step size of 0.01° and scan speed of 10°/min. The Hanawalt method was used for phase identification [42,43]. Changes in thickness were estimated from changes in the diffraction intensity of the (101) peak in the anatase phase.

4.3. Photocatalytic Performance Test for Acetaldehyde Decomposition

The photocatalytic performances of the TiO2 films were evaluated using a modified acetaldehyde decomposition test [46] based on JIS R1757 [47] and ISO 19,652 [48] in a 0.5 L reactor containing four glass samples (25 mm × 25 mm) under UV irradiation (1.0 mW/cm2). The initial concentration of acetaldehyde was set to 100 ppm, and the change in acetaldehyde concentration was monitored for 1 h using a GASERA ONE photoacoustic gas analyser (Gasera, Ltd., Turku, Finland).

4.4. Evaluation of Photocatalytic Performance Using Rz Ink Tests

The photocatalytic performance of the fabricated TiO2 films was evaluated using a Rz-based photocatalytic indicator ink [7]. To prepare this ink, hydroxyethyl cellulose (750 mg) (HEC; FUJIFILM Wako Pure Chemical Corporation, Osaka, Japan) was dissolved in ultrapure water (49.25 g) with stirring for 12 h at room temperature (20 ± 5 °C). Subsequently, glycerol (5 g) and polysorbate 20 (100 mg) (FUJIFILM Wako Pure Chemical Corporation, Japan) were added with continuous stirring until complete dissolution, followed by the addition of Rz (50 mg) (TCI Co., Ltd., Tokyo, Japan) and stirring for 8 h. To examine the effect of pH on ink colour, NaOH solutions (100 μL) with different concentrations (10 M, 1 M, 0.1 M, 0.01 M, and 0.001 M) were added into this ink. The modified ink was applied to the as-synthesised TiO2 films by spin coating at 1500 rpm for 10 s. The colour change of the ink under UV irradiation (1.0 mW/cm2) was monitored by recording digital images at intervals of 5–14 s. The RGB values of these images were analysed using ImageJ software ver. 1.54g (Figure 10) [49].

4.5. Evaluation of Photocatalytically Generated OH Radicals

The concentration of the photocatalytically generated OH radicals was measured using the NaTA fluorescence probe method [30,31], whose basic principle is as follows: OH radicals react with TA to produce HTA (Figure 11), and as HTA emits characteristic fluorescence, the amount of HTA produced can be quantified by measuring fluorescence intensity. Moreover, as the reaction proceeds stoichiometrically at a ratio of 1:1, the amount of OH radicals that reacted with TA can be directly estimated from the amount of HTA produced. Here, an NaTA solution (20 mL; 5 mM) (TCI Co., Ltd.) was placed in a Petri dish containing the four photocatalyst samples and irradiated with UV light (1.0 mW/cm2) for 1 h. The fluorescence spectra of these solutions were measured using a SEC2020 UV/vis Spectrometer (ALS Co., Ltd., Tokyo, Japan). A probe combining optical fibres for 310 nm LED excitation light and fluorescence detection was inserted into the test solutions to record data over 400–500 nm. The OH radical concentration was quantified using a calibration curve prepared from standard solutions of 2-hydroxyterephthalic acid (TCI Co., Ltd.).

5. Conclusions

In this study, the effectiveness of using a modified Rz ink test and the fluorescence probe method as simple evaluation techniques for assessing photocatalytic air purification performance was investigated. TiO2 film samples with varying thicknesses were fabricated by controlling spin-coating speed and slurry concentration to validate the effectiveness of these methods. Notably, adjusting the pH of Rz ink to 12.7 enabled the quantitative evaluation of high-performance photocatalytic materials, which is challenging using standard Rz ink [7]. The proposed method for evaluating OH radical generation uses a fluorescence probe as a simple alternative to ESR. This method maintains a strong correlation with the acetaldehyde decomposition performance of the system. Both modified Rz ink testing and fluorescence probe evaluation methods showed strong correlations with acetaldehyde decomposition performance, confirming their high reliability as alternative evaluation methods for photocatalytic air purification performance. Thus, the evaluation methods proposed in this study have potential for application in material screening and quality control during photocatalytic product development. Future studies will focus on expanding the application of these methods to a wide range of photocatalytic materials and validating them under different evaluation conditions.

Author Contributions

Conceptualisation, methodology, K.H. and T.O.; validation, formal analysis, writing—original draft, K.H.; investigation, data curation, K.H., D.M. and M.N.; writing—review and editing, D.M., M.N. and T.O.; supervision, T.O. All authors have read and agreed to the published version of the manuscript.

Funding

This research received no external funding.

Data Availability Statement

Data are contained within the article.

Acknowledgments

We would like to thank Hitoshi Ishiguro (KISTEC) for advice on the experimental design of Rz ink tests. We also would like to thank Yosuke Mizuno (KISTEC) for help given in observing XRD patterns of the TiO2 films.

Conflicts of Interest

The authors declare no conflicts of interest.

References

  1. Fujishima, A.; Honda, K. Electrochemical Photolysis of Water at a Semiconductor Electrode. Nature 1972, 238, 37–38. [Google Scholar] [CrossRef] [PubMed]
  2. Fujishima, A.; Rao, T.N.; Tryk, D.A. Titanium dioxide photocatalysis. J. Photochem. Photobiol. C Photochem. Rev. 2000, 1, 1–21. [Google Scholar] [CrossRef]
  3. Fujishima, A.; Zhang, X.; Tryk, D.A. TiO2 photocatalysis and related surface phenomena. Surf. Sci. Rep. 2008, 63, 515–582. [Google Scholar] [CrossRef]
  4. Nakata, K.; Fujishima, A. TiO2 photocatalysis: Design and applications. J. Photochem. Photobiol. C Photochem. Rev. 2012, 13, 169–189. [Google Scholar] [CrossRef]
  5. Hamada, K.; Ochiai, T.; Aoki, D.; Akutsu, Y.; Hirabayashi, Y. Decomposition of Gaseous Styrene Using Photocatalyst and Ozone Treatment. Catalysts 2022, 12, 316. [Google Scholar] [CrossRef]
  6. Mills, A.; Wang, J.; Lee, S.-K.; Simonsen, M. An intelligence ink for photocatalytic films. Chem. Commun. 2005, 21, 2721–2723. [Google Scholar] [CrossRef]
  7. ISO 21066: 2018; Fine Ceramics (Advanced Ceramics, Advanced Technical Ceramics)—Qualitative and Semiquantitative Assessment of the Photocatalytic Activities of Surfaces by the Reduction of Resazurin in a Deposited Ink Film. International Organization for Standardization: Geneva, Switzerland, 2018.
  8. JIS R 1703-1: 2020; Fine Ceramics (Advanced Ceramics, Advanced Technical Ceramics)—Test Method for Self-Cleaning Performance of Photocatalytic Materials—Part 1: Measurement of Water Contact Angle. Japanese Standards Association: Tokyo, Japan, 2020.
  9. JIS R 1703-2: 2014; Fine Ceramics (Advanced Ceramics, Advanced Technical Ceramics)—Test Method for Self-Cleaning Performance of Photocatalytic Materials—Part 2: Decomposition of Wet Methylene Blue. Japanese Standards Association: Tokyo, Japan, 2014.
  10. Mills, A.; Cusick, A.; Hepburn, J. The Kinetics of Semiconductor Photocatalysis in Activity-Indicator Films. J. Adv. Oxid. Technol. 2009, 12, 152–157. [Google Scholar] [CrossRef]
  11. Mills, A.; Hill, C.; Robertson, P.K.J. Overview of the current ISO tests for photocatalytic materials. J. Photochem. Photobiol. A Chem. 2012, 237, 7–23. [Google Scholar] [CrossRef]
  12. Mills, A.; Hepburn, J.; Hazafy, D.; O’Rourke, C.; Krysa, J.; Baudys, M.; Zlamal, M.; Bartkova, H.; Hill, C.E.; Winn, K.R.; et al. A simple, inexpensive method for the rapid testing of the photocatalytic activity of self-cleaning surfaces. J. Photochem. Photobiol. A Chem. 2013, 272, 18–20. [Google Scholar] [CrossRef]
  13. Mills, A.; Hepburn, J.; Hazafy, D.; O’Rourke, C.; Wells, N.; Krysa, J.; Baudys, M.; Zlamal, M.; Bartkova, H.; Hill, C.E.; et al. Photocatalytic activity indicator inks for probing a wide range of surfaces. J. Photochem. Photobiol. A Chem. 2014, 290, 63–71. [Google Scholar] [CrossRef]
  14. Ishibashi, K.-I.; Fujishima, A.; Watanabe, T.; Hashimoto, K. Detection of active oxidative species in TiO2 photocatalysis using the fluorescence technique. Electrochem. Commun. 2000, 2, 207–210. [Google Scholar] [CrossRef]
  15. Bubacz, K.; Kusiak-Nejman, E.; Tryba, B.; Morawski, A.W. Investigation of OH radicals formation on the surface of TiO2/N photocatalyst at the presence of terephthalic acid solution. Estimation of optimal conditions. J. Photochem. Photobiol. A Chem. 2013, 261, 7–11. [Google Scholar] [CrossRef]
  16. Tampieri, F.; Ginebra, M.-P.; Canal, C. Quantification of Plasma-Produced Hydroxyl Radicals in Solution and their Dependence on the pH. Anal. Chem. 2021, 93, 3666–3670. [Google Scholar] [CrossRef] [PubMed]
  17. Nosaka, Y.; Nosaka, A.Y. Generation and Detection of Reactive Oxygen Species in Photocatalysis. Chem. Rev. 2017, 117, 11302–11336. [Google Scholar] [CrossRef]
  18. Hirakawa, T.; Yawata, K.; Nosaka, Y. Photocatalytic reactivity for O2•- and •OH radical formation in anatase and rutile TiO2 suspension as the effect of H2O2 addition. Appl. Catal. A 2007, 325, 105. [Google Scholar] [CrossRef]
  19. Yan, G.; Chen, J.; Hua, Z. Roles of H2O2 and OHradical dot radical in bactericidal action of immobilized TiO2 thin-film reactor: An ESR study. J. Photochem. Photobiol. A Chem. 2009, 207, 153–159. [Google Scholar] [CrossRef]
  20. Sawada, T.; Yoshino, F.; Kimoto, K.; Takahashi, Y.; Shibata, T.; Hamada, N.; Sawada, T.; Toyoda, M.; Lee, M.-C. ESR Detection of ROS Generated by TiO2 Coated with Fluoridated Apatite. J. Dent. Res. 2010, 89, 848–853. [Google Scholar] [CrossRef]
  21. Suzuki, S.; Okazaki, T.; Amano, F. Continuous-Flow Electron Spin Resonance Measurements of Hydroxyl Radicals Produced during Photocatalytic Water Oxidation. J. Phys. Chem. C 2024, 128, 19669–19678. [Google Scholar] [CrossRef]
  22. Zhang, J.; Nosaka, Y. Photocatalytic oxidation mechanism of methanol and the other reactants in irradiated TiO2 aqueous suspension investigated by OH radical detection. Appl. Catal. B Environ. 2015, 166–167, 32–36. [Google Scholar] [CrossRef]
  23. Nosaka, Y.; Nosaka, A. Understanding Hydroxyl Radical (•OH) Generation Processes in Photocatalysis. ACS Energy Lett. 2016, 1, 356–359. [Google Scholar] [CrossRef]
  24. Tochikubo, F.; Shimokawa, Y.; Shirai, N.; Uchida, S. Chemical reactions in liquid induced by atmospheric-pressure dc glow discharge in contact with liquid. Jpn. J. Appl. Phys. 2014, 53, 126201. [Google Scholar] [CrossRef]
  25. Kanazawa, S.; Furuki, T.; Nakaji, T.; Akamine, S.; Ichiki, R. Measurement of OH Radicals in Aqueous Solution Produced by Atmospheric-pressure LF Plasma Jet. Int. J. Plasma Environ. Sci. Technol. 2012, 6, 166–171. [Google Scholar]
  26. Kanazawa, S.; Furuki, T.; Nakaji, T.; Akamine, S.; Ichiki, R. Application of chemical dosimetry to hydroxyl radical measurement during underwater discharge. J. Phys. Conf. Ser. 2013, 418, 012102. [Google Scholar] [CrossRef]
  27. Hamada, K.; Ochiai, T.; Tsuchida, Y.; Miyano, K.; Ishikawa, Y.; Nagura, T.; Kimura, N. Eco-Friendly Cotton/Linen Fabric Treatment Using Aqueous Ozone and Ultraviolet Photolysis. Catalysts 2020, 10, 1265. [Google Scholar] [CrossRef]
  28. Sahni, M.; Locke, B.R. Quantification of Hydroxyl Radicals Produced in Aqueous Phase Pulsed Electrical Discharge Reactors. Ind. Eng. Chem. Res. 2006, 45, 5819–5825. [Google Scholar] [CrossRef]
  29. Sahni, M.; Locke, B.R. The Effects of Reaction Conditions on Liquid-Phase Hydroxyl Radical Production in Gas-Liquid Pulsed-Electrical-Discharge Reactors. Plasma Process. Polym. 2006, 3, 668–681. [Google Scholar] [CrossRef]
  30. Kanazawa, S.; Kawano, H.; Watanabe, S.; Furuki, T.; Akamine, S.; Ichiki, R.; Ohkubo, T.; Kocik, M.; Mizeraczyk, J. Observation of OH radicals produced by pulsed discharges on the surface of a liquid. Plasma Sources Sci. Technol. 2011, 20, 034010. [Google Scholar] [CrossRef]
  31. Hayashi, H.; Akamine, S.; Ichiki, R.; Kanazawa, S. Comparison of OH radical concentration generated by underwater discharge using two methods. Int. J. Plasma Environ. Sci. Technol. 2016, 10, 24–28. [Google Scholar]
  32. Charbouillot, T.; Brigante, M.; Mailhot, G.; Maddigapu, P.R.; Minero, C.; Vione, D. Performance and selectivity of the terephthalic acid probe for OH as a function of temperature, pH and composition of atmospherically relevant aqueous media. Photochem. Photobiol. A Chem. 2011, 222, 70–76. [Google Scholar] [CrossRef]
  33. Khan, M.S.I.; Lee, E.-J.; Kim, Y.-J. Roles of individual radicals generated by a submerged dielectric barrier discharge plasma reactor during Escherichia coli O157:H7 inactivation. AIP Adv. 2015, 5, 107111. [Google Scholar] [CrossRef]
  34. Tochikubo, F.; Uchida, S.; Watanabe, T. Study on Decay Characteristics of OH Radical Density in Pulsed Discharge in Ar/H2O. Jpn. J. Appl. Phys. 2004, 43, 315. [Google Scholar] [CrossRef]
  35. Aparna, N.; Philip, R.S.; Mathew, M. Tailoring the properties of SnS thin films deposited at room temperature by varying the amount of complexing agent for enhanced photocatalytic activity. Mater. Today Sustain. 2024, 27, 100941. [Google Scholar] [CrossRef]
  36. Yang, L.; Chen, Z.; Cao, Q.; Liao, H.; Gao, J.; Zhang, L.; Wei, W.; Li, H.; Lu, J. Structural Regulation of Photocatalyst to Optimize Hydroxyl Radical Production Pathways for Highly Efficient Photocatalytic Oxidation. Adv. Mater. 2024, 36, 2306758. [Google Scholar] [CrossRef] [PubMed]
  37. Shen, J.-H.; Chuang, H.-Y.; Jiang, Z.-W.; Liu, X.-Z.; Horng, J.-J. Novel quantification of formation trend and reaction efficiency of hydroxyl radicals for investigating photocatalytic mechanism of Fe-doped TiO2 during UV and visible light-induced degradation of acid orange 7. Chemosphere 2020, 251, 126380. [Google Scholar] [CrossRef]
  38. Shiraki, D.; Ishibashi, N.; Takeuchi, N. Quantitative Estimation of OH Radicals Reacting in Liquid Using a Chemical Probe for Plasma in Contact with Liquid. IEEE Trans. Plasma Sci. 2016, 44, 3158–3163. [Google Scholar] [CrossRef]
  39. Matthews, R.W. The Radiation Chemistry of the Terephthalate Dosimeter. Radiat. Res. 1980, 83, 27–41. [Google Scholar] [CrossRef]
  40. Fang, X.; Mark, G.; von Sonntag, C. OH radical formation by ultrasound in aqueous solutions Part I: The chemistry underlying the terephthalate dosimeter. Ultrason. Sonochem. 1996, 3, 57–63. [Google Scholar] [CrossRef]
  41. Yahagi, T.; Ohji, T.; Yamaguchi, H.; Takahashi, T.; Nakano, H.; Iijima, M.; Tatami, J. Deformation Behavior and Fracture Strength ofSingle-Crystal 4H-SiC Determined by MicrocantileverBending Tests. Adv. Eng. Mater. 2024, 26, 2400095. [Google Scholar] [CrossRef]
  42. Hanawalt, J.D.; Rinn, W.; Frevel, L.K. Chemical Analysis by X-Ray Diffraction. Ind. Eng. Chem. Anal. Ed. 1938, 10, 457–512. [Google Scholar] [CrossRef]
  43. Hanawalt, J.D.; Rinn, W. Identification of Crystalline Materials. Ind. Eng. Chem. Anal. Ed. 1936, 8, 244–247. [Google Scholar] [CrossRef]
  44. Mills, A.; Wells, N. Reductive photocatalysis and smart inks. Chem. Soc. Rev. 2015, 44, 2849–2864. [Google Scholar] [CrossRef] [PubMed]
  45. Mills, A.; Wells, N.; O’Rourke, C. Probing the activities of UV and visible-light absorbing photocatalyst powders using a resazurin-based photocatalyst activity indicator ink (Rz Paii). J. Photochem. Photobiol. A Chem. 2017, 338, 123–133. [Google Scholar] [CrossRef]
  46. Ochiai, T.; Nagai, T.; Hamada, K.; Tobe, T.; Aoki, D.; Sunada, K.; Ishiguro, H. Estimating the Anti-Viral Performance of Photocatalytic Materials: The Correlation between Air Purification Efficiency and Severe Acute Respiratory Syndrome Coronavirus 2 Inactivation. Catalysts 2024, 14, 163. [Google Scholar] [CrossRef]
  47. JIS R 1757: 2020; Fine Ceramics (Advanced Ceramics, Advanced Technical Ceramics)—Test Method of Complete Decomposition by Photocatalytic Materials Under Indoor Lighting Environment-Decomposition of Acetaldehyde. Japanese Standards Association: Tokyo, Japan, 2020.
  48. ISO 19652: 2018; Fine Ceramics (Advanced Ceramics, Advanced Technical Ceramics), Test Method for Complete Decomposition Performance of Semiconducting Photocatalytic Materials Under Indoor Lighting Environment, Decomposition of Acetaldehyde. International Organization for Standardization: Geneva, Switzerland, 2018.
  49. Schneider, C.A.; Rasband, W.S.; Eliceiri, K.W. NIH Image to ImageJ: 25 years of image analysis. Nat. Methods 2012, 9, 671–675. [Google Scholar] [CrossRef]
Figure 1. SEM images of the cross-sections of films fabricated at the following spin-coating speeds and photocatalyst solution concentrations: (a) 1000 rpm-T1 (undiluted); (b) 2000 rpm-T1 (undiluted); (c) 4000 rpm-T1 (undiluted); (d) 4000 rpm-T2 (2-fold dilution); (e) 4000 rpm-T5 (5-fold dilution); and (f) 4000 rpm-T10 (5-fold dilution). SEM was conducted at an accelerating voltage of 2.0 kV with a dwell time of 1 µs and 32 frame integrations.
Catalysts 15 00288 g001
Figure 2. XRD patterns of the fabricated films. (a) XRD patterns of films synthesized at different spin-coating speeds and solution concentrations. (b) Comparison of the XRD pattern of the film fabricated at 1000 rpm-T1 with the reference patterns of anatase and rutile TiO2 from the ICSD database.
Catalysts 15 00288 g002
Figure 3. (a) Time-dependent acetaldehyde concentration values during photocatalytic decomposition under UV irradiation (365 nm, 1.0 mW/cm2) for TiO2 films fabricated with different spin-coating speeds and photocatalyst solution concentrations. (b) Relationship between TiO2 film thickness and the rate constant of acetaldehyde decomposition. (c) Relationship between the (101) peak intensity of anatase TiO2 and rate constant of acetaldehyde decomposition.
Catalysts 15 00288 g003
Figure 4. Photographs of Rz ink applied by spin-coating (1500 rpm, 10 s) on a (a) bare glass substrate and (b) TiO2 film synthesised at 1000 rpm-T1, recorded immediately after ink application without UV irradiation. Here, Bt = RGB(B)/(RGB(R) + RGB(G) + RGB(B)).
Catalysts 15 00288 g004
Figure 5. Relationship between the theoretical pH of Rz ink, calculated from the amount of added NaOH solution, and Rz ink colour immediately after coating onto a TiO2 film fabricated at 1000 rpm-T1 without UV irradiation. Here, Bt = RGB(B)/(RGB(R) + RGB(G) + RGB(B)).
Catalysts 15 00288 g005
Figure 6. (a) Effect of film thickness on the RGB values of resazurin ink coated onto TiO2 films with and without NaOH addition, measured immediately after coating without UV irradiation; (b) corresponding photographs of TiO2 films coated with Rz ink. Here, Bt = RGB(B)/(RGB(R) + RGB(G) + RGB(B)).
Catalysts 15 00288 g006
Figure 7. Time evolution of the normalised red colour component Rt of Rz ink coated onto the following TiO2 films fabricated under different conditions on exposure to UV irradiation (365 nm, 1.0 mW/cm2): (a) 1000 rpm-T1; (b) 2000 rpm-T1; (c) 4000 rpm-T1; (d) 4000 rpm-T2; (e) 4000 rpm-T5; and (f) 4000 rpm-T10. Here, Rt = RGB(R)/(RGB(R) + RGB(G) + RGB(B)).
Catalysts 15 00288 g007
Figure 8. (a) Relationship between TiO2 film thickness and the rate of change of the normalised red colour component Rt. (b) Relationship between the rate constant of acetaldehyde decomposition and the rate of change of the normalised red colour component Rt.
Catalysts 15 00288 g008
Figure 9. (a) Fluorescence spectra of 2-hydroxyterephthalic acid produced by the reaction between terephthalic acid and photogenerated OH radicals on TiO2 films fabricated with different spin-coating speeds and photocatalyst solution concentrations under UV irradiation (365 nm, 1.0 mW/cm2). Relationship between (b) TiO2 film thickness and photogenerated OH radical concentrations and between the (c) rate constant of acetaldehyde decomposition and photogenerated OH radical concentration.
Catalysts 15 00288 g009
Figure 10. Process for evaluating photocatalytic performance using Rz ink tests.
Catalysts 15 00288 g010
Figure 11. Evaluation method of photocatalytically generated OH radicals using NaTA. (a) Formation of HTA through the reaction between OH radicals and NaTA. (b) Fluorescence measurement system for HTA detection involving excitation light and fluorescence detection units.
Catalysts 15 00288 g011
Disclaimer/Publisher’s Note: The statements, opinions and data contained in all publications are solely those of the individual author(s) and contributor(s) and not of MDPI and/or the editor(s). MDPI and/or the editor(s) disclaim responsibility for any injury to people or property resulting from any ideas, methods, instructions or products referred to in the content.

