Article

Synergistic Radical and Non-Radical Pathways in Phenol Degradation: Electron Transfer Mechanism Dominated by N-Doped Carbon/Peroxymonosulfate System

1
State Key Laboratory of Coking Coal Resources Green Exploitation, China University of Mining and Technology, Xuzhou 221116, China
2
School of Chemical Engineering and Technology, China University of Mining and Technology, Xuzhou 221008, China
3
Center of Mineral Resource Waste Recycling, China University of Mining and Technology, Xuzhou 221008, China
*
Author to whom correspondence should be addressed.
Catalysts 2025, 15(10), 968; https://doi.org/10.3390/catal15100968
Submission received: 12 September 2025 / Revised: 3 October 2025 / Accepted: 8 October 2025 / Published: 10 October 2025
(This article belongs to the Section Catalytic Materials)

Abstract

Phenolic compounds constitute the predominant group of recalcitrant organic contaminants in coal chemical wastewater. In this study, humic acid and urea were used as carbon and nitrogen sources to prepare nitrogen-doped carbon material (labeled as NC-800) through a two-step calcination process. Using this catalyst (NC-800) to activate PMS for phenol degradation achieved 100% phenol removal across a wide pH range (1–9). The removal rate remained at 99.62% even with high concentrations of inorganic anions or natural organic matter, breaking through the limitations of traditional Fenton-like reactions in terms of acid–base environment and anion influence. The quenching experiment and electron spin resonance (ESR) spectroscopy results indicated that the N-C/PMS system generated three active species hydroxyl radicals (•OH), superoxide radicals (O2•−), and singlet oxygen (1O2) through the active sites in electron-rich regions such as graphite nitrogen, pyrrole nitrogen, and C=O. An electrochemical test revealed that the system formed a metastable NC-800-PMS* complex during the reaction, indicating the existence of a non-radical pathway of electron transfer. The combination of free radicals (•OH, O2•−) and non-free radicals (1O2, electron transfer) facilitated the rapid degradation of phenol, providing a theoretical basis for phenol degradation.

1. Introduction

Coal chemical wastewater primarily originates from the coal processing industry and typically contains a lot of harmful substances, including phenols, long-chain alkanes, and ammonia nitrogen, along with high salt content [1]. Phenolic pollutants, such as phenol, cresols, mono-phenols, and di-phenols, are the predominant group of organic compounds in coal chemical wastewater, whose Chemical Oxygen Demand (COD) accounts for approximately 60% to 80% of the total [2]. Phenol is highly toxic and has carcinogenic and mutagenic properties; it not only resists biodegradation but also poses risks to health and the environment [3]. Therefore, exploring effective methods for the treatment of phenol-polluted water sources is highly worthwhile.
Compared to traditional oxidation methods, advanced oxidation processes (AOPs) are increasingly used to degrade organic toxins. Persulfate-based AOPs can generate reactive oxidizing species (ROS), such as hydroxyl radicals (•OH), sulfate radicals (SO4•−), and singlet oxygen (1O2), which can degrade toxic organic pollutants into harmless mineral salts, carbon dioxide, and water [4]. Activating persulfate is an effective method for degrading refractory organic compounds.
Carbon materials has extensively developed as activators for persulfate for the degradation of organic pollutants, primarily due to their abundance, excellent biocompatibility, high specific surface area, acid and alkali resistance, and tunable electronic structures and physicochemical properties [5]. For example, reduced graphene oxide [6], carbon nanotubes [7], nanodiamonds [8], and ordered mesoporous carbon [9] have all been used to activate persulfate for the effective degradation of phenol. However, these pure carbon materials are often difficult to obtain, making it essential to develop high-performance carbon-based materials. Natural polymer humic acid (HA) is an excellent precursor for carbon materials. Humic acid has a porous nature and a high oxygen content, and during carbonization, it releases a significant amount of volatile components, contributing to pore formation [10]. The surface of HA-based carbon materials contains oxygen functional groups and disordered aromatic structures, which can effectively adsorb phenol and some heterocyclic organic compounds in coal chemical wastewater [11,12].
Introducing heteroatoms during the preparation of carbon materials can significantly enhance their catalytic performance. Among these, nitrogen (N) doping is widely applied. The similarity in atomic radius between N and C, along with their differing electronegativities, allows for high loading level and the ability to tune the local electronic structure for carbon materials. Additionally, nitrogen modification introduces various nitrogen dopants (graphitic nitrogen, pyridinic nitrogen, and pyrrolic nitrogen) and nitrogen functional groups (oxynitride compounds and amine groups), achieving different catalytic effects in carbon materials [13]. For instance, Duan et al. [14] utilized melamine as a precursor for nitrogen-doped carbon nanotubes, which exhibited a performance for activating PMS to degrade phenol that was greater than that of nitrogen-free carbon nanotubes. Wang et al. [15] employed ammonia as a precursor for nitrogen-doped graphene, achieving a performance for activating peroxydisulfate (PDS) to degrade bisphenol A and bisphenol F that was 700 times higher than that of graphene. Graphitic carbon nitride (g-C3N4) is a compound with high nitrogen content, graphite-like structure, and is both affordable and stable, which can be prepared by thermally condensing a series of nitrogen-containing materials at temperatures between 550 and 600 °C [16]. Its rich nitrogen content leads to the production of numerous nitrogen-containing small molecules during degradation, which can be incorporated into the material’s framework as nitrogen dopants while also serving as pore-forming agents [13]. As a nitrogen source, g-C3N4 can also act as a porogen, eliminating the need for subsequent template removal. Compared to pure g-C3N4, N-doped carbon materials prepared using it as a precursor and template typically exhibit higher specific surface area and better conductivity, which are expected to expose more active sites and promote electron transfer [17].
This study prepared HA-based carbon materials using HA as a carbon source and graphite-like carbon nitride (g-C3N4) as a nitrogen source. It investigated the activation of PMS for the degradation of phenolic wastewater and explored the mechanisms involved in this process. The removal efficiency of phenol was assessed to evaluate the activation performance of the materials. The study examined the effects of the amount of nitrogen-doped HA-based materials, the amount of oxidant (PMS), the initial concentration of phenol, the initial pH of the pollutant solution, inorganic anions, and natural organic matter on the reaction. It also evaluated the stability and reusability of the nitrogen-doped HA-based materials. Through quenching experiments and electron spin resonance (ESR) detection, the reactive species in the material-activated PMS system were analyzed. The structural changes of the nitrogen-doped HA-based materials before and after the reaction were investigated to explore their active sites, revealing the mechanisms by which nitrogen-doped HA-based materials activate PMS and speculating on the phenol degradation pathway.

2. Results and Discussion

2.1. Characterization of Nitrogen-Doped HA-Based Carbon Materials

The FTIR analysis results of NC-800 are shown in Figure 1a. The infrared spectrum of NC-800 does not exhibit characteristic peak around 809 cm−1 for heptazine rings, nor around 1200–1700 cm−1 for C-N bonds in C6N7 rings, indicating that using g-C3N4 as a template is feasible. Nitrogen adsorption–desorption curves were used to analyze the specific surface area, pore size distribution, and pore volume of NC-700, NC-800, and NC-900. As shown in Figure 1b, all three exhibit type II isotherms with H3-type hysteresis loops, characteristic of macroporous solids with the presence of slit-like mesopores. The increase in specific surface area from NC-700 to NC-800 possibly results from an initial structural shrinkage during carbonization, which led to the formation of some pore constrictions. However, when the temperature reached 900 °C, the specific surface area and total pore volume of NC-900 decreased, likely due to the densification of the pore walls at higher carbonization temperatures, a process that eliminated these constrictions. The pore size distribution in Figure 1c reveals similar distributions among samples, uniformly spanning 2–30 nm, with NC-800 also showing micropores below 2 nm. The specific surface area, total pore volume, and pore size distribution of the three catalysts are presented in Table 1. As the carbonization temperature increases from 700 °C to 800 °C, the complete decomposition of the g-C3N4 template and the further shrinkage of the carbon framework, combined with graphitization, lead to the collapse of some mesopores or their transformation into smaller pores (including micropores). Due to the collapse of some larger pores, the total pore volume may only increase slightly or remain relatively stable. However, when the temperature reached 900 °C, the total pore volume of NC-900 decreased due to the collapse of some pore channels and carbon framework at higher temperatures.
The XRD patterns of NC-700, NC-800, and NC-900 are shown in Figure 1d. The precursor g-C3N4 shows a characteristic peak around 27.4°, corresponding to the (002) interlayer stacking peak of graphitic-like materials [18,19]. All three materials exhibit broad diffraction peaks around 26° and 43.5°, corresponding to the (002) and (100) planes of carbon, which are associated with the interlayer stacking of graphite-like materials [20]. The absence of sharp peaks and the broad nature of these features indicate the lack of long-range, three-dimensional graphitic ordering in these materials. Additionally, with the increased temperature, the peak shapes of NC-700, NC-800, and NC-900 become sharper, indicating that the degree of ordering in the graphene basal planes of the materials gradually increases with temperature. The Raman spectra are shown in Figure 1e, where NC-700, NC-800, and NC-900 display characteristic peaks at 1340 cm−1 and 1580 cm−1, corresponding to the D band and G band, respectively. The intensity ratio of the D band to the G band (ID/IG) is commonly used to reflect the degree of ordering in the graphene basal planes and defect density in the materials [21]. The ID/IG values for NC-700, NC-800, and NC-900 are 1.32, 0.83, and 0.82, respectively. This indicates that as the temperature increases, degree of ordering in the graphene basal planes of materials also increases. This is attributed to the loss of nitrogen element from the materials at higher temperatures, leading to a reduction in defects and an enhancement in the degree of ordering in the graphene basal planes.
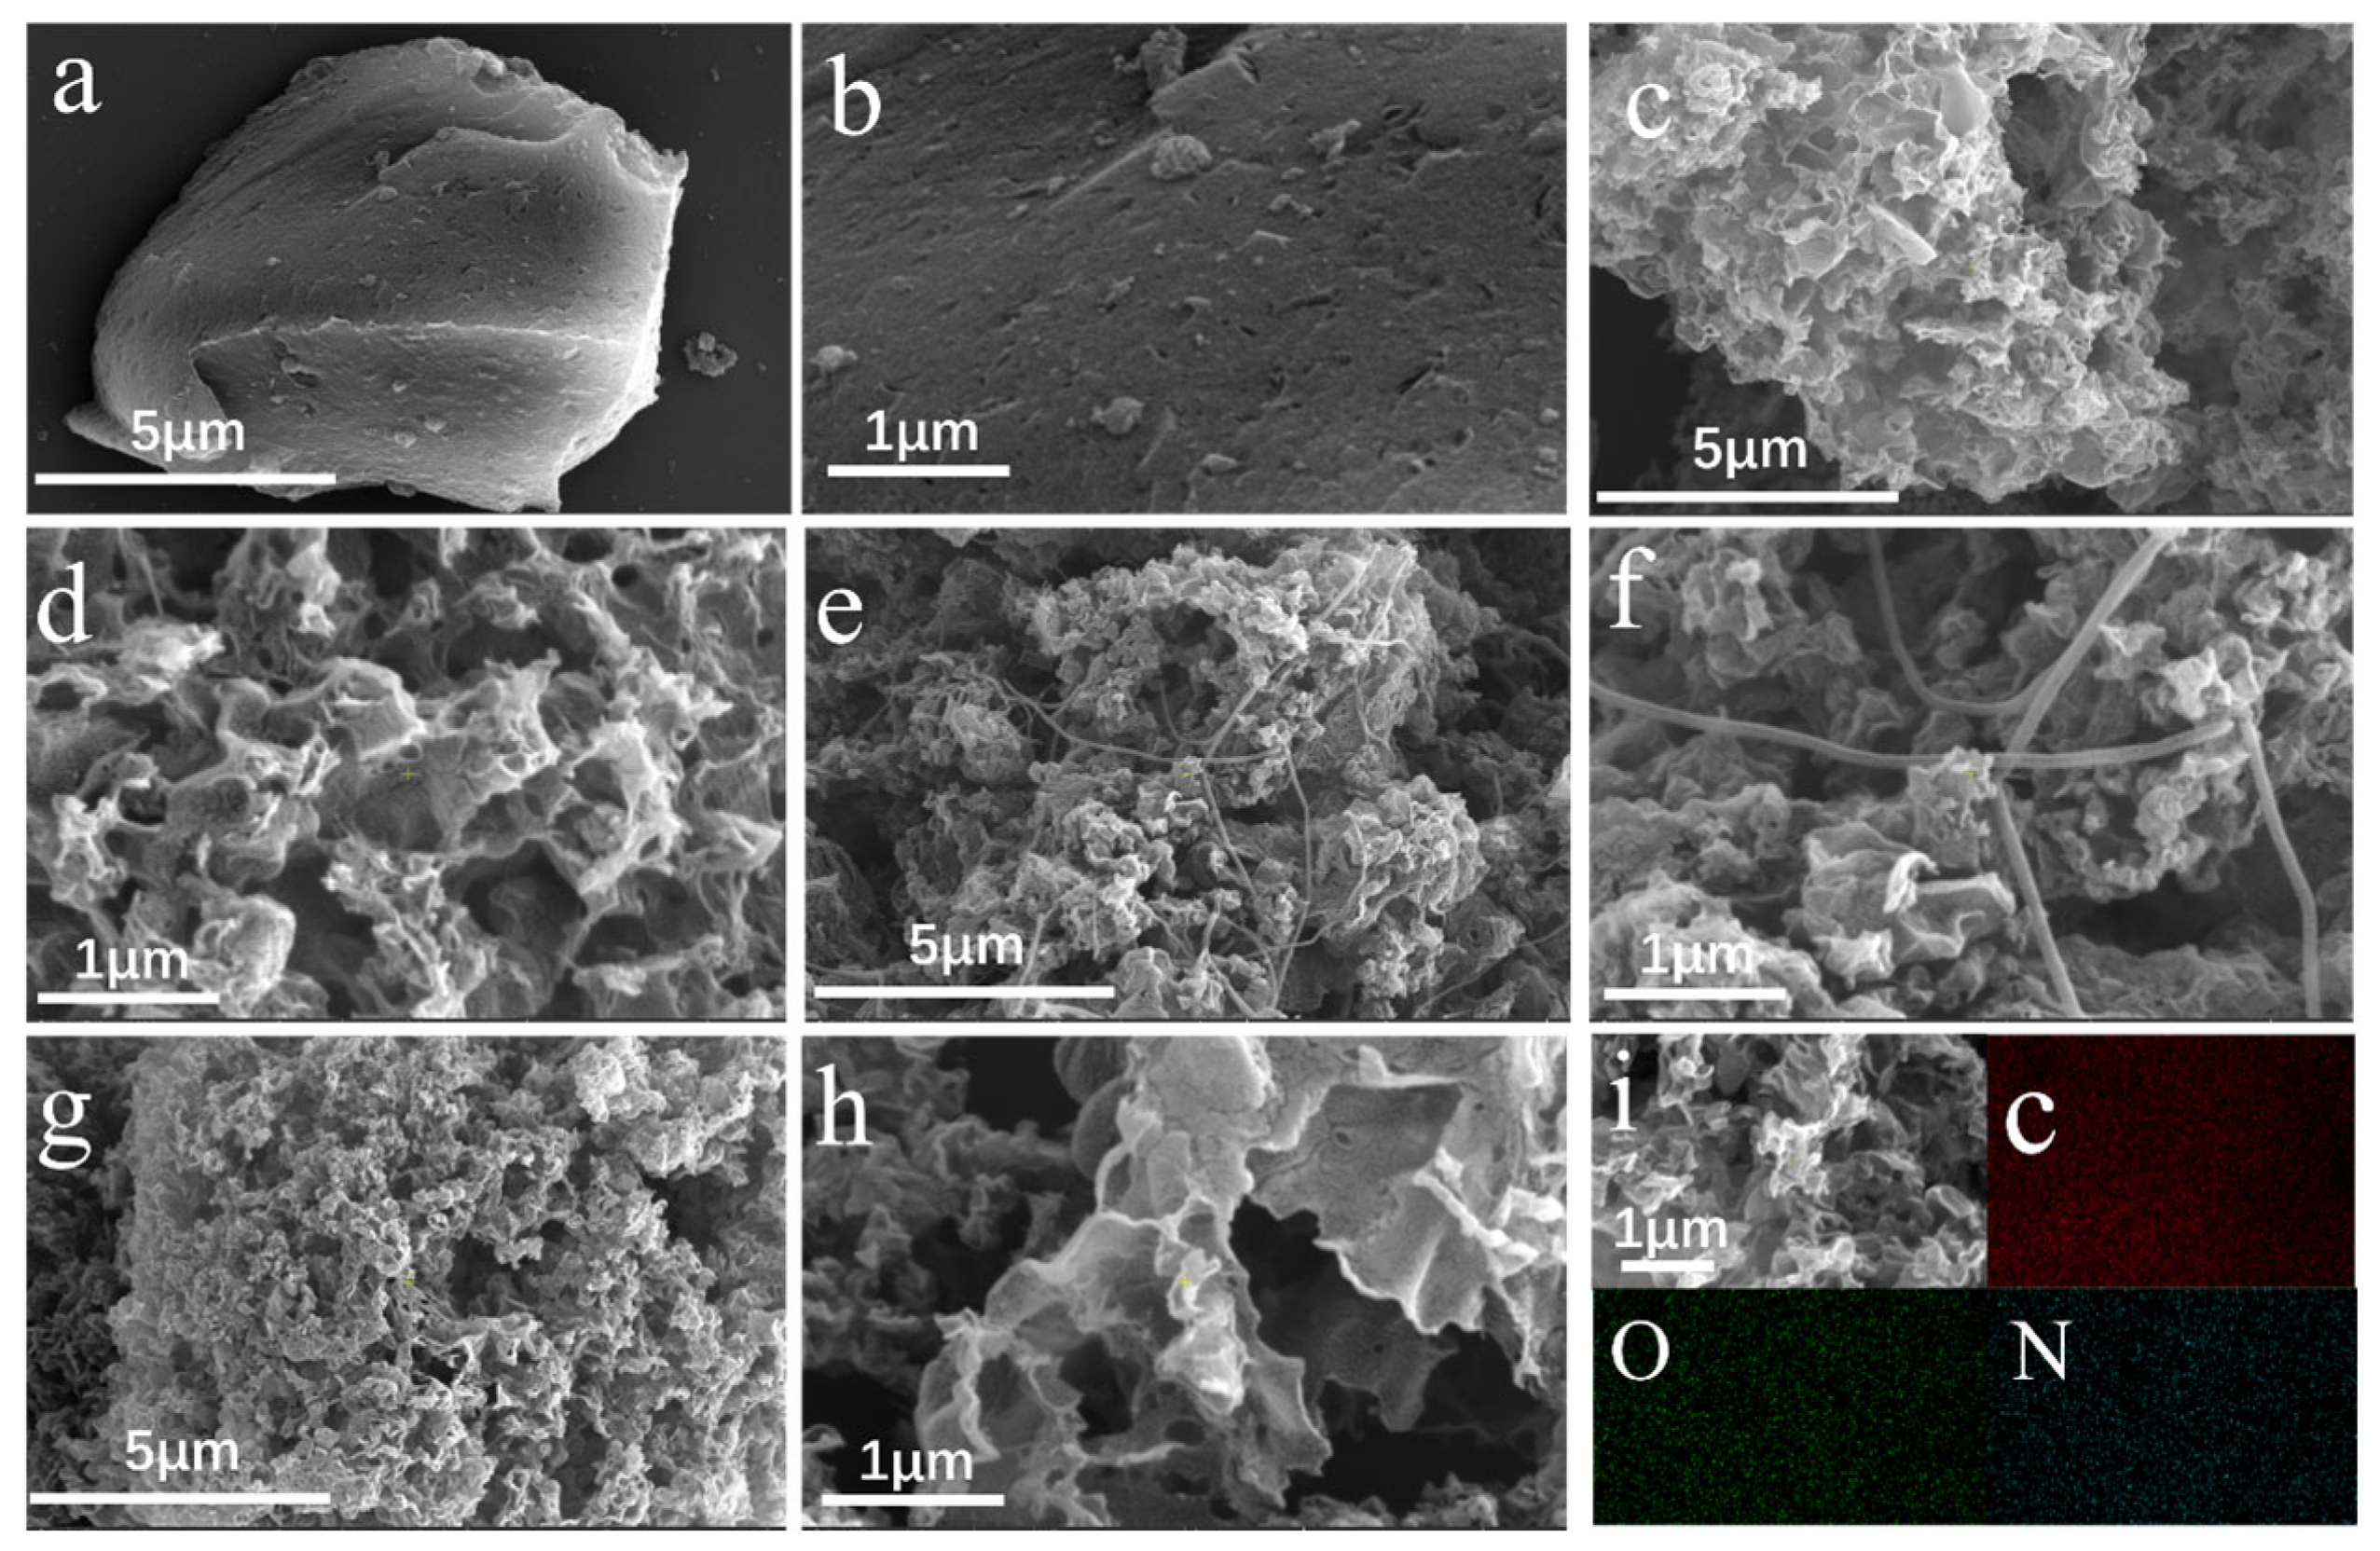
The SEM images of C-800, NC-700, NC-800, and NC-900 are shown in Figure 2. The nitrogen-doped HA-based materials exhibit a wrinkled porous structure, which differs significantly from the morphology of the undoped C-800 material. This indicates that g-C3N4 acts as a template, facilitating further delamination of the carbon layers and transforming the morphology into a wrinkled, sheet-like porous structure. Such morphology increases the contact area between reactants and catalysts, promoting the diffusion of pollutants. Unlike other temperatures, NC-800 displays tubular structures of approximately 80–100 nm on its surface, presenting an overall “bridge-like” three-dimensional interwoven structure. This may be due to the presence of trace elements such as iron and potassium in HA, which catalyze the formation of carbon nanotube-like materials through the high-temperature pyrolysis of HA with g-C3N4 [22]. The EDS results for NC-800 are shown in Figure 2i, which indicate that C, N, and O elements are distributed throughout the carbon material. It is worth noting that the nitrogen content on the tubular structure is significantly higher than the average nitrogen content in the material, up to 17.58%.
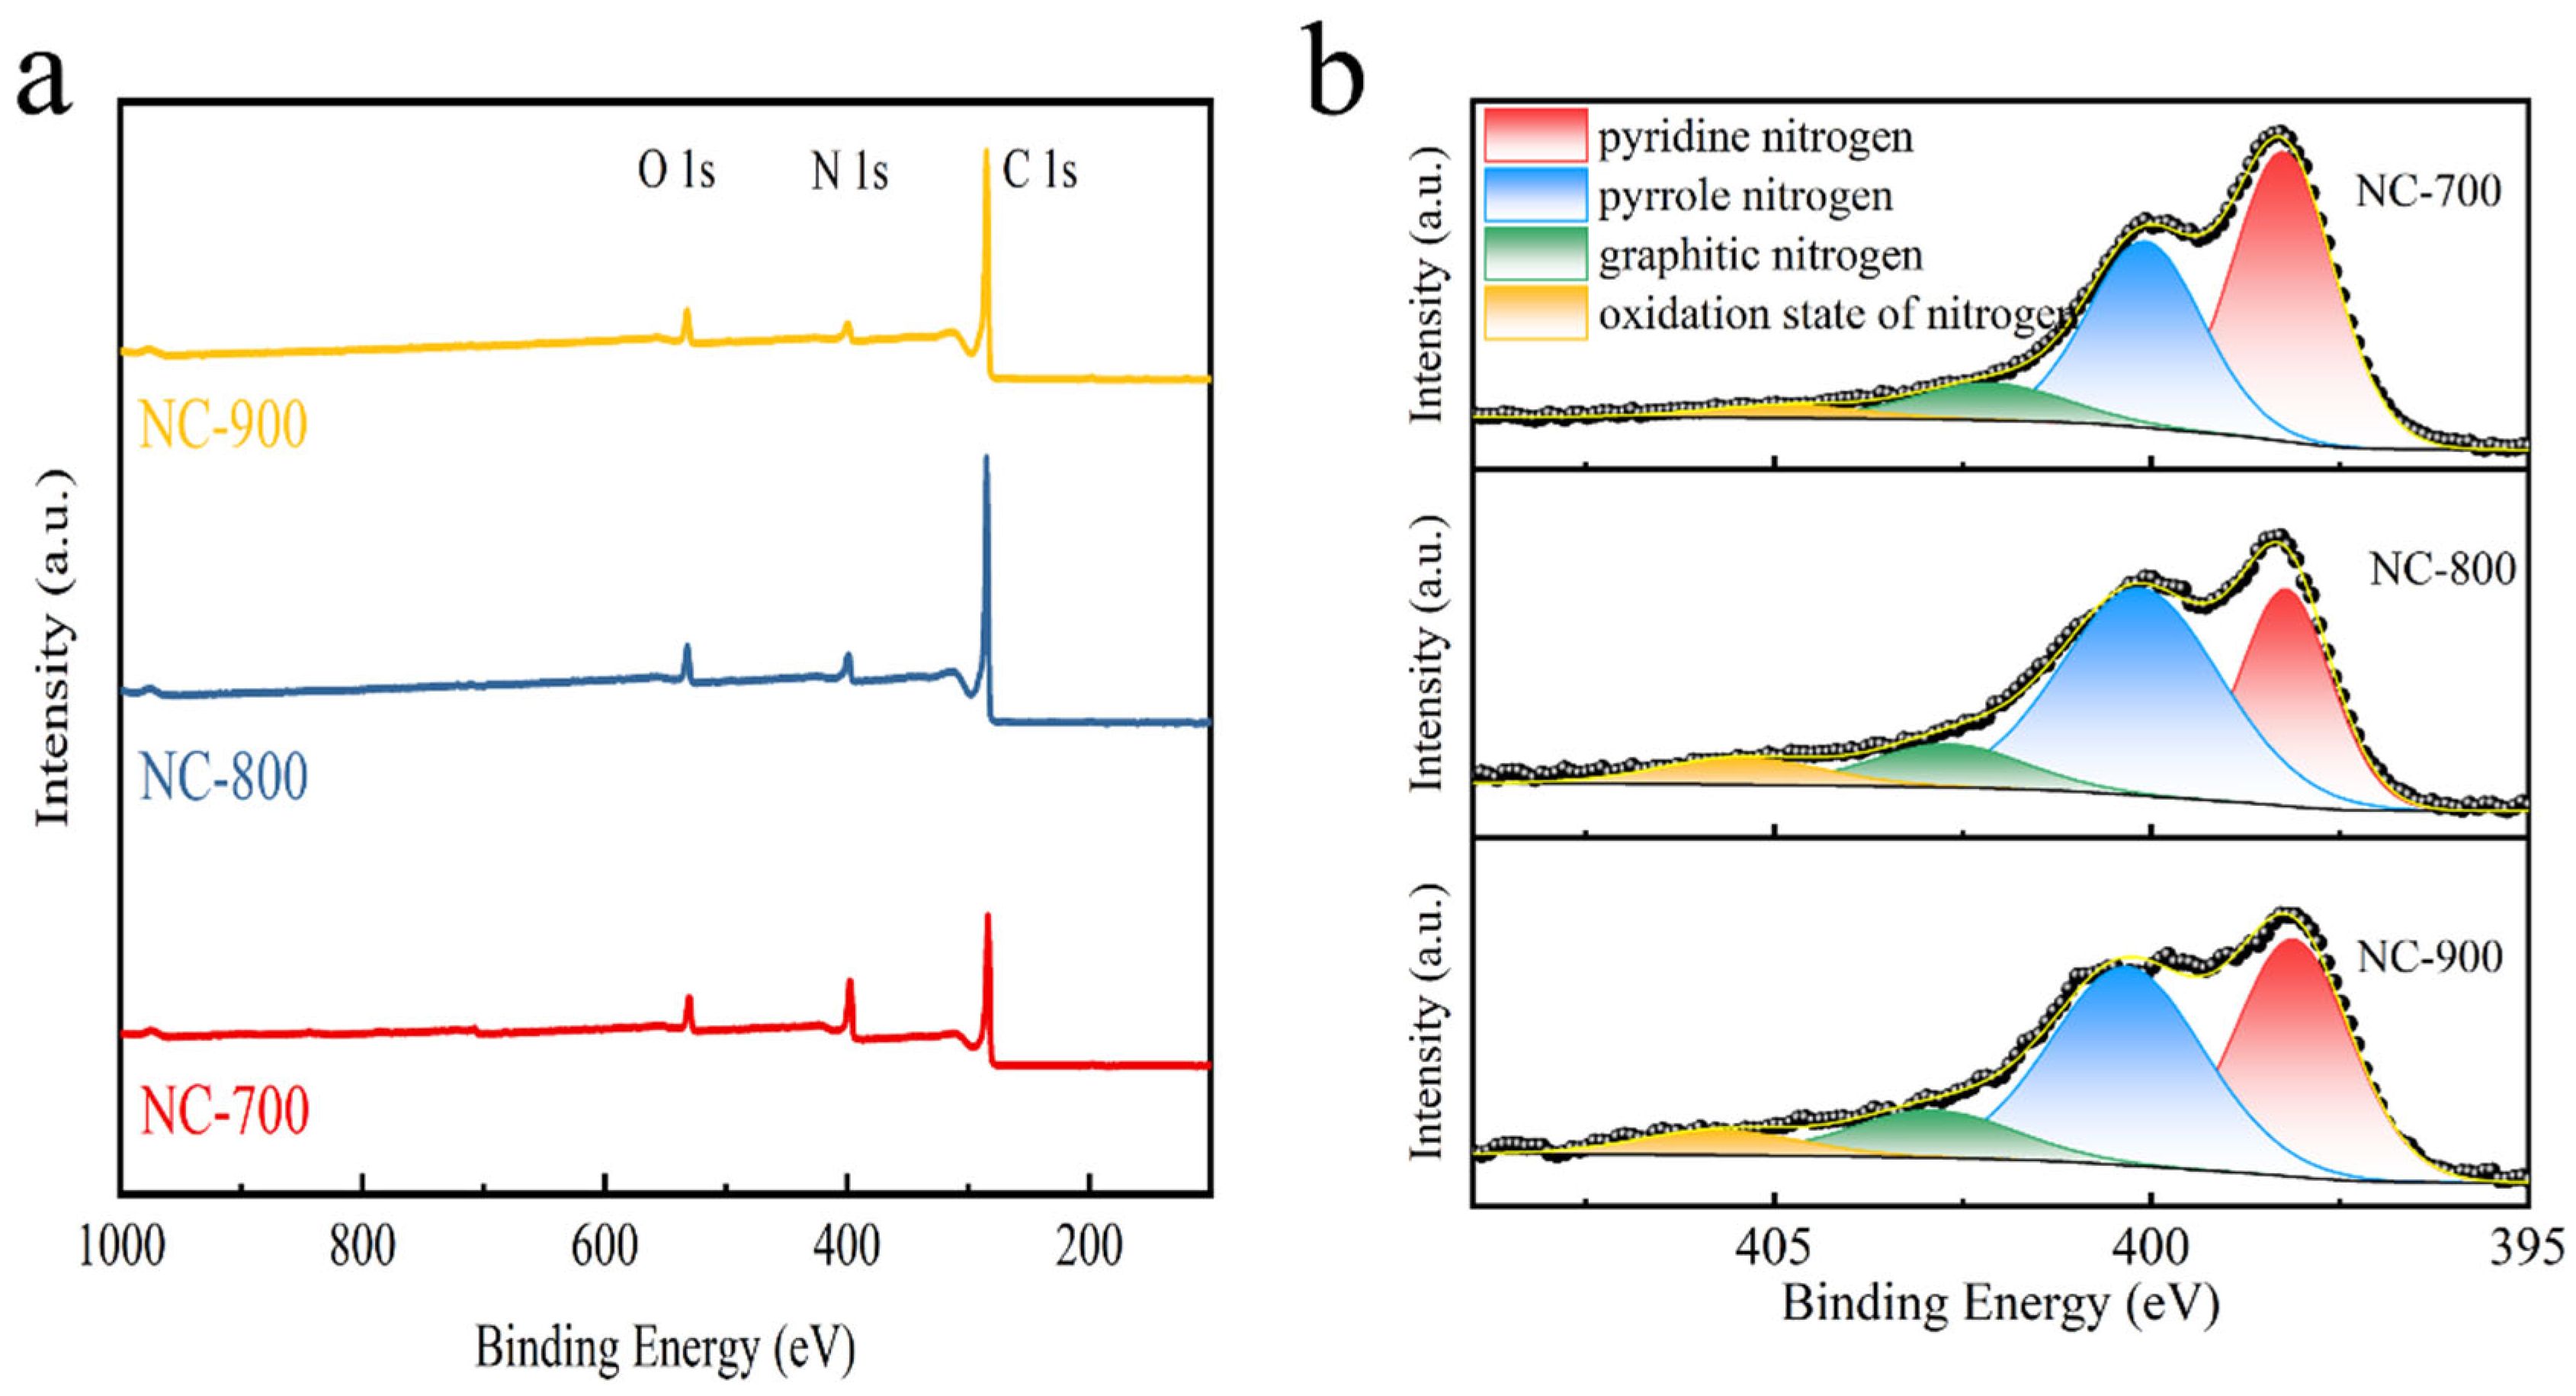
Figure 3a shows the XPS spectrum of the nitrogen-doped HA-based carbon materials, indicating successful doping of nitrogen. As the carbonization temperature increases from 700 °C to 900 °C, due to the significant loss of nitrogen species at high temperatures, the relative content of carbon increases accordingly (Table 2). This is due to the instability of C-N bonds at high temperatures, which leads to the loss of nitrogen. This result is consistent with the analysis from the Raman spectra.
As shown in Figure 3b, the N1s spectrum of catalysts can be divided into pyridinic nitrogen, pyrrolic nitrogen, graphitic nitrogen, and oxidized nitrogen, with binding energies of 397.8, 399.4, 400.7, and 404.6 eV, respectively [13,23]. Due to the differences in carbonization temperature, the relative contents of the four nitrogen species also vary (Table 3). Among them, NC-700 has the highest relative content of pyridinic nitrogen, while NC-800 and NC-900 exhibit the highest relative content of pyrrolic nitrogen. The critical role of the nitrogen species morphology rather than the total nitrogen content in PMS activation.

2.2. Performance Evaluation of Nitrogen-Doped HA-Based Carbon Materials Activated PMS

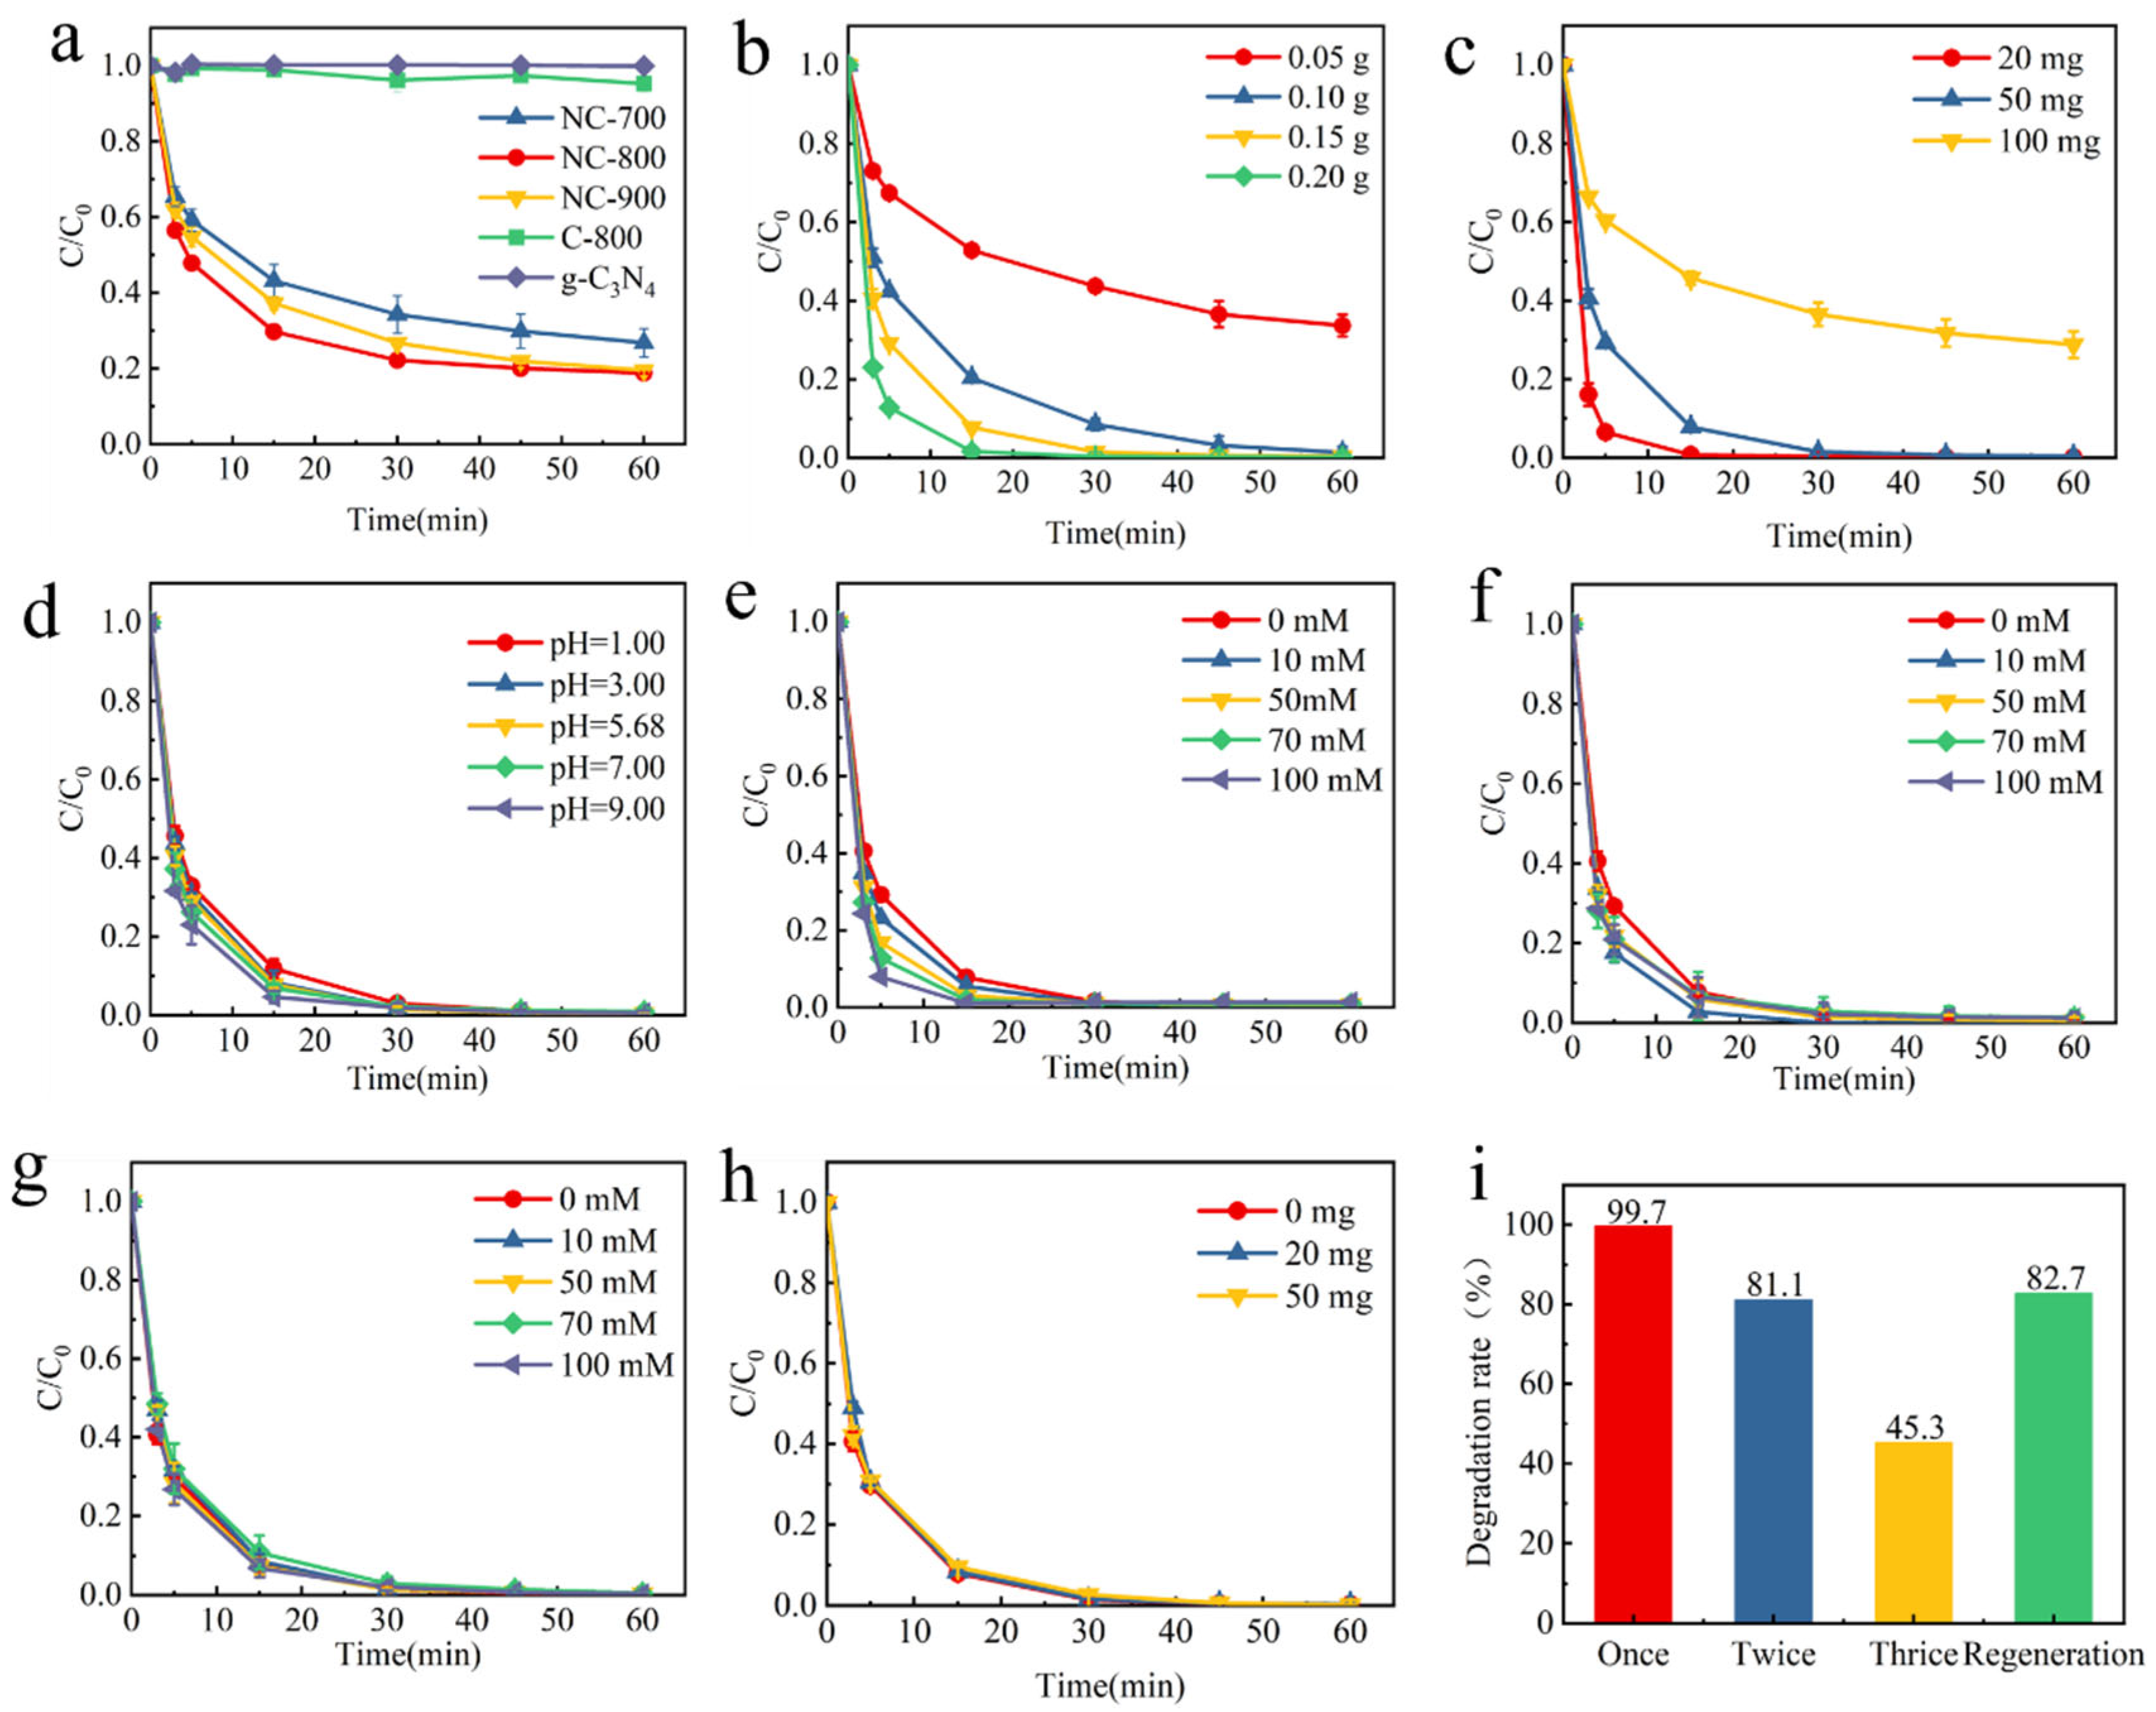
The results of nitrogen-doped HA-based carbon materials activating PMS for the degradation of phenol are shown in Figure 4a. The removal rates of phenol for g-C3N4 and C-800 are 0.27% and 3.31%, respectively, while the removal rates for NC-700, NC-800, and NC-900 are 73.22%, 81.16%, and 80.45%, respectively. This indicates that the doping of nitrogen significantly enhances the ability of the nitrogen-doped HA-based carbon materials to activate PMS for phenol removal. Although NC-700 has the highest nitrogen content, its reaction rate (0.0235 min−1) and degradation rate are lower than those of NC-800 and NC-900 (Figure S3a). The forms of nitrogen present in the nitrogen-doped HA-based carbon materials are also important factors affecting PMS activation.
The effect of different PMS concentrations on phenol degradation is shown in Figure S2b. As the PMS concentration increases, the system generates more reactive species, which enhances the removal rate of phenol. However, excessive PMS may lead to a self-quenching effect, which interferes with the generation of reactive species, thereby preventing further improvement in the degradation of organic pollutants. In subsequent experiments [24,25], the PMS dosage was fixed at 1.5 mmol/L.
The results of phenol degradation with varying amounts of NC-800 are shown in Figure 4b. When the dosage of NC-800 increases from 0.05 to 0.20 g/L, the phenol degradation rate in the solution rises from 66.28% to 99.79%, and the reaction rate constant increases from 0.0186 to 0.1544 min−1 (Figure S3b). A higher dosage of NC-800 provides more reactive sites, accelerating PMS activation and generating more active species, thereby improving the phenol degradation rate. Even at lower dosages of NC-800, good phenol removal efficiency is maintained, indicating that NC-800 has excellent activation performance. Considering the economic aspect of using higher activator dosages, subsequent experiments will use an NC-800 dosage of 0.15 g/L. In addition, the degradation effect of phenol is positively correlated with the amount of NC-800 added. This may be due to the increased probability of collisions between the activator and organic pollutants in the solution as the amount of activators increases, which accelerates the phenol removal rate. Meanwhile, a higher amount of activator can provide more reactive sites, accelerate the decomposition of PMS and generate more active species in the system, thereby improving the phenol removal rate. As shown in Figure 4c, when the initial phenol concentrations are 20, 50, and 100 mg/L, the phenol degradation rates are 99.88%, 99.62%, and 71.20%, respectively, with corresponding reaction rates of 0.2434, 0.1214, and 0.0216 min−1 (Figure S3c). This indicates that NC-800 has a strong ability to activate PMS and can effectively remove phenol across different concentration ranges.
The effect of the initial pH of the solution on phenol removal is shown in Figure 4d. Within the initial pH range of 1 to 9, phenol can be almost completely degraded, with the degradation rate being nearly unaffected by the initial pH of the solution. This indicates that the NC-800/PMS system is superior to traditional Fenton reactions, exhibiting a better pH adaptability and a stronger resistance to interference. Furthermore, the phenol degradation rate increases with the rise in initial pH. This may be since, in acidic environments, HSO5 easily forms hydrogen bonds with H+, which hinders PMS activation. Additionally, H+ can compete with phenol for adsorption on the active sites of the material, reducing their availability. On the other hand, PMS is more easily activated by alkalis, promoting the reaction and the generation of active species [26]. The degree of phenol mineralization at different initial pH values was also investigated, as shown in Figure S3e, indicating that most of the phenol in the system can be mineralized to CO2 and H2O. Although alkaline conditions accelerate the removal rate of phenol, the degree of mineralization decreases.
The effect of Cl on phenol removal is shown in Figure 4e and Figure S3f. When the Cl concentration increased from 0 to 100 mmol/L, the phenol degradation rate maintained at 99.62% within a 60 min reaction time. This may be attributed to the generation of active chlorine species (Cl2, HClO, ClO) in the system, which promoted phenol degradation [27]. The effect of HCO3 on phenol removal is illustrated in Figure 4f and Figure S3g, where HCO3 also accelerated the phenol removal rate. The promoting effect was most pronounced at an HCO3 concentration of 50 mmol/L, but it diminished as the ion concentration increased further. This could be because the addition of HCO3 makes the solution alkaline, leading to the activation of PMS. However, as the concentration of HCO3 increased further, it could react with •OH and SO4•− to form inert CO3•−, which reduced the reaction rate. The reaction equations are shown in (1) and (2) [28].
SO 4 + HCO 3     SO 4 2 + CO 3 + H +
OH + HCO 3     H 2 O + CO 3
The effect of SO42− on phenol removal is shown in Figure 4g and Figure S3h. SO42− has no significant impact on the degradation of phenol in the NC-800/PMS system, likely because the active species in the system do not react with SO42−. In summary, the NC-800/PMS system demonstrates strong resistance to interference when degrading organic pollutants in wastewater. The degradation rate of pollutants is largely unaffected in the presence of high concentrations of Cl, HCO3, and SO42− ions, and no other disinfection byproducts are generated, as shown in Figure 4h. After adding different concentrations of HA, the removal rate of phenol decreased during the first 30 min, but at 60 min, the degradation rate was greater than 99%. This may be due to competition between HA and other organic pollutants in the solution, consuming a large amount of active species and leading to a reduction in the initial phenol degradation rate [29].
The stability of NC-800 is shown in Figure 4i. After regeneration, the ability of NC-800 to activate PMS for phenol degradation was restored, with a degradation rate of 82.74%. This decline in activity may be attributed to the loss of some nitrogen elements during the thermal treatment of the deactivated material, resulting in a reduction in active sites on the material. The phenol removal rate of NC-800 gradually decreases during repeated use, a phenomenon consistent with conclusions in other studies. For example, in the biochar/PMS system, the degradation rate of bisphenol A dropped from 100% to 62% after the third use [30]. This may be due to the loss of active sites on the material, structural damage, or the surface of the material being covered by intermediate products from phenol degradation, which prevents further contact between the material and PMS.

2.3. The Mechanism of NC-800 Activation of PMS

2.3.1. Detection of Active Substances

The results of the quenching experiments for the NC-800/PMS system are shown in Figure 5b. Without the addition of quenchers, the reaction rate constant for phenol removal in the NC-800/PMS system was 0.1214 min−1. After adding methanol, the removal rate of phenol slightly decreased, with the reaction rate constant dropping to 0.1012 min−1. When tert-butanol was added in the same proportion, the reaction rate constant changed to 0.1053 min−1. The addition of both quenchers slightly inhibited the removal rate of phenol, indicating that the NC-800/PMS system may contain •OH and SO4•−. However, the inhibitory effects of both quenchers were not significant, suggesting the presence of other active species or reaction pathways in the system. When para-benzoquinone (P-BQ) was added to the solution, the phenol degradation rate decreased to 91.30% after 60 min, with the reaction rate constant dropping to 0.0576 min−1. These quenching experiment results indicate that O2•− is present in the NC-800/PMS system. Additionally, when furfural alcohol was added to the solution, the phenol degradation rate fell to 60.50% after 60 min, with the reaction rate constant dropping to 0.0238 min−1. Compared to the other three quenchers, furfural alcohol showed the most pronounced inhibitory effect. From these quenching experiment results, it can be inferred that 1O2 is present in the NC-800/PMS system and plays a role. Relevant studies have shown that furfural alcohol reacts with PMS, and 10 mmol/L FFA consumed about 33% of 1 mmol/L PMS within 30 min [31]. The addition of a large amount of furfural alcohol consumes PMS in the solution, leading to a decrease in both the phenol removal rate and removal efficiency.
The ESR detection results are shown in Figure 5c. Characteristic peaks for DMPO-OH in a 1:2:2:1 intensity ratio indicated the presence of •OH radicals in the system. The signal intensity of DMPO-SO4 is relatively low compared to that of DMPO-OH, indicating that SO4 does not exist in the system. As time progresses, the intensity of the DMPO-OH characteristic peak increases, suggesting the accumulation of •OH. In Figure 5d, a characteristic signal peak for DMPO-O2 is observed, indicating the presence of O2 in the system. Signal enhancement indicates that this reactive species (superoxide radical) is continuously generated and accumulated during the early stages of the reaction. As shown in Figure 5e, when PMS is present alone, a characteristic peak for TEMP-1O2 is observed, which results from the self-decomposition of PMS generating a small amount of 1O2 [32]. Compared to PMS alone, the intensity of the TEMP-1O2 characteristic peak in the NC-800/PMS system does not change significantly after 2 min of reaction time. However, when the reaction time is extended to 10 min, the TEMP-1O2 characteristic peak disappears. This may be due to the transformation of PMS into other substances, resulting in little 1O2 in the system. Signal changes suggest that this reactive species (singlet oxygen) is consumed during the reaction process, or its generation rate is lower than its consumption rate, leading to a decrease in its steady-state concentration over time. This dynamic change confirms that these reactive species actively participate in the reaction. Both quenching experiments and EPR tests confirmed the presence of 1O2, but its role in the system is secondary compared to the free radicals (•OH, O2) and the direct electron transfer mechanism. ESR results show that the 1O2 signal weakens over time. Combined with literature reports suggesting that FFA may consume PMS, we conclude that 1O2 is present in the system, but it is not the primary active species for the degradation of phenolic pollutants.
To further investigate whether there are other reaction pathways in the NC-800/PMS system, the consumption of PMS in solution under different conditions was examined (Figure S2d). To determine whether an electron transfer mechanism exists in the system, electrochemical measurement was conducted on the NC-800/PMS system. The open-circuit potential versus time curve is shown in Figure 5f. After adding PMS to the electrolyte, the potential raised sharply and then gradually stabilized, indicating the formation of a metastable NC-800-PMS* complex [33]. Following the addition of phenol, the potential gradually decreased and stabilized. This occurs because the equilibrium potential of the NC-800-PMS* complex exceeds the oxidation potential of phenol, resulting in electron transfer that promotes the degradation of phenol. This experimental observation confirms the presence of an electron transfer pathway in the process of NC-800 activating PMS to degrade phenol. Compared to radical pathways, the electron transfer-based non-radical pathway exhibits stronger resistance to environmental interference. This explains why the degradation rate of phenol in the NC-800/PMS system remains unaffected in the presence of high concentrations of inorganic salt ions and natural organic matter.

2.3.2. The Changes in the Surface Structure of NC-800 Before and After the Reaction

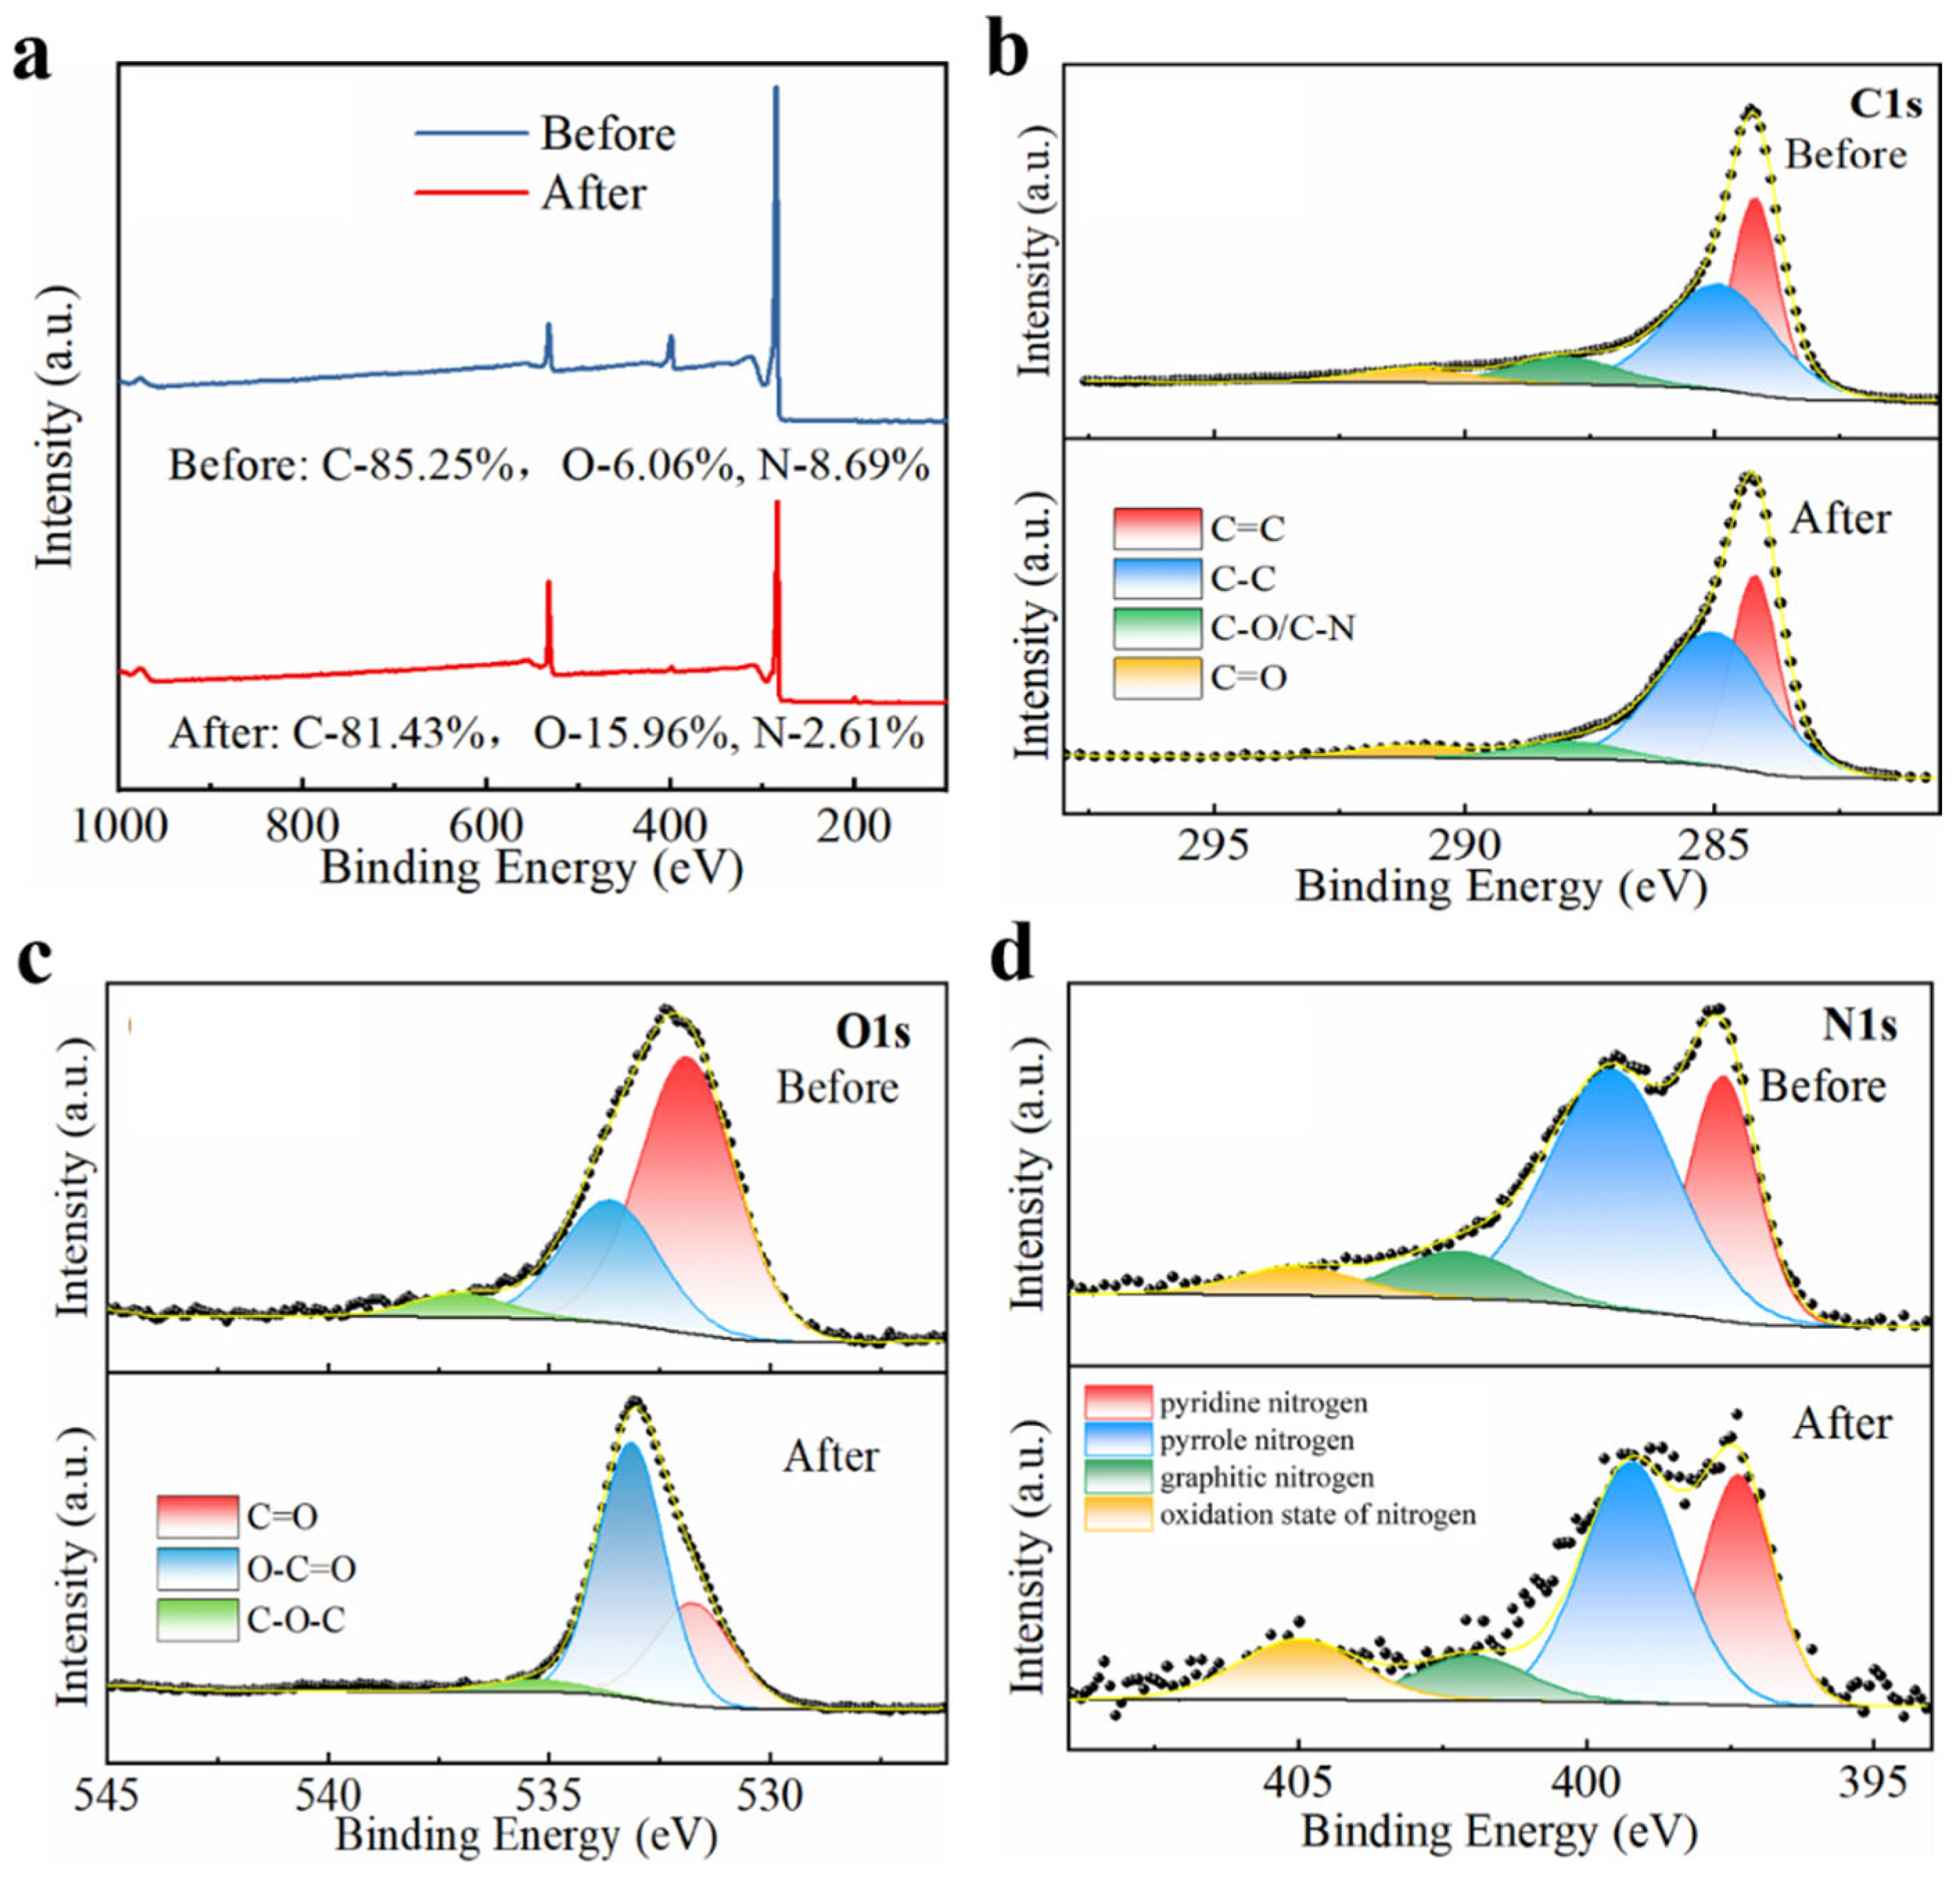
The XPS analysis results of NC-800 before and after the reaction are shown in Figure 6. After reaction, the nitrogen content in NC-800 significantly decreased, while the oxygen content increased, indicating that oxidation occurred on the surface of NC-800 during reaction. The possible reasons for this result are as follows: (1) NC-800 acts as an electron donor, transferring surface electrons to PMS, leading to its own oxidation. (2) During the activation, PMS generates many strong oxidizing species that attack the surface of NC-800, resulting in oxidation.
As shown in Figure 6b, the high-resolution C1s spectrum can be fitted to four characteristic peaks [9]: C=C (284.0 eV), C-C (284.6 eV), C-O/C-N (287.6 eV), and C=O (290.6 eV). After the reaction, the relative content of C=C, C=O, and C-O/C-N in NC-800 decreased, while the relative content of C-C increased, indicating that C=C, C-O/C-N, and C=O acted as active sites during the reaction. Compared to C-C, C=C exhibits higher reactivity due to its freely flowing π electrons [34].
As shown in Figure 6c, the high-resolution O1s spectrum can be fitted to three characteristic peaks [35]: C=O (531.3 eV), O-C=O (532.1 eV), and C-O-C (533.1 eV). After the reaction, the relative content of C=O and C-O-C decreased significantly, while the relative content of O-C=O increased, indicating that C=O and C-O-C participated as active sites during the reaction. C=O has lone pair electrons and a higher electron density nearby, which can provide electrons to PMS to generate •OH and O2•−, while itself being oxidized to O-C=O [31,36,37]. The C=O (carbonyl) functional group is an electron-rich site that can act as an electron donor to activate PMS in the reaction. During this process, the C=O group itself is oxidized and converted to a higher oxidation state—O-C=O (carboxyl/ester group). Therefore, the decrease in the relative content of C=O and the increase in the relative content of O-C=O after the reaction confirm that C=O is an active site involved in PMS activation.
As shown in Figure 6d, the high-resolution N1s spectrum can be fitted to four characteristic peaks [13,38]: pyridinic nitrogen, pyrrolic nitrogen, graphitic nitrogen, and oxidized nitrogen. After the reaction, the relative content of pyrrolic nitrogen and graphitic nitrogen decreased, while the relative content of pyridinic nitrogen and oxidized nitrogen increased. Graphitic nitrogen can activate the adjacent carbon atoms, which then undergo electron transfer to form NC-800-PMS*. At the same time, graphitic nitrogen can induce the O2•− [31]. During the reaction, both graphitic nitrogen and pyrrole nitrogen can act as active sites, with the nitrogen atoms serving as electron donors to activate PMS and generate •OH.

2.3.3. The Potential Activation Mechanisms of the NC-800/PMS System

Based on the above discussion, a possible reaction mechanism for the degradation of phenol in the NC-800-activated PMS system is proposed: (1) The self-decomposition of PMS produces a small amount of 1O2 (Equation (3)) [32]. (2) PMS is adsorbed onto the active sites of NC-800, where the surface sp2-hybridized carbon, graphite nitrogen, pyrrole nitrogen, and electron-rich regions such as C=O on NC-800 act as electron donors, transferring electrons to PMS and inducing the cleavage of the O-O bond to generate •OH [39] (Equation (4)) and O2•− [36]. The combined action of •OH and O2•− forms a free radical pathway to degrade organic pollutants [40], as shown in Equations (5) and (6). (3) PMS is adsorbed onto the surface of NC-800 to form a metastable NC-800-PMS* complex. When its oxidation potential exceeds that of phenol, it reacts with phenol to promote degradation through a non-radical pathway, as shown in Equations (7) and (8) [39]. Throughout this process, the radical and non-radical pathways are integrated.
SO 5 2 +   HSO 5         HSO 4   SO 4   2 + 1 O 2
e - +   HSO 5     SO 4 2 + OH
Phenol   + OH   H 2 O + C O 2
Phenol   + O 2   H 2 O + C O 2
PMS   + NC-800   NC-800-PMS*
Phenol   + surface   activated   PMS     intermediates H 2 O + C O 2

2.4. The Possible Pathways for Phenol Degradation

To analyze the intermediates in the phenol degradation process, GC-MS was used to identify the intermediates during the reaction. The total ion chromatogram at a reaction time of 10 min is shown in Figure S4. The main intermediates (Table S1) include catechol, p-benzoquinone, and small molecular acids such as butyric acid. The toxicity of these intermediates may be comparable to or even more toxic than the parent compound. Therefore, these byproducts must be removed before the treated water is discharged into the environment [41,42]. After the phenol in the solution is oxidized, it first produces hydroxylated products like catechol and hydroquinone, which are then further oxidized to quinone compounds. Subsequently, under the action of reactive species, these are further oxidized to small molecular carboxylic acids, which are ultimately mineralized to CO2 and H2O. The studies examined the mineralization extent of phenol in the NC-800/PMS system at different initial pH values (Figure S5). Within 60 min at pH 5.65, the TOC degradation rate was 81.31%, indicating that most phenol was degraded to CO2 and H2O, leaving very little residual material. Based on this analysis, a proposed degradation pathway for phenol is illustrated in Figure 7.

2.5. Material Comparison

To better evaluate the performance of NC-800 in activating PMS for the degradation of organic pollutants, a comparison was made between NC-800 and metal and non-metal catalysts reported in the literature [43,44,45,46,47,48] regarding their performance in activating PMS for phenol degradation. As shown in Table 4, the performance of NC-800 in activating PMS for phenol degradation is comparable to that of the metal catalysts reported in the literature, while it features simpler preparation process and stronger interference resistance. Furthermore, NC-800 achieves efficient degradation of phenol even at high concentrations of inorganic salt ions. Compared to other non-metal catalysts, the NC-800/PMS system can achieve the same phenol degradation performance with a lower dosage of catalyst.

3. Experimental Sections

3.1. Materials and Reagents

Humic acid (HA), sodium bicarbonate (NaHCO3), potassium chloride (KCl), urea, furfuryl alcohol (FFA), p-benzoquinone (p-BQ), ammonia water (NH3·H2O), and 2,2′-azinobis (3-ethylbenzothiazole-6-sulfonic acid) diammonium salt (ABTS) were purchased from Shanghai Macklin Biochemical Technology Co., Ltd. (Shanghai, China). Phenol, sodium hydroxide (NaOH), hydrochloric acid (HCl), and sulfuric acid (H2SO4) were sourced from Sinopharm Group Chemical Reagent Co., Ltd. (Shanghai, China). Potassium peroxymonosulfate (KHSO5), hydrogen peroxide (H2O2), anhydrous sodium sulfate (Na2SO4), and tert-butanol (TBA) were obtained from Shanghai Aladdin Biochemical Technology Co., Ltd. (Shanghai, China). Methanol (MeOH) was purchased from TEDIA (Fairfield, OH, USA).

3.2. Preparation and Structural Characterization of Nitrogen-Doped HA-Based Carbon Materials

A light-yellow sample of g-C3N4 was obtained by heating a certain amount of urea in a muffle furnace at a rate of 5 °C/min to 550 °C and maintaining that temperature for 4 h.
HA and g-C3N4 were mixed in a mass ratio of 1:2 in 40 mL of deionized water. Then, an appropriate amount of ammonia water was added and stirred thoroughly. The resulting solution evaporated to dryness, and the obtained mixture was placed in a tube furnace. Under a nitrogen atmosphere, the temperature was raised to 300 °C and maintained for 1 h, followed by heating to 700, 800, and 900 °C for 1 h, respectively. The resulting products were washed with 1 mol/L hydrochloric acid and water until neutral and then dried to obtain three black powdered nitrogen-doped carbon materials. The nitrogen-doped carbon materials prepared at different temperatures were named NC-700, NC-800, and NC-900, respectively. An undoped g-C3N4 material was prepared at 800 °C using the same procedure, referred to as C-800.

3.3. Material Performance Evaluation and Methods

This experiment uses simulated wastewater of phenol for testing. A phenol solution of specified concentration was prepared, and a measured amount of PMS and nitrogen-doped HA-based materials were added sequentially. Samples were taken at set intervals, filtered through a 0.45 μm microporous filter, and analyzed. The pH of the solution was adjusted using NaOH and H2SO4, with no buffering solution added during the process. After the reaction, the solid was collected and dried in an oven, and the procedure was repeated four times to test the reusability of nitrogen-doped HA-based materials. The reused nitrogen-doped HA-based materials were then calcined in a tube furnace at 700 °C under a nitrogen atmosphere for 1 h to obtain regenerated materials, followed by testing the regeneration performance using the same procedures.

3.4. Materials Characterization

The crystal structure of the materials was tested using a Rigaku SmartLab SE X-ray diffractometer (XRD, Rigaku, Tokyo, Japan). Functional groups in the materials were analyzed using a Bruker VERTEX 80v Fourier Transform Infrared Spectrometer, with a spectral range of 400 to 4000 cm−1. Nitrogen adsorption–desorption isotherms were measured using a physical adsorption instrument from Quantachrome (Boynton Beach, FL, USA). The surface morphology of the materials was examined using a Regulus 8100 (Hitachi, Tokyo, Japan). The surface elemental composition and chemical states of the materials were analyzed using a K-Alpha X-ray photoelectron spectrometer (XPS, Thermo Scientific, Waltham, MA, USA). The degree of graphitization and defect level of the materials were assessed using an inVia Raman spectrometer (Renishaw, London, UK). Elemental analysis of the samples was performed using an elemental analyzer (Elementar, Rhine Main, Germany). The concentration of phenol pollutants was determined by high-performance liquid chromatography (HPLC). Total organic carbon (TOC) (Shimadzu, Tokyo, Japan) concentrations in the reaction system were measured using a total organic carbon analyzer. The intermediates in the degradation of organic pollutants were identified using gas chromatography-mass spectrometry (GC-MS) (Agilent, Santa Clara, CA, USA).
The concentration of PMS was measured using the Co2+/PMS-ABTS colorimetric spectrophotometric method. The specific procedure is as follows: prepare 20 mmol/L Co2+ solution and 20 mmol/L ABTS solution for use. At regular intervals, take 0.1 mL of the sample from the reaction (filtered through a 0.45 μm filter) and add it to a centrifuge tube containing 5 mL of ultrapure water. Then, immediately add 0.4 mL of the prepared ABTS solution and 0.2 mL of the Co2+ solution, and shake well. After standing for 10 min, the green ABTS radical species will form. The maximum absorption wavelength was measured at 735 nm using a UV-Vis spectrophotometer (Unico Instrument Co., Ltd., Shanghai, China). The absorbance was found to correlate with the PMS concentration according to Beer’s Law. A standard curve was drawn with the PMS concentration as the x-axis and absorbance as the y-axis, as shown in Figure S1. The absorbance of the water sample to be tested was substituted into the standard curve to calculate the remaining PMS concentration in the solution.
The reactive species in the system were determined using an electron spin resonance spectrometer (ESR, Bruker EMXplus) (Bruker, Saarbrücken, Germany). DMPO was used as the electron spin trapping agent to detect •OH and SO4 in aqueous solution, and O2 in methanol solution. TEMP was used as the electron spin trapping agent to detect 1O2 in aqueous solution. The specific procedure is as follows: Take 30 μL of the sample, add 30 μL of DMPO (200 mmol/L in deionized water/methanol) or 50 μL of TEMP (100 mmol/L), mix thoroughly, then draw a certain amount of the mixture with a capillary tube, place it in a quartz tube, and insert it into the ESR sample cavity for testing the active species. The instrument parameters are as follows: central field strength 350.0 mT, scanning width 10 mT, scanning time 30 s, microwave energy 6.325 mW, resonance frequency 9.828 GHz, modulation amplitude 0.1 mT, and microwave attenuation 15.0 dB. The types of active species in the system were identified based on the hyperfine coupling constants of the adducts formed with the electron spin trapping agents and the corresponding characteristic peaks.

4. Conclusions

In this study, a novel nitrogen-doped carbon material (NC-800) was synthesized for activating persulfate (PMS) by using HA as a carbon source and g-C3N4, obtained from urea via secondary calcination, as a nitrogen source through high-temperature carbonization. The preparation temperature has a significant impact on the structure and catalytic activity of the catalyst. NC-800 exhibits a larger specific surface area and a higher graphite nitrogen content, which are favorable for PMS activation. The NC-800/PMS system demonstrates excellent phenol degradation performance across a wide pH range (pH 1–9), and certain substances (such as Cl, SO42−, HCO3, and HA) have little effect on the degradation efficiency of phenol. Additionally, the active species in the NC-800/PMS system were detected through ESR analysis and quenching experiments, revealing the generation of three active species: •OH, O2•−, and 1O2. XPS analysis of NC-800 before and after the reaction indicated that both graphite nitrogen and pyrrolic nitrogen served as active sites, with nitrogen atoms acting as electron donors to activate PMS. The variation in the open-circuit potential over time confirmed the existence of an electron transfer pathway during the phenol degradation in NC-800/PMS. In conclusion, the NC-800/PMS system features a free radical pathway involving •OH and O2•−, as well as a non-radical pathway with 1O2 generated by PMS self-decomposition and electron transfer. Both pathways work together to promote the degradation of phenol. This research validates the phenol degradation performance of NC-800 and its practical application prospects, providing new ideas and theoretical guidance for using green carbon catalysts to address micropollutants in wastewater.

Supplementary Materials

The following supporting information can be downloaded at: https://www.mdpi.com/article/10.3390/catal15100968/s1, Figure S1: Standard curve for measuring PMS concentration using colorimetric spectrophotometry. Figure S2: (a) Adsorption effect of NC-Ts on phenol (phenol = 50 mg/L, material dosage = 0.1 g/L, PMS concentration = 0.8 mM, Initial pH = 5.68) (b) Effect of oxidant on phenol removal efficiency (phenol = 50 mg/L, NC-800 dosage = 0.1 g/L, oxidant concentration = 1.5 mM, initial pH = 5.68) (c) Change Curve of NC-800 Surface Zeta Potential with pH (d) Changes in PMS Concentration (phenol = 50 mg/L, NC-800 dosage = 0.15 g/L, PMS concentration = 1.5 mM). Figure S3: (a) First-order reaction kinetics fitting of nc-ts activated pms for phenol removal (phenol = 50 mg/L, material dosage = 0.1 g/L, PMS concentration = 0.8 mM, Initial pH = 5.68), (b) Fitting of first-order reaction kinetics of NC-800 dosage on phenol removal (phenol = 50 mg/L, PMS concentration = 1.5 mM, initial pH = 5.68); (c) First-order reaction kinetics fitting of phenol with different initial concentrations (NC-800 dosage = 0.15 g/L, PMS concentration = 1.5 mM, initial pH = 5.68); (d) First-order reaction kinetics of phenol removal at different initial pH of solution; (e) Phenol mineralization rate at different initial pH of solution Effect of inorganic anions on phenol removal efficiency and first-order reaction kinetics of phenol removal under different conditions (f) Cl−(g) HCO3− (h) SO42− (phenol = 50 mg/L, NC-800 dosage = 0.15 g/L, PMS concentration = 1.5 mM). Figure S4: Total ion chromatogram of intermediate products during phenol removal process. Figure S5 Phenol mineralization rate at different initial pH of solution (phenol = 50 mg/L, NC-800 dosage = 0.15 g/L, PMS concentration = 1.5 mM). Table S1: Main intermediate products of phenol degradation by NC-800/PMS system.

Author Contributions

Q.H.: Conceptualization, methodology, investigation, writing—original review draft, funding acquisition. X.W. (Xuewen Wu): Conceptualization, writing—review and editing, investigation, methodology. P.M.: Methodology, writing—review and editing, investigation. X.W. (Xiaoqi Wu): Conceptualization, investigation. Z.M.: Review and editing, supervision. All authors have read and agreed to the published version of the manuscript.

Funding

This work was supported by the National Key Research and Development Program of China (2021YFC2902604) and funded by the National Natural Science Foundation of China (52374286).

Data Availability Statement

The data generated and analyzed during this study are available from the corresponding author upon reasonable request.

Conflicts of Interest

The authors declare no conflicts of interest.

References

  1. Shi, J.X.; Wan, N.; Li, L.C.; Li, Z.X.; Han, H.J. Review on treatment technologies of coal gasification wastewater in China. J. Clean. Prod. 2022, 333, 130166. [Google Scholar] [CrossRef]
  2. Wang, W.; Han, H.J. Recovery strategies for tackling the impact of phenolic compounds in a UASB reactor treating coal gasification wastewater. Bioresour. Technol. 2012, 103, 95–100. [Google Scholar] [CrossRef]
  3. Yang, L.; Liu, Y.; Zhang, A.; Liu, Z.; Yang, Z.; Li, X.; Li, Z. Construction of aldehyde-based, ester-based hyper-cross-linked polar resin and its selective adsorption mechanism for phenol in coal chemical wastewater. Environ. Res. 2024, 246, 118140. [Google Scholar] [CrossRef] [PubMed]
  4. Duan, X.G.; Sun, H.Q.; Wang, S.B. Metal-Free Carbocatalysis in Advanced Oxidation Reactions. Acc. Chem. Res. 2018, 51, 678–687. [Google Scholar] [CrossRef] [PubMed]
  5. Wang, Y.; Zhang, Z.P.; Yin, Z.L.; Liu, Z.F.; Liu, Y.L.; Yang, Z.; Yang, W.B. Adsorption and catalysis of peroxymonosulfate on carbocatalysts for phenol degradation: The role of pyrrolic-nitrogen. Appl. Catal. B Environ. 2022, 319, 121891. [Google Scholar] [CrossRef]
  6. Sun, H.Q.; Liu, S.Z.; Zhou, G.L.; Ang, H.M.; Tadé, M.O.; Wang, S.B. Reduced Graphene Oxide for Catalytic Oxidation of Aqueous Organic Pollutants. ACS Appl. Mater. Inter. 2012, 4, 5466–5471. [Google Scholar] [CrossRef]
  7. Zhong, S.; Zhou, H.Y.; Zhu, Z.S.; Ren, S.Y.; Vongsvivut, J.; Zhou, P.; Duan, X.G.; Wang, S.B. Overlooked Impacts of Alcohols in Electro-H2O2 and Fenton Chemistry. Environ. Sci. Technol. 2024, 58, 14585–14593. [Google Scholar] [CrossRef]
  8. Duan, X.G.; Sun, H.Q.; Wang, S.B. Comment on “Activation of Persulfate by Graphitized Nanodiamonds for Removal of Organic Compounds”. Environ. Sci. Technol. 2017, 51, 5351–5352. [Google Scholar] [CrossRef]
  9. Indrawirawan, S.; Sun, H.Q.; Duan, X.G.; Wang, S.B. Nanocarbons in different structural dimensions (0-3D) for phenol adsorption and metal-free catalytic oxidation. Appl. Catal. B Environ. 2015, 179, 352–362. [Google Scholar] [CrossRef]
  10. Yang, Y.-j.; Wang, B.; Guo, X.-j.; Zou, C.-w.; Tan, X.-d. Investigating adsorption performance of heavy metals onto humic acid from sludge using Fourier-transform infrared combined with two-dimensional correlation spectroscopy. Environ. Sci. Pollut. Res. 2019, 26, 9842–9850. [Google Scholar] [CrossRef]
  11. Li, Y.; Jia, X.; Li, X.; Liu, P.; Zhang, X.; Guo, M. Study on the potential of sludge-derived humic acid as energy storage material. Waste Manag. 2023, 162, 55–62. [Google Scholar] [CrossRef]
  12. Wang, C.Q.; Jin, R.Y.; He, Z.D.; Qiao, Y.N.; Wang, Y.; Wang, K.; Lu, Y.R.; Wang, X.J.; Liu, D.D. A new water treatment technology for degradation of B[a]A by hydrodynamic cavitation and chlorine dioxide oxidation. Ultrason. Sonochem 2020, 61, 104834. [Google Scholar] [CrossRef]
  13. Yu, H.J.; Shang, L.; Bian, T.; Shi, R.; Waterhouse, G.I.N.; Zhao, Y.F.; Zhou, C.; Wu, L.Z.; Tung, C.H.; Zhang, T.R. Nitrogen-Doped Porous Carbon Nanosheets Templated from g-C3N4 as Metal-Free Electrocatalysts for Efficient Oxygen Reduction Reaction. Adv. Mater. 2016, 28, 5080–5086. [Google Scholar] [CrossRef]
  14. Duan, X.G.; Sun, H.Q.; Wang, Y.X.; Kang, J.; Wang, S.B. N-Doping-Induced Nonradical Reaction on Single-Walled Carbon Nanotubes for Catalytic Phenol Oxidation. ACS Catal. 2015, 5, 553–559. [Google Scholar] [CrossRef]
  15. Wang, X.B.; Qin, Y.L.; Zhu, L.H.; Tang, H.Q. Nitrogen-Doped Reduced Graphene Oxide as a Bifunctional Material for Removing Bisphenols: Synergistic Effect between Adsorption and Catalysis. Environ. Sci. Technol. 2015, 49, 6855–6864. [Google Scholar] [CrossRef]
  16. Ong, W.J.; Tan, L.L.; Ng, Y.H.; Yong, S.T.; Chai, S.P. Graphitic Carbon Nitride (g-C3N4)-Based Photocatalysts for Artificial Photosynthesis and Environmental Remediation: Are We a Step Closer to Achieving Sustainability? Chem. Rev. 2016, 116, 7159–7329. [Google Scholar] [CrossRef]
  17. Li, H.; Shan, C.; Pan, B. Fe(III)-Doped g-C3N4 Mediated Peroxymonosulfate Activation for Selective Degradation of Phenolic Compounds via High-Valent Iron-Oxo Species. Environ. Sci. Technol. 2018, 52, 2197–2205. [Google Scholar] [CrossRef] [PubMed]
  18. Tian, M.; Ren, X.; Ding, S.; Fu, N.; Wei, Y.; Yang, Z.; Yao, X. Effective degradation of phenol by activating PMS with bimetallic Mo and Ni Co-doped g-C3N4 composite catalyst: A Fenton-like degradation process promoted by non-free radical 1O2. Environ. Res. 2023, 243, 117848. [Google Scholar] [CrossRef] [PubMed]
  19. Martha, S.; Nashim, A.; Parida, K.M. Facile synthesis of highly active g-C3N4 for efficient hydrogen production under visible light. J. Mater. Chem. A 2013, 1, 7816–7824. [Google Scholar] [CrossRef]
  20. Zhu, S.S.; Huang, X.C.; Ma, F.; Wang, L.; Duan, X.G.; Wang, S.B. Catalytic Removal of Aqueous Contaminants on N-Doped Graphitic Biochars: Inherent Roles of Adsorption and Nonradical Mechanisms. Environ. Sci. Technol. 2018, 52, 8649–8658. [Google Scholar] [CrossRef]
  21. Ren, W.; Xiong, L.L.; Nie, G.; Zhang, H.; Duan, X.G.; Wang, S.B. Insights into the Electron-Transfer Regime of Peroxydisulfate Activation on Carbon Nanotubes: The Role of Oxygen Functional Groups. Environ. Sci. Technol. 2020, 54, 1267–1275. [Google Scholar] [CrossRef]
  22. Lv, X.M.; Zhang, Y.F.; Wang, Y.; Zhang, G.J.; Liu, J.; Lu, Y. Formation of coal-based carbon nanotubes by Fe-K catalyst. J. Anal. Appl. Pyrolysis 2022, 161, 105400. [Google Scholar] [CrossRef]
  23. Ahmed, S.; An, J.; Zubair, M.; Sun, H.-J.; Shim, J.; Park, G. Relationship between Morphology and Performance of Manganese-Derived Catalysts for Rechargeable Zinc-Air Batteries. J. Phys. Chem. Lett. 2025, 16, 6667–6673. [Google Scholar] [CrossRef]
  24. Hong, Y.C.; Peng, J.L.; Zhao, X.G.; Yan, Y.; Lai, B.; Yao, G. Efficient degradation of atrazine by CoMgAl layered double oxides catalyzed peroxymonosulfate: Optimization, degradation pathways and mechanism. Chem. Eng. J. 2019, 370, 354–363. [Google Scholar] [CrossRef]
  25. Dikdim, J.M.D.; Gong, Y.; Noumi, G.B.; Sieliechi, J.M.; Zhao, X.; Ma, N.; Yang, M.; Tchatchueng, J.B. Peroxymonosulfate improved photocatalytic degradation of atrazine by activated carbon/graphitic carbon nitride composite under visible light irradiation. Chemosphere 2019, 217, 833–842. [Google Scholar] [CrossRef]
  26. Dominguez, C.M.; Rodriguez, V.; Montero, E.; Romero, A.; Santos, A. Methanol-enhanced degradation of carbon tetrachloride by alkaline activation of persulfate: Kinetic model. Sci. Total Environ. 2019, 666, 631–640. [Google Scholar] [CrossRef] [PubMed]
  27. Liu, Y.; Guo, H.G.; Zhang, Y.L.; Tang, W.H.; Cheng, X.; Liu, H.W. Activation of peroxymonosulfate by BiVO4 under visible light for degradation of Rhodamine B. Chem. Phys. Lett. 2016, 653, 101–107. [Google Scholar] [CrossRef]
  28. de Andrade, J.R.; Vieira, M.G.A.; Carlos da Silva, M.G.; Wang, S. Oxidative degradation of pharmaceutical losartan potassium with N-doped hierarchical porous carbon and peroxymonosulfate. Chem. Eng. J. 2020, 382, 122971. [Google Scholar] [CrossRef]
  29. Shang, E.; Li, Y.; Niu, J.; Zhou, Y.; Wang, T.; Crittenden, J.C. Relative importance of humic and fulvic acid on ROS generation, dissolution, and toxicity of sulfide nanoparticles. Water Res. 2017, 124, 595–604. [Google Scholar] [CrossRef]
  30. Xu, L.; Wu, C.; Liu, P.; Bai, X.; Du, X.; Jin, P.; Yang, L.; Jin, X.; Shi, X.; Wang, Y. Peroxymonosulfate activation by nitrogen-doped biochar from sawdust for the efficient degradation of organic pollutants. Chem. Eng. J. 2020, 387, 124065. [Google Scholar] [CrossRef]
  31. Govindan, K.; Kim, D.-G.; Ko, S.-O. Role of N-Doping and O-Groups in Unzipped N-Doped CNT Carbocatalyst for Peroxomonosulfate Activation: Quantitative Structure–Activity Relationship. Catalysts 2022, 12, 845. [Google Scholar] [CrossRef]
  32. Li, N.; Li, R.; Duan, X.; Yan, B.; Liu, W.; Cheng, Z.; Chen, G.; Hou, L.a.; Wang, S. Correlation of Active Sites to Generated Reactive Species and Degradation Routes of Organics in Peroxymonosulfate Activation by Co-Loaded Carbon. Environ. Sci. Technol. 2021, 55, 16163–16174. [Google Scholar] [CrossRef]
  33. Ren, W.; Nie, G.; Zhou, P.; Zhang, H.; Duan, X.G.; Wang, S.B. The Intrinsic Nature of Persulfate Activation and N-Doping in Carbocatalysis. Environ. Sci. Technol. 2020, 54, 6438–6447. [Google Scholar] [CrossRef]
  34. Zhu, K.; Bin, Q.; Shen, Y.; Huang, J.; He, D.; Chen, W. In-situ formed N-doped bamboo-like carbon nanotubes encapsulated with Fe nanoparticles supported by biochar as highly efficient catalyst for activation of persulfate (PS) toward degradation of organic pollutants. Chem. Eng. J. 2020, 402, 126090. [Google Scholar] [CrossRef]
  35. Hu, W.; Xie, Y.; Lu, S.; Li, P.; Xie, T.; Zhang, Y.; Wang, Y. One-step synthesis of nitrogen-doped sludge carbon as a bifunctional material for the adsorption and catalytic oxidation of organic pollutants. Sci. Total Environ. 2019, 680, 51–60. [Google Scholar] [CrossRef]
  36. Ye, S.; Zeng, G.; Tan, X.; Wu, H.; Liang, J.; Song, B.; Tang, N.; Zhang, P.; Yang, Y.; Chen, Q.; et al. Nitrogen-doped biochar fiber with graphitization from Boehmeria nivea for promoted peroxymonosulfate activation and non-radical degradation pathways with enhancing electron transfer. Appl. Catal. B Environ. 2020, 269, 118850. [Google Scholar] [CrossRef]
  37. Lv, P.; She, L.; Zhong, Y.; Chen, Q.; Ye, Q.; Zeng, D.; Wang, J.; Yang, J.; Li, J.; Wu, G.; et al. Regulation mechanism of biochar on cobalt-doped copper oxide/peroxymonosulfate system: Key roles of superoxide radicals. Sep. Purif. Technol. 2025, 375, 133857. [Google Scholar] [CrossRef]
  38. Hou, J.F.; Yang, S.S.; Wan, H.Q.; Fu, H.Y.; Qu, X.L.; Xu, Z.Y.; Zheng, S.R. Highly effective catalytic peroxymonosulfate activation on N-doped mesoporous carbon for o-phenylphenol degradation. Chemosphere 2018, 197, 485–493. [Google Scholar] [CrossRef]
  39. Chen, X.; Oh, W.-D.; Hu, Z.-T.; Sun, Y.-M.; Webster, R.D.; Li, S.-Z.; Lim, T.-T. Enhancing sulfacetamide degradation by peroxymonosulfate activation with N-doped graphene produced through delicately-controlled nitrogen functionalization via tweaking thermal annealing processes. Appl. Catal. B Environ. 2018, 225, 243–257. [Google Scholar] [CrossRef]
  40. Ghaly, H.A.; El-Kalliny, A.S.; Gad-Allah, T.A.; El-Sattar, N.E.A.A. Photodegradation of Naproxen Using Ag/AgCl–PANI Composite under Solar Light: Transformation Product and Reaction Kinetics. Kinet. Catal. 2021, 62, 367–374. [Google Scholar] [CrossRef]
  41. Rahmani, A.R.; Poormohammadi, A.; Zamani, F.; Tahmasebi Birgani, Y.; Jorfi, S.; Gholizadeh, S.; Mohammadi, M.J.; Almasi, H. Activated persulfate by chelating agent Fe/complex for in situ degradation of phenol: Intermediate identification and optimization study. Res. Chem. Intermed. 2018, 44, 5501–5519. [Google Scholar] [CrossRef]
  42. Sanchez, I.; Stüber, F.; Font, J.; Fortuny, A.; Fabregat, A.; Bengoa, C. Elimination of phenol and aromatic compounds by zero valent iron and EDTA at low temperature and atmospheric pressure. Chemosphere 2007, 68, 338–344. [Google Scholar] [CrossRef]
  43. Liu, S.; Zhang, Z.; Huang, F.; Liu, Y.; Feng, L.; Jiang, J.; Zhang, L.; Qi, F.; Liu, C. Carbonized polyaniline activated peroxymonosulfate (PMS) for phenol degradation: Role of PMS adsorption and singlet oxygen generation. Appl. Catal. B Environ. 2021, 286, 119921. [Google Scholar] [CrossRef]
  44. Kou, L.D.; Fan, Q.F.; Yang, Y.H.; Duan, X.Y.; Jiang, K.; Wang, J. Polyaniline@g-C3N4 derived N-rich porous carbon for selective degradation of phenolic pollutants via peroxymonosulfate activation: An electron transfer mechanism. Chemosphere 2023, 311, 137022. [Google Scholar] [CrossRef] [PubMed]
  45. Wang, Y.; Duan, H.; Li, H.; Zhen, J.; Lv, W. Efficient activation of peroxymonosulfate by MoS2 intercalated MgCuFe layered double hydroxide for phenol pollutant control. J. Environ. Chem. Eng. 2023, 11, 109502. [Google Scholar] [CrossRef]
  46. Ding, S.; Ren, X.; Chen, R.; Yang, Z. Efficient degradation of Phenol by 1 T/2H-MoS2/CuFe2O4 activated peroxymonosulfate and mechanism research. Appl. Surf. Sci. 2023, 612, 155931. [Google Scholar] [CrossRef]
  47. Afzal, S.; Mehmood, A.; Jin, L.; Pan, K.; Ahmad, M.; Duan, D.; Wei, Y.; Raza, W.; Hao, T.; Sharif, H.M.A.; et al. Facile fabrication of cobalt doped manganese oxide with hierarchical porosity for peroxymonosulfate activation: Performance investigation, mechanistic insight to degrade organic pollutants in water and DFT study. J. Hazard. Mater. Adv. 2023, 9, 100244. [Google Scholar] [CrossRef]
  48. Yu, Y.L.; Yang, J.; Fan, X.F.; Liu, Y.M. Enhanced persulfate activation by nitrogen-doped mesoporous carbon for efficiently degrading organic matters. Environ. Sci. Pollut. Res. 2023, 30, 33795–33807. [Google Scholar] [CrossRef] [PubMed]
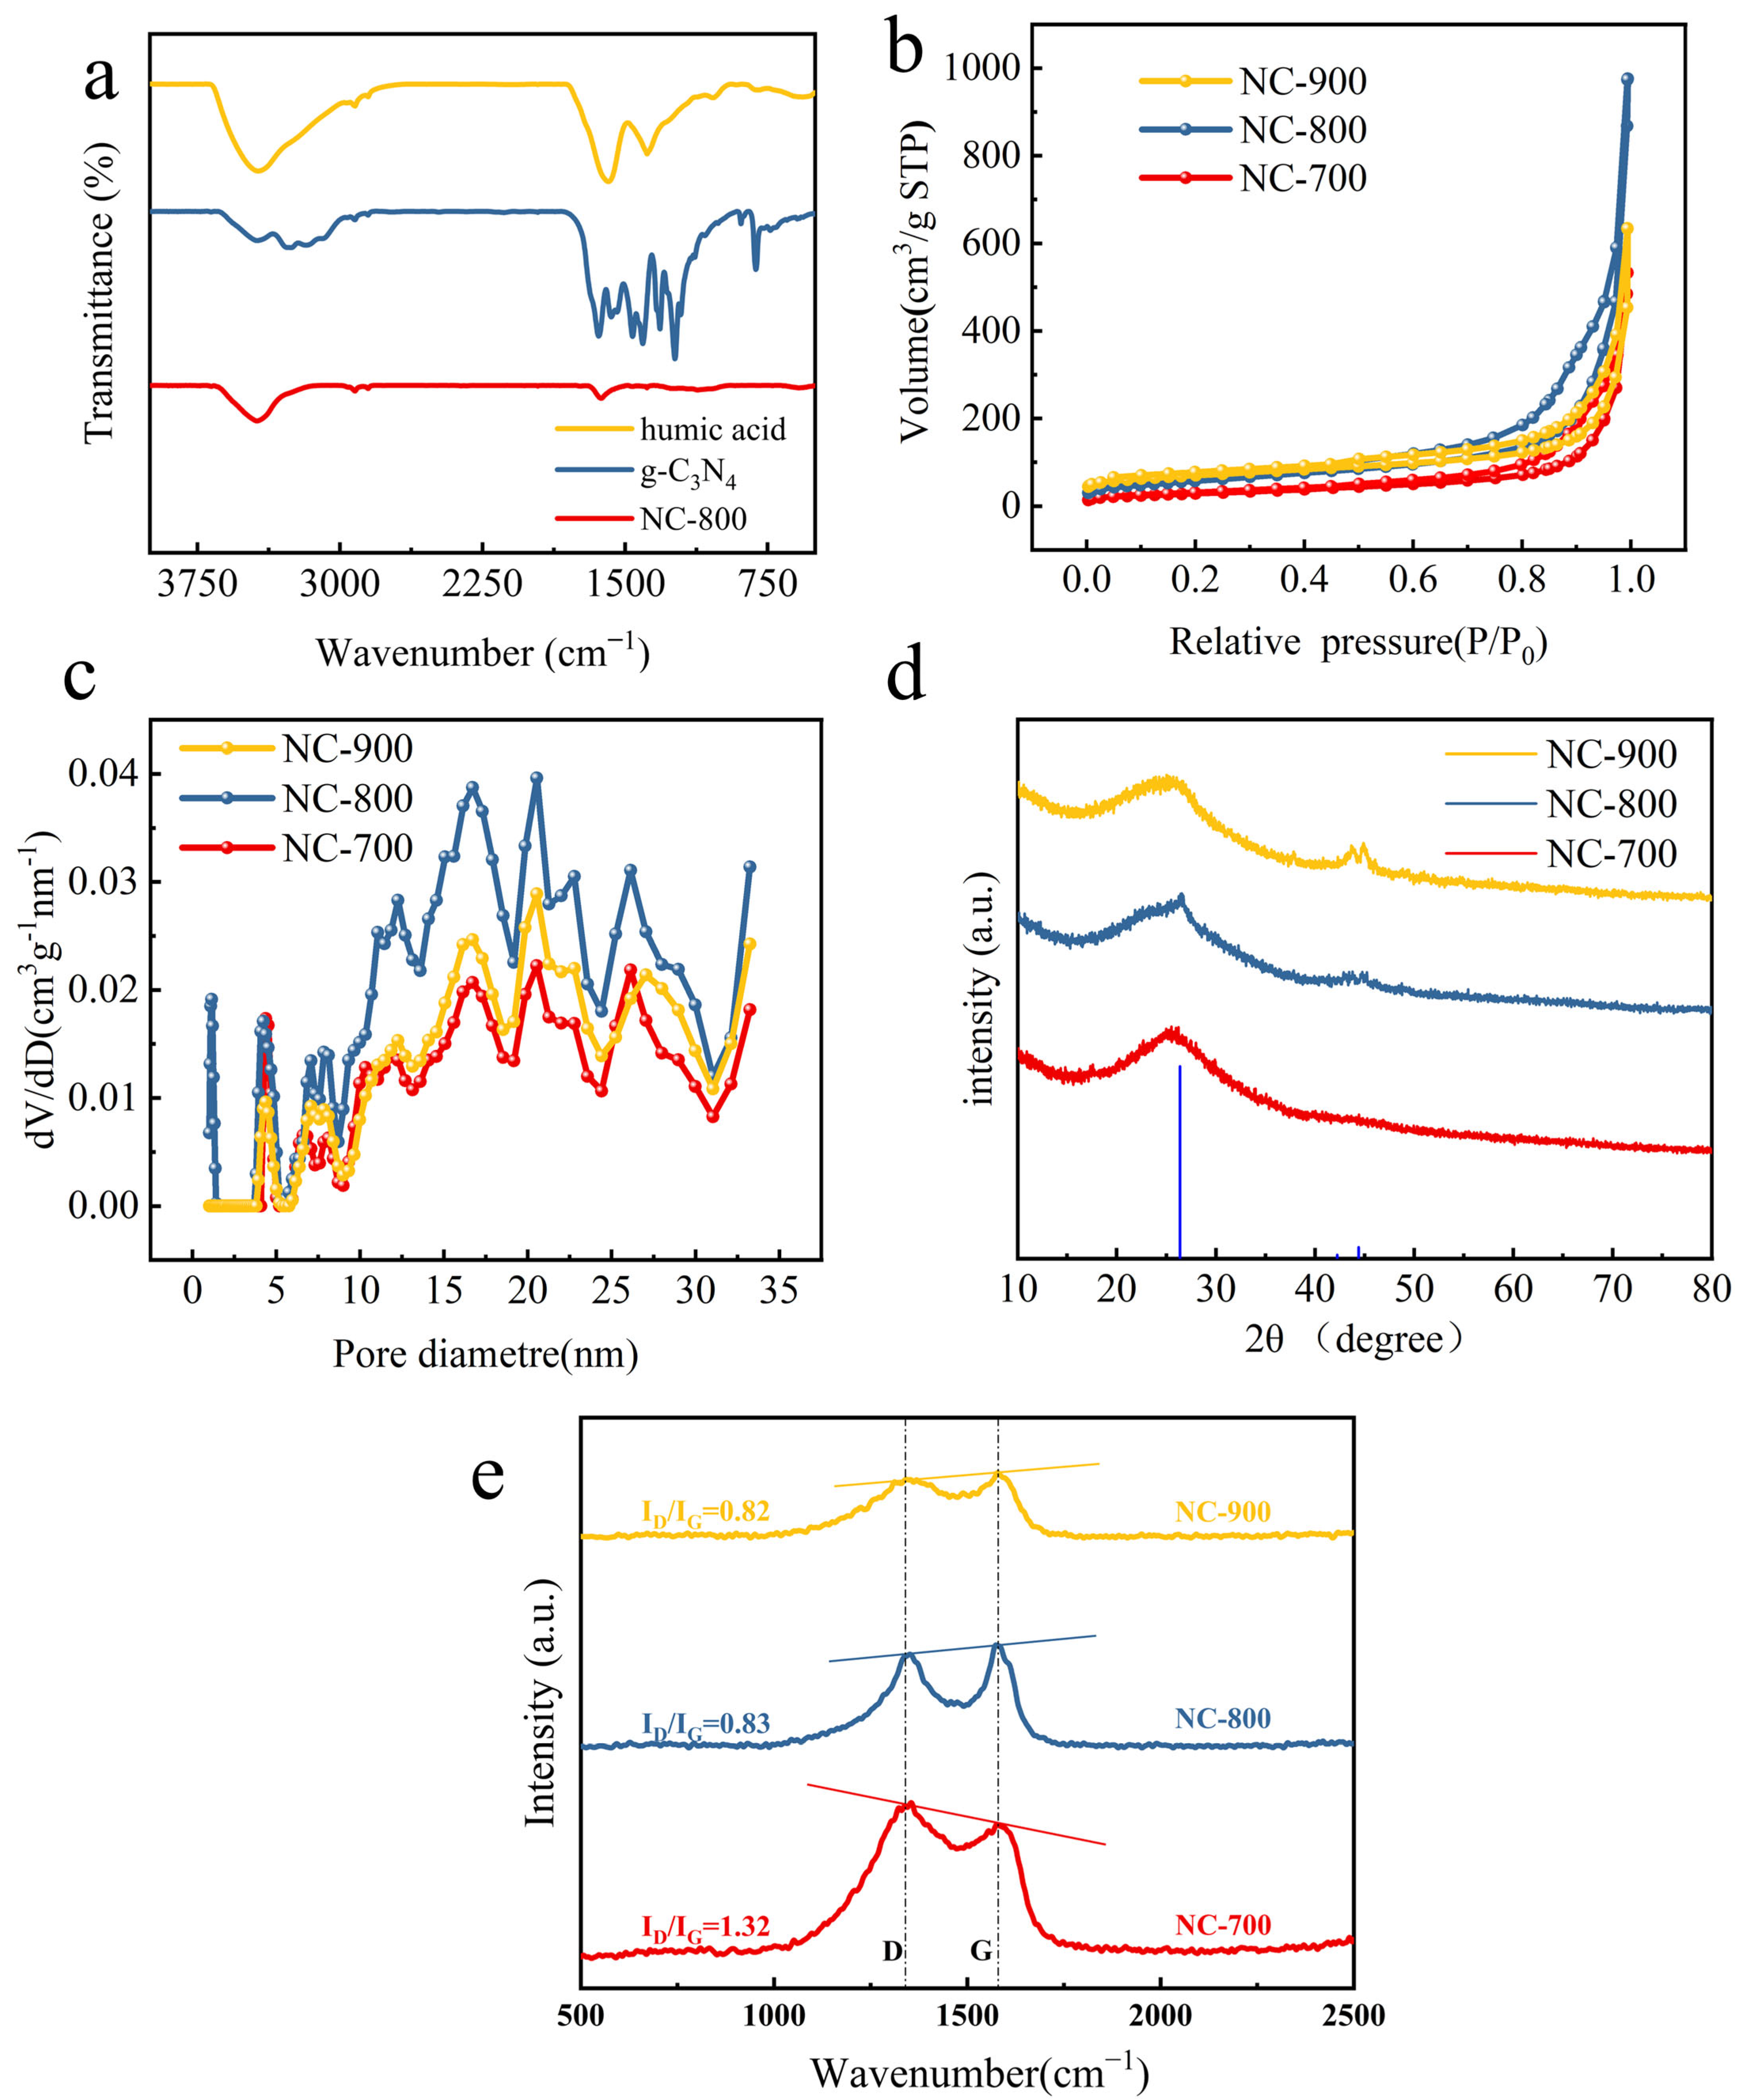
Figure 1. (a) Infrared spectrogram of HA, g-C3N4, and NC-800; (b,c) N2 adsorption–desorption isotherms and pore size distribution; (d) XRD patterns; (e) Raman spectrum of NC-700, NC-800, and NC-900.
Catalysts 15 00968 g001
Figure 2. SEM images of (a,b) C-800, (c,d) NC-700, (e,f) NC-800, and (g,h) NC-900, and (i) EDS mapping images of NC-800.
Catalysts 15 00968 g002
Figure 3. (a) XPS full spectrum; (b) N1s spectrogram.
Catalysts 15 00968 g003
Figure 4. (a) Comparison of performance of nitrogen-doped HA-based carbon materials activated with PMS (material dosage = 0.1 g/L, PMS concentration = 0.8 mM, initial pH = 5.68). (b) Effect of NC-800 dosage. (c) Effect of concentration ofphenol (d) Effect of initial pH of solution. (e) Cl. (f) HCO3. (g) SO42−. (h) Effect of natural organic matter on phenol removal efficiency. (i) Reusability of NC-800 (phenol = 50 mg/L, NC-800 dosage = 0.15 g/L, PMS concentration = 1.5 mM).
Catalysts 15 00968 g004
Figure 5. (a) Degradation of phenol by NC-800/PMS system; (b) first-order reaction kinetics fitting of the effect of various quenching agents on phenol degradation; ESR spectra of NC-800/PMS system for (c) DMPO-OH and DMPO-SO4, (d) DMPO-O2•−, and (e) TEMP-1O2; (f) pen circuit potential changes over time.
Catalysts 15 00968 g005
Figure 6. (a) XPS full spectrum; (b) C1s spectrogram; (c) O1s spectrogram; (d) N1s spectrogram of NC-800 before and after reaction.
Catalysts 15 00968 g006
Figure 7. Possible path of phenol degradation in NC-800/PMS system.
Catalysts 15 00968 g007
Table 1. Specific surface area and pore volume of catalysts.
ParametersNC-700NC-800NC-900
SBET (m2/g)104.17209.11130.29
Pore volume (cm3/g)0.380.680.46
Table 2. Elemental composition of nitrogen-doped HA-based carbon materials.
SamplesElemental Analysis (wt. %)XPS (at. %)
CadNadHadCadNadOad
NC-70065.3223.661.9171.6720.847.49
NC-80076.667.851.4185.258.696.06
NC-90080.246.731.3986.956.986.07
Table 3. Relative content of nitrogen forms of nitrogen-doped HA-based carbon materials.
SamplesPyridinic NPyrrolic NGraphitic NOxidized N
NC-70050.10%36.61%9.71%3.58%
NC-80030.81%52.75%10.43%6.01%
NC-90039.19%43.64%11.27%5.90%
Table 4. Comparison of phenol removal performance of different materials.
MaterialsReaction ConditionsDegradation Rate ConstantDegradation EffectReusabilityLiterature
Carbonized polyaniline[PH] = 0.94 mg/L;
[catalyst] = 25 mg/L;
[PMS] = 0.5 mmol/L
0.431 min−1100%
30 min
29% after fourth times[43]
Polyaniline@g-C3N4[PH] = 9.4 mg/L;
[catalyst] = 100 mg/L;
[PMS] = 1 mM
0.075 min−1100%
180 min
46% after three times[44]
MoS2/MgCuFe-LDH[PH] = 1.88 mg/L;
[catalyst] = 100 mg/L;
[PMS] = 1.0 mM
1.24 min−198%
10 min
[45]
1T/2H-MoS2/CuFe2O4[PH]= 20 mg/L;
[catalyst]= 300 mg/L;
[PMS] = 1.0 mM
0.170 min−195.8%
40 min
More than 90% after 5 cycles[46]
Co18-MnOx[PH] = 20 mg/L;
[catalyst] = 200 mg/L;
[PMS] = 2.86 mM
0.29 min−1100%
18 min
87.45% after three times[47]
nitrogen-doped mesoporous carbon[PH] = 70 mg/L;
[catalyst] = 400 mg/L;
[PMS] = 1.5 mM
0.0192 min−195%
90 min
45% after the third cycle[48]
8-g C3N4/Mo/Ni[PH] = 20 mg/L;
[catalyst] = 350 mg/L;
[PMS] = 0.6 mM
0.097 min−195%
20 min
72% after the fifth cycle[18]
NC-800[PH] = 50 mg/L;
[catalyst] = 150 mg/L;
[PMS] = 1.5 mM
0.1214 min−199.62%
60 min
45.3% after the third cycleThis thesis
Disclaimer/Publisher’s Note: The statements, opinions and data contained in all publications are solely those of the individual author(s) and contributor(s) and not of MDPI and/or the editor(s). MDPI and/or the editor(s) disclaim responsibility for any injury to people or property resulting from any ideas, methods, instructions or products referred to in the content.