Article

Electrochemical and Spectroelectrochemical Studies on Oxygen Reduction Mediated by Cu(II) Complexes Containing the Alkylamine Ligand N,N-Dimethylethylendiamine

by
Omar Monsalvo Zúñiga
1,
Angel Mendoza
2,
Marisela Cruz-Ramírez
3,
Lillian G. Ramírez-Palma
4,
Juan Pablo F. Rebolledo-Chávez
4 and
Luis Ortiz-Frade
1,*
1
Departamento de Electroquímica, Centro de Investigación y Desarrollo Tecnológico en Electroquímica S. C. Parque Tecnológico Querétaro, Sanfandila, Pedro Escobedo, Querétaro C. P. 76703, Mexico
2
Centro de Química, Instituto de Ciencias, Benemérita Universidad Autónoma de Puebla, Ciudad Universitaría, Col. San Manuel, Puebla C. P. 72570, Mexico
3
Escuela de Bachilleres Plantel San Juan del Río, Universidad Autónoma de Querétaro, Calle Corregidora No. 4, Colonia Centro, San Juan del Río, Querétaro C. P. 76800, Mexico
4
División de Química y Energía Renovables, Universidad Tecnológica de San Juan del Río, Avenida la Palma no. 125 Vista Hermosa, San Juan del Río C.P. 76826, Querétaro, Mexico
*
Author to whom correspondence should be addressed.
Catalysts 2025, 15(10), 951; https://doi.org/10.3390/catal15100951
Submission received: 30 August 2025 / Revised: 28 September 2025 / Accepted: 30 September 2025 / Published: 3 October 2025

Abstract

In this study, Cu(II) complexes containing the bidentate ligand N,N-dimethylethylendiamine (dmen), i.e., [CuII(dmen)2(CH3COO)2], [CuII(dmen)2(NO3)2], and [CuII(dmen)2Cl2], were developed to explore molecular catalysis for the oxygen reduction reaction (ORR). Cyclic voltammetry and UV–vis spectroelectrochemical and electrochemical impedance spectroscopy experiments were performed in the absence and presence of oxygen. The UV–vis spectroscopy results suggested that the aforementioned Cu(II) complexes present an octahedral geometry in the solid state; meanwhile, they show a square pyramidal geometry in an aqueous solution. It is proposed that the chemical species [CuI(dmen)2H2O]+ reacts with O2, exhibiting an outer-sphere electron transfer mechanism. The same UV–vis spectroelectrochemical response obtained with and without O2 indicated a direct electron transfer from Cu(II) to Cu(I), with the regeneration of catalyst and the absence of other intermediate species. Among the reported compounds, [Cu(dmen)2(NO3)2] exhibited the highest catalytic rate (TOF = 1.3 × 10⁴ s−1). The impedance spectroscopy results showed that the resistance charge transfer (Rct) of the redox pair CuII|CuI decreased in the presence of O2 from 36.391 kΩ to 5.54 kΩ. For a better understanding of the effect of aliphatic amines on the ORR, a comparison with the complex [Cu(1,10-phen)2NO3]NO3 is also presented.

1. Introduction

The search for renewable and alternative energy sources has encouraged the scientific community in recent years, due to the worldwide scarcity of fossil fuel [1]. One of the most promising renewable and alternative energy options are fuel cells, which are devices capable of converting chemical energy from a reaction into electrical energy, thereby providing enough energy to fulfill vehicle demands [2,3]. In these devices, the oxygen reduction reaction (ORR) is widely used for energy generation. In an acidic medium, the ORR generates 2H2O via 4e reduction [4]. Unfortunately, the efficiency of the ORR is determined by the overpotential associated with slow kinetics that decreases the overall efficiency to 40–60% [3,5]. Pt has been used as a catalyst for the ORR and is capable of accelerating the reaction, but with a high overpotential (300 mV). In addition to the low abundance and high cost of Pt, its implementation in commercial cells has been inviable. For this reason, investigations have focused on the search of high-efficiency catalysts based on non-precious metals [6,7,8,9].
Laccase is a metalloenzyme, capable of reducing O2 to H2O, with a very small overpotential (approximately 20 mV), which has led to research on anchoring it in fuel cells; however, the narrow pH range and sensitive operating conditions have limited its implementation [10,11,12]. The high catalytic activity of this enzyme has inspired the scientific community to investigate Cu complexes as ORR catalysts. The kinetics, thermodynamics, and reactivity of the reaction of Cu(I) with O2 have been widely studied, due to its presence in biological processes [13,14]. In recent years, its use as a catalyst in fuel cells has been considered. A wide variety of mono- and binuclear Cu(II) complexes have been studied for the ORR, with different ligands such as heterocyclic porphyrins, phthalocyanines [15], substituted phenanthrolines [16,17], and pyridylalkylamine ligands [18,19,20,21,22]. Among all the reported compounds, the Cu complex with the ligand (tris(2-pyridylmethyl)amine (tmpa) has demonstrated the highest activity for the ORR, with a turnover frequency (TOF) of 1.8 × 10⁻⁶ s−1 [18]. However, only a few copper complexes containing alkylamine ligands, such as tris(3-aminopropyl)amine (trpn) [23] and tris(2-aminoethyl)amine (tren) [24], have been reported for the ORR. In addition, no extensive electrochemical characterization using spectroelectrochemical and electrochemical impedance spectroscopy (EIS) has been reported to obtain information about the mechanism of these copper complexes.
In this study, we assess the electrochemical, spectroelectrochemical, and EIS response of mononuclear Cu(II) complexes with the N,N-dimethylethylenediamine (dmen) ligand in the presence and absence of O2 to explore their ability in the ORR and to contribute to the understanding of the role of molecular structure in the process. TOFs were calculated through foot of the wave analysis (FOWA) and compared with other reported Cu complexes. As a reference, the ORR using the complex [CuII(1,10-phen)2NO3]NO3 is also presented.

2. Results and Discussion

2.1. Complexes’ Characterization

2.1.1. Solid-State Characterization

The IR spectra of complexes present characteristic vibrations between 3000 and 2800 cm−1 corresponding to the ν(C-H) vibration of the N-CH3, -CH3, and -CH2 groups of dmen ligand; see Figure S1. The stretching vibration ν(Cu-N) is detected between 500 and 450 cm−1, which is in agreement with the reported value for Cu(II) coordination with ethylenediamine [25,26,27]. The complex [Cu(dmen)2(CH3COO)2] presents two typical stretching vibrations ν(COO)s,as at 1410 and 1572 cm−1, with a Δν(COO-) = 162 cm−1 associated with the monodentate coordination mode M-O-CO [28]. Furthermore, the complex [Cu(dmen)2(NO3)2] presents signals at 1313 and 1414 cm−1 corresponding to asymmetrical and symmetrical (NO2) vibrations, which could be related with a monodentate coordination mode for NO3. The mass spectrum data of complexes showed m/z signals at 273, 301, and 239, corresponding to [Cu(dmen)2(CH3COO)]+, [Cu(dmen)2(NO3)]+ and [Cu(dmen)2Cl]+, respectively; see Figures S2–S4. The electronic spectra of the solid state of complexes [Cu(dmen)2(CH3COO)2], [Cu(dmen)2(NO3)2], and [Cu(dmen)2Cl2] showed broad and asymmetrical absorption bands at 557 nm, 545 nm, and 585 nm, respectively (Figure 1), associated with a distorted octahedral geometry around the metal center [29]. The crystal structure of complex [Cu(dmen)2(NO3)2] confirms the proposed structure, which is similar to that reported earlier by Narayanan and Bhadbhade [30]; see Figure 2 and Tables S1 and S2.

2.1.2. Characterization in Solution

The electronic spectra of all complexes in the aqueous solution showed one absorption band at 570 nm, typical of a d⟶d transition, associated with a square pyramidal geometry; see Figure S5. Furthermore, in the UV region, two absorption bands at 230 nm and 270 nm were detected, typical of the Ligand–Metal Charge-Transfer (LMCT) transitions n → σ* and σ → σ*, respectively. The same spectrum obtained for all complexes suggests an exchange between the counterion of the complexes with a water molecule of the medium, generating a common chemical species [CuII(dmen)2H2O]2+.

2.2. Electrochemical Behavior of Cu-dmen Complexes

2.2.1. Cyclic Voltammetry for Bis(dmen) Complexes

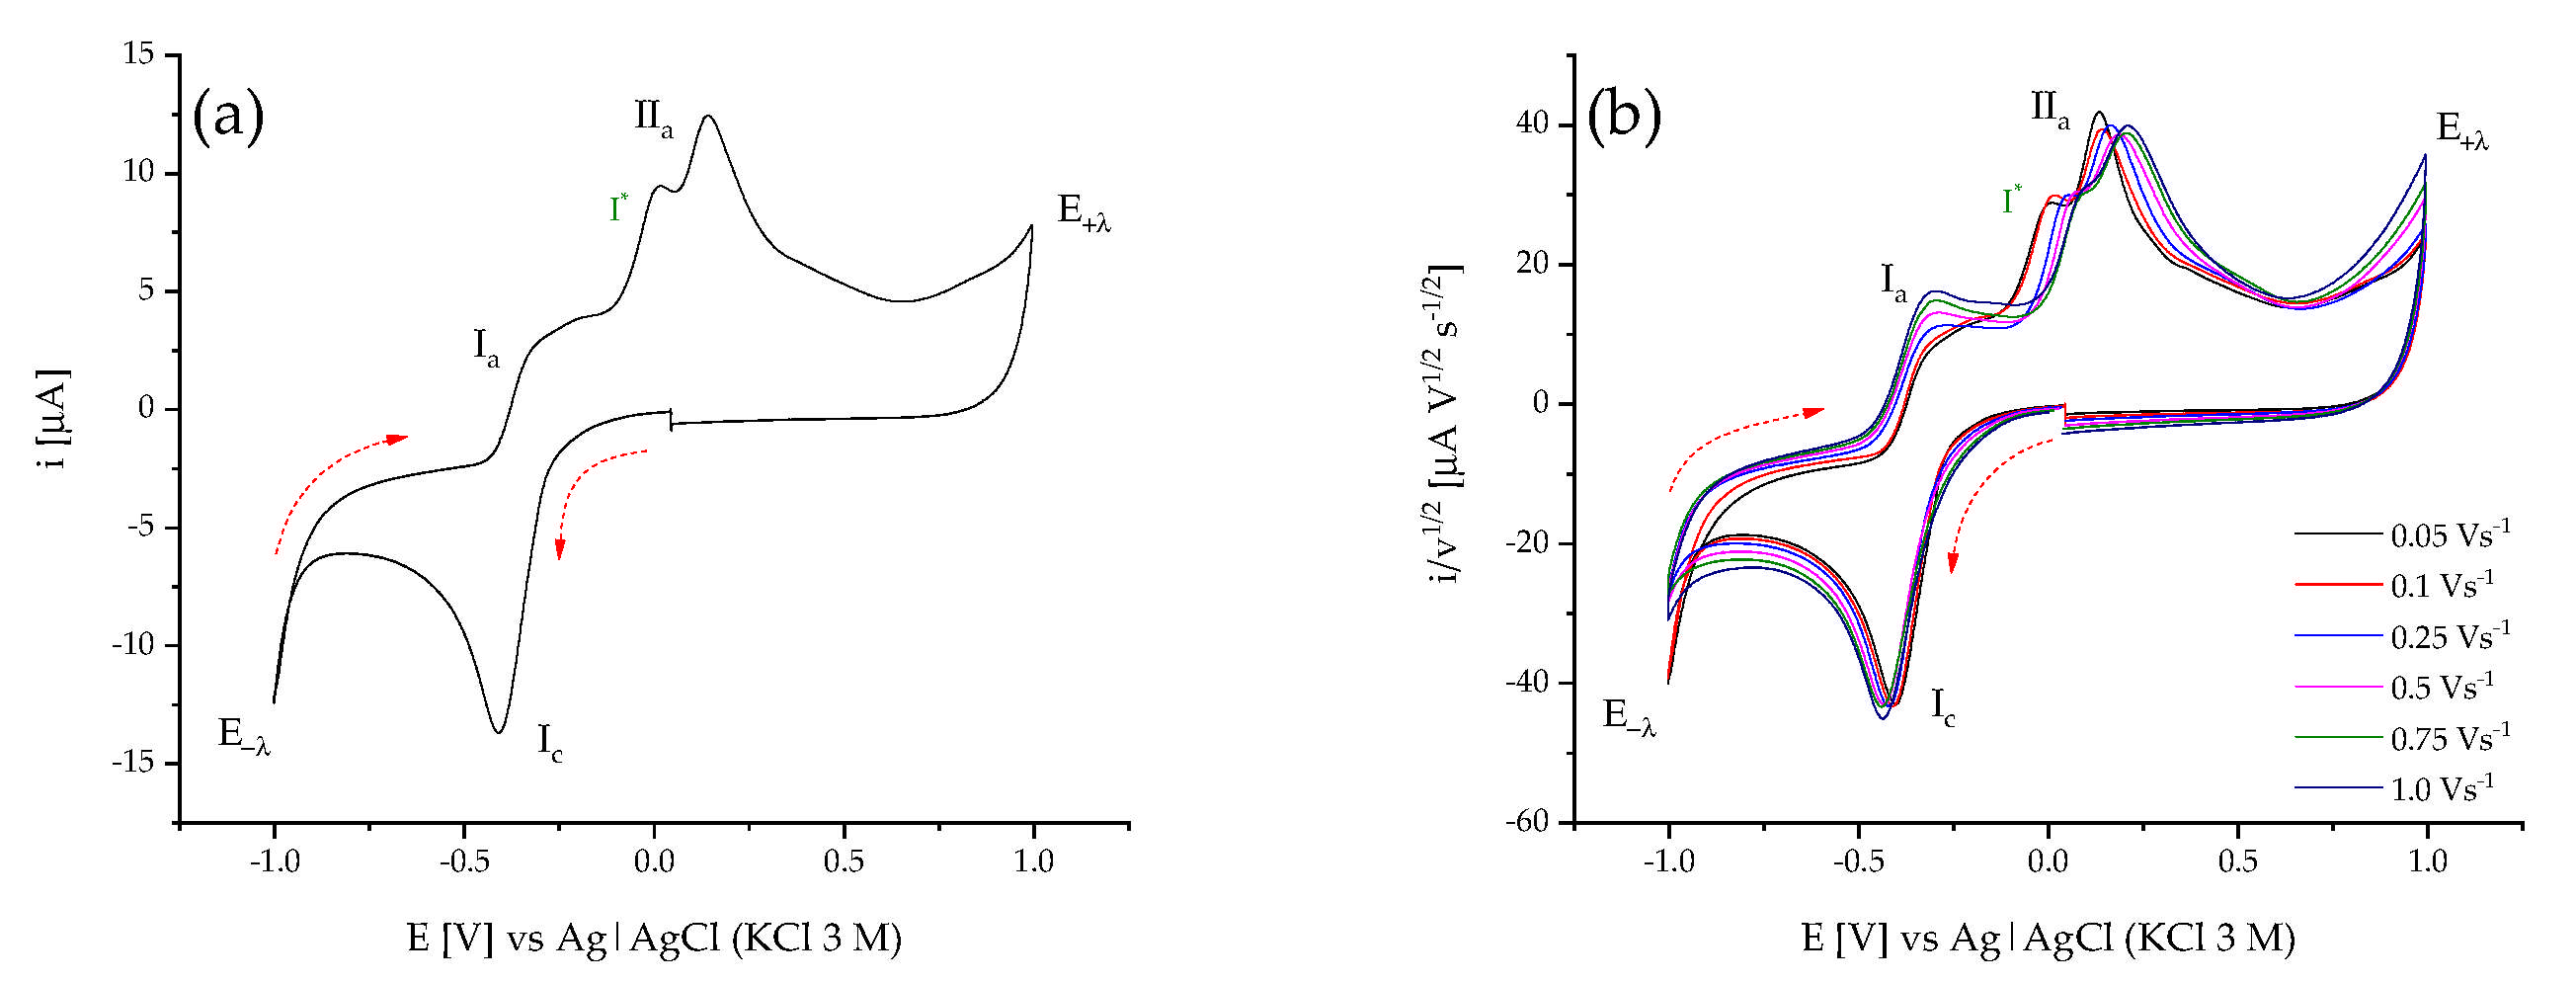
The electrochemical response of bis(dmen)Cu complexes was explored through cyclic voltammetry from open-circuit potential (Eoc) in the negative direction, using a glassy carbon electrode as the working electrode in the presence of 0.1 M KNO3 in an aqueous solution as the supporting electrolyte. Figure 3a shows a typical cyclic voltammogram at 0.1 V s−1 of the complex [CuII(dmen)2(NO3)2], where one reduction signal (Ic) at an Epc = −0.390 V Ag/AgCl and two oxidation signals (Ia and IIa) at −0.241 and 0.146 V vs. Ag|AgCl can be observed. Furthermore, a pre-wave signal I* is also detected at −0.023 V vs. Ag|AgCl. A study of inversion of potential E in the negative direction indicates that all oxidation signals are dependent on the reduction signal Ic. Considering the dependence of signals Ic with Ia, and experiments of cyclic voltammetry at different scan rates, a difference in peak potentials ΔEp close to 150 mV was calculated. Cyclic voltammograms in a normalized representation (i/ν1/2), as seen in Figure 3b, exhibited an increase in normalized current for signal Ia and a shift toward more negative potential for signal Ic when the scan rate was increased. This behavior can be related to quasi-reversible electron transfer followed by a coupled chemical reaction. The peak potential values for signal IIa also presented a shift to positive values. This fact also suggests the presence of a coupled chemical reaction with the electron transfer process. The formation of Cu(0) over the electrode must be neglected, as no metallic electrodeposit was detected in cyclic voltammograms after bulk electrolysis experiments. The responses of bis(dmen)Cu complexes display similar behavior among themselves; see Figures S6 and S7; only the response of the complex [CuII(dmen)2(NO3)2] is shown in this article. Spectroelectrochemical experiments were performed to establish the location of the electron transfer in the process Ic.

2.2.2. Spectroelectrochemical Characterization

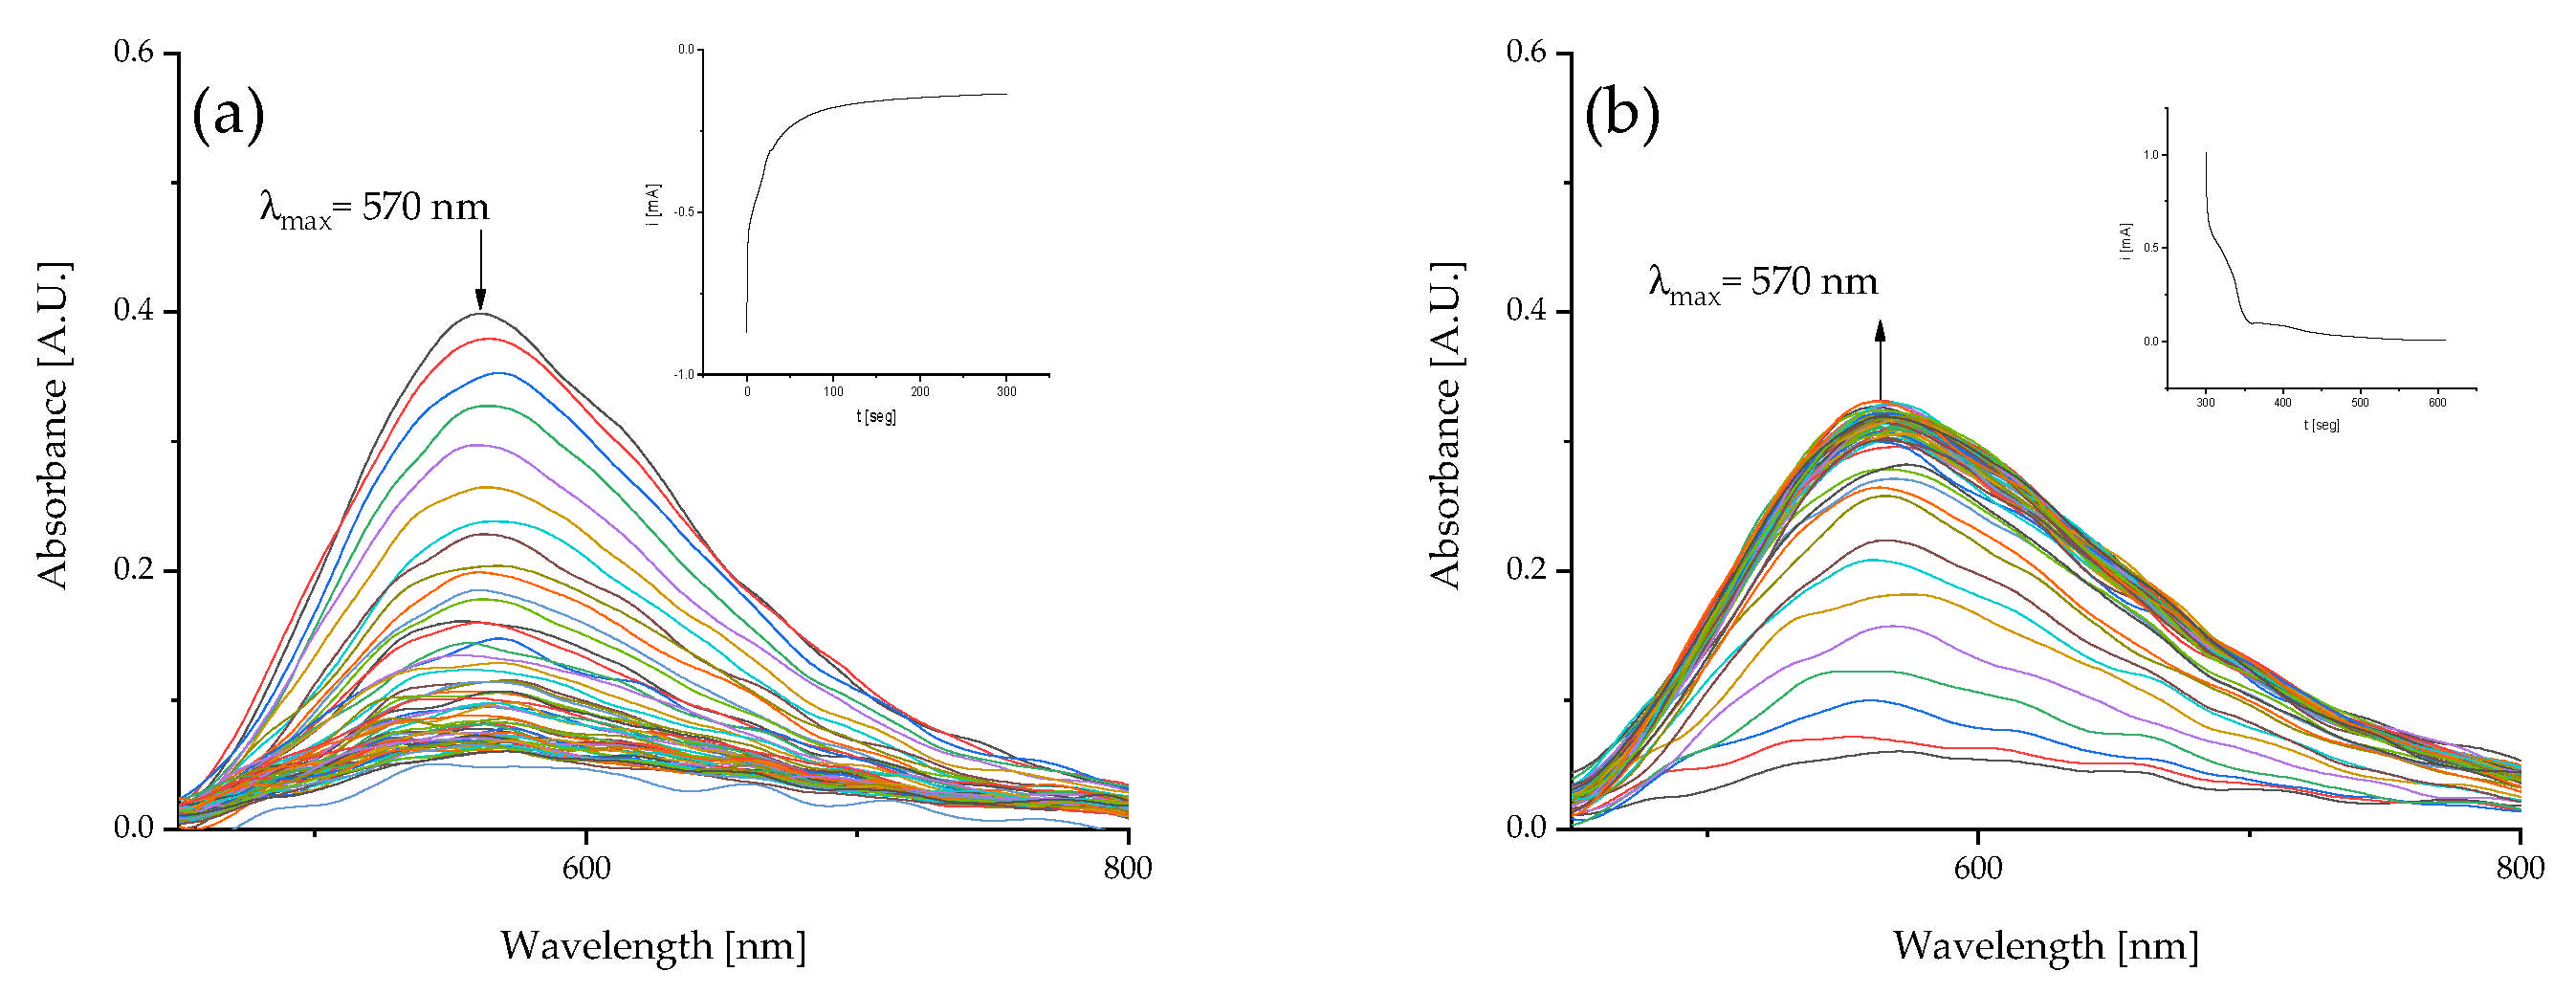
UV–vis spectroelectrochemical experiments for a solution of 1.5 × 10⁻² M of complex [CuII(dmen)2(NO3)2] in 0.1 M KNO3 were performed, imposing a pulse of potential in which the process Ic is limited by diffusion (E1 = −0.85 V vs. Ag|AgCl) by 5 min, with the simultaneous acquisition of spectra performed every 3 s (see Figure 4a). Immediately, a second potential pulse (E2 = 0.25 V vs. Ag|AgCl) was imposed for 5 min (see Figure 4b). For the forward pulse, a decrease in the absorbance values for the signal at 570 nm, typical of a d⟶d electronic transition associated with a distorted square pyramidal geometry around the Cu(II) metal center, was recorded. For the backward pulse, the absorbance values for the electronic transition at 570 nm increased until a constant value was reached (Figure 4b). Hence, the process Ic can be attributed to the reduction Cu(II) + 1e → Cu(I); meanwhile, Ia can be associated with the oxidation Cu(I) → Cu(II) + 1e; for the [CuII(dmen)2(NO3)2] complex at 0.1 Vs.−1, E1/2 was calculated to be −0.32 V vs. Ag|AgCl.

2.2.3. Chronoamperometry

The diffusion coefficient (Do) was calculated using simple pulse chronoamperometry by applying a potential value of −0.5 V vs. Ag|AgCl, with a perturbation time of 60 s; see Figure S8a. The linear relationship of i vs. t−1/2 indicated that the process obeys the Cottrell law (Equation (1)), Figure S8b, with the equation i(t) = −0.01004t−1/2 − 2.941 × 10⁻⁴, where r = 0.99836. From the slope, the diffusion coefficient Do was calculated to be 5.36 × 10⁻⁶ cm2s−1.
i t = i d t = nFA D o 1 2 C 0 π 1 2   t 1 2

2.2.4. Proposed Mechanism

As demonstrated above, spectroelectrochemical experiments and cyclic voltammetry signals Ic and Ia are related to the redox couple Cu(II)|Cu(I), with a coupled chemical reaction. Meanwhile, the oxidation process IIa and the pre-wave signal for adsorbed spices are related to the oxidation of Cu(I) species generated in the redox process Ic. Considering the previously mentioned evidence and the similarity of voltametric profile obtained in this study with that reported for the ECE-DISP mechanism [31,32,33], the following mechanism is proposed.
[CuII(dmen)2H2O]2+ + e ↔ [CuI(dmen)2H2O] +  I     E
[CuI(dmen)2 H2O] + ⟶ [CuI(dmen)2]+ + H2O      C
[CuI(dmen)2]+ ↔ [CuII(dmen)2]2+ + e    Ia    E
[CuI(dmen)2 H2O]+ + [CuII(dmen)2]2+ ⟶[CuII(dmen)2 H2O]2+ + [CuI(dmen)2]+  DISP
[CuI(dmen)2 H2O]+ (ads) ⟶[CuII(dmen)2 H2O]2+ + e  I*

2.3. Electrochemical Characterization of Cu-1,10-Phen Complex

Cyclic Voltammetry for bis(1,10-phen)Cu complex

To understand the effect of aliphatic amines on the electrochemical reduction of O2, a comparison with the complex [CuII(1,10-phen)2NO3]NO3 is presented. Cyclic voltammetry at 0.1 V seg−1 initiated from open-circuit potential in the negative direction of this complex is presented in Figure S9a, where one reduction signal Ic with an Epc = 0.007 V vs. Ag|AgCl and one oxidation signal Ia with an Epa = 0.123 V vs. Ag|AgCl can be observed, with a difference between peak potentials (ΔEp) of 116 mV. The fine shape of the wave and the value of Ep/2 = 14.7 mV for Ic indicate that the process has a contribution from adsorbed species at the electrode surface. Cyclic voltammograms at different scan rates in normalized representation (i/ν1/2) voltammetry, as seen in Figure S9b, show that the normalized peak current and peak potential values for Ic for Ia do not converge, confirming the contribution of adsorbed species in both processes. According to the literature and considering the mentioned results, the signals Ic and Ia can be associated with the redox process [CuII(1,10-phen)2NO3]+(ads) + e ↔ [CuI(1,10-phen)2NO3] (ads) [34,35].

2.4. Electrochemical Studies in Presence of O2

2.4.1. Cyclic Voltammetry in Presence of O2

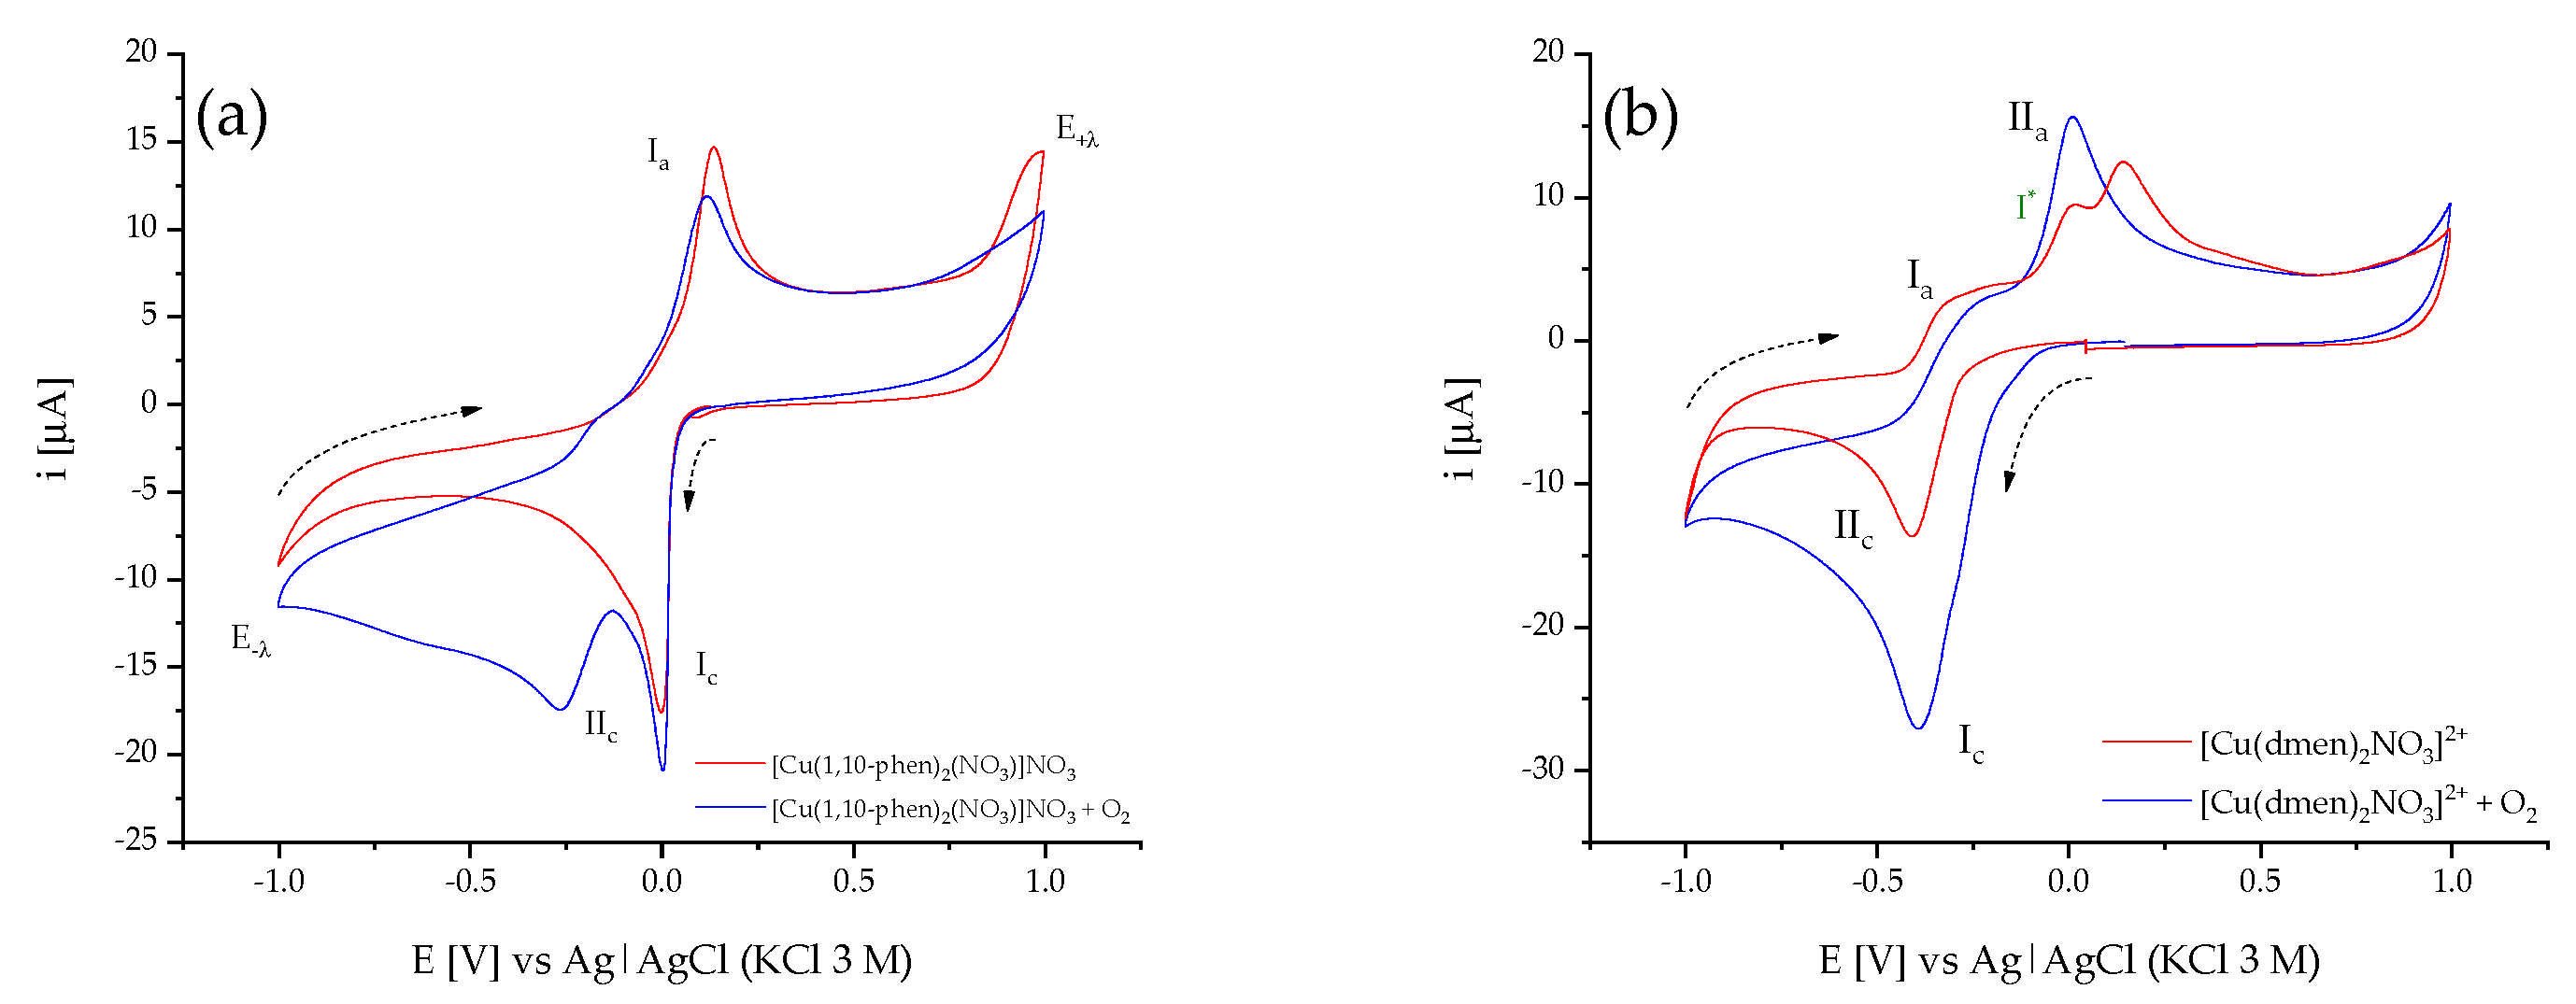
Figure 5a shows the electrochemical response of O2 in the presence of 0.1 M KNO3 (black line), where one irreversible reduction signal IIIc with an Epc = −0.655 V vs. Ag|AgCl and an Ep/2 = 184 mV, associated with the redox process O2 + 4H++ 4e ⟶ 2H2O, was observed. In the same figure, the electrochemical response of the complex [CuII(dmen)2(NO3)2] in the absence (red line) and in the presence of molecular oxygen (blue line) is presented. It is observed that, when oxygen is present in a solution (blue line), the signal IIc is not detected, and the signal Ic shows an increase in its current value, with an Epc = −0.390 V vs. Ag|AgCl, related to the electrochemical reduction in Cu(II) to Cu(I), which is shifted by 10 mV toward a positive value in comparison to when oxygen is absent. These changes are associated with a typical molecular catalysis that occurs during O2 reduction, where the electrogenerated Cu(I) species acts as a redox mediator, which reduces the O2 molecule with a homogeneous electron transfer mechanism. When the experiments were carried out at a variable scan rate (Figure 5b), the signal Ia did not show an increase in its normalized current value, and the potential values of signal IIa were shifted toward more positive values when the scan rate was increased, which is typically observed in a coupled chemical reaction. Moreover, in the presence of oxygen, the signal I* is not detected at any scan rate. The inversion potential analysis confirms the dependencies of signals Ic and IIa; see Figure S10. For all the other bis(dmen)Cu complexes, similar responses were recorded; see Figure S11.
In the case of the complex [CuII(1,10-phen)2NO3]NO3, a signal for O2 reduction is not observed at −0.62 V vs. Ag|AgCl (IIIc) (Figure S12a). For the process Ic, a low increase in current is recorded, which is associated with the low molecular catalysis of oxygen reduction at the surface electrode, due to the already mentioned adsorption process (Figure 6a). A new signal is recorded at −0.26 V vs. Ag|AgCl for the desorption processes of Cu(II) complexes promoted by oxygen and can be attributed to the molecular catalysis of O2 reduction in the solution (Figure 6a).
Experiments at a variable scan rate, as seen in Figure S12b, show changes in potential peaks of signals Ic and IIc to negative values and a low increase in normalized current (i/v1/2) when the scan rate is increased and recorded. For the signal Ic, a shift toward positive values is observed when the scan rate is increased. A comparison of electrochemical responses of [CuII(dmen)2(NO3)2] and [CuII(1,10-phen)2NO3]NO3, as seen in Figure 6a,b, indicates a higher performance for oxygen reduction for the complex [CuII(dmen)2(NO3)2], due to the presence of 1,10-phenanthroline in [CuII(1,10-phen)2NO3]NO3 that promotes the adsorption of the complex at the electrode surface, decreasing its ability to carry out the molecular catalysis of oxygen reduction.

2.4.2. Spectroelectrochemical in Presence of O2

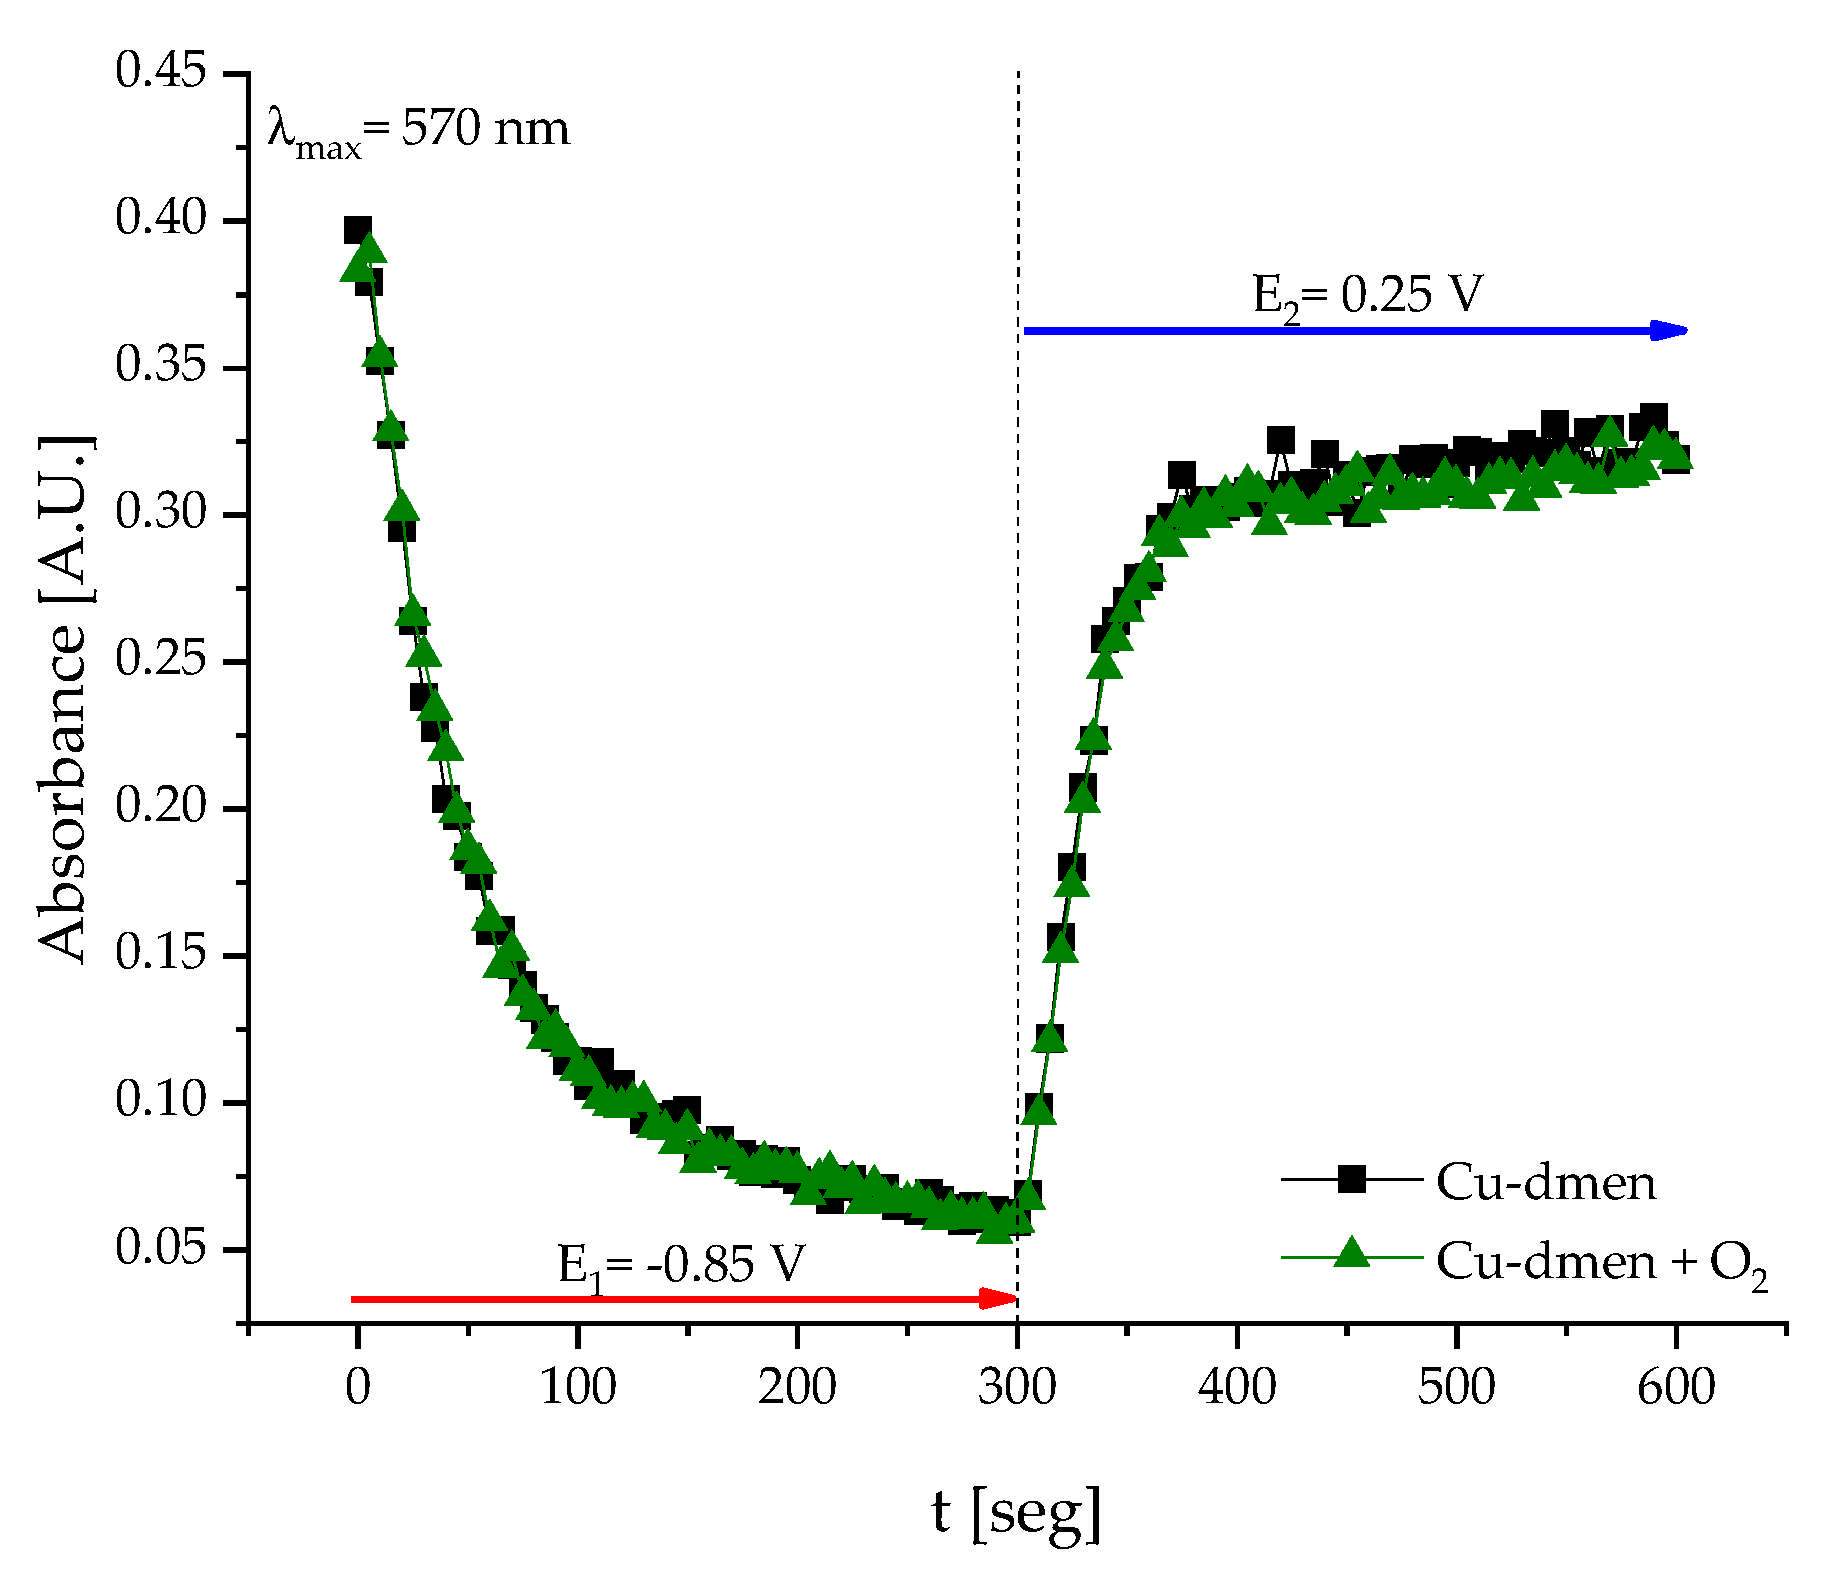
Due to the adsorption of the [CuII(1,10-phen)2(NO3)]NO3 complex on the electrode surface, only electronic absorption behavior during the ORR for the bis(dmen)Cu complex was explored with UV–vis spectroelectrochemical characterization, using a 1.5 × 10⁻² M solution of the complex [CuII(dmen)2(NO3)2] in 0.1 KNO3 in the presence of O2. Imposing a first potential E1 = −0.85 V vs. Ag|AgCl in the first 5 min and, immediately, a second pulse E2 = 0.25 V vs. Ag|AgCl, also for 5 min, spectra were acquired simultaneously every 3 seg (Figure S13). In the absence of O2, before imposing any pulse potential, Cu complexes exhibit a well-defined absorbance band at 570 nm associated with a d→d electronic transition, corresponding to Cu+2; in the presence of O2, the absorbance band remains at 570 nm, indicating a higher cathodic potential of Epc; no intermediated species are formed. Figure 7 displays Abs vs. t at a fixed wavelength of 570 nm, both in the absence and presence of O2 at E1 = −0.85 V vs. Ag|AgCl; see only the redox reaction involving the consumption of Cu2+ to Cu+. The same UV–vis spectroelectrochemical response obtained with and without O2 indicated a direct electron transfer from Cu(II) to Cu(I) and the regeneration of catalyst without any intermediate species.

2.4.3. Proposed Mechanism for O2 Reduction

For bis(dmen)Cu complexes, the following mechanism is proposed, which is similar to that presented in the absence of oxygen, except the adsorption process and the molecular catalysis ECi’.
[CuII(dmen)2H2O]2+ + e ↔ [CuI(dmen)2 H2O]+        E
O2 + 4H+ + 4[CuI(dmen)2 H2O]+⟶ 4[CuII(dmen)2 H2O]2+ + 2H2O    Ci
Meanwhile, for the bis(1,10-phen)Cu complex, the following mechanism is proposed.
[CuII(1,10-phen)2NO3]+(ads) + e ↔ [CuI(1,10-phen)2NO3] (ads)      Ic
O2 + 4H+ + [CuI(1,10-phen)2NO3] (ads) ⟶ 4[CuII(1,10-phen)2NO3] (ads) + 2H2O     Ci
[CuII(1,10-phen)2NO3]+ + e ↔[CuI(1,10-phen)2NO3]      IIc
O2 + 4H+ + 4[CuII(1,10-phen)2NO3] ⟶ 4[CuI(1,10-phen)2NO3]+ + H2O    Ci’’
Based on the above discussion, it can be proposed that the presence of aromatic system in the 1,10-phenanthroline ligand promotes the adsorption of molecular catalysts, decreasing the electrocatalytic activity.

2.4.4. Foot of the Wave Analysis (FOWA) for O2 Reduction

Considering a 4e mechanism for O2 reduction using the CV response of the complex [Cu(dmen)2(NO3)2] in the presence of molecular oxygen, a FOWA was carried out to calculate the homogenous electron transfer rate constant kobs, using the following equation [36]:
i c i p = 2.24 n R T k o b s F ν 1 + ε 1
where ic and ip are the catalytic current and the diffusion current, respectively; the term ε 1 = e x p [ R R T E E 1 2 ] contains the half-wave potential E1/2 for the catalytic wave; and n refers to the number of transferred electrons. According to the above reaction, the kobs = TOF value of the 4e reduction in dioxygen was calculated from the slope m = 2.24n R T k o b s F ν of the plot ic/ip,red vs. 1/(1 + ε1) (see Figures S14–S16), where capacitance contribution does not compromise analysis [37]. Hence, linear regression in the range of 10−5 < 1/1 + ε1 < 0.001 was used. The resulting values for the 4e reduction of O2 to H2O mediated by [Cu(dmen)2(CH3COO)2]2+, [Cu(dmen)2(NO3)2] 2+, and [Cu(dmen)2Cl2] 2+ at 0.1 V Vs.−1 were 4.84 × 10³ s−1, 1.36 × 10⁴ s−1, and 5.39 × 10³ s−1, respectively.
Table 1 shows parameters of Cu(II) complexes related to the molecular catalysis in the ORR, including other examples taken from the literature. It can be observed that E1/2 is an indicator of the viability of a mediator to catalyze the oxygen reduction reaction; the smaller the overpotential of E1/2, the more feasible it is to carry out the 4e reduction of O2 to H2O. The bis(dmen)Cu complexes reported in this study showed the lowest value of E1/2 for the oxygen reduction reaction (Table 1). The fact that catalytic data for some Cu complexes listed in Table 1 are not reported makes it difficult to compare with the studied systems. Furthermore, it is expected that both the ligands pyridylalkylamine and alkyl amines in the copper complexes favor a flexible pentacoordinate geometry, which facilitates the interaction between O2 and the Cu center, thus improving the electron transfer. However, in the case of the N,N-dimethylethylenediamine complexes, the presence of ECE and disproportion reactions compete with redox mediation, decreasing the TOF value of catalysis. The dmen ligand is an inexpensive and available option for molecular catalysis in the ORR, in contrast to more sophisticated tetradentate ligands such as tmpa or tpmen, making the complexes more accessible and economically viable for large-scale catalytic applications. Although tmpa and tpmen complexes achieve higher intrinsic turnover frequencies, the bis(dmen)Cu systems reported in this study combine reasonable activity with ease of synthesis, operational robustness in simple aqueous media, and compatibility with low-cost electrodes. These features position them as attractive candidates for scalable oxygen reduction electrocatalysis.

2.5. Chronoamperometry in Presence of O2

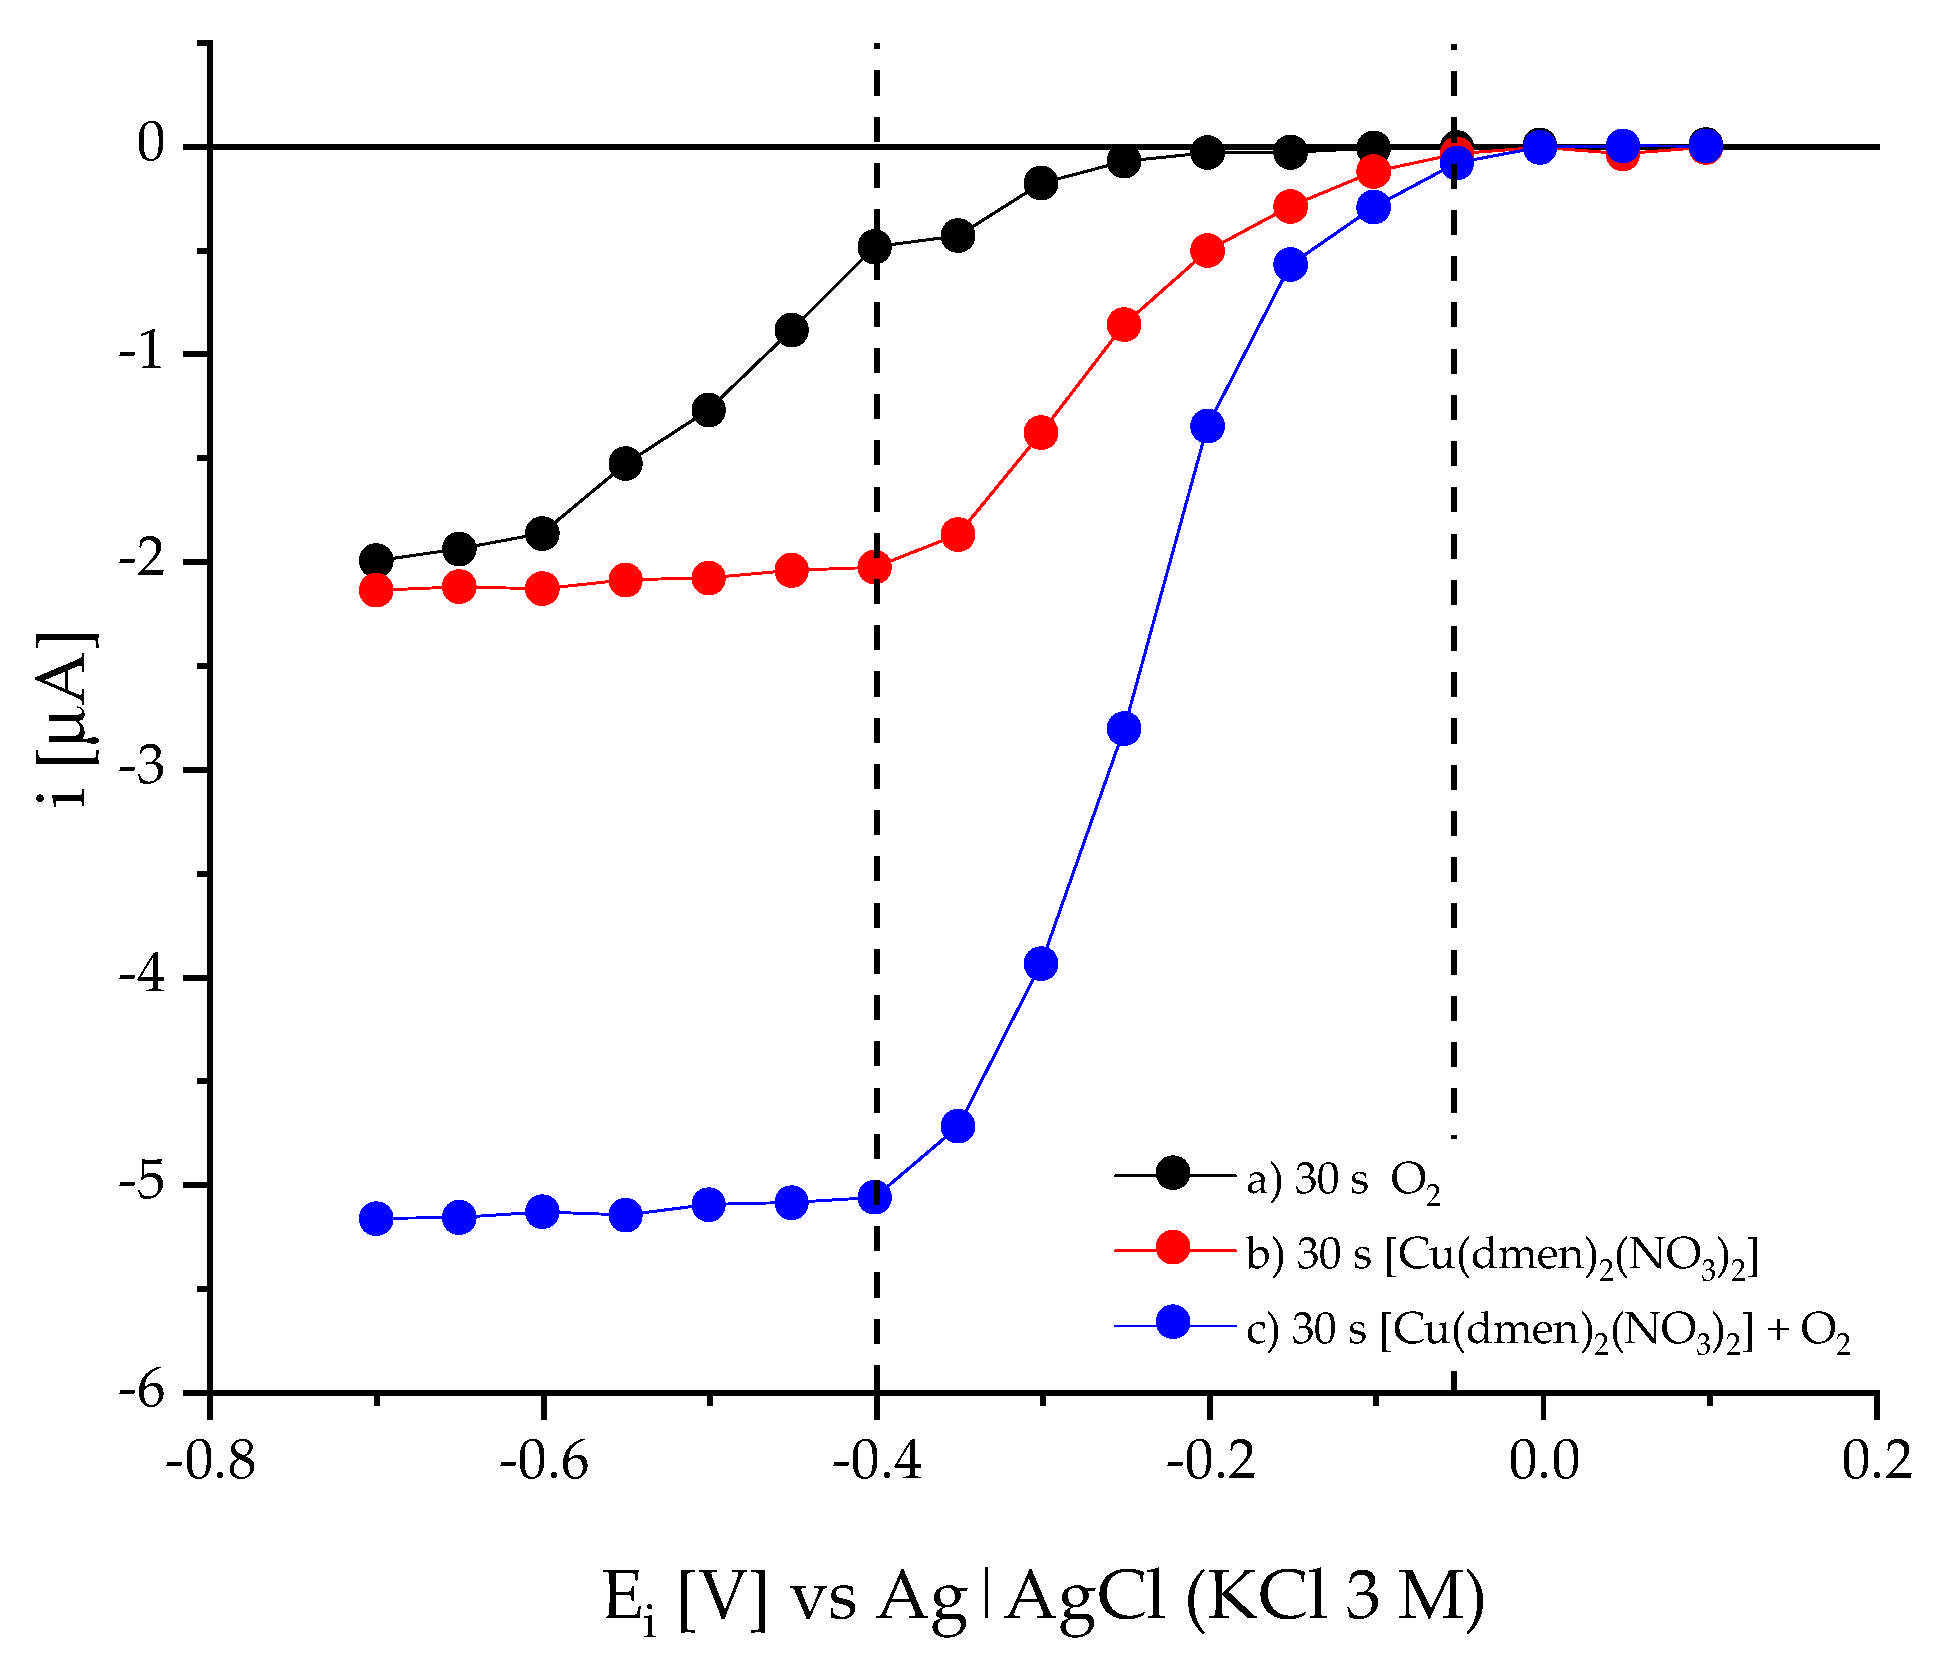
To establish the changes in potential when oxygen reduction takes places in the redox mediation by copper complexes, current-sampled versus potential plots I(t)–E were constructed from single-step chronoamperometric experiments at different potentials. Figure 8a shows a typical I(t)–E graph for oxygen in a 0.1 KNO3 solution, where the broad shape of the wave from 0.5 to −0.5 V vs. Ag|AgCl with a E1/2 =−0.44 V vs. Ag|AgCl indicates slow electrode kinetics for oxygen reduction. A plateau current with a value close to 1.9 µA was detected from −0.6 V vs. Ag|AgCl, which indicates that the current is limited by the mass transport from this potential value. In the case where the compound [Cu(dmen)2(NO3)2] is in a 0.1 KNO3 solution, as seen in Figure 8b, the I(t)–E(t) profile indicates a fast electrode kinetic process with a E1/2 = −0.32 V vs. Ag|AgCl and a current plateau of 2.0 µA, recorded from −0.4 V vs. Ag|AgCl. When [Cu(dmen)2(NO3)2] and oxygen are in a solution (see Figure 8c), a reversible wave is observed with a E1/2 = −0.24 vs. Ag|AgCl and a limited current of −5.0 µA from −0.4 V vs. Ag|AgCl. A comparison of Figure 8a,c indicates a diminution of 0.2 V and an increase of 3.0 µA in the limited current for oxygen reduction in the presence of the complex [Cu(dmen)2(NO3)2], and this can be used as a criterion to assess whether this electrochemical measurement is improved in a time window larger than that used in cyclic voltammetry.

2.6. Electrochemical Impedance Spectroscopy Studies

The electrode–electrolyte interface phenomena of mononuclear Cu(II) complexes were studied using EIS in the absence and presence of O2 to identify parameters related to the ORR. Experiments were carried out at a more cathodic potential than the Epc for the reduction in complexes, EDC = −0.5 V vs. Ag|AgCl, with a frequency range from 1.2 kHz to 1 Hz.
Characteristic Nyquist diagram and Bode-module and Bode-phase representations are shown in Figure 9a–c. All spectra were fitted in the equivalent circuit (EC) inset in Figure 8a. Instead of an ideal capacitance, a constant phase element (CPE, Q1) was used to compensate surface roughness and other surface inhomogeneities, using the expression Z = [Y(jω)n]−1 where n ≈ 1 [40]. For the diffusional phenomenon, a constant phase element (CPE, Q2) with the same expression and n ≈ 0.5 was considered [41,42]. R1 and R2 correspond to solution resistance (Rs) and charge-transfer resistance (Rct), respectively (see SM, Table S3).
In the Nyquist representation, in the absence of O2, semicircles are not well-defined in comparison to those in experiments where O2 is present (Figure 9a). In both conditions, the Bode-module representation (Figure 9b) showed a charge-transfer reaction (at frequencies from 1.2 kHz to 50 Hz) and diffuse behavior (at frequencies from 15 Hz to 1 Hz). On the other hand, the Bode-phase representation (Figure 9c), in a low-frequency system, tends to be 45°, corresponding to diffusional behavior. In the absence and presence of O2, Rct for [Cu(dmen)2(NO3)2] decreased from 36.391 kΩ to 5.54 kΩ. This decrease is attributed to the molecular catalysis of O2 reduction mediated by [CuI(dmen)2 H2O]+. The EIS results of the other Cu(II) complexes with the dmen ligand display their similar behavior, as well as those of the CV experiments. Hence, only the results of complex 2 are shown, and the rest can be found in SM, Figures S17 and S18.
Finally, the EIS response for the ORR with the [Cu(1,10-phen)2NO3]NO3 complex was also studied. It was different from that of Cu-dmen complexes in the absence of O2; the spectra of [Cu(1,10-phen)2NO3]NO3 in the Nyquist representation showed a well-defined semicircle; see SM Figure S19. Spectra were fitted to the same equivalent circuit; see the inset of Figure S20. However, the low values of Q1 in comparison to those obtained with Cu(II) complexes can be associated with the adsorption processes [43,44]. In the absence and presence of O2, a small change in Rct from 2.51 kΩ to 2.38 kΩ could be related to the low molecular catalysis of O2 reduction.

3. Materials and Methods

3.1. Materials and Physical Measurements

All chemicals and solvents were purchased from the commercial source and used without further purification: N,N’-dimethylethylenediamine, dmen (95%, Sigma-Aldrich, St. Louis, MO, USA), Cu(CH3COO)2 H2O (98+%, Strem Chemicals, New Buryport, MA, USA), CuCl2 • 2 H2O (99.2%, J. T. Baker, Radnor, PA, USA), Cu(NO3)2 2.5 H2O (99.99%, Sigma-Aldrich, St.Louis, MO, USA), KNO3 (99.4%, Fermont, Moterrey, Mexico), KBr (>99%, Sigma-Aldrich, St.Louis, MO, USA), diethyl ether (water < 0.01%, J.T. Baker, Radnor, PA, USA), N,N’–dimethylformamide (99.95%, water < 0.05%, J. T. Baker, Radnor, PA, USA), and acetonitrile anhydrous (water < 0.001%, Sigma Aldrich, St. Louis, MO, USA).
The IR spectra were obtained using a Shimadzu FT-IR IRAffinity-1S spectrophotometer, in a range between 450 and 4000 cm−1 using KBr disks. UV–vis spectra were obtained with a Thermo Scientific Evolution Array Spectrophotometer with a spectral range of 200–1100 nm in water and in 0.1 M KNO3 aqueous solutions, using quartz cells with an optical path length of 1 cm. The solid-state UV–vis spectra were obtained using a Shimadzu 2600-UV–vis Spectrophotometer, in a range between 200 and 900 nm. Molar conductivity was measured using a Metrohm conductivity module, model 856, with a cell having a cell constant C = 0.613 cm−1.

3.2. Synthesis of Complexes

Synthesis of complex [Cu(dmen)2(CH3COO)2] H2O: A 1 mmol quantity of Cu(CH3COO)2 H2O (185 mg) was dissolved in 10 mL of MeCN. Then, 2 mmol of dmen (185 mg), dissolved in 10 mL of MeCN, was added to the copper solution. The resulting reaction mixture was stirred for 30 min at room temperature (25 °C), forming a purple precipitate, which was collected by filtration, washed with MeCN, and ground to obtain a dark purple powder. Characteristic IR bands (cm−1): 2872, 2968 ν(C-H)N-CH3; 2900 ν(C-N)R-N-CH3; 2851, 2954 ν(C-H)R-CH2-N; 2838, 2986 ν(C-H)R-CH2-NH2; 3096, 3191 ν(N-H)R-CH2-NH2; 1656 δ(NH2)R-CH2-NH2, 1464 δ(CH2), 1410, 1572 ν(COO); 2943 ν(C-H)CH3COO; 457, 494, 579 ν(Cu-N). UV–vis peaks in the aqueous solution λmáx/nm (ε/Lmol−1 cm−1): 264 (238), 329 (242), 575 (94). Conductivity measurement (⋀/Ω−1cm2 mol−1): 170.9. Mass spectrum data FAB (+) m/z: 273, [Cu(dmen)2(CH3COO)]+, m/z: 239, [Cu(dmen)2]+.
Synthesis of complex [Cu(dmen)2(NO3)2] H2O: A 2 mmol quantity of dmen (185 mg) and a 1 mmol quantity of Cu(NO3)2 •H2O (187 mg) were dissolved separately in 10 mL of MeCN. The ligand solution was added to the metallic salt solution. The resulting reaction mixture was stirred for 30 min at room temperature (25 °C) to obtain a purple precipitate. Then, the powder was washed with MeCN and ground. Crystals suitable for the X-ray analysis were obtained with the diethyl ether diffusion method using a mixture of DMF/MeOH. Characteristic IR bands (cm−1): 2873, 2969 ν(C-H)N-CH3; 2900 ν(C-N)R-N-CH3; 2857, 2988 ν(C-H)R-CH2-N; 2839, 2954 ν(C-H)R-CH2-NH2; 3097, 3193 ν(N-H)R-CH2-NH2; 1640 δ(NH2)R-CH2-NH2, 1460 δ(CH2), 1414, 1313 ν(NO2)NO3; 458, 505, 572 ν(Cu-N). UV–vis peaks in the aqueous solution λmáx/nm (ε/Lmol−1 cm−1): 268 (241.63), 330 (245.53), 575 (100.01). Conductivity measurement (⋀/Ω−1cm2 mol−1): 259.7. Mass spectrum data FAB (+) m/z: 301, [Cu(dmen)2(NO3)]+, m/z: 239, [Cu(dmen)2]+.
Synthesis of complex [Cu(dmen)2Cl2] H2O: A 2 mmol quantity of the ligand dmen (185 mg) dissolved in MeCN was added to 1 mmol CuCl2 • 2H2O (170 mg) previously dissolved in 10 mL of MeCN. The reaction mixture was stirred for 30 min at room temperature (25 °C), forming a blue precipitate, which was collected by filtration, washed with MeCN, and ground into a dark blue powder. Characteristic IR bands (cm−1): 2874, 2971 ν(C-H)N-CH3; 2899 ν(C-N)R-N-CH3; 2841, 2988 ν(C-H)R-CH2-N; 2801, 2955 ν(C-H)R-CH2-NH2; 3094, 3188 ν(N-H)R-CH2-NH2; 1640 δ(NH2)R-CH2-NH2, 1465 δ(CH2); 403 ν(M-Cl); 458, 492, 584 ν(Cu-N). UV–vis peaks in the aqueous solution λmáx/nm (ε/Lmol−1 cm−1): 269 (241.54), 330 (243.22), 575 (98.72). Conductivity measurement (⋀/Ω−1cm2 mol−1): 271.3. FAB mass spectrum (+) m/z: 274, [Cu(dmen)2(Cl)]+, m/z: 239, [Cu(dmen)2]+.
Synthesis of the complexes [Cu(1,10-phen)2NO3]NO3·H2O: The synthesis of this metal complex was carried out by dissolving 0.1 mmol of Cu(NO3)2·2.5 H2O in 5 mL of anhydrous ethanol. Then, this solution was added dropwise to the metallic salt solution of 0.2 mmol of the ligand 1,10-phenanthroline, previously dissolved in 5 mL of anhydrous ethanol. The ligand solution was heated at 70 C for complete dissolution; a change from blue to green was observed. The reaction mixture was heated and stirred for 2 h. Solvent was removed by slow evaporation until a powder was observed. The product was filtered and washed with diethyl ether. Characteristic IR bands (cm−1): 1627, 1520, ν(C=C) + ν(C=N); 3057ν(=C-H); 1605, 1586, 1493, ν(C=C)ring; 1315 νs(N=O); 1330 νa(NO2); 1383 NO3 ionic, ν(Cu-N) 431, ν(Cu-O) 4010. Anal. Calc. for CuC24H18N6O7 (MW = 565 g/mol) %C, 50.9; %H, 3.2; %N, 14.8. Found: %C, 50.9; %H, 3.6; %N, 15.0. Mass spectrum FAB(+) m/z = 485, [Cu(1,10-phen)2NO3]+, m/z = 423 [Cu(1,10-phen)2]+.

3.3. Single-Crystal XRD Analysis

A single crystal of [Cu(dmen)2(NO3)2] was mounted on a glass fiber and analyzed using an Oxford Diffraction Gemini “A” diffractometer, equipped with a charge-coupled device area detector, an X-ray tube (λMoKα = 0.71073 Å), and a graphite monochromator. The software packages CrysAlis PRO and CrysAlis RED version 171.44 were used for data collection and integration. The data were corrected for absorbance using an analytical numerical correction [45]. Structure solution and refinement were carried out using the software Olex2 [46]. Graphics were obtained using the software Mercury 4.0 and Olex2 [47]. Full-matrix least-squares refinement was performed by minimizing (Fo2Fc2)2. All non-hydrogen atoms were refined anisotropically. Hydrogen atoms of the water molecules (H–O) were located with a difference map and refined isotropically with Uiso(H) = 1.5 for H–O. H atoms attached to C atoms were placed in geometrically idealized positions, with C–H = 0.95 and 0.98 Å and Uiso(H) = 1.2Ueq(C) and 1.5Ueq(C) for aromatic and methyl groups, respectively. The crystal data and experimental details of the structural determinations are listed in Tables S1 and S2 of Supplementary Materials. Crystallographic data have been deposited in the Cambridge Crystallographic Data Center (CCDC) with supplementary material number CCDC 125785. Copies of the data can be obtained free of charge upon application to CCDC: 12 Union Road, Cambridge CB2 1EZ, UK (email: deposit@ccdc.cam.ac.uk).

3.4. Electrochemical Experiments

Electrochemical measurements were carried out with a Biologic SP-300 potentiostat/galvanostat using the software EC-Lab® V11.02. A typical three-electrode array was used with a glassy carbon electrode (Ø = 3 mm), a Pt wire, and an Ag|AgCl electrode (KCl 3 M), as the working, counter, and reference electrodes, respectively. All experiments were carried out in the presence of 0.1 M KNO3 in an aqueous solution as the supporting electrolyte. The working electrode was manually polished with an alumina suspension (0.3 μm), sonicated for 90 s, and rinsed with deionized water. Before each measurement, the solution was bubbled for 5 min and maintained under a nitrogen atmosphere during the experiment. Ohmic drop (IR) was corrected by positive feedback compensation. Cyclic voltammetry experiments were started for open-circuit potential (Eoc) in the negative direction at different scans rates from 100 to 1000 mVs.−1. One-step chronoamperometric experiments were carried out imposing pre-polarization at open-circuit potential for 20 s, followed by first-step potential at different values more negative than Eoc for 60 s. Electrochemical impedance spectroscopy experiments were acquired using a direct potential value more cathodic than the Epc for the reduction in complexes with a stabilization time of 5 min and applying a sinusoidal perturbation EAC = 10 mV with a frequency range from 100 kHz to 1 Hz and 10 points per decade.

3.5. Spectroelectrochemical Studies

Spectro electrochemical experiments were performed with a BioLogic SP-300 potentiostat/galvanostat coupled to a diode array UV–vis spectrophotometer (Thermo-Scientific-Evolutions Array). A Pine commercial platinum honeycomb spectroelectrochemical cell with a Ag|AgCl(KCl 3M) reference electrode was used. The concentration of the complexes was 1.5 × 10⁻² M in the presence of 0.1 M KNO3 in an aqueous solution. Spectra were acquired every 10 sec, and simultaneously, a double-potential-step chronoamperometry sequence was imposed (E1: −0.85 V vs. Ag|AgCl and E2: 0.25 V vs. Ag|AgCl (KCl 3 M and t1 = t2 = 5 min)).

4. Conclusions

Mononuclear CuII complexes containing the dmen ligand used to catalyze the oxygen reduction reaction are no longer studied due to the slow electronic transfer interaction between the Cu(II) center and O2 during the reduction reaction, compared to other Cu(II) complexes with pyridylalkylamine ligands. However, we verified the viability of bis(dmen)Cu complexes as ORR catalysts, specifically [Cu(dmen)2(NO3)2] with a TOF = 1.36 × 10⁴ s−1; although they were not as efficient as the complex [Cu(tmpa)(L)]2+ with a TOF = 1.8 × 10⁶ s−1, their efficiency is comparable to that of other complexes with pyridylalkylamine ligands such as [Cu(tpmen)(ClO4)2] with a TOF = 6.4 × 10³ s−1.
More research needs to be conducted in the future on Cu(II) complexes with these types of ligands as oxygen reduction catalysts for increasing their catalytic capability and defining their limits. We also believe that this study can bring into focus a long-abandoned area of research and expand it.

Supplementary Materials

The following Supporting Information can be downloaded at: https://www.mdpi.com/article/10.3390/catal15100951/s1. Figure S1. IR spectra in ATR mode of [Cu(dmen)2(CH3COO)2] H2O, [Cu(dmen)2(NO3)2] H2O, and [Cu(dmen)2Cl2] H2O complexes. Figure S2. Mass spectrum of complex [Cu(dmen)2(CH3COO)2] H2O. Figure S3. Mass spectrum of complex [Cu(dmen)2(NO3)2]. Figure S4. Mass spectrum of complex [Cu(dmen)2Cl2]. Figure S5. Electronic spectra of mononuclear Cu(II) complexes in aqueous solution + KNO3 0.1 M. Figure S6. Cyclic voltammograms of 1 × 10⁻³ M solution of mononuclear Cu(II) complexes in negative direction at scan rate 0.1 V seg−1. Electrolyte = H2O + KNO3 0.1 M; Ew = glassy carbon. Figure S7. Cyclic voltammograms of 1 × 10⁻³ M solution in normalized current representation (i/ν1/2) of complexes: (a) [Cu(dmen)2(CH3COO)2] H2O and (b) [Cu(dmen)2Cl2] H2O in negative direction at scan rate from 0.1 to 1 V seg−1. Electrolyte = H2O + KNO3 0.1 M; EW = glassy carbon. Figure S8. One-step chronoamperometry of 1 × 10⁻³ M solution of [Cu(dmen)2(NO3)2]: (a) I vs. t plot and (b) i vs. t−1/2 plot. Electrolyte = H2O + KNO3 0.1 M; EW = glassy carbon; Ei = −0.5 V vs. Ag|AgCl; τ = 60 s. Figure S9. Cyclic voltammetry of 1 × 10⁻³ M solution of complex [Cu(1,10-phen)2NO3]NO3 in negative direction at (a) scan rate of 0.1 V seg−1 and (b) normalized representation (i/ν1/2) at scan rate from 0.1 to 1 V seg−1. Electrolyte = H2O + KNO3 0.1 M; EW = glassy carbon. Figure S10. Inversion potential analysis of 1 × 10⁻³ M solution of complex [Cu(dmen)2(NO3)2] in negative direction at scan rate 0.1 V seg−1 in presence of O2. Electrolyte= H2O + KNO3 0.1 M; EW = glassy carbon. Figure S11. Cyclic voltammograms of 1 × 10⁻³ M solution of complexes [Cu(dmen)2(CH3COO)2] H2O, [Cu(dmen)2(NO3)2] H2O, and [Cu(dmen)2Cl2] H2O in presence of O2 in negative direction at scan rate 0.1 V seg−1. Electrolyte = H2O + KNO3 0.1 M; EW = glassy carbon. Figure S12. Cyclic voltammograms of 1 × 10⁻³ M solution of complex [Cu(1,10-phen)2NO3]NO3 + O2 in negative direction at (a) scan rate 0.1 V seg−1 and (b) normalized representation (i/ν1/2) at scan rate from 0.1 to 1 V seg−1. Electrolyte = H2O + KNO3 0.1 M; EW = glassy carbon. Figure S13. UV–vis spectroelectrochemical response of 1.5 × 10⁻² M solution of complex [Cu(dmen)2(NO3)2]: a) E1 = −0.85 V vs. Ag|AgCl, inset chronoamperometric plot, and b) E2 = 0.25 V vs. Ag|AgCl, inset chronoamperometric plot. Electrolyte = H2O + KNO3 0.1 M; EW= commercial Pt honeycomb, spectra acquired each 5 seg for 10 min. Figure S14. ORR FOWA plot of 1 × 10⁻³ M solution of complex [Cu(dmen)2(CH3COO)2]: (a) adjusted plot to Eq. (4) and (b) linearly adjusted plot to −0.142–−0.159 V potential. Cyclic voltammetry performed in negative direction; electrolyte = H2O + KNO3 0.1 M; Ew = glassy carbon; ν = 0.1 V seg−1. Figure S15. ORR FOWA plot of 1 × 10⁻³ M solution of complex [Cu(dmen)2(NO3)2]: (a) adjusted plot to Eq. (4) and (b) linearly adjusted plot to −0.142–−0.159 V potential. Cyclic voltammetry performed in negative direction; electrolyte = H2O + KNO3 0.1 M; Ew = glassy carbon; ν = 0.1 V seg−1. Figure S16. ORR FOWA plot of 1 × 10⁻³ M solution of complex [Cu(dmen)2Cl2]: (a) adjusted plot to Eq. (4) and (b) linearly adjusted plot to −0.142–−0.159 V potential. Cyclic voltammetry performed in negative direction; electrolyte = H2O + KNO3 0.1 M; Ew = glassy carbon; ν = 0.1 V seg−1. Figure S17. EIS spectra of 1 × 10⁻³ M solution of complex [Cu(dmen)2(CH3COO)2] in absence and presence of O2: (a) Nyquist, (b) Bode-module, and (c) Bode-phase diagrams. Electrolyte = H2O + KNO3 0.1 M; Ew: glassy carbon; EDC: −0.55 V; EAC: 10 mV; nd: 10, 100 kHz–1 Hz. Figure S18. EIS spectra of 1 × 10⁻³ M solution of complex [Cu(dmen)2Cl2] in absence and presence of O2: (a) Nyquist, (b) Bode-module, and (c) Bode-phase diagrams. Electrolyte = H2O + KNO3 0.1 M; Ew: glassy carbon; EDC: −0.5 V; EAC: 10 mV; nd: 10, 100 kHz–1 Hz. Figure S19. EIS spectra of 1 × 10⁻³ M solution of complex [Cu(1,10-phen)2(NO3)]NO3 in absence and presence of O2: (a) Nyquist, (b) Bode-module, and (c) Bode-phase diagrams. Electrolyte = H2O + KNO3 0.1 M; Ew: glassy carbon; EDC: −0.05 V; EAC: 10 mV; nd: 10, 100 kHz–1 Hz. Table S1. Crystal and structure refinement data of [Cu(dmen)2(NO3)2] complex. Table S2. Selected bond lengths (Å) and angles (deg) for [Cu(dmen)2(NO3)2]. Table S3. Fitted parameter of Cu(II) mononuclear complexes. Electrolyte: H2O + KNO3 0.1 M; Ew: glassy carbon.

Author Contributions

Conceptualization, L.O.-F.; methodology, O.M.Z.; software, A.M., J.P.F.R.-C. and L.O.-F.; validation, M.C.-R. and L.G.R.-P.; formal analysis, O.M.Z. and L.O.-F.; investigation, O.M.Z.; resources, L.O.-F.; data curation, O.M.Z. and L.O.-F.; writing—original draft preparation, O.M.Z. and L.O.-F.; writing—review and editing, O.M.Z.; visualization, A.M., J.P.F.R.-C., M.C.-R. and L.G.R.-P.; supervision, L.O.-F.; project administration, L.O.-F.; funding acquisition, L.O.-F. All authors have read and agreed to the published version of the manuscript.

Funding

This research was funded by “Secretaria de Ciencia Humanidades Tecnología e Innovación, SECIHTI” “Ciencia Básica y de Frontera 2023–2024”, Grant number CBF2023-2024-3108.

Data Availability Statement

Data are available in the Supplementary Materials File.

Acknowledgments

O.M.Z. expresses gratitude to SECIHTI (Ministry of Science, Humanities, Technology and Innovation) for the scholarship awarded during his doctoral studies.

Conflicts of Interest

The authors declare no conflicts of interest.

Abbreviations

The following abbreviations are used in this manuscript:
EwWorking electrode
EDCDirect-current potential
EACAlternate-current potential
EpcCathodic peak potential
EpaAnodic peak potential
CPEConstant phase element
ΝScan rate
ΤPerturbation time
ORROxygen reduction reaction
FOWAFoot of the wave analysis

References

  1. Sueyoshi, T.; Mo, F.; Wang, D.D. Sustainable development of countries all over the world and the impact of renewable energy. Renew. Energy 2022, 184, 320–331. [Google Scholar] [CrossRef]
  2. Yua, X.-Z.; Wang, H. PEM Fuel Cell Fundamentals. In PEM Fuel Cell Electrocatalysts and Catalyst Layers, 1st ed.; Zhang, J., Ed.; Springer: Vancouver, BC, Canada, 2008; pp. 1–88. [Google Scholar]
  3. Gewirth, A.A.; Varnell, J.A.; DiAscro, A.M. Nonprecious Metal Catalysts for Oxygen Reduction in Heterogeneous Aqueous Systems. Chem. Rev. 2018, 118, 2313–2339. [Google Scholar] [CrossRef] [PubMed]
  4. Thorseth, M.A.; Tornow, C.E.; Tse, E.C.; Gewirth, A.A. Cu complexes that catalyze the oxygen reduction reaction. Cord. Chem. Rev. 2013, 257, 130–139. [Google Scholar] [CrossRef]
  5. Zagal, J.H.; Koper, M.T.M. Reactivity Descriptors for the Activity of Molecular MN4 Catalysts for the Oxygen Reduction Reaction. Angew. Chem. Int. Ed. Engl. 2016, 55, 14510–14521. [Google Scholar] [CrossRef]
  6. Fu, S.; Zhu, C.; Song, J.; Du, D.; Lin, Y. Metal-Organic Framework-Derived Non-Precious Metal Nanocatalysts for Oxygen Reduction Reaction. Adv. Energy Mater. 2017, 7, 1700363. [Google Scholar] [CrossRef]
  7. Gewirth, A.A.; Thorum, M.S. Electroreduction of Dioxygen for Fuel-Cell Applications: Materials and Challenges. Inorg. Chem. 2010, 49, 3557–3566. [Google Scholar] [CrossRef]
  8. Zhu, R.; Qin, Y.; Wu, T.; Ding, S.; Su, Y. Insights into local coordination environment of main group metal-nitrogen-carbon catalysts for enhanced oxygen reduction reaction. Appl. Surf. Sci. 2023, 631, 157581. [Google Scholar] [CrossRef]
  9. Zhao, Y.; Yu, G.; Wang, F.; Wei, P.; Liu, J. Bioinspired Transition-Metal Complexes as Electrocatalysts for the Oxygen Reduction Reaction. Chem. A Eur. J. 2019, 25, 3726–3739. [Google Scholar] [CrossRef]
  10. Muñoz-Becerra, K.; Zagal, J.H.; Venegas, R.; Recio, F.J. Strategies to improve the catalytic activity and stability of bioinspired Cu molecular catalysts for the ORR. Curr. Opin. Electrochem. 2022, 35, 101035. [Google Scholar] [CrossRef]
  11. Mano, N.; Soukharev, V.; Heller, A. A Laccase-Wiring Redox Hydrogel for Efficient Catalysis of O2 Electroreduction. J. Phys. Chem. B 2006, 110, 11180–11187. [Google Scholar] [CrossRef]
  12. Schweiger, H.; Vayner, E.; Anderson, A.B. Why Is There Such a Small Overpotential for O[sub 2] Electroreduction by Copper Laccase? Electrochem. Soc. 2005, 8, 585–588. [Google Scholar] [CrossRef]
  13. SFukuzumi, S.; Karlin, K.D. Kinetics and thermodynamics of formation and electron-transfer reactions of Cu–O2 and Cu2–O2 complexes. Cord. Chem. Rev. 2013, 257, 187–195. [Google Scholar] [CrossRef]
  14. Lewis, E.A.; Tolman, W.B. Reactivity of Dioxygen−Copper Systems. Chem. Rev. 2004, 104, 1047–1076. [Google Scholar] [CrossRef]
  15. Yoshimoto, S.; Tada, A.; Suto, K.; Itaya, K. Adlayer Structures and Electrocatalytic Activity for O2 of Metallophthalocyanines on Au(111): In Situ Scanning Tunneling Microscopy Study. J. Phys. Chem. B 2003, 107, 5836–5843. [Google Scholar] [CrossRef]
  16. van der Ham, C.J.M.; Zwagerman, D.N.H.; Wu, L.; Hofmann, J.P.; Hetterscheid, D.G.H. A Heterogenized Copper Phenanthroline System to Catalyze the Oxygen Reduction Reaction. ChemElectroChem 2022, 9, e202101365. [Google Scholar] [CrossRef] [PubMed]
  17. McCrory, C.C.L.; Ottenwaelder, X.; Stack, T.D.P.; Chidsey, C.E.D. Kinetic and Mechanistic Studies of the Electrocatalytic Reduction of O2 to H2O with Mononuclear Cu Complexes of Substituted 1,10-Phenanthrolines. J. Phys. Chem. A 2007, 111, 12641–12650. [Google Scholar] [CrossRef] [PubMed]
  18. Langerman, M.; Hetterscheid, D.G.H. Fast Oxygen Reduction Catalyzed by a Copper(II) Tris(2-pyridylmethyl)amine Complex through a Stepwise Mechanism. Angew. Chem. Int. Ed. Engl. 2019, 58, 12974–12978. [Google Scholar] [CrossRef]
  19. Zhang, X.; Chen, G.-S.; Liu, H.-C.; Zhu, M.-J.; Xie, M.-Y.; Cen, M.-S.; Li, Q.-J.; Wang, T.-S.; Zhang, H.-X. Bidirectional O2 reduction/H2O oxidation boosted by a pentadentate pyridylalkylamine copper(II) complex. Electrochimica Acta 2023, 446, 142099. [Google Scholar] [CrossRef]
  20. He, F.; Mi, L.; Shen, Y.; Chen, X.; Yang, Y.; Mei, H.; Liu, S.; Mori, T.; Zhang, Y. Driving electrochemical oxygen reduction and hydrazine oxidation reaction by enzyme-inspired polymeric Cu(3,3′-diaminobenzidine) catalyst. J. Mater. Chem. A 2017, 5, 17413–17420. [Google Scholar] [CrossRef]
  21. Fukuzumi, S.; Kotani, H.; Lucas, H.R.; Doi, K.; Suenobu, T.; Peterson, R.L.; Karlin, K.D. Mononuclear Copper Complex-Catalyzed Four-Electron Reduction of Oxygen. J. Am. Chem. Soc. 2010, 132, 6874–6875. [Google Scholar] [CrossRef]
  22. Zhang, X.; Qin, Z.-L.; Peng, S.; Luo, Z.-L.; Che, Y.-T.; You, L.-Q.; Li, R.-R.; Zhang, H.-X. Catalytic oxygen reduction by pyridylalkylamine copper complexes bearing triazolylpyridines. Mol. Catal. 2024, 567, 114446. [Google Scholar] [CrossRef]
  23. Cai, C.X.; Xue, K.H.; Xu, X.Y.; Luo, Q.H. Electrocatalysis for the reduction of O2 and H2O2 based on complex of copper(II) with the tris(3-aminopropyl)amine and imidazole ligands. J. Appl. Electrochem. 1997, 27, 793–798. [Google Scholar] [CrossRef]
  24. Wang, M.; Xu, X.; Gao, J.; Jia, N.; Cheng, Y. Electrocatalytic reduction of O2 at pyrolytic graphite electrode modified by a novel copper(II) complex with 2-[bis(2-aminoethyl)amino]ethanol and imidazole ligands. Russ. J. Electrochem. 2006, 42, 878–881. [Google Scholar] [CrossRef]
  25. Fleming, G.; Shepherd, R. Infrared spectra and normal coordinate analysis of bis(ethylenediamine) and bis(trimethylenediamine) complexes with copper(II). Spectrochim. Acta Part A Mol. Spectrosc. 1987, 43, 1141–1146. [Google Scholar] [CrossRef]
  26. Pretshc, E.; Bühlmann, P.; Badertscher, M. Structure Determination of Organic Compounds, 4th ed.; Springer: Berlin/Heidelberg, 2009. [Google Scholar]
  27. Larkin, P.J. IR and Raman Spectra–Structure Correlations: Characteristic Group Frecuencies. In Infrared and Raman Spectroscopy, 2nd ed.; John Fedor: Stamford, CT, USA, 2018; pp. 85–134. [Google Scholar] [CrossRef]
  28. Nakamoto, K. Infrared and Raman Spectra of Inorganic and Coordinatio Compounds Part B, 6th ed.; Wiley: Hoboken, NJ, USA, 2009. [Google Scholar]
  29. Masternak, J.; Zienkiewicz-Machnik, M.; Łakomska, I.; Hodorowicz, M.; Kazimierczuk, K.; Nosek, M.; Majkowska-Młynarczyk, A.; Wietrzyk, J.; Barszcz, B. Synthesis and Structure of Novel Copper(II) Complexes with N,O- or N,N-Donors as Radical Scavengers and a Functional Model of the Active Sites in Metalloenzymes. Int. J. Mol. Sci. 2021, 22, 7286. [Google Scholar] [CrossRef] [PubMed]
  30. Narayanan, B.; Bhadbhade, M.M. Non-Thermochromic Bis(N,N-dimethylethylenediamine)copper(II) Dinitrate. Acta Crystallogr. Sect. C Cryst. Struct. Commun. 1995, 51, 2016–2018. [Google Scholar] [CrossRef]
  31. Willery, M.; Julliard, P.-G.; Molton, F.; Thomas, F.; Fortage, J.; Costentin, C.; Collomb, M.-N. Mechanism of Electrochemical Proton Reduction Catalyzed by a Cobalt Tetraaza Schiff Base Macrocyclic Complex: Ligand Protonation and/or Influence of the Chloro Ligand. ACS Catal. 2024, 14, 11352–11365. [Google Scholar] [CrossRef]
  32. Cukman, D.; Pravdic, V. An Investigation of the Electrochemical Reactions of a Nickel Cyanide Complex at Mercury Electrode by Cyclic Voltammetry. Croat. Chem. Acta 1978, 51, 243–247. [Google Scholar]
  33. Bruch, Q.J.; Malakar, S.; Goldman, A.S.; Miller, A.J.M. Mechanisms of Electrochemical N2 Splitting by a Molybdenum Pincer Complex. Inorg. Chem. 2022, 61, 2307–2318. [Google Scholar] [CrossRef]
  34. Lee, C.; Anson, F.C. Electron Exchange Between bis(1,10-Phenanthroline)copper(1+) Adsorbed on Graphite and bis(1,10-Phenanthroline)copper(2+) in Solution. Inorg. Chem. 1984, 23, 837–844. [Google Scholar] [CrossRef]
  35. Lei, Y.; Anson, F.C. Mechanistic aspects of the electroreduction of dioxygen as catalyzed by copper-phenanthroline complexes adsorbed on graphite electrodes. Inorg. Chem. 1994, 33, 5003–5009. [Google Scholar] [CrossRef]
  36. Zhang, X.; Sun, X.-Q.; Liu, J.-C.; Pu, Y.-L.; Ou-Yang, Q.-R.; Lu, D.-Y.; Zhang, H.-X. Oxygen reduction mediated by tetrapyridylalkylamine Cu(II) complexes with diimines. Electrochim. Acta 2024, 477, 143758. [Google Scholar] [CrossRef]
  37. Wang, V.C.-C.; Johnson, B.A. Interpreting the Electrocatalytic Voltammetry of Homogeneous Catalysts by the Foot of the Wave Analysis and Its Wider Implications. ACS Catal. 2019, 9, 7109–7123. [Google Scholar] [CrossRef]
  38. Langerman, M.; van Langevelde, P.H.; van de Vijver, J.J.; Siegler, M.A.; Hetterscheid, D.G.H. Scaling Relation between the Reduction Potential of Copper Catalysts and the Turnover Frequency for the Oxygen and Hydrogen Peroxide Reduction Reactions. Inorg. Chem. 2023, 62, 19593–19602. [Google Scholar] [CrossRef] [PubMed]
  39. Thorseth, M.A.; Letko, C.S.; Tse, E.C.M.; Rauchfuss, T.B.; Gewirth, A.A. Ligand Effects on the Overpotential for Dioxygen Reduction by Tris(2-pyridylmethyl)amine Derivatives. Inorg. Chem. 2013, 52, 628–634. [Google Scholar] [CrossRef] [PubMed]
  40. Jüttner, K. Electrochemical impedance spectroscopy (EIS) of corrosion processes on inhomogeneous surfaces. Electrochimica Acta 1990, 35, 1501–1508. [Google Scholar] [CrossRef]
  41. Jorcin, J.-B.; Orazem, M.E.; Pébère, N.; Tribollet, B. CPE analysis by local electrochemical impedance spectroscopy. Electrochim. Acta 2006, 51, 1473–1479. [Google Scholar] [CrossRef]
  42. Hsu, C.H.; Mansfeld, F. Technical Note: Concerning the Conversion of the Constant Phase Element Parameter Y into a Capacitance. Corrosion 2001, 57, 747–748. [Google Scholar] [CrossRef]
  43. Morad, M. An electrochemical study on the inhibiting action of some organic phosphonium compounds on the corrosion of mild steel in aerated acid solutions. Corros. Sci. 2000, 42, 1307–1326. [Google Scholar] [CrossRef]
  44. Monticelli, C.; Balbo, A.; Esvan, J.; Chiavari, C.; Martini, C.; Zanotto, F.; Marvelli, L.; Robbiola, L. Evaluation of 2-(salicylideneimino) thiophenol and other Schiff bases as bronze corrosion inhibitors by electrochemical techniques and surface analysis. Corros. Sci. 2019, 148, 144–158. [Google Scholar] [CrossRef]
  45. Clark, R.C.; Reid, J.S. The analytical calculation of absorption in multifaceted crystals. Acta Crystallogr. Sect. A 1995, 51, 887–897. [Google Scholar] [CrossRef]
  46. Dolomanov, O.V.; Bourhis, L.J.; Gildea, R.J.; Howard, J.A.K.; Puschmann, H. OLEX2: A complete structure solution, refinement and analysis program. J. Appl. Crystallogr. 2009, 42, 339–341. [Google Scholar] [CrossRef]
  47. Macrae, C.F.; Sovago, I.; Cottrell, S.J.; Galek, P.T.; McCabe, P.; Pidcock, E.; Wood, P.A. Mercury 4.0: From visualization to analysis, design and prediction. J. Appl. Crystallogr. 2020, 53, 226–235. [Google Scholar] [CrossRef]
Figure 1. Electronic spectra of mononuclear bis(dmen)Cu compounds in solid state.
Catalysts 15 00951 g001
Figure 2. ORTEP visualization of [Cu(dmen)2(NO3)2] complex.
Catalysts 15 00951 g002
Figure 3. Cyclic voltammetry in negative direction of 1x10⁻³ M solution of complex [CuII(dmen)2(NO3)2]. at (a) scan rate 0.1 Vseg−1 and (b) normalized representation (i/ν1/2) at scan rate from 0.05 to 1.0 Vseg−1. Electrolyte = H2O + KNO3 0.1 M; Ew = glassy carbon.
Catalysts 15 00951 g003
Figure 4. UV–vis spectroelectrochemical response of the complex [CuII(dmen)2(NO3)2] at a concentration of 15 × 10−3 M and in the presence of 0.1 M KNO3: (a) E1 = −0.85 V vs. Ag|AgCl, inset chronoamperometric plot, and (b) E2 = 0 V vs. Ag|AgCl, inset chronoamperometric plot. Experiments were carried out using a commercial Pt honeycomb as the working electrode, and spectra were acquired every 5 s for 5 min.
Catalysts 15 00951 g004
Figure 5. Cyclic voltammograms of 1 × 10⁻³ M solution of complex [CuII(dmen)2(NO3)2] in negative direction at (a) scan rate 0.1 V seg−1 and (b) normalized representation (i/ν1/2) at scan rate from 0.05 to 1 V seg−1. Electrolyte = H2O + KNO3 0.1 M; Ew = glassy carbon.
Catalysts 15 00951 g005
Figure 6. Cyclic voltammograms of 1 × 10⁻³ M solution of complexes (a) [CuII(1,10-phen)2NO3] NO3 and (b) [CuII(dmen)2(NO3)2] in negative direction at 0.1 Vs.−1. Electrolyte = H2O + KNO3 0.1 M; Ew = glassy carbon.
Catalysts 15 00951 g006
Figure 7. Absorbance vs. time plot at 570 nm of 1.5 × 10⁻² M solution of complex [CuII(dmen)2(NO3)2].
Catalysts 15 00951 g007
Figure 8. Current-sampled versus potential plots I(t)–E plot for (a) O2, (b) complex [Cu(dmen)2(NO3)2] 1 × 10⁻³ M, and (c) complex [Cu(dmen)2(NO3)2]+ O2; electrolyte = 0.1 M KNO3, EW = glassy carbon, τ = 60 s, and sample time = 30 seg.
Catalysts 15 00951 g008
Figure 9. EIS spectra of 1 × 10⁻³ M solution of complex [Cu(dmen)2(NO3)2] in absence and presence of O2: (a) Nyquist, (b) Bode-module, and (c) Bode-phase diagrams. Electrolyte = H2O + KNO3 0.1 M; Ew: glassy carbon; EDC: −0.5 V; EAC: 10 mV; nd: 10, 100 kHz–1 Hz.
Catalysts 15 00951 g009
Table 1. The ORR activity of few Cu(II) complex catalysts.
CatalystCond [pH/Electrode]E1/2 CuII|CuITOF [s−1]Reference
[Cu(dmen)2(CH3COO)2]aqueous solution, glassy carbon−0.326 V vs. Ag|AgCl4.8 × 103this work
[Cu(dmen)2(NO3)2]aqueous solution, glassy carbon−0.32 V vs. Ag|AgCl1.3 × 104this work
[Cu(dmen)2Cl2]aqueous solution, glassy carbon−0.324 V vs. Ag|AgCl5.3 × 103this work
[Cu(1,10-phen)2(NO3)2]NO3aqueous solution, glassy carbonN.R.N.R.this work
[Cu(tmpa)(L)]2+pH 7.0 PB, glassy carbon0.002 V vs. Ag|AgCl1.8 × 106[18]
Cu-phthalocyanineAu(111) electrodeN.R.N.R.[15]
[Cu(1,10-phen)]pH 7.0 PB, Au electrodeN.R.N.R.[16]
[Cu(tpmen)](ClO4)2pH 7.0 Pb, glassy carbon0.002 V vs. Ag|AgCl6.5 × 104[19]
[Cu(pmea)(L)]2+pH 7.0 PB, glassy carbon0.162 V vs. Ag|AgCl1.4 × 103[38]
[Cu(tren)(L)]2+rotating electrode glassy carbonN.R.N.R.[39]
[Cu(tren)(ImH)](ClO4)2pH 7.0 PB, pyrolytic graphiteN.R.N.R.[24]
[Cu(trpn)(ImH)](ClO4)2pH 6.4 Britton–Robinson, pyrolytic graphiteN.R.N.R.[23]
N.R.—“not reported”.
Disclaimer/Publisher’s Note: The statements, opinions and data contained in all publications are solely those of the individual author(s) and contributor(s) and not of MDPI and/or the editor(s). MDPI and/or the editor(s) disclaim responsibility for any injury to people or property resulting from any ideas, methods, instructions or products referred to in the content.