2.1. Chemical Analysis and Cationic Exchange Capacity
Table 1 presents a comprehensive analysis of the chemical composition of MMT, MMT-TiO
2, and MMT-Cu
3TiO
5. As the primary clay mineral, MMT is primarily composed of silica (SiO
2) and alumina (Al
2O
3), comprising approximately 77.44% of its total weight. This suggests that it should be classified as an aluminosilicate material. These oxides are present within the structure of montmorillonite, which is the most prevalent clay mineral in bentonite. As reported by Ghrair et al. [
35], montmorillonite is the dominant mineral in bentonite, a type of clay rock. The high alumina (Al
2O
3) content suggests the possibility of substitution within the tetrahedral or octahedral sheets of the montmorillonite structure. Conversely, elevated levels of magnesium oxide (MgO), calcium oxide (CaO), potassium oxide (K
2O), and sodium oxide (Na
2O) indicate their presence as readily exchangeable cations within bentonite. Furthermore, the SiO
2/Al
2O
3 ratio, which is 4.39 for bentonite, offers valuable insights. This ratio falls within the 2–5 range, which is characteristic of smectite clays, thus further suggesting a high cation exchange capacity (CEC). The XRF results indicate that the bentonite composition contains insignificant quantities of TiO
2 and CuO. In order to differentiate between initial bentonite and modified bentonite (MMT-TiO
2 and MMT-Cu
3TiO
5) composites, it is necessary to identify the elemental composition present in each. This is presented in
Table 1.
The observed disappearance of Ca2+, Na+, and K+ in the treated samples, despite the absence of direct cation exchange in the preparation procedure, can be explained by several interconnected factors. The highly acidic environment generated during TiCl4 hydrolysis likely promotes partial cation exchange, where protons (H+) replace exchangeable cations in the clay’s interlayer spaces, leading to their removal during washing. Furthermore, the occurrence of minor structural changes in the clay, such as edge dissolution due to the presence of acidic conditions, can render certain cations more accessible and susceptible to displacement. In addition, multivalent cations, such as Ca2+, can react with hydrolyzed titanium species or chloride ions to form insoluble precipitates that are subsequently removed during the washing process. The deposition of TiO2 or CuO nanoparticles has been observed to further alter the clay structure by obstructing ionic exchange sites, thereby reducing cation retention. The combined effects of these processes, along with the slight leaching observed in the reduction in major oxides (SiO2, Al2O3, Fe2O3), collectively explain the disappearance of these cations in the treated samples. During the synthesis process, titanium species are primarily deposited onto the surface or interlayer spaces of bentonite rather than integrating into its crystalline framework. This deposition leads to a composite material with titanium species distributed across the clay, influenced by the synthesis conditions and interactions between titanium precursors and the clay matrix. This interaction, in conjunction with the heterogeneous and porous nature of bentonite, may account for the observed TiO2 content of approximately 48.79% and 52.14% in MMT-TiO2 and MMT-Cu3TiO5, respectively, despite the initial 2:1 Ti/clay ratio. The results demonstrate the successful integration of TiO2 nanoparticles into the bentonite matrix.
Additionally, the presence of CuO is observed exclusively in MMT-Cu3TiO5, with a content of 0.02%. This confirms the targeted introduction of CuO alongside TiO2 during the modification process, resulting in a change in the chemical formula for MMT-TiO2: (Si2.28Al0.61Fe0.17Mg0.34Ti2.42)O10(OH)2 and for MMT-Cu3TiO5: (Si2.17Al0.56 Fe0.17Mg0.25Ti2.61Cu0.001)O10(OH)2. These observations underscore the substantial influence of TiO2 and TiO2-CuO modification on the original bentonite composition. Such modifications have the potential to induce novel functional properties, including photocatalytic activity and antibacterial behavior.
2.2. Powder X-Ray Diffraction (PXRD) Analysis
The structural characteristics of MMT, MMT-TiO
2, and MMT-Cu
3TiO
5 were investigated using X-ray diffraction (XRD), as illustrated in
Figure 1. The diffraction patterns for all three samples exhibited the characteristic features of layered structures. The diffractograms of the three catalyst materials exhibited distinct peaks corresponding to hkl reflections of type (100), (105), (210), and (300), located at 2θ angles of 19.89°, 35.02°, 54.23°, and 62.02°, respectively. A comparison of these data with the JCPDS Card N0 00-029-1498 crystallographic card allows for the standard structure of Na-montmorillonite to be identified [
36,
37]. The most prominent diffraction peak for bentonite was observed at a 2θ value of 6.49°, which is characteristic of the 001 plane of montmorillonite. The corresponding interlayer spacing, d
001, was determined to be approximately 13.60 Å. The presence of quartz and cristobalite as the main impurities is confirmed by the observation of characteristic reflections at 2θ = 26.56°, 29.19°, and 73.18°, which align with the standard JCPDS cards for cristobalite (No. 00-039-1425) and quartz (No. 00-033-1161) [
38,
39]. A comparison of the DRX analysis of unmodified bentonite with that of MMT-TiO
2 and MMT-Cu
3TiO
5 photocatalysts reveals the presence of higher background peaks, which can be attributed to the semi-crystalline nature of these materials.
However, the d001 value remains largely unaltered following impregnation with TiO2 or TiO2-CuO heterojunction oxides, exhibiting 2θ values of 6.61° and 6.01°, respectively. The introduction of Ti4 and Cu2+ ions, which have larger ionic radii (R (Ti4+) = 0.61 Å and R (Cu2+) = 0.73 Å) compared to Al3+(octahedral layer) and Si4+(tetrahedral layer) ions in montmorillonite, does not directly result in the substitution of these ions. Rather, it leads to the formation of the TiO2 and Cu3TiO5 phases. The interaction of these cations with the clay structure, particularly in the interlayer spaces and on the surface, may influence the overall structure and ordering of the montmorillonite. This interaction may result in a reduction in the intensity of diffraction peaks, indicating that the layered structure may undergo some degree of distortion or disorder along the C axis during the synthesis process via the sol–gel method. The MMT-Cu3TiO5 composite displays the most substantial structural impact, likely due to the synergistic interaction between the materials. Additional reflections observed in the X-ray diffraction (XRD) patterns indicate the crystallization of the Cu3TiO5 phase. Despite the low copper content (0.02%), the detection of Cu3TiO5 is feasible, as the formation of this phase is not solely dependent on the absolute concentration of copper.
The particular synthesis conditions, such as the sol–gel method, may facilitate the coordination of copper ions with titanium species, even at low concentrations. XRD analysis, indexed with the ASTM reference card (JCPDS: 00-018-0461), revealed the presence of peaks corresponding to the Cu
3TiO
5 phase at 2θ = 35.02°, 37.60°, 59.76°, and 61.54°, which can be attributed to the (310), (311), (511), and (204) planes, respectively. The presence of these peaks thus corroborates the identification of the Cu
3TiO
5 phase despite the relatively low concentration of copper. The high crystallinity of Cu
3TiO
5 and the sensitivity of XRD provide further evidence that this phase can be detected at trace concentrations. Furthermore, the TiO
2 present in the MMT-TiO
2 structure is predominantly in the anatase phase, as indicated by peaks at 2θ = 25.3° (101), 36.9° (103), 37.73° (004), 48.8° (200), and 53.8° (105), which align with the standard (JCPDS: 01-083-5916). Additionally, the rutile phase of TiO
2 was observed at 2θ = 27.50° (110), 36.04° (101), and 54.23° (211), though with lower intensity. The dominance of the anatase phase can be attributed to the confinement of TiO
2 nanoparticles within the silica-based matrix, which restricts their growth and results in smaller particle sizes, thereby enhancing their photocatalytic performance [
40].
The stabilization of the anatase phase is attributed to the formation of Si–O–Ti bonds and the high dispersion of TiO
2 particles across the silica-rich clay matrix, which effectively prevents the transformation of anatase to the rutile phase [
18].
The X-ray diffraction analysis of Cu-doped TiO
2-modified bentonite, as illustrated in
Figure 2, indicates the existence of mixed phases. The presence of the anatase phase of TiO
2 is confirmed by the observation of characteristic peaks at 25.31° and 48.07°, which correspond to the (101) and (200) planes, respectively. The relative intensity of these peaks indicates that the anatase tetragonal structure is the predominant phase.
New peaks emerge at 2θ = 35.02°, 37.60°, 59.76°, and 61.54°, which are attributed to the (310), (311), (511), and (204) planes, respectively. These peaks corroborate the formation of the tetragonal structure of the Cu3TiO5 semiconductor in accordance with the JCPDS file 00-018-0461.
As previously stated, a reduction in crystallinity can result in an elevated number of defects in the material relative to a perfectly crystalline material. The average crystallite size of the phases can be calculated from the XRD data using the following formula [
41,
42] D = kλ/βcosθ, where k is a constant approximately equal to 0.9; λ is the wavelength of the XRD (λ = 1.5406Å); β represents the full width at half maximum (FWHM) of the reflection in radians, and θ is the angle between the incident and diffracted beams.
The average crystallite sizes of the MMT, MMT-TiO2, and MMT-Cu3TiO5 nanocomposites are approximately 5.53 µm, 0.52 µm, and 0.14 µm, respectively. The crystallite size of MMT-TiO2 is markedly smaller than that of pure MMT, indicating a substantial reduction resulting from the interaction between TiO2 particles and the bentonite surface, which impedes crystallite growth. This reduction is further amplified in MMT-Cu3TiO5, potentially due to the formation of a distinct crystal structure with Cu3TiO5, which involves more robust chemical interactions and more constrained crystal growth. Such alterations in crystallite size may impact the physicochemical properties of the materials.
2.3. N2 Adsorption/Desorption
To correlate the textural characteristics of the MMT-TiO
2 and MMT-Cu
3TiO
5 catalysts with their catalytic performance, a BET N
2 adsorption–desorption isotherm was utilized (
Figure 2), and the corresponding textural parameters are presented in
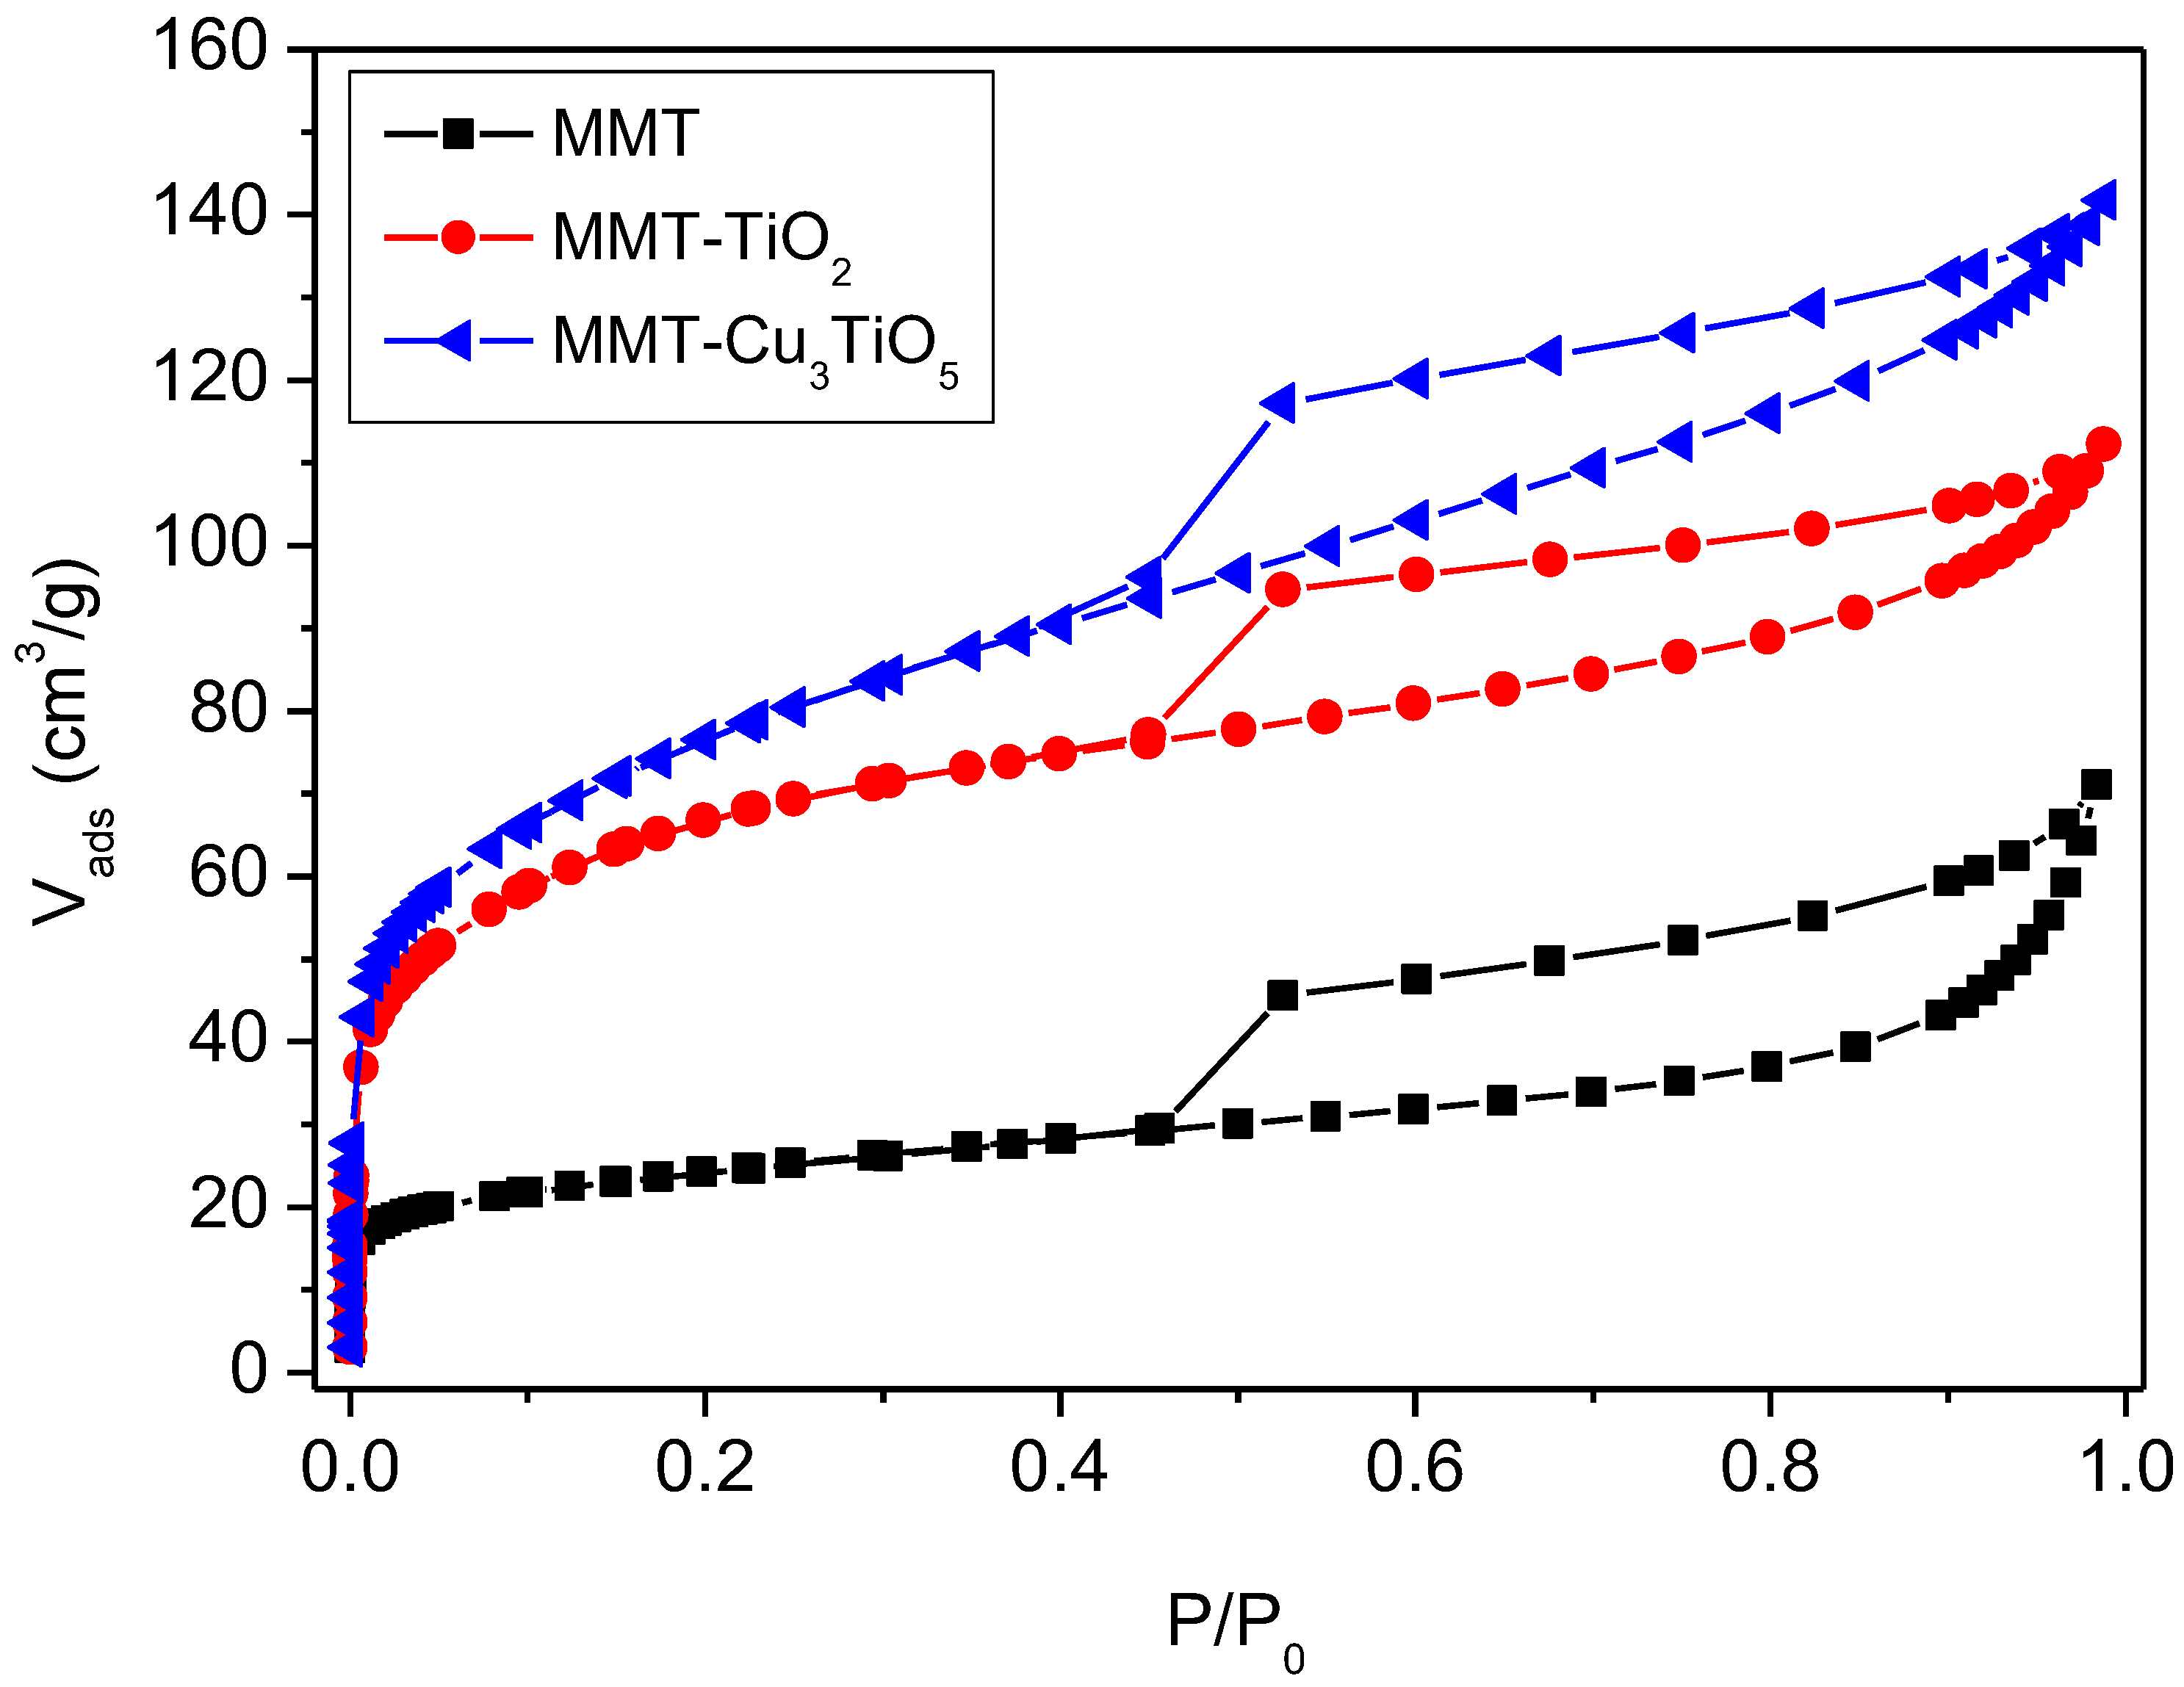
Table 2. In accordance with the classification system established by the International Union of Pure and Applied Chemistry (IUPAC), all three isotherms exhibit a pronounced H3 hysteresis loop, a characteristic feature of porous materials with a mesoporous structure. This aligns with the Type IV isotherm classification, frequently associated with multilayer adsorption followed by capillary condensation [
43,
44].
The modified MMT-TiO
2 and MMT-Cu
3TiO
5 samples display a wider hysteresis loop, indicative of a broader pore size distribution and more pronounced mesoporous porosity. The hysteresis loop is indicative of plate particle aggregates or slit pores [
45]. At low pressures (P/P
0 < 0.2), rapid initial adsorption occurs due to adsorption on the external surface and in the micropores. At higher relative pressures (P/P
0 > 0.4), the adsorption in the mesopores becomes more significant, as indicated by the continuous increase in the adsorbed volume. The hysteresis loop initiates at P/P
0 = 0.45 and culminates near P/P
0, indicative of the presence of moderate mesoporous pores.
A comparative analysis of the textural parameters of the samples presented in
Table 2 reveals notable disparities between the pure montmorillonite, MMT-TiO
2, and MMT-Cu
3TiO
5. The nitrogen adsorption results indicate a notable enhancement in the specific surface area (S
BET), total pore volume (V
tot), and micropore volume (V
micro) of the modified materials (MMT-TiO
2 and MMT-Cu
3TiO
5) in comparison to pure montmorillonite. The S
BET increases significantly with the addition of TiO
2 and Cu
3TiO
5, rising from 85 m
2/g for pure MMT to 245 m
2/g for MMT-TiO
2 and 279 m
2/g for MMT-Cu
3TiO
5. The mean pore diameter (D) exhibited a notable increase from 5.84 Å for the MMT sample to 6.76 Å for the MMT-TiO
2 sample and 6.74 Å for the MMT-Cu
3TiO
5 sample. This suggests that the modified materials possess a more developed pore structure. This phenomenon has been previously documented in the literature for catalysts obtained via impregnation of active phases [
46]. This increase can be attributed to the formation of novel adsorption sites and the expansion of the pore size distribution, particularly within the mesoporous range. The modified materials exhibit an elevated average pore diameter and a more extensive pore distribution, indicating an enhancement in their textural characteristics. The micropore volume represents 19% and 11% of the total pore volume, respectively, while the external surface area contributes 67% and 78% to the total specific surface area of the MMT-TiO
2 and MMT-Cu
3TiO
5 samples. The mesoporosity, which can be described as a “house of cards” type porous organization, indicates that the external surface is the primary site of interaction with the adsorbed molecules.
These findings suggest that the incorporation of TiO2 and Cu3TiO5 into the montmorillonite structure results in the formation of more porous materials, which exhibit enhanced potential for applications in adsorption and catalysis.
2.4. Morphological Characterization by SEM
Figure 3 depicts SEM images of MMT, MMT-TiO
2, and MMT-Cu
3TiO
5. Bentonite particles manifest as irregular aggregates with considerable variation in size, as illustrated in
Figure 3a. The surface is observed to be rough and porous, a quality also exhibited by clays such as bentonite [
47]. Micrometer-sized filler clusters form agglomerates, as can be observed in
Figure 3b,c. It is evident that MMT-TiO
2 also exhibits irregularly shaped particles but with a notable difference from those observed in pure bentonite. The particles appear more compact and have more defined structures, which is likely due to the presence of titanium dioxide. The surface displays a reduction in cracking and an increase in uniformity when compared to bentonite alone [
48]. This phenomenon may be attributed to the adsorption or coverage of TiO
2 particles on the bentonite surface. TiO
2 particles have the potential to act as a protective layer, modifying the bentonite surface.
The MMT-Cu
3TiO
5 particles (
Figure 3c) are not discrete entities; rather, they form irregular aggregates of micrometric dimensions. The surface of the aggregates is characterized by a high degree of roughness and the presence of numerous pores. This phenomenon can be attributed to the lamellar structure of the bentonite and the incorporation of the semiconductor Cu
3TiO
5. It is challenging to discern individual Cu
3TiO
5 particles in this image. This indicates the presence of either a highly dispersed TiO
2 phase within the bentonite matrix or a strong interaction between the two phases, which obscures the visibility of the TiO
2 particles. The particles and aggregates appear to be micrometric in size, which is consistent with the nature of the bentonite. Nevertheless, a certain particle size distribution is evident, with the presence of larger and smaller aggregates.
2.5. FTIR Characterization
FTIR spectroscopy provides valuable insight into the molecular structure and intermolecular interactions of materials. In the present case, a comparative analysis of the spectra of MMT, MMT-TiO
2, and MMT-Cu
3TiO
5 reveals the modifications induced by the incorporation of TiO
2 and Cu
3TiO
5 into the bentonite structure.
Figure 4 depicts the FTIR spectra of MMT, MMT-TiO
2, and MMT-Cu
3TiO
5, which collectively demonstrate that all bentonite types exhibit absorption peaks that are characteristic of montmorillonite. The spectra display the characteristic bands of MMT at 3613, 3400, and 3229 cm
−1. These broad, intense bands are attributed to the valence vibrations of the O–H bonds of adsorbed water molecules and the structural hydroxyl groups of MMT [
49,
50].
The peak at 1631 cm
−1 is indicative of the angular deformation of adsorbed water molecules. The bands at 1106, 1003, 973, 916, 840, and 786 cm
−1 are indicative of the valence and strain vibrations of Si–O and Al–O bonds within the tetrahedra and octahedra of the MMT structure, as previously documented in references [
51,
52,
53]. In comparison to MMT, the spectra of MMT-TiO
2 and MMT-Cu
3TiO
5 exhibit notable alterations. The O–H bands exhibit a shift and broadening. This indicates the presence of an interaction between water molecules and the TiO
2 and Cu
3TiO
5 species introduced into the montmorillonite structure. The appearance of new bands in the low wavenumber regions (below 1000 cm
−1) can be attributed to vibrations that are characteristic of Ti–O and Cu–O bonds. This evidence corroborates the incorporation of TiO
2 and Cu
3TiO
5 into the bentonite matrix. Furthermore, alterations in the relative intensity of the Si–O and Al–O bands suggest a disruption in the bentonite structure following the introduction of the metal species. These findings indicate that the integration of TiO
2 and Cu
3TiO
5 into the bentonite matrix alters its local environment by forming new bonds and disrupting existing ones. These modifications have the potential to significantly impact the physico-chemical properties of bentonite, including its CEC. As previously observed, there has been a notable enhancement in the cation exchange capacity and external specific surface area of bentonite. The external surface area of MMT-TiO
2 exhibited a 300% increase, while that of MMT-Cu
3TiO
5 demonstrated a 403% increase in comparison to the initial external surface area of MMT. This increase had a significant impact on the catalytic properties.
2.6. Thermogravimetric Analysis
The TGA thermograms of the materials illustrated in
Figure S1 demonstrate distinct thermal behaviors. For MMT, a 1% mass loss is observed between 30 and 150 °C, which is attributed to the desorption of physically adsorbed water. A further loss of 5.72% is observed between 200 and 500 °C, extending up to 700 °C, corresponding to the dehydroxylation of structural hydroxyl groups. The profiles of MMT-TiO
2 and MMT-Cu
3TiO
5 are similar but show slight discrepancies. A mass loss of 3% is observed between 30 and 200 °C, which is attributed to the desorption of water and the elimination of hydroxyl groups.
A 7% loss is observed between 200 and 800 °C, which is attributed to phase transformations and dehydroxylation. Although these processes result in mass loss, they do not indicate a loss of thermal stability. The curve for MMT-Cu3TiO5 is slightly below that for MMT-TiO2, indicating a stronger interaction between Cu3TiO5 and MMT. This interaction enhances thermal stability by preserving structural integrity during phase transformations and dehydroxylation.
In conclusion, the materials MMT-TiO2 and MMT-Cu3TiO5 exhibit improved thermal stability compared to pure MMT, with MMT-Cu3TiO5 demonstrating the most favorable thermal stability, likely due to optimal interactions between Cu3TiO5 and the MMT matrix. The observed thermal stability beyond 500 °C for all samples indicates their potential for high-temperature applications. Additionally, the combined properties of montmorillonite, TiO2, and Cu3TiO5 may offer promising prospects for catalytic or sorption applications.
2.7. Zeta Potential
In the Orange G (OG) solution (
Figure 5a), the zeta potential of the bentonite decreases with increasing pH, indicating that the bentonite surface becomes increasingly negative. This phenomenon may be attributed to the deprotonation of the adsorption sites on the bentonite. In comparison, the zeta potential values of the bentonite in distilled water (
Figure 5b) exhibit minimal variation, indicating that the adsorption sites remain predominantly protonated. The lack of interaction between bentonite and OG dye molecules, as evidenced by the decrease in the zeta potential of MMT-TiO
2 and MMT-Cu
3TiO
5 with increasing pH, also suggests that the surface of MMT-TiO
2 and MMT-Cu
3TiO
5 becomes increasingly negative. However, this reduction is less pronounced compared to that observed in bentonite. This phenomenon may be attributed to the deprotonation of adsorption sites. The acid activation of bentonite and the presence of TiO
2 may also result in the creation of new adsorption sites that exhibit differing reactivity with the dye compared to pure bentonite.
This is evidenced by the observed change in zeta potential with the presence of MMT-TiO2 and MMT-Cu3TiO5 on OG, with the peak change occurring at pH = 3, followed by a gradual decrease as the pH value increases and then decreases. The zeta potentials of MMT-Cu3TiO5 are less negative than those of pure bentonite and MMT-TiO2 at low pHs, indicating the potential for interaction between the copper in the composite and the dye, which could affect the surface charge. Zeta potential measurements demonstrate that the interactions between Orange G and the different materials are complex and are strongly influenced by pH. The addition of TiO2 and Cu to the composites appears to modulate the effect of pH on the surface charge, which could have a significant impact on the adsorption capacity of the dye.
2.8. UV Spectroscopy of Photocatalysts
As illustrated in
Figure S2, the UV–visible spectrum provides the evaluated values of the band gap energy (Eg) for the prepared materials. These values were determined by plotting (αhν)
0.5 as a function of photon energy (hν), where α represents the absorption coefficient; h is the Planck constant (4.14 × 10
−15 eV·s), and ν is the photon frequency (Hz). The resulting UV–visible absorbance spectrum was obtained by measuring the absorbance (A) as a function of wavelength. The absorption coefficient (α) can be calculated from a spectrum [
54] using the following equation:
where t is film thickness; α varies with the bandgap length of the semiconductor (E
g) and with the energy of the absorbed photon (hν) according to the Tauc equation:
The experimental band gap of sample E can be obtained by identifying the point of intersection between the tangent to the linear portion of the curve and the abscissa axis (αhν)1/n = 0. The value of n is contingent upon the type of electronic transition involved (e.g., n = 1/2 for a direct allowed transition).
The gap energy for MMT-TiO2 and MMT-Cu3TiO5 was determined to be 2.7 eV and 2.15 eV, respectively, corresponding to the absorbance wavelengths of 459.2 nm and 568.8 nm.
2.9. Adsorption Kinetics
In order to investigate the photocatalytic degradation of OG, it was first necessary to determine the adsorption kinetics of the dye onto MMT-TiO
2 and MMT-Cu
3TiO
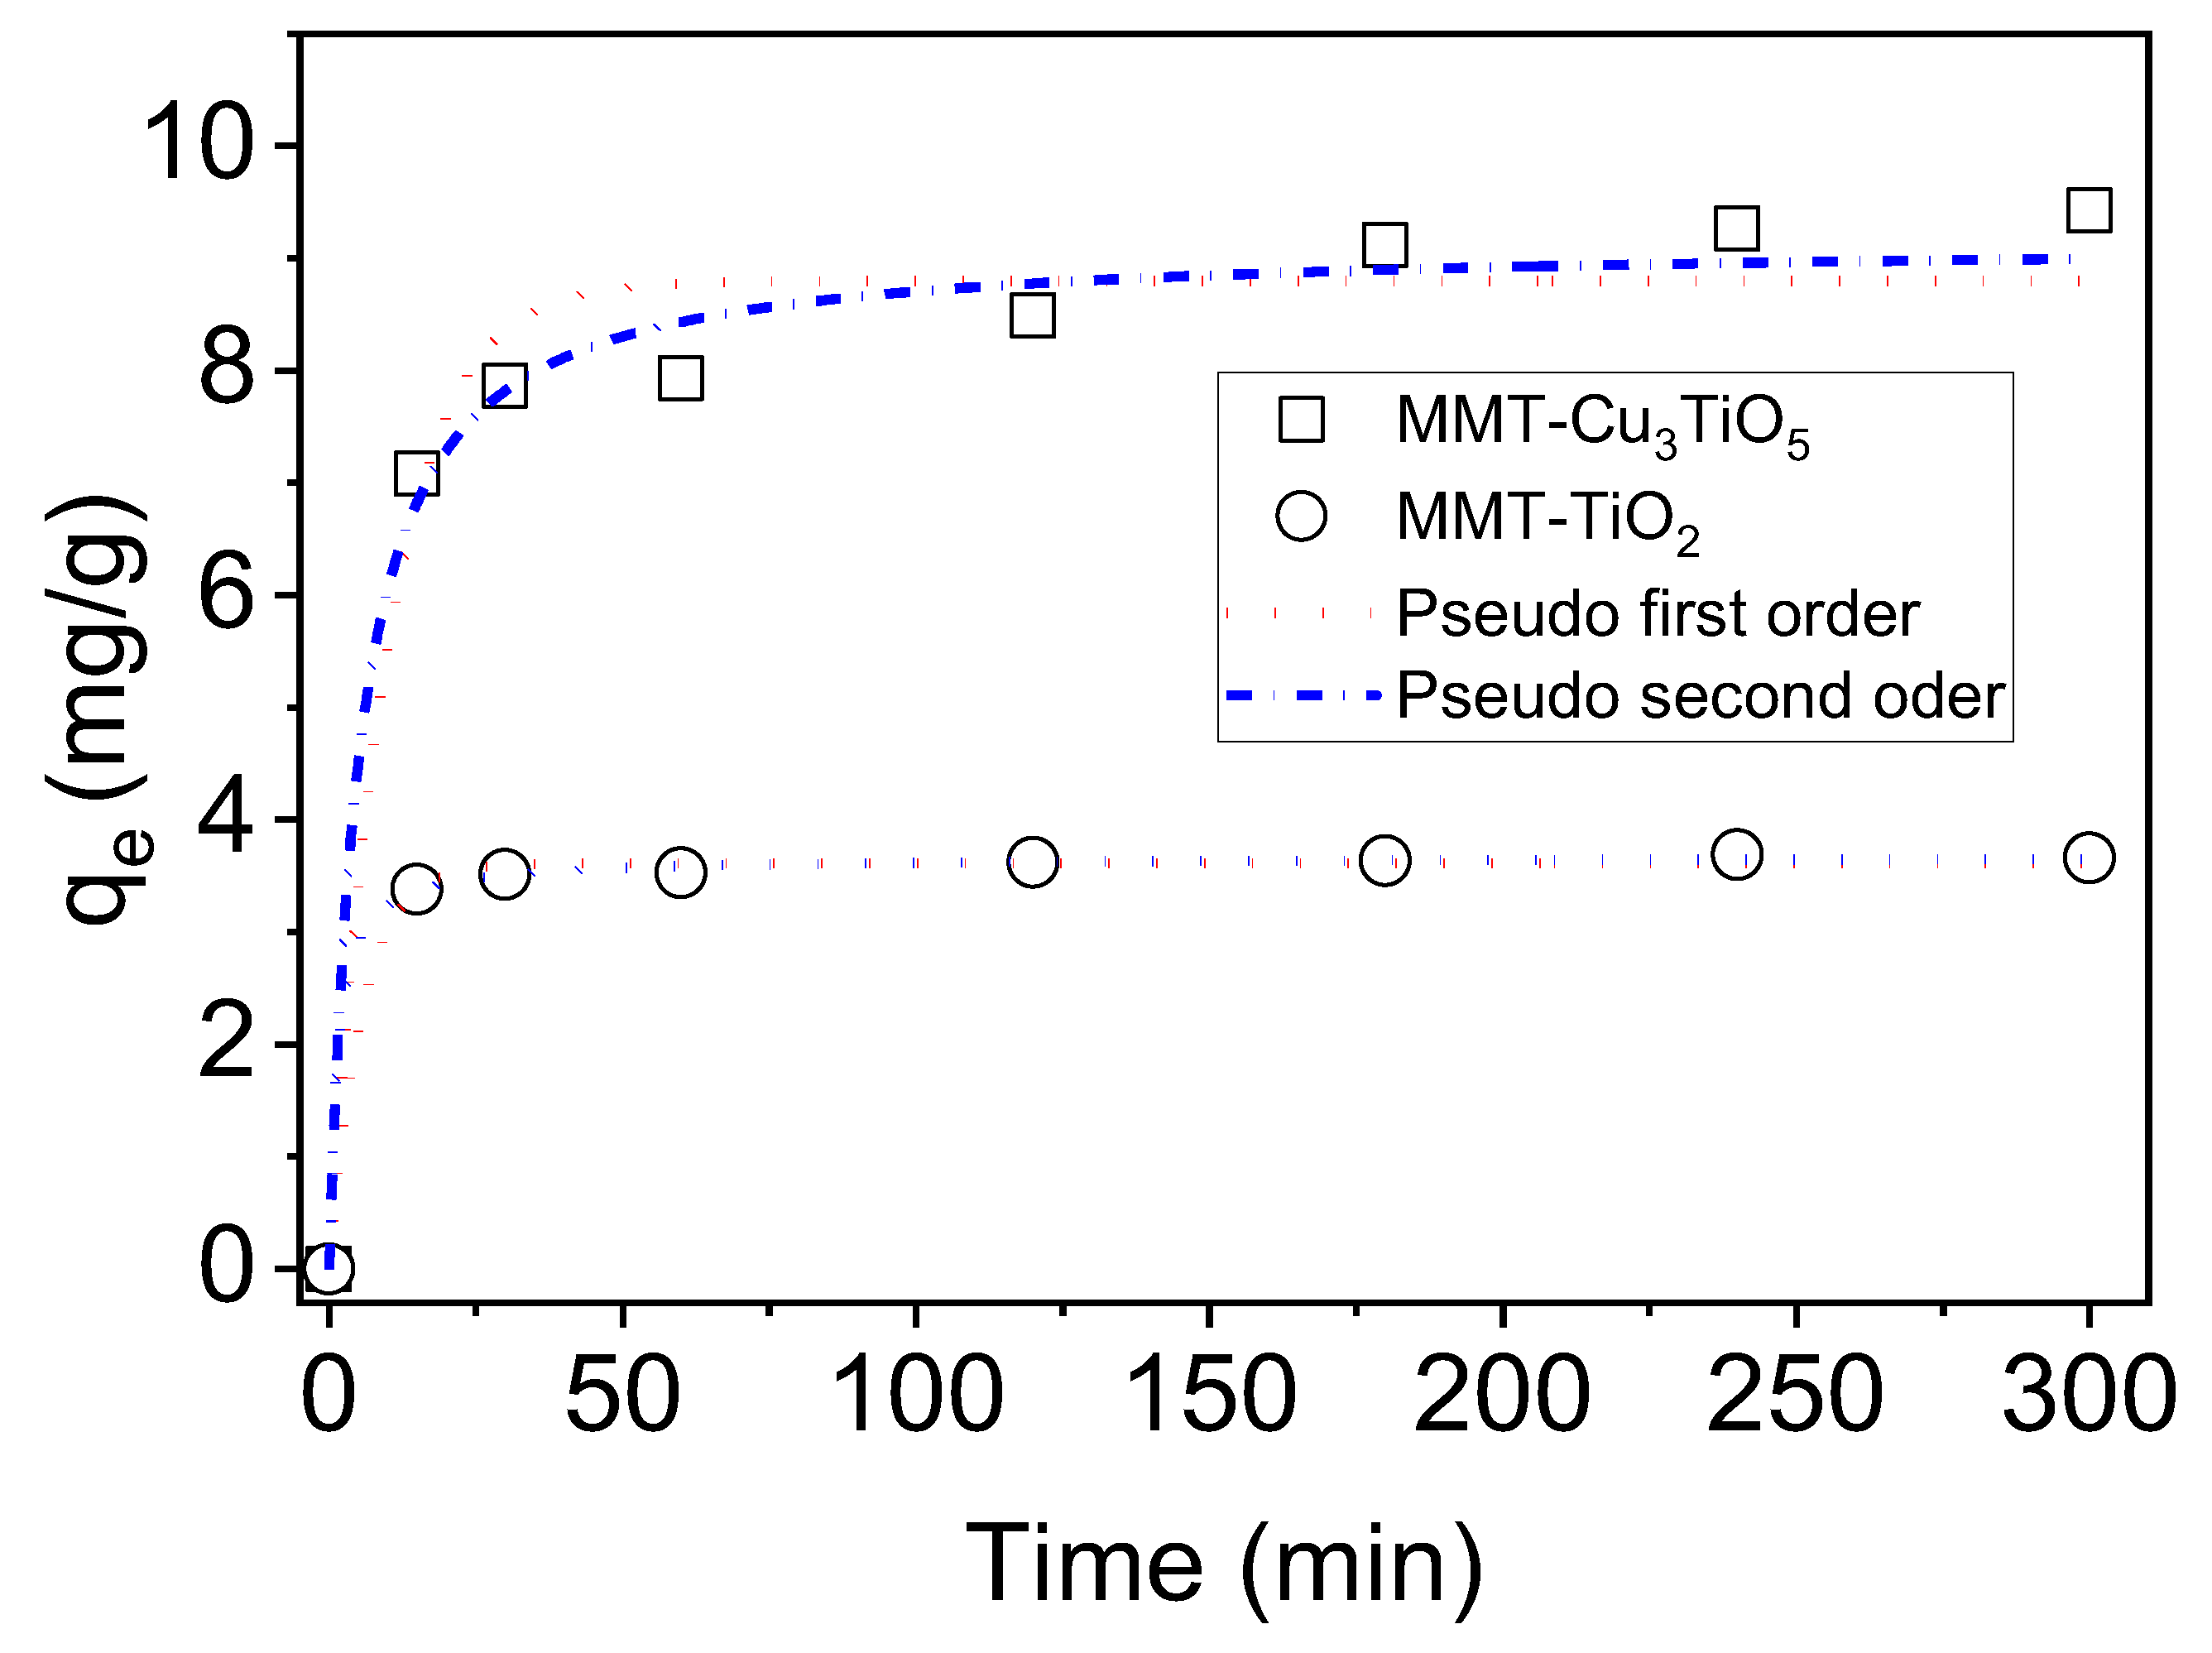
5 catalysts. The adsorption process, which precedes photodegradation, is of critical importance in establishing the efficiency of the catalyst. Batch adsorption experiments were conducted at 25 °C and pH 7, with an initial OG concentration of 40 mg/L and an adsorbent concentration of 2 g/L. The adsorption kinetics were monitored in the absence of light for a period of 300 min to ascertain the time required to reach equilibrium. The results depicted in
Figure 6 provide valuable insights into the adsorptive properties of these catalysts and their potential for effective OG removal. The graph illustrates the temporal evolution of the quantity of OG dye adsorbed (in mg/g) for the two adsorbent materials as a function of time (in minutes). The materials under consideration are MMT-Cu
3TiO
5 and MMT-TiO
2. The quantity of dye adsorbed exhibited a rapid increase within the initial 15 min of contact. This indicates that the most accessible adsorption sites are rapidly occupied by dye molecules. This rapid adsorption can be attributed to physisorption, a process whereby dye molecules are attracted to the material’s adsorption sites by weak forces, such as van der Waals forces. Subsequently, the quantity of dye adsorbed reaches a plateau, indicating that equilibrium has been reached with regard to the adsorption process. The number of available adsorption sites is reached, and the amount of adsorbed dye no longer varies significantly. The equilibrium uptake of dye on MMT-TiO
2 is reached in 30 min with 3.60 mg/g (37%) of dye removal, while on MMT-Cu
3TiO
5, equilibrium is reached in 120 min with 9.11 mg/g (41.50%) of dye removal. The MMT-Cu
3TiO
5 material exhibits a greater adsorption capacity than the MMT-TiO
2 material, attaining a higher maximum adsorption amount.
The findings indicate that the integration of copper into the MMT-Cu
3TiO
5 structure markedly enhances its adsorption capacity. This can be attributed to the increase in specific surface area and total pore volume (279 m
2/g and 0.11 cm
3/g versus 245 m
2/g and 0.10 cm
3/g for MMT-TiO
2), which results in the creation of additional active sites for dye adsorption. Furthermore, the presence of copper introduces new specific adsorption sites and promotes coordination interactions between metal ions and dye molecules. While MMT-TiO
2 exhibits promising adsorption capacity, the nature of its active sites, predominantly associated with titanium dioxide, appears less conducive to interactions with the dye under investigation. The surface coverage rate, which reflects the efficiency of an adsorbent, was evaluated for the materials MMT-TiO
2 and MMT-Cu
3TiO
5. In accordance with the principle of proportionality between the surface area occupied by a molecule and its molecular surface area [
55,
56,
57], it was estimated that OG used as a model dye occupies a surface area of 169.39 Å. The results demonstrate that MMT-Cu
3TiO
5 achieves a coverage rate of 6.87%, which is significantly higher than that of MMT-TiO
2 (3.23%). Moreover, the enhanced pore structure and pore size, as demonstrated by BET analysis, could also facilitate the adsorption process. Therefore, it can be postulated that the interactions between the dye and the MMT-Cu
3TiO
5 surface may be more robust, thereby enhancing the adsorption process.
In order to investigate the adsorption mechanism, the nonlinear forms of the pseudo-first-order [
58] and the pseudo-second-order [
59] kinetic rate equations are provided as Equations (3) and (4), respectively.
where q
t and q
e represent the amount of dyes adsorbed at equilibrium (mg/g) and at time t (min), and k
1 (min
−1) and k
2 (g/mg min) are the pseudo-first-order and pseudo-second-order rate constants, respectively. The rate constants k
1, k
2, and q
e(cal) were obtained from plots of Equations (3) and (4), as well as from q
e(exp) (
Figure 6). The resulting values are gathered in
Table 3, along with the correlation coefficients R
2 and the chi-square Test (χ
2).
The pseudo-first-order and pseudo-second-order kinetic models demonstrated satisfactory fits to the experimental data. However, the rate constants (k1 = 0.180 min−1 and k2 = 0.206 g/mg.min) for MMT-TiO2 are significantly higher than those for MMT-Cu3TiO5. The rate constants (k1 = 0.099 min−1 and k2 = 0.021 g/mg. min) indicate that the adsorption kinetics of OG dye on MMT-Cu3TiO5 follows a relatively slow process. With regard to the correlation coefficient, the value of 0.999 for MMT-TiO2 is slightly higher than that of 0.997, indicating that the pseudo-second-order model provides a superior description of the adsorption kinetics for this material. In contrast, for MMT-Cu3TiO5, the value of 0.939 is less than 0.968, indicating that the first-order model may be more applicable to this material, although the fit is slightly inferior to that of MMT-TiO2. The chi-square test (χ2) indicates a discrepancy between the models and the experimental data, with low values for the pseudo-second-order model. Nevertheless, the pseudo-second-order model demonstrates an excellent correlation with the experimental data, suggesting that this model more accurately describes the adsorption kinetics of the OG dye for both materials. These results indicate that the adsorption of the dye likely follows a more intricate mechanism, consistent with the assumptions of the pseudo-second-order model. This suggests that specific interactions, such as multilayer formation or chemical reactions at the active sites, play a pivotal role in the adsorption process. This finding reflects the heterogeneous nature of adsorption on MMT-TiO2 and MMT-Cu3TiO5 materials, with the pseudo-second-order model offering the most accurate description of the observed process.
2.10. Study of the pH Effect on the Adsorption and Photodegradation of Orange G onto MMT-TiO2 and MMT-Cu3TiO5
The adsorption process is significantly influenced by pH, as it affects the surface charge of the adsorbents (MMT-TiO
2 and MMT-Cu
3TiO
5) and the ionic form of the anionic dye OG (
Figure S3). The adsorption of the anionic dye OG on MMT is found to be negligible under all pH conditions, indicating that pure montmorillonite is not an effective adsorbent for the dye at any pH. The highest adsorption is observed at pH 3, reaching approximately 52.48% on MMT-Cu
3TiO
5 and 31.01% on MMT-TiO
2, demonstrating excellent efficiency under acidic conditions. The zeta potential was found to be approximately +2.81 mV for MMT-Cu
3TiO
5 and +1.05 mV for MMT-TiO
2, indicating a significant positive charge. The anionic form of OG was the predominant species at pH values greater than 1, resulting from the deprotonation of its two SO
3H groups (pK
a = 1) [
60]. This finding is consistent with the high adsorption of the dye at this pH, which suggests a favorable electrostatic interaction between the anionic dye and the positively charged material. At higher pH values, above pH = 7, the zeta potential becomes slightly negative (approximately −0.49 mV and −11.6 mV for MMT-Cu
3TiO
5 and MMT-TiO
2, respectively), which may account for the slight decrease in adsorption observed. The efficiency of the MMT-Cu
3TiO
5 material declines, though it remains relatively stable at approximately 35% between pH 4 and 7 and between 24.28% and 19.43% between pH 4 and 9 for MMT-TiO
2. The decline in efficiency with rising pH levels suggests that the reaction mechanism is more complex than a straightforward electrostatic interaction between oppositely charged species. Nevertheless, the rate of adsorption declines precipitously at pH values exceeding 9. At elevated pH levels, the repulsion between the negatively charged surfaces of the materials and the anionic dye (OG) increases, resulting in a reduction in adsorption efficiency. This is due to a reduction in favorable electrostatic interactions, which results in a decline in the efficacy of the adsorption process.
The adsorption process of the anionic azo dye OG on the nanocomposites MMT-TiO
2 and MMT-Cu
3TiO
5 appears to be primarily regulated by physisorption forces. At acidic and slightly acidic pH levels, electrostatic interactions are established between the sulfonate groups (SO
3−) of the anionic dye and the positive surface charges of the nanocomposites. Moreover, polar forces generated by an electric field within the micropores of the nanocomposites, as well as potential hydrogen bonds with the silanol (-SiOH) and aluminol (-AlOH) groups present on some nanocomposites, may also play a pivotal role in the adsorption process [
61]. Therefore, the capacity of bentonite to adsorb anionic azo dye molecules can be markedly augmented through the immobilization of Cu
3TiO
5 nanoparticles on its surface. The efficiency of OG degradation using MMT-Cu
3TiO
5 at pH 3 was 99% after 120 min.
2.11. Photolytic Behavior of Orange G Dye
Figure 7 illustrates the photolysis kinetics of the degradation of OG in an aqueous solution with an initial concentration of 70 mg/L at pH 3 under LC8 lamp irradiation. As the duration of irradiation increases, the degradation of OG initially rises, reaching a maximum of 1% at 30 min. Further exposure beyond this point has a negligible impact. This indicates that the optimal concentration of hydroxyl radicals is reached within 30 min, thereby limiting further degradation of the dye’s functional groups [
62]. In the absence of a catalyst, the degradation of OG remains low, irrespective of the duration of irradiation.
The results presented in
Figure 7 illustrate the substantial influence of the MMT-TiO
2 and MMT-Cu
3TiO
5 catalysts on the photocatalytic degradation of OG. The MMT-TiO
2 catalyst markedly enhances the degradation process compared to simple photolysis, although complete degradation is not attained within a 300-minute period, with a rate of 96%. The addition of montmorillonite serves to stabilize the TiO
2, thereby optimizing its photocatalytic performance. Nevertheless, the incomplete degradation may be attributed to saturation of the active sites or diffusion limitations. The MMT-Cu
3TiO
5 catalyst demonstrated significantly enhanced performance. Its structure, with a band gap of 2.15 eV in comparison to 2.7 eV for MMT-TiO
2, allows for greater absorption of visible light. The immobilization of Cu
3TiO
5 to the montmorillonite system also appears to facilitate the generation of reactive radicals (OH•) and enhance selectivity in the attack on dye molecules, resulting in nearly complete degradation (100%) of the dye within 150 min. This distinctive MMT-Cu
3TiO
5 combination may be attributed to the enhanced separation of electron–hole pairs, which reduces recombination and enhances the efficiency of the photocatalytic reaction.
In order to ascertain the order of the OG degradation reaction, the experimental data were fitted to nonlinear kinetic models of pseudo-first-order (PFO) in accordance with Equation (5) and pseudo-second-order (PSO) in accordance with Equation (6). The best fit was identified through evaluation of the coefficient of determination (R
2) and the chi-square test (χ2), which revealed that the predominant reaction order was as follows:
where C
0 represents the initial dye concentration (in mg/L); C denotes the concentration at time t (in mg/L); k
1 signifies the rate constant of pseudo-first-order degradation (in units of minutes/L), and k
2 denotes the rate constant of pseudo-second-order degradation (in units of L mg
−1 min
−1).
The experimental results were analyzed using pseudo-first- and pseudo-second-order kinetic models.
Figure 7 presents a comparison of the two models, thereby enabling the identification of the model that most accurately describes the kinetics of the studied reaction. The regression coefficients and the chi-square (χ
2) test (
Table 4) demonstrated that the pseudo-first-order model provided the most accurate representation of the experimental data. This observation is consistent with prior research on the photodegradation kinetics of OG dye on diverse catalyst surfaces [
63].
The photodegradation of OG dye using the MMT-Cu
3TiO
5 catalyst was found to be markedly more efficient than that achieved with the MMT-TiO
2 material. This discrepancy in performance can be attributed to the enhanced specific surface area and positive surface charge of MMT-Cu
3TiO
5, which facilitate superior photocatalytic activity. The MMT-Cu
3TiO
5 nanocomposite was tested at varying catalyst concentrations (2, 2.66, 3.33, 4, and 4.66 g/L) to ascertain the optimal concentration for the photodegradation of OG. The results are presented in
Figure 8. In contrast with conventional methodologies, the reaction medium was not maintained in a dark environment prior to irradiation; instead, it was directly exposed to the UV–Visible lamp. Time point t
0 = 0 corresponds to the initiation of the solution’s exposure to the light, thereby marking the commencement of the photocatalysis experiment. However, the photolysis of OG dye in the absence of any photocatalyst resulted in minimal dye degradation, indicating that the degradation process was exclusively photocatalytic, as OG was not susceptible to UV radiation in the absence of the photocatalyst. This result is consistent with those reported by Derya et al. [
64], wherein the photolysis of OG resulted in minimal dye degradation. The results demonstrate a rapid reduction in the concentration of OG, reaching 100% after only 180 min of irradiation for catalyst concentrations of 2.66, 3.33, 4, and 4.66 g/L of MMT-Cu
3TiO
5. Furthermore, additional experiments were conducted at a catalyst concentration of 2 g/L of MMT-Cu
3TiO
5, as higher concentrations resulted in an excessively rapid degradation process, yielding a limited number of exploitable data points. In the study of the rate at which a reaction occurs on the surface of a catalyst (heterogeneous catalysis), the Langmuir–Hinshelwood model is a commonly employed model. The model posits that reactant molecules initially adsorb onto the catalyst surface before undergoing a reaction with one another. The interaction on the catalyst surface directly influences the reaction rate, which can be quantified using Equation (7).
In this equation, k represents the reaction rate constant; K
L is the adsorption equilibrium constant that characterizes the affinity between the reactant and the catalyst surface, and C denotes the instantaneous concentration of the reactant in the solution. Daneshvar and colleagues [
65] proposed an adaptation of the Langmuir–Hinshelwood model for the specific purpose of investigating the impact of the quantity of TiO
2 employed as a catalyst Equation (8).
In this context, k
app represents the apparent first-order rate constant. The experimental data are presented in
Figure S4 for purposes of illustration.
Figure S4 illustrates that an increase in the concentration of MMT-Cu
3TiO
5 is accompanied by an enhancement in the initial reaction rate. This evidence substantiates the hypothesis that MMT-Cu
3TiO
5 plays a catalytic role in the degradation of the OG dye. The relationship between V
0 and catalyst concentration appears to be approximately linear over the range of catalyst concentrations studied. This figure demonstrates that Equation (8) is verified, thereby validating the Langmuir–Hinshelwood model within the specified range of catalyst concentration. This study allows us to conclude that the photodegradation of OG dye in the presence of MMT-Cu
3TiO
5 can occur via two simultaneous processes: adsorption and photocatalysis, with a rate constant of 0.1646 min
−1.
2.12. Regeneration of MMT-Cu3TiO5 Catalyst After Orange G Adsorption and Photodegradation
The potential for repurposing the MMT-Cu3TiO5 photocatalyst is of significant economic and practical value, necessitating comprehensive life cycle assessment and the identification of optimal treatment methodologies.
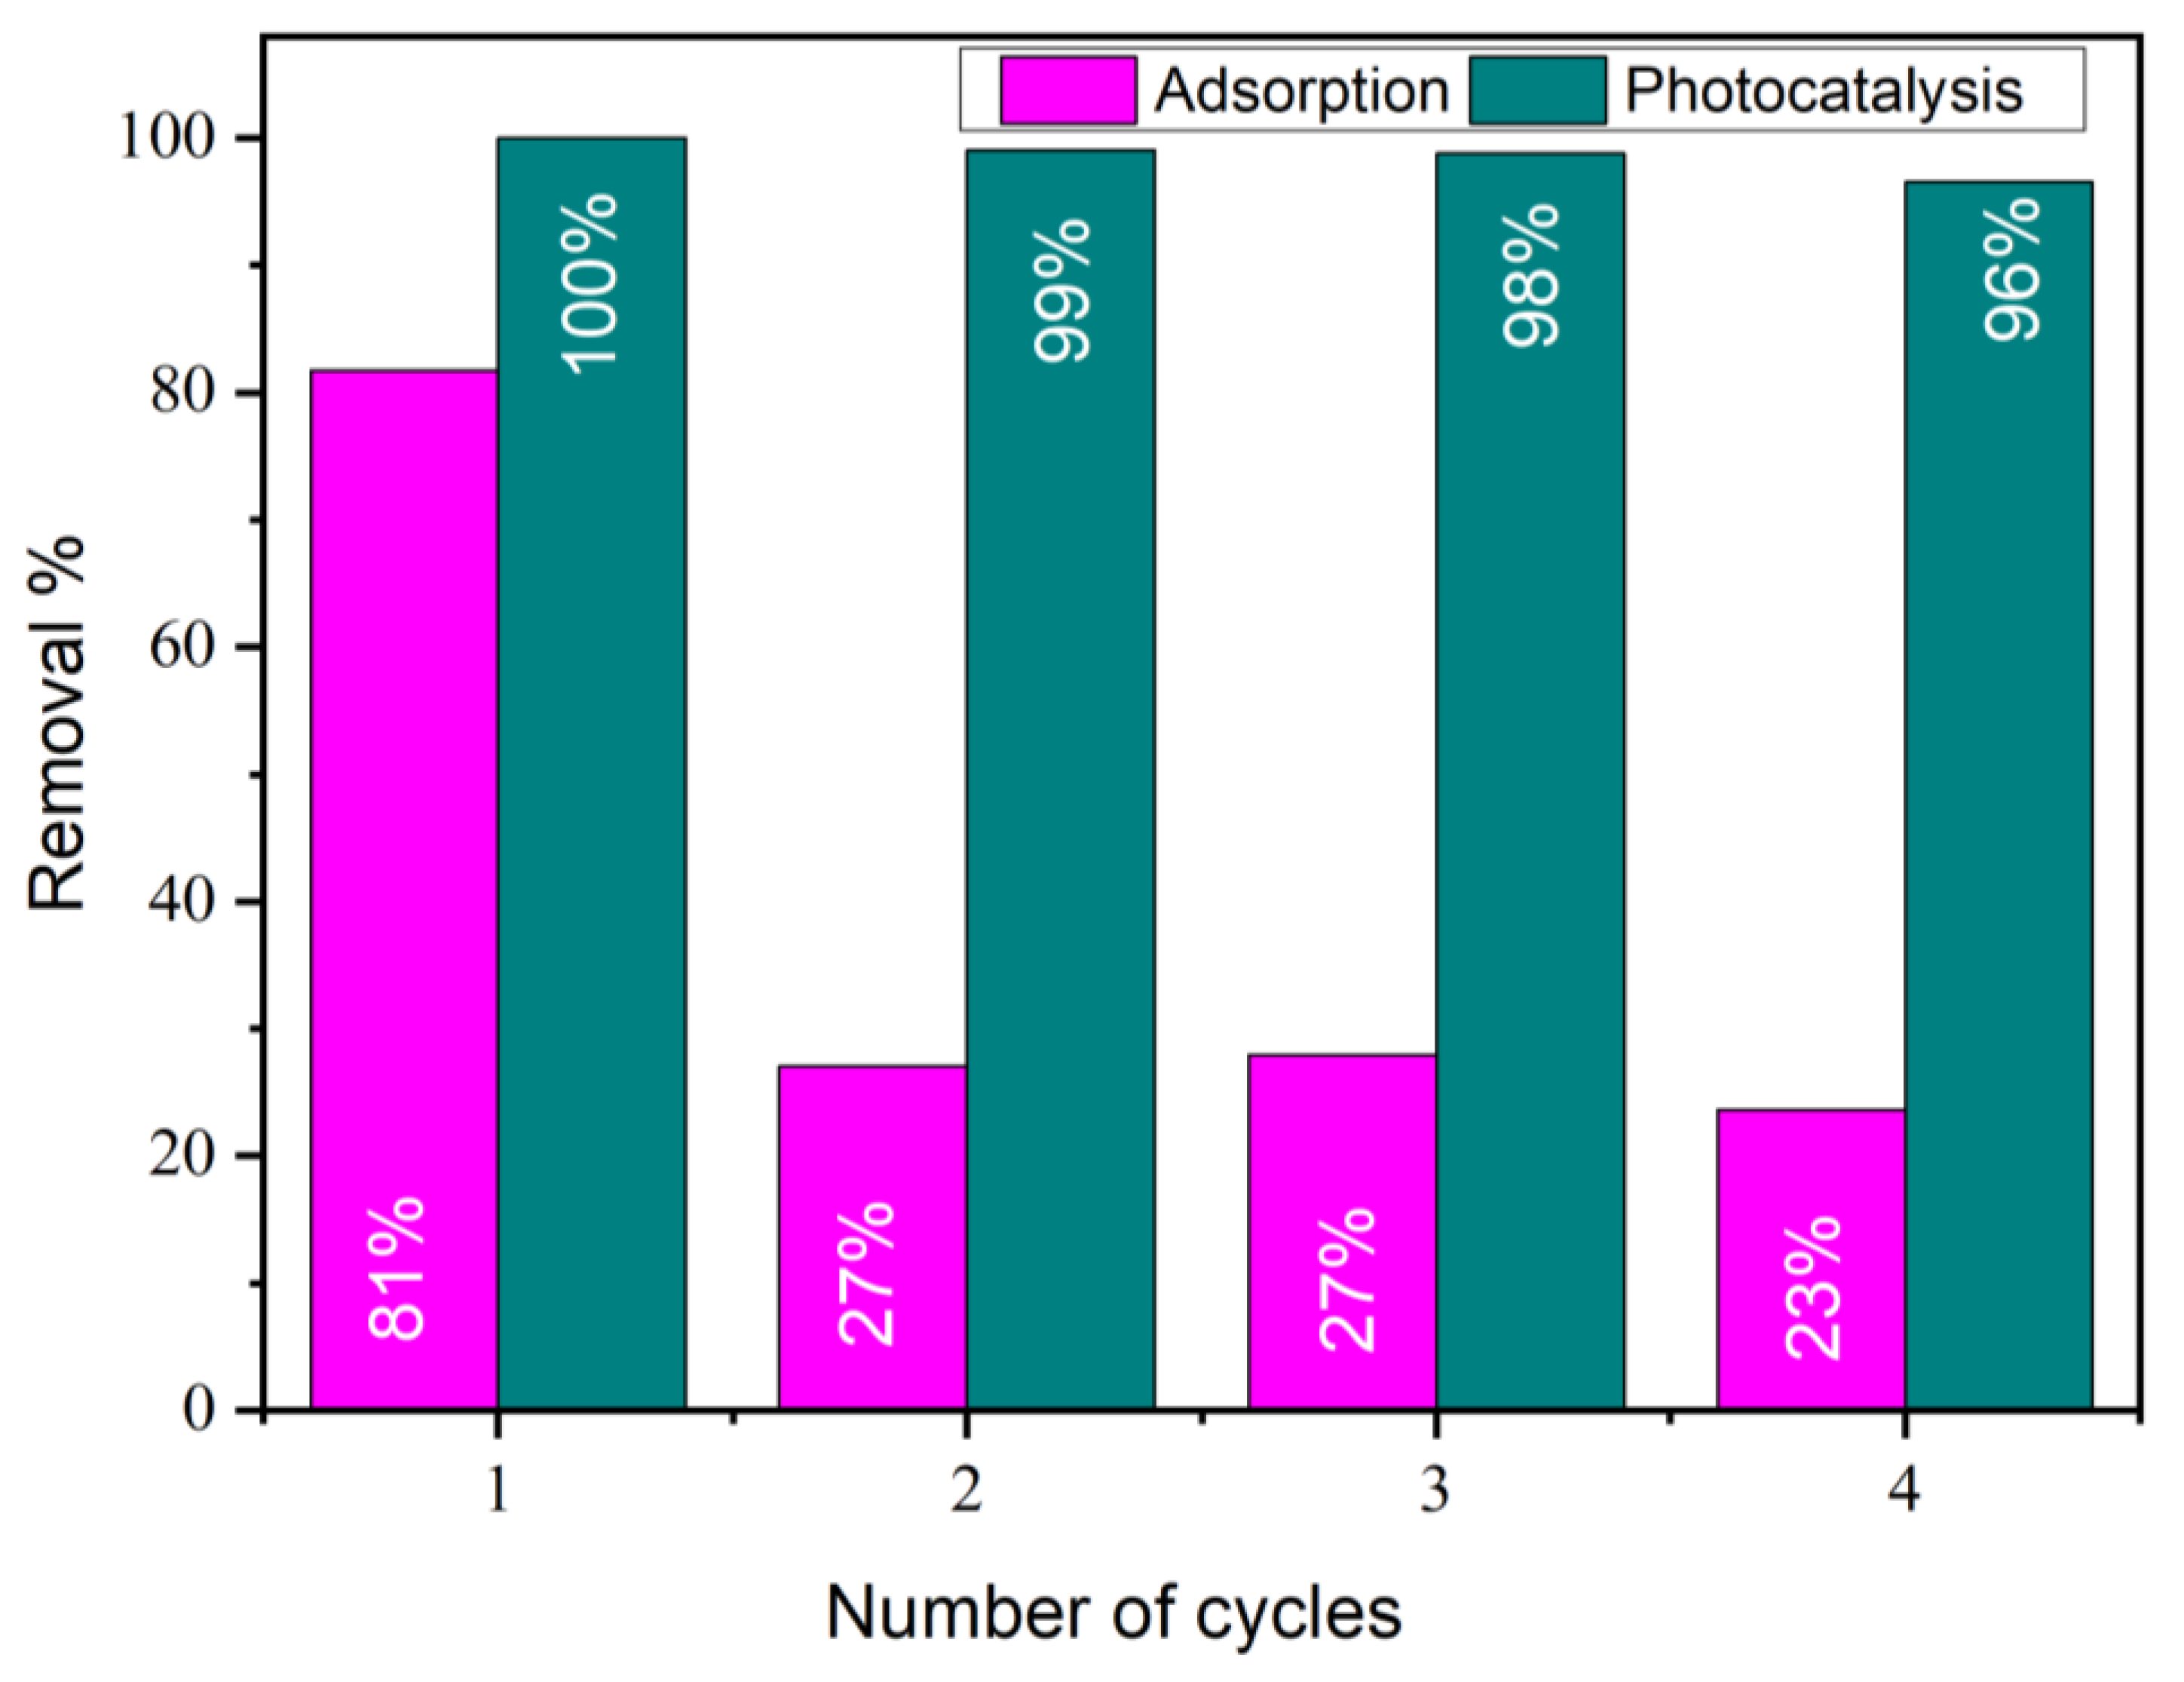
The potential for reusing MMT-Cu3TiO5 was investigated for up to four cycles of OG degradation under the following experimental conditions: an OG concentration of 70 mg/L and a catalyst concentration of 2 g/L, comprising MMT-TiO2 and MMT-Cu3TiO5. The adsorption process was monitored for a duration of 30 min, and the photocatalytic process was monitored for a duration of 120 min at a pH of 3 and a temperature of 25 °C. Subsequent to the completion of each process, the catalyst was extracted from the reaction mixture via centrifugation and subjected to a wash with the same solution that was recovered following the catalyst synthesis process, thereby maintaining the same acidity. Subsequently, the material was washed with distilled water, recovered by centrifugation, and dried at 80 °C. The catalyst’s weight was measured both before and after the regeneration process, and no appreciable loss of the catalyst was observed during this procedure.
As illustrated in
Figure 9, the adsorption capacity of the catalyst exhibited a decline over time. However, the catalyst demonstrated the capacity to sustain the degradation of the dye throughout the same period, which substantiates its ability to maintain the production rate of and the same dye degradation rates. The findings demonstrate the capacity of the MMT- Cu
3TiO
5 catalyst to sustain its photocatalytic efficacy following four successive degradation cycles, exhibiting a modest decline in the extent of OG degradation.
Initially, the capacity of the catalyst to purify itself from adsorbed materials was observed, as evidenced by the DRX and FTIR results (
Figure 10 and
Figure 11, respectively). The absence of new materials after use indicates that the catalyst utilized the photocatalytic properties of the dye to achieve complete degradation.


 ,
, 


