Article

Enhancing Biomedical and Photocatalytic Properties: Synthesis, Characterization, and Evaluation of Copper–Zinc Oxide Nanoparticles via Co-Precipitation Approach

1
Department of Physics, College of Science, Princess Nourah bint Abdulrahman University, P.O. Box 84428, Riyadh 11671, Saudi Arabia
2
King Abdullah Institute for Nanotechnology, King Saud University, P.O. Box 2455, Riyadh 11451, Saudi Arabia
3
Department of Physics, College of Science, Shaqra University, P.O. Box 5701, Shaqra 11961, Saudi Arabia
4
Department of Botany and Microbiology, Faculty of Science, King Saud University, Riyadh 11459, Saudi Arabia
5
Vice Rectorate for Graduate Studies and Scientific Research Central Research Laboratory, King Saud University, Riyadh 11451, Saudi Arabia
6
Department of Chemistry, College of Science, King Saud University, P.O. Box 2455, Riyadh 11451, Saudi Arabia
*
Authors to whom correspondence should be addressed.
Catalysts 2024, 14(9), 641; https://doi.org/10.3390/catal14090641
Submission received: 20 August 2024 / Revised: 12 September 2024 / Accepted: 13 September 2024 / Published: 20 September 2024
(This article belongs to the Special Issue Cutting-Edge Photocatalysis)

Abstract

:
In this work, researchers synthesized copper–zinc oxide nanoparticles (NPs) of different shapes and sizes and tested their antibacterial and anticancer effects. The current research used a straightforward method to synthesize copper-doped zinc oxide nanoparticles (Cu-ZnO NPs). Next, the photocatalytic, antibacterial, and anticancer properties of the Cu-ZnO NPs were ascertained. Nanoparticles of Cu-doped ZnO were synthesized using co-precipitation technology. The physicochemical characterization was carried out using X-ray diffraction (XRD), scanning electron microscopy (SEM), transmission electron microscopy (TEM), ultraviolet–visible (UV-Vis) and Fourier-transform infrared (FTIR) spectroscopy, and other imaging techniques. The SEM analysis confirmed that the particles observed by SEM were found to be below 100 nm in size, which aligns with the results obtained from XRD. The size histogram in the figure inset shows that the nanoparticles are mostly round and have a size range of 5 to 50 nm. The XRD diffractograms revealed the classic structure of wurtzite-phase crystalline Cu-ZnO, and the crystallite size is 26.48 nm. Differences in the principal absorption peaks between the FTIR and UV-vis spectra suggest that varying ZnO NP morphologies might lead to spectrum shifts. We used the agar diffusion method to determine how effective Cu-doped ZnO NPs were against bacteria and the MTT assay to see how well they worked against cancer. The photocatalytic disintegration capacity of Cu-doped ZnO NPs was investigated by degrading crystal violet (CV) and methylene blue (MB) dyes under ultraviolet lamp irradiation. A value of 1.32 eV was recorded for the band gap energy. All peaks conformed to those of the Zn, O, and Cu atoms, and there were no impurities, according to the EDS study. Additionally, the nanoparticles had anticancer properties, indicating that the NPs were specifically targeting cancer cells by inducing cell death. At a 100 µg/mL concentration of the synthesized Cu-doped ZnO NPs, the cell availability percentages for the SW480, MDA-231, and HeLa cell lines were 29.55, 30.15, and 28.2%, respectively. These findings support the idea that Cu-doped ZnO NPs might be a new cancer treatment. Moreover, the results show the percentage of dye degradation over different time durations. After 180 h, the degradation of CV dye reached 79.6%, while MB dye exhibited a degradation of 69.9%. Based on these findings, Cu-doped ZnO NPs have the potential to be effective photocatalysts, antibacterial agents, and cancer fighters. This bodes well for their potential applications in the fields of ecology, medicine, and industry in the future.

1. Introduction

As a fast-expanding area of study, nanotechnology and nanoscience include fundamental knowledge of atomic and subatomic physical, chemical, and biological characteristics with possible applications in electronics, cosmetics, and other areas [1,2,3]. Researchers in nanoscience and nanotechnology are making great strides in unlocking previously inaccessible technological secrets, aiming to create novel materials with enhanced and distinctive properties [4]. The versatile nature of metal oxide nanoparticles is attracting a lot of attention. This is mainly because of the many potential uses for these materials in fields such as optics, electronics, biology, and catalysis. The distinctive characteristics of nanocrystalline materials are determined by both their size and shape. Several techniques have been developed to produce nanocrystalline materials with diverse structures [5].
The potential issues associated with metal oxide nanoparticles stem from their chemical properties, small size, and lack of biodegradability, which may result in their widespread dispersion in the environment, leading to uncertain outcomes. The potential toxicity of metal oxide nanoparticles in water and soil is an area where our current understanding is lacking. When assessing the dangers of metal oxide nanoparticles, it is essential to separate their effects from those of dissolved metals [6].
Titanium dioxide (TiO2) and zinc oxide (ZnO) are two examples of metallic compounds that have shown promise as antibacterial and anticancer agents. Scientists are very interested in ZnO because of its antibacterial and anticancer properties, and it is also cheap and abundant in nature. The capacity of ZnO nanoparticles to cause oxidative stressors, which lead to the breakdown of bacterial cell membranes, is one of the ways in which these particles restrict bacterial growth [7].
The imaging and therapeutic capabilities of engineered nanoparticles (NPs) make them useful for cancer diagnoses and therapy in their early stages [8,9,10,11]. The cancer pandemic in the past few decades has contributed to a dramatic increase in the death toll. Surgery, radiation treatment, and chemotherapy were successful in killing cancer cells, but they killed healthy cells as well. Nanomedicine, tailored drug delivery, and multi-target inhibitors have all contributed to these treatments losing some luster [12]. The ancient Greeks used the antibacterial characteristics of certain metal oxides for use in cooking, knowledge that has existed for millennia [13].
ZnO nanoparticles show several characteristics, such as an advantageous band gap, an electrostatic charge, a high surface area, and the ability to enhance redox-cycling cascades [14,15]. Biomedical applications that take advantage of these features of ZnO nanoparticles include cell imaging, bio-sensing, and medicine delivery. A lot of people are curious about the potential of ZnO nanoparticles to cure cancer. When tested on human cancer cells, ZnO nanoparticles killed cancer cells more effectively than normal cells. Nanoparticles made of zinc oxide may one day be used to combat cancer. Apoptotic events were linked to the potential cytotoxic mechanism of ZnO NPs [16]. Incorporating metal ions into ZnO nanoparticles enhances their capacity to destroy cancer cells, which is the main emphasis of this work. There is a lot of room for surface functionalization on these nanoparticles, and they also have great mechanical strength and thermal stability and a cheap price tag [17].
Nanoscale dopant materials, such as biomolecules and transition metals (Mn, Fe, Cr, Cu), may increase and change the surface area of ZnO nanostructures, improving their functionality and efficiency [18,19]. The production of ZnO and nanoparticles doped with transition metals has been approached from many angles [20]. When it comes to dopants, Cu is one of the most impactful on ZnO NPs’ optical, morphological, structural, electrical, and biological characteristics [21,22]. Electrical conductivity [23], magnetic [24] and biological [25] properties, mechanical strength [1,26], and NPs doped with Cu [27] are only a few of the many properties that have been improved. Compared to undoped ZnO NPs, Cu-doped ZnO NPs exhibited superior anticancer activity [25]. This research intends to use cationic doping to enhance the antibacterial and anticancer properties of ZnO nanoparticles. Cu was traditionally highly regarded for doping ZnO NPs with an element to increase their antibacterial and anticancer properties. The improved anticancer activity of ZnO nanoparticles was discovered to be due, in part, to the doped Cu structure [26]. A thorough investigation was undertaken to confirm the effectiveness of copper doping with ZnO in several areas. The antibacterial and anticancer capabilities of ZnO and Cu-ZnO nanoparticles and their production and characterization are reported here.

2. Experimental Methods

2.1. Materials

The details of using materials for Cu-ZnO NPs are clarified in Table 1.

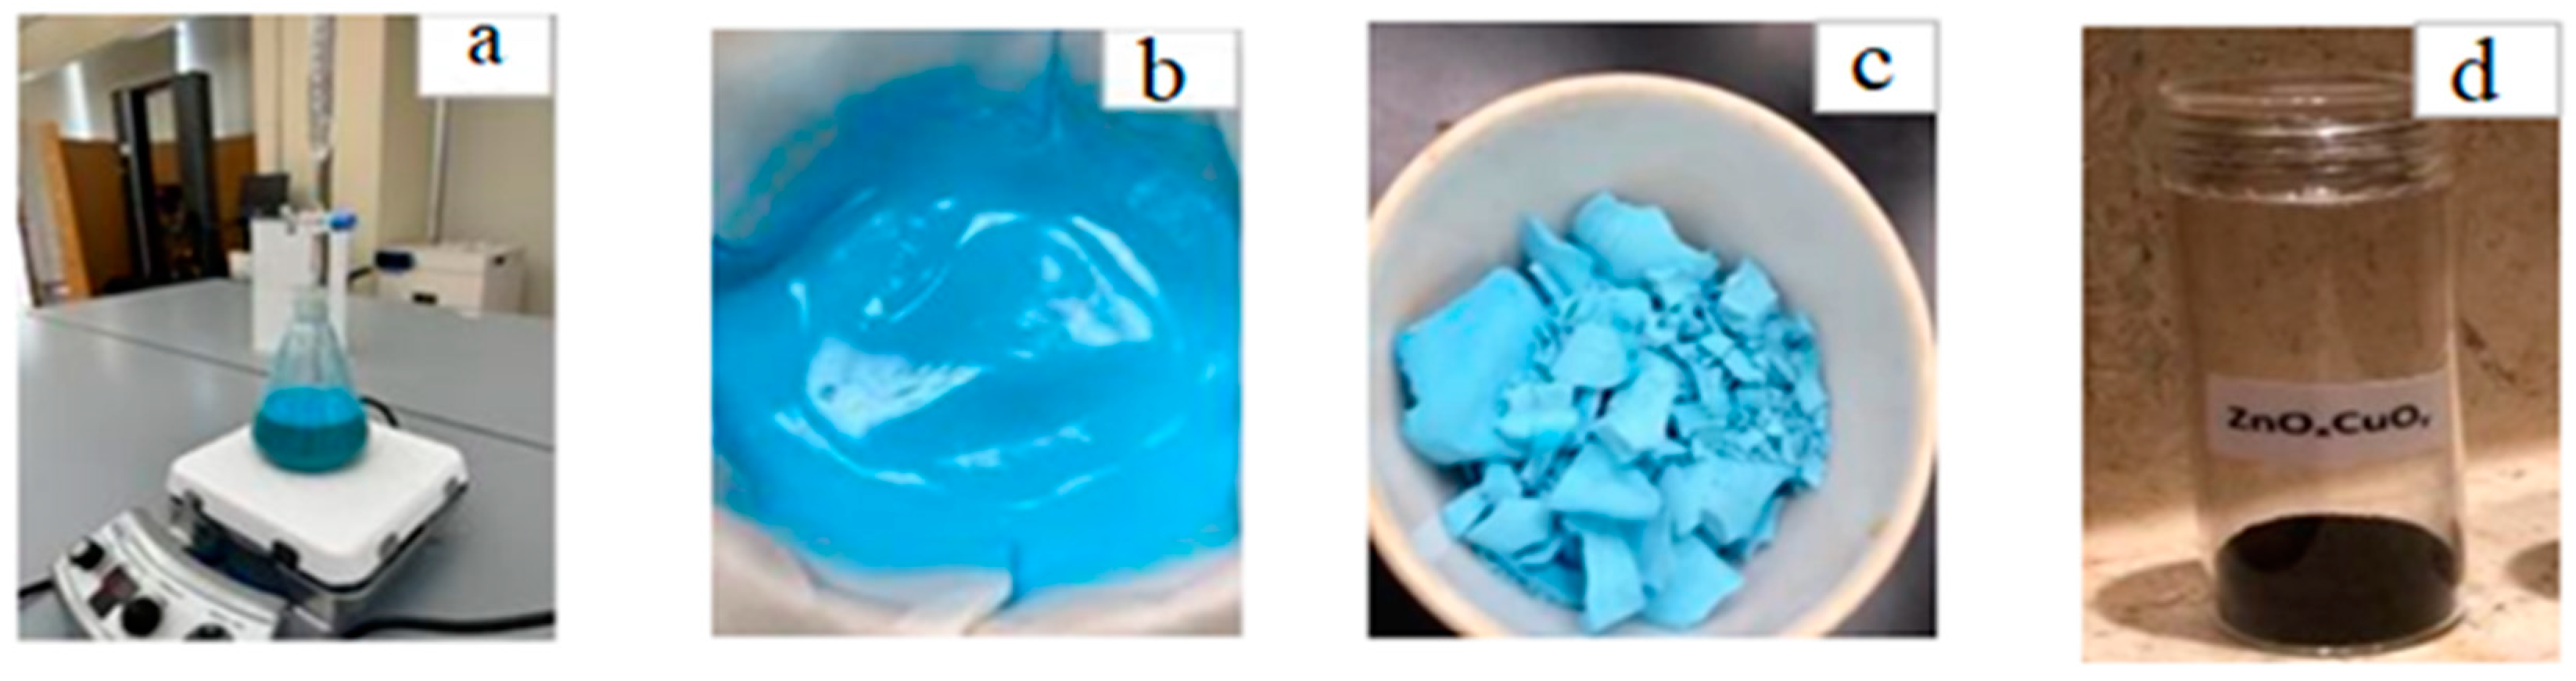
2.2. Preparation of Cu-Doped ZnO NPs

The production of Cu-ZnO NPs via chemical co-precipitation is demonstrated in Figure 1. This involves taking 0.5 M from each aqueous solution of zinc chloride (ZnCl2) and copper chloride (CuCl2) with an equal ratio (50:50) and stirring for 30 min, then adding 2 M of a sodium hydroxide (NaOH) aqueous solution dropwise to the previous mixture solution, until the pH becomes more than 10. Then, the heavy solution is stirred for 3 h, filtered, washed with distilled water, and dried for 24 h. Then, the resulting residue is placed in a furnace at 400 °C and ground. Finally, a copper-doped zinc oxide NP has been obtained, depending on Equation (1) [27].
ZnCl 2   ( aq ) + CuCl 2   ( aq ) + 2 NaOH   ( aq )   ZnCl ( OH ) 2   ( aq ) + 2 NaCl 2   ( aq )

2.3. Characterization Techniques

2.3.1. Scanning Electron Microscopy (SEM) with Energy Dispersive X-ray Analysis (EDX)

The scanning electron microscopy (SEM with EDX, Sirion, London, UK) was used for both the morphological investigation of the sample and the measurement of the Cu-ZnO NPs. A computer screen is then used to display the photos. Energy Dispersive X-ray Spectroscopy (EDX) systems and modern software are standard features of most commercially available SEMs nowadays. One of the advantages of the EDX was the ability to use software to analyze the sample’s composition of many different components.

2.3.2. Transmission Electron Microscopy (TEM)

To determine the main size of Cu-ZnO NPs, transmission electron microscopy (TEM) was used. After being removed from the Zinclear 60CCT (Antaria Ltd., Welshpool, WA, Australia) using acetone, the Cu-ZnO NPs were allowed to dry on a sterile glass slide. Images were captured using transmission electron microscopy (Philips CM10, Philips, Leiden, The Netherlands) after dispersing the collected powder in ethanol at a concentration ranging from 0.01 to 0.1 mM, as described in terms of the Cu-ZnO NP crystal unit cell.

2.3.3. X-ray Diffraction (XRD)

At room temperature, experiments were carried out using Siemens wide-angle X-ray diffraction (WAXD, Siemens D-5000, Bruker AXS GmbH, Karlsruhe, Germany) equipment that is specifically designed for Cu-based GAXRD and works at 40 kV. At a wavelength of 1.54178, CuKα radiation was the origin of the X-rays. The scattered intensities were measured across 2θ values ranging from 5° to 40° in increments of 0.05 s−1. In this project, powder diffraction is frequently used since sample preparation is straightforward, and the test is often quick and non-destructive. The powder diffraction pattern peaks help identify materials quickly, while peak width or position changes help detect crystal size and texture.

2.3.4. Fourier-Transform Infrared Spectroscopy (FTIR)

A few fine Cu-ZnO particles were put separately on the FTIR instrument’s clean infrared transparent surface. A range of 4000–400 cm−1 was used for the infrared scan.

2.3.5. Ultraviolet–Visible Spectroscopy (UV-Vis)

The absorption spectrum of Cu-ZnO NPs was analyzed using a UV-Vis spectrometer (Carry 5000, Varian, Palo Alto, CA, USA). A 2 mm route high-grade UV quartz cuvette contained the suspension and reduced the scattering impact. Since the scattering mean route is much larger than the cuvette pathway throughout the concentration range of our investigation, it may be considered a single scattering event. It is possible to ignore the scattering cross-section of the Cu-ZnO NPs since it is so little in comparison to their absorption cross-section.

2.3.6. Fluorescence

A Perkin Elmer fluorescence LS-55 spectrophotometer (PerkinElmer, Norwalk, CT, USA) was activated to detect the fluorescence spectra of the Cu-ZnO NP aqueous solution. With the use of a quartz cell with a 1 cm path, spectra in the 200–900 nm region were successfully captured. Excitation and emission slits were 1 nm wide and 383 nm long in an experiment that measured fluorescence spectra.

2.3.7. Thermal Gravimetric Analysis (TGA)

The Perkin-Elmer Pyris 1TGA (Perkin Elmer, Norwalk, CT, USA) was used for the thermal gravimetric analysis (TGA). Method steps include heating the sample to 10 °C min−1 in a nitrogen atmosphere at a constant flow rate of 60 mL/min. There was a wide range of temperatures, from ambient to 900 °C. Eight to nine milligrams was the initial mass of the preserved specimens. While the specimens were solid, they underwent all the necessary measurements.

2.4. Photocatalytic Process

Cu-doped ZnO NPs had their photocatalytic potential measured by watching how quickly ponceau in a solution exposed to a visible light source deteriorates [28]. The experimental flask was used to execute the photocatalytic process, which included adding 5 mg of NPs to 50 mL of methylene blue (MB) and crystal violet (CV) dye at a concentration of 10 mg/L separately. Without NPs, the control group consists of dye solutions alone. Before exposing the reaction solution to UV light, it was magnetically agitated in darkness for a few minutes to preserve the chemical component adsorption/desorption equilibrium on the catalyst surface. The photocatalytic breakdown of the dyes was then accelerated by keeping the solution under a halogen light at three-hour intervals; the colors’ absorption was measured using a UV-Vis spectrophotometer.
D E % = C 0 C C 0 × 100
The degradation efficiency (DE%) is a percentage, and the variables C0 and C are the initial and final dye concentrations, respectively.

2.5. Biological Studies

For the microorganism’s activity method, they were tested on autoclaved nutrient agar to test the NPs’ antibacterial properties—pure cultures of human pathogens. Staphylococcus aureus (+ve), Staphylococcus epidermidis (+ve), Shigella sonnei (−ve), and Salmonella enterica (−ve) were collected at King Saud University’s Botany and Microbiology lab and were used. Synthesized Cu-doped ZnO NPs were tested for antibacterial properties using disc diffusion [29]. We sterilized and set aside nutrient agar medium plates. The bacterial cultures were swabbed onto these plates once they had solidified. A zone of clearing surrounding the wells was detected following inhibitory action after dipping the sterile discs in a solution of Cu-doped ZnO NPs (5, 10 µg/mL). Afterwards, they were placed on a plate of nutritious agar and left to incubate at 37 °C for one day. The clearance zones were determined in millimeters by means of a scale. To provide the average values of the zone diameter, the investigations were repeated three times.
For the cell culture and cytotoxicity assay, the MTT assay was carried out using a standard protocol [30]. For the MTT test, a 96-well plate was used to plant 2 × 10⁵ cells per well of human cells from the SW480, MDA-231, and HELA lines of the colon, breast, and cervix, respectively, in 100 μL of the optimum medium. The overall cell count for all experiments was obtained using a trypan blue exclusion test (0.4%) and a cell counter. After a 24 h period of rest, the cells were subjected to Cu-doped ZnO NPs at concentrations varying from 3.125 to 100 µg/mL. Treatment was stopped after 24 h, but cells were allowed to keep growing.
It is advised to provide Cell Titer 96® AQueous One Solution (G3582, Promega, Madison, WI, USA) for at least 48 h to take effect. We put 100 μL of culture media and 20 L of Cell Titer 96® AQueous One Solution Reagent onto a 96-well assay plate. Then, we placed the plate in an incubator at 37 degrees Celsius and 2 h of 5% carbon dioxide humidity. This experiment aims to quantify the cellular breakdown of MTS that yields soluble formazan.
A 96-well plate reader, such as the Molecular Devices (Espectra max Plus 384, Molecular Devices Inc., Sunnyvale, CA, USA), is ideal for measuring absorbance at 490 nm. Three independent experiments were conducted for each condition. Optical density values were adjusted to those of untreated cells as a baseline. Therefore, untreated cell viability measurements should equal 100%, but treated cell viability values should be either less than or more than 100%. For the math, we utilized this equation [1]:
Cell   viability   ( % ) = T o t a l   c e l l s v i a b l e   c e l l t o t a l   C e l l s × 100

3. Results and Discussion

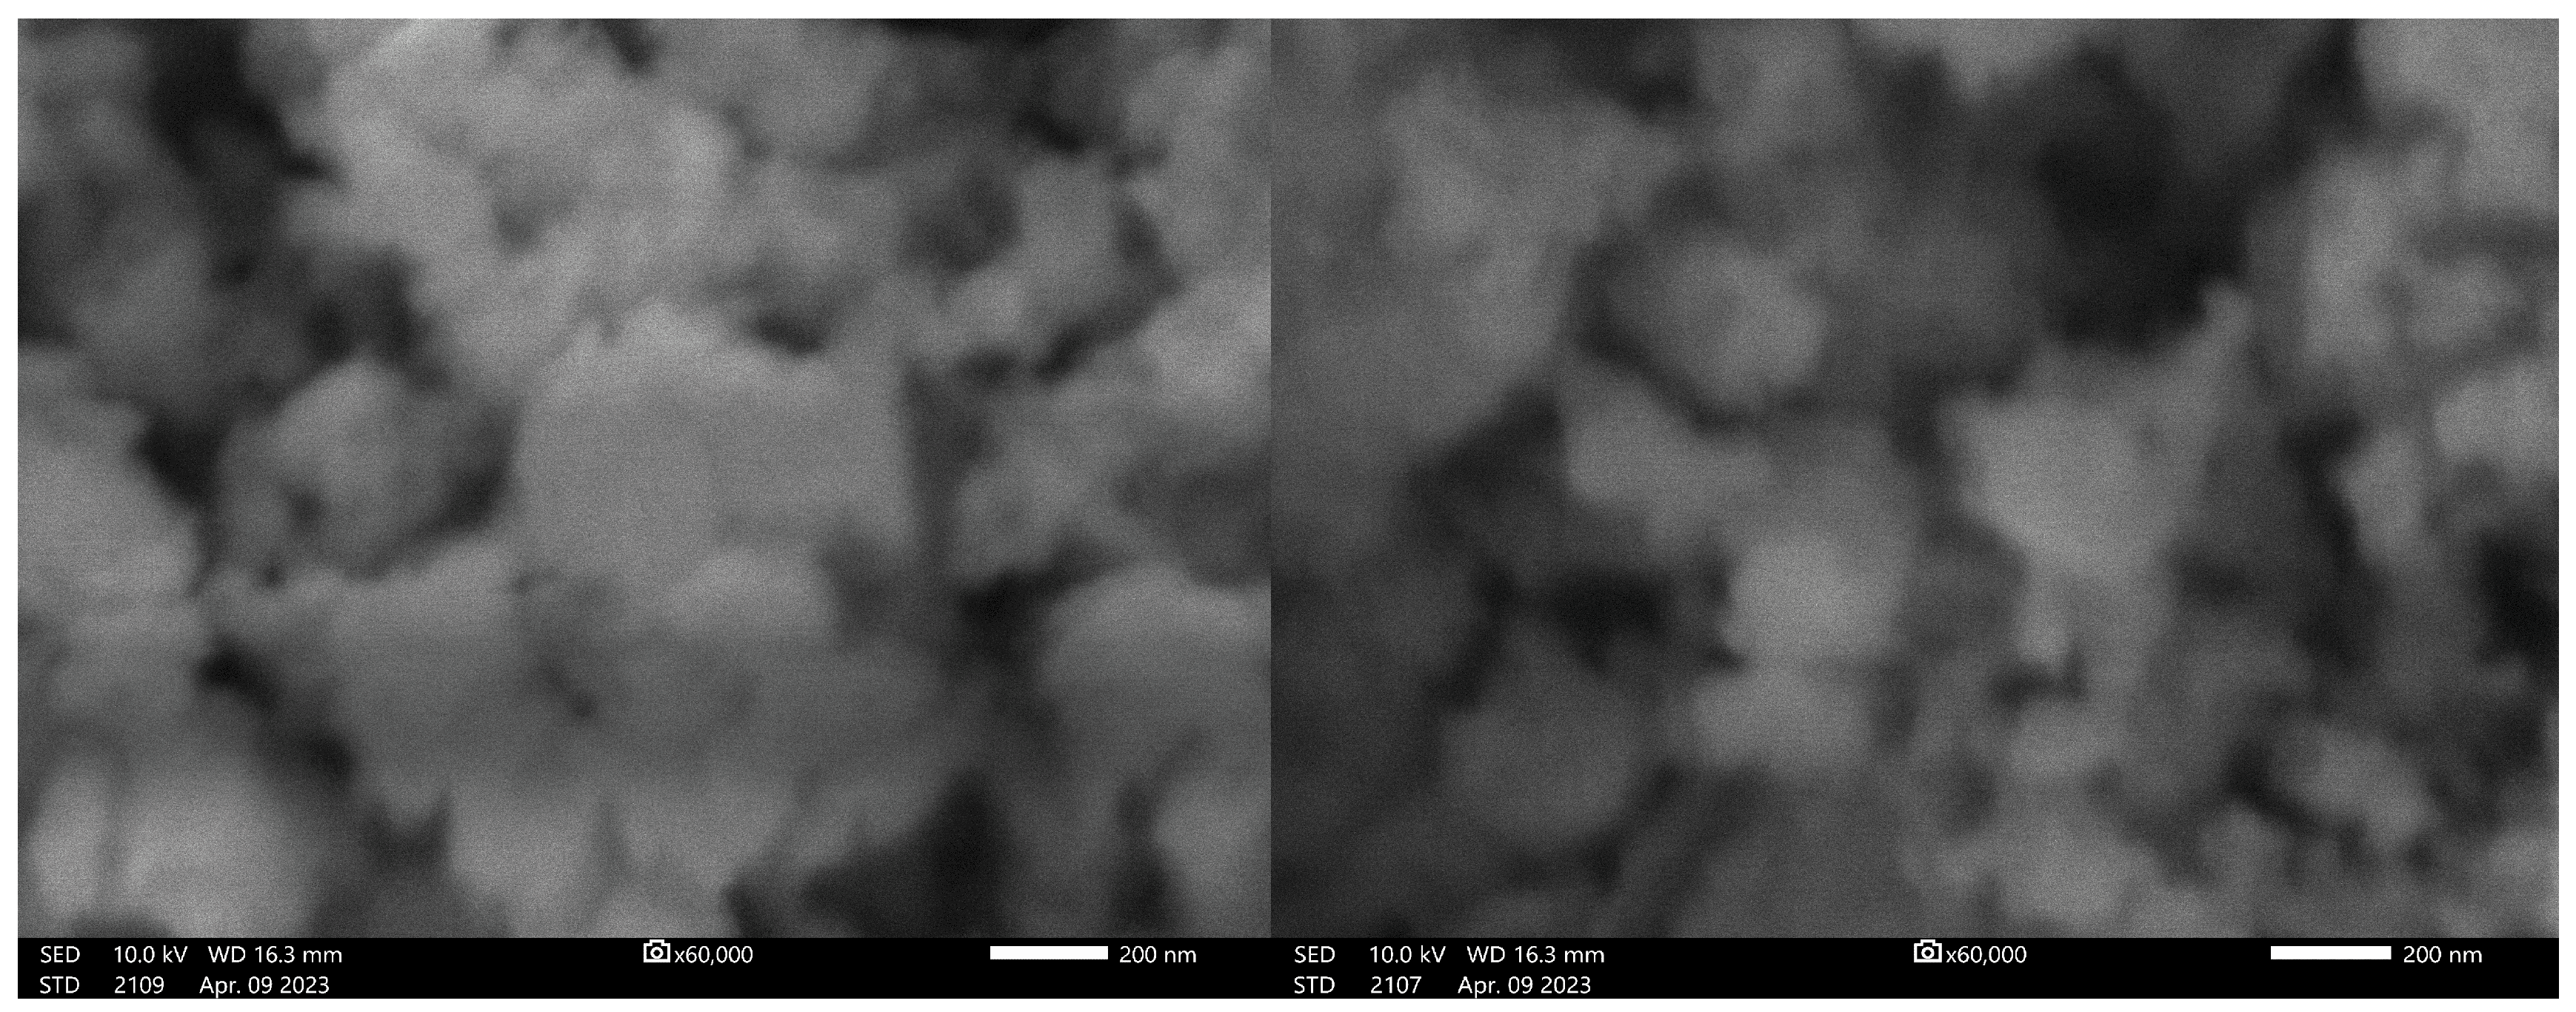
3.1. Scanning Electron Microscopy (SEM) Studies

Scanning electron microscopy (SEM) was used to analyze the surface morphologies of the synthesized Cu-doped ZnO NPs. Figure 2 shows that the surface of the generated Cu-doped ZnO nanoparticles is uniform and evenly distributed [31]. Nanoparticles in the 5–50 nm size range have a mostly spherical shape, as seen in the figure inset. Nanoparticles undergo a process of shrinkage, size and shape uniformity, and final sphericity when doped with copper oxide [32,33,34] compared to pure Zn NPs [35]. The scanning electron microscopy (SEM) results showed that the size and shape of the ZnO NPs were impacted by the degree of Cu doping. Previous research has shown similar outcomes [28].

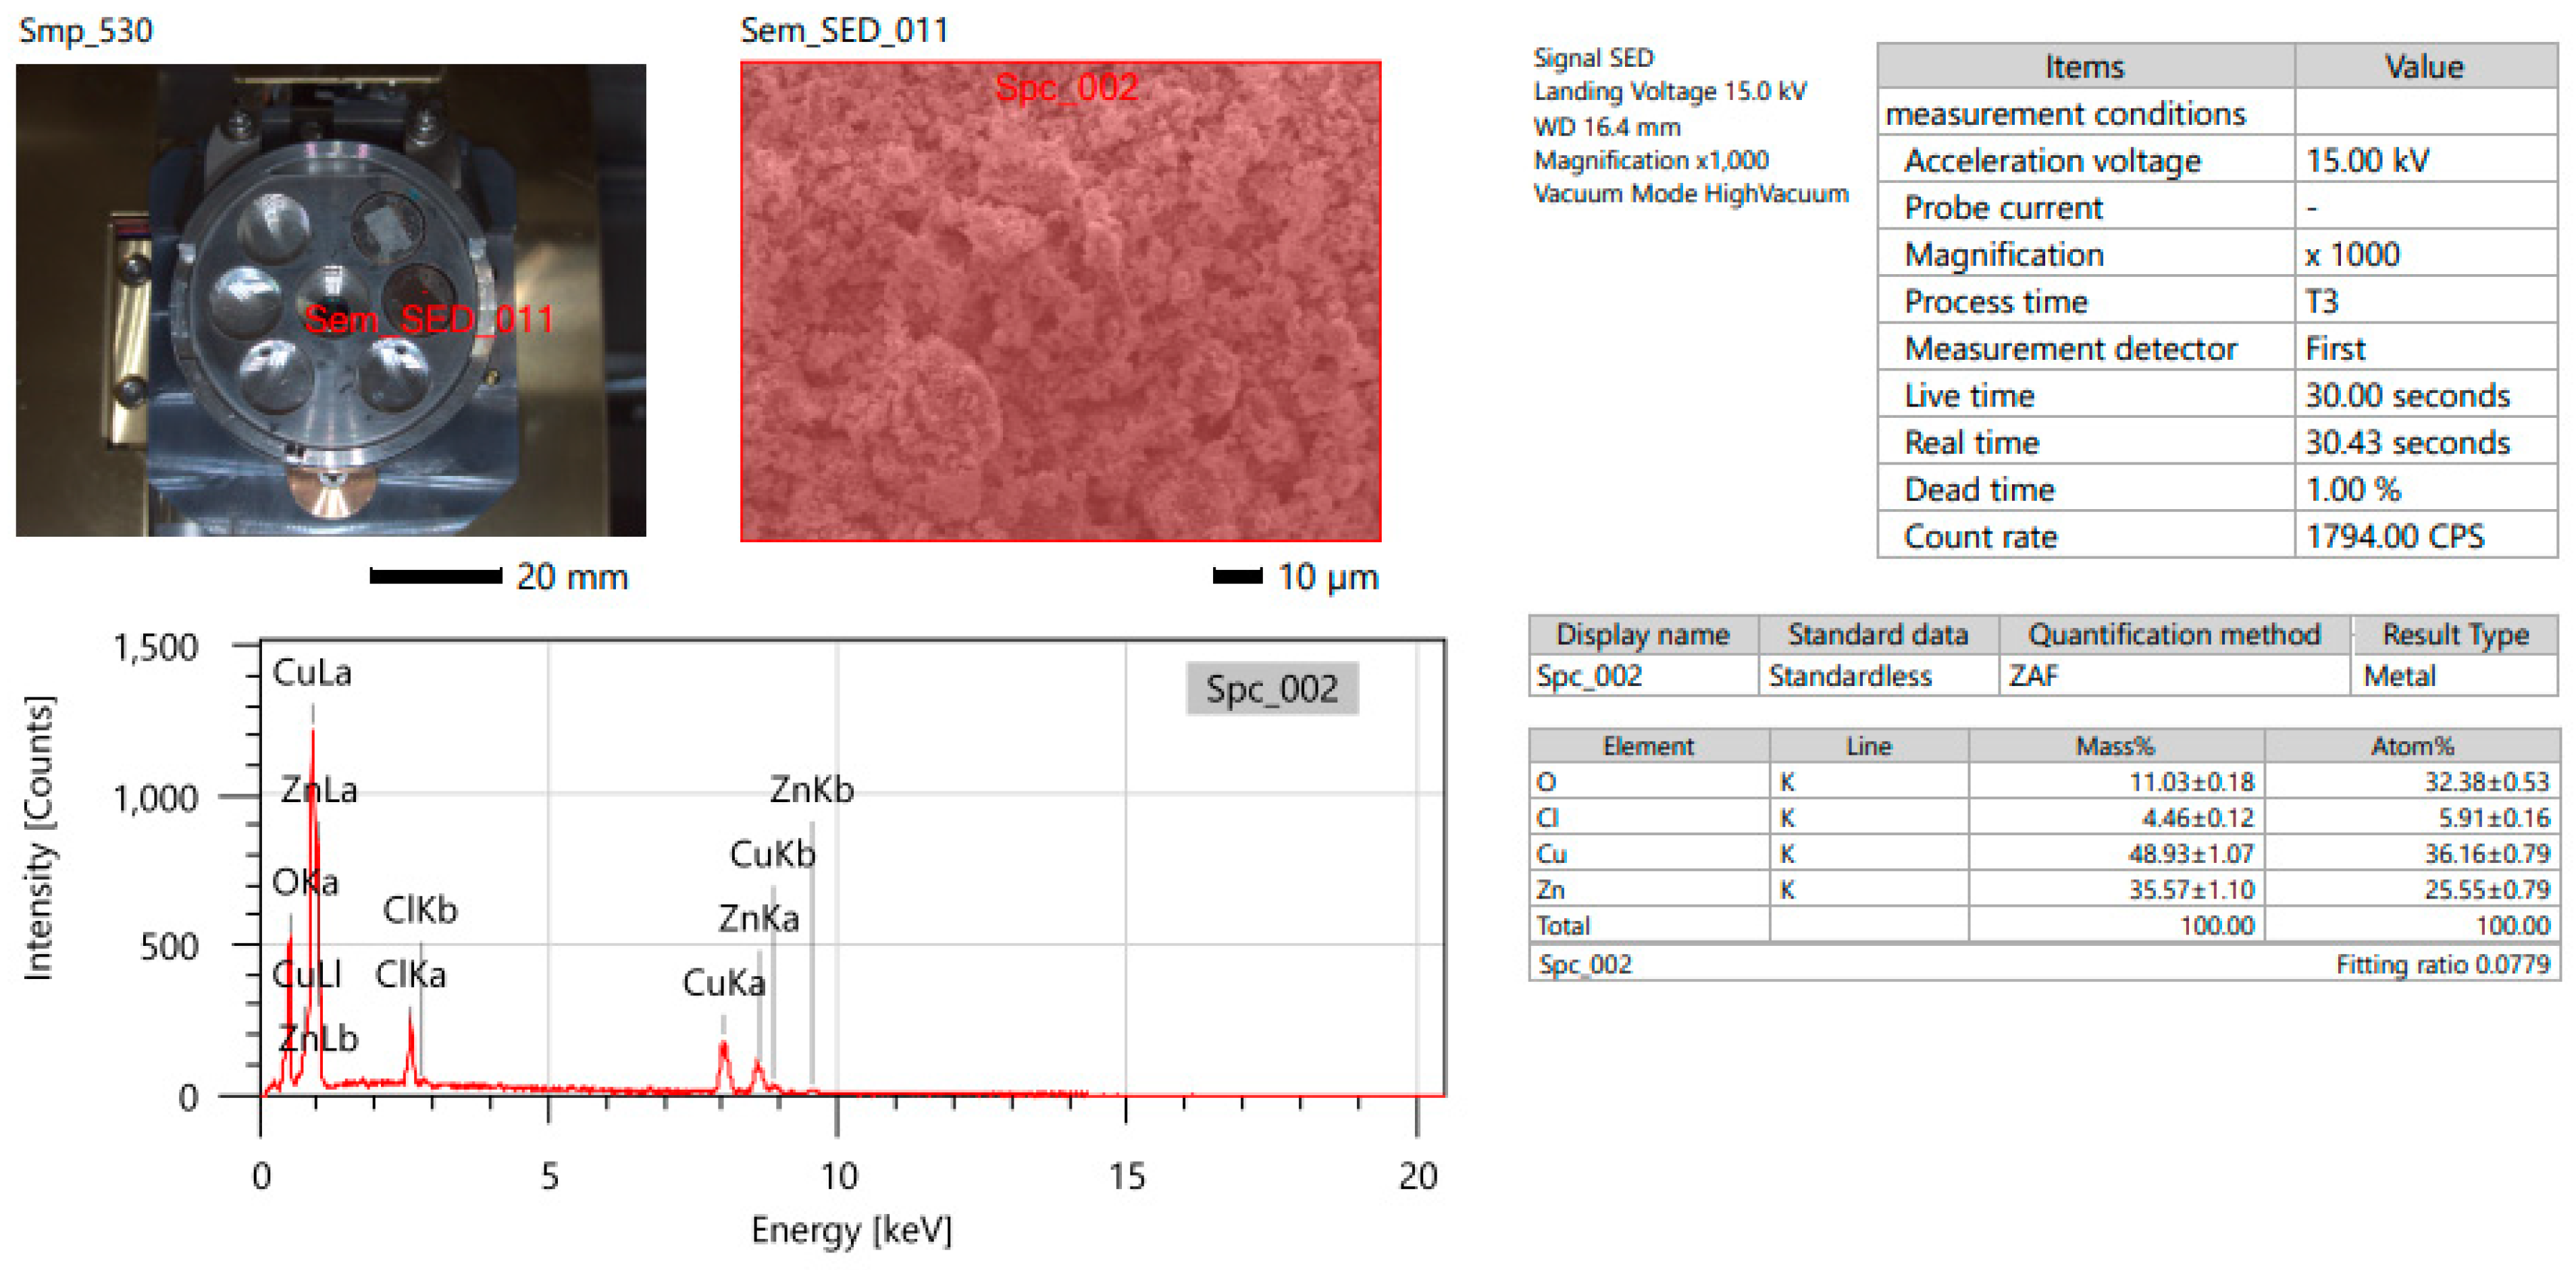
3.2. Energy-Dispersive X-ray Analysis (EDX) Analysis

The synthesis and chemical makeup of Cu-ZnO NPs were investigated by an EDX study. The Cu-ZnO EDX spectrum is shown in Figure 3. Additional proof of the sample’s chemical components was supplied by the EDX spectra. Specifically, the analysis revealed that the sample, known as Cu-ZnO, mainly consisted of copper (48.93%), zinc (35.57%), oxygen (11.3%), and a small amount of chlorine (4.46%). Importantly, no additional contaminants were detected in the sample. The locations of the EDX peaks agreed with those expected for ZnO, and the distinct peaks seen in the EDX analysis suggested that the synthesized nanoparticles have crystalline structures [36,37]. Products with a high degree of crystallinity are indicated by diffraction peaks with narrow widths and significant intensity, consistent with other studies, this one found [38].

3.3. XRD Results

X-ray diffraction is a fascinating analytical tool that may reveal the crystal structures and chemical composition of both naturally occurring and man-made materials [39]. A well-crystalline hexagonal array has formed in the Cu-ZnO NPs, according to the XRD spectra. However, XRD spectra reveal the absence of any further phase. The excellent crystalline structure of the Cu-ZnO NPs is shown by the sharp diffraction peaks exhibited in Figure 4. There was no discernible peak associated with any impurity [40]. Particles of the nanoscale scale were revealed by the widening of the peaks. The NPs of Cu-ZnO often exhibit the XRD patterns seen in Figure 4. Sharp peaks indicate the hexagonal wurtzite structure of ZnO, according to JCPDS Card No. 00-001-1136 [41]. Hexagonal wurtzite is the most prevalent stable ZnO phase among numerous others. There were other peaks in the XRD pattern that were associated with impurities and phases. According to ICDD card no. D.B. 01-080-1917, such peaks are caused by Cu insertion into the Zn interstitial gaps [38]. These peaks reveal a hexagonal wurtzite structure in addition to a monoclinic structure with unequal lattice parameters (a = 0.28 nm, b = 0.3422 nm, and c = 0.5069 nm), as shown in Table 2. The crystallite size of the sample has been derived using Scherrer’s formula D = 0.9 λ β   c o s θ . Based on this formula, the average grain size of the Cu-doped ZnO NPs was 26.48 nm, which was determined by analyzing the three most significant peaks, as shown in Table 3. The XRD data (Figure 4) show patterns with numerous sharp peaks, which suggest that the Cu-ZnO NP samples are of exceptional quality. The crystalline nanostructure and tiny grain size further support this claim.
In this case, the wavelength of the X-rays emitted by a copper source is 1.5406 Å, the diffraction angle is denoted by θ, the average size of the crystallites is denoted by γ, and the full width at half maximum (FWHM) of the observed peak is defined. In accordance with the findings of the scanning electron microscopy and ultraviolet spectroscopy, the size range of the sample reveals the nanoscale regime of the particles that were created. Furthermore, Cu-ZnO NPs have an average crystallite size of 26.48 nm, which is in agreement with contemporary TEM findings as well as the published literature [42,43].
This confirms the formation of Cu-ZnO NPs and may be caused by copper oxidation upon the addition of copper. In addition, whereas copper does not change the crystalline phase, it does affect the FWHM of the peaks. The crystalline character of the samples was shown by the examination of both XRD patterns, which revealed very sharp and strong peaks. Microstrain is caused by atoms’ inconsistent dislocations from their lattice positions and defects, which account for many of nanostructures’ extraordinary chemical and physical properties, and which widened the peaks [44].

3.4. TEM Results

TEM pictures of Cu-ZnO NP film in Figure 5a show that NPs have a spherical shape, and Figure 5b shows that their average particle size is 26.77 nm. The particle-size distribution histogram and transmission electron microscopy (TEM) images both show that the Cu-ZnO NPs were spherical with diameters between 5 and 60 nm. Researchers found that when nanoparticles were doped with copper oxide, they shrank and were more homogeneous in shape [45,46].

3.5. FTIR Results

After all this getting ready, spectroscopy infrared FT-IR was used to analyze Cu–ZnO NPs, as seen in Figure 6. Observable peaks corresponding to the Zn–O bond fall between the 500 and 4000 cm−1 range. Interestingly, as the particle sizes grow, this peak moves to higher wavenumbers. As a rule, NP size and shape may affect the FTIR spectrum [47]. Peaks at about 3462 cm−1 were seen in all ZnO NPs, which are indicative of O–H bonds. O–H bonds with very low bands are due to the minute presence of a moisture content [48]. The peak observed at 1634 cm−1 is attributed to the O−H stretching vibration of H2O in the Cu−ZnO lattice while the peak at 1400 cm−1 is linked to the C–H bond, whereas the peak at 3462 cm−1 is linked to the vibration of the N-H bond [49]. Also, between 700 and 1400 cm−1, there are a few modest peaks that are linked to residues [50]. The formation of clusters (M–O) is indicated by the peak at 483 cm−1, as shown by the FT-IR analysis. The compound known as Cu–ZnO NPs has been synthesized.

3.6. UV-Vis Results

The UV-Vis absorption spectra of Cu–ZnO NPs are shown in Figure 7. The produced NPs’ outstanding optical properties likely explain their robust and broad UV absorption. A large peak of absorbance was seen at around 456.43 nm for Cu–ZnO NPs in the UV–Visible absorption spectrum of the Cu–ZnO NPs. Furthermore, a broad spectrum of absorption was detected between 300 and 700 nm. These broad absorption peaks may be explained by the presence of Cu2+ ions in the produced Cu–ZnO NPs [51] compared to the peak in reference [35] for pure ZnO. The results of calculating the photocatalyst’s direct band gap energy using the Tauc plot approach are shown in Figure 8. This is accomplished by plotting (αhv)2 against photon energy (hv) (eV). A tight relationship exists between the optical direct band gap of Cu-doped ZnO reported at 1.32 eV and the absorption of visible light. According to [12], Cu-doped ZnO exhibited lower transmittances and greater absorptions across the board than pure ZnO. This might be because the vast flaw lowered transmittance and increased absorption in the visible area, leading to this outcome. The change in doping concentration significantly impacted the optical characteristics of the ZnO NPs. These characteristics show that the photocatalytic activity of ZnO NPs was enhanced by doping them with Cu, which allowed them to absorb light in the visible spectrum [52,53].

3.7. Fluorescence Emission

From 200 to 270 nm, λexc was changed every 10 nm, as shown in Figure 9. The system generates two distinct emission bands at 300 and 600 nm at those wavelengths; these bands hypsochromically shift as the excitation energy diminishes, making the red edge excitation shift (REES) phenomenon obvious. Ref. [54] reported several media, including micro-emulsions, may have their solvation dynamics studied using this REES [55]. An excited fluorophore causes a dipolar and non-viscous solvent to relax around them at a rate that is much greater than the fluorescence lifetime. Even if the excitation wavelength has no impact on the fluorescence band, the REES effect will cause the emission maxima to move to lower energy as the excitation wavelength rises. If the excited-state solvent relaxation is sufficiently slow and coincides with the fluorescence lifetime, then this will be the case [56]. So, there are two groups visible in the emission spectra: one is stable at high energy (300 nm) independent of the excitation energy, while the other is affected by the REES effect (emi > 30 nm). Nanoparticles’ varying charge densities produce this spectroscopic effect by causing water dipoles to migrate at a snail’s pace over their surfaces [55].

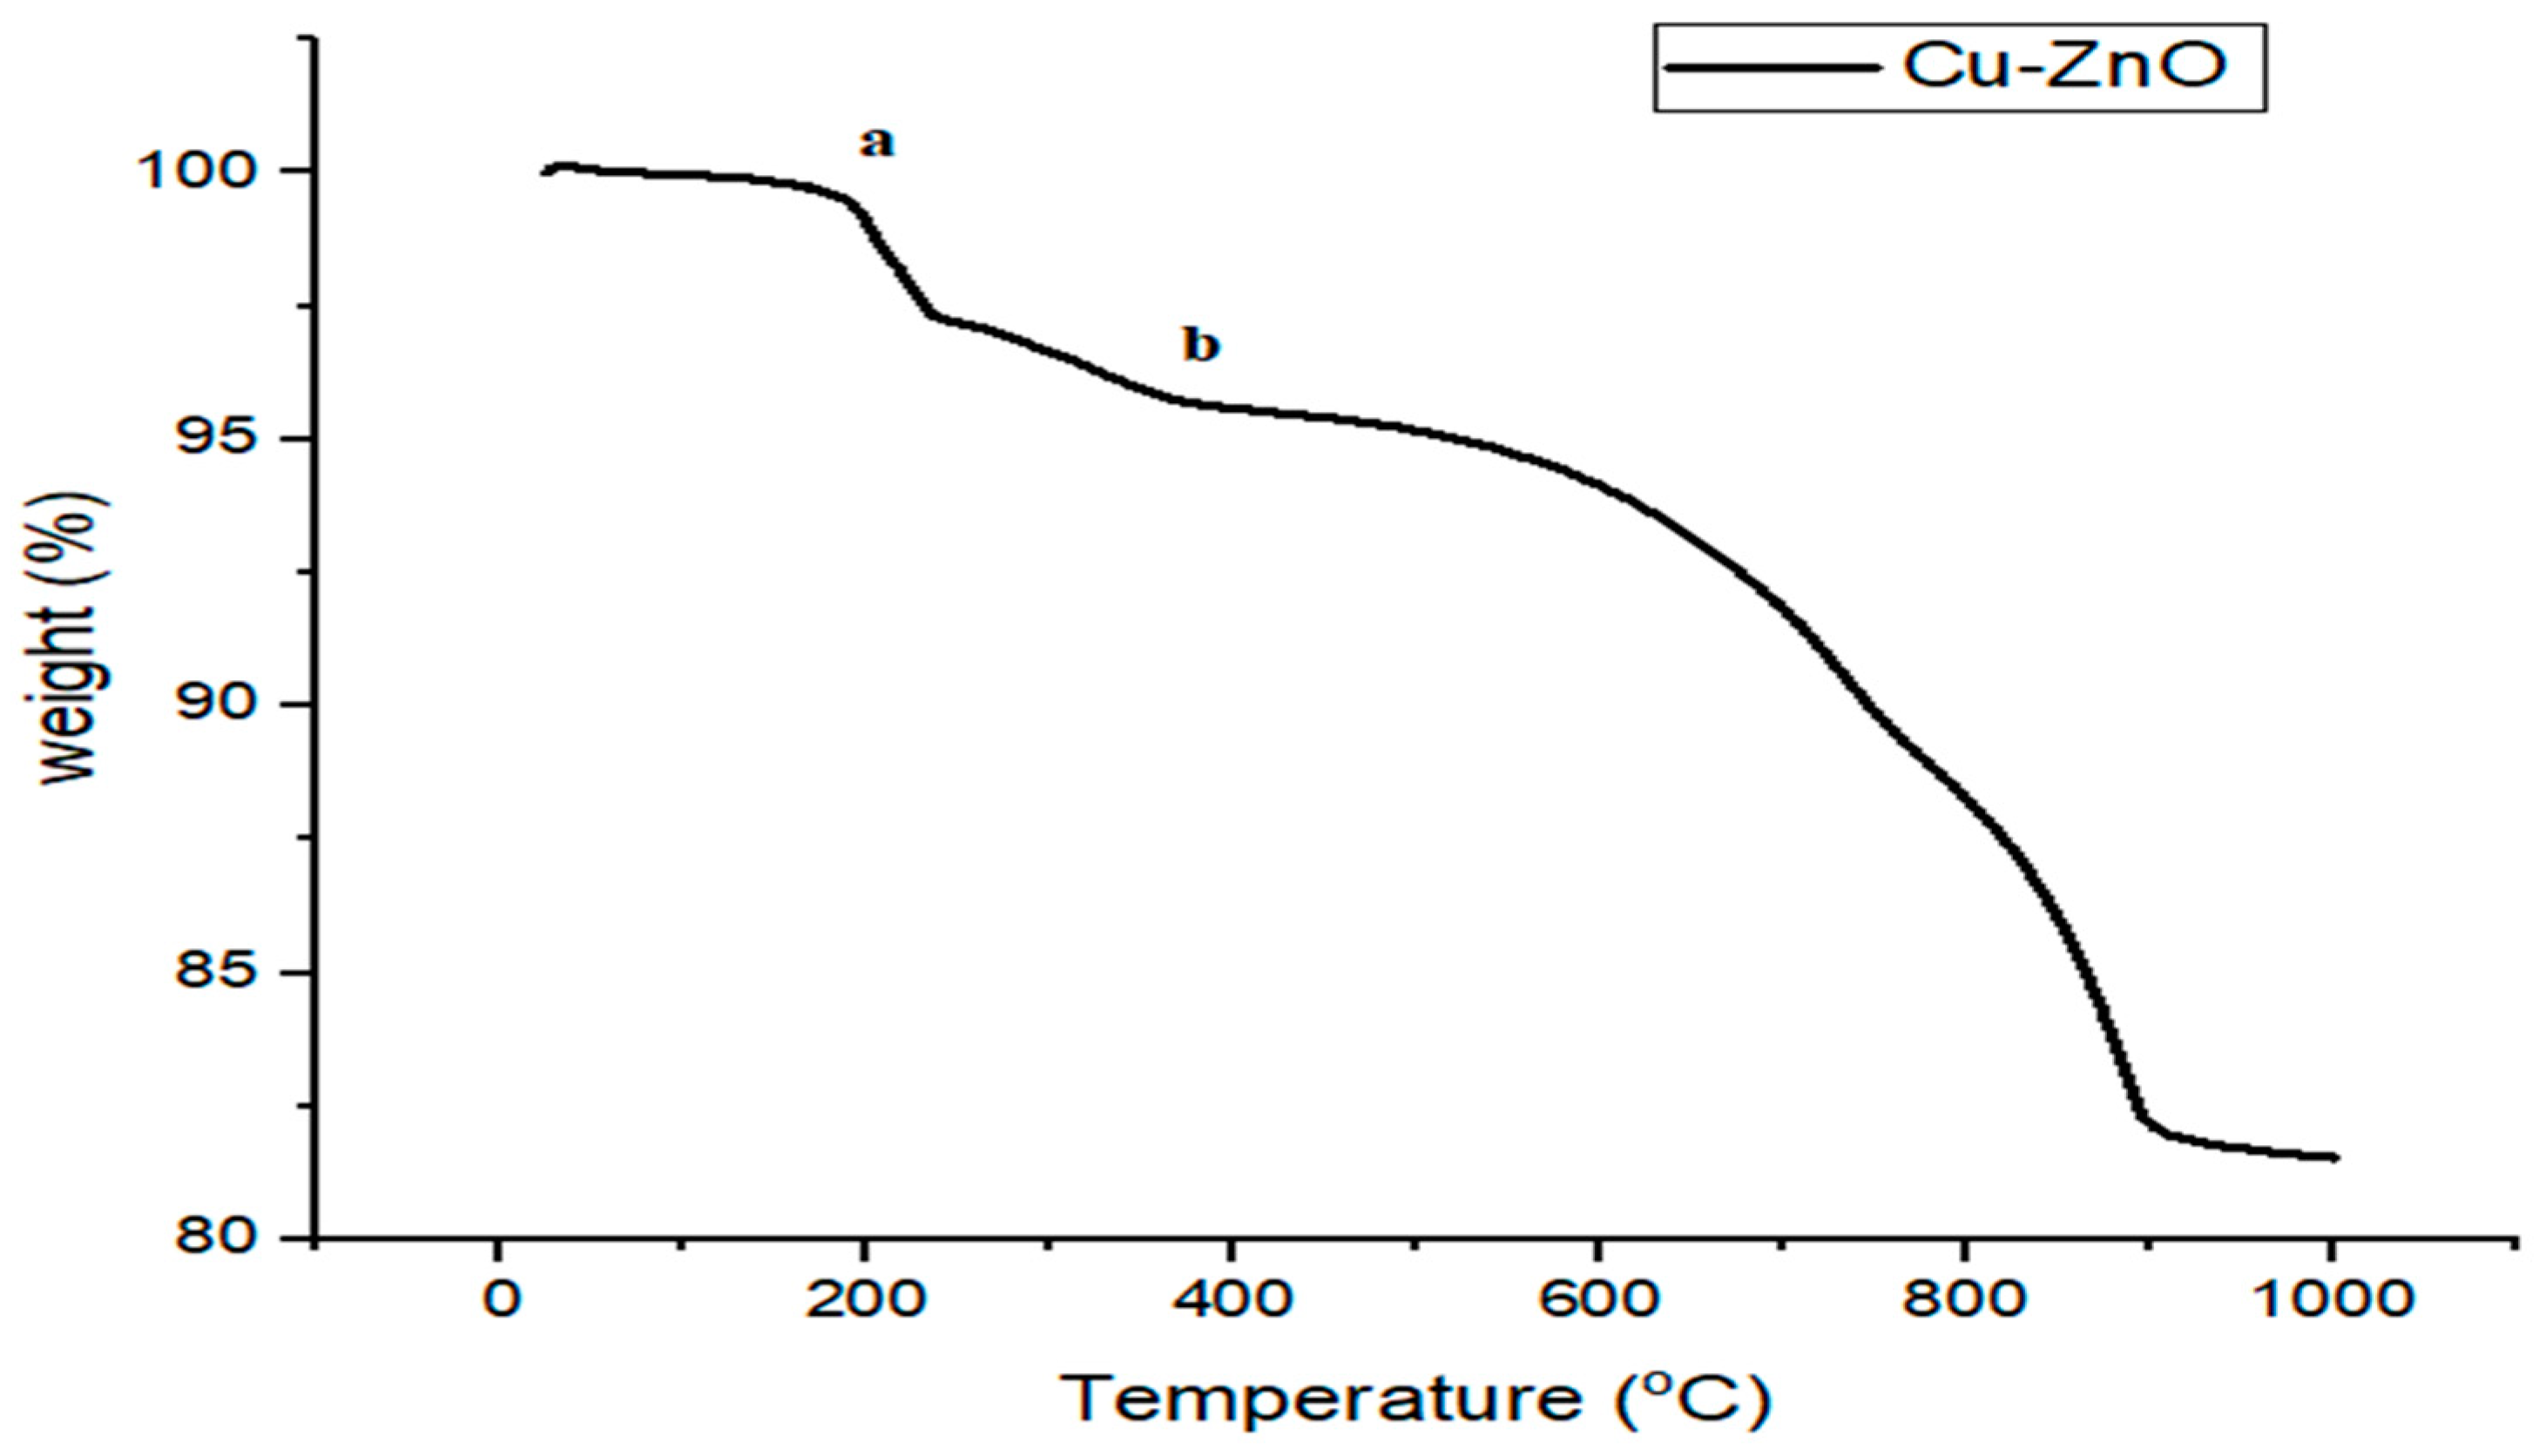
3.8. Cu-ZnO TGA Analysis

As shown in Figure 10, the temperature gradient analysis (TGA) of Cu-ZnO NPs exhibits that the thermal decomposition of Cu-doped ZnO NPs takes place in three steps below 570 °C. The first weight loss is recorded in the temperature range 0–200 °C with an endothermic peak (a) at 188 °C, which is due to the evaporation of the water content. Weight loss between 238 and 380 °C might be ascribed to the volatilization and combustion of organic species in the sample. There is a large endothermic peak (b) at 380 °C. There is weight loss within the temperature range 380–564 °C, which shows the crystallization of Cu-doped ZnO [57]. Since there is negligible change in weight above 570 °C, the annealing temperature of the Cu-doped ZnO is optimized at 500 °C. The structural investigations and thermal assessments mentioned earlier make it very evident that chemical precipitation-synthesized nano-oxides are different from Cu-doped ZnO NPs that are commercially accessible. There are more flaws in the chemical precipitation-obtained materials because their structure is less organized and contains amorphous components. These flaws may be crucial in reactive oxygen species (ROS) production, potentially leading to a dramatic upsurge in antibacterial activity [57].

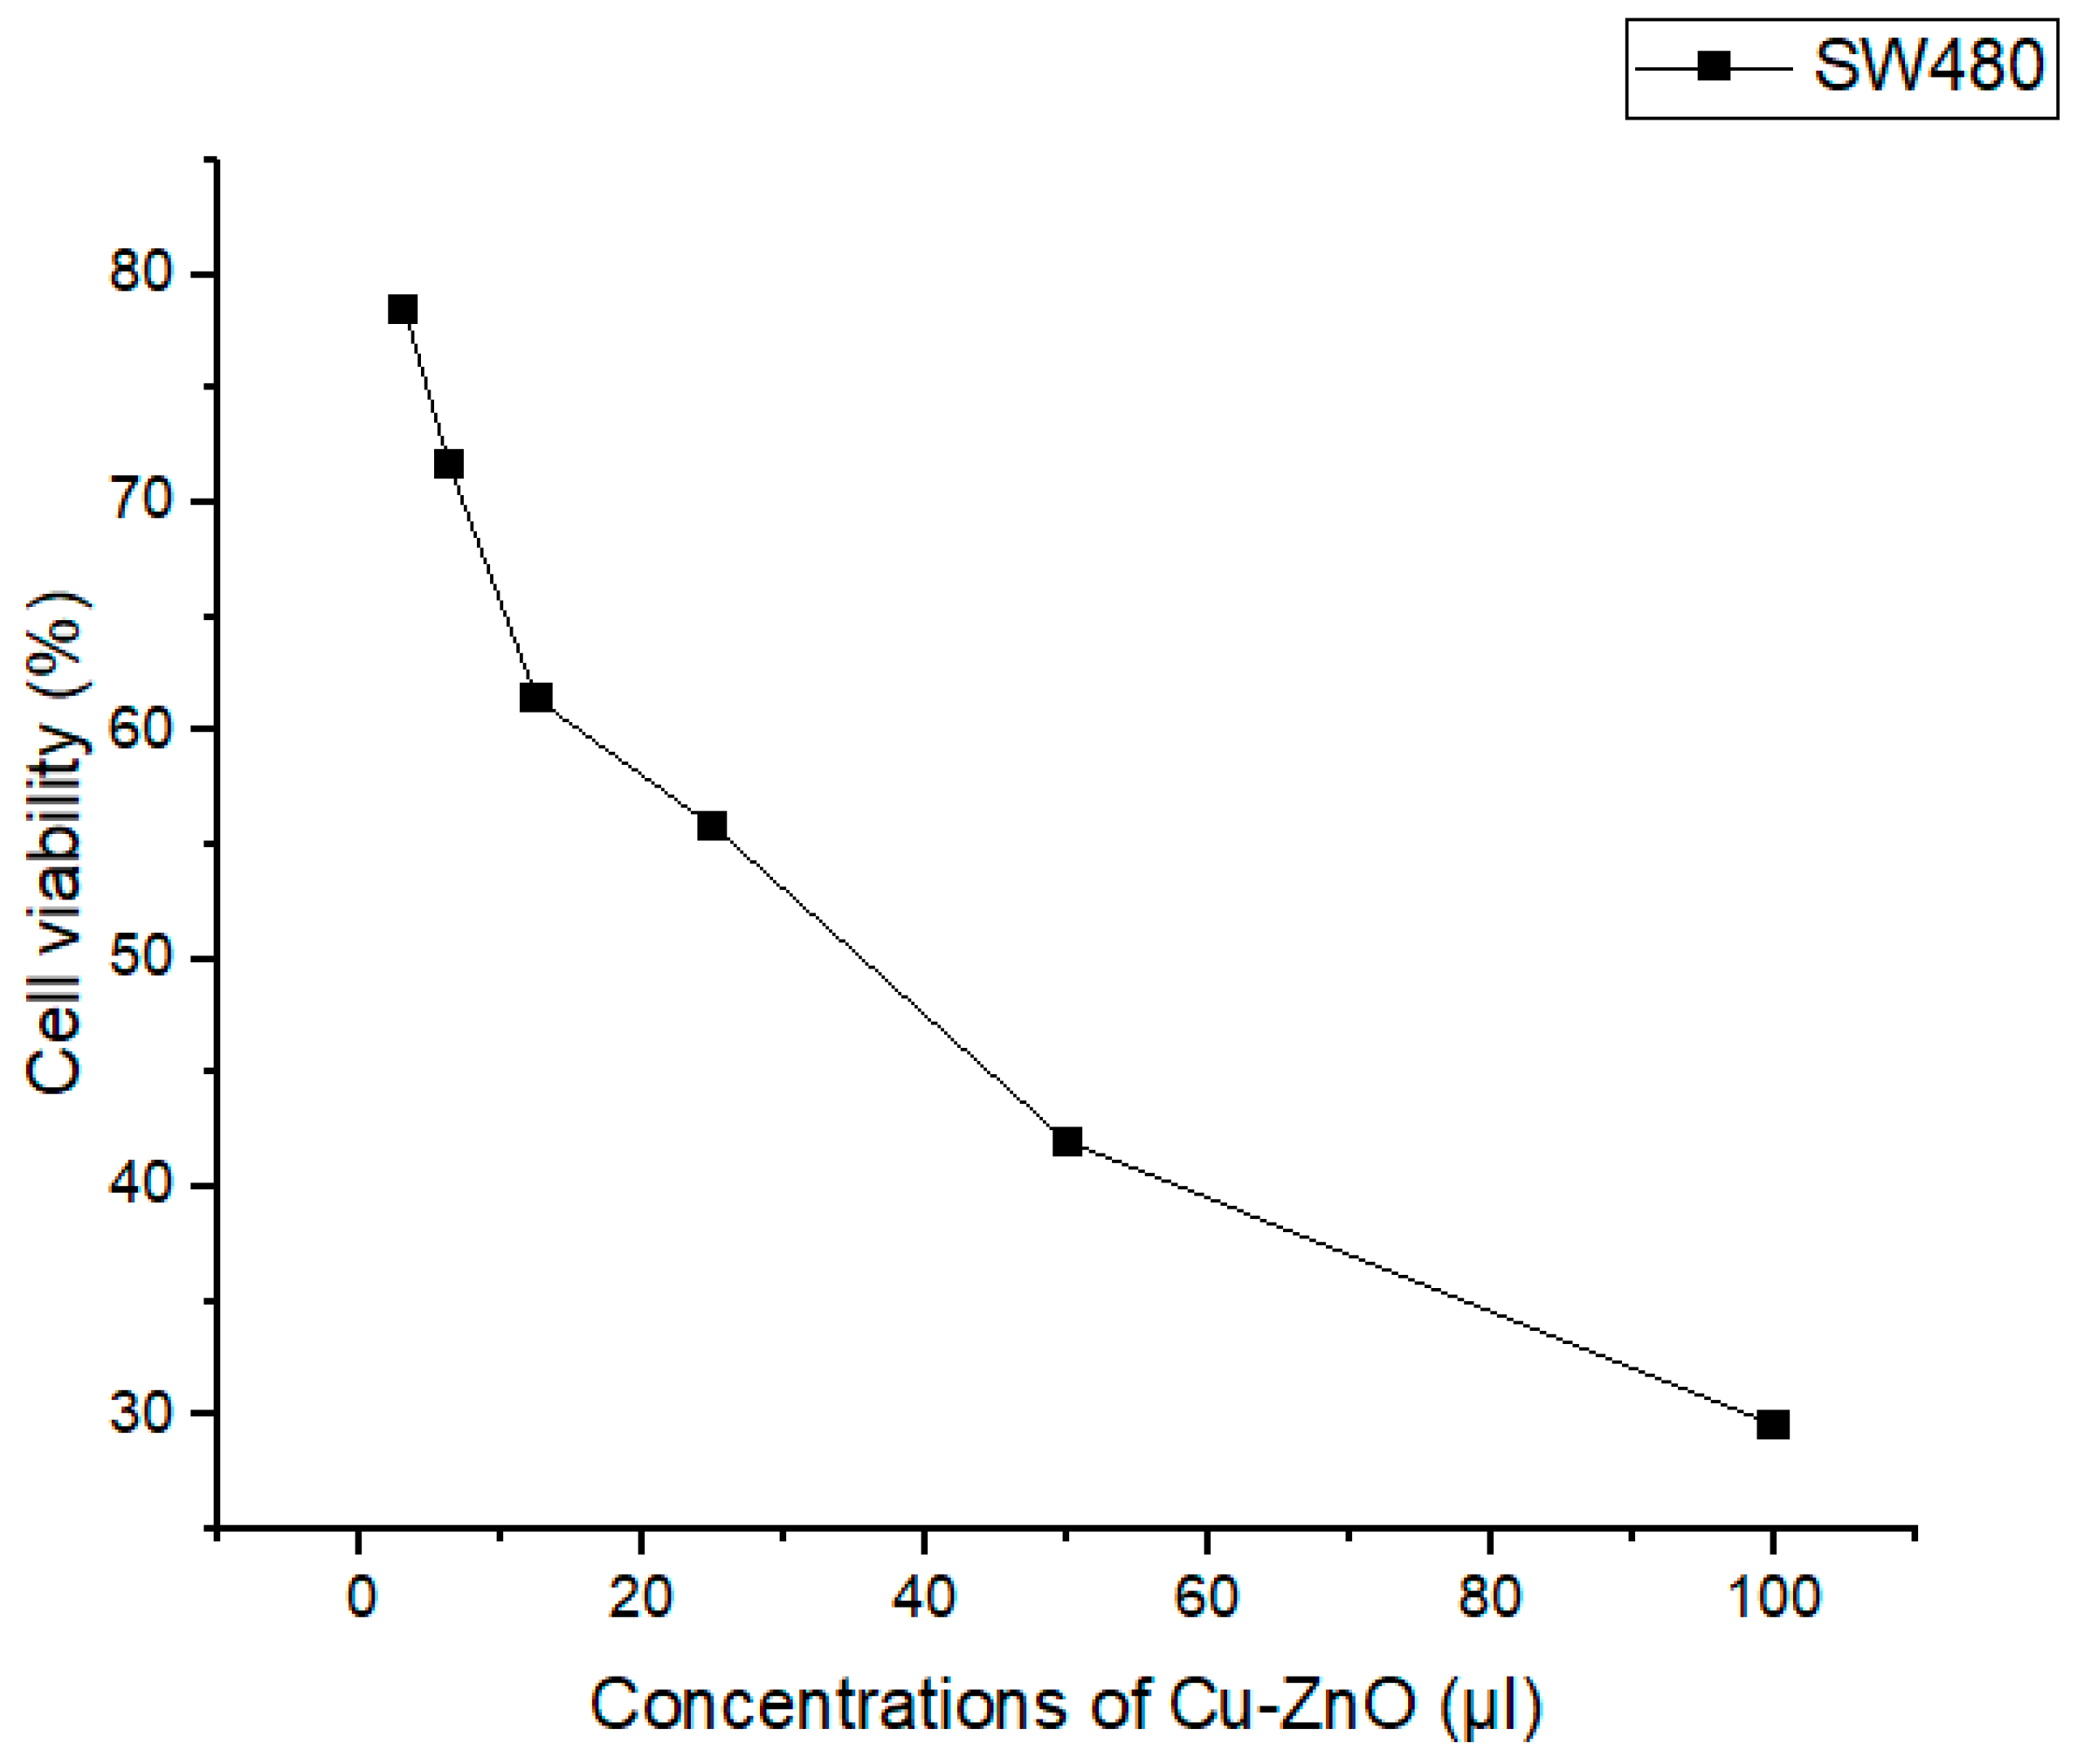
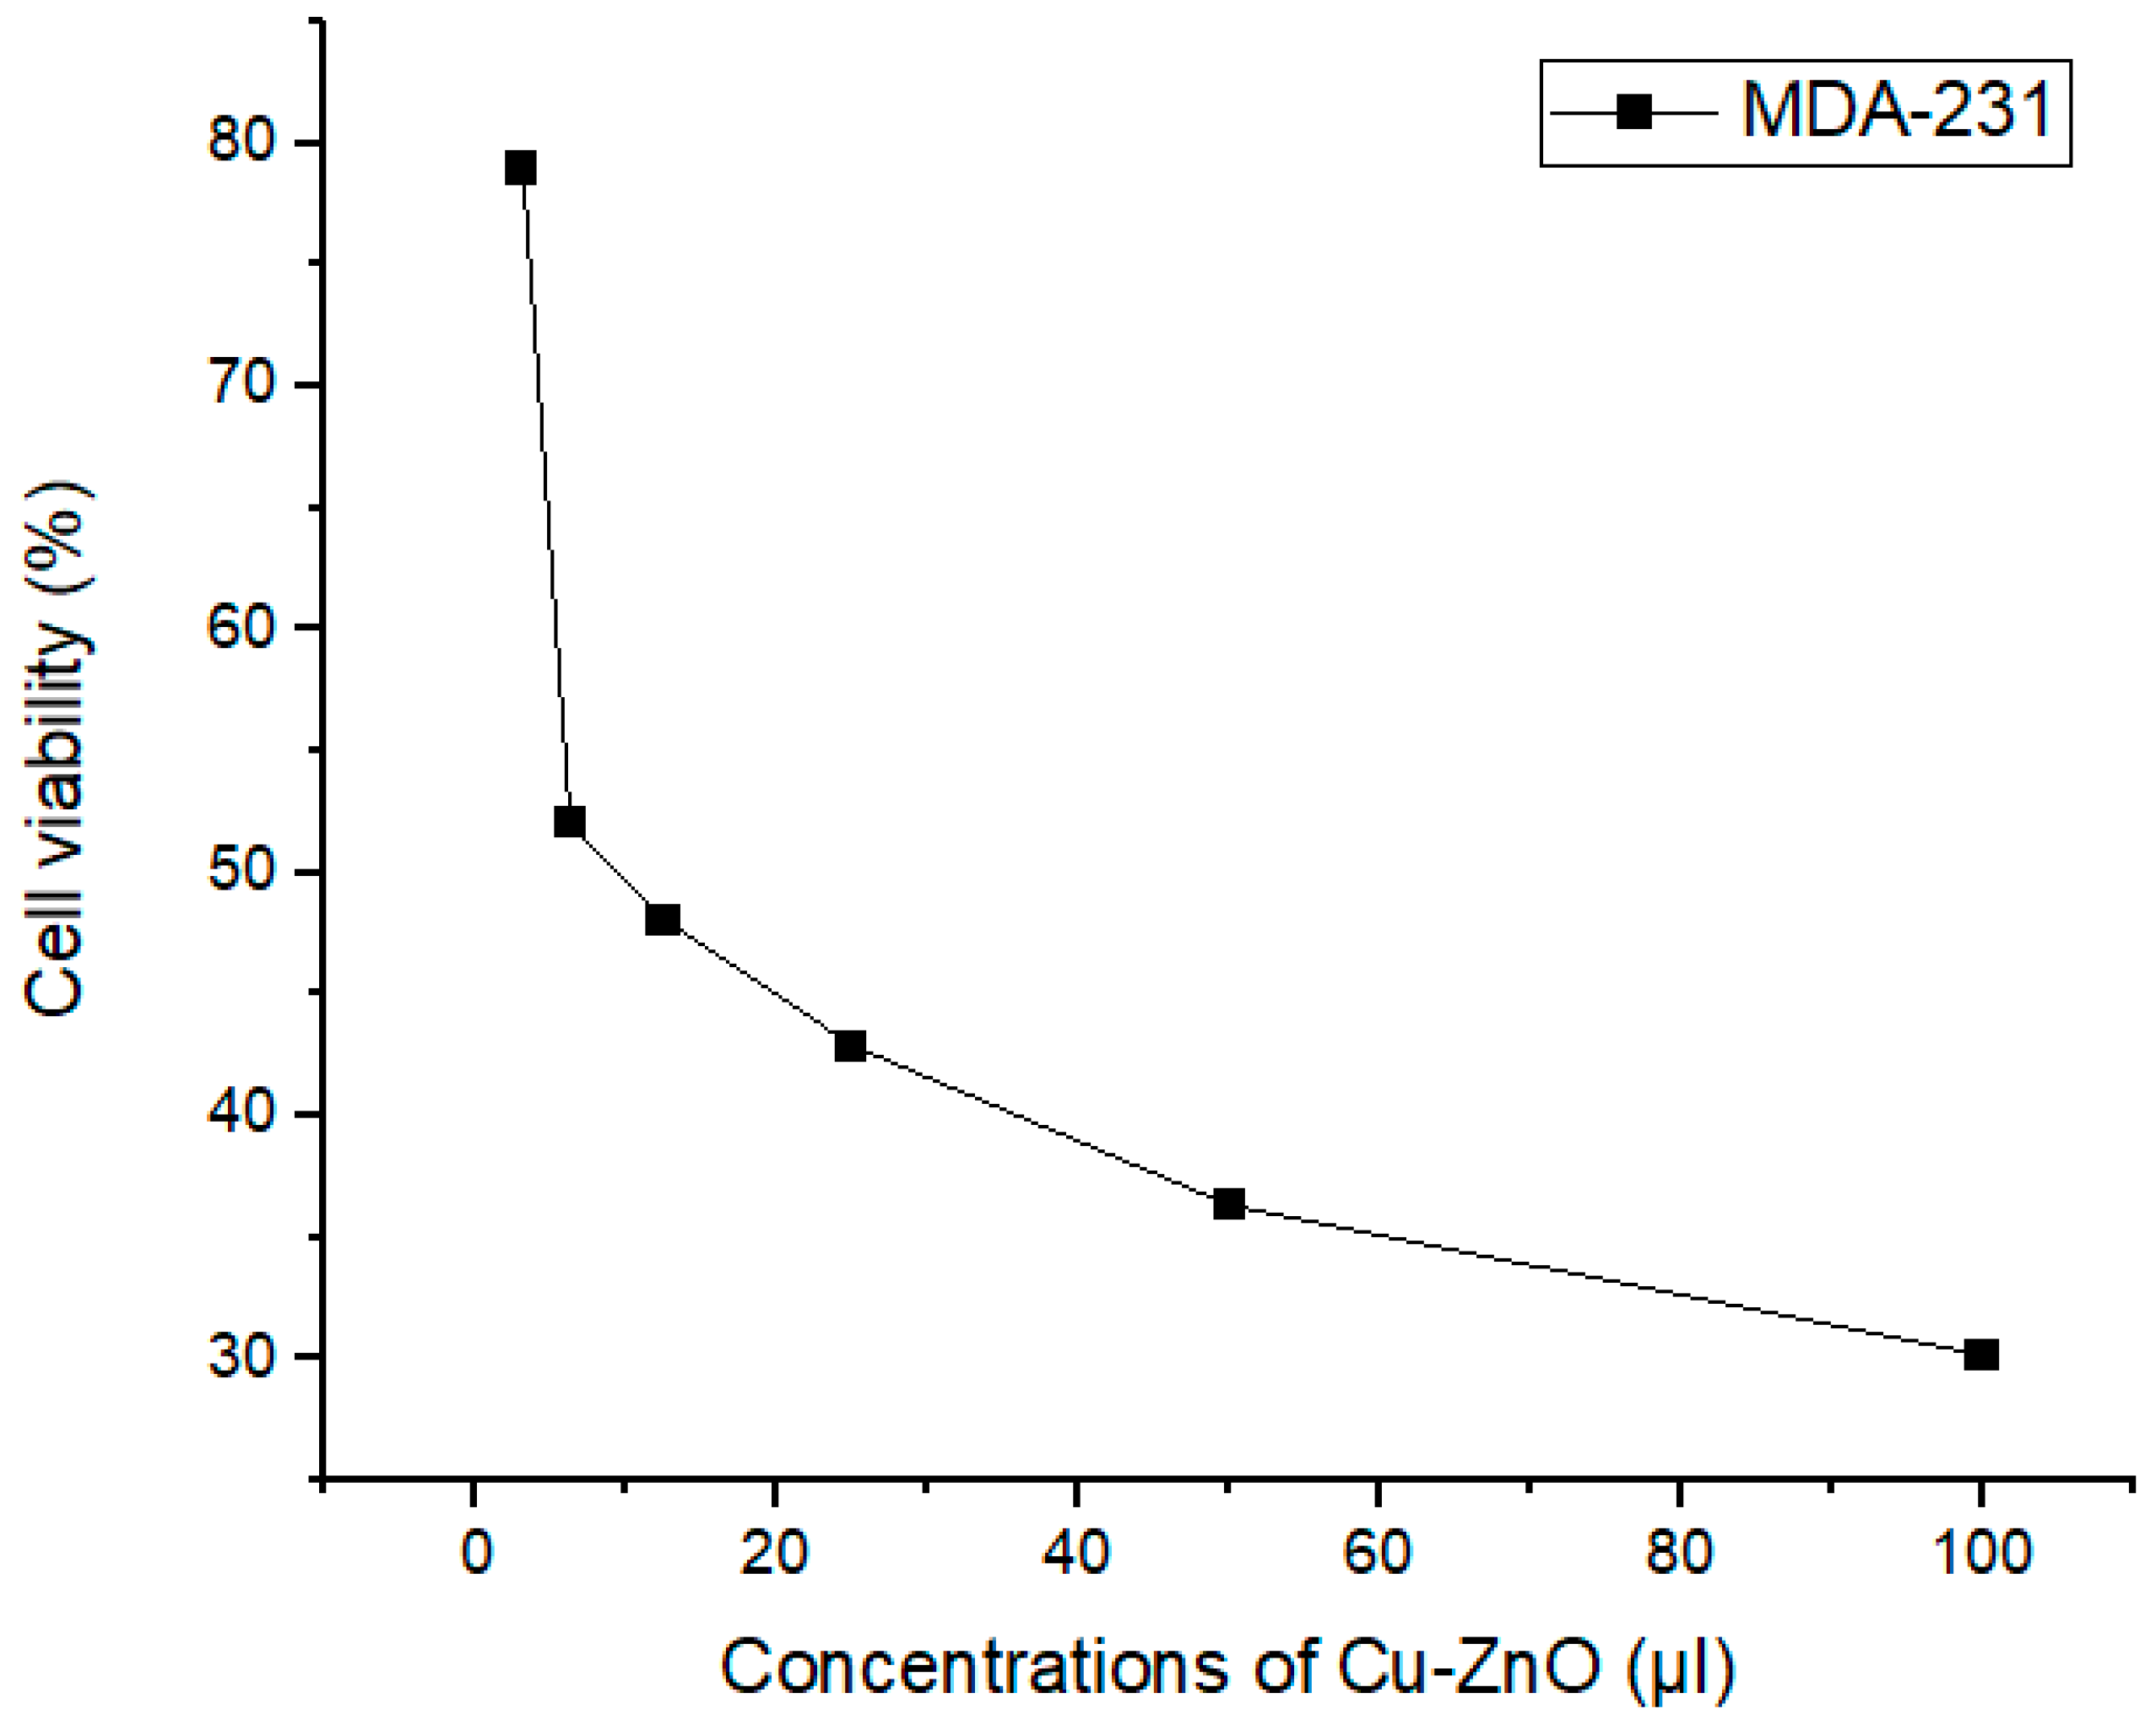
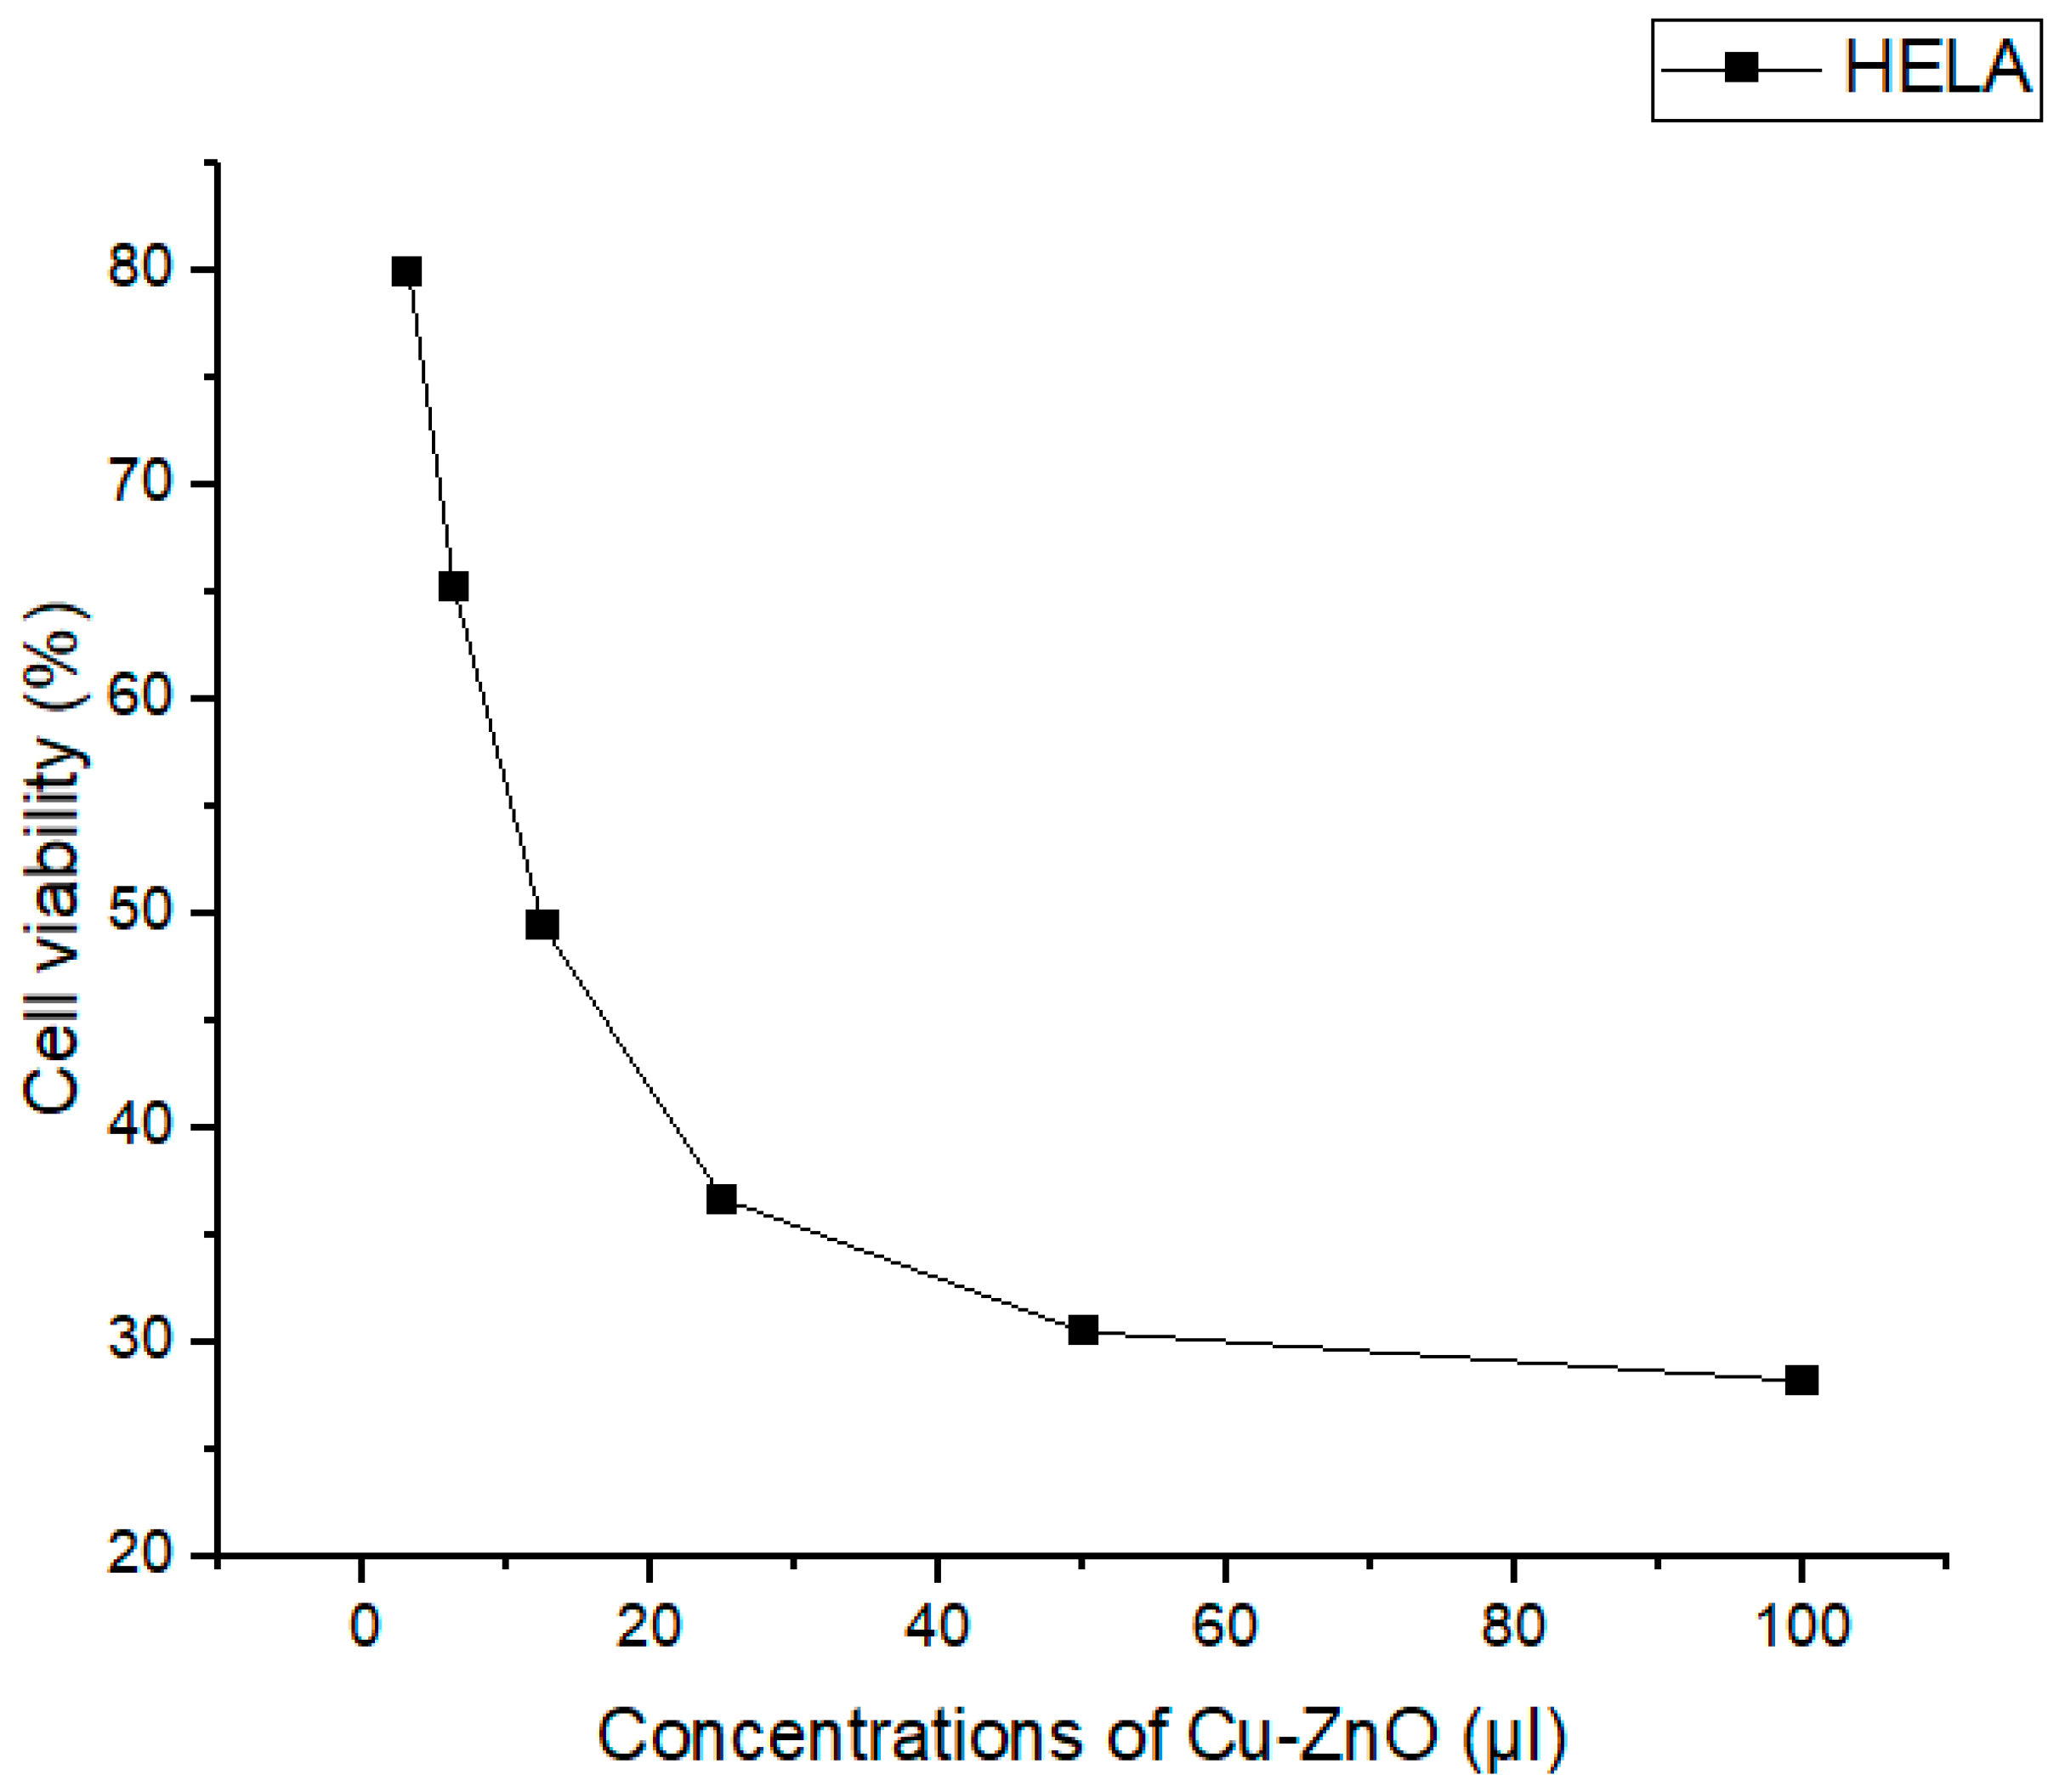
3.9. Anticancer Activity

As the quantity of Cu–ZnO NPs increased, the number of cancer cells dropped. According to Figure 11, Figure 12 and Figure 13, the cell viability was at its lowest at concentrations of 50–100 μL of Cu-doped ZnO NPs.
The compound’s cytotoxic activity was assessed in vitro using the MTT test on human colon (SW480), breast (MDA-231), and cervical (HeLa) cancer cells. After 48 h of incubation, the cytotoxicity of the Cu-doped ZnO NPs was shown in Figure 11, Figure 12 and Figure 13, respectively, on the SW480, MDA-231, and HeLa cell lines. Cell inhibition, measured as IC50 values, was used for the data analysis. The SW480, MDA-231, and HeLa cell lines were only moderately affected by Cu-doped ZnO NPs, with an IC50 value of 6.25 µg/mL. At a 100 µg/mL concentration, the cell availability percentages for the SW480, MDA-231, and HeLa cell lines were 29.55, 30.15, and 28.2%, respectively. These findings support the idea that Cu-ZnO NPs might be a new cancer treatment [58].
Although metal-doped ZnO NPs have been the subject of extensive research, the exact cell death process at the nanoscale remains unclear and requires further investigation. Potentially involving apoptosis, necrosis, and ROS generation, NPs were hazardous to cancer cell lines. Most people think that Cu–ZnO NPs kill cancer cells by increasing ROS activity and releasing dissolved Zn2+ ions within the cells, which sets off an apoptotic signaling cascade. Interfering with the cancer cell’s electron transport chain, Zn2+ destroys the mitochondria. It releases a flood of reactive oxygen species (ROS), leading to mitochondrial damage, an imbalance in protein activity, and cell death. A crystal lattice of Cu-doped ZnO NPs may produce more reactive oxygen species (ROS) when introducing the transition metal ion (Cu2+). The catalytic separation of H2O2 molecules into hydroxide ions, primary hydroxyl groups, hydrogen ions, and hydroperoxyl radicals is strengthened by the expansion band gap energy, which is responsible for this action. The upshot of this effect is the elimination of cancer cells via enhancing intracellular protein oxidation and redox status. The current findings show cell death, which leads us to believe that their potential is due to both the cytotoxic impact and the potential for tumor reduction [59,60].

3.10. Antibacterial Activity

The antibacterial efficacy of Cu-ZnO NPs was compared using the excellent diffusion approach, as indicated in Table 4. Researchers looked at how well Cu-doped ZnO NPs killed four different types of bacteria: Staphylococcus aureus (+ve), Staphylococcus epidermidis (+ve), Shigella sonnei (−ve), and Salmonella enterica (−ve). The inhibitory zone, measured in millimeters, was taken at two concentrations, 5 and 10 µg/mL. The absence of immunogenicity for Salmonella epidermis (+ve), Salmonella sonnet (−ve), and Salmonella enterica (−ve) was convincingly shown. However, regarding S. aureus (+ve), the inhibition zone was noticeable at 0.7 mm for 5 µg/mL and 0.8 mm for 10 µg/mL, independently (see Figure 14 and Table 4). The growth inhibition of bacteria was shown to be concentration-dependent when Cu-doped ZnO was used. Results demonstrated that Cu–ZnO NPs inhibited the growth of Gram-positive and Gram-negative bacteria, respectively. Previous research has shown that ZnO and Cu–ZnO were more effective against Gram-positive bacteria than Gram-negative ones [61]. One theory puts the distinctions between Gram-positive and Gram-negative bacteria down to (i) varying levels of interaction, (ii) metabolic activities and cellular physiology, and (iii) different cell membrane topologies. Nanoparticles of zinc oxide, whether they were pure or doped with iron, were more effective against Gram-negative bacteria than Gram-positive ones [62,63,64].
There may be two steps to the nanoparticle’s action mechanism. Firstly, the NPs may engage directly with the bacterial cell wall or cause electrostatic damage to the cell membrane, damaging the outer membrane. Secondly, when metal oxides are present, they may induce oxidative stress, which is an active oxygen environment, to be produced, for example, during the generation of hydrogen peroxide. For instance, bacterial cells do not change form when exposed to metal-doped ZnO NPs. However, when these particles cling to bacterial cell surfaces, they lead to surface leakage due to abnormal surface structure, membrane bleeding, and outer membrane fatigue. The goal of employing NPs as bactericidal agents is based on their bacteriostatic effects. To put it another way, metal-doped ZnO NPs cause intracellular oxidative stress, inhibit cell development, and ultimately kill bacteria through direct interaction with their outer membrane permeability. Through the process, the NPs generate Zn2+ ions that directly impact the cell wall, causing damage. Additionally, reactive oxygen species (ROS) are formed as a result. When ROS is generated, it leads to the production of H2O2 and the release of zinc ions. These substances can help bacteria penetrate inside cells and exert their toxic effects [65,66,67].

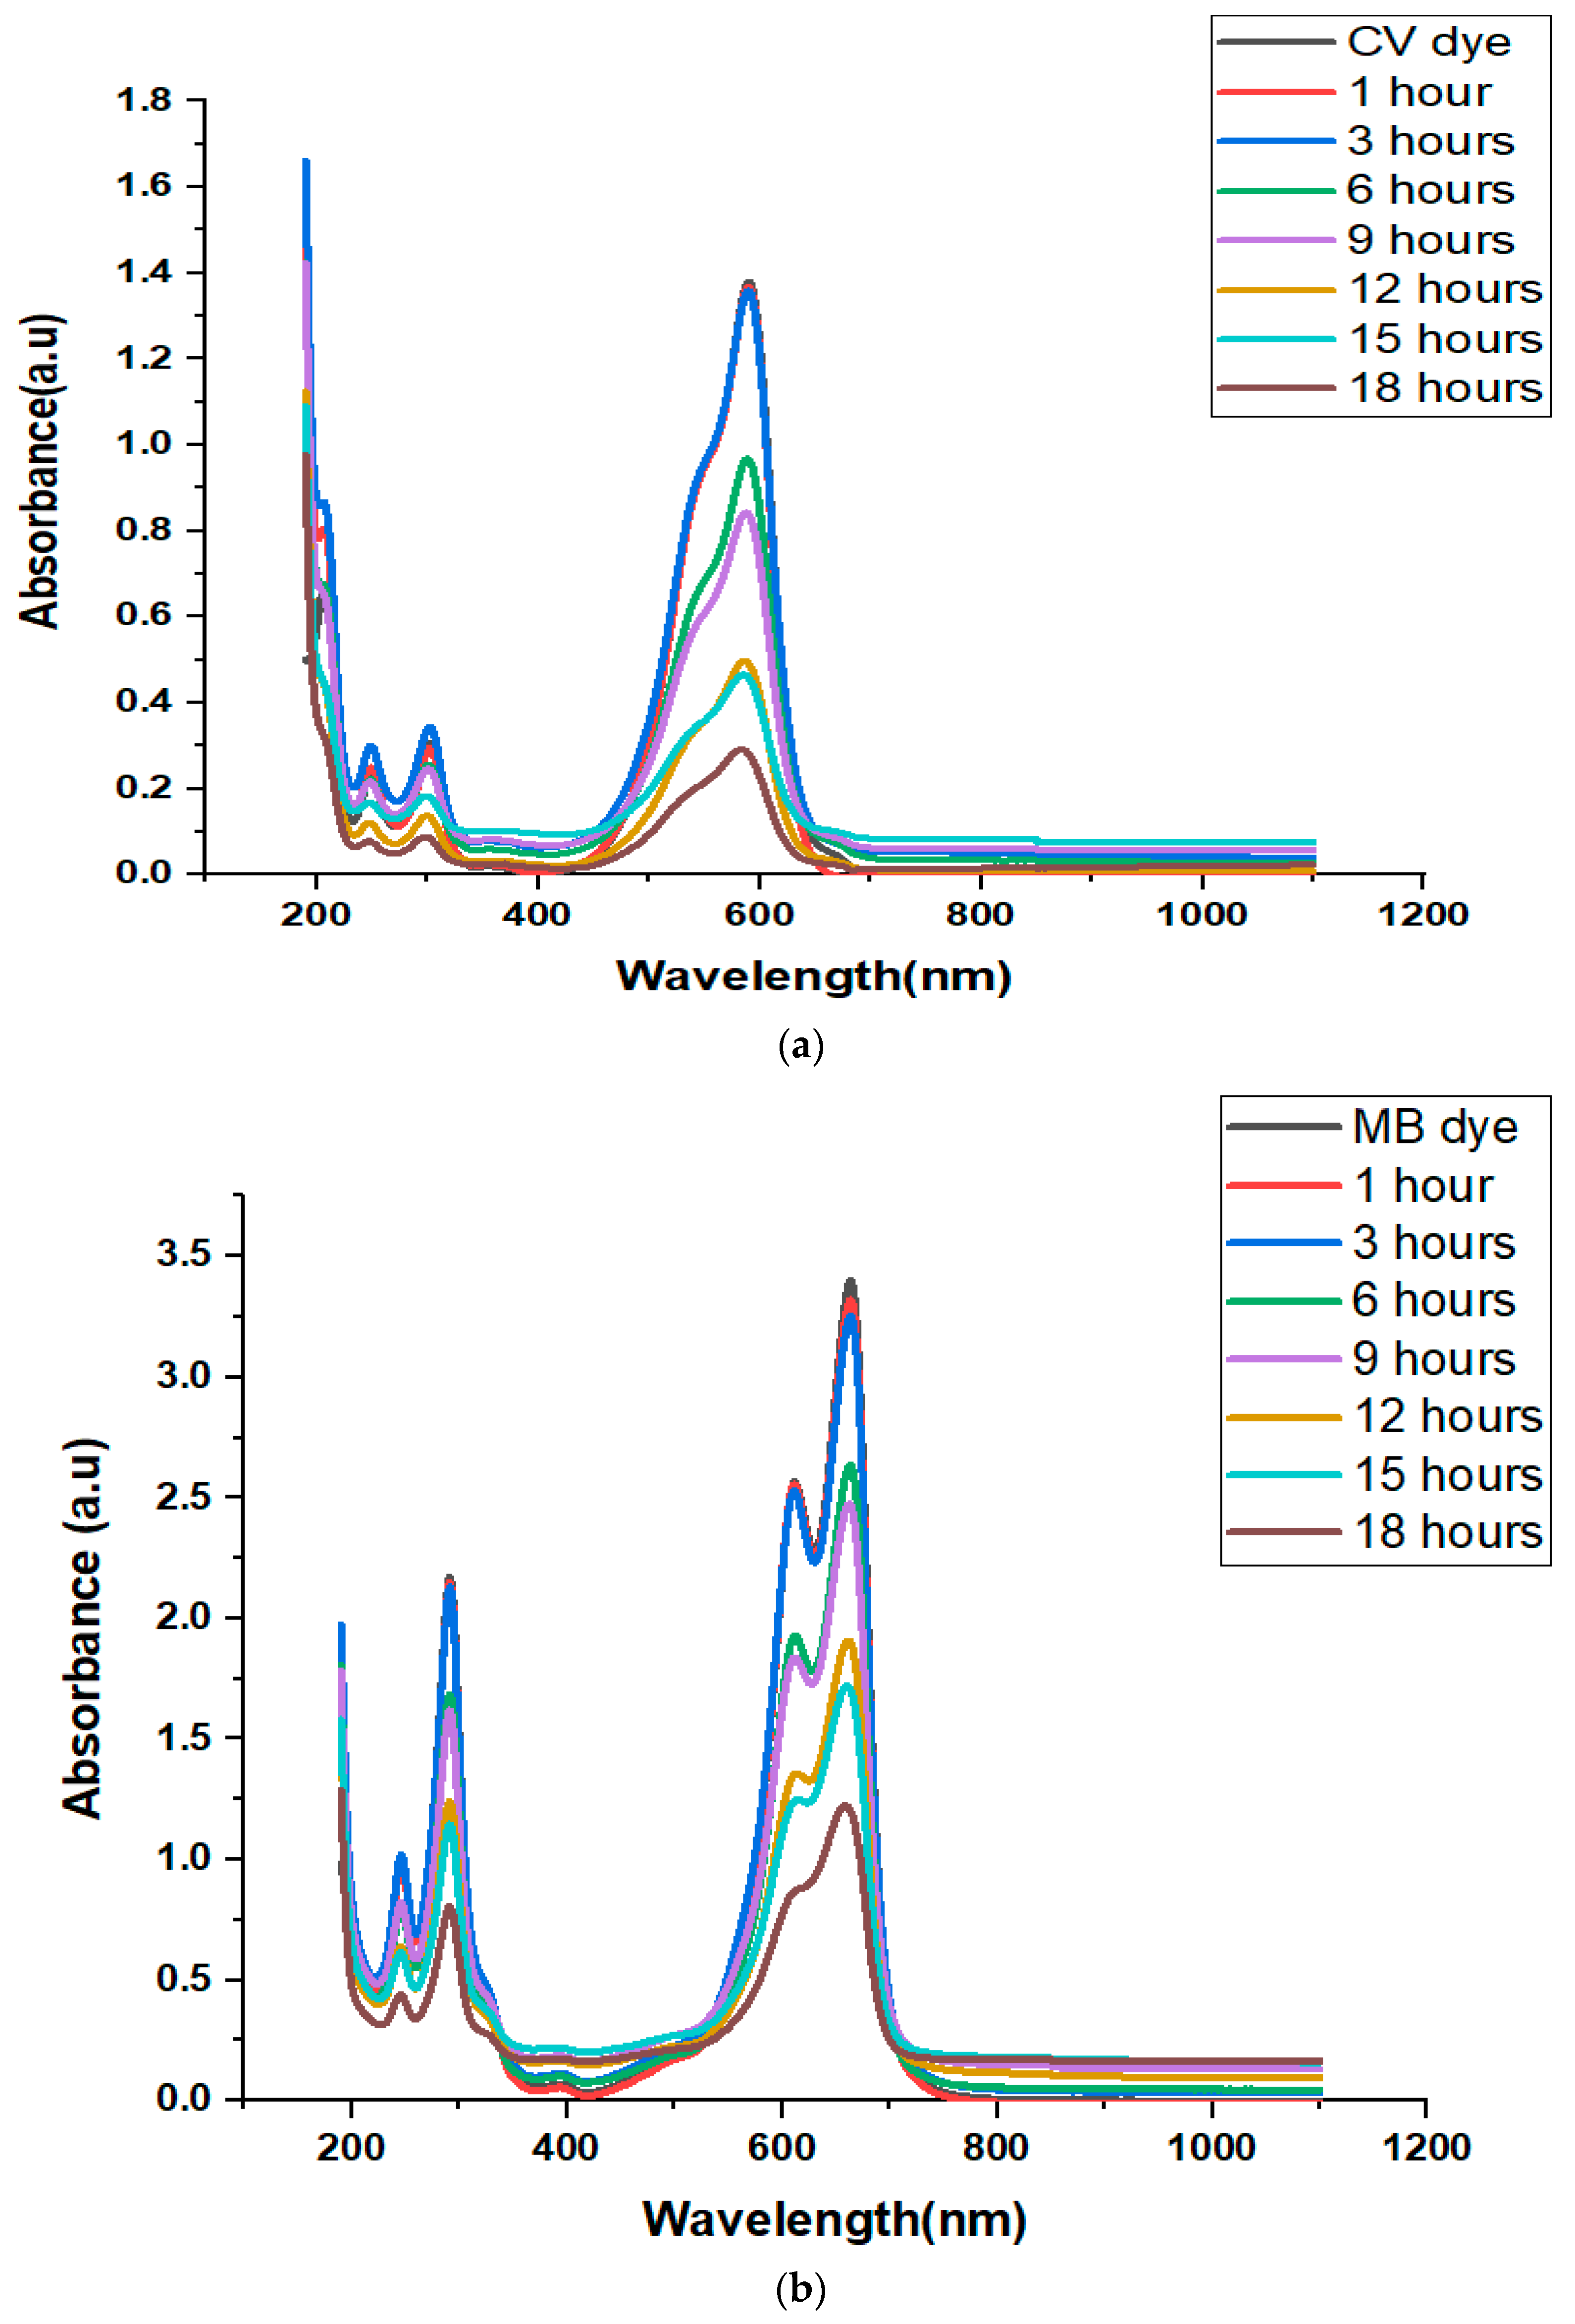
3.11. Photocatalytic Activities

We compared the CV and MB dyes to the pure and Cu-doped ZnO NPs in order to determine their photocatalytic activity when exposed to ultraviolet (UV) light. When the dyes CV and MB were degraded, the absorption maxima at 590 and 665 nm served as references. Figure 15a,b displays the absorption spectra of a water-based solution containing CV and MB, respectively, adding Cu-doped ZnO NPs at different intervals to observe degradation over time. It has been observed that the degradation of dyes (absorbance) decreases as the UV irradiation time increases. It was noticed that the strength of the CV and MB peaks decreased as the exposure duration increased, as illustrated in the figure below (Figure 16a,b), respectively. The dyes have undergone degradation in the presence of nanoparticles. A copper atom is now part of the ZnO structure. Dye degradation percentages across various time durations are shown in this figure. During 18 h, the degradation of CV dye reached 79.6%, while MB dye showed a degradation of 69.9% (Figure 15b). This indicates a consistent increase in the percentage of degradation. Photoexcited Cu-doped ZnO creates conduction band electrons and valence band holes. This is the suggested process for organic dye photodegradation using Cu-doped ZnO. Electrons reacting with water form a positive hydroxyl radical. These radicals are known to be powerful oxidizing agents that can lead to the fading of colors [68]. A superoxide anion radical may be formed when the concentration of dissolved oxygen is reduced due to electron generation by light. The organic dye molecules at the catalyst’s surface break down due to the oxidizing capabilities of these anion radicals, which are used to remove any absorbed organic compounds or chemicals [69].
With its suitable band gap energy and wider photo-responding range, the semiconductor is ideal for usage in enhancing the electronic transition and photocatalytic efficacy of ZnO nanoparticles. Several reports have detailed investigations on the photodegradation of metal oxides, with a focus on ZnO nanoparticles. Though generic congo red (CR)-functionalized magnetic materials may be able to adsorb heavy metal ions and medications, there have been few publications on the subject so far. In a similar vein, CuO and ZnO have long been thought of as photocatalysts based on n-type semiconductors, able to produce electron–hole pairs when exposed to ultraviolet light [70]. Improving photocatalytic degradation efficiency may be achieved by increasing the band gap and decreasing the absorbance range to the visible region with the combination of two semiconductors. This process causes electron–hole pairs to split during irradiation. So, to improve the use of ZnO/CuO-centered photocatalysts, a lot of research has been focused on synthesizing CuO and ZnO semiconductor composites and doped nanomaterials in recent years [71,72,73].
According to research that looked at how CR dye degraded in a CuO–ZnO composite when exposed to visible light, the photocatalytic decoloration of CR over single-phase ZnO reached a low of 25% after 50 min of light exposure. On the other hand, the CuO–ZnO composites showed a high degradation ratio of 91%. This is because of their huge surface area and the fact that they impede the recombination of electron–hole pair carriers [69,72].
ZnO (e + h+)/CuO (e + h+) → ZnO (e + e)/CuO (h+ + h+)
h+ + OH → OH•
e + O2 → •O2
H2O + •O2 → OOH + OH
2OOH → O2 + H2O2
H2O2 + •O2 → OH + OH + O2
OH + •O2 + h+VB + pollutants → degrade pollutant
OH + •O2 + h+VB + degrade pollutant → CO2 + H2O
Equations (4)–(11) represent the succession of reactions that lead to mineralization and the aromatization process’s loss by ring cleavage through the redox process. The mechanism of photocatalysis is illustrated schematically in Figure 17.

4. Conclusions

Green approaches for nanoparticle preparation have gained widespread recognition as an eco-friendly, dependable, easy, quick, and effective alternative. The current work generated nanoparticles of Cu-doped ZnO, which are copper-doped zinc oxide, using the co-precipitation method. The crystallite grain size of Cu-doped ZnO nanoparticles is about 26.48 nm, determined from XRD data. The optical band gap value of Cu-doped ZnO nanoparticles has been recorded to be 1.32 eV. EDX analysis peaks conformed to those of the Zn, O, and Cu atoms, and there were no impurities. The antimicrobial and anticancer properties of the synthesized doped nanoparticles with spherical forms were studied. Additionally, the nanoparticles had anticancer properties, indicating that the NPs were specifically targeting cancer cells by inducing cell death. At a 100 µg/mL concentration of the synthesized Cu-doped ZnO NPs, the cell availability percentages for the SW480, MDA-231, and HeLa cell lines were 29.55, 30.15, and 28.2%, respectively. Moreover, the results show the percentage of dye degradation over different time durations. After 18 h, the degradation of CV dye reached 79.6%, while MB dye exhibited a degradation of 69.9%. All these findings indicated that the produced Cu-doped ZnO NPs have significant and desirable biological properties, including photocatalytic, antibacterial, and anticancer activities, according to this research. With these Cu-doped ZnO NPs, a plethora of cosmetic, nutraceutical, and medical uses should be feasible. The degradation of organic dyes provided further proof of the photocatalytic solid activity of Cu-doped ZnO NPs, as reported in the research. This finding is significant because it shows that Cu-doped ZnO NPs have promise as a material for use in organic dye cleaning effluents in the future.

Author Contributions

M.M.A.: Supervision; M.A.A.: data analysis and writing; H.H.A.: data analysis and writing; A.A.H.: Writing original draft; H.A.A.: Resources; N.M.M.: Software; S.G.A.: Data curation; L.M.A.: Experimental; A.A.A.: Experimental; M.S.A.: Experimental. All authors have read and agreed to the published version of the manuscript.

Funding

This research was funded by Princess Nourah bint Abdulrahman University Researchers Supporting Project (number PNURSP2024R56), Princess Nourah bint Abdulrahman University, Riyadh, Saudi Arabia.

Data Availability Statement

Data are contained within the article.

Conflicts of Interest

The authors declare no conflict of interest.

References

  1. Khan, S.A.; Noreen, F.; Kanwal, S.; Iqbal, A.; Hussain, G. Green synthesis of ZnO and Cu-doped ZnO nanoparticles from leaf extracts of Abutilon indicum, Clerodendrum infortunatum, Clerodendrum inerme and investigation of their biological and photocatalytic activities. Mater. Sci. Eng. C 2018, 82, 46–59. [Google Scholar] [CrossRef] [PubMed]
  2. Kamat, P.V. Photophysical, photochemical, and photocatalytic aspects of metal nanoparticles. J. Phys. Chem. B 2002, 106, 7729–7744. [Google Scholar] [CrossRef]
  3. Manikprabhu, D.; Lingappa, K. Synthesis of silver nanoparticles using the Streptomyces coelicolor klmp33 pigment: An antimicrobial agent against extended-spectrum beta-lactamase (ESBL) producing Escherichia coli. Mater. Sci. Eng. C 2014, 45, 434–437. [Google Scholar] [CrossRef] [PubMed]
  4. Adams, F.C.; Barbante, C. Nanoscience, nanotechnology, and spectrometry. Spectrochim. Acta Part B At. Spectrosc. 2013, 86, 3–13. [Google Scholar] [CrossRef]
  5. Baskaran, I.; Narayanan, T.S.; Stephen, A. Pulsed electrodeposition of nanocrystalline Cu–Ni alloy films and evaluation of their characteristic properties. Mater. Lett. 2006, 60, 1990–1995. [Google Scholar] [CrossRef]
  6. Serag, M.F.; Kaji, N.; Habuchi, S.; Bianco, A.; Baba, Y. Nanobiotechnology meets plant cell biology: Carbon nanotubes as organelle targeting nanocarriers. RSC Adv. 2013, 3, 4856–4862. [Google Scholar] [CrossRef]
  7. Poyraz, S.; Cerkez, I.; Huang, T.S.; Liu, Z.; Kang, L.; Luo, J.; Zhang, X. One-step synthesis and characterization of polyaniline nanofiber/silver nanoparticle composite networks as antibacterial agents. ACS Appl. Mater. Interfaces 2014, 6, 20025–20034. [Google Scholar] [CrossRef]
  8. Wang, R.; Billone, P.S.; Mullett, W.M. Nanomedicine in action: An overview of cancer nanomedicine on the market and in clinical trials. J. Nanomater. 2013, 2013, 629681. [Google Scholar] [CrossRef]
  9. McNeil, S.E. Wiley Interdiscip. Rev. Nanomed. Nanobiotechnol. 2009, 1, 264–271. [Google Scholar] [CrossRef]
  10. Akhtar, M.J.; Alhadlaq, H.A.; Alshamsan, A.; Majeed Khan, M.A.; Ahamed, M. Aluminum doping tunes band gap energy level and oxidative stress-mediated cytotoxicity of ZnO nanoparticles in MCF-7 cells. Sci. Rep. 2015, 5, 13876. [Google Scholar] [CrossRef]
  11. Rasmussen, J.W.; Martinez, E.; Louka, P.; Wingett, D.G. Zinc oxide nanoparticles for selective destruction of tumor cells and potential for drug delivery applications. Expert Opin. Drug Deliv. 2010, 7, 1063–1077. [Google Scholar] [CrossRef] [PubMed]
  12. Rishikesh, S.; Basha, M.A.M. Synthesis, Characterization, and Evaluation of Antimicrobial, Antioxidant & Anticancer Activities of Copper Doped Zinc Oxide Nanoparticles. Acta Chim. Slov. 2020, 67, 235–245. [Google Scholar]
  13. Hanley, C.; Layne, J.; Punnoose, A.; Reddy, K.; Coombs, I.; Coombs, A.; Feris, K.; Wingett, D. Preferential killing of cancer cells and activated human T cells using ZnO nanoparticles. Nanotechnology 2008, 19, 295103. [Google Scholar] [CrossRef]
  14. Islam, F.; Shohag, S.; Uddin, M.J.; Islam, M.R.; Nafady, M.H.; Akter, A.; Mitra, S.; Roy, A.; Emran, T.B.; Cavalu, S. Exploring the journey of zinc oxide nanoparticles (ZnO-NPs) toward biomedical applications. Materials 2022, 15, 2160. [Google Scholar] [CrossRef] [PubMed]
  15. Khan, S.A.; Noreen, F.; Kanwal, S.; Hussain, G. Comparative synthesis and characterization of Cu-doped ZnO nanoparticles and their antioxidant, antibacterial, antifungal, and photocatalytic dye degradation activities. Dig. J. Nanomater. Biostruct. 2017, 12, 877–889. [Google Scholar]
  16. Kalantar, E.; Kabir, K.; Gharibi, F.; Hatami, S.; Maleki, A. Effect and properties of surface-modified copper doped ZnO nanoparticles (Cu: ZnO NPs) on killing curves of bacterial pathogens. J. Med. Bacteriol. 2013, 2, 20–26. [Google Scholar]
  17. Chauhan, R.; Kumar, A.; Chaudhary, R.P. Synthesis and characterization of copper-doped ZnO nanoparticles. J. Chem. Pharm. Res. 2010, 2, 178–183. [Google Scholar]
  18. Glaspell, G.; Dutta, P.; Manivannan, A. A room-temperature and microwave synthesis of M-doped ZnO (M = Co, Cr, Fe, Mn & Ni). J. Clust. Sci. 2005, 16, 523–536. [Google Scholar]
  19. Mallika, A.N.; RamachandraReddy, A.; SowriBabu, K.; Reddy, K.V. Synthesis and optical characterization of aluminum-doped ZnO nanoparticles. Ceram. Int. 2014, 40, 12171–12177. [Google Scholar] [CrossRef]
  20. Deka, S.; Joy, P.A. Synthesis and magnetic properties of Mn-doped ZnO nanowires. Solid State Commun. 2007, 142, 190–194. [Google Scholar] [CrossRef]
  21. Saleh, R.; Djaja, N.F. Transition-metal-doped ZnO nanoparticles: Synthesis, characterization and photocatalytic activity under U.V. light. Spectrochim. Acta Part A Mol. Biomol. Spectrosc. 2014, 130, 581–590. [Google Scholar] [CrossRef] [PubMed]
  22. Jayakumar, O.D.; Salunke, H.G.; Kadam, R.M.; Mohapatra, M.; Yaswant, G.; Kulshreshtha, S.K. Magnetism in Mn-doped ZnO nanoparticles prepared by a co-precipitation method. Nanotechnology 2006, 17, 1278–1285. [Google Scholar] [CrossRef]
  23. Motevalizadeh, L.; Shohany, B.G.; Abrishami, M.E. Effects of Mn doping on electrical properties of ZnO thin films. Mod. Phys. Lett. B 2016, 30, 1650024–1650044. [Google Scholar] [CrossRef]
  24. Jun, J.H.; Cho, K.; Yun, J.; Suh, K.S.; Kim, T.; Kim, S. Enhancement of electrical characteristics of electrospun polyaniline nanofibers by embedding the nanofibers with Ga-doped ZnO nanoparticles. Org. Electron. 2008, 9, 445–451. [Google Scholar] [CrossRef]
  25. Zhong, J.; Muthukumar, S.; Chen, Y.; Lu, Y.; Ng, H.M.; Jiang, W.; Garfunkel, E.L. Ga-doped ZnO single-crystal nanotips grown on fused silica by metalorganic chemical vapor deposition. Appl. Phys. Lett. 2003, 83, 3401–3403. [Google Scholar] [CrossRef]
  26. Bagheri, S.; Chandrappa, K.G.; Hamid, S.B.A. Facile synthesis of nano-sized ZnO by direct precipitation method. Pharma Chem. 2013, 5, 265–270. [Google Scholar]
  27. Pung, S.Y.; Ong, C.S.; Isha, K.M.; Othman, M.H. Synthesis and characterization of Cu-doped ZnO nanorods. Sains Malays. 2014, 43, 273–281. [Google Scholar]
  28. Sivakamavalli, J.; Pandiselvi, K.; Park, K.; Kwak, I.S. Garcinia cambogia assisted synthesis of ZnO nanoparticles coupled with chitosan for antibacterial, antibiofilm, cytotoxic, anticancer, and ecotoxicity assessment. J. Clust. Sci. 2022, 33, 2249–2264. [Google Scholar] [CrossRef]
  29. Liao, C.; Jin, Y.; Li, Y.; Tjong, S.C. Interactions of zinc oxide nanostructures with mammalian cells: Cytotoxicity and photocatalytic toxicity. Int. J. Mol. Sci. 2020, 21, 6305. [Google Scholar] [CrossRef]
  30. Savitha, D.; Latha, H.K.; Lalithamba, H.S.; Jeppu, Y.V. Impact of Al and Mn doping on structural and Electrical properties of the Green synthesized ZnO Nanoparticles. In Proceedings of the 2023 International Conference on Smart Systems for Applications in Electrical Sciences (ICSSES), Tumakuru, India, 7–8 July 2023; pp. 1–6. [Google Scholar]
  31. Ghaffarian, H.R.; Saiedi, M.; Sayyadnejad, M.A.; Rashidi, A.M. Synthesis of ZnO nanoparticles by spray pyrolysis method. Iran. J. Chem. Chem. Eng. 2011, 57, 1–6. [Google Scholar]
  32. Evans, J.S.O.; Evans, I.R. Beyond classical applications of powder diffraction. Chem. Soc. Rev. 2004, 33, 539–547. [Google Scholar] [CrossRef] [PubMed]
  33. Salavati-Niasari, M.; Davar, F.; Khansari, A. Nanosphericals and nanobundles of ZnO: Synthesis and characterization. J. Alloys Compd. 2011, 509, 61–65. [Google Scholar] [CrossRef]
  34. Zvezdanović, J.; Marković, D. Bleaching of chlorophylls by U.V. irradiation in vitro: The effects on chlorophyll organization in acetone and n-hexane. J. Serbian Chem. Soc. 2008, 73, 271–282. [Google Scholar] [CrossRef]
  35. Almoneef, M.; Awad, M.; Aldosari, H.; Hendi, A.; Aldehish, H.; Merghani, N.; Alshammari, S. Exploring the multi-faceted potential: Synthesized ZnO nanostructure—Characterization, photocatalysis, and crucial biomedical applications. Heliyon 2024, 10, e32714–e32729. [Google Scholar] [CrossRef] [PubMed]
  36. Vidyasagar, C.C.; Naik, Y.A.; Venkatesh, T.G.; Viswanatha, R. Solid-state synthesis and effect of temperature on optical properties of Cu–ZnO, Cu–CdO, and CuO nanoparticles. Powder Technol. 2011, 214, 337–343. [Google Scholar] [CrossRef]
  37. Rani, S.; Suri, P.; Shishodia, P.K.; Mehra, R.M. Synthesis of nanocrystalline ZnO powder via sol-gel route for dye-sensitized solar cells. Sol. Energy Mater. Sol. Cells 2008, 92, 1639–1645. [Google Scholar] [CrossRef]
  38. Sivakumar, P.; Lee, M.; Kim, Y.S.; Shim, M.S. Photo-triggered antibacterial and anticancer activities of zinc oxide nanoparticles. J. Mater. Chem. B 2018, 6, 4852–4871. [Google Scholar] [CrossRef]
  39. Shabaani, M.; Rahaiee, S.; Zare, M.; Jafari, S.M. Green synthesis of ZnO nanoparticles using loquat seed extract; Biological functions and photocatalytic degradation properties. Lwt 2020, 134, 110133–110153. [Google Scholar] [CrossRef]
  40. Moharram, A.H.; Mansour, S.A.; Hussein, M.A.; Rashad, M. Direct precipitation and characterization of ZnO nanoparticles. J. Nanomater. 2014, 2014, 20. [Google Scholar] [CrossRef]
  41. Adeyemi, J.O.; Onwudiwe, D.C.; Oyedeji, A.O. Biogenic synthesis of CuO, ZnO, and CuO–ZnO nanoparticles using leaf extracts of Dovyalis caffra and their biological properties. Molecules 2022, 27, 3206. [Google Scholar] [CrossRef]
  42. Abebe, B.; Tsegaye, D.; Sori, C.; Renuka Prasad, R.C.K.; Murthy, H.A. Cu/CuO-doped ZnO nanocomposites via solution combustion synthesis for catalytic 4-nitrophenol reduction. ACS Omega 2023, 8, 9597–9606. [Google Scholar] [CrossRef] [PubMed]
  43. Bu, I.Y. Facile synthesis of highly oriented p-type aluminum co-doped zinc oxide film with aqua ammonia. J. Alloys Compd. 2011, 509, 2874–2878. [Google Scholar] [CrossRef]
  44. Riter, R.E.; Kimmel, J.R.; Undiks, E.P.; Levinger, N.E. Novel reverse micelles partition nonaqueous polar solvents in a continuous hydrocarbon phase. J. Phys. Chem. B 1997, 101, 8292–8297. [Google Scholar] [CrossRef]
  45. Riter, R.E.; Undiks, E.P.; Levinger, N.E. Impact of counterion on water motion in aerosol O.T. reverse micelles. J. Am. Chem. Soc. 1998, 120, 6062–6067. [Google Scholar] [CrossRef]
  46. Willard, D.M.; Riter, R.E.; Levinger, N.E. Dynamics of polar solvation in lecithin/water/cyclohexane reverse micelles. J. Am. Chem. Soc. 1998, 120, 4151–4160. [Google Scholar] [CrossRef]
  47. Riter, R.E.; Willard, D.M.; Levinger, N.E. Water immobilization at surfactant interfaces in reverse micelles. J. Phys. Chem. B 1998, 102, 2705–2714. [Google Scholar] [CrossRef]
  48. Lakowicz, J.R. (Ed.) Principles of Fluorescence Spectroscopy; Springer: Boston, MA, USA, 2006. [Google Scholar]
  49. Hussain, A.; Oves, M.; Alajmi, M.F.; Hussain, I.; Amir, S.; Ahmed, J.; Rehman, M.T.; El-Seedi, H.R.; Ali, I. Biogenesis of ZnO nanoparticles using Pandanus odorifer leaf extract: Anticancer and antimicrobial activities. RSC Adv. 2019, 9, 15357–15369. [Google Scholar] [CrossRef]
  50. Esparza-González, S.C.; Sánchez-Valdés, S.; Ramírez-Barrón, S.N.; Loera-Arias, M.J.; Bernal, J.; Meléndez-Ortiz, H.I.; Betancourt-Galindo, R. Effects of different surface modifying agents on the cytotoxic and antimicrobial properties of ZnO nanoparticles. Toxicol. Vitr. 2016, 37, 134–141. [Google Scholar] [CrossRef]
  51. Haque, M.A.; Mahalakshmi, S. Effect of triethanolamine on zinc oxide nanoparticles. Mater. Focus 2013, 2, 469–474. [Google Scholar] [CrossRef]
  52. Wiesmann, N.; Tremel, W.; Brieger, J. Zinc oxide nanoparticles for therapeutic purposes in cancer medicine. J. Mater. Chem. B 2020, 8, 4973–4989. [Google Scholar] [CrossRef]
  53. Muhammad, W.; Ullah, N.; Haroon, M.; Abbasi, B.H. Optical, morphological, and biological analysis of zinc oxide nanoparticles (ZnO NPs) using Papaver somniferum L. RSC Adv. 2019, 9, 29541–29548. [Google Scholar] [CrossRef] [PubMed]
  54. Wahab, R.; Khan, S.T.; Dwivedi, S.; Ahamed, M.; Musarrat, J.; Al-Khedhairy, A.A. Effective inhibition of bacterial respiration and growth by CuO microspheres composed of thin nanosheets. Colloids Surf. B Biointerfaces 2013, 111, 211–217. [Google Scholar] [CrossRef] [PubMed]
  55. Khashan, K.S.; Sulaiman, G.M.; Hussain, S.A.; Marzoog, T.R.; Jabir, M.S. Synthesis, characterization, and evaluation of aluminum-doped zinc oxide nanoparticles’ antibacterial, anti-parasitic, and anticancer activities. J. Inorg. Organomet. Polym. Mater. 2020, 30, 3677–3693. [Google Scholar] [CrossRef]
  56. Maruthupandy, M.; Rajivgandhi, G.; Muneeswaran, T.; Song, J.M.; Manoharan, N. Biologically synthesized zinc oxide nanoparticles as nano antibiotics against ESBLs producing gram harmful bacteria. Microb. Pathog. 2018, 121, 224–231. [Google Scholar] [CrossRef] [PubMed]
  57. Şahin, E.; Musevi, S.J.; Aslani, A. Antibacterial activity against Escherichia coli and characterization of ZnO and ZnO–Al2O3 mixed oxide nanoparticles. Arab. J. Chem. 2017, 10, S230–S235. [Google Scholar] [CrossRef]
  58. Duque, J.S.; Madrigal, B.M.; Riascos, H.; Avila, Y.P. Colloidal metal oxide nanoparticles prepared by laser ablation technique and their antibacterial test. Colloids Interfaces 2019, 3, 25. [Google Scholar] [CrossRef]
  59. Hameed, R.; Khashan, K.S.; Sulaiman, G.M. Preparation and characterization of graphene sheet prepared by laser ablation in liquid. Mater. Today Proc. 2020, 20, 535–539. [Google Scholar] [CrossRef]
  60. Khashan, K.S.; Jabir, M.S.; Abdulameer, F.A. Preparation and characterization of copper oxide nanoparticles decorated carbon nanoparticles using laser ablation in liquid. J. Phys. Conf. Ser. 2018, 1003, 012100. [Google Scholar] [CrossRef]
  61. Bhuiyan, M.R.A.; Alam, M.M.; Momin, M.A.; Mamur, H. Characterization of Al doped ZnO nanostructures via an electrochemical route. Int. J. Energy Appl. Technol. 2017, 4, 28–33. [Google Scholar]
  62. Singh, G.; Singh, J.; Jolly, S.S.; Rawat, R.; Kukkar, D.; Kumar, S.; Basu, S.; Rawat, M. Fructose modified synthesis of ZnO nanoparticles and its application for removal of industrial pollutants from water. J. Mater. Sci. Mater. Electron. 2018, 29, 7364–7371. [Google Scholar] [CrossRef]
  63. Singh, J.; Kumar, V.; Kim, K.H.; Rawat, M. Biogenic synthesis of copper oxide nanoparticles using plant extract and its prodigious potential for photocatalytic degradation of dyes. Environ. Res. 2019, 177, 108569–108579. [Google Scholar] [CrossRef] [PubMed]
  64. Chabri, S.; Dhara, A.; Show, B.; Adak, D.; Sinha, A.; Mukherjee, N. Mesoporous CuO–ZnO p–n heterojunction based nanocomposites with high specific surface area for enhanced photocatalysis and electrochemical sensing. Catal. Sci. Technol. 2016, 6, 3238–3252. [Google Scholar] [CrossRef]
  65. Chen, X.; Wu, Z.; Liu, D.; Gao, Z. Preparation of ZnO photocatalyst for the efficient and rapid photocatalytic degradation of azo dyes. Nanoscale Res. Lett. 2017, 12, 143. [Google Scholar] [CrossRef] [PubMed]
  66. Elilarassi, R.; Chandrasekaran, G. Effect of annealing on structural and optical properties of zinc oxide films. Mater. Chem. Phys. 2010, 121, 378–384. [Google Scholar] [CrossRef]
  67. Guo, M.Y.; Ng, A.M.C.; Liu, F.; Djurisic, A.B.; Chan, W.K.; Su, H.; Wong, K.S. Effect of native defects on photocatalytic properties of ZnO. J. Phys. Chem. C 2011, 115, 11095–11101. [Google Scholar] [CrossRef]
  68. Jena, S.K.; Sadasivam, R.; Packirisamy, G.; Saravanan, P. Nanoremediation: Sunlight mediated dye degradation using electrospun PAN/CuO–ZnO nanofibrous composites. Environ. Pollut. 2021, 280, 116964. [Google Scholar] [CrossRef]
  69. Hitkari, G.; Chowdhary, P.; Kumar, V.; Singh, S.; Motghare, A. Potential of Copper-Zinc Oxide nanocomposite for photocatalytic degradation of congo red dye. Clean. Chem. Eng. 2022, 1, 100003. [Google Scholar] [CrossRef]
  70. Zak, A.K.; Abrishami, M.E.; Majid, W.A.; Yousefi, R.; Hosseini, S.M. Effects of annealing temperature on some structural and optical properties of ZnO nanoparticles prepared by a modified sol–gel combustion method. Ceram. Int. 2011, 37, 393–398. [Google Scholar] [CrossRef]
  71. Vijayalakshmi, K.; Karthick, K. High quality ZnO/CuO nanocomposites synthesized by microwave assisted reaction. J. Mater. Sci. Mater. Electron. 2014, 25, 832–836. [Google Scholar] [CrossRef]
  72. Zhu, X.; Qin, F.; Luo, Y.; Zhang, L.; Yang, D.; Feng, W.; Chen, S. Enhanced photocatalytic activity of p (BaSnO3)-n (anatase/rutile/brookite TiO2) heterojunction composites by efficient interfacial charge transfer. J. Mol. Struct. 2023, 1294, 136440. [Google Scholar] [CrossRef]
  73. Wong, K.T.; Kim, S.C.; Yun, K.; Choong, C.E.; Nah, I.W.; Jeon, B.H.; Yoon, Y.; Jang, M. Understanding the potential band position and e/h+ separation lifetime for Z-scheme and type-II heterojunction mechanisms for effective micropollutant mineralization: Comparative experimental and DFT studies. Appl. Catal. B Environ. 2020, 273, 119034. [Google Scholar] [CrossRef]
Figure 1. Preparation steps of Cu-ZnO NPs: (a) stirring step, (b) filtering step, (c) drying step at room temp, (d) final product.
Catalysts 14 00641 g001
Figure 2. SEM scan image for Cu-doped ZnO NPs.
Catalysts 14 00641 g002
Figure 3. EDX results and mapping of Cu-ZnO NPs.
Catalysts 14 00641 g003
Figure 4. The XRD pattern of the produced Cu-ZnO NPs.
Catalysts 14 00641 g004
Figure 5. (a) TEM image of Cu-ZnO NPs. (b) Particle-size distribution of Cu-ZnO NPs.
Catalysts 14 00641 g005
Figure 6. The FTIR spectrum of Cu-ZnO NPs.
Catalysts 14 00641 g006
Figure 7. UV-Vis absorption spectrum for Cu-ZnO NPs.
Catalysts 14 00641 g007
Figure 8. Band gap for Cu-ZnO NPs.
Catalysts 14 00641 g008
Figure 9. Fluorescence emission spectrum of synthesized Cu-ZnO NPs.
Catalysts 14 00641 g009
Figure 10. The TGA analysis of prepared Cu–ZnO NPs.
Catalysts 14 00641 g010
Figure 11. The cell viability percentages of SW480 with different concentrations of Cu-ZnO NPs.
Catalysts 14 00641 g011
Figure 12. The cell viability percentages of MDA-231 with different concentrations of Cu-ZnO NPs.
Catalysts 14 00641 g012
Figure 13. The cell viability percentages of Hela with different concentrations of Cu-ZnO NPs.
Catalysts 14 00641 g013
Figure 14. The antibacterial activity of Cu–ZnO NPs against Staphylococcus aureus.
Catalysts 14 00641 g014
Figure 15. (a) Decolorization of CV and MB dye; (b) photocatalytic degradation (%) of MB and CV using Cu-doped Zn NPs.
Catalysts 14 00641 g015
Figure 16. UV-Vis absorbance spectra for (a) CV dye and (b) MB.
Catalysts 14 00641 g016
Figure 17. The photocatalysis process mechanism.
Catalysts 14 00641 g017
Table 1. The material information of Cu-ZnO NPs.
ChemicalsChemical’s StructureManufacturer CompanyPurity %
Sodium hydroxideNaOHLoba Chemie, Mumbai, India98%
Zinc (II) chlorideZnCl2Sigma-Aldrich, Steinheim,
Germany
99.95%
Copper (II) chlorideCuCl2VWR Chemicals, Leuven,
Belgium
99.99%
Distilled waterH2OVWR chemicals-
Table 2. Lattice constants of Cu-ZnO NPs.
2θ (°)d (Å)hklLattice Constant
a (Å)
Lattice Constant
b (Å)
Lattice Constant
c (Å)
31.67°2.82 Å1002.8200
34.35°2.61 Å002005.22
67.94°1.38 Å112005.05
53.51°1.71 Å02003.420
72.41°1.30 Å004005.22
75.01°1.27 Å004005.06
Table 3. The crystallite size of Cu-ZnO NPs.
Peak Position (2θ)FWHM
(ꞵ)
Crystallite Size D
(nm)
D (nm) (Average)
Cu-ZnO NPs
31.670.2238.3826.48
34.350.2140.36
36.180.2434.99
38.710.4717.73
47.490.2534.05
48.610.4718.36
56.540.3030.02
58.240.4022.73
53.510.4619.23
61.490.3923.59
62.820.3229.05
66.120.7213.16
67.940.4421.57
69.040.3527.45
Table 4. The bacterial reduction as an effect of Cu-doped ZnO NPs.
BacteriaSample IDmm (Zone Inhibition)
Salmonella entericaCu-doped ZnO1 (5 µg/mL)0.0
Cu-doped ZnO2 (10 µg/mL)0.0
Shigella sonneiCu-doped ZnO1 (5 µg/mL)0.0
Cu-doped ZnO2 (10 µg/mL)0.0
Staphylococcus aureusCu-doped ZnO1 (5 µg/mL)0.7
Cu-doped ZnO2 (10 µg/mL)0.8
Staphylococcus epidermidisCu-doped ZnO1 (5 µg/mL)0.0
Cu-doped ZnO2 (10 µg/mL)0.0
Disclaimer/Publisher’s Note: The statements, opinions and data contained in all publications are solely those of the individual author(s) and contributor(s) and not of MDPI and/or the editor(s). MDPI and/or the editor(s) disclaim responsibility for any injury to people or property resulting from any ideas, methods, instructions or products referred to in the content.

