1. Introduction
Increased awareness of hygiene has raised concerns about infectious diseases, allergies, and sick house syndrome caused by bacteria, viruses, house dust, and VOCs [
1,
2,
3]. Microbial infectious diseases have long been a recurring problem [
4,
5,
6]. For example, tuberculosis, a bacterial infectious disease, still occurs mainly in Asia and Africa, and there have been global outbreaks of viral infectious diseases, such as severe acute respiratory syndrome (SARS) in 2003 [
7,
8], influenza A (H1N1) in 2009 [
9,
10], and coronavirus disease 2019 (COVID-19) since 2019 [
11,
12]. To safeguard individuals from contagious illnesses, it is essential to have reliable techniques for neutralizing bacteria and viruses. Recently, photocatalysts have gained attention as effective agents against bacteria and viruses. Since the discovery of the Honda-Fujishima effect in 1967 and its report in 1972 [
13], extensive research has been conducted on photocatalysts, leading to their practical application. When semiconductor photocatalysts are irradiated with energy higher than the corresponding bandgap, they excite electrons in the valence band to the conduction band, generating a hole in the valence band [
14]. Electrons have a reducing property and holes have an oxidizing property; moreover, reactions with water and oxygen may generate reactive oxygen species (ROS), such as OH radicals and superoxide anion radicals, respectively. The holes and ROS have oxidizing properties that ultimately decompose organic chemicals into carbon dioxide and water; thus, they can be used as antibacterial and antiviral agents [
15]. The representative photocatalyst TiO
2 inactivates various microorganisms and is widely used in air purification as an antibacterial and antiviral agent [
16,
17,
18]. Research on antibacterial mechanisms in TiO
2 and bacteria, such as
Escherichia coli (“
E. coli”), has reported that the destruction of external structures such as the extracellular membrane and cell membrane by ROS is the main cause of inactivation [
19,
20,
21]. Research has also been conducted using a visible-light-responsive photocatalyst for indoor use, which can inactivate bacteria mainly through the destruction of the bacterial outer structure by ROS, in a manner similar to TiO
2 [
22]. Meanwhile, research on virus inactivation mechanisms initially used bacteriophages (“phages”) as an alternative to viruses [
23,
24,
25]. Subsequent research on viruses has verified that the ROS-mediated destruction of external structures (e.g., proteins such as capsids present in the outer shell of virus particles) is the main cause of inactivation by TiO
2 [
26,
27,
28]. However, very few reports have focused on antiviral mechanisms using lower-band-gap visible-light-responsive photocatalysts to date [
22,
29].
Since TiO
2 generates a large amount of ROS as well as holes via photocatalysis, most bacteria and viruses are inactivated by non-specific external structure disruption [
30]. Additionally, given their principles, other photocatalysts including visible-light-responsive photocatalysts generally exhibit antimicrobial activation through non-specific microbial destruction and eliminate various microorganisms [
31,
32]. Considering their advanced biological application, wide band gap photocatalysts can cause oxidative stress not only to harmful organisms but also to useful organisms. Photocatalysts must selectively inactivate specific microorganisms to be effective antibacterial and antiviral agents in a mixed environment.
Ground Rh-doped SrTiO
3 (“g-STO:Rh”), a visible-light-responsive photocatalyst, decomposes environmental pollutants such as acetaldehyde in the gas phase and dimethyl sulfoxide in the liquid phase [
33]. It has been clarified that g-STO:Rh generates fewer holes and ROS, resulting in a lower decomposition efficiency of organic substances compared to TiO
2-mediated decomposition efficiency. However, when both
E. coli and bacteriophage Qβ (“Qβ phage”) coexisted in the presence of g-STO:Rh, the activation rate of Qβ phage significantly decreased, even when the survival rate of
E. coli remained unaffected under the same conditions. This suggests that factors other than holes and reactive oxygen species are involved [
34]. This suggests the existence of a different mechanism from the conventional antibacterial/antiviral mechanism of TiO
2, which non-specifically destroys the external structure by large amounts of ROS [
15,
35,
36].
In the current study of COVID-19, photocatalysts for antiviral activity have gained considerable interest [
37,
38,
39]. Herein, we aimed to clarify the mechanism of selective antimicrobial activation by g-STO:Rh through investigating the effects of photocatalysis with g-STO:Rh on various phages and model proteins. Photocatalysts with selective antimicrobial activation, such as g-STO:Rh, are rare and the details of the mechanism remain unclear. Elucidating the mechanism is important for developing new photocatalysts with selective antimicrobial activation.
2. Results and Discussion
To elucidate the mechanism of the selective inactivation of Qβ phages by g-STO:Rh, first, we conducted SDS–PAGE to separate and detect Qβ phage proteins by molecular weight after g-STO:Rh treatment (
Figure 1). The bands obtained correspond to coat protein (approximately 14 kDa), A1 protein (approximately 35 kDa), A2 protein (approximately 48 kDa), and RNA replicase (approximately 60 kDa) in ascending order [
40,
41,
42]. The band intensities of the four proteins extracted from the negative control Qβ phages before and after the treatments (either irradiation or g-STO:Rh only) were not significantly different, indicating that they were undamaged (
p > 0.05). Meanwhile, the intensities of the bands representing the coat and A1 proteins extracted from g-STO:Rh-treated Qβ phages under irradiation showed no significant difference before and after the treatment (
p > 0.05), but the bands representing the A2 protein and RNA replicase faded, suggesting that the A2 protein and RNA replicase were preferentially damaged via g-STO:Rh-mediated photocatalysis (
p < 0.05).
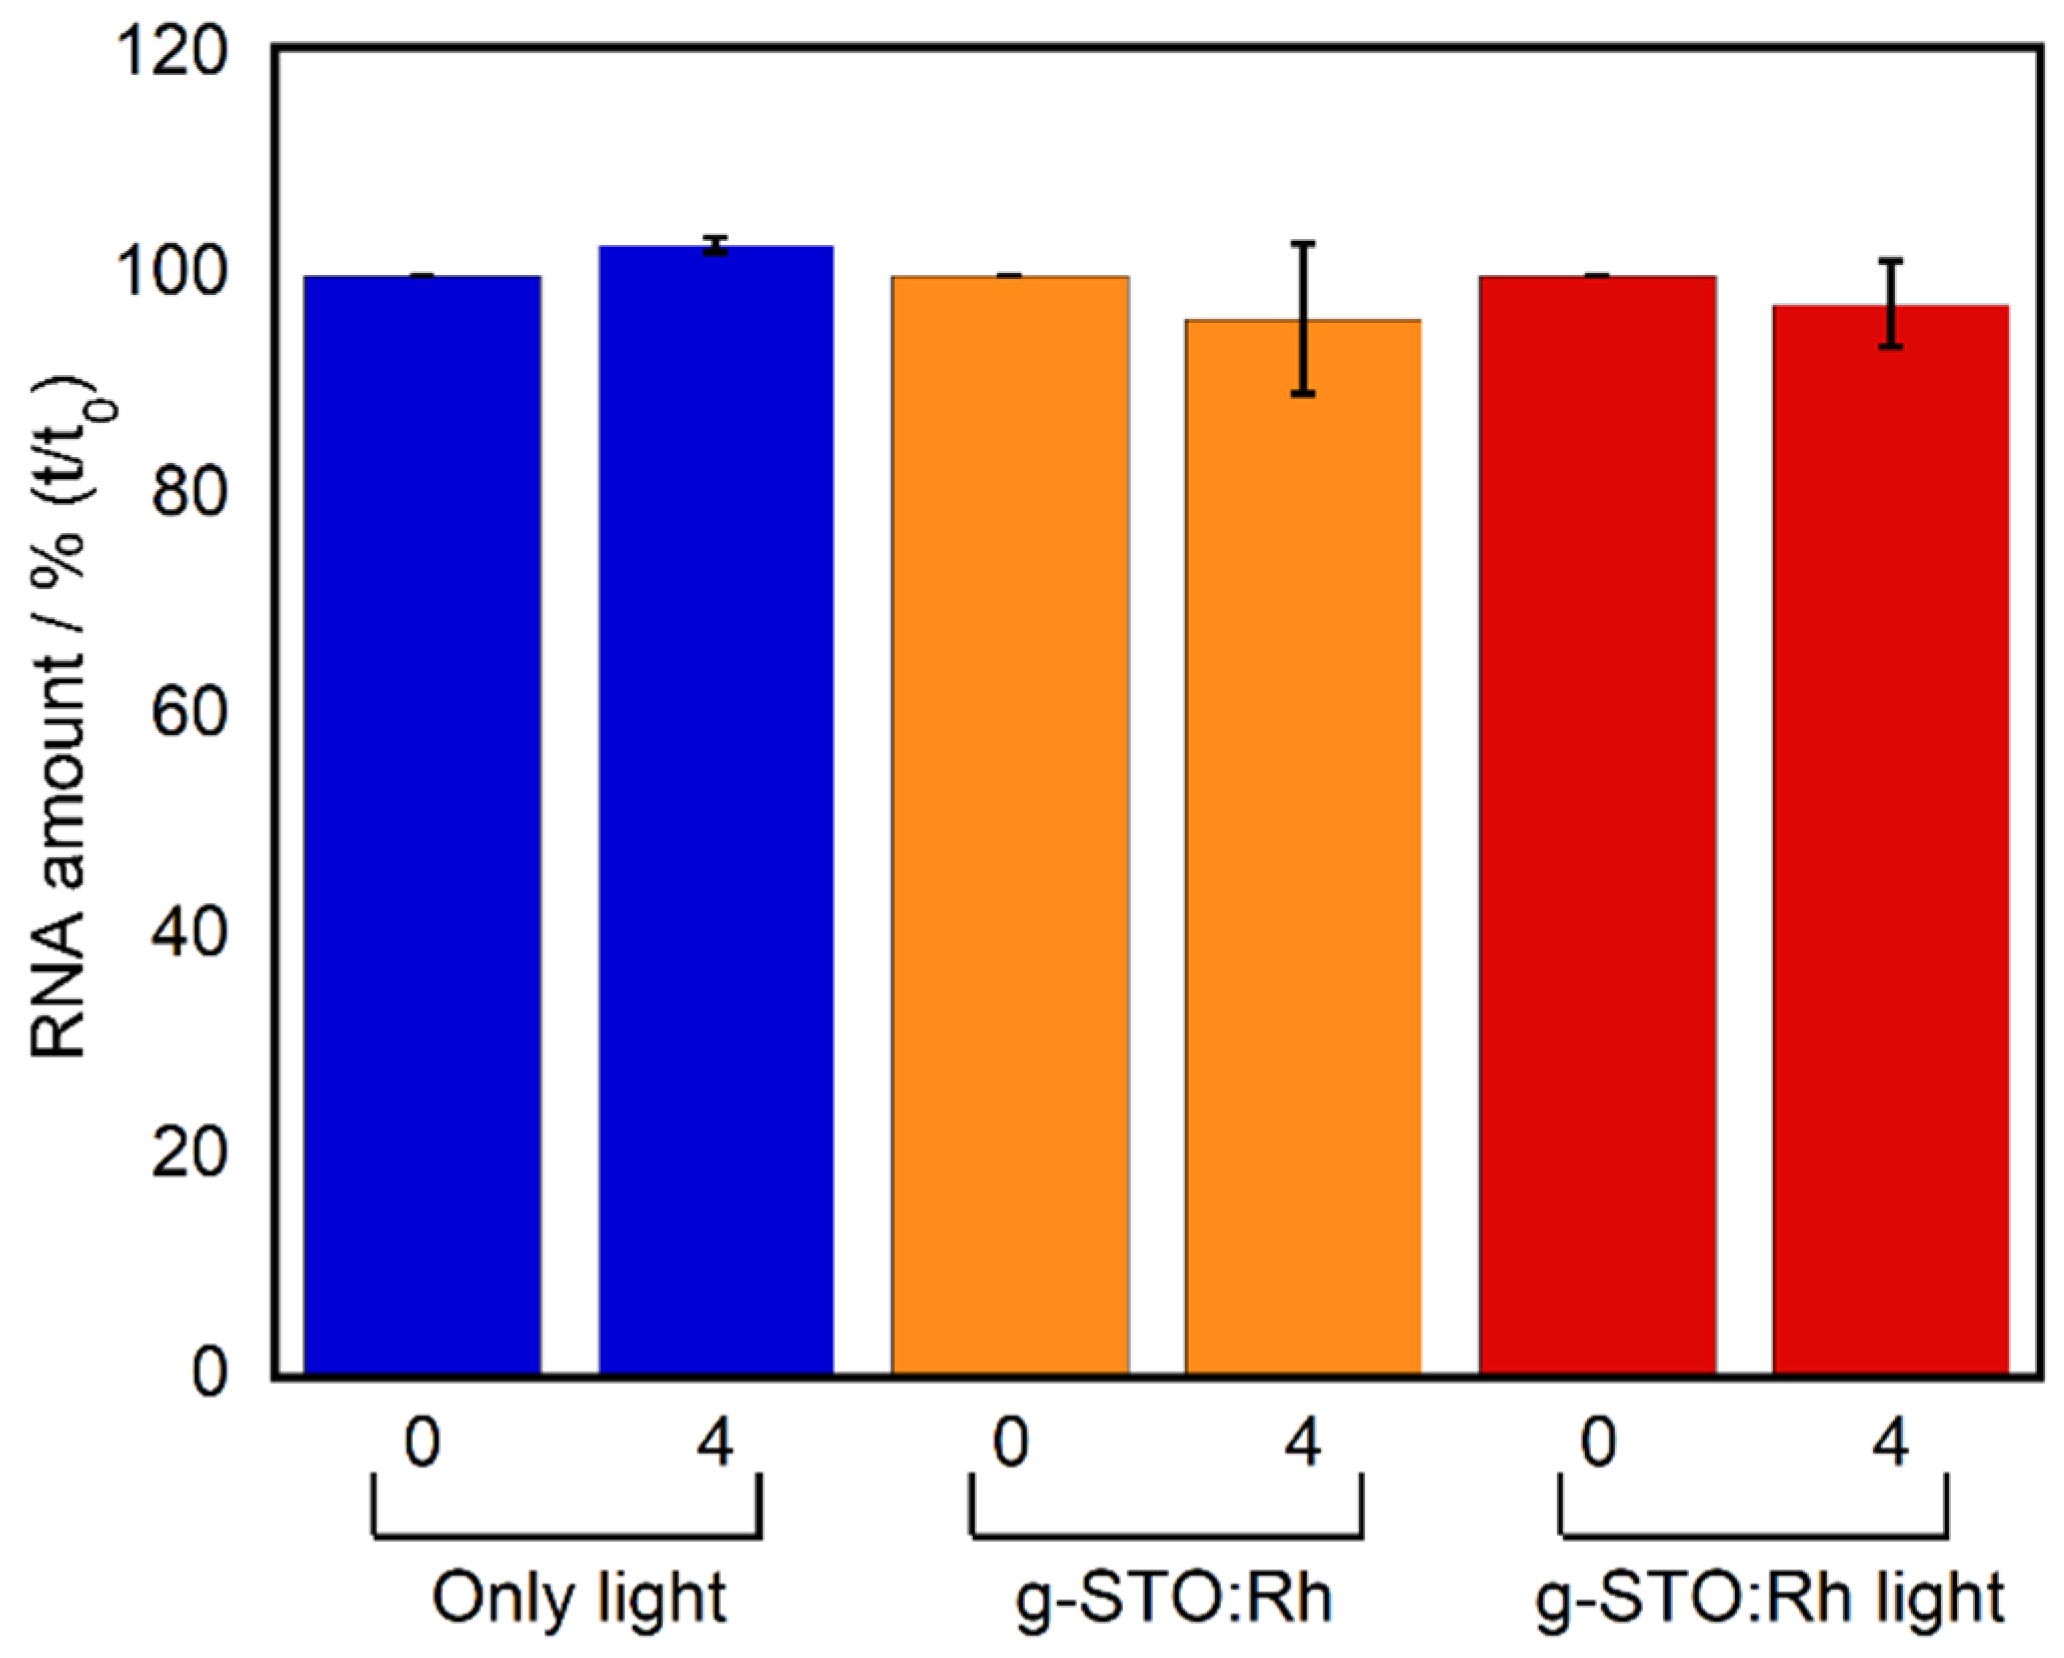
The Qβ phage comprises not only proteins but also nucleic acids. The above potential damage to RNA replicase, which is an internal Qβ phage protein, indicates g-STO:Rh-treatment could affect the interior structure of a Qβ phage. We quantified the RNA that exists near the center of the Qβ phage [
43] and behaves as genetic information (
Figure 2). The amount of RNA after four hours of g-STO:Rh treatment did not show significant differences from the negative controls (light only 0 h and g-STO:Rh without irradiation), when verified by a
t-test (
p > 0.05). These results suggest that g-STO:Rh-mediated damage did not affect the center of the Qβ phage (
p > 0.05) [
43].
The A2 protein, which is suggested to be damaged, is involved in the attachment to the pili of
E. coli during infection [
44,
45]. Therefore, we examined whether the Qβ phage after g-STO:Rh treatment can attach to
E. coli.
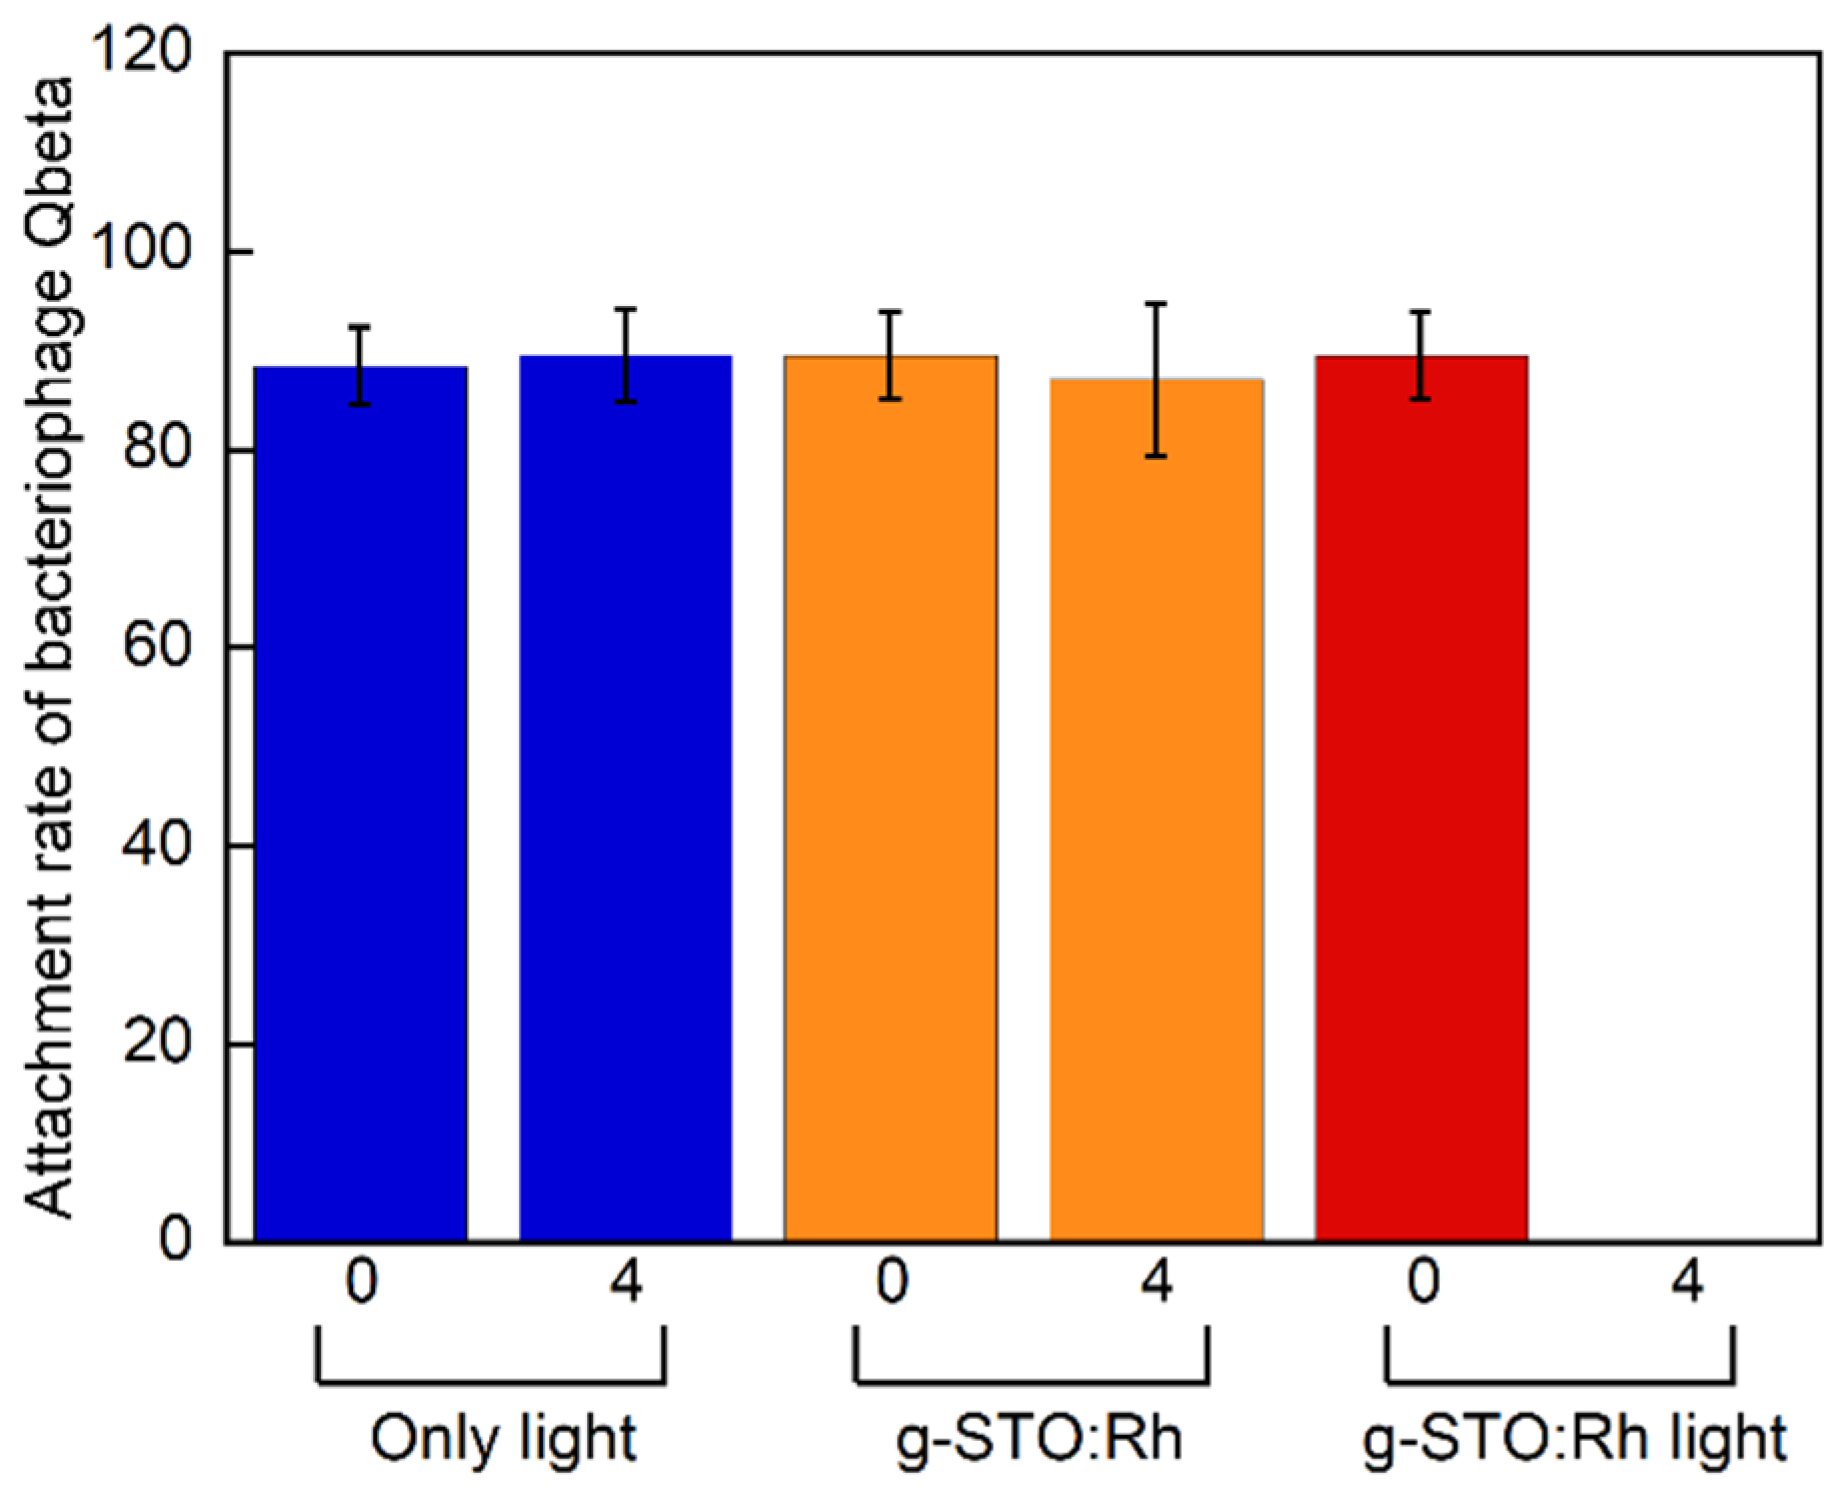
Figure 3 shows rates of Qβ phage attachment to
E. coli over 3 h in an environment at 37 °C. In general, approximately 10% normal Qβ phages were detected in the supernatant; thus, the attachment rate of Qβ phages before g-STO:Rh treatment was nearly 90%. The attachment rates of negative controls were similar (approximately 90%) after treatment for 0 and 4 h. Meanwhile, the attachment rate of g-STO:Rh-treated and irradiated Qβ phages at the start of treatment was approximately 90%, but significantly decreased to almost 0% after 4 h treatment (
p < 0.01). These results suggest that g-STO:Rh-mediated photocatalysis eliminated the A2 protein’s ability to attach to the pili and that the Qβ phage lost its ability to infect
E. coli.
From the above results, the Qβ phage was damaged during g-STO:Rh treatment under irradiation. The Qβ phage has the coat protein and A2 protein on the outside, and the A1 protein, RNA replicase, and RNA on the inside [
43]. Using a typical photocatalyst, such as TiO
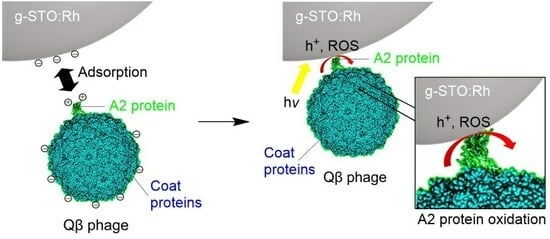
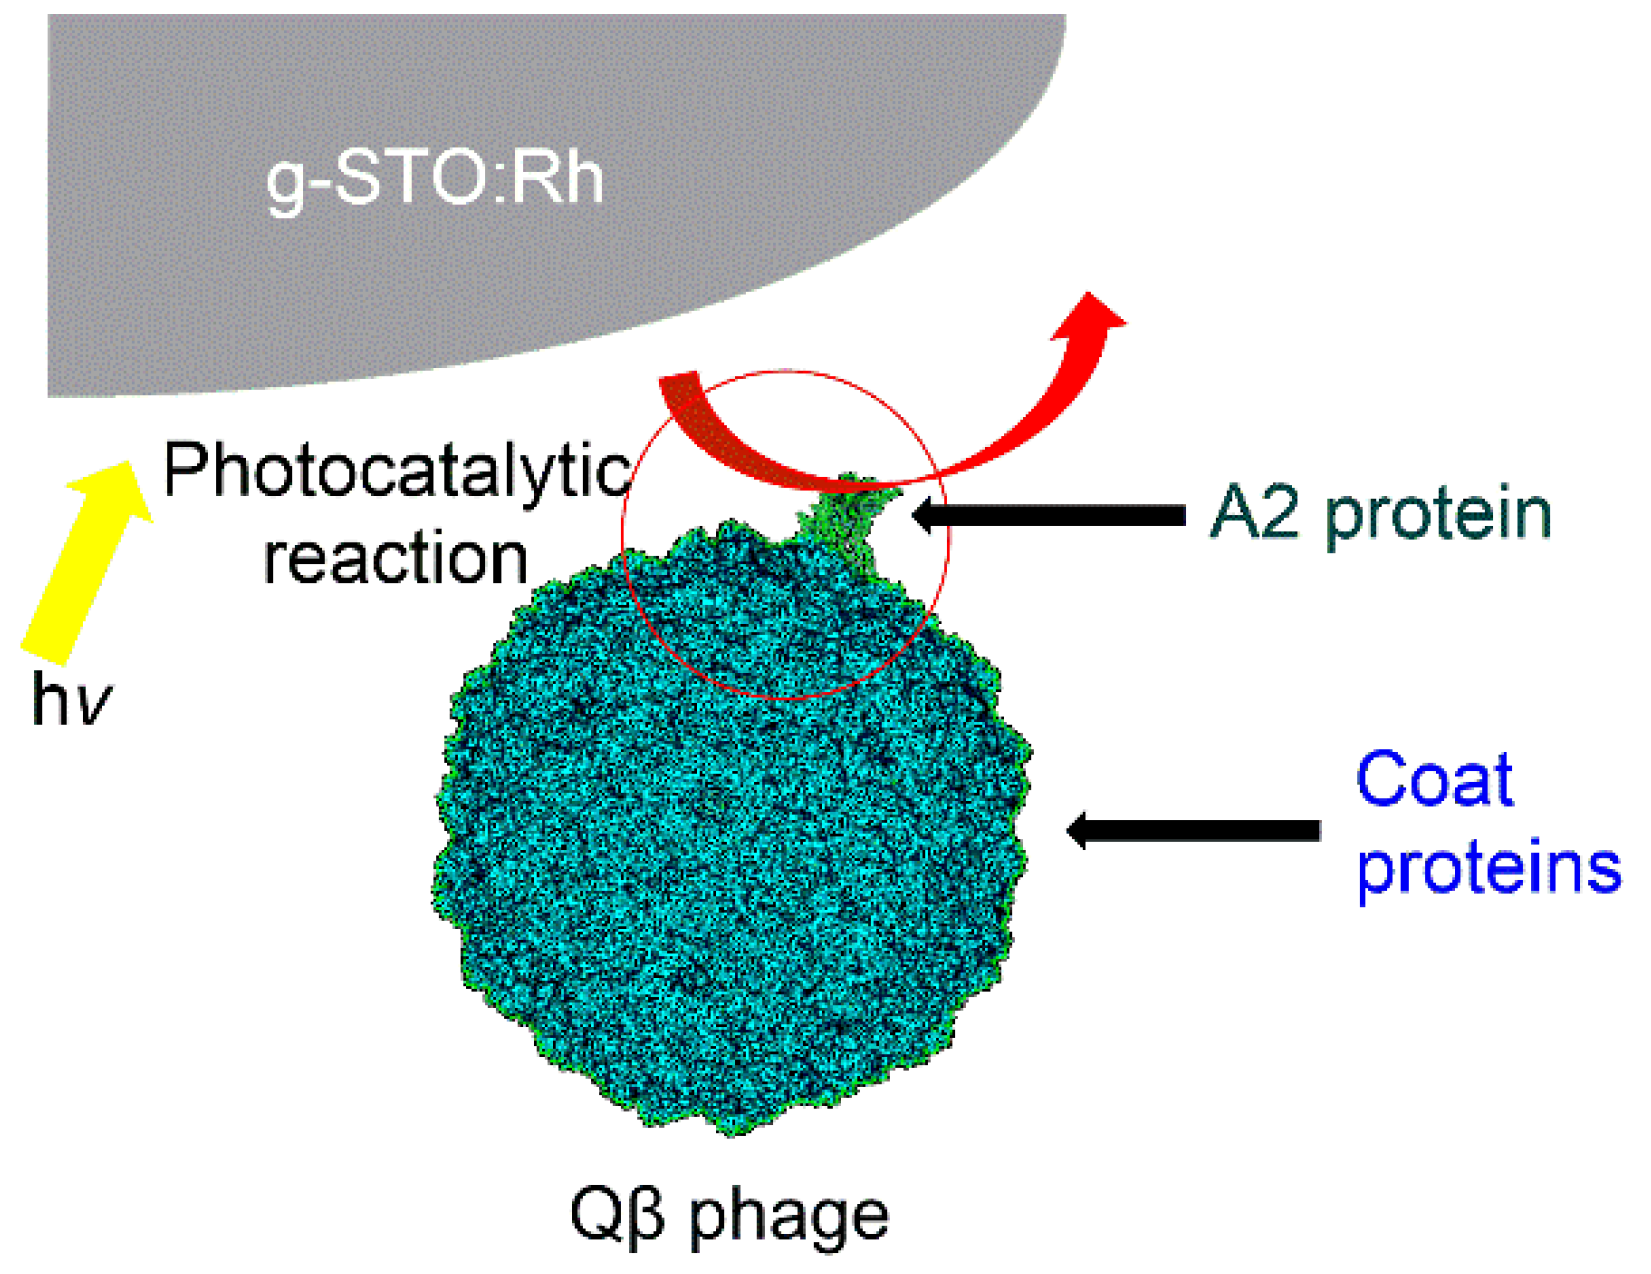
2, generates oxidative holes and ROS via photocatalysis, which indiscriminately destroy the Qβ phage protein and RNA regardless of whether they are inside or outside. In contrast, g-STO:Rh selectively damaged only the A2 protein and RNA replicase of the Qβ phage.
Figure 4 shows the presumed mechanism of the anti-phage effect. The A2 protein and RNA replicase are adjacent [
43]. Additionally, the A2 protein is located outside the phage relative to the RNA replicase [
46], and the RNA adjacent to the RNA replicase was undamaged, which suggests that the A2 protein was damaged first, followed by the RNA replicase.
During the experiment, the A2 protein underwent damage due to g-STO:Rh-mediated photocatalysis, which caused the loss of its attachment ability to the
E. coli. This is believed to be the primary reason behind the Qβ-phage inactivation. However, the outer coat protein of the Qβ phage remained undamaged. Therefore, to investigate the factors in the A2 protein that contribute to g-STO:Rh-mediated selective damage, we conducted experiments using model proteins. A previous report on g-STO:Rh-mediated damage to the model protein lysozyme analyzed molecular weight and protein content using SDS–PAGE and the BCA method [
47]. In SDS-PAGE, the position of the lysozyme band did not change before and after g-STO:Rh treatment in the dark, but its intensity decreased over time. It has been reported that lysozyme adsorbs to microparticles such as silica and ZnO nanoparticles [
48,
49]. Therefore, the decrease in the amount of lysozyme in the g-STO:Rh treatment in dark was probably not due to lysozyme damage, but its adsorption to g-STO:Rh. Meanwhile, the amount of lysozyme also decreased after g-STO:Rh treatment in light. The initial decrease observed in lysozyme staining by CBB (CBB binds to the N-terminal or side-chain amino acids of proteins and is used for protein detection and quantitation [
50]) after treatment with g-STO:Rh may reflect its adsorption to the material. However, unlike the dark treatment, the adsorbed lysozyme decreased over time under light irradiation. These results suggest that the lysozyme initially adsorbs to g-STO:Rh and is eventually decomposed via g-STO:Rh-mediated photocatalysis. This study also reported that the number of peptide bonds of the lysozyme decreased during the g-STO:Rh treatment and light irradiation using the BCA method (the BCA method measures the amount of protein using the reducing capacity of the peptide bonds within the protein [
51]). The SDS–PAGE results suggest that the lysozyme was decomposed via g-STO:Rh-mediated photocatalysis without the detection of lower-molecular-weight intermediates. Therefore, it is suggested that when the lysozyme is damaged by g-STO:Rh-mediated photocatalysis, it first adsorbs to g-STO:Rh and then the peptide bonds are cleaved without releasing the lysozyme. Adsorption to g-STO:Rh may be an important factor in protein decomposition. The adsorption of proteins and photocatalysts in aqueous solution is correlated with the isoelectric point of the protein [
52]. A lysozyme is a basic protein with a high isoelectric point. Therefore, we used ovalbumin, an acidic protein with a low isoelectric point, to investigate whether the isoelectric point of the protein is involved in the damage caused by g-STO:Rh-mediated photocatalysis.
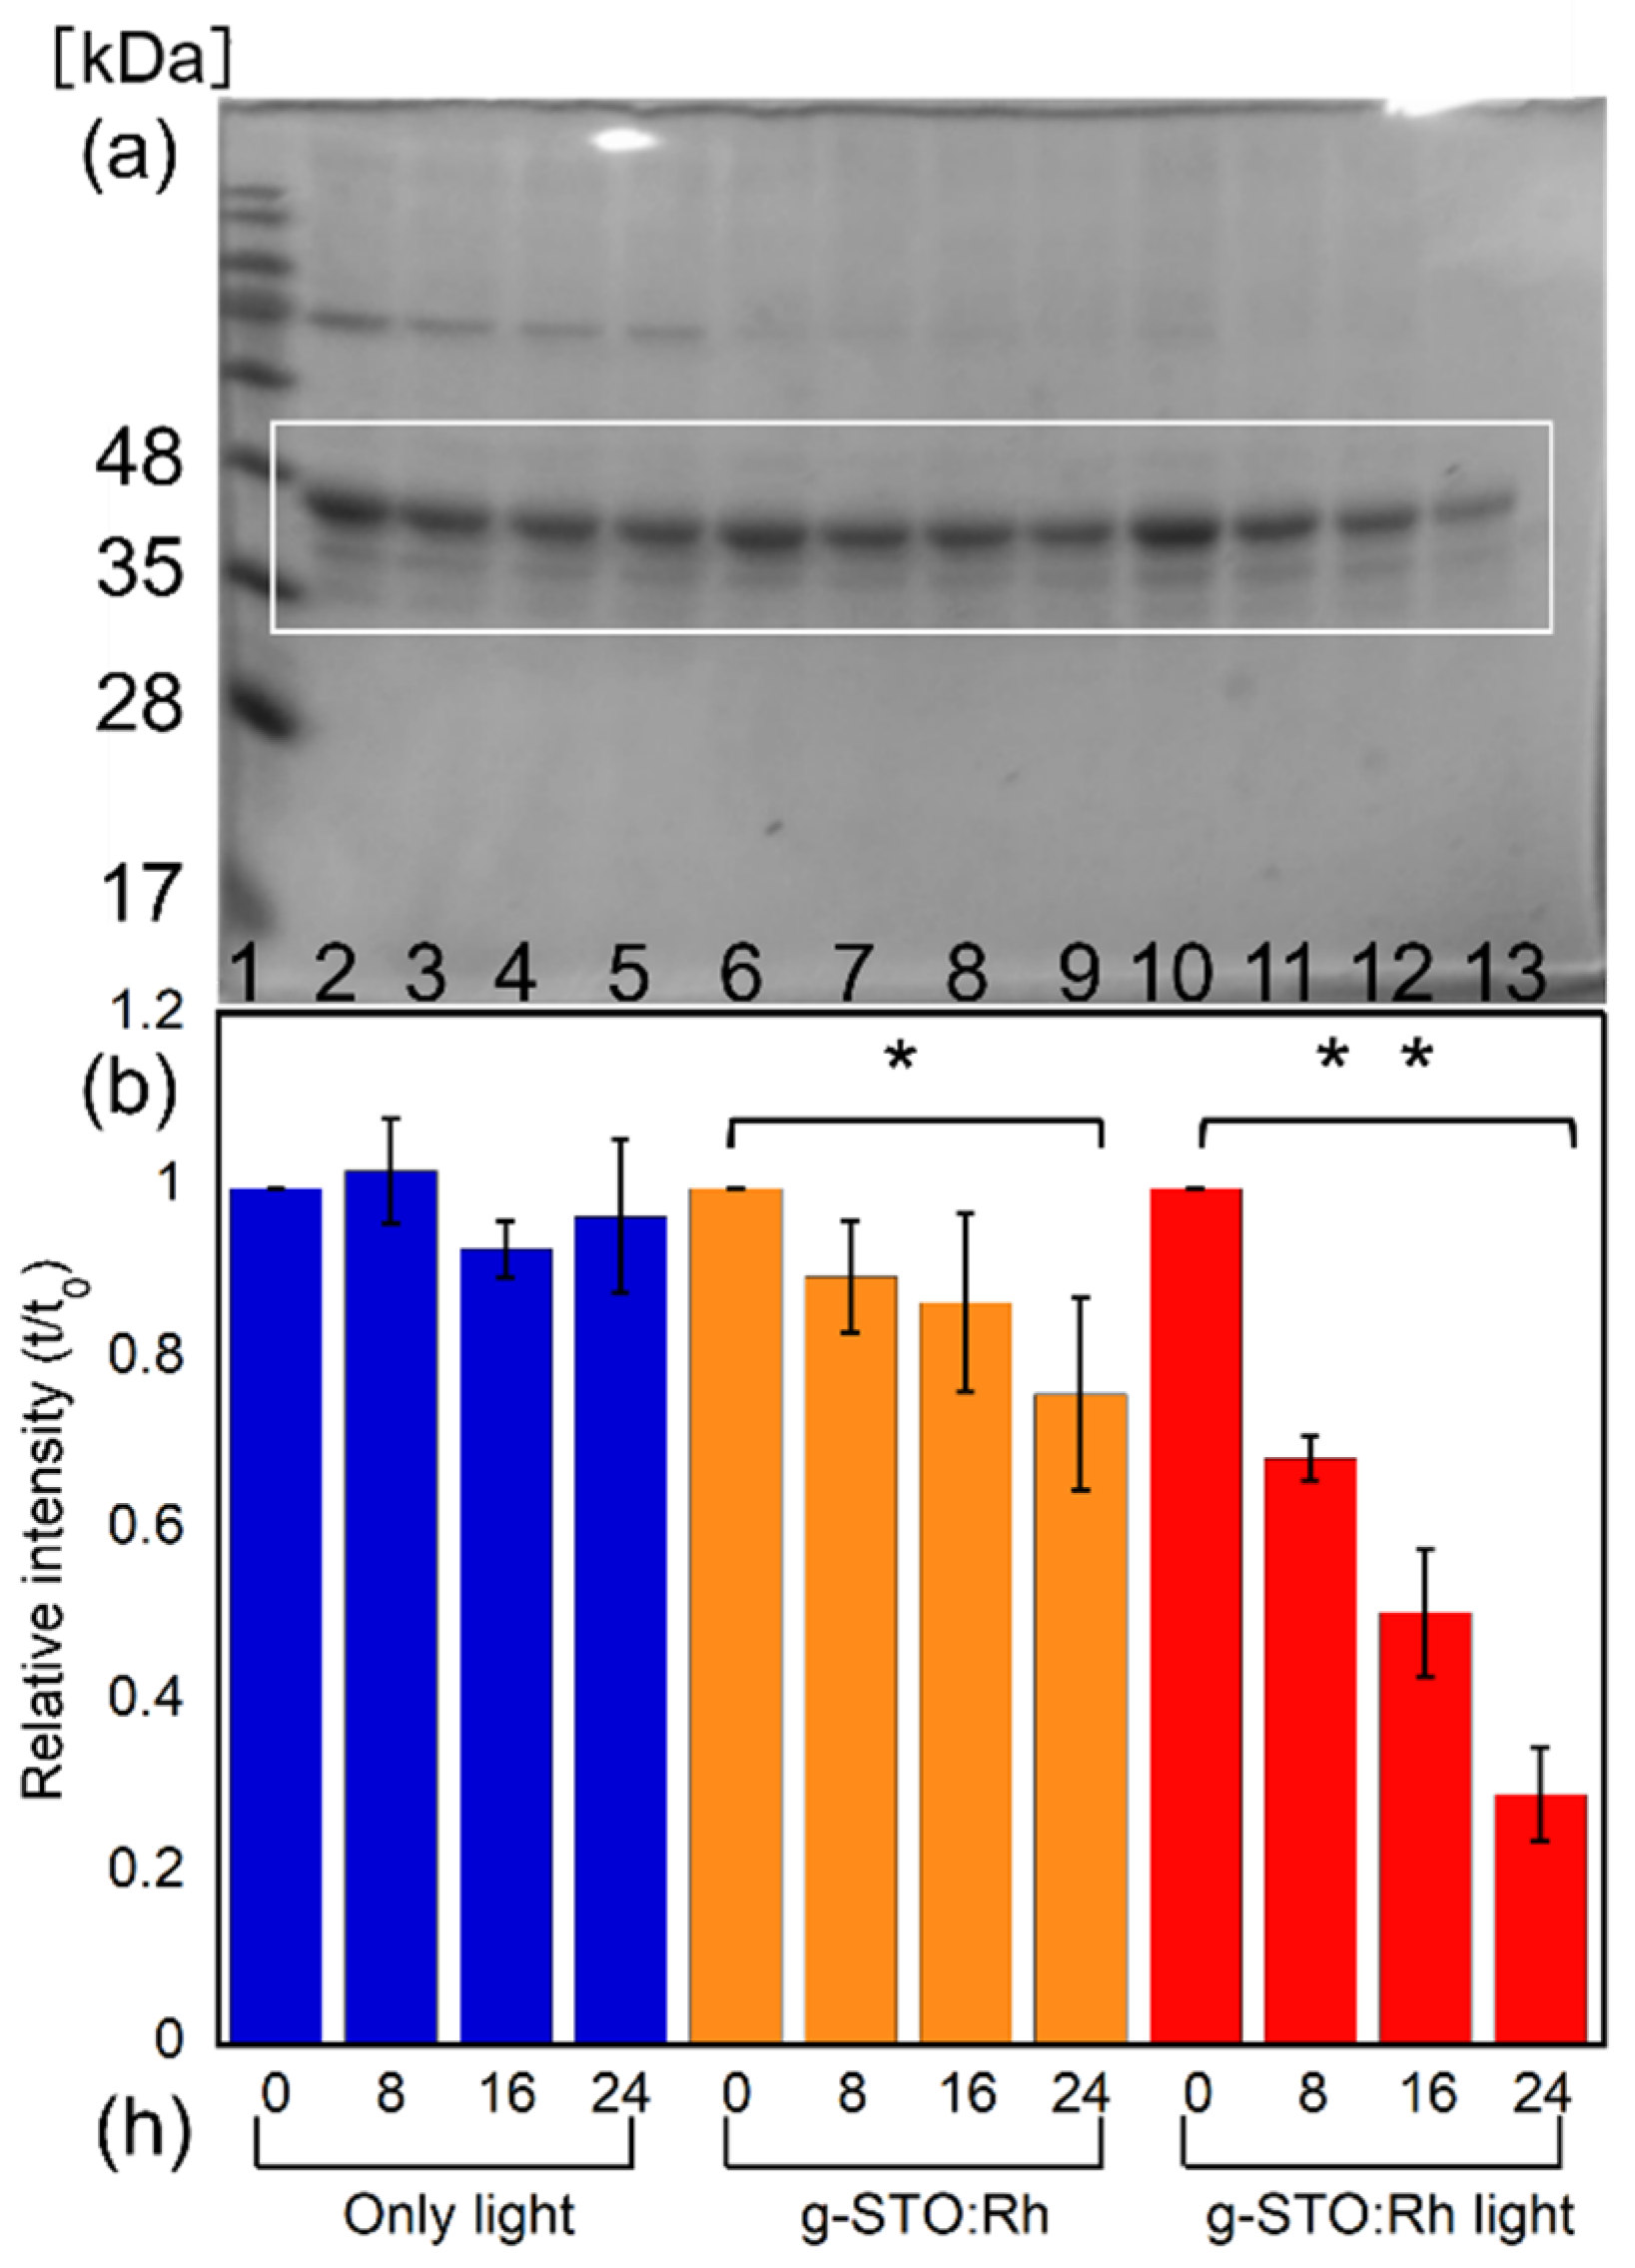
SDS–PAGE was conducted to investigate the effect of g-STO:Rh on ovalbumin, an approximately 45 kDa protein (
Figure 5a). The concentration of ovalbumin irradiated with visible light did not change after treatment for 8, 16, and 24 h (Lanes 2–5). Meanwhile, the concentration of ovalbumin treated with g-STO:Rh in the dark slightly decreased over time (Lanes 6–9). The bands indicating ovalbumin treated with g-STO:Rh in light also faded over time (Lanes 10–13). No new bands other than the band around 45 kDa representing ovalbumin were observed under any conditions. The bands indicating ovalbumin treated with g-STO:Rh in light were fainter than those indicating ovalbumin treated with g-STO:Rh in the dark, when the ovalbumin was quantified by densitometry of gel bands using the image analysis software ImageJ (
Figure 5b). The amount of ovalbumin treated with g-STO:Rh in the dark decreased significantly over time, reaching approximately 0.76 after 24 h (
p < 0.05). The amount of ovalbumin treated with g-STO:Rh in the light showed an even greater decrease over time, reaching approximately 0.29 after 24 h (
p < 0.01). The amounts of lysozyme treated with g-STO:Rh for 24 h in dark and light were approximately 0.16 and 0.03, respectively [
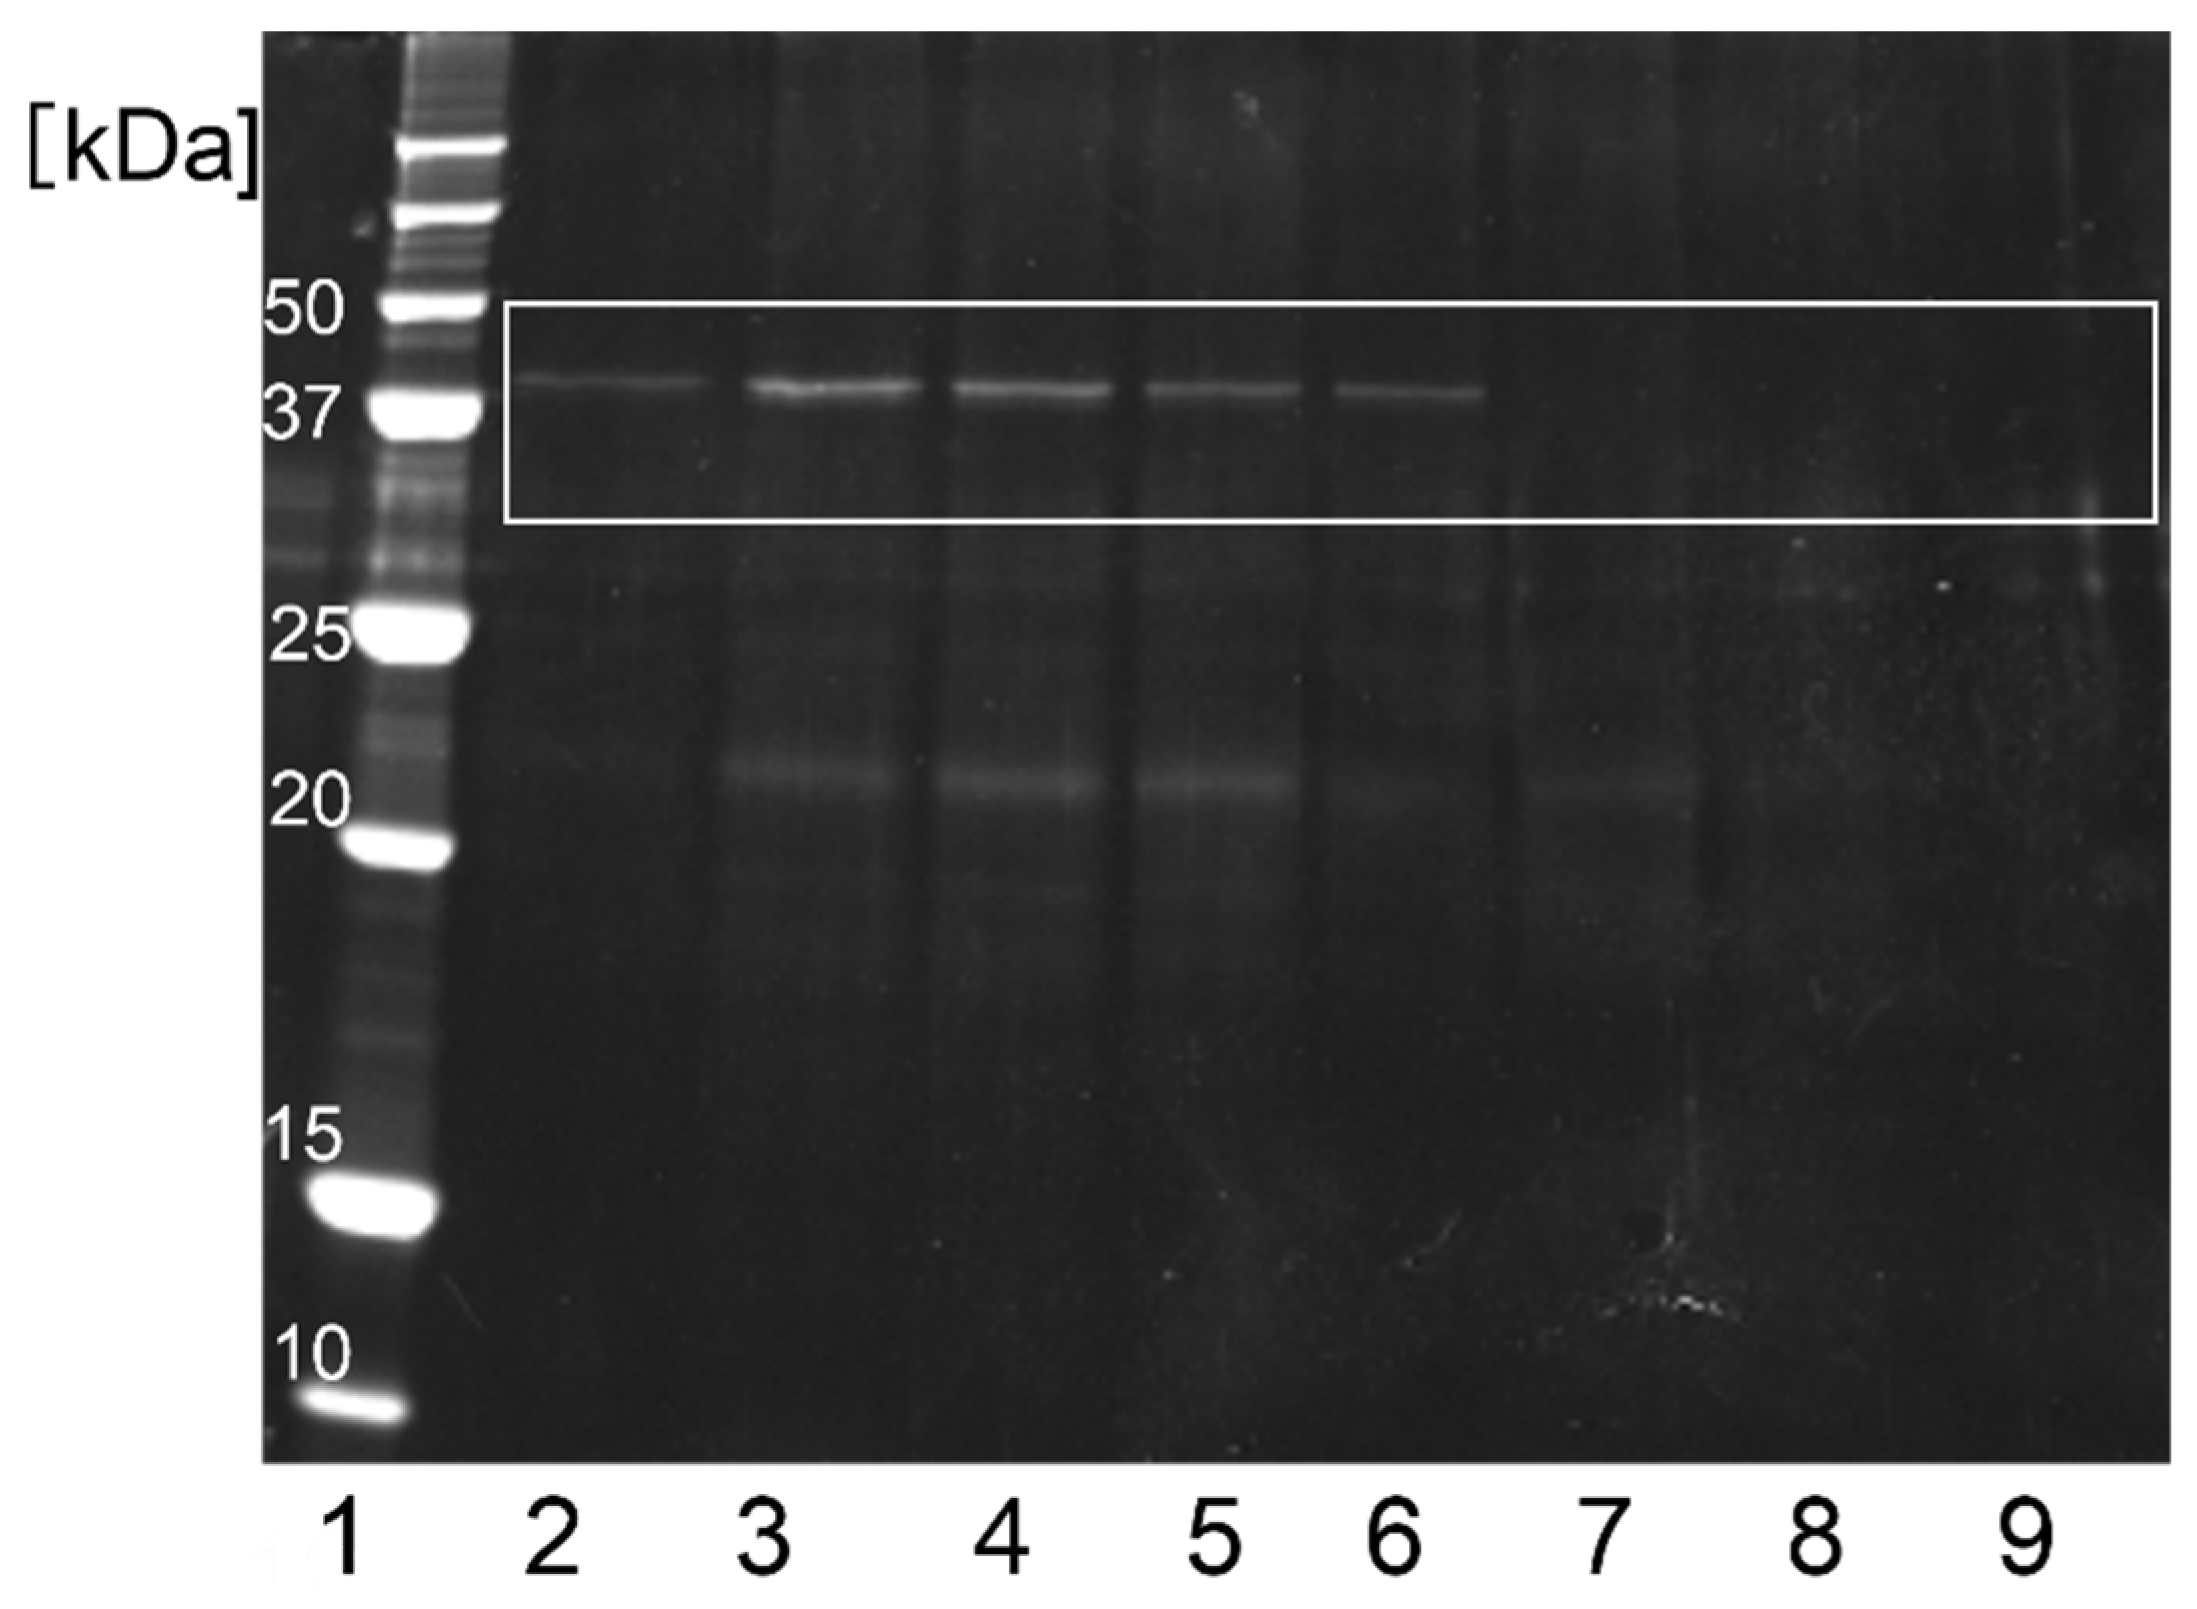
47]. Therefore, the decreasing rate of the ovalbumin was lower than that of the lysozyme, both in the dark and light. To examine the amount of ovalbumin absorbed to the g-STO:Rh, we examined the ovalbumin eluted in lysis buffer from g-STO:Rh used in dark and light treatment (
Figure 6). The ovalbumin band eluted in the lysis buffer after g-STO:Rh treatment in the dark intensified after incubation and a new band between 20 and 25 kDa appeared in the incubated sample (No. 2–5). However, the 45 kDa ovalbumin from light-irradiated g-STO:Rh was hardly observed after 8 h treatment. The band between 20 and 25 kDa intensified at 8 h and decreased over time (No. 6–9).
The 45 kDa band indicating ovalbumin eluted from g-STO:Rh in the dark was more intense after treatment for 8 h than that after treatment for 0 h, suggesting that the ovalbumin was adsorbed to g-STO:Rh. Our previous study used CBB staining for staining lysozyme [
47], whereas the present study used oriole staining for ovalbumin, which is more sensitive than CBB staining. Even with a method with more than 10 times the sensitivity, the ovalbumin band itself was faint. Therefore, the amount of ovalbumin adsorbed was considerably lower than that of the lysozyme. In addition, the 45 kDa ovalbumin absorbed on g-STO:Rh underwent degradation, producing intermediates with molecular weights in the range of 20–25 kDa. These results suggest that ovalbumin is adsorbed similarly to lysozyme, but at a lower rate, and that the adsorbed ovalbumin degrades on g-STO:Rh without being released to water once it is absorbed.
The isoelectric points of lysozyme and ovalbumin were approximately 11 and 4.5, respectively. In ultrapure water at pH 7, lysozyme has a net positive charge and ovalbumin has a net negative charge. Moreover, the zeta potential of g-STO:Rh in ultrapure water at pH 7 was −20.5 mV, indicating that it was negatively charged. Therefore, the electrostatic forces expected to act on lysozymes are greater than those acting on ovalbumins. In addition to electrostatic attraction, hydrophobic interactions and Van der Waals force are also factors related to protein adsorption. The frequencies of hydrophobic amino acids are comparable between ovalbumin and lysozyme, which are 50.8% and 49.3%, respectively. High-molecular-weight proteins generally have wide hydrophobic sites, making it easier for them to adsorb to other substances. However, the lysozyme, which has a lower molecular weight, adsorbed more to g-STO:Rh than ovalbumin. Therefore, hydrophobic interaction is not considered to be a main factor for lysozyme adsorption. The van der Waals force is related to adsorption [
53], but it is unlikely to be the main factor because the effective range is narrower and the force is weaker than the force acting between the ions, as described above [
54]. Electrostatic attraction is therefore the strongest contributor to adsorption. Electrostatic attraction of proteins to g-STO:Rh is possibly one of the causes of protein damage due to efficient contact with holes and ROS generated from g-STO:Rh.
To confirm whether electrostatic attraction is involved in the adsorption of g-STO:Rh and lysozyme, we changed the pH of the lysozyme solution to confirm whether the amount of lysozyme adsorbed changed.
Figure 7 illustrates the quantity of residual lysozyme that remained unabsorbed after the interaction of g-STO:Rh with lysozyme, providing insights into the amount of lysozyme adsorbed on g-STO:Rh. The ratio of the residual lysozyme after treatment for 24 h significantly decreased to approximately 0.85 (
p < 0.05), 0.55 (
p < 0.01), and 0.38 (
p < 0.01) for the lysozyme solution at pH 6, pH 7, and pH 8, respectively. The difference between pH 7 and 8 (
p < 0.01) was verified by
t-test. At lower pH levels, proteins tend to carry a more positive charge due to the presence of excess protons in the environment, which can lead to the protonation of amino acids and an increase in positive charge on the protein. However, the absorption of lysozyme decreased as the pH decreased. This result is consistent with the absorption of lysozyme to silica particles at different pH levels [
48]. The proteins absorbed to SiO
2 undergo partial structure loss, which shows the primary attraction of proteins by electrical charge, which than leads to structural change in conformation and absorption by a mechanism other than electrical charges. The surface curvature of the particle is one of the factors affecting the conformational change. The less-significant perturbation of lysozyme’s secondary structure is observed when the protein is adsorbed onto smaller nanoparticles. It is thought that this is due to the anchorage of one end to the nanoparticle isolate’s other protein domains from the particle surface [
48,
49]. This suggests that the absorption efficiency of proteins to microparticles is affected by the accessibility of the protein domain to the particle surface. Given that both holes and electrons are generated during photocatalysis, electrostatic charges primarily serve to attract molecules, and decomposition is likely to occur independently of electrostatic charges once protein is absorbed to g-STO:Rh.
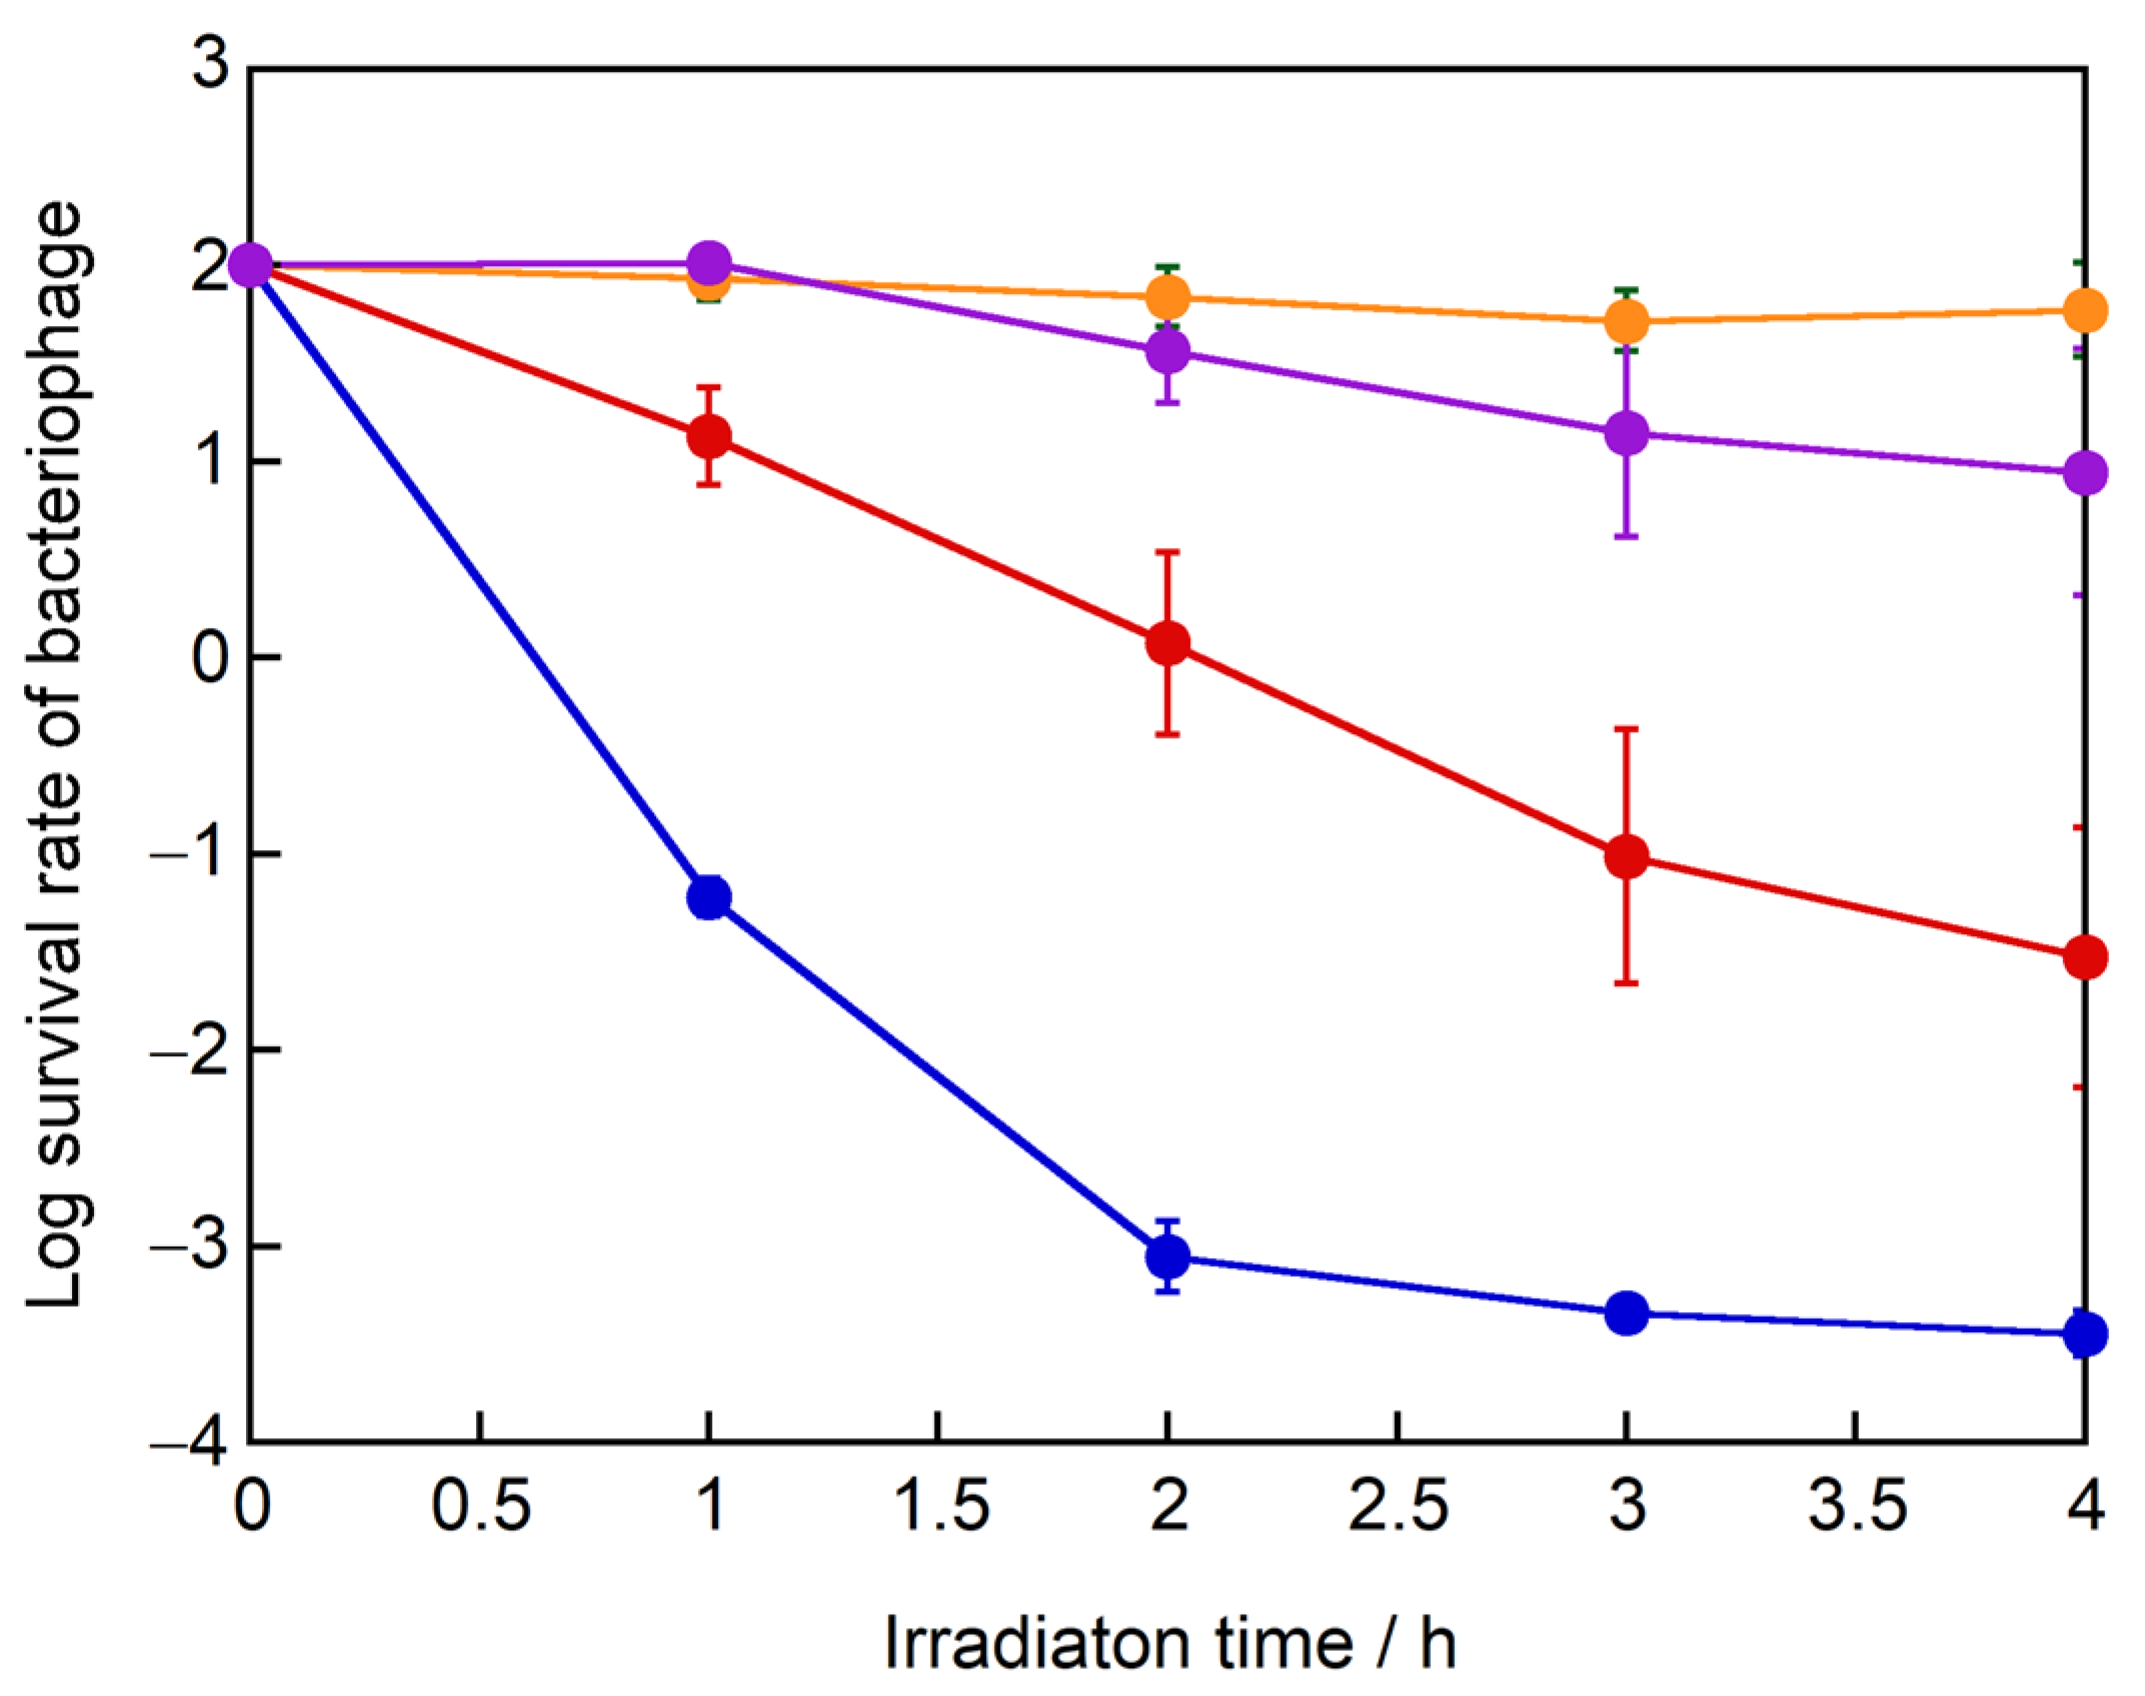
Since the negatively charged ovalbumin was absorbed to g-STO:Rh and degraded by light irradiation, the electrostatic charges of the proteins cannot fully protect absorption on g-STO:Rh and degradation of the proteins. We next used four phages to confirm whether the steric structure of the virus affects the inactivation efficiency due to the accessibility to the g-STO:Rh surface. We used the Qβ and MS2 phages possessing proteins with a net positive charge near neutral pH and φX174 and φ6 phages possessing negatively charged proteins, and compared their inactivation efficiencies (
Figure 8). The survival rate of the Qβ phage treated with g-STO:Rh for 2 h in light decreased to approximately 0.001%. Next, the survival rate of the MS2 phage, which has a positively charged protein like the Qβ phage, took 4 h in light to decrease to approximately 0.01%. The survival rate of the MS2 phage decreased much more slowly than the Qβ phage, although the MS2 phage has positively charged surface proteins. Meanwhile, the survival rate of the φX174 phage, which has a negatively charged protein, treated with g-STO:Rh for 4 h in light was 10^(1.98)%, only approximately 4.5% loss. Interestingly, the survival rate of the φ6 phage, which has a negatively charged protein, treated with g-STO:Rh treatment for 4 h in light was approximately 10%. The g-STO:Rh can decompose many organic compounds like sugar, gases aldehydes and amino acids into water and CO
2, indicating enough potential to degrade most biological structures. Thus, these results show that the isoelectric point of surface proteins contributed significantly to phage inactivation (
Table 1), but the difference in the steric structure, which contributes to the access to the g-STO:Rh surface, is also important for efficient inactivation.
Meanwhile, the
E. coli external structure mostly comprises a negatively charged outer membrane and has a negative zeta potential. The electrostatic attraction between the negatively charged g-STO:Rh and
E. coli is poor. Furthermore,
E. coli is capable of synthesizing and repairing its own proteins. Thus, the difference in contact efficiency to the photocatalyst admits time for
E. coli to repair the damaged molecules, achieving the selective inactivation of the Qβ phage over
E. coli in photocatalysis using g-STO:Rh. In addition to virus inactivation, the mechanism of g-STO:Rh, which irreversibly absorbs protein until complete degradation, may become important in the treatment of infectious diseases. This is because the SARS CoV-2 spike protein alone has been reported to cause symptoms simply by binding to its receptor, suggesting that the complete degradation of inactivated virus may be required to suppress the symptoms [
55]. In the future, elucidation of the attraction and absorption mechanism of g-STO:Rh may lead to the selective inactivation of specific molecules in vivo.
4. Materials and Methods
4.1. Preparation of Photocatalyst
The g-STO:Rh powder was prepared according to the following procedure. A mixture of 2.53 g SrCO3 (Kanto Chemical Co., Inc., Tokyo, Japan), 1.27 g TiO2 (Soekawa Chemical Co., Ltd., Tokyo, Japan), and 20.3 mg Rh2O3 (FUJIFILM Wako Pure Chemical Corp., Tokyo, Japan) was prepared in an alumina mortar, mixed for 4–5 h using a pestle, heated to 900 °C at 9.7 °C/min in an electric furnace (DENKEN-HIGHDENTAL Co., Ltd., Kyoto, Japan), and sintered for 1 h. After cooling, the temperature was raised again to 1100 °C at 7.2 °C/min and then sintered for 10 h. After cooling, the mixture was ground in a planetary ball mill (FRITSCH JAPAN Co., Ltd., Yokohama, Japan) at 800 rpm for 60 min, filtered through a 0.2 µm membrane filter (Merck Millipore, Burlington, MA, USA), and dried at 60 °C for 24 h.
4.2. Preparation of E. coli and P. syringae Suspension
Qβ phage NBRC20012, MS2 phage NBRC102619, φX174 phage NBRC103405, and φ6 phage NBRC105899 were used for the anti-phage test. Additionally, E. coli NBRC10637 was used as the host to culture the Qβ and MS2 phages, E. coli NBRC13898 was used to culture the φX174 phage, and Pseudomonas syringae NBRC105640 was used for the φ6 phage. These strains were provided by the NBRC.
First, E. coli and P. syringae were cultured by shaking at 30 °C for 16 h in NB medium (Nissui Pharmaceutical 05514) as a preculture. Next, 200 µL preculture was seeded in NB medium and cultured with shaking at 30 °C for 3 h as the main culture. The main culture was centrifuged at 4 °C and 1100× g for 10 min, the supernatant was discarded, and the cells were washed with 1 mL physiological saline (0.9 w/v% NaCl) thrice. Then, the turbidity of the E. coli and P. syringae suspensions were adjusted to 0.5 with physiological saline.
4.3. Preparation of Phage Suspension
A total of 0.1 mL E. coli suspension was added to 1.0 mL Qβ, MS2, or φX174 phage suspensions. Similarly, 0.1 mL P. syringae suspension was added to 1.0 mL φ6 phage suspension. Afterwards, 3.0 mL calcium-supplemented NB soft agar medium was added to each phage suspension and mixed by inverting. Then, the cells were overlaid on the calcium-supplemented NB agar medium and cultured at 37 °C for 24 h. After culturing, 2.0 mL calcium-supplemented NB medium was poured onto the layered agar medium and it was stored overnight at 4 °C in a refrigerator. Later, the liquid medium and layered soft agar medium was collected in a centrifuge tube using a scraper, and centrifuged at 4 °C and 10,000× g for 20 min, and the supernatant was collected and filtered through a 0.22 µm diameter polyvinylidene fluoride (PVDF; Advantec, Osaka, Japan) membrane. The filtrates were used as phage suspensions for further experiments.
4.4. Anti-Phage Test
A total of 150 mg (3.0 mg/mL) g-STO:Rh was added to 50 mL sterile water and sonicated for 5 min to disperse the g-STO:Rh. Afterwards, the phage suspensions were added so that the infectivity titer was 5 × 10⁷ PFU/mL, and the solution was stirred with a stirrer and irradiated with a UV cut filter (Y-44, 440 nm < λ, HOYA) at 110 mW/cm2. Phages that were only irradiated or g-STO:Rh-treated in the dark were used as the negative controls. The phage suspensions were collected at pre-determined intervals and the Qβ phage activity rate was measured by the plaque counting method.
4.5. Effect of Photocatalyst Treatment on Ovalbumin
A total of 45 mg (3.0 mg/mL) g-STO:Rh was added to 15 mL ultrapure water and sonicated for 5 min. Then, 7.5 mg (0.5 mg/mL) ovalbumin (FUJIFILM Wako Pure Chemical Corp.) was added and irradiated with a UV cut filter (Y-44, 440 nm < λ) at 110 mW/cm2 while stirring. The light-irradiation-only treatment, which was the negative control, and the g-STO:Rh treatment in the dark were conducted in the same manner. The ovalbumin solution was collected at pre-determined time intervals and centrifuged at 9000× g for 5 min to collect the supernatant. The supernatant was subjected to sodium dodecyl sulfate polyacrylamide gel electrophoresis (SDS–PAGE).
4.6. Protein Adsorption to g-STO:Rh
Ovalbumin solutions were collected at pre-determined time intervals after g-STO:Rh treatment in both the light and dark.
Meanwhile, lysozyme (FUJIFILM Wako Pure Chemical Corp.) was adsorbed onto g-STO:Rh under several pH conditions in dark. A weight of 45 mg (3.0 mg/mL) g-STO:Rh was added to 15 mL 50 mM Tris-HCl (pH 6, 7, 8) and sonicated for 5 min, after which 7.5 mg (0.5 mg/mL) lysozyme was added and incubated in dark while stirring. Then, the lysozyme solution was collected at pre-determined time intervals.
The collected ovalbumin and lysozyme solutions were centrifuged at 9000× g for 5 min. Then, the supernatant was removed and g-STO:Rh was collected. Next, g-STO:Rh was suspended in SDS sample buffer (62.5 mM Tris HCl pH 6.8, 5% v/v glycerol, 1% v/v SDS, and 3% v/v 2-mercaptoethanol (FUJIFILM Wako Pure Chemical Corp.)) to collect each protein adsorbed to g-STO:Rh. After agitation with a vortex for 10 min, this was centrifuged at 9000× g for 5 min. Then, the supernatant from which each protein was eluted was collected and used as a sample for SDS–PAGE.
4.7. Qβ Phage Protein Purification
Each negative-control Qβ phage suspension was centrifuged at 12,000× g for 10 min. Then, g-STO:Rh was completely removed by collecting the supernatant, which was further concentrated by centrifuging at 7500× g for 30 min using an ultrafiltration filter (Merck Millipore) that permeates 50 kDa or smaller proteins and collects the liquid that did not permeate the membrane. Ice-cold acetone was added to the concentrated Qβ phage suspension, incubated overnight at −20 °C, and centrifuged at 12,000× g for 5 min, and the supernatant was removed. The obtained pellet was suspended in 200 µL lysis buffer (final concentrations: 10 mM EDTA-2Na, 0.5% sodium lauroyl sarcosinate, and 50 mM Tris-HCl pH 7.8) and incubated at 25 °C for 24 h to re-dissolve the protein. This solution was used as the Qβ phage protein solution.
4.8. Protein Concentration Quantification
A total of 100 µL lysis buffer was added to 100 µL Qβ phage protein solution or g-STO:Rh-treated ovalbumin solution. Then, 50 µL of this mixture was added to a 1 mL 50:1 BCATM Protein Assay Reagent A and BCATM Protein Assay Reagent B mixture (Thermo Fisher Scientific, Waltham, MA, USA), it was incubated at 37 °C for 30 min, and its absorbance at 570 nm was measured using a MICRO PLATE READER (BIO-RAD, Hercules, CA, USA). A calibration curve was created from the absorbance results for 0, 0.1, 0.2, 0.4, 0.8, 1.2, 1.6, and 2.0 mg/mL bovine serum albumin (BSA; Thermo Fisher Scientific), and the protein concentration of each sample was measured based on the graph.
4.9. SDS–PAGE
A total of 6 mL 15% acrylamide gel was poured to the gel plate, overlaid with ultrapure water, and rested at 25 °C for 45 min to solidify the separation gel (6 × 9 cm2). After removing the ultrapure water, the acrylamide gel was overlaid, a gel comb was inserted, and the gel was solidified at 25 °C for 30 min. Precision Plus Protein™ Unstained Standard (BIO-RAD) was used as a marker. The protein solution and 3× sample buffer (187.5 mM Tris HCl pH 6.8, 15% v/v glycerol, 3% w/v SDS) were prepared so that they all had the same concentration at a 2:1 volume, and were used for SDS–PAGE after heating at 100 °C for 10 min. The marker was prepared by mixing the above stock solution and 1× sample buffer at 1:1 volume ratio. A total of 20 µL prepared marker and resulting protein solution was applied to each well, and electrophoresis was conducted for 100 min at a 130 mA constant current per gel in the running buffer (final concentration 25 mM Tris, 192 mM glycine (FUJIFILM Wako Pure Chemical Corp.), and 0.1% v/w SDS). After electrophoresis, the gel was removed from the electrophoresis apparatus, immersed in Oriol staining solution (BIO-RAD), shaken for 90 min, irradiated at 254 nm using a transilluminator (Atto Co. Ltd., Tokyo, Japan) for detection, and imaged. The brightness of the bands was measured using ImageJ.
4.10. Quantitative PCR
The QIAamp® Viral RNA Mini Kit (QIAGEN) was used to extract and purify RNA from Qβ phages. Next, QuantiTect® Reverse Transcription (QIAGEN) was used to reverse-transcribe the collected Qβ phage RNA. The reverse-transcribed sample was used for PCR as the 1st-strand cDNA.
Real-time PCR was conducted using the QuantiTect® Probe PCR kit (QIAGEN) and Thermal Cycler Dice® Real Time System II (TaKaRa) and the forward primer (5′-TAAGCGAATGTTGCGAGCAC-3′), reverse primer (5′-TGCCTAAACAGCTGCAACGT-3′), and probe (5′-FAM-TGCCCTCGTCGGATCGGTCCTAAT-BHQ-1-3′). Additionally, uracil-N-glycosylase (UNG; Sigma-Aldrich) was added to the PCR solution to prevent PCR carryover. The reaction conditions were as follows: 2 min at 50 °C for UNG synthesis followed by 15 min at 95 °C for cDNA synthesis. Afterwards, a cycle of 94 °C for 15 s and 60 °C for 1 min was conducted 45 times.
4.11. Detection of Attachment Rate of Qβ Phage to E. coli
The Qβ phages were mixed with
E. coli, and the mixture in which the Qβ phage was attached to
E. coli was obtained immediately after mixing and stirring at 37 °C for 3 h. Afterward, each mixture was centrifuged at 9000×
g for 20 min to remove the
E. coli and Qβ phage attached to
E. coli. The Qβ phage attached to
E. coli was precipitated together with
E. coli by centrifugation. Meanwhile, the Qβ phage not attached to
E. coli remained free in the supernatant after centrifugation. By collecting the supernatant, only the free Qβ phage could be obtained. Then, the Qβ phage RNA present in the supernatant was extracted, purified, and quantified using quantitative PCR. The RNA amount is proportional to the number of phage particles; thus, the number of phage particles can be estimated from the RNA amount. The Qβ phage RNA amount present in the supernatant, obtained by centrifuging the mixture at the start of treatment, indicates the total Qβ phage RNA amount. Meanwhile, the Qβ phage RNA amount present in the supernatant obtained by centrifuging the mixture after stirring for 3 h indicates the amount of RNA from free Qβ phages. The attachment rate was calculated according to the following formula:
4.12. Zeta Potential Measurement
The Zeta potential was measured using a ZETASIZAER Nano ZS (Malvern Panalytical) to investigate the g-STO:Rh particle surface charge. A total of 3 mg (0.3 mg/mL) g-STO:Rh was added to 10 mL ultrapure water and sonicated for 5 min to disperse g-STO:Rh, after which measurements were made at 25 °C.
4.13. Statistical Analysis
The mean ± standard deviation (SD) was used for the statistical analysis of results by Microsoft Excel. Experimental data were subjected to an unpaired t test, with representation from at least three independent experiments. Results of p < 0.05 and p < 0.01 were defined as the criteria for statistical significance.


 ,
, 


