Article

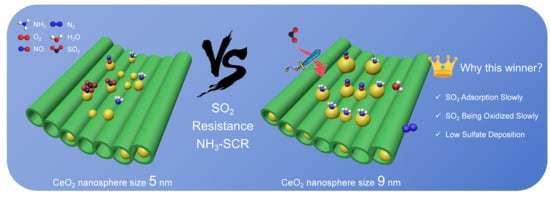
Influence of Particle Size of CeO2 Nanospheres Encapsulated in SBA-15 Mesopores on SO2 Tolerance during NH3-SCR Reaction

1
Ganjiang Innovation Academy, Chinese Academy of Sciences, No.1, Science Academy Road, Ganzhou 341000, China
2
School of Rare Earths, University of Science and Technology of China, Hefei 230041, China
3
Key Laboratory of Rare Earths, Chinese Academy of Sciences, Ganzhou 341000, China
4
Changchun Institute of Applied Chemistry, Chinese Academy of Sciences, Changchun 130022, China
*
Authors to whom correspondence should be addressed.
Catalysts 2024, 14(2), 151; https://doi.org/10.3390/catal14020151
Submission received: 31 December 2023 / Revised: 2 February 2024 / Accepted: 13 February 2024 / Published: 18 February 2024
(This article belongs to the Special Issue Rare Earth Catalysis: From Synthesis to Sustainable Applications)

Abstract

:
Ce-based selective catalytic reductions with an NH3 (NH3-SCR) catalyst have emerged as a focal point in denitrification catalyst research. However, the correlation between the structural characteristics of Ce-based catalysts and the influence of CeO2 nanoparticle size on SO2 resistance remains unclear. CeO2 nanospheres with different sizes of less than 10 nm were synthesized, and a series of supported CeO2/SBA-15 catalysts were prepared according to the 10 nm pore size of SBA-15. These catalysts were used to explore the influence of the size of the CeO2 nanospheres on these catalysts, specifically on their SO2 resistance in NH3-SCR reactions. With the increase in size, their SO2 resistance became stronger. The results of NH3-TPD, H2-TPR, and XPS indicated that the catalyst with the largest particle size had the lowest adsorption of SO2, which was attributed to more acid sites and a mutual effect between Si and Ce, resulting in the best SO2 resistance. It was also observed that there was less sulfate deposition on the catalyst by thermogravimetric analysis. In situ DRIFTs revealed that after SO2 poisoning, the NH3-SCR reaction on the catalyst predominantly follows the E-R mechanism. This study offers recommendations for the development of Ce-based SO2-resistant NH3-SCR catalysts, specifically focusing on the synthesis and interaction of nanomaterials.

Graphical Abstract

1. Introduction

NOx, including NO and NO2, is a common air pollutant from industrial boilers [1,2,3,4]. Selective catalytic reduction with NH3 (NH3-SCR) has been used for a long time as an effective method of purification [5,6]. Due to its outstanding oxygen storage capacity (OSC), ceria (CeO2) and modified Ce-based catalysts have attracted much attention from researchers to rare earth heterogeneous catalysts for NH3-SCR [7,8]. However, pure CeO2 nanocatalysts have a low catalytic activity, partly due to their low surface acidity and agglomeration effects caused by particle aggregation [9,10]. One way to solve this problem is to prepare supported Ce-based catalysts, and the specific surface area should be considered when choosing a suitable support. For example, SBA-15, a mesoporous silica molecular sieve with a high surface area of about 400 m2/g, constitutes a promising support material for catalytic applications [11]. Shen et al. used SBA-15 as a support to synthesize CeO2/SBA-15 catalysts and focused on the effect of a P123 template on the attachment of CeO2 to the surface of SBA-15 [12]. Their results showed that SBA-15 could be a great support, while P123 was a template which increased the dispersion of CeO2.
Currently, the deactivation of catalysts caused by SO2 poisoning has become an extremely serious problem for Ce-based NH3-SCR catalysts. The adsorption of SO2 on the surface of the catalyst and the subsequent oxidation generating SO3 and Ce2(SO4)3 are steps taking place above a temperature of 300 °C, alongside the formation of ammonium sulfate (AS) and ammonium bisulfate (ABS). After the above, these sulfate bulks cover the active centers, leading to a sharp drop in catalytic activity. Furthermore, the active centers of supported CeO2-based catalysts may transfer to the contact surface or be limited by the structure of the supports [13]. This phenomenon results in different numbers and densities of active centers due to the different sizes of CeO2-based particles [14]. Ma et al. synthesized a novel hollow structure where TiO2 was the shell and C@CeO2 was the core [15]. They compared the SO2 resistance of shells with different sizes: 5 μm and 400 nm. Their test data showed that larger shells had better SO2 resistance. They only explained the effect of AS and ABS on the catalyst and how large shells counteracted this effect, but they did not explore the effect of the particle size of the CeO2. Hu et al. used the wet impregnation method to prepare CeO2/MoO3(nanorods) catalysts [16]. The size of the CeO2 was controlled by the amount of Ce(NO3)3 added. They found that smaller CeO2 particles had more non-bulk electronic states, which increased the rejection of SO2 adsorption. However, the impregnation method they used led to an uneven distribution and an inconsistent morphology of the introduced CeO2 particles, resulting in not only considering particle size as a single variable between different samples but also affecting subsequent studies.
Nanospheres have garnered significant attention in the areas of material synthesis and application due to their regular crystal planes and uniform morphology. Li et al. synthesized Mn-doped CeO2 nanospheres for NH3-SCR, demonstrating that these nanospheres had a better performance than those prepared using the co-precipitation method [17]. However, in current studies, little focus has been given to the sulfur resistance of nanospheres, which is an important parameter for their applications. Moreover, the impact of particle size on the properties of these nanospheres has not been well understood.
In this study, CeO2 nanospheres with varying diameters were synthesized and supported by an SBA-15 molecular sieve. The focus was on the performance of NH3-SCR and SO2 resistance. After determining the optimal loading percentage for maximum catalytic activity, four different sizes of CeO2 nanospheres (5 nm, 6 nm, 7 nm, and 9 nm) were prepared and loaded onto SBA-15 at the determined optimal loading percentage. The particle size of the CeO2 nanoparticles was determined using a laser particle size analyzer and TEM. XRD, FT-IR, H2-TPR, NH3-TPD, and XPS were used to investigate the structure, physical and chemical properties, and electronic state of the CeO2/SBA-15 catalysts. The catalytic performance was evaluated on a fixed-bed reactor with an online infrared gas analyzer, and the impact of SO2 was assessed by decreased catalytic efficiency. Additionally, possible reaction mechanisms for these nanosphere catalysts were proposed to better understand the NH3-SCR reaction via in situ DRIFTs.

2. Results and Discussion

2.1. Pore Analysis of SBA-15

SBA-15, which was purchased from XFnano in Nanjing, PRC, was the support of the CeO2 nanospheres. The investigation of its pore structure was helpful in selecting the appropriate particle size of the nanospheres in the preparation process. A N2 isotherm adsorption and desorption test was performed on this molecule sieve. The textural data of these samples are listed in Table 1. It can be found that the BET specific surface area of SBA-15 is as high as 496 m2/g, while the mean pore diameter is 10.07 nm. In addition, the BJH pore distribution curves are shown in Supplementary Figure S1. It can be seen that all of those pores are located in the mesopore range of a 6~12 nm diameter. To give the active components (nanospheres) a chance to arrive inside the support, CeO2 nanospheres with diameters of 5~9 nm were synthesized.

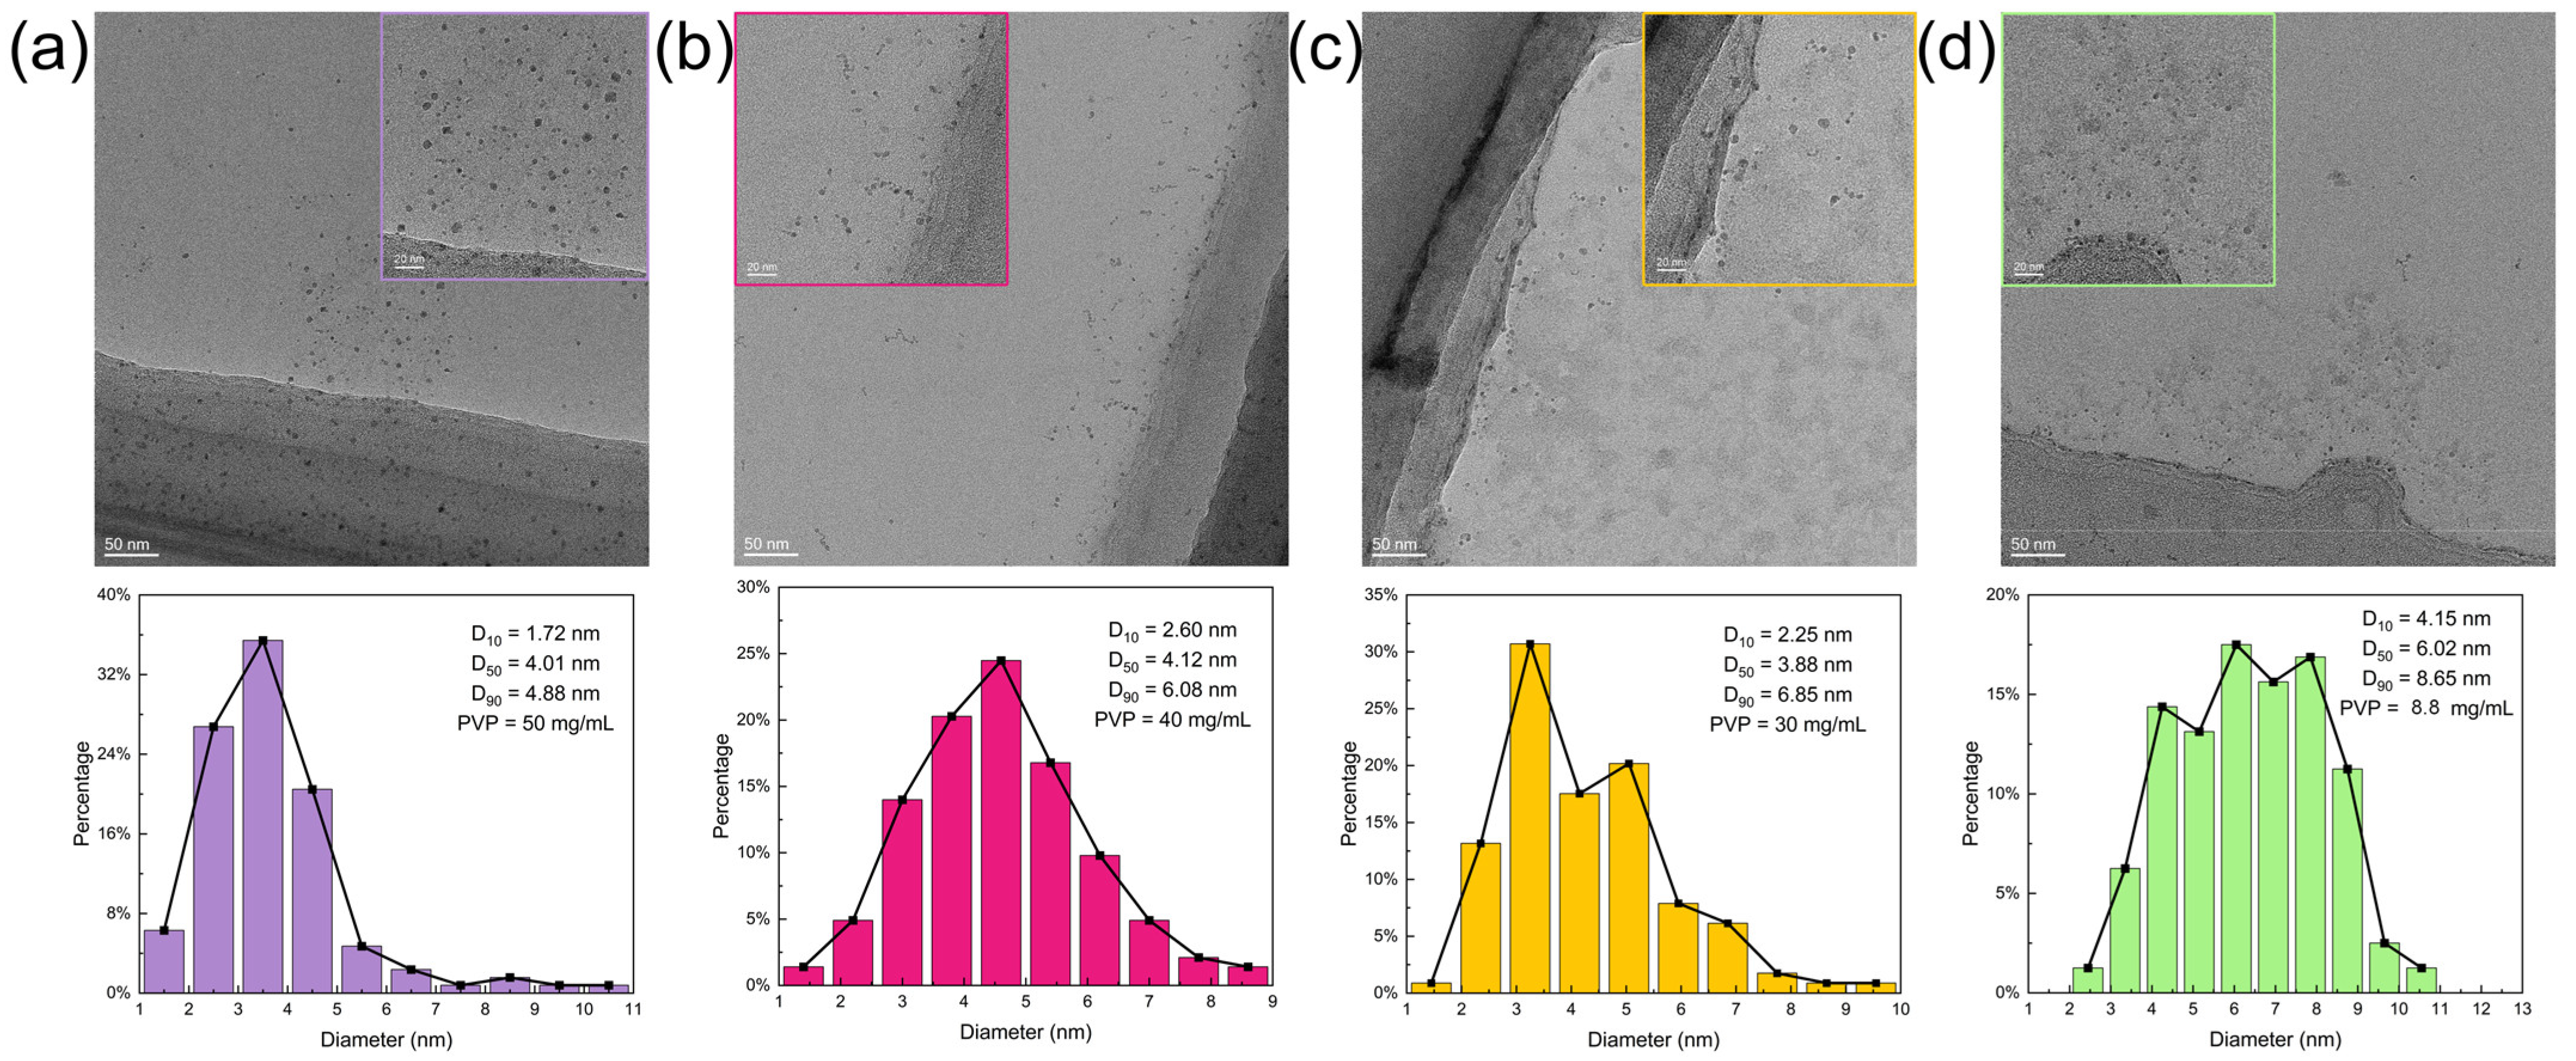
2.2. Particle Size Control of Nanospheres

Polyvinylpyrrolidone (PVP), a surfactant, has been found to play a crucial role in the oriented aggregation process of CeO2 nanoparticles [18,19]. Zhang et al. observed that the size of CeO2 nanocrystals initially decreased and then increased with an increase in the amount of PVP added [20]. When the concentration of PVP was low, it attached itself to the surface of CeO2 seed crystals, inhibiting the growth of active crystal planes. However, as more PVP was added, the inhibition became more pronounced, leading to a decrease in particle size. The particle size of CeO2 nanospheres could be precisely controlled by adjusting the amount of PVP added in 40 mL of ethanol. Microscopic observation of these nanospheres was performed using TEM, and the particle size was measured using the ImagePro6.0 software. The results are presented in Figure 1, where four different PVP addition amounts were used to control the particle size of nanospheres within the range of 5~9 nm. It is also evident that the more PVP is added, the smaller the particle size of the nanospheres that can be synthesized. Furthermore, the laser particle size analyzer data for the different particle sizes of CeO2 nanospheres are presented in Figure S2 and Table S1.

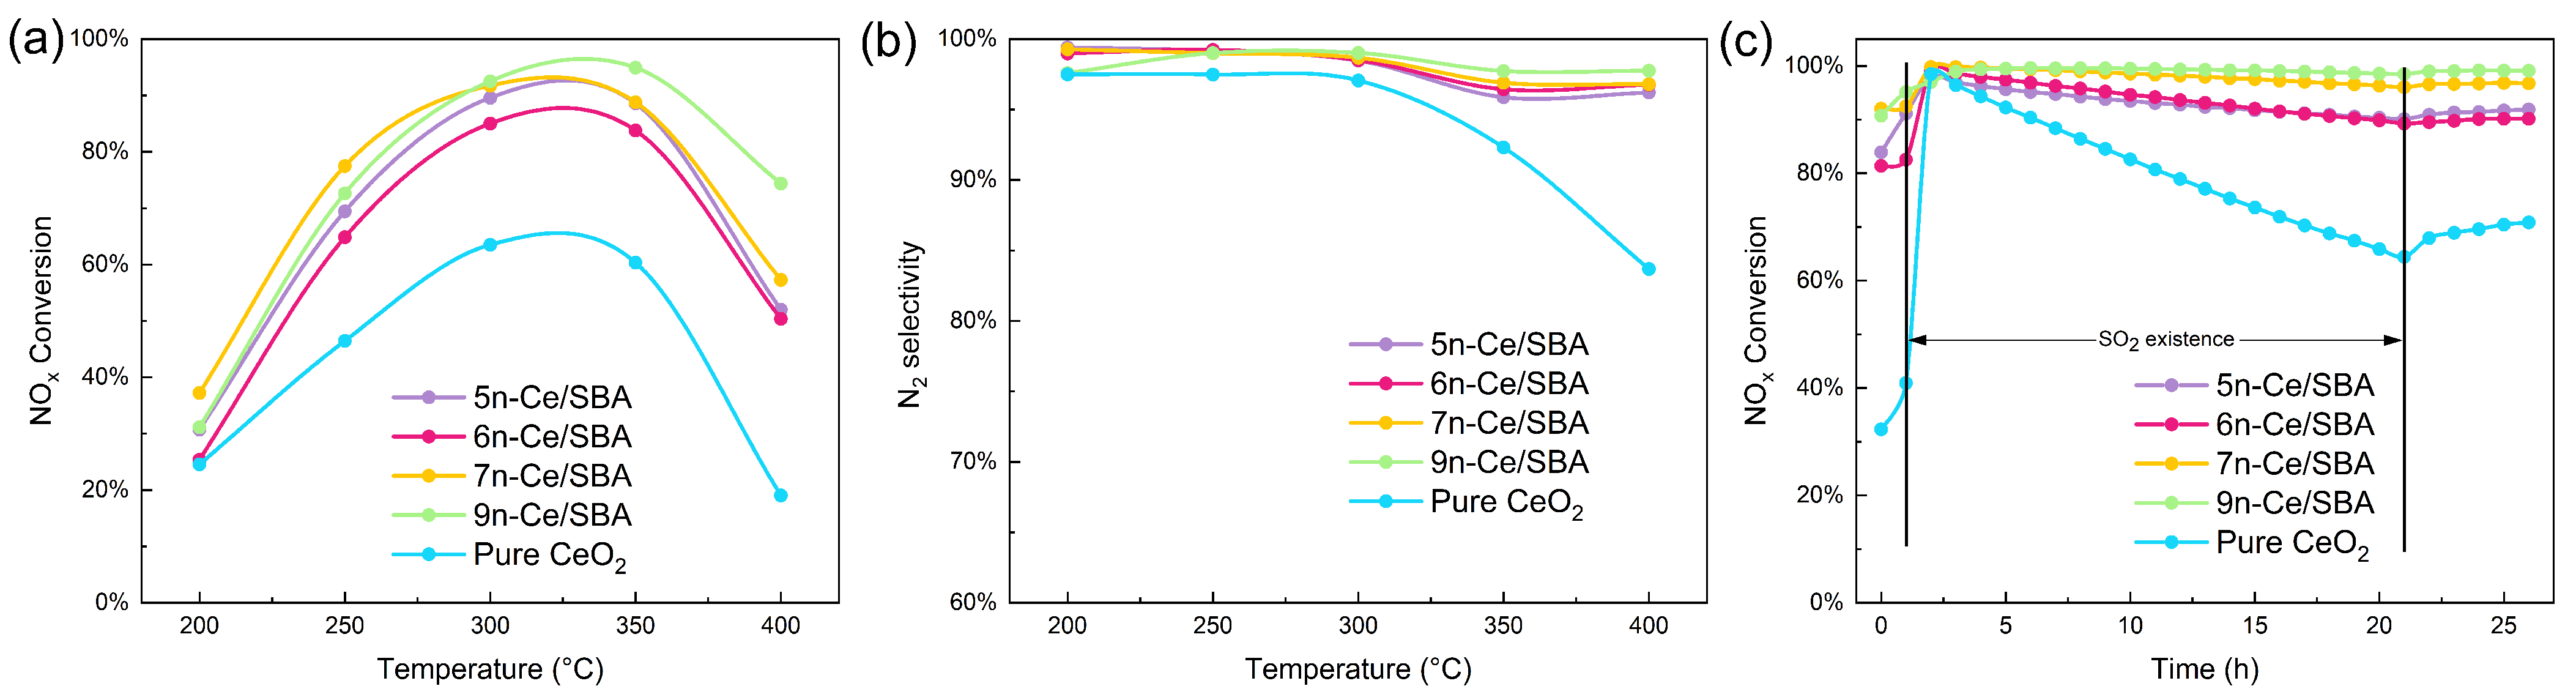
2.3. NH3-SCR Performance and SO2 Resistance of the Catalyst

According to the selected four different particle sizes, we selected the particle size in the middle for the preparation of catalysts with different loading percentages. Nanospheres 7 nm in diameter were used as an ingredient to prepare five catalysts with loading percentages of 5%, 15%, 25%, 35%, and 45%. After the catalytic activity test, the data are plotted in Figure S3. It can be clearly seen from Figure S3a that the 7n-Ce/SBA had the best NH3-SCR performance, converting 92% of NOx at a temperature of 300 °C, which was the highest NOx conversion of these catalysts. Compared to 7n-Ce/SBA, 7n-Ce/SBA(45%) showed the same catalytic performance before 300 °C, while, with the temperature increasing, its NOx conversion dropped quickly. The NOx conversion of other catalysts including pure CeO2 did not exceed 80% at 300 °C. Furthermore, except for 7n-Ce/SBA(25%) and 7n-Ce/SBA(5%), which had the best activity temperature of 350 °C, the temperature of the best SCR performance for the rest of the catalysts was 300 °C. In addition to this, the performance of pure 7n-Ce/SBA(5%) was worse than that of the 7 nm CeO2 nanospheres, because of the fewer activity sites. Moreover, Figure S3b shows that N2 selectivity was almost the same for these samples, except for 7n-Ce/SBA(15%). Their N2 selectivity decreased from 98% to 95% with the increase in temperature. However, 7n-Ce/SBA(15%) showed a trend of dropping first and then rising. The NOx purification performance of the nanospheres with a bigger size was also investigated. Figure S3c depicts CeO2 nanospheres with a D90 of 32 nm, which were obtained by adjusting the amount of PVP added. The resulting catalyst was designated as 30n-Ce/SBA. The NOx conversion curve of this catalyst is plotted in Figure S3d. As can be observed from the figure, 30n-Ce/SBA exhibits an enhanced stability compared to 5n-Ce/SBA, and its activity remains relatively stable even after the introduction of SO2. However, the denitrification performance of the catalyst deteriorates significantly in the absence of SO2. Therefore, it can be concluded that larger particle sizes are more favorable. Consequently, the size range of the nanospheres studied in this work is justified.
After determining the optimal loading percentage of these catalysts, the CeO2 nanospheres with 5, 6, 7, and 9 nm diameters were loaded on SBA-15. These samples were tested for SCR performance, and the results are shown in Figure 2a. As can be seen from the data in Figure 2a, 9n-Ce/SBA, which converted 90% of NOx at 300 °C, had the best catalytic performance. 7n-Ce/SBA had a better activity than 9n-Ce/SBA below 300 °C, and it purified 80% of NOx at 250 °C. Moreover, the catalytic activity of 5n-Ce/SBA was significantly higher than that of 6n-Ce/SBA, the worst one out of these catalysts. As described in Figure 2b, the N2 selectivities of these catalysts were very close to one another and were all above 90%, except for the pure CeO2. The N2 selectivity of 9n-Ce/SBA was the lowest below 250 °C, while it became the highest when the temperature of the reactor reached more than 300 °C, as indicated by the green line in Figure 2b.
Figure 2c shows the NOx conversion data of CeO2/SBA-15 catalysts with different particle sizes when 100 ppm SO2 was added to the gas. All the catalysts stabilized at 300 °C for 1 h without SO2. When the SO2 gas was introduced into the reactor, the activity of the CeO2 catalysts improved quickly in 1 h because of the beneficial effects of a small amount of sulfate, which had no effect on SCR but increased the surface acidity of CeO2 [21,22]. The existence of Ce2(SO4)3 enhanced the adsorption ability of CeO2 to NH3, promoting NH3-SCR performance. However, as the amount of sulfate increased, the activity of all the catalysts showed a decreasing trend 1.5 h after the introduction of SO2. When SO2 was continuously introduced, NH3, O2, and SO2 formed sulfate that attached to the surface of the catalysts and covered the active sites. 9n-Ce/SBA, which converted 99.5% of NOx with the presence of SO2, had the best SO2 tolerance. Its activity hardly decayed during the entirety of the 26 h test. And the NOx conversion of 7n-Ce/SBA decreased from 100% to 95% during the 20 h of SO2 presence, which was significantly higher than those of 6n-Ce/SBA and 5n-Ce/SBA. One unanticipated finding was that the activity of 6n-Ce/SBA was higher than that of 5n-Ce/SBA in the first 15 h, while it dropped rapidly, meaning that 5n-Ce/SBA had the better performance of the two when the test ended.
After turning off the SO2 switch, the NOx conversion of all the catalysts was recovered but was still lower than the catalytic efficiency measured when SO2 was first introduced. This finding was understandable because Ce2(SO4)3 was no longer formed, while AS and ABS could slowly decompose at 300 °C [23,24]. Moreover, it is evident from Figure 2a,c that the order of catalytic activity in the presence of SO2 was consistent with the order of catalytic activity without SO2. 9n-Ce/SBA always maintained a leading position. These results suggested that both Ce2(SO4)3 and ammonia sulfide were the causes of catalyst deactivation.

2.4. Material Structure and Morphology

2.4.1. Phase Analysis (XRD and FT-IR)

X-ray diffraction is one of the most commonly used phase analysis methods. It can determine the crystal structure of CeO2. The corresponding results are given in Figure 3a. According to JCPDS #34-0394, a series of diffraction peaks at 2θ = 28.55°, 33.08°, 47.48°, 56.33°, 59.09°, 69.40°, 76.70°, and 79.07° were ascribed to different crystal planes of cubic fluorite-type CeO2. The characteristic intensity diffraction peaks of (1 1 1) and (2 2 0) gradually decreased with the increase in particle size. The reason may be that the catalysts with smaller particle sizes exposed a higher density of crystal planes, which led to an increase in the diffraction intensity.
Moreover, the Ce/SBA catalysts before SO2 poisoning were characterized by FT-IR. The absorption spectrum of these catalysts is plotted in Figure 3b. The absorption peak from 1100 to 1000 cm−1 is the stretching vibration of the Si-O bond [25]. Since SBA-15 makes up the majority of the catalyst, the intensity of these peaks does not change with the increase in particle size. And, the SO2-poisoned catalysts were also tested by FT-IR, the results of which are shown in Figure 3c. The spectrum of pure CeO2-S exhibits a prominent absorption peak at the position of 1100 cm−1, indicating the presence of a considerable amount of sulfate on the catalyst [26]. Conversely, the IR peaks of the Ce/SBA series of catalysts remain unchanged, suggesting that the sulfate produced on these catalysts is too minute to be detected by IR spectroscopy, which is consistent with their SO2 resistance capabilities.

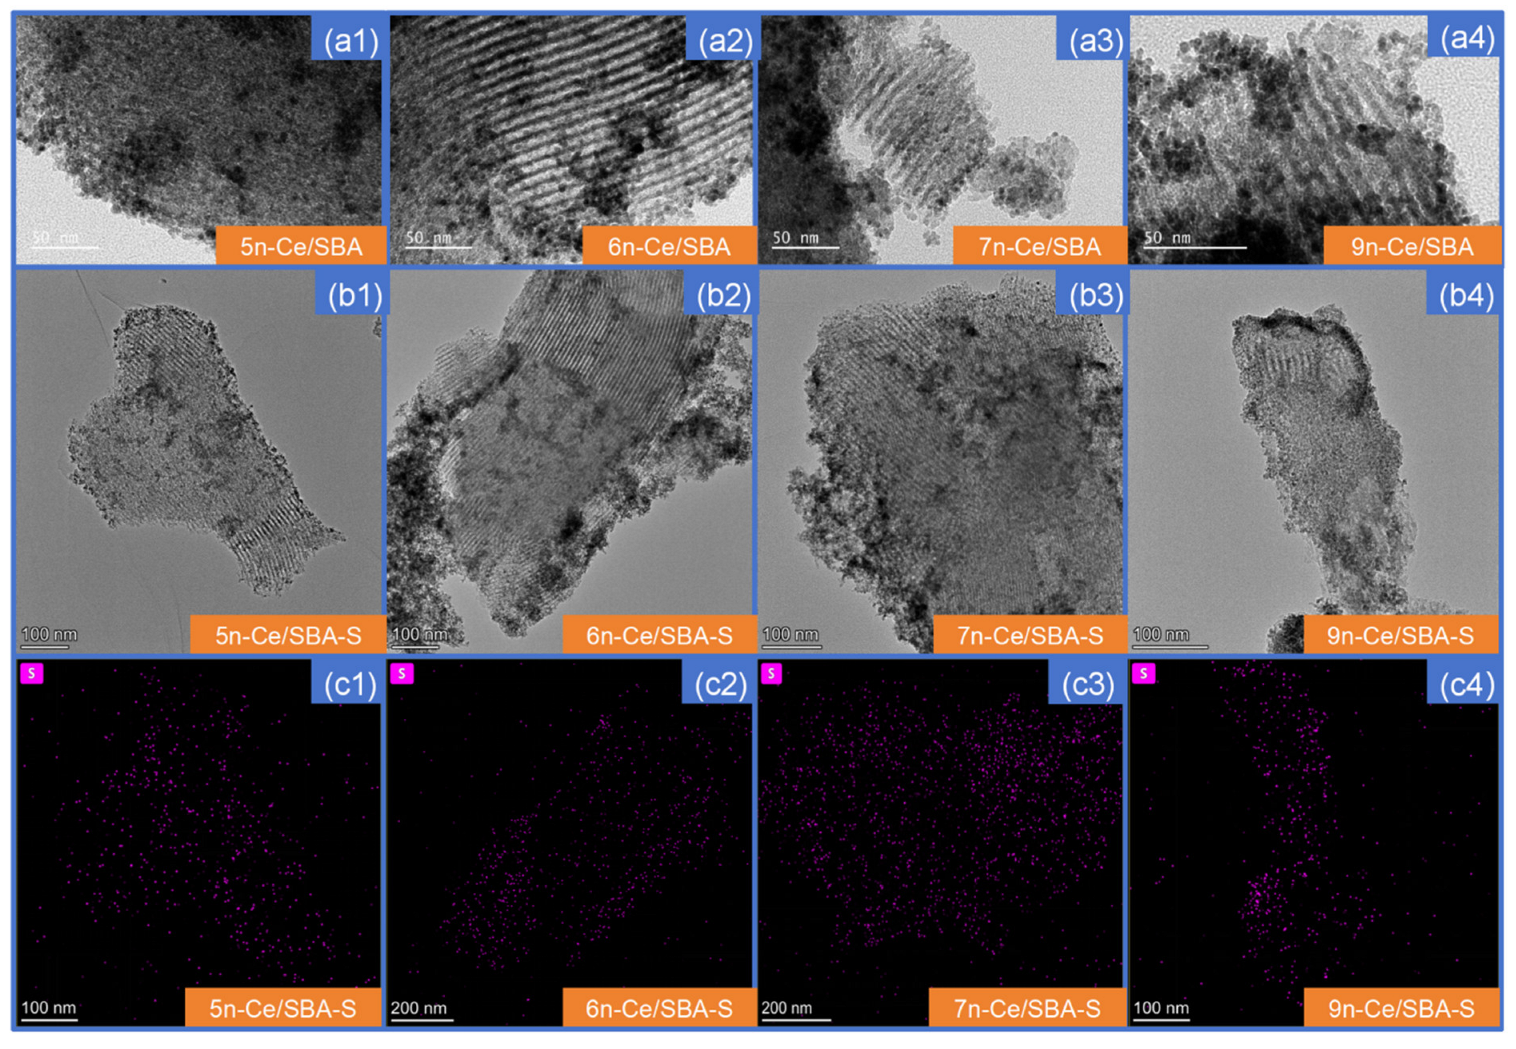
2.4.2. Morphology of Catalysts (TEM)

TEM is a common method of observing the morphology of materials. TEM photos of the four catalysts and of the EDS distribution of the S element are shown in Figure 4. The figure reveals that the nanospheres were aggregated on all four catalysts, which corresponded to 35% of their loading capacity. Additionally, a comparison between Figure 4a,b reveals that, after being contaminated with sulfur, the catalysts maintained their morphology as nanospheres and nanosheets. Due to the aggregation of nanospheres, it is challenging to distinguish between the dark region in the images and whether it is a nanosphere or sulfate. Consequently, we photographed the EDS spectrum of the catalyst, which is presented in Figure S4. Furthermore, the distribution of the S elements is plotted in Figure 4c. By examining both Figure S4 and Figure 4c, the distribution of sulfur elements can be observed on all four catalysts. When analyzed in conjunction with the high-angle annular dark field (HAADF) photo, it becomes evident that there are more S elements present in the white bright spots (areas where the CeO2 nanospheres congregate) in the figure. This suggests that S elements preferentially react with CeO2 to form cerium sulfate.

2.5. Chemisorption Test

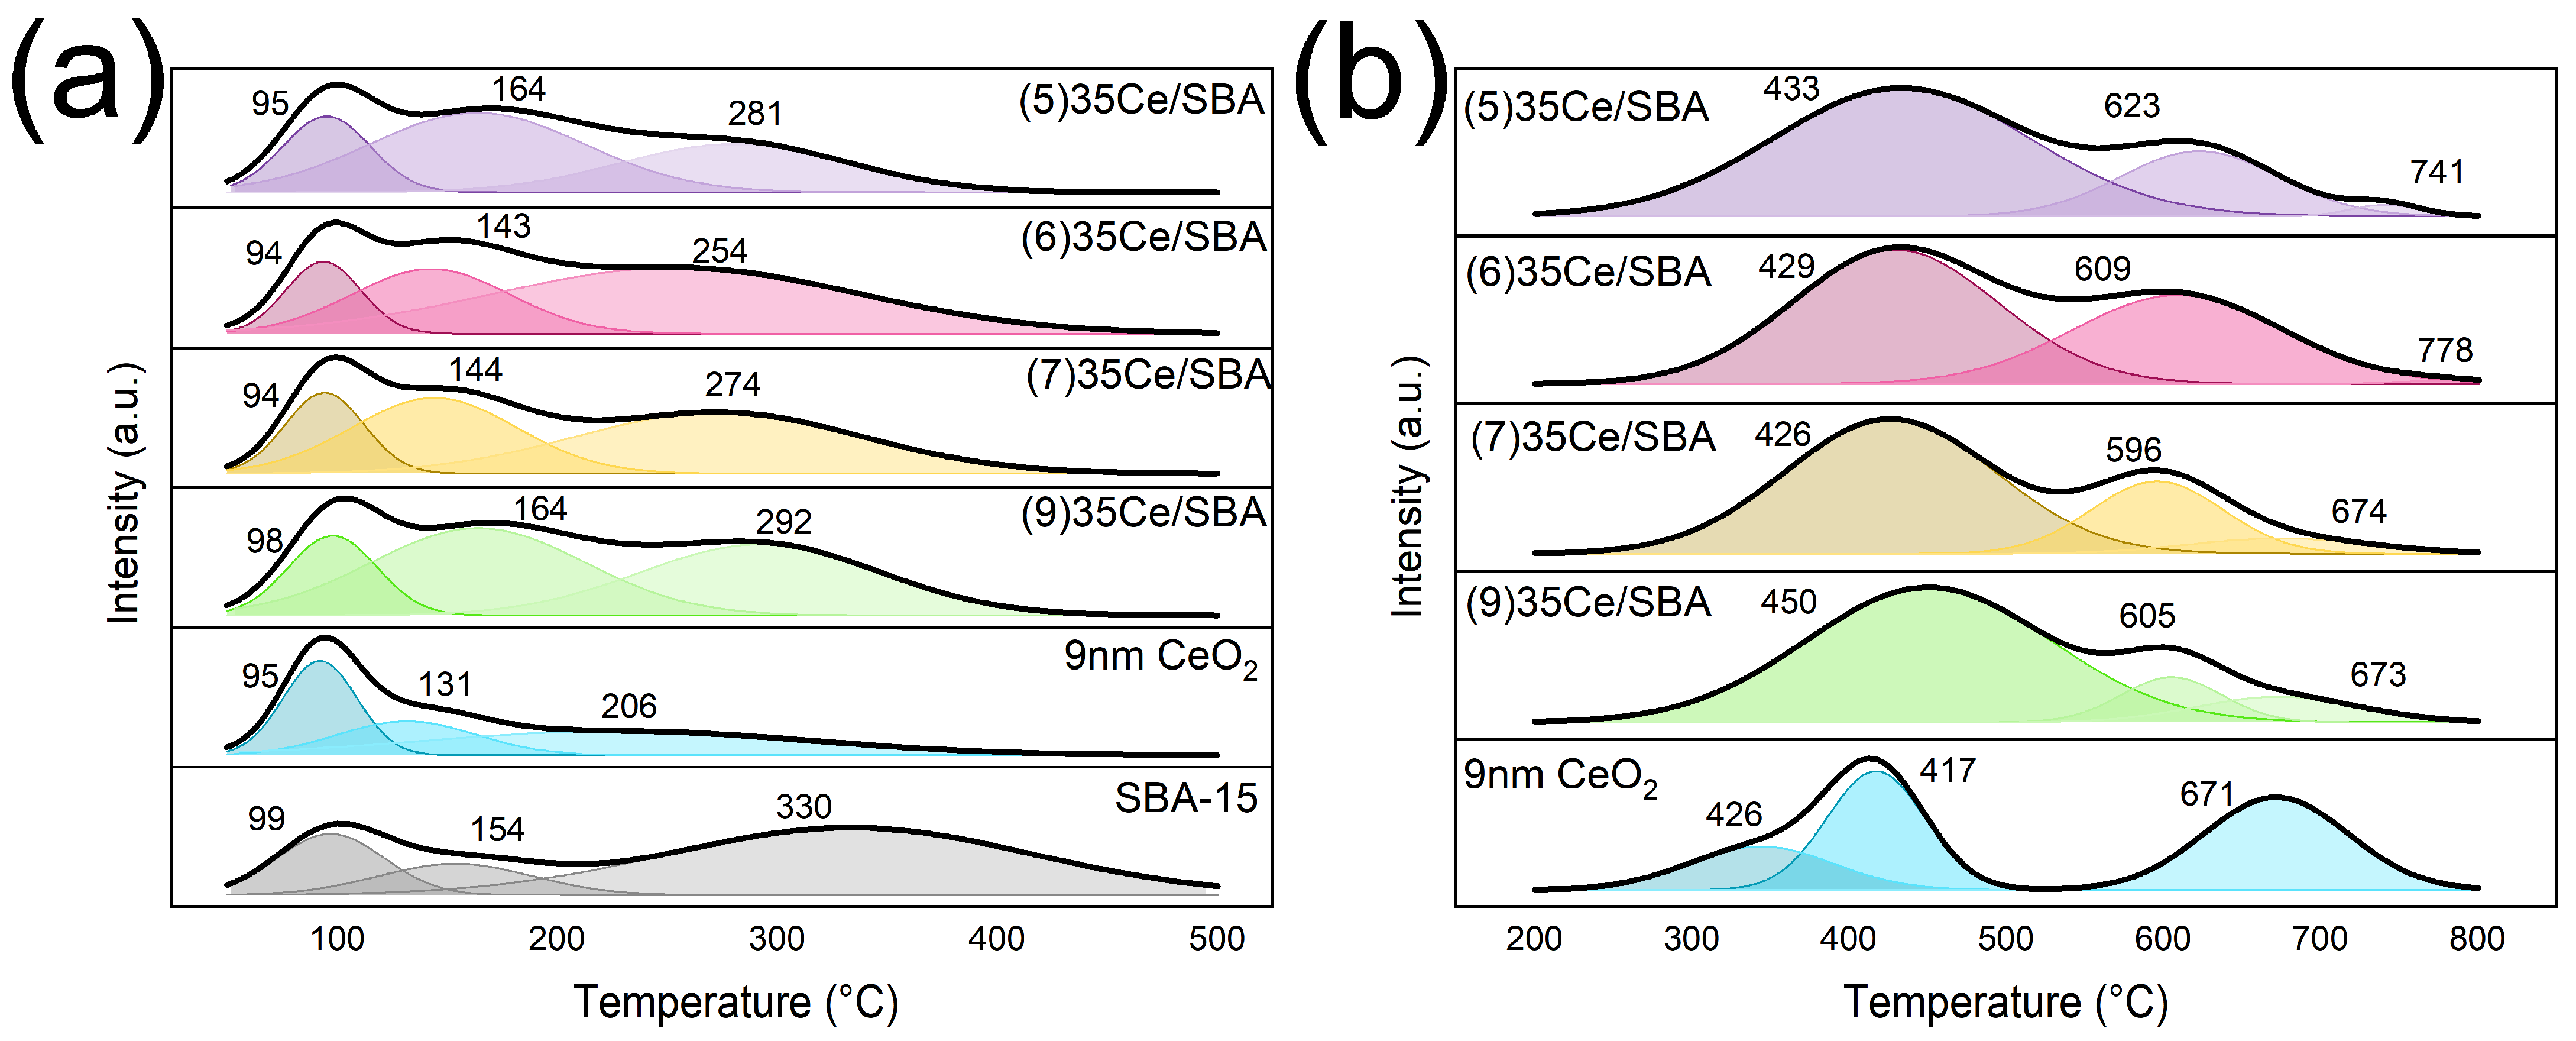
2.5.1. Acid Site Distribution and Intensity (NH3-TPD)

NH3-TPD is a common means of characterizing catalyst surface acidity. It can detect the strength and number of acid sites on the catalyst’s surface. In Figure 5a, all the desorption curves of CeO2/SBA-15 catalyst, pure CeO2, and SBA-15 can be observed in a temperature range of 50 to 500 °C. The detector also recorded the amount of NH3 leaving the catalyst surface during the desorption process, and these data are presented in Table S2. The first peak located around 100 °C is related to the physically adsorbed NH3 [27]. And, the other two peaks represent the NH4+ adsorbed by Bronsted acid (around 150 °C) and the coordinated NH3 bound to the Lewis acid sites (around 280 °C) [28]. According to the total NH3 consumption, it can be found that the minimum NH3 consumption of the supported Ce/SBA catalyst is 0.242 mmol/g, which is close to that of pure CeO2 (0.241 mmol/g) and SBA-15 (0.240 mmol/g). The acidity of the 9 nm CeO2 nanospheres, SBA-15, and 5n-Ce/SBA can be considered equivalent. However, the 9n-Ce/SBA catalyst, which comprises 35% 9 nm CeO2 nanospheres and 65% SBA-15 molecular sieve (mass ratio), exhibits a higher acidity (0.315 mmol/g) than the sum of the 9 nm CeO2 nanospheres and SBA-15 with the same weight. This result combined with the difference in the peak 2 area in Table S2 suggests an interaction between the 9 nm CeO2 nanospheres and SBA-15. This interaction increases the number of Bronsted sites on the catalyst and enhances its adsorption capacity for NH3. More importantly, the peak area, indicating the number of acidic sites, is significantly correlated with NH3-SCR performance. The peak areas at temperatures of about 150 °C and 300 °C for the four curves increase sequentially from top to bottom, and they are all larger than that of pure CeO2, which is consistent with the ranking of catalytic activity with the presence of SO2. This can explain why 9n-Ce/SBA can have the highest NH3-SCR performance and pure CeO2 the lowest one. And it can also be inferred that, since SO2 is an acidic gas, it tends to be adsorbed onto less acidic substances. Therefore, the more acidic the catalyst, the less likely it is to adsorb SO2. The data from the NH3-TPD analysis suggest that the 9n-Ce/SBA catalyst may exhibit excellent SO2 resistance due to its low adsorption rate of SO2, resulting in reduced sulfate production after SO2 adsorption at the active site. This reduction in the sulfate formation rate helps to minimize the amount of poisoning at the active site, contributing to the excellent sulfur resistance of the catalysts.

2.5.2. Redox Site Distribution and Intensity (H2-TPR)

The oxidation process is an important part of the SCR mechanism. In the process of SCR, there must be oxidation and reduction of substances. The oxidation performance of a catalyst is closely related to its catalytic activity. H2-TPR can be used to characterize the oxidative capacity of CeO2/SBA-15 catalysts, and the results are shown in Figure 5b. The consumption of H2 is counted in Table S3. SBA-15 cannot be reduced by H2 within 800 °C, indicating that the reduction peak in Figure 5b is solely attributed to CeO2. For pure CeO2, its H2-TPR curve exhibits three peaks, namely, surface-adsorbed oxygen, surface Ce4+, and volume-phase Ce4+ from a low temperature to a high temperature [29]. These peaks are consistent with those of the pure 9 nm CeO2 in Figure 5b. Furthermore, the graph provides some information on the fact that the addition of SBA-15 makes the three reduction peaks move to a high temperature, indicating an increase in the strength of the oxidative sites because of the mutual effect between SBA-15 and the nanospheres. And, due to the high dispersion of the CeO2 nanospheres on the surface and in the poles of the SBA-15, the width of the first peak increases. Moreover, the reduction peak of adsorbed oxygen for the 9n-Ce/SBA catalyst is at 450 °C, which is significantly higher than that of the other catalysts. This suggests that the oxidation capacity of this catalyst is weaker compared to the other catalysts. This trend indicates that a smaller particle size of the nanospheres has a stronger oxidation activity, which can both improve the SCR performance and the probability of side reactions such as SO2 oxidation, causing catalysts’ poisoning. The data from the NH3-TPD analysis and the observation of the reduction peak of adsorbed oxygen for the 9n-Ce/SBA catalyst in Figure 4 lead us to the conclusion that this catalyst exhibits exceptional SO2 resistance. The reason behind this is that SO2 is not easily adsorbed onto the surface of the catalyst, as evidenced by the stronger NH3 desorption intensity. Additionally, after being adsorbed, SO2 is not easily oxidized by surface-active oxygen, resulting in the lowest generation of sulfates on this catalyst. This phenomenon leads to a minimal amount of poisoning at the active site, contributing to the superior SO2 resistance of the 9n-Ce/SBA catalyst.

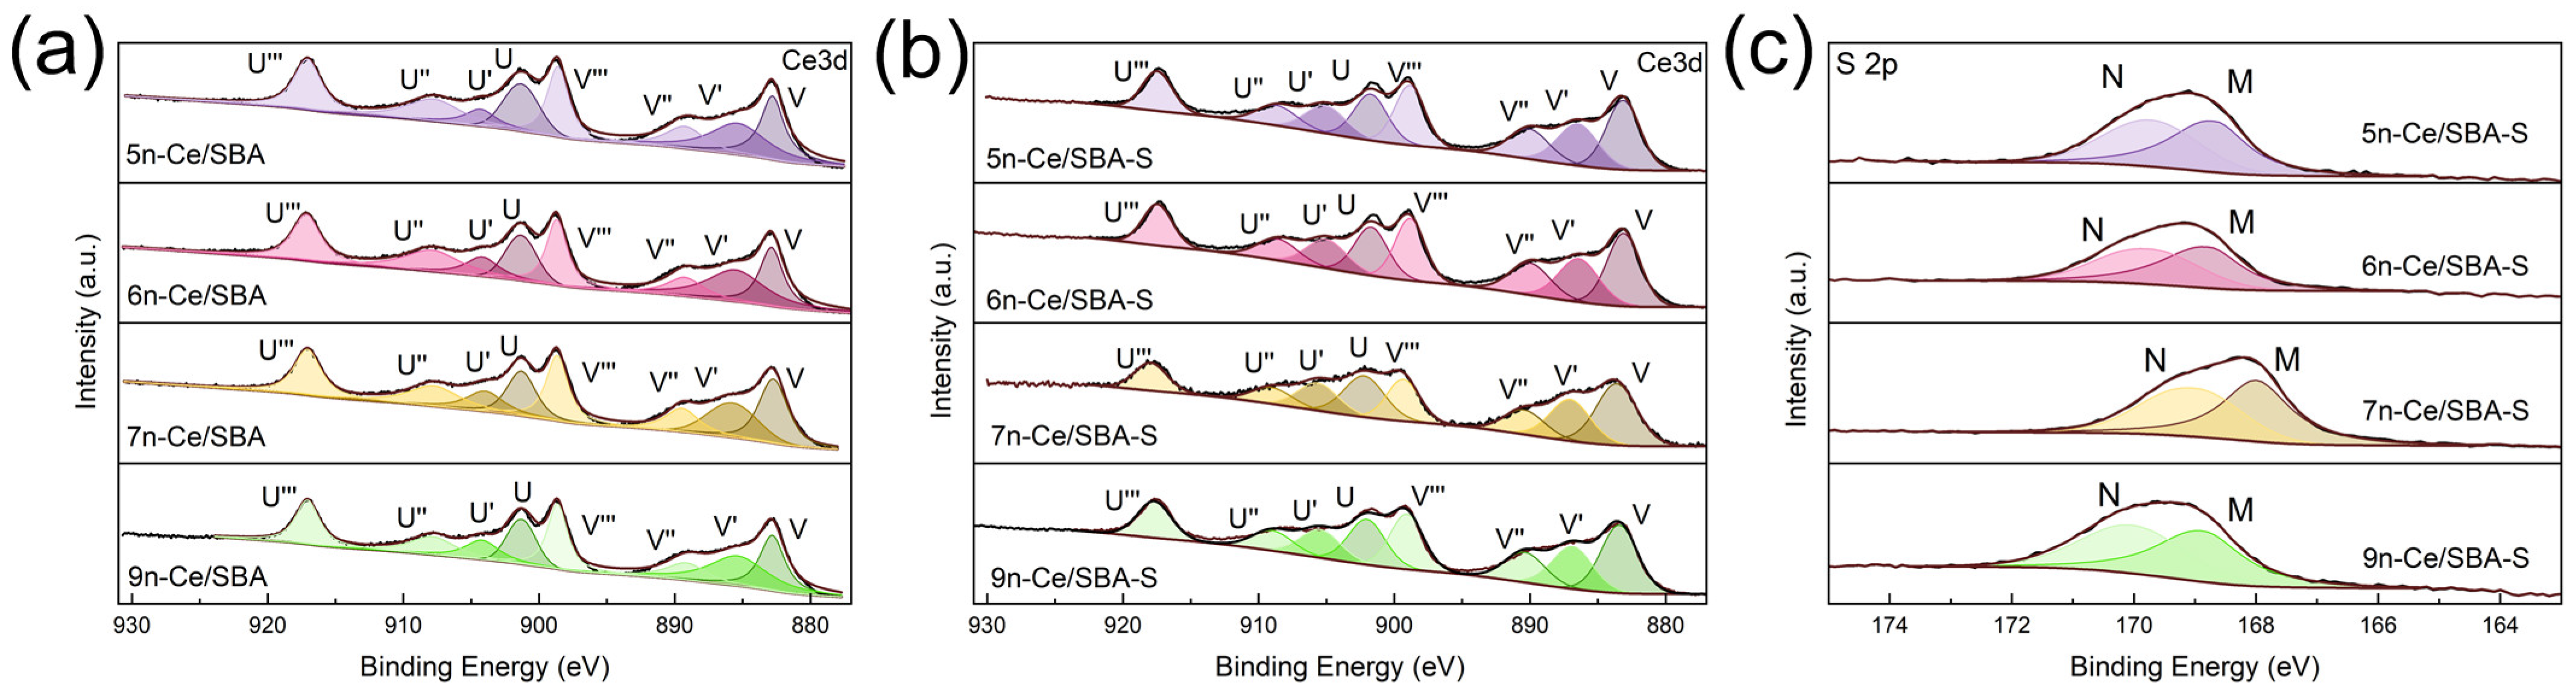
2.6. Valence Testing of Surface Atoms (XPS)

X-ray photoelectron spectroscopy (XPS) is a surface analysis technique that can characterize the atomic species on the surface of a material and the valence state of an ion through the electronic states. In this work, XPS was used to study the chemical state and surface properties of CeO2/SBA-15 catalysts. The XPS spectra of Ce 3d of the Ce/SBA catalysts before SO2 poisoning is presented in Figure 6a, and it can be seen that there are eight peaks of the Ce 3d orbital. The letters U and V stand for the orbitals after splitting, named 3d3/2 and 3d5/2, located at 902.5 eV and 882.5 eV, respectively. The characteristic peaks labeled as V′ (885.6 eV) and U′ (904.2 eV) represent the initial electronic state of the 3d104f1 of the Ce3+ ion, while the other six peaks marked as U, U′′, U′′′, V, V′′, and V′′′ are the characteristic peaks of Ce4+ with the electronic state of 3d104f0 [9,29]. The results of the XPS demonstrate that both Ce4+ and Ce3+ exist in these CeO2/SBA-15 catalysts. The presence of Ce3+ on the catalyst can disrupt charge balance and cause oxygen vacancies, which facilitates the adsorption of oxygen in the gas on the surface, thereby improving the efficiency of the oxidation process in the NH3-SCR reaction [30]. Moreover, Table 2 gives the content of Ce3+ and the Ce3+/Ce4+ ratio on the surface of these catalysts. The relative Ce3+ content of the xn-Ce/SBA (x = 5, 6, 7, and 9) catalysts is 22.80%, 26.00%, 21.43%, and 27.70%, respectively. It can be found that 9n-Ce/SBA has the most Ce3+ content, but this value is not much higher than that of the other samples. Therefore, the content of Ce3+ on the surface is not a decisive factor for the resistance to SO2. This can also be seen from the XPS spectra of the sulfurized catalyst, as shown in Figure 6b. After SO2 treatment, the proportion of Ce3+ on the catalyst has no significant change compared to that before poisoning and is maintained at about 25%. For example, for the 9n-Ce/SBA with the best NH3-SCR performance, the Ce3+ before poisoning was 27.70%, but, after poisoning, the Ce3+ was slightly reduced to 23.57%, indicating that SO2 poisoning ultimately did not affect the valence state of Ce.
In Figure 6b and Table S4, the location of the main Ce 3d peak (peak V) for each catalyst varies, and it shifts from 883.19 eV to 883.50 eV as the particle size increases. In contrast, the binding energy of peak V of the 30n-Ce/SBA catalyst is 882.99 eV, which is lower than the other catalysts. This observation indicates that CeO2 nanoparticles of different sizes interact with Si and S atoms on the catalyst surface. Table 2 shows the proportion of S atoms on the catalyst surface, and it can be observed that 9n-Ce/SBA has a mutual effect with Si. Because the S element in 9n-Ce/SBA accounts for 3.05% of it, the movement of its binding energy is higher than that of 7n-Ce/SBA, whose S element proportion is 5.63%. It is well known that SiO2 fundamentally does not react with SO2 and has strong structural and chemical stability. Therefore, 9n-Ce/SBA can reduce the probability of a reaction with SO2 by virtue of this close effect and, thus, show excellent SO2 resistance.

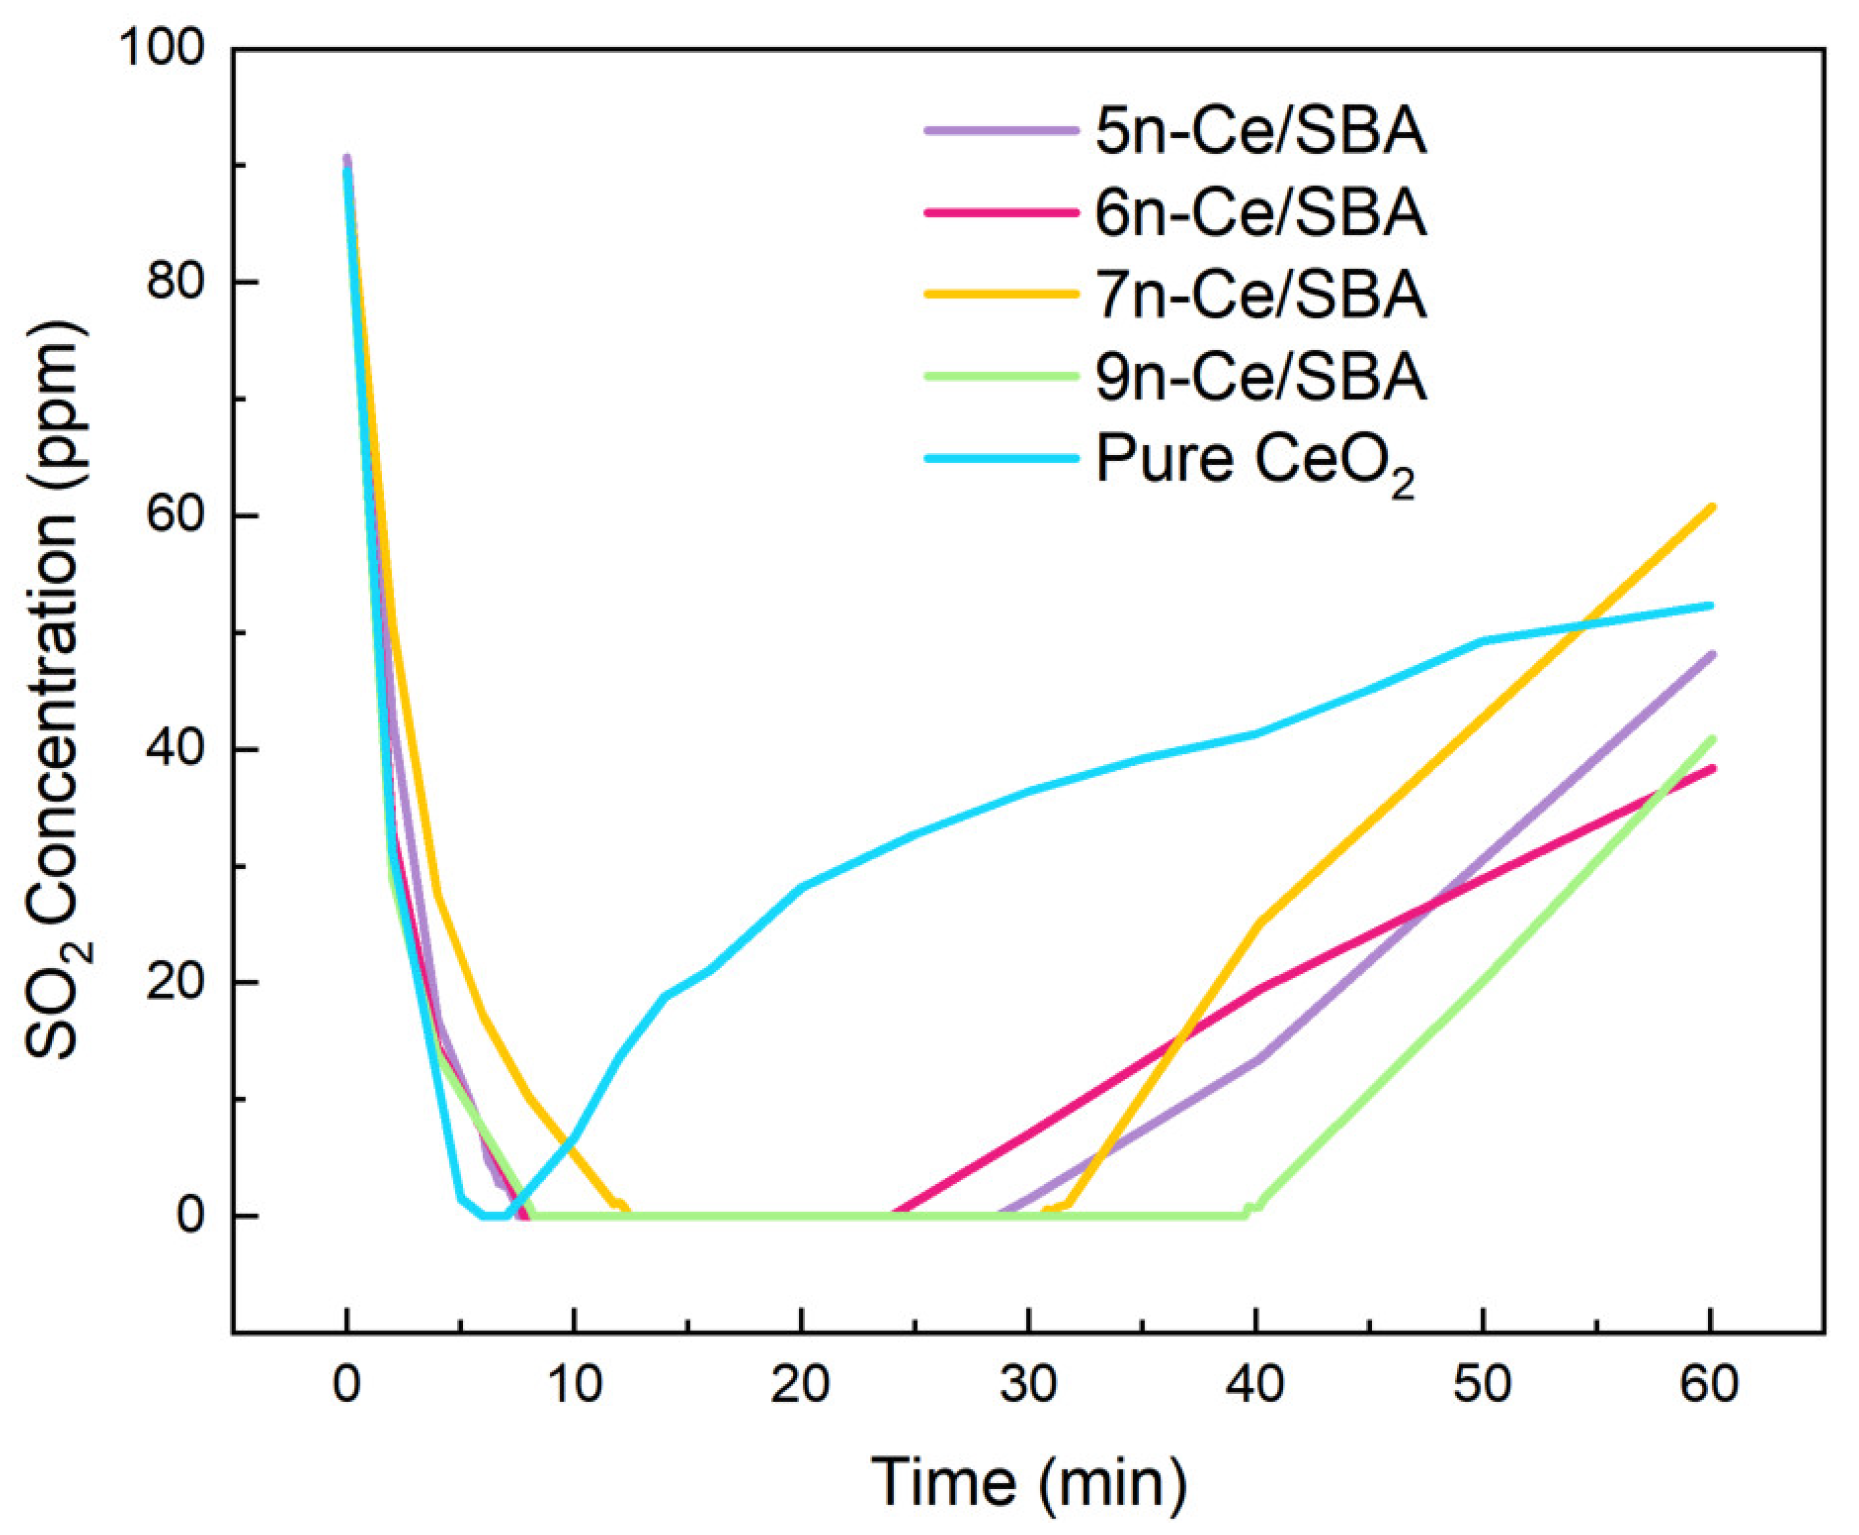
2.7. Sulfation Rate Test of Active Components

In the sections above, several characterization methods such as NH3-TPD, H2-TPR, and XPS were employed to demonstrate that 9n-Ce/SBA has the highest acidity and exhibits weak adsorption and reduction by SO2. To further substantiate this claim, SO2 and O2 were introduced into the reactor to examine the rate at which the active component was cured, as shown in Figure 7. From the figure, it can be seen that 5n-Ce/SBA, 6n-Ce/SBA, and 9n-Ce/SBA quickly adsorb all the SO2 gas. But 9n-Ce/SBA maintains a 100% conversion of SO2 for the longest time out of all the catalysts, i.e., about 30 min. The other three samples keep a 100% conversion for 20 min, while 7n-Ce/SBA takes more time to adsorb all of the SO2, which shows a weaker oxidation ability than 5n-Ce/SBA and 6n-Ce/SBA. Table S5 presents the BET specific surface area of the catalysts, and it can be observed that all four catalysts have similar specific surface areas of about 350 m2/g. Therefore, the endurance time under the SO2 atmosphere is not significantly affected by the specific surface area of a catalyst. From Figure 7, it can be inferred that the active component of 9n-Ce/SBA has the lowest sulfurization rate, and it accumulates less sulfate after being exposed to SO2 for the same duration (e.g., during the reaction of NH3-SCR containing SO2 for 20 h). This proves that 9n-Ce/SBA has the strongest SO2 resistance among the four catalysts. In conjunction with the TEM image presented in Figure 4, it is evident that certain nanospheres on the catalyst exhibit agglomeration. A correlation between the specific surface area analysis and nanosphere agglomeration reveals that the smaller specific surface areas of the catalyst result in a more pronounced agglomeration of nanospheres. Moreover, the nanospheres present on the catalysts’ surface, ready to combine with the SO2, forming cerium sulfate. Consequently, the 5n-Ce/SBA and 6n-Ce/SBA catalysts, characterized by smaller specific surface areas, exhibit inferior SO2 tolerance.

2.8. Reaction Kinetics

Catalytic reaction kinetics is a field of study that explores the relationship between the rate of a catalytic reaction and various process variables. The primary objective of this research is to gain a deeper understanding of the underlying mechanisms behind catalytic reactions, which can then be used to inform catalyst design. To achieve this goal, rate equations have been developed for the catalytic reaction of NO, NH3, and O2 with respect to the catalysts. These equations are aimed at identifying any specific mechanisms that may be involved in the reaction process. Table 3 presents data on the order of reaction and rate equations for several catalysts used in NH3-SCR reactions. Additionally, Figure S7 illustrates the relationship between reaction rate r and reactant concentration. Firstly, it can be observed that the catalysts exhibit a different reactivity towards NO. The reaction orders for 5n-Ce/SBA and 6n-Ce/SBA are slightly higher than 0.6, while the order of 7n-Ce/SBA is the highest, at 0.818. The reaction order of NO for 9n-Ce/SBA is 0.717. These values are all less than 1, suggesting that some NO does not adsorb into the catalysts, indicating the coexistence of L-H and E-R mechanisms in the catalysts. Secondly, the reaction order of the catalysts towards NH3 is very small, almost close to 0, indicating that, when the concentration of NH3 exceeds 400 ppm, the adsorption of NH3 by the catalysts is near saturation. Under optimal conditions, where the NH3/NO ratio is 1:1, there is no excess NH3, and it does not escape from the flue gas. Finally, the NOx conversion of the catalysts in the range of a 1~5% oxygen concentration is not significant, suggesting that, at an oxygen concentration above 1%, the catalysts form a large number of adsorbed oxygen and lattice oxygen, enhancing its surface oxidation capacity.

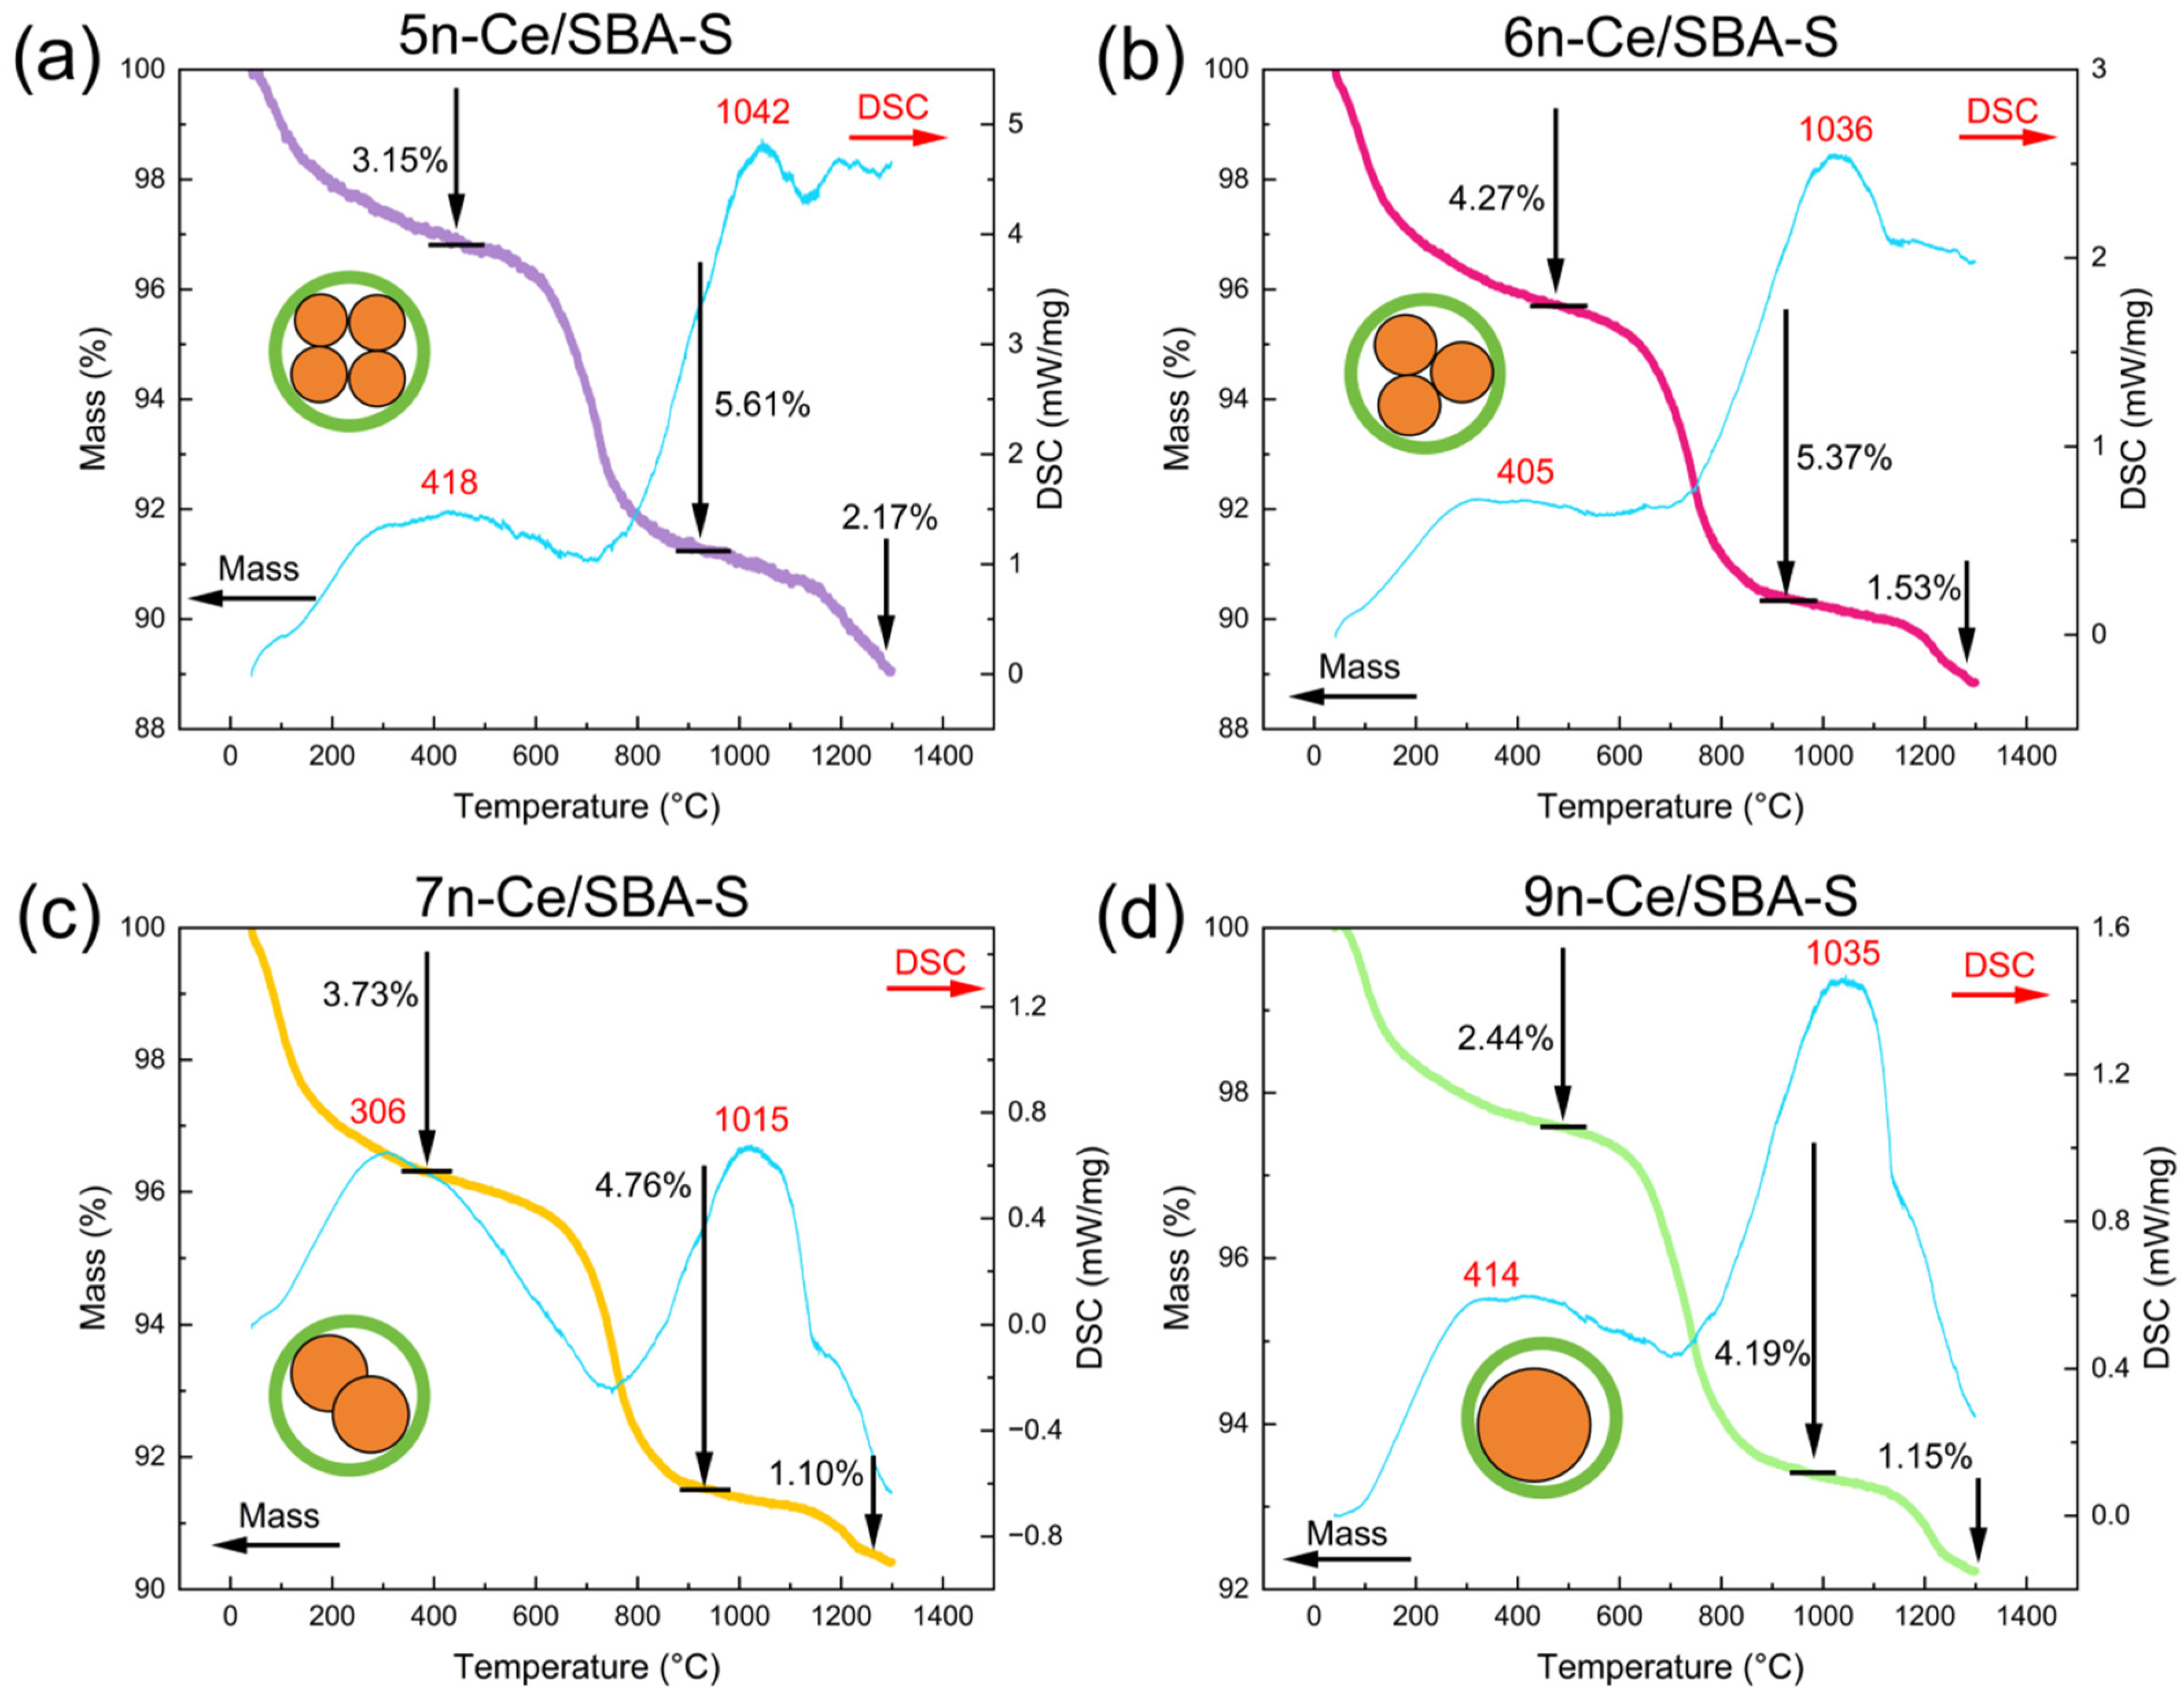
2.9. Thermal Decomposition of Sulfate (TGA)

The thermogravimetric analysis of Ce/SBA-S-series catalysts was conducted to determine the types and thermal decomposition temperatures of the sulfur-containing substance present on the catalysts. The TG and DSC curves are presented in Figure 8. After being reacted with in the presence of 500 ppm NO, 500 ppm NH3, and 100 ppm SO2 with 5 vol% O2 (balanced with N2) for 20 h at 300 °C, the TG curves of these catalysts exhibited two significant weight loss events at temperatures ranging from 306 to 418 °C and from 1015 to 1042 °C, accompanied by two exothermic peaks in the DSC curves. These first weight loss events corresponded to the decomposition of ABS and AS, while the second event corresponded to the pyrolysis of cerium sulfate, respectively. By comparing the mass ratio of ABS and AS, it can be observed that the ammonium (bi)sulfate on the 9n-Ce/SBA-S catalyst was the least present, at only 2.44%, while this substance’s proportion on the 6n-Ce/SBA-S catalyst with poor SO2 resistance was 4.27%. Similarly, by analyzing the mass ratio of cerium sulfate, it can be seen that the cerium sulfate deposited on the 9n-Ce/SBA-S catalyst was only 4.19%, while the cerium sulfate on the 6n-Ce/SBA-S catalyst was as high as 5.61%. These results indicate that the 9n-Ce/SBA-S catalyst accumulated the least amount of sulfate substances during the reaction, which is consistent with the results of the NH3-TPD, H2-TPR, and XPS tests and the sulfurization rate of the active components.

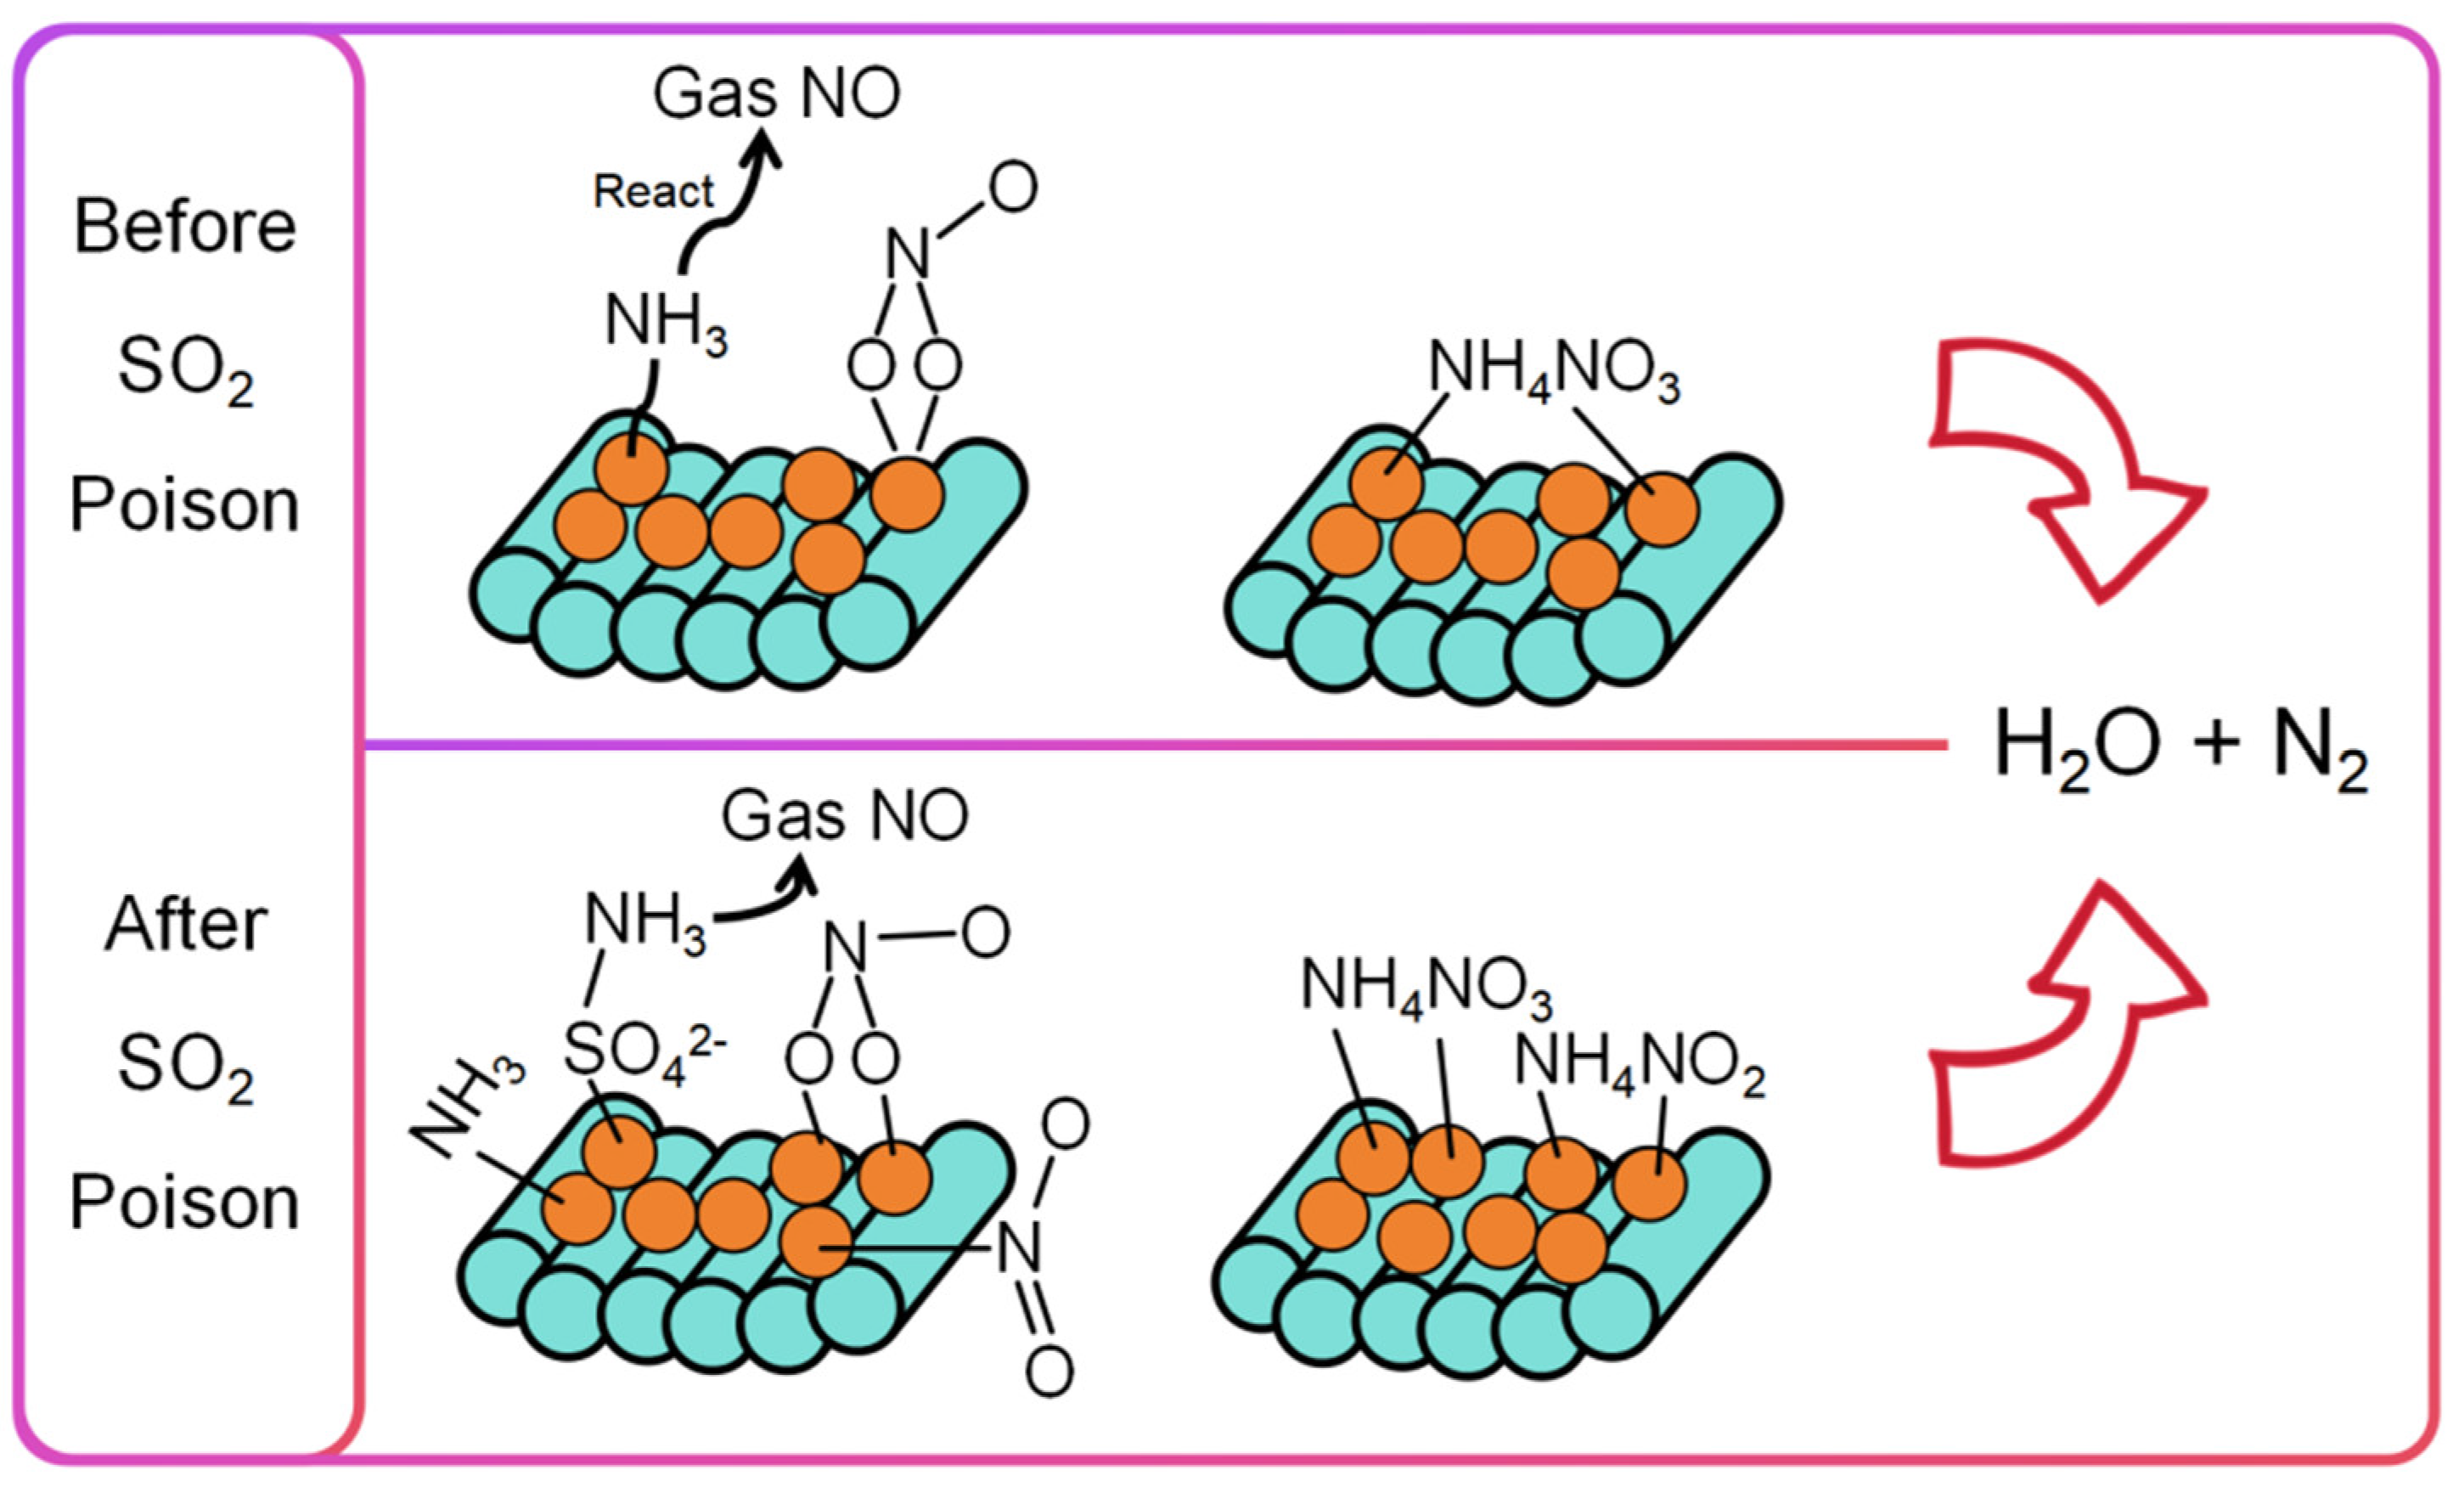
2.10. Reaction Mechanism

In situ DRIFT spectroscopy was used to investigate the active intermediates and mechanisms in the catalysts before and after SO2 poisoning. The adsorption of 9n-Ce/SBA and 9n-Ce/SBA-S on NH3 and NO as well as surface reactions were analyzed using this technique. The catalysts were tested for NH3 adsorption and NO adsorption at different temperatures to examine the species and strength of the acid sites on the catalysts’ surface, particularly the acidity enhanced by SO2, and the types of intermediates (nitrates) formed on the catalysts by NO and NO2. The IR spectra obtained from these tests are presented in Figures S8 and S9. Additionally, the reactions of NH3, NO, and O2 were also monitored by in situ DRIFTs, and the results are shown in Figure S10. The test conditions and the results’ analysis can be found in the Supplementary Materials.
Based on our previous research and the literature, we observed a peak at 3300 cm−1 that can be attributed to the stretching vibration of the N-H bonds of coordinated NH3 species. Additionally, the peaks from 1419 to 1439 cm−1 suggest the presence of Bronsted acid sites and NH4+ species on the catalysts’ surface [31,32]. Moreover, the lattice oxygen in the catalysts was active, leading to the appearance of IR peaks at 1338 and 1327 cm−1, which are attributed to oxidized NH3 species [33]. The orange lines in the figures represent the IR absorption peaks of the nitrate species. The peak located at 1535 (1539) cm−1 is assigned to monodentate nitrate, while the band at 1578 cm−1 represents bidentate nitrate. Furthermore, M-NO2 nitro compounds with their IR peak at 1315 (1304) cm−1 and NO2 with its asymmetry vibration IR peak at 1273 and 1277 cm−1 can also be identified in the figures. Additionally, the peaks at 1381 and 1385 cm−1 indicate that numerous NO3 free ions exist on the catalysts’ surface, suggesting that gas may undergo surface ionization or that ammonium nitrate may become molten.
The catalyst was pretreated at 400 °C with a flow rate of 40 mL/min in an argon atmosphere for 30 min. Subsequently, 500 ppm NH3-Ar was introduced into the sample cell, and the IR spectra were recorded for 15 min. To remove the physically adsorbed NH3, the sample cell was purged with Ar for 10 min. After that, 500 ppm NO-Ar and 5% O2 were introduced into the cell for 30 min, during which time the IR spectra were continuously recorded. The resulting IR spectra of the two catalysts are plotted in Figure 8a,b. Another fresh catalyst was fitted into the sample cell, and it was first introduced into NO-Ar and O2 for 15 min, followed by NH3-Ar for another 30 min. The resulting IR spectra of the two catalysts are plotted in Figure 8c,d.

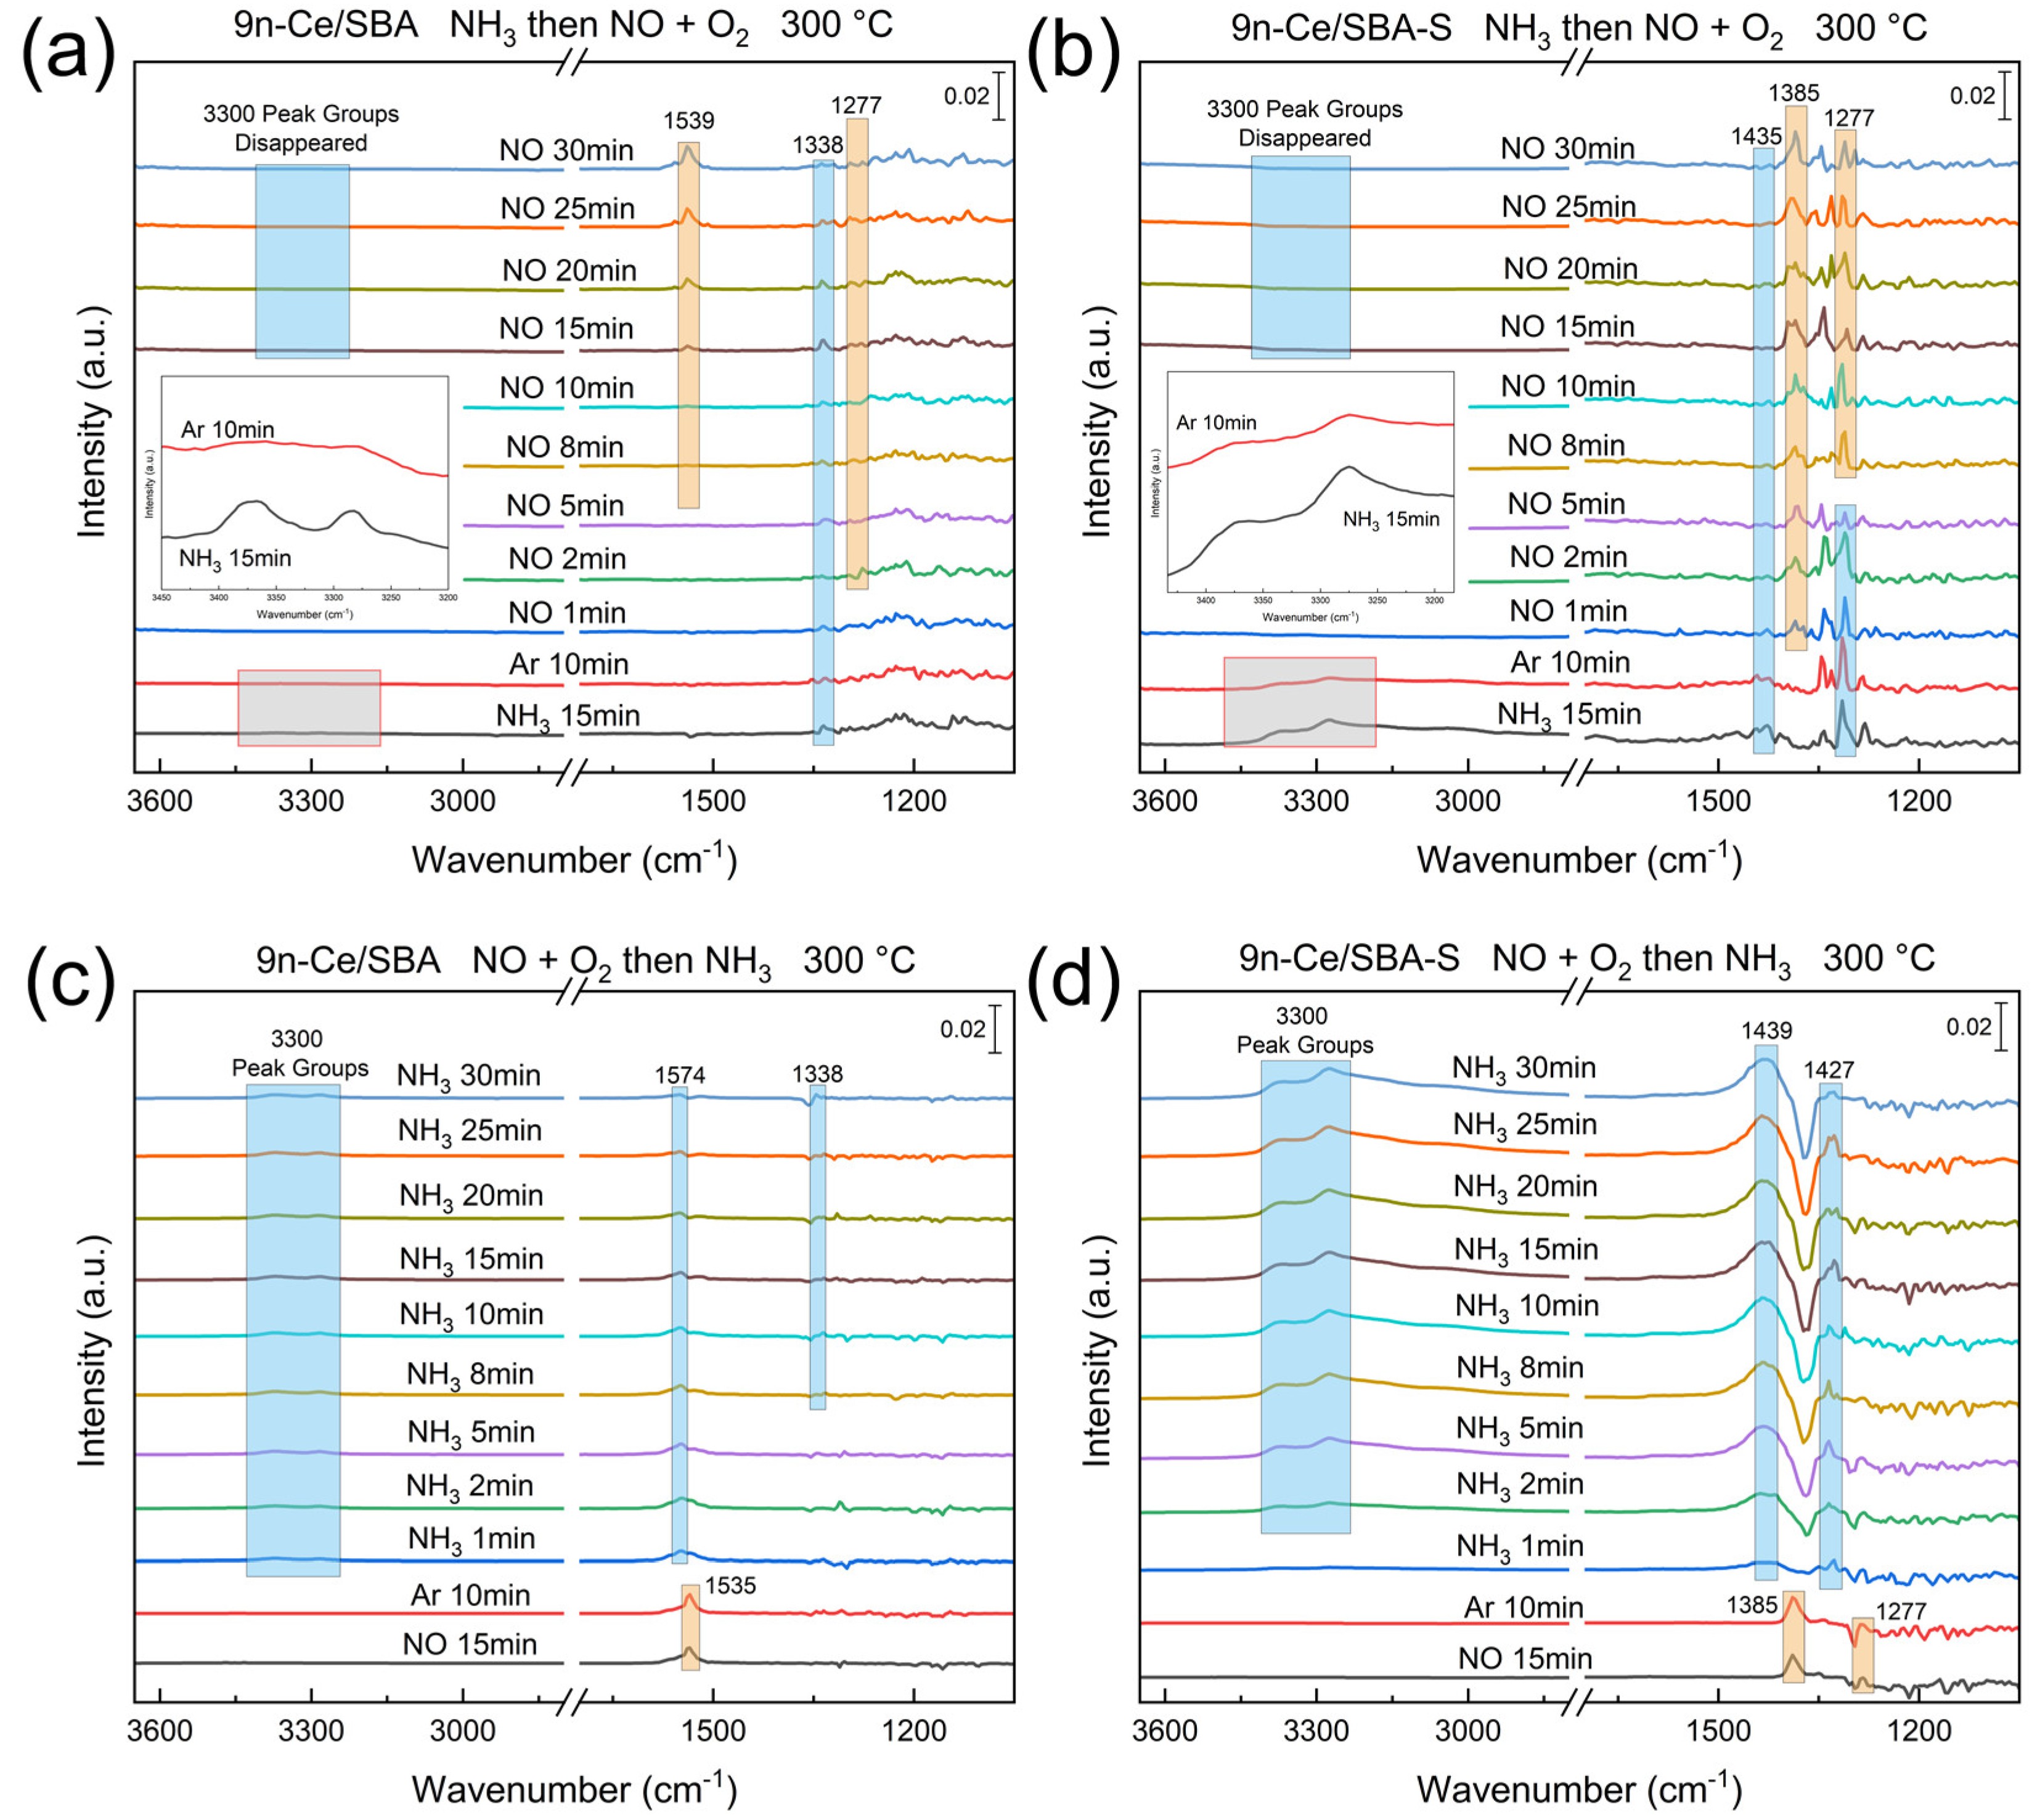
2.10.1. NH3 Passed over Pre-Adsorbed NO + O2

Figure 9a,b show the IR spectra of the pre-adsorbed NO and O2 of the 9n-Ce/SBA and 9n-Ce/SBA-S catalysts passed over by NH3. The adsorption of NH3 on the catalyst is very different. In Figure 8a, the infrared absorption peaks of NH3 adsorbed by Lewis acid are located at 3300 and 1338 cm−1, respectively. However, in Figure 8b, after SO2 treatment, the catalysts can function as a protic acid, specifically Bronsted acid, to adsorb NH3. Therefore, under the same scale, the adsorption strength of NH3 in the 9n-Ce/SBA-S catalyst is much higher than that in the 9n-Ce/SBA catalyst. In addition, the nitrate intermediates on the catalyst are also different. The 9n-Ce/SBA catalyst has two types of intermediates, nitrite and monodentate nitrate. However, the 9n-Ce/SBA-S catalyst presents two types of free NO3 ions and NO2 salt, indicating that the intermediate on the 9n-Ce/SBA-S catalyst decomposes faster. This phenomenon is consistent with the improvement in NH3-SCR performance after sulfurization observed in some catalysts [21].

2.10.2. NO + O2 Passed over Pre-Adsorbed NH3

Figure 9c,d show the IR spectra of the pre-adsorbed NH3 of the 9n-Ce/SBA and 9n-Ce/SBA-S catalysts passed over by NO and O2. The nitrate intermediates on the 9n-Ce/SBA-S catalyst are the same as those in Figure 8b, which are both NO3 and NO2 nitrites, indicating that the lattice oxygen of the catalyst is active and its surface is relatively smooth, which can allow NO3 to exist in the form of free ions. This may be related to the SO2 poisoning of some CeO2 active sites. In contrast, for 9n-Ce/SBA, there is only one intermediate, monodent nitrate, on the catalyst, indicating that the adsorption strength of NO in the catalyst is not high (which can be confirmed by comparing the height of the NO peak in the two figures), and it can also be inferred that the NO2 ion at 1277 cm−1 may be the IR peak of the nitro in ammonium nitrite. Furthermore, it is evident from the adsorption strength that a portion of NO is not adsorbed onto 9n-Ce/SBA, resulting in a higher proportion of reactions occurring on this catalyst according to the E-R mechanism compared to 9n-Ce/SBA-S. However, there are more nitrate species on 9n-Ce/SBA, which indicates that this catalyst exhibits a strong adsorption capacity for NO. In conjunction with the rate equation presented in Section 2.8, it can be inferred that the dominant mechanism of the NH3-SCR reaction on the 9n-Ce/SBA catalyst is the Langmuir–Hinshelwood (L-H) mechanism, with a NO reaction order of 0.717.
The mechanism of the reaction before and after poisoning is shown in Figure 10.

3. Materials and Methods

3.1. Catalyst Preparation

Preparation of Reagent. The following chemicals were used without further purification: Ce(NO3)3·6H2O (99.5%, Rhawn, Shanghai, China), triethylamine (AdR, Macklin, Shanghai, China), polyvinylpyrrolidone (PVP K-30, Adamas, Shanghai, China), SBA-15 (pore size 6~11 nm, XFnano, Nanjing, China), and absolute ethanol (AR, Greagent, Shanghai, China).
Synthesis of CeO2 nanospheres. The monodisperse nanospheres of CeO2 were obtained by means of the hydrothermal method. Firstly, PVP (according to particle size) and 0.2 mmol Ce(NO3)3·6H2O were dissolved with 20 mL ethanol, respectively. When the solutions in both beakers changed to clear, they were mixed together. Then, 0.415 mL triethylamine was slowly added dropwise to the above. After 10 min of stirring, the yellow solution was transferred into a 100 mL stainless-steel autoclave that was Teflon-lined. The sealed vessel was then heated at 180 °C for 24 h before it was cooled to room temperature. The CeO2 nanospheres were dispersed into colloid homogeneously.
Loading nanospheres on SBA-15. A certain amount of CeO2 colloid and SBA-15 were added into a crucible and heated at 70 °C until a gel appeared. Due to the well-developed pore structure of SBA-15 and the appropriate particle size range of the CeO2, most of the nanospheres entered the pore channels of the SBA-15 molecular sieves during the evaporation process. The gel was heated at 500 °C for 4 h with a rate of 5 °C/min in a muffle furnace. The powder obtained after cooling was the CeO2/SBA-15 catalysts (abbreviated as Ce/SBA). The different size of the particles was marked according to the D90 diameter and was given as Xn before Ce/SBA. The load percentage was indicated at the end using parentheses, but, for the catalysts with a 35% load, the load percentage was not be displayed. For example, 25%-loaded catalyst constituted of 7 nm nanospheres were marked as 7n-Ce/SBA(25%), while 35%-loaded catalyst comprising 5 nm nanospheres were marked as 5n-Ce/SBA. And the label of the 35%-loaded catalyst after having finished the SO2 resistance test was achieved by adding S at the end of the name, such as 7n-Ce/SBA-S.
The catalyst synthesis process is shown in Scheme 1.

3.2. Catalyst Characterization

Bruker (Billerica, MA, USA) D8 Advance is the instrument utilized for the X-ray diffraction (XRD) patterns of these catalysts. The target was Ni-filtered Cu Kα radiation (λ = 0.15418 nm). The operating voltage was 40 kV, while the current was 40 mA. The diffraction intensity was collected and recorded when the diffraction angle moved from 5 to 80°.
The Thermo Fisher Nicolet iS50 FT-IR (Waltham, MA, USA) with an ATR infrared absorption detector for a solid substances spectrometer was the instrument utilized to perform the IR tests of the catalysts. The wavenumber range of the infrared light emitted by the transmitter was from 4000 to 500 cm−1. The absorption data of each catalyst were collected 32 times. Moreover, the IR spectra in this work were published in the form of transmittance.
An FEI Talos F200x transmission electron microscope (TEM, Hillsboro, OR, USA) was used to shoot the images of the catalysts. The acceleration voltage was set to 200 kV. And the EDS mapping of the Ce, O, and other elements was obtained using EDS Super-X devices (Oxford Instruments, Abingdon, UK).
In addition to using TEM to calculate the particle size of the nanospheres, laser particle size gauges were also used to test the diameter of the nanospheres to obtain size data as realistic as possible. The particle sizes of the CeO2 nanospheres were measured with Zetasizer Pro, a laser particle size analyzer manufactured by Malvern (Malvern, UK). A total of 1.5 mL of CeO2 colloid was added into a cuvette with a 1 cm × 1 cm bottom; then, the cuvette was put into the particle size analyzer and tested in a closed environment at 25 °C.
The Micromeritics Autochem II 2920 chemisorption instrument (Micromeritics, Norcross, GA, USA) was used to perform NH3 temperature-programmed desorption (NH3-TPD) and H2 temperature-programmed reduction (H2-TPR). A thermal conductivity detector (TCD) (Tokyo, Japan) was used to detect the outlet gas concentration. In the NH3-TPD test, about 100 mg of catalyst was fitted in a quartz tube. The sample was preprocessed at 100 °C in He for 30 min with a flow rate of 30 mL/min. Then, 10% NH3-He was passed into the tube at 50 °C for 1 h. After 30 min of He purge (30 mL/min) to remove the physical adsorption of NH3, the sample was heated from 50 to 500 °C at 10 °C/min in pure He to complete the desorption of NH3, and data recording started. In the H2-TPR test, about 200 mg of catalyst was also fitted in a quartz tube. The catalyst was preprocessed in Ar at 300 °C for 1 h with a flow rate of 30 mL/min, and then it was cooled to ambient temperature. After that, the H2-TPR test temperature started from 50 to 800 °C at a rate of 10 °C/min with a gas flow of 5% H2-Ar. H2 consumption data and signal curves were recorded from 200 to 800 °C.
The Thermo Scientific K-Alpha XPS system (Waltham, MA, USA) was used as the instrument to perform the X-ray photoelectron spectroscopy (XPS) test on these catalysts. The excitation source was Al Kα rays with an energy of 1486.6 eV. And a binding energy of C 1s = 284.80 eV was used to set charge correction.
Pore size data of the catalysts were calculated using the Barret-Joyner-Halenda (BJH) method. These data were obtained by N2 isotherm adsorption and desorption tests on an ASAP2460 physical adsorption instrument made by Micromeritics (Norcross, GA, USA). The sample was degassed under vacuum at 250 °C for 4 h and a relative pressure range of P/P0 = 0–1.0 during the test.
A sulfation rate test of the active components was carried on a fixed-bed reactor with an air flow path and a heater. The gas containing O2 (5%), SO2 (100 ppm), and N2 in balanced proportions was passed into the reactor with the catalysts at 300 °C. The gas flow was 5000 mL/h, while the mass of the catalysts was 83 mg. Thermo Fisher’s IGS Analyzer (Kandel, Germany) recorded the concentration of SO2 over 1 h.
A thermogravimetric analysis (TGA) was performed on a NETZSCH STA 449 F3 synchronous thermal analyzer (NETZSCH, Beijing, China). A few milligrams of the catalyst were placed in the crucible, and the weight was recorded. The crucible was then heated from room temperature to 1300 °C in an argon atmosphere, and the weight curve of the catalyst and the heat absorption and release of the system were recorded.
In situ DRIFTs were collected at a wave number from 4000 to 650 cm−1 via accumulating 32 scans on a Nicolet iS50 FT-IR spectrometer (Thermo Scientific, Waltham, MA, USA) fitted out with Harrick DRIFTs cell and a highly sensitive MCT detector cooled with liquid nitrogen. A total of 5 mg of the catalysts with KBr as substrate was filled into the sample compartment, and the gas content was the same as that of the NH3-SCR performance test.
All of the test results were saved in the form of numerical values and drawn into curves using the OriginPro2023 software.

3.3. Catalytic Performance Measurements

NH3-SCR performance test. A fixed-bed reactor with an air flow path and a heater was used as the catalyst performance test device. The gas used in the test contained NH3 (500 ppm), NO (500 ppm), O2 (5%), and N2 in balanced proportions. The heater heated the temperature of the reactor from room temperature to 400 °C. The recording of the experimental data started at 200 °C and ended at 400 °C.
The gas containing NH3 (500 ppm), NO (500 ppm), O2 (5%), SO2 (100 ppm), and N2 in balanced proportions was passed into the fixed-bed reactor with the catalysts. The catalysts were heated to 300 °C and tested for their SCR performance for 1 h. Then, the heater maintained the temperature of the reactor at 300 °C, and the SO2 gas flowed for 20 h. After turning off the SO2 gas, the catalysts continued their performance testing for an additional 5 h.
In the above two tests, 83 mg of catalyst was fitted in a quartz tube of a 50 cm length and a 1 cm diameter, and the reactions were carried out at different temperatures with a space velocity of 60,000 mL/(g·h). The content of NO, NO2, and N2O of the outlet was detected using Thermo Fisher’s IGS Analyzer (Kandel, Germany). All the results were saved as numerical data. And NOx conversion was calculated with Equation (1), while N2 selectivity was calculated using Equation (2):
N O x   c o n v e r s i o n   ( % ) =   ( 1 [ N O ] o u t + [ N O 2 ] o u t [ N O ] i n + [ N O 2 ] i n ) × 100 %
N 2   s e l e c t i v i t y   ( % ) =   ( 1 2 [ N 2 O ] o u t [ N O x ] i n + [ N H 3 ] i n [ N O x ] o u t [ N H 3 ] o u t ) × 100 %
Reaction order test. A total of 8.3 mg of catalyst was fitted in a quartz tube 50 cm in length and 1 cm in diameter, and the reactions were carried out at different temperatures with a space velocity of 600,000 mL/(g·h). The catalyst was heated to 300 °C by varying the gas concentration to test the reaction order of the catalyst to the reactant; the rate equation was then established. Over the course of the test, the NOx conversion was consistently below 25%. The form of the kinetic equation is shown in Equation (3). When testing the reaction order of NO, the NH3 concentration was kept unchanged at 500 ppm, and the concentration of NO was increased from 0 to 1000 ppm. When testing the reaction order of NH3, the concentration of NO was kept unchanged at 500 ppm, and the concentration of NH3 was increased from 0 to 1000 ppm. However, when calculating the rate equation, an NH3 concentration range of 400 to 1000 ppm was taken. When the O2 reaction order was tested, the concentration of NO and NH3 was kept constant at 500 ppm, and the O2 concentration was increased from 1 to 5%.
r = d N O d t = k N O x N H 3 y [ O 2 ] z
The reaction rate r was calculated using Equation (4):
r i = c f , i X i V P a t m m c a t a R T
where mcata is the mass of catalyst; cf,i is the concentration of substances i; Xi is the NOx conversion of the catalyst; V is the total flow rate; R is the molar gas constant; T is the room temperature; and Patm is the standard atmospheric pressure.

4. Conclusions

In summary, CeO2 nanospheres with different particle sizes were successfully synthesized and loaded onto an SBA-15 molecular sieve. During the NH3-SCR test, the 9n-Ce/SBA catalyst with the largest size of nanospheres showed the best catalytic performance in the presence of 100 ppm SO2, purifying over 90% of NOx. To investigate the reason for its superior SO2 resistance, various characterization methods were used. The results of the NH3-TPD showed that 9n-Ce/SBA has the most and strongest acid sites, while the H2-TPR results indicated that this catalyst is hard to reduce below 450 °C. The XPS results proved that Si and Ce have a closer effect to stabilize the active center CeO2. Based on these characterization results, it can be inferred that the superior SO2 resistance of this catalyst is due to its low adsorption and oxidation of SO2 to form sulfate. As a result, the amount of sulfate deposition on this catalyst’s surface is the lowest, as confirmed by the TGA results. In situ DRIFTs revealed that, before and after poisoning, the NH3-SCR reactions of the catalysts studied followed L-H and E-R mechanisms, but the proportion of reactions according to the L-H mechanism in 9n-Ce/SBA catalyst before poisoning was low.

Supplementary Materials

The following Supplementary Materials can be downloaded at https://www.mdpi.com/article/10.3390/catal14020151/s1, Figure S1: BJH pore distribution curves of pure SBA-15; Figure S2: Particle size distribution curves of different PVP addition amounts; Figure S3: NOx conversion (a) and N2 selectivity (b) curves of five different loading percentages of catalysts and pure CeO2, (c) particle size distribution curves of PVP addition amounts of 7 mg/mL, and (d) NOx conversion of 30n-Ce/SBA catalyst in 100 ppm SO2 existing for 20 h; Figure S4: EDS mapping of Ce/SBA-S-series catalysts; Figure S5: (a) XPS spectrum of the Ce 3d orbital of 30n-Ce/SBA-S and (b) content of elements on the surface of 30n-Ce/SBA-S from XPS results; Figure S6: N2 adsorption–desorption curve and pore distribution curve of some catalysts; Figure S7: Dependence of NO conversion rate upon (a) NO, (b) NH3, and (c) O2 concentrations; Figure S8: In situ DRIFT spectra of the adsorption of NH3 at different temperatures of (a) 9n-Ce/SBA and (b) 9n-Ce/SBA-S; Figure S9: In situ DRIFT spectra of the adsorption of NO + O2 at different temperatures of (a) 9n-Ce/SBA and (b) 9n-Ce/SBA-S; Figure S10: In situ DRIFT spectra of the reaction of NO, NH3, and O2 at different temperatures of (a) 9n-Ce/SBA and (b) 9n-Ce/SBA-S; Table S1: The amount of PVP added and the D10, D50, and D90 size data obtained from the laser particle size analyzer; Table S2: The fitted NH3-TPD data of the catalysts; Table S3: The fitted H2-TPR data of the catalysts; Table S4: The binding energy of the peak U of the Ce 3d orbital of the catalysts after SO2 poisoning; Table S5: Specific surface area, average pore volume, and pore size of the catalysts; Table S6: Materials corresponding to different wavenumbers and references. And the Supplementary Materials contain 6 references [9,34,35,36,37,38].

Author Contributions

Conceptualization, Y.Z. and K.L.; methodology, X.H. and M.B.; investigation, X.Y. (Xin Yang); resources, D.Z.; writing—original draft preparation, X.H.; writing—review and editing, Y.Z. and K.L.; supervision, X.Y. (Xiangguang Yang); funding acquisition, X.Y. (Xiangguang Yang), Y.Z and K.L. All authors have read and agreed to the published version of the manuscript.

Funding

This research was funded by the National Natural Science Foundation of China (22072141, 22176185 and 52304429), the National Key Research and Development Program of China (2022YFB3504200, 2021YFB3501900), the Natural Science Foundation of the Jiangxi Province for Distinguished Young Scholars (20232ACB213004), the Jiangxi Provincial Key Research and Development Program (20232BBG70012), the Jiangxi Provincial Natural Science Foundation (20212BAB213032), the Youth Innovation Promotion Association of Chinese Academy of Sciences (2018263), the Jiangxi province’s “Double Thousand Plan” (jxsq2020101047), and the Research Projects of the Ganjiang Innovation Academy, Chinese Academy of Sciences (E355C001 and E490C004).

Data Availability Statement

All data used in this study appear in the submitted article.

Conflicts of Interest

The authors declare no conflicts of interest.

References

  1. Liu, M.; Shang, F.; Lu, X.; Huang, X.; Song, Y.; Liu, B.; Zhang, Q.; Liu, X.; Cao, J.; Xu, T.; et al. Unexpected response of nitrogen deposition to nitrogen oxide controls and implications for land carbon sink. Nat. Commun. 2022, 13, 3126. [Google Scholar] [CrossRef]
  2. Wang, X.; Li, B.; Wang, Y.; Wei, T.; Li, S.; Li, W. Insight into the dynamic behaviors of reactants with temperature over a TiOx-based catalyst for NOx removal via NH3-SCR. Appl. Surf. Sci. 2022, 605, 154689. [Google Scholar] [CrossRef]
  3. An, X.; Feng, C.; Liu, J.; Cheng, G.; Du, Y.; Fan, Z.; Wu, X. Insight into the sulfur resistance of manganese oxide for NH3-SCR: Perspective from the valence state distributions. Appl. Surf. Sci. 2022, 592, 153223. [Google Scholar] [CrossRef]
  4. Zhao, W.; Rong, J.; Luo, W.; Long, L.; Yao, X. Enhancing the K-poisoning resistance of CeO2-SnO2 catalyst by hydrothermal method for NH3-SCR reaction. Appl. Surf. Sci. 2022, 579, 152176. [Google Scholar] [CrossRef]
  5. Vogt, E.T.C.; van Dillen, A.J.; Geus, J.W.; Janssen, F.J.J.G. Selective catalytic reduction of NOx with NH3 over a V2O5/TiO2 on silica catalyst. Catal. Today 1988, 2, 569–579. [Google Scholar] [CrossRef]
  6. Martín-Martínez, J.M.; Singoredjo, L.; Mittelmeijer-Hazeleger, M.; Kapteijn, F.; Moulijn, J.A. Selective catalytic reduction of no with NH3 over activated carbons. I: Effect of origin and activation procedure on activity. Carbon 1994, 32, 897–904. [Google Scholar] [CrossRef]
  7. Kakuta, N.; Sugino, Y.; Rachi, H.; Ohkita, H.; Mizushima, T. Chemical removal of CeO2 segregated on the surface of CeO2-ZrO2 binary oxides for improvement of OSC. Top. Catal. 2009, 52, 1888. [Google Scholar] [CrossRef]
  8. Kakuta, N.; Morishima, N.; Kotobuki, M.; Iwase, T.; Mizushima, T.; Sato, Y.; Matsuura, S. Oxygen storage capacity (OSC) of aged Pt/CeO2/Al2O3 catalysts: Roles of Pt and CeO2 supported on Al2O3. Appl. Surf. Sci. 1997, 121–122, 408–412. [Google Scholar] [CrossRef]
  9. Han, X.; Liu, K.; Bian, M.; Fang, Y.; Sun, J.; Zhang, Y.; Yang, X. CeO2−δ nanoparticles supported on SnNb2O6 nanosheets for selective catalytic reduction of NOx with NH3. ACS Appl. Nano Mater. 2022, 5, 13529–13541. [Google Scholar] [CrossRef]
  10. Li, X.; He, E.; Zhang, M.; Peijnenburg, W.J.G.M.; Liu, Y.; Song, L.; Cao, X.; Zhao, L.; Qiu, H. Interactions of CeO2 nanoparticles with natural colloids and electrolytes impact their aggregation kinetics and colloidal stability. J. Hazard. Mater. 2020, 386, 121973. [Google Scholar] [CrossRef]
  11. Zhang, X.M.; Zhang, Z.R.; Suo, J.S.; Ben, L.S. Synthesis of mesoporous silica molecular sieves via a novel templating scheme. Chin. Chem. Lett. 1999, 129, 23–30. [Google Scholar]
  12. Shen, J.; Hess, C. Controlling the dispersion of ceria using nanoconfinement: Application to CeO2/SBA-15 catalysts for NH3-SCR. Mater. Adv. 2021, 2, 7400–7412. [Google Scholar] [CrossRef]
  13. Zhang, L.; Li, L.; Cao, Y.; Yao, X.; Ge, C.; Gao, F.; Deng, Y.; Tang, C.; Dong, L. Getting insight into the influence of SO2 on TiO2/CeO2 for the selective catalytic reduction of NO by NH3. Appl. Catal. B-Environ. 2015, 165, 589–598. [Google Scholar] [CrossRef]
  14. Zhu, J.; Ciolca, D.; Liu, L.; Parastaev, A.; Kosinov, N.; Hensen, E.J.M. Flame synthesis of Cu/ZnO-CeO2 catalysts: Synergistic metal–support interactions promote CH3OH selectivity in CO2 hydrogenation. ACS Catal. 2021, 11, 4880–4892. [Google Scholar] [CrossRef] [PubMed]
  15. Ma, K.; Guo, K.; Li, L.; Zou, W.; Dong, L. Cavity size dependent SO2 resistance for NH3-SCR of hollow structured CeO2-TiO2 catalysts. Catal. Commun. 2019, 128, 105719. [Google Scholar] [CrossRef]
  16. Hu, X.; Chen, J.; Qu, W.; Liu, R.; Tang, X. Sulfur-resistant ceria-based low-temperature SCR catalysts with the non-bulk electronic states of ceria. Environ. Sci. Technol. 2021, 55, 5435–5441. [Google Scholar] [CrossRef]
  17. Li, L.L.; Sun, B.W.; Sun, J.F.; Yu, S.H.; Ge, C.Y.; Tang, C.J.; Dong, L. Novel MnOx-CeO2 nanosphere catalyst for low-temperature NH3-SCR. Catal. Commun. 2017, 100, 98–102. [Google Scholar] [CrossRef]
  18. Chen, Y.; Chen, Y.; Hu, P.; Ma, S.; Li, Y. The effects of PVP surfactant in the direct and indirect hydrothermal synthesis processes of ceria nanostructures. Ceram. Int. 2016, 42, 18516–18520. [Google Scholar] [CrossRef]
  19. Zhou, F.; Zhao, X.; Xu, H.; Yuan, C. CeO2 spherical crystallites: Synthesis, formation mechanism, size control, and electrochemical property study. J. Phys. Chem. C 2007, 111, 1651–1657. [Google Scholar] [CrossRef]
  20. Zhang, H.; Wang, W.; Zhang, B.; Li, H.; Zhang, Q. Controllable synthesis of spherical cerium oxide particles. RSC Adv. 2016, 6, 30956–30962. [Google Scholar] [CrossRef]
  21. Xie, R.; Ma, L.; Li, Z.; Qu, Z.; Yan, N.; Li, J. Review of sulfur promotion effects on metal oxide catalysts for NOx emission control. ACS Catal. 2021, 11, 13119–13139. [Google Scholar] [CrossRef]
  22. Guo, K.; Ji, J.W.; Song, W.; Sun, J.F.; Tang, C.J.; Dong, L. Conquering ammonium bisulfate poison over low-temperature NH3-SCR catalysts: A critical review. Appl. Catal. B-Environ. 2021, 297, 120388. [Google Scholar] [CrossRef]
  23. Muzio, L.; Bogseth, S.; Himes, R.; Chien, Y.C.; Dunn-Rankin, D. Ammonium bisulfate formation and reduced load SCR operation. Fuel 2017, 206, 180–189. [Google Scholar] [CrossRef]
  24. Zhang, W.J.; Liu, G.F.; Jiang, J.; Tan, Y.C.; Wang, Q.; Gong, C.H.; Shen, D.K.; Wu, C.F. Temperature sensitivity of the selective catalytic reduction (SCR) performance of Ce-TiO2 in the presence of SO2. Chemosphere 2020, 243, 125419. [Google Scholar] [CrossRef] [PubMed]
  25. Zhang, L.; Zhao, Y.; Dai, H.; He, H.; Au, C.T. A comparative investigation on the properties of Cr-SBA-15 and CrOx/SBA-15. Catal. Today 2008, 131, 42–54. [Google Scholar] [CrossRef]
  26. Bae, Y.K.; Kim, T.-W.; Kim, J.-R.; Kim, Y.; Ha, K.-S.; Chae, H.-J. Enhanced SO2 tolerance of V2O5-Sb2O3/TiO2 catalyst for NO reduction with co-use of ammonia and liquid ammonium nitrate. J. Ind. Eng. Chem. 2021, 96, 277–283. [Google Scholar] [CrossRef]
  27. Han, X.; Bian, M.; Liu, K.; Yang, X.; Zheng, D.; Yang, X.; Zhang, Y. Excellent MCM-49 Supported CeCuOx nanocatalyst with ultrawide operating temperature window and strong anti-alkali ability for NH3-SCR. ChemNanoMat 2023, 9, e202300407. [Google Scholar] [CrossRef]
  28. Han, X.; Jin, S.; Rao, C.; Fang, Y.; Hu, B.; Liu, K.; Zhang, Y.; Yang, X. Mo-modified Pt/CeO2 nanorods with high propane catalytic combustion activity: Comparison of phosphoric, sulphuric and molybdic acid modifications. Mol. Catal. 2023, 548, 113426. [Google Scholar] [CrossRef]
  29. Xie, S.; Tan, W.; Li, Y.; Ma, L.; Ehrlich, S.N.; Deng, J.; Xu, P.; Gao, F.; Dong, L.; Liu, F. Copper single atom-triggered niobia–ceria catalyst for efficient low-temperature reduction of nitrogen oxides. ACS Catal. 2022, 12, 2441–2453. [Google Scholar] [CrossRef]
  30. Maqbool, M.S.; Pullur, A.K.; Ha, H.P. Novel sulfation effect on low-temperature activity enhancement of CeO2-added Sb-V2O5/TiO2 catalyst for NH3-SCR. Appl. Catal. B-Environ. 2014, 152, 28–37. [Google Scholar] [CrossRef]
  31. Peng, Y.; Li, J.; Si, W.; Li, X.; Shi, W.; Luo, J.; Fu, J.; Crittenden, J.; Hao, J. Ceria promotion on the potassium resistance of MnOx/TiO2 SCR catalysts: An experimental and DFT study. Chem. Eng. J. 2015, 269, 44–50. [Google Scholar] [CrossRef]
  32. Hu, W.; Zhang, Y.; Liu, S.; Zheng, C.; Gao, X.; Nova, I.; Tronconi, E. Improvement in activity and alkali resistance of a novel V-Ce(SO4)2/Ti catalyst for selective catalytic reduction of NO with NH3. Appl. Catal. B-Environ. 2017, 206, 449–460. [Google Scholar] [CrossRef]
  33. Wang, X.; Cong, Q.; Chen, L.; Shi, Y.; Shi, Y.; Li, S.; Li, W. The alkali resistance of CuNbTi catalyst for selective reduction of NO by NH3: A comparative investigation with VWTi catalyst. Appl. Catal. B-Environ. 2019, 246, 166–179. [Google Scholar] [CrossRef]
  34. Bian, M.; Liu, K.; Han, X.; Fang, Y.; Liu, Q.; Zhang, Y.; Yang, X. Novel manganese-based assembled nanocatalyst with “nitrous oxide filter” for efficient NH3-SCR in wide low-temperature window: Optimization, design and mechanism. Fuel 2023, 331, 125857. [Google Scholar] [CrossRef]
  35. Liu, J.; Shi, X.; Shan, Y.; Yan, Z.; He, H. Hydrothermal stability of CeO2-WO3-ZrO2 mixed oxides for selective catalytic reduction of NOx by NH3. Environ. Sci. Technol. 2018, 52, 11769–11777. [Google Scholar] [CrossRef] [PubMed]
  36. Qi, G.; Yang, R.T. Characterization and FT-IR studies of MnOx-CeO2 catalyst for low-temperature SCR of NO with NH3. J. Phys. Chem. B 2004, 108, 4463–4469. [Google Scholar] [CrossRef]
  37. Zhang, L.; Li, L.L.; Ge, C.Y.; Li, T.Z.; Li, C.J.; Li, S.X.; Xiong, F.; Dong, L. Promoting N2 selectivity of CeMnOx catalyst by supporting TiO2 in NH3-SCR reaction. Ind. Eng. Chem. Res. 2019, 58, 6325–6332. [Google Scholar] [CrossRef]
  38. Hadjiivanov, K.I. Identification of neutral and charged NxOy surface species by IR spectroscopy. Catal. Rev. 2000, 42, 71–144. [Google Scholar] [CrossRef]
Figure 1. TEM images and particle size statistics from TEM images of different PVP amounts in ethanol. (a) 50 mg/mL, D90 = 5 nm; (b) 40 mg/mL, D90 = 6 nm; (c) 30 mg/mL, D90 = 7 nm; and (d) 8.8 mg/mL, D90 = 9 nm.
Catalysts 14 00151 g001
Figure 2. NOx conversion (a) and N2 selectivity (b) curves of CeO2/SBA-15 catalysts with different particle sizes and pure CeO2. (c) NOx conversion curves of catalysts with different particle sizes and pure CeO2 in 100 ppm SO2 existing for 20 h.
Catalysts 14 00151 g002
Figure 3. (a) XRD patterns of CeO2/SBA-15 catalysts with different particle sizes and a standard PDF card of CeO2 (#34−0394). Infrared absorptivity of CeO2/SBA-15 catalysts (b) before and (c) after the 20 h SO2 resistance test with different particle sizes and pure CeO2.
Catalysts 14 00151 g003
Figure 4. TEM images of (a1a4) Ce/SBA and (b1b4) Ce/SBA-S-series catalysts. Panes (c1c4) are the EDS mapping of sulfur on Ce/SBA-S-series catalysts.
Catalysts 14 00151 g004
Figure 5. (a) NH3-TPD and (b) H2-TPR curves of CeO2/SBA-15 catalysts with different particle sizes, pure CeO2, and SBA-15.
Catalysts 14 00151 g005
Figure 6. XPS spectra of (a) Ce 3d of Ce/SBA catalysts, (b) Ce 3d, and (c) S 2p of Ce/SBA-S catalysts.
Catalysts 14 00151 g006
Figure 7. SO2 concentration curves in the outlet of the reactor of catalysts with different particle sizes in 100 ppm SO2 and 5% O2 for 1 h.
Catalysts 14 00151 g007
Figure 8. Ex situ TG-DTA curves of Ce/SBA catalysts after being treated with NH3, NO, O2, and SO2. (a) 5n-Ce/SBA-S, (b) 6n-Ce/SBA-S, (c) 7n-Ce/SBA-S and (d) 9n-Ce/SBA-S.
Catalysts 14 00151 g008
Figure 9. In situ DRIFT spectra of NO + O2 adsorption with pre−adsorbed NH3 at 300 °C of (a) 9n-Ce/SBA, and (b) 9n-Ce/SBA-S and NH3 adsorption with pre−adsorbed NO + O2 at 300 °C of (c) 9n-Ce/SBA and (d) 9n-Ce/SBA-S.
Catalysts 14 00151 g009
Figure 10. Schematic diagram of the reaction mechanism before and after SO2 poisoning.
Catalysts 14 00151 g010
Scheme 1. Flow chart of the synthesis of the Ce/SBA series of catalysts.
Catalysts 14 00151 sch001
Table 1. BET specific surface area, pore volume, and mean pore diameter of SBA-15.
SampleBET Surface Area (m2/g)Pore Volume (cm3/g)Average Pore Diameter (nm)
SBA-154961.2010.07
Table 2. Surface element contents of the catalysts, derived from XPS spectra.
CatalystCe3+/(Ce3+ + Ce4+)Ce Atoms on Surface
(Atomic Percentage)
S Atoms on Surface
(Atomic Percentage)
5n-Ce/SBA22.80%5.79%
6n-Ce/SBA26.00%2.52%
7n-Ce/SBA21.43%2.68%
9n-Ce/SBA27.70%2.41%
5n-Ce/SBA-S24.01%4.46%1.28%
6n-Ce/SBA-S23.98%4.64%1.79%
7n-Ce/SBA-S25.72%1.58%5.63%
9n-Ce/SBA-S23.57%5.36%3.05%
Table 3. Reaction orders and rate equations for NH3-SCR with Ce/SBA catalysts.
CatalystReaction Order ofRate Equation
NONH3O2
5n-Ce/SBA0.6040.000410.138 r = k N O 0.604 N H 3 0.00041 [ O 2 ] 0.138    
6n-Ce/SBA0.6310.000500.112 r = k N O 0.631 N H 3 0.00050 [ O 2 ] 0.112
7n-Ce/SBA0.8180.000450.099 r = k N O 0.818 N H 3 0.00045 [ O 2 ] 0.099
9n-Ce/SBA0.7170.000320.115 r = k N O 0.717 N H 3 0.00032 [ O 2 ] 0.115
Disclaimer/Publisher’s Note: The statements, opinions and data contained in all publications are solely those of the individual author(s) and contributor(s) and not of MDPI and/or the editor(s). MDPI and/or the editor(s) disclaim responsibility for any injury to people or property resulting from any ideas, methods, instructions or products referred to in the content.

